Embed Size (px)
Citation preview
2017
Published in October 2018
PORT
Central AmericanPort Maritime StatisticsNetwork
STATISTICALSUMMARY
CENTRAL AMERICAN PORTS STATISTICAL SUMMARY, YEAR 2017
CENTRAL AMERICAN COMISSION OF MARITIME TRANSPORT, COCATRAM 1
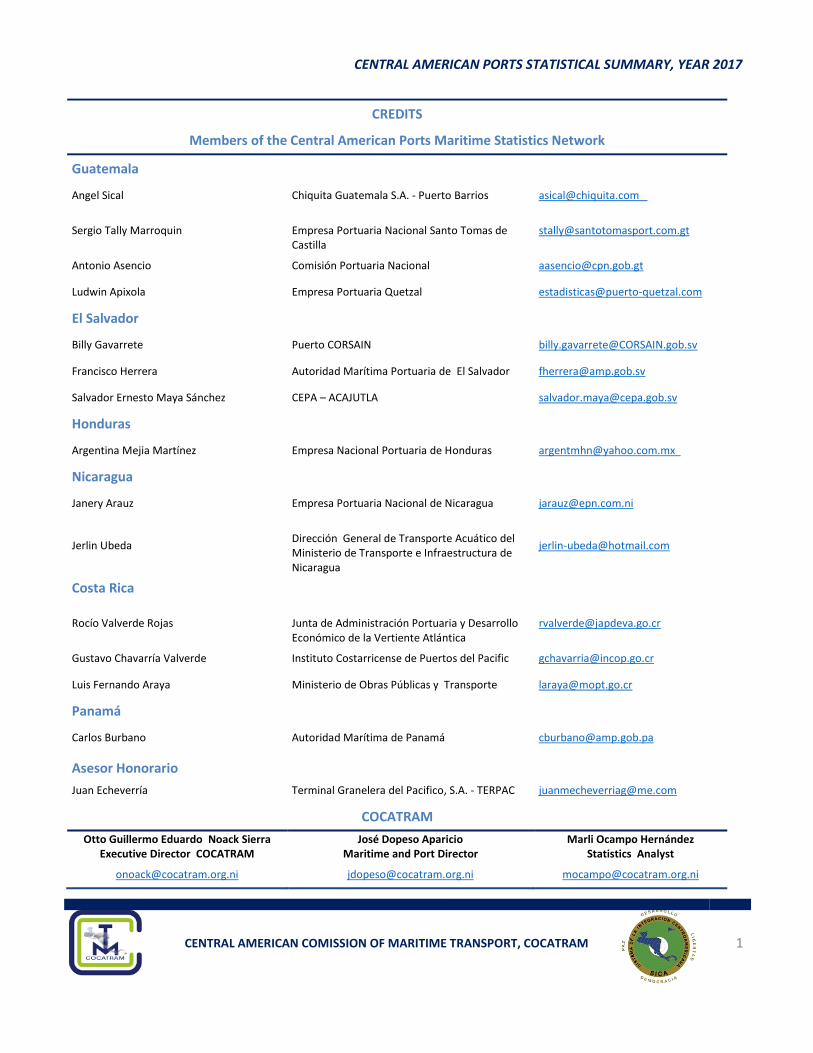
CREDITS
Members of the Central American Ports Maritime Statistics Network
Guatemala
Angel Sical Chiquita Guatemala S.A. - Puerto Barrios [email protected]
Sergio Tally Marroquin Empresa Portuaria Nacional Santo Tomas de Castilla
Antonio Asencio Comisión Portuaria Nacional [email protected]
Ludwin Apixola Empresa Portuaria Quetzal [email protected]
El Salvador
Billy Gavarrete Puerto CORSAIN [email protected]
Francisco Herrera Autoridad Marítima Portuaria de El Salvador [email protected]
Salvador Ernesto Maya Sánchez CEPA – ACAJUTLA [email protected]
Honduras
Argentina Mejia Martínez Empresa Nacional Portuaria de Honduras [email protected]
Nicaragua
Janery Arauz Empresa Portuaria Nacional de Nicaragua [email protected]
Jerlin Ubeda
Dirección General de Transporte Acuático del Ministerio de Transporte e Infraestructura de Nicaragua
Costa Rica
Rocío Valverde Rojas Junta de Administración Portuaria y Desarrollo Económico de la Vertiente Atlántica
Gustavo Chavarría Valverde Instituto Costarricense de Puertos del Pacific [email protected]
Luis Fernando Araya Ministerio de Obras Públicas y Transporte [email protected]
Panamá
Carlos Burbano Autoridad Marítima de Panamá [email protected]
Asesor Honorario
Juan Echeverría Terminal Granelera del Pacifico, S.A. - TERPAC [email protected]
COCATRAM
Otto Guillermo Eduardo Noack Sierra Executive Director COCATRAM
José Dopeso Aparicio Maritime and Port Director
Marli Ocampo Hernández Statistics Analyst

CENTRAL AMERICAN PORTS STATISTICAL SUMMARY, YEAR 2017
CENTRAL AMERICAN COMISSION OF MARITIME TRANSPORT, COCATRAM 2
CENTRAL AMERICAN PORTS STATISTICAL SUMMARY, YEAR 2017
CENTRAL AMERICAN COMISSION OF MARITIME TRANSPORT, COCATRAM 3
Acknowledgements
The Central American Maritime Transport Commission (COCATRAM) is pleased to present the 2017
Summary of Maritime Port Statistics to the maritime port community of the Central American Isthmus,
to be used as a decision-making and research tool in the subsector.
COCATRAM has arranged this Statistical summary in two parts; the first one is comprised of three
sections, specifically Cargo, Vessels and Containers, which briefly approach key aspects of port
performance in the Central American region during 2017. The second part features appendixes
containing statistical tables that strengthen information at the regional level.
The information contained in this document comes from forty-five international service ports operated
by both state-owned and private companies in Guatemala, El Salvador, Honduras, Nicaragua, Costa
Rica and Panama. The three sections that comprise the first part of the Statistical Summary feature
general information and comments on cargo, vessels and container traffic by port and country,
including total volume of foreign trade, cargo handling type , vessel type, and size of containers, among
others.
The main source of information of this summary is based on official information provided by port
authorities and operators in the Central American region in charge of gathering national port statistics
through the members of the Central American Maritime Ports Statistics Network (REMARPOR in
Spanish), in place since year 2000, and which is coordinated by COCATRAM. Data about regional
foreign trade were obtained from official websites of each country's entity in charge of this area. In the
case of Nicaragua, there was not information available when this report was edited. Similarly, cruise
ship traffic information in Honduras was obtained with the support of the General Directorate of the
Merchant Marine of Honduras, to whom we do express our warmest thanks.
The information contained in this report is updated to April 2018, and it covers calendar year 2017.
However, it is subject to future updates to be made as information from official sources of member
countries is provided. More details on port throughput statistics can be found in the Central American
Maritime Port Statistical Information System (SIEMPCA) at:
http://www.cocatram.org.ni/estadisticas/
COCATRAM, together with the port authorities and terminal operators in the Central American Isthmus
have reaffirmed their commitment to prepare this document fully aware of the great importance it has.
Should you have any comment regarding the information herein contained, please contact COCATRAM
Statistical Unit at: [email protected].
CENTRAL AMERICAN PORTS STATISTICAL SUMMARY, YEAR 2017
CENTRAL AMERICAN COMISSION OF MARITIME TRANSPORT, COCATRAM 4
INDEX Conventional Signs .....................................................................................................................................................7
Acronyms ...................................................................................................................................................................7
1 Cargo throughput ................................................................................................................................................8
1.1 Cargo handled by country and port ............................................................................................................8
1.2 Foreign trade and port traffic ....................................................................................................................19
1.3 Cargo throughput handled by coast ..........................................................................................................21
1.4 Distribution of cargo according to cargo-handling method ......................................................................26
2 Vessel Calls ......................................................................................................................................................29
3 Containers and Box Trucks/Trailers .................................................................................................................31
Chart
Chart No. 1 Cargo throughput percentage by country (Thousands of MT, %), year 2017 .......................................8
Chart No. 2 Guatemala: Cargo throughput by port (Thousands of MT), Years 2016-2017 .....................................9
Chart No. 3 Guatemala: Cargo loaded and offloaded in port, by cargo type (Thousand MT), Years 2016-2017 ....9
Chart No. 4 El Salvador: Cargo throughput by port (Thousands of MT), Years 2016-2017 ..................................10
Chart No. 5 El Salvador Cargo loaded and offloaded in port, by cargo type (Thousand MT), Years s 2016-201710
Chart No. 6 Honduras: Cargo throughput by port (Thousands of MT), Years 2016-2017 .....................................11
Chart No. 7 Honduras: Cargo loaded and offloaded in port, by cargo type (Thousand MT), Years 2016-2017 ....11
Chart No. 8 Nicaragua: Cargo throughput by port (Thousands of MT), Years 2016-2017 ....................................12
Chart No. 9 Nicaragua: Cargo loaded and offloaded in port, by cargo type (Thousand MT), Years 2016-2017 ...12
Chart No. 10 Costa Rica: Cargo throughput by port (Thousands of MT), Years 2016-2017 .................................13
Chart No. 11 Costa Rica: Cargo loaded and offloaded in port, by cargo type (Thousand MT), Years 2016-2017 13
Chart No. 12 Panamá: Cargo throughput by principal ports (Thousands of MT), Years 2016-2017 .....................15
Chart No. 13 Panamá: Cargo loaded and offloaded in port, by cargo type (Thousand MT), Years 2016-2017 .....15
Chart No. 14 Central America: Cargo throughput by principal ports (Thousands of MT), Years 2017 .................16
Chart No. 15 Central America: Cargo handled by ports (Thousand mt), Year 2017 ..............................................18
Chart No. 16 Central America: Cargo loaded and offloaded by seaboard in port, ..................................................21
Chart No. 17 Caribbean Seaboard: Cargo loaded and offloaded in port, by cargo type .........................................22
CENTRAL AMERICAN PORTS STATISTICAL SUMMARY, YEAR 2017
CENTRAL AMERICAN COMISSION OF MARITIME TRANSPORT, COCATRAM 5
Chart No. 18 Caribbean Seaboard: Cargo handled in ports, (Thousand mt and percentage), Years 2017 ..............22
Chart No. 19 Pacific Seaboard: Cargo loaded and offloaded in port, by cargo type (Thousand mt), Years 2016-
2017 ..........................................................................................................................................................................23
Chart No. 20 Pacific Seaboard: Cargo handled in ports, (Thousand mt and percentage), Year 2017 .....................23
Chart No. 21 Central America: Traffic Cargo Breakdown by type of handling in port, (Thousand mt and
percentage), Year 2017 .............................................................................................................................................27
Chart No. 22 Central America: Traffic offloaded breakdown by type of cargo, (Thousand mt y %), Year 2017 ..27
Chart No. 23 Central America: Traffic loaded breakdown by type of cargo, .........................................................28
Chart No. 24 Central America: Traffic loaded breakdown by type of cargo, .........................................................28
Chart No. 25 Central America: Distribution by type of vessel, Year 2017 .............................................................29
Chart No. 26 Central American: Number of vessels by type, Year2016-2017 .......................................................30
Chart No. 27 Central American: Number of vessels by type, by littoral, Years 2016-2017 ...................................30
Chart No. 28 Central America: Container throughput in ports, (TEU), Year 2016-2017 .......................................31
Chart No. 29 Central America: Container throughput by coast ..............................................................................32
Tables
Table No. 1 Central America: Cargo throughput by country, (Thousands of metric ton), year 2016-2017...............8
Table No. 2 Central America: Cargo handled by ports, (Thousand MT), Years 2016-2017 ...................................17
Table No. 3 Central America: Value and volume of foreign trade, (Millions US dollar y thousand MT), Years
2017 ..........................................................................................................................................................................19
Table No. 4 Central America: Volume of foreign trade and cargo handled (Thousand mt), Year 2017 .................20
Table No. 5 Caribbean Seaboard: Cargo loaded and offloaded by port, (Thousand mt), Year 2017 .......................24
Table No. 6 Pacific Seaboard: Cargo loaded and offloaded by port, (Thousand mt), Year 2017 ............................25
Table No. 7 Distribution of cargo handled in ports per year, by type of handling (Percentages), Years 2013-2017
..................................................................................................................................................................................26
CENTRAL AMERICAN PORTS STATISTICAL SUMMARY, YEAR 2017
CENTRAL AMERICAN COMISSION OF MARITIME TRANSPORT, COCATRAM 6
ANNEXS
Port traffic in Central America by Country, (Thousands of MT), Years 2001-2017 ...............................................34
Vessel arrivals in Central America by Country, (Units), Years 2001-2017 .............................................................35
Container throughput at Central America, (TEU), Years 2001-2017 ......................................................................36
Summary Table. - Central America: Traffic by ports, Year 2017 ............................................................................37
Table 1. Central America: cargo throughput by country and port, (Thousands of MT), Year 2017 ........................39
Table 2. Central America: Vessel arrivals by ports, quarterly (Units), Year 2017 ..................................................41
Table 3. Central America: Vessel arrivals by ship type, (Units) Year 2017 ............................................................43
Table 4. Central America: Traffic by cargo, (Thousands of MT), Year 2017..........................................................45
Table 4-A. Central America: Traffic offloaded by cargo type, (Thousands of MT), Year 2017 .............................46
Table 4-B. Central America: Traffic loaded by cargo type, (Thousands of MT), Year, 2017 .................................47
Table 5. Central America: Containers and box trucks/trailers throughput, (Units), Year 2017 ...............................48
Table No. 7. Central America: Cruises vessels and passengers arrivals by port, Year 2017 ...................................54
Glosary of Terms ......................................................................................................................................................55
CENTRAL AMERICAN PORTS STATISTICAL SUMMARY, YEAR 2017
CENTRAL AMERICAN COMISSION OF MARITIME TRANSPORT, COCATRAM 7
Conventional Signs
- : Data not applicable
… : Information not available
0 : Figure did not reach the first expressed unit
Acronyms
BAPCRASA : Boyas Alba Petróleos Cenergicas y RASA
C : Caribbean Seaboard
C.C.T. : Colon Container Terminal
COCATRAM : Central American Commission for Maritime Transport
C.P.T. : Colon Port Terminal
L : Loaded
MIT : Manzanillo International Terminal
O : Offloaded
PATSA : Petro America Terminal S. A.
PPCC : Panama Ports Company Cristobal
PPCB : Panama Ports Company Balboa
P : Pacific Seaboard
PPIT : PSA Panama International Terminal
SANTOCAS : Santo Tomás de Castilla
TEU : Twenty-Foot Equivalent Unit/
mt : Metric Ton, equivalent to one thousand kilograms
CENTRAL AMERICAN PORTS STATISTICAL SUMMARY, YEAR 2017
CENTRAL AMERICAN COMISSION OF MARITIME TRANSPORT, COCATRAM 8
1 Cargo throughput
1.1 Cargo handled by country and port
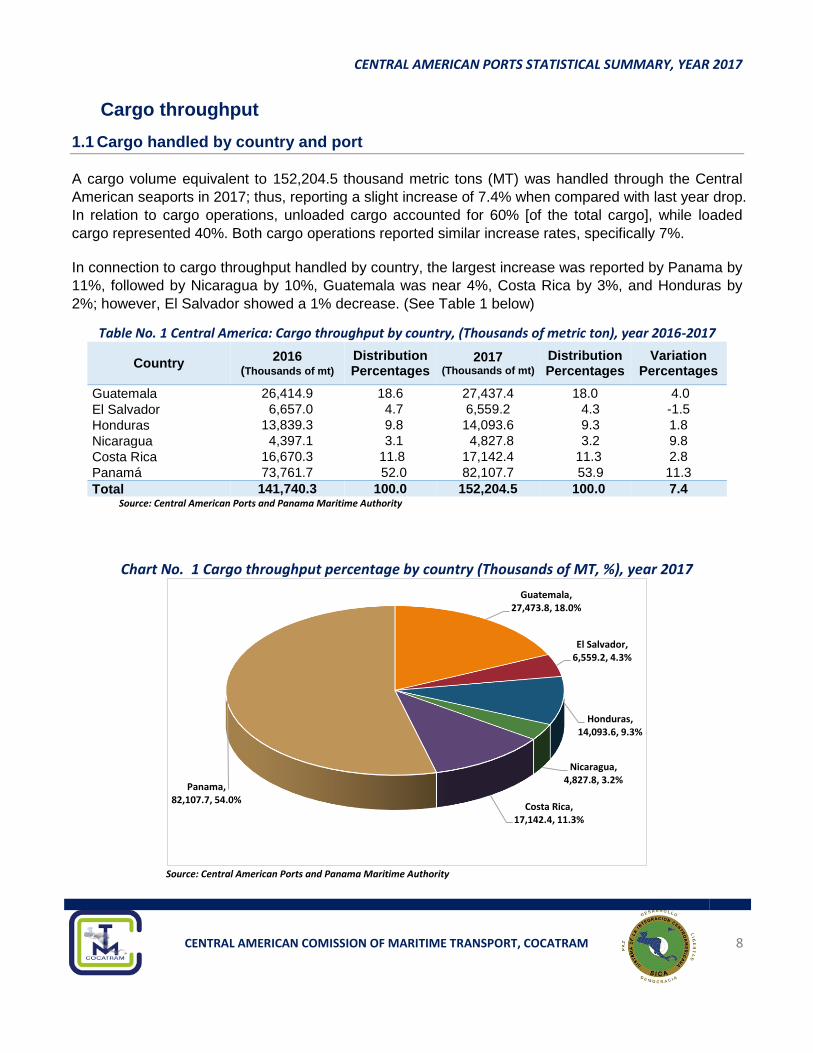
A cargo volume equivalent to 152,204.5 thousand metric tons (MT) was handled through the Central
American seaports in 2017; thus, reporting a slight increase of 7.4% when compared with last year drop.
In relation to cargo operations, unloaded cargo accounted for 60% [of the total cargo], while loaded
cargo represented 40%. Both cargo operations reported similar increase rates, specifically 7%.
In connection to cargo throughput handled by country, the largest increase was reported by Panama by
11%, followed by Nicaragua by 10%, Guatemala was near 4%, Costa Rica by 3%, and Honduras by
2%; however, El Salvador showed a 1% decrease. (See Table 1 below)
Table No. 1 Central America: Cargo throughput by country, (Thousands of metric ton), year 2016-2017
Country 2016
(Thousands of mt) Distribution Percentages
2017 (Thousands of mt)
Distribution Percentages
Variation Percentages
Guatemala 26,414.9 18.6 27,437.4 18.0 4.0
El Salvador 6,657.0 4.7 6,559.2 4.3 -1.5
Honduras 13,839.3 9.8 14,093.6 9.3 1.8
Nicaragua 4,397.1 3.1 4,827.8 3.2 9.8
Costa Rica 16,670.3 11.8 17,142.4 11.3 2.8
Panamá 73,761.7 52.0 82,107.7 53.9 11.3
Total 141,740.3 100.0 152,204.5 100.0 7.4 Source: Central American Ports and Panama Maritime Authority
Chart No. 1 Cargo throughput percentage by country (Thousands of MT, %), year 2017
Source: Central American Ports and Panama Maritime Authority
Guatemala, 27,473.8, 18.0%
El Salvador, 6,559.2, 4.3%
Honduras, 14,093.6, 9.3%
Nicaragua, 4,827.8, 3.2%
Costa Rica, 17,142.4, 11.3%
Panama, 82,107.7, 54.0%
CENTRAL AMERICAN PORTS STATISTICAL SUMMARY, YEAR 2017
CENTRAL AMERICAN COMISSION OF MARITIME TRANSPORT, COCATRAM 9
GUATEMALA
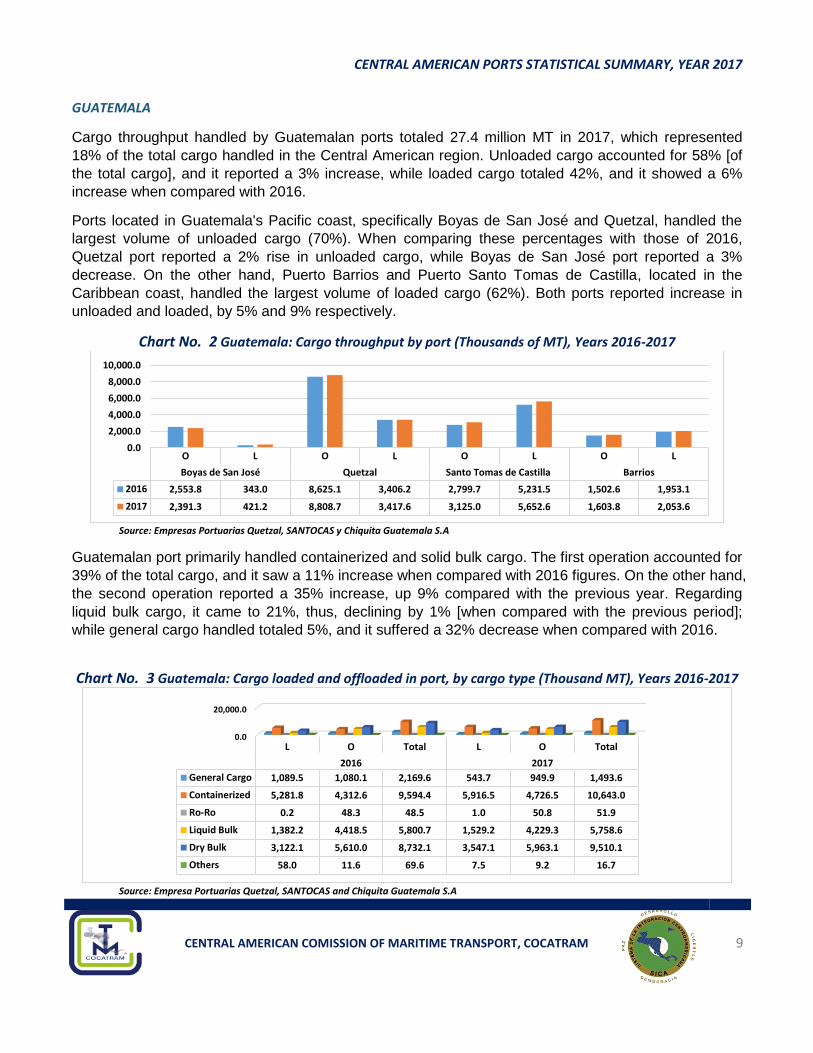
Cargo throughput handled by Guatemalan ports totaled 27.4 million MT in 2017, which represented
18% of the total cargo handled in the Central American region. Unloaded cargo accounted for 58% [of
the total cargo], and it reported a 3% increase, while loaded cargo totaled 42%, and it showed a 6%
increase when compared with 2016.
Ports located in Guatemala's Pacific coast, specifically Boyas de San José and Quetzal, handled the
largest volume of unloaded cargo (70%). When comparing these percentages with those of 2016,
Quetzal port reported a 2% rise in unloaded cargo, while Boyas de San José port reported a 3%
decrease. On the other hand, Puerto Barrios and Puerto Santo Tomas de Castilla, located in the
Caribbean coast, handled the largest volume of loaded cargo (62%). Both ports reported increase in
unloaded and loaded, by 5% and 9% respectively.
Chart No. 2 Guatemala: Cargo throughput by port (Thousands of MT), Years 2016-2017
Source: Empresas Portuarias Quetzal, SANTOCAS y Chiquita Guatemala S.A
Guatemalan port primarily handled containerized and solid bulk cargo. The first operation accounted for
39% of the total cargo, and it saw a 11% increase when compared with 2016 figures. On the other hand,
the second operation reported a 35% increase, up 9% compared with the previous year. Regarding
liquid bulk cargo, it came to 21%, thus, declining by 1% [when compared with the previous period];
while general cargo handled totaled 5%, and it suffered a 32% decrease when compared with 2016.
Chart No. 3 Guatemala: Cargo loaded and offloaded in port, by cargo type (Thousand MT), Years 2016-2017
Source: Empresa Portuarias Quetzal, SANTOCAS and Chiquita Guatemala S.A
O L O L O L O L
Boyas de San José Quetzal Santo Tomas de Castilla Barrios
2016 2,553.8 343.0 8,625.1 3,406.2 2,799.7 5,231.5 1,502.6 1,953.1
2017 2,391.3 421.2 8,808.7 3,417.6 3,125.0 5,652.6 1,603.8 2,053.6
0.0
2,000.0
4,000.0
6,000.0
8,000.0
10,000.0
0.0
20,000.0
L O Total L O Total
2016 2017
General Cargo 1,089.5 1,080.1 2,169.6 543.7 949.9 1,493.6
Containerized 5,281.8 4,312.6 9,594.4 5,916.5 4,726.5 10,643.0
Ro-Ro 0.2 48.3 48.5 1.0 50.8 51.9
Liquid Bulk 1,382.2 4,418.5 5,800.7 1,529.2 4,229.3 5,758.6
Dry Bulk 3,122.1 5,610.0 8,732.1 3,547.1 5,963.1 9,510.1
Others 58.0 11.6 69.6 7.5 9.2 16.7
CENTRAL AMERICAN PORTS STATISTICAL SUMMARY, YEAR 2017
CENTRAL AMERICAN COMISSION OF MARITIME TRANSPORT, COCATRAM 10
EL SALVADOR
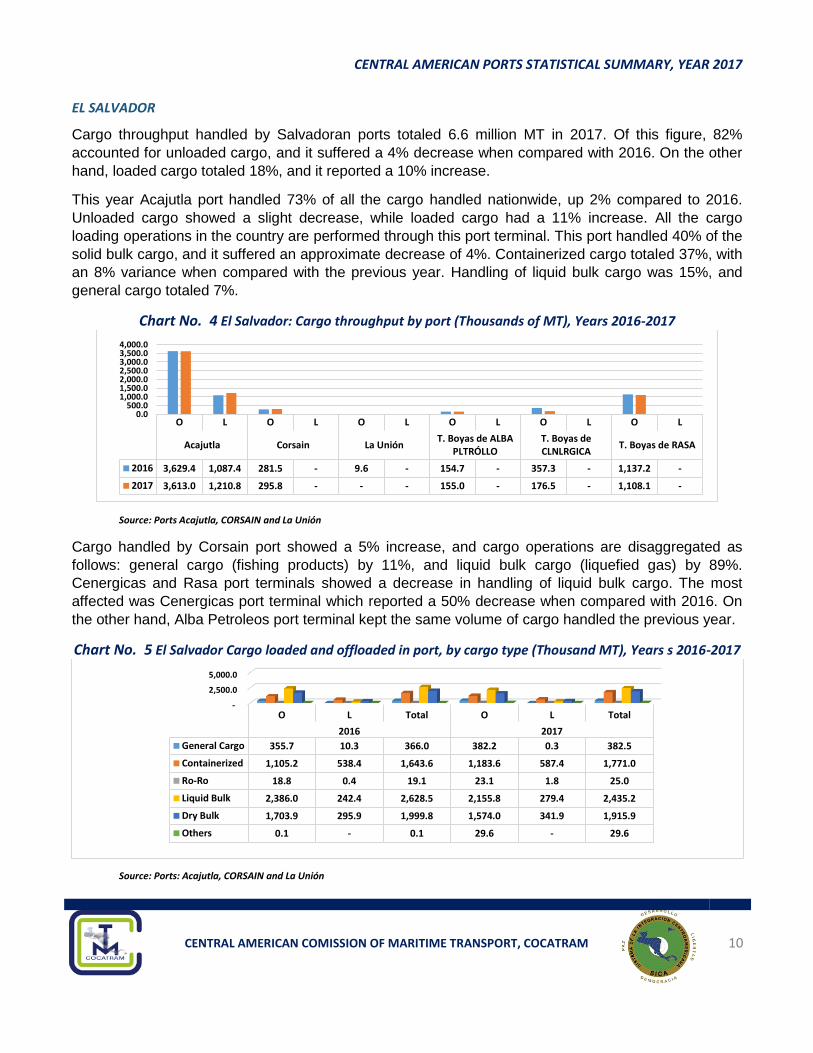
Cargo throughput handled by Salvadoran ports totaled 6.6 million MT in 2017. Of this figure, 82%
accounted for unloaded cargo, and it suffered a 4% decrease when compared with 2016. On the other
hand, loaded cargo totaled 18%, and it reported a 10% increase.
This year Acajutla port handled 73% of all the cargo handled nationwide, up 2% compared to 2016.
Unloaded cargo showed a slight decrease, while loaded cargo had a 11% increase. All the cargo
loading operations in the country are performed through this port terminal. This port handled 40% of the
solid bulk cargo, and it suffered an approximate decrease of 4%. Containerized cargo totaled 37%, with
an 8% variance when compared with the previous year. Handling of liquid bulk cargo was 15%, and
general cargo totaled 7%.
Chart No. 4 El Salvador: Cargo throughput by port (Thousands of MT), Years 2016-2017
Source: Ports Acajutla, CORSAIN and La Unión
Cargo handled by Corsain port showed a 5% increase, and cargo operations are disaggregated as
follows: general cargo (fishing products) by 11%, and liquid bulk cargo (liquefied gas) by 89%.
Cenergicas and Rasa port terminals showed a decrease in handling of liquid bulk cargo. The most
affected was Cenergicas port terminal which reported a 50% decrease when compared with 2016. On
the other hand, Alba Petroleos port terminal kept the same volume of cargo handled the previous year.
Chart No. 5 El Salvador Cargo loaded and offloaded in port, by cargo type (Thousand MT), Years s 2016-2017
Source: Ports: Acajutla, CORSAIN and La Unión
O L O L O L O L O L O L
Acajutla Corsain La UniónT. Boyas de ALBA
PLTRÓLLOT. Boyas deCLNLRGICA
T. Boyas de RASA
2016 3,629.4 1,087.4 281.5 - 9.6 - 154.7 - 357.3 - 1,137.2 -
2017 3,613.0 1,210.8 295.8 - - - 155.0 - 176.5 - 1,108.1 -
0.0500.0
1,000.01,500.02,000.02,500.03,000.03,500.04,000.0
-
2,500.0
5,000.0
O L Total O L Total
2016 2017
General Cargo 355.7 10.3 366.0 382.2 0.3 382.5
Containerized 1,105.2 538.4 1,643.6 1,183.6 587.4 1,771.0
Ro-Ro 18.8 0.4 19.1 23.1 1.8 25.0
Liquid Bulk 2,386.0 242.4 2,628.5 2,155.8 279.4 2,435.2
Dry Bulk 1,703.9 295.9 1,999.8 1,574.0 341.9 1,915.9
Others 0.1 - 0.1 29.6 - 29.6
CENTRAL AMERICAN PORTS STATISTICAL SUMMARY, YEAR 2017
CENTRAL AMERICAN COMISSION OF MARITIME TRANSPORT, COCATRAM 11
HONDURAS1
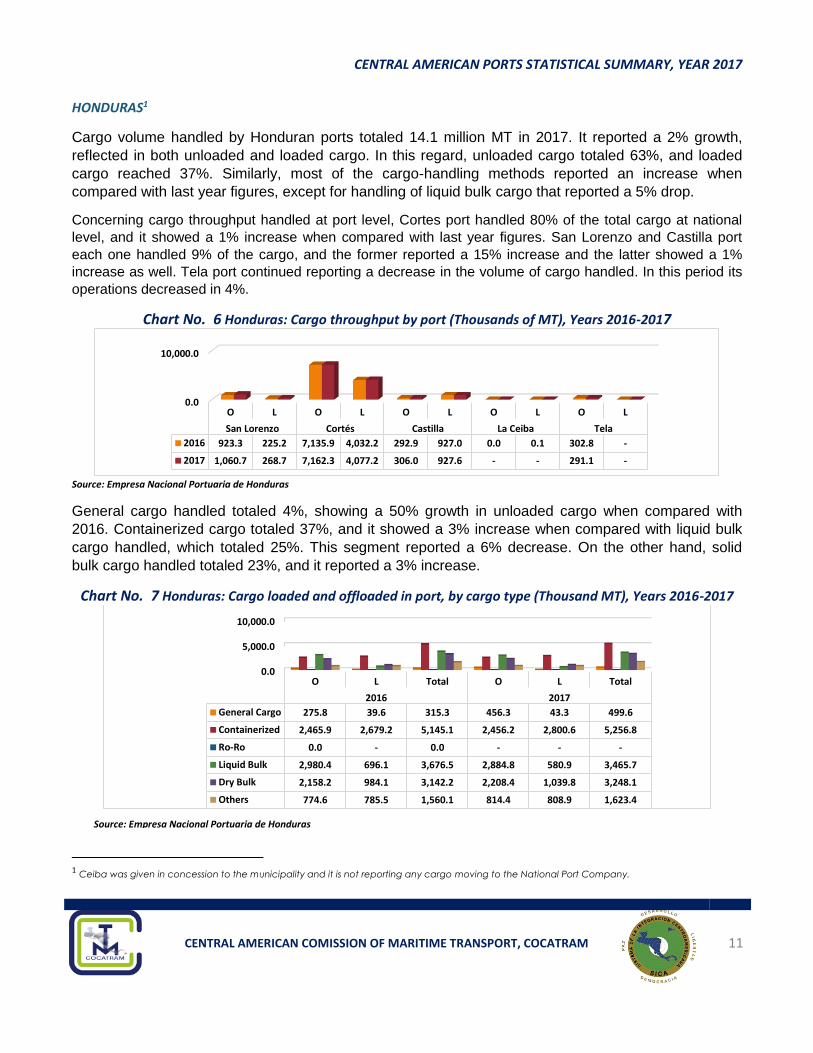
Cargo volume handled by Honduran ports totaled 14.1 million MT in 2017. It reported a 2% growth,
reflected in both unloaded and loaded cargo. In this regard, unloaded cargo totaled 63%, and loaded
cargo reached 37%. Similarly, most of the cargo-handling methods reported an increase when
compared with last year figures, except for handling of liquid bulk cargo that reported a 5% drop.
Concerning cargo throughput handled at port level, Cortes port handled 80% of the total cargo at national
level, and it showed a 1% increase when compared with last year figures. San Lorenzo and Castilla port
each one handled 9% of the cargo, and the former reported a 15% increase and the latter showed a 1%
increase as well. Tela port continued reporting a decrease in the volume of cargo handled. In this period its
operations decreased in 4%.
Chart No. 6 Honduras: Cargo throughput by port (Thousands of MT), Years 2016-2017
Source: Empresa Nacional Portuaria de Honduras
General cargo handled totaled 4%, showing a 50% growth in unloaded cargo when compared with
2016. Containerized cargo totaled 37%, and it showed a 3% increase when compared with liquid bulk
cargo handled, which totaled 25%. This segment reported a 6% decrease. On the other hand, solid
bulk cargo handled totaled 23%, and it reported a 3% increase.
Chart No. 7 Honduras: Cargo loaded and offloaded in port, by cargo type (Thousand MT), Years 2016-2017
1 Ceiba was given in concession to the municipality and it is not reporting any cargo moving to the National Port Company.
0.0
10,000.0
O L O L O L O L O L
San Lorenzo Cortés Castilla La Ceiba Tela
2016 923.3 225.2 7,135.9 4,032.2 292.9 927.0 0.0 0.1 302.8 -
2017 1,060.7 268.7 7,162.3 4,077.2 306.0 927.6 - - 291.1 -
0.0
5,000.0
10,000.0
O L Total O L Total
2016 2017
General Cargo 275.8 39.6 315.3 456.3 43.3 499.6
Containerized 2,465.9 2,679.2 5,145.1 2,456.2 2,800.6 5,256.8
Ro-Ro 0.0 - 0.0 - - -
Liquid Bulk 2,980.4 696.1 3,676.5 2,884.8 580.9 3,465.7
Dry Bulk 2,158.2 984.1 3,142.2 2,208.4 1,039.8 3,248.1
Others 774.6 785.5 1,560.1 814.4 808.9 1,623.4
Source: Empresa Nacional Portuaria de Honduras

CENTRAL AMERICAN PORTS STATISTICAL SUMMARY, YEAR 2017
CENTRAL AMERICAN COMISSION OF MARITIME TRANSPORT, COCATRAM 12
NICARAGUA
Cargo handled by Nicaraguan ports totaled 4.8 million MT in 2017; thus, reporting a 10% growth when
compared with the previous period. Unloaded cargo accounted for 74% of the total cargo, and it reported a
5% increase, while loaded cargo totaled 26%. This operation also showed a 25% increase when compared
with 2016.
Chart No. 8 Nicaragua: Cargo throughput by port (Thousands of MT), Years 2016-2017
Source: Empresa Portuaria de Nicaragua
Corinto port handled 79% of all the cargo handled nationwide, showing a 6% increase when compared with
2016. Unloaded cargo came to 67%, and loaded cargo totaled 33%. The latter reported a 24% growth in this
period, which particularly included delivery of solid bulk cargo with a 17% increase. Containerized cargo
accounted for 37% of the total cargo moved in this port, reporting a 21% increase in this segment. Similarly,
liquid bulk cargo handled reached 27% of the total cargo handled, down 11% on 2016 in both unloading and
loading operations. General cargo handled totaled 3%, and it suffered a 42% decrease.
During the period under review, Sandino port showed a 28% growth in the volume of cargo handled; Arlen
Siu port also showed a 25% increase; while Puerto Cabezas and Bluff ports showed a decrease of 26% and
1% drop respectively. Regarding sorts of cargo-handling method, general cargo accounted for 4% of the
total cargo moved, and it suffered a 3% decrease; containerized cargo reached 31%, and it reflected a 22%
increase; solid bulk cargo totaled 28%, and it had a 20% increase in this period; while liquid bulk cargo
totaled 37%; however, it suffered a 2% decrease.
Chart No. 9 Nicaragua: Cargo loaded and offloaded in port, by cargo type (Thousand MT), Years 2016-2017
Source: Empresa Portuaria de Nicaragua
0.0500.0
1,000.01,500.02,000.02,500.03,000.0
O L O L O L O L O L
Corinto Cabezas Arlen Síu El Bluff Sandino
2016 2,579.3 1,004.8 27.5 - 29.5 17.4 20.9 - 717.6 -
2017 2,559.1 1,248.4 20.2 - 31.9 26.7 20.8 - 920.7 -
0.0
2,000.0
O L Total O L Total
2016 2017
General Cargo 70.5 111.6 182.1 107.5 69.6 177.1
Containerized 672.6 539.0 1,211.6 723.4 750.8 1,474.2
Ro-Ro 36.3 1.0 37.4 26.2 0.0 26.2
Liquid Bulk 1,598.9 233.6 1,832.5 1,589.0 205.8 1,794.8
Dry Bulk 996.5 137.0 1,133.5 1,106.7 248.8 1,355.5
Others - - - - - -
CENTRAL AMERICAN PORTS STATISTICAL SUMMARY, YEAR 2017
CENTRAL AMERICAN COMISSION OF MARITIME TRANSPORT, COCATRAM 13
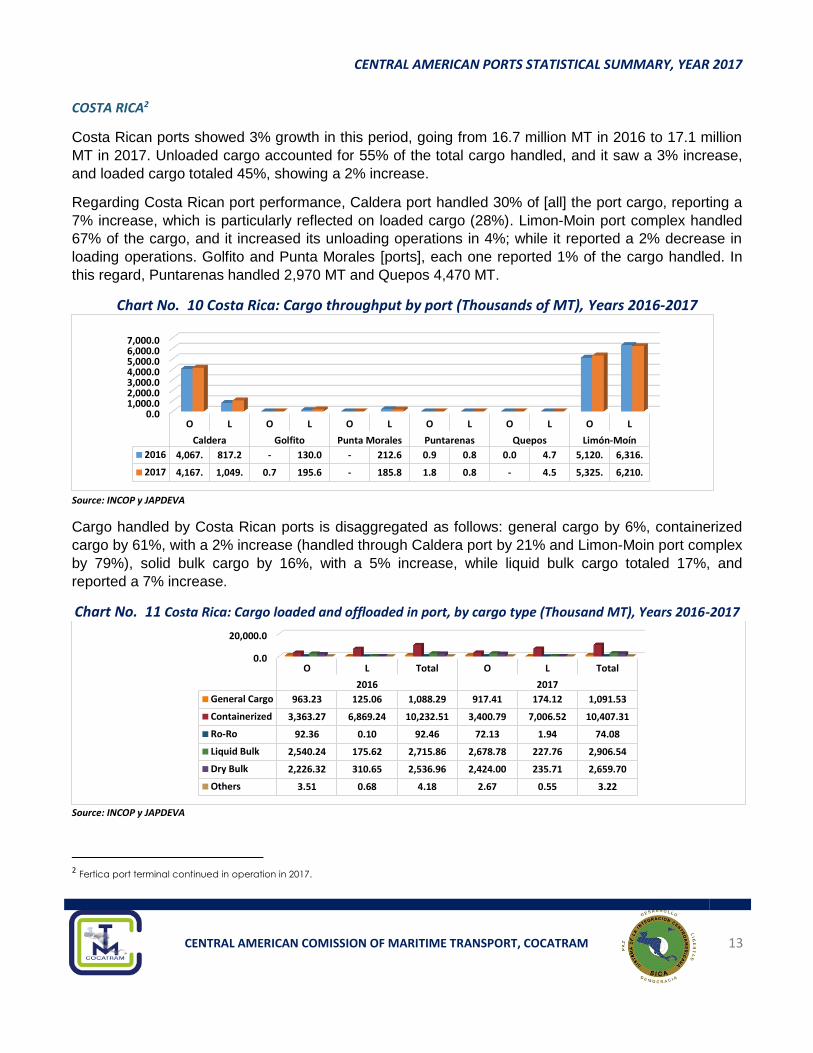
COSTA RICA2
Costa Rican ports showed 3% growth in this period, going from 16.7 million MT in 2016 to 17.1 million
MT in 2017. Unloaded cargo accounted for 55% of the total cargo handled, and it saw a 3% increase,
and loaded cargo totaled 45%, showing a 2% increase.
Regarding Costa Rican port performance, Caldera port handled 30% of [all] the port cargo, reporting a
7% increase, which is particularly reflected on loaded cargo (28%). Limon-Moin port complex handled
67% of the cargo, and it increased its unloading operations in 4%; while it reported a 2% decrease in
loading operations. Golfito and Punta Morales [ports], each one reported 1% of the cargo handled. In
this regard, Puntarenas handled 2,970 MT and Quepos 4,470 MT.
Chart No. 10 Costa Rica: Cargo throughput by port (Thousands of MT), Years 2016-2017
Source: INCOP y JAPDEVA
Cargo handled by Costa Rican ports is disaggregated as follows: general cargo by 6%, containerized
cargo by 61%, with a 2% increase (handled through Caldera port by 21% and Limon-Moin port complex
by 79%), solid bulk cargo by 16%, with a 5% increase, while liquid bulk cargo totaled 17%, and
reported a 7% increase.
Chart No. 11 Costa Rica: Cargo loaded and offloaded in port, by cargo type (Thousand MT), Years 2016-2017
Source: INCOP y JAPDEVA
2 Fertica port terminal continued in operation in 2017.
0.01,000.02,000.03,000.04,000.05,000.06,000.07,000.0
O L O L O L O L O L O L
Caldera Golfito Punta Morales Puntarenas Quepos Limón-Moín
2016 4,067. 817.2 - 130.0 - 212.6 0.9 0.8 0.0 4.7 5,120. 6,316.
2017 4,167. 1,049. 0.7 195.6 - 185.8 1.8 0.8 - 4.5 5,325. 6,210.
0.0
20,000.0
O L Total O L Total
2016 2017
General Cargo 963.23 125.06 1,088.29 917.41 174.12 1,091.53
Containerized 3,363.27 6,869.24 10,232.51 3,400.79 7,006.52 10,407.31
Ro-Ro 92.36 0.10 92.46 72.13 1.94 74.08
Liquid Bulk 2,540.24 175.62 2,715.86 2,678.78 227.76 2,906.54
Dry Bulk 2,226.32 310.65 2,536.96 2,424.00 235.71 2,659.70
Others 3.51 0.68 4.18 2.67 0.55 3.22
CENTRAL AMERICAN PORTS STATISTICAL SUMMARY, YEAR 2017
CENTRAL AMERICAN COMISSION OF MARITIME TRANSPORT, COCATRAM 14
PANAMA
In 2017, the Panamanian port system reported 82.1 million MT, growing by 11% when compared with
2016. This increase covered both unloading and loading operations, although the largest increase
(13%) was reported in unloading operations.
In relation to growth at port level, the most significant was reported by PPCC port terminal with 7,348.8
thousand MT in 2016, to 11,297.7 thousand MT in 2017, equivalent to 54% of the cargo handled.
Charco Azul ranked second regarding cargo volume moved, with a 14% increase. Similarly, MIT
reported a 5% increase, Chiriqui Grande reflected a 25% increase, and CCT reached a 11% increase
as well.
PPCB continued reporting the largest volume of cargo handled in 2017, even though it reported a 2%
decrease when compared with 2016. Similarly, port terminals that reported a decrease included PATSA
by 4%, PPIT by 50% and Terminal Granelera by 57%.
Volume of containerized cargo reached 56%, thus reporting a 11% increase. Liquid bulk cargo handled
totaled 42%, and it saw a 15% increase; solid bulk cargo with a 1%, suffered a 26% decrease. General
cargo represented less than 1%, and it also suffered a 59% decrease, including Ro-Ro cargo with less
than 1%.
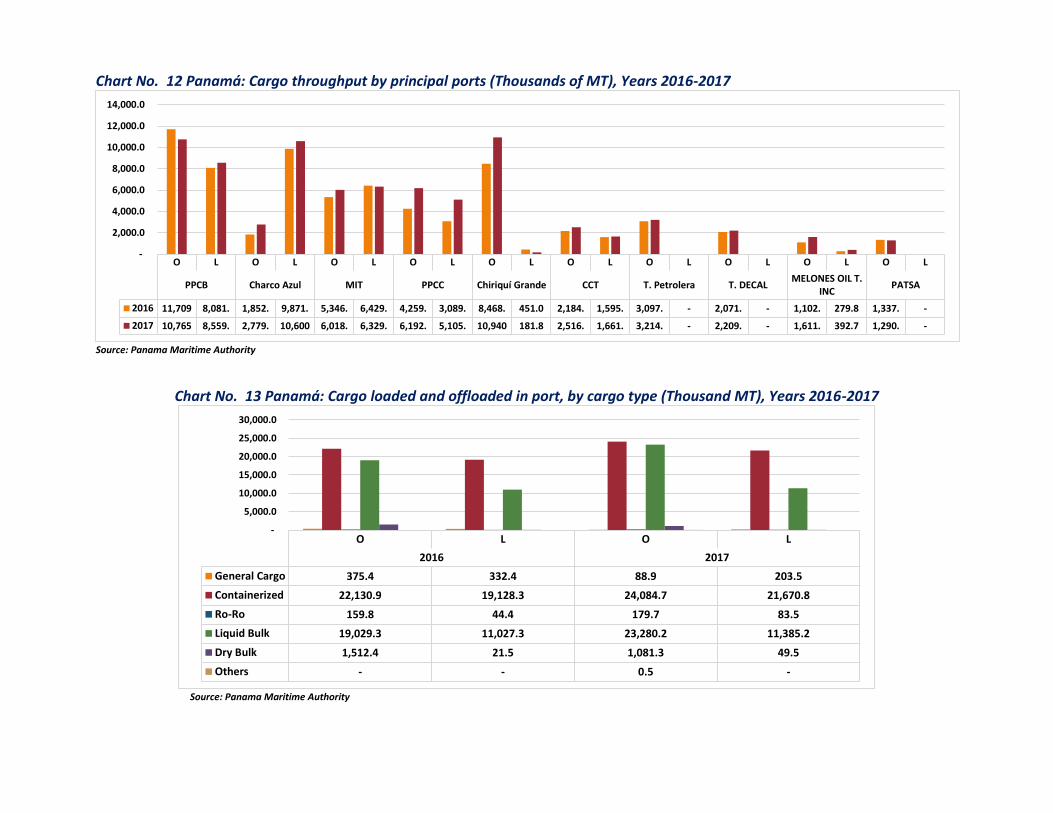
Chart No. 12 Panamá: Cargo throughput by principal ports (Thousands of MT), Years 2016-2017
Source: Panama Maritime Authority
Chart No. 13 Panamá: Cargo loaded and offloaded in port, by cargo type (Thousand MT), Years 2016-2017
Source: Panama Maritime Authority
O L O L O L O L O L O L O L O L O L O L
PPCB Charco Azul MIT PPCC Chiriquí Grande CCT T. Petrolera T. DECALMELONES OIL T.
INCPATSA
2016 11,709 8,081. 1,852. 9,871. 5,346. 6,429. 4,259. 3,089. 8,468. 451.0 2,184. 1,595. 3,097. - 2,071. - 1,102. 279.8 1,337. -
2017 10,765 8,559. 2,779. 10,600 6,018. 6,329. 6,192. 5,105. 10,940 181.8 2,516. 1,661. 3,214. - 2,209. - 1,611. 392.7 1,290. -
-
2,000.0
4,000.0
6,000.0
8,000.0
10,000.0
12,000.0
14,000.0
O L O L
2016 2017
General Cargo 375.4 332.4 88.9 203.5
Containerized 22,130.9 19,128.3 24,084.7 21,670.8
Ro-Ro 159.8 44.4 179.7 83.5
Liquid Bulk 19,029.3 11,027.3 23,280.2 11,385.2
Dry Bulk 1,512.4 21.5 1,081.3 49.5
Others - - 0.5 -
-
5,000.0
10,000.0
15,000.0
20,000.0
25,000.0
30,000.0
CENTRAL AMERICAN PORTS STATISTICAL SUMMARY, YEAR 2017
CENTRAL AMERICAN COMISSION OF MARITIME TRANSPORT, COCATRAM 16
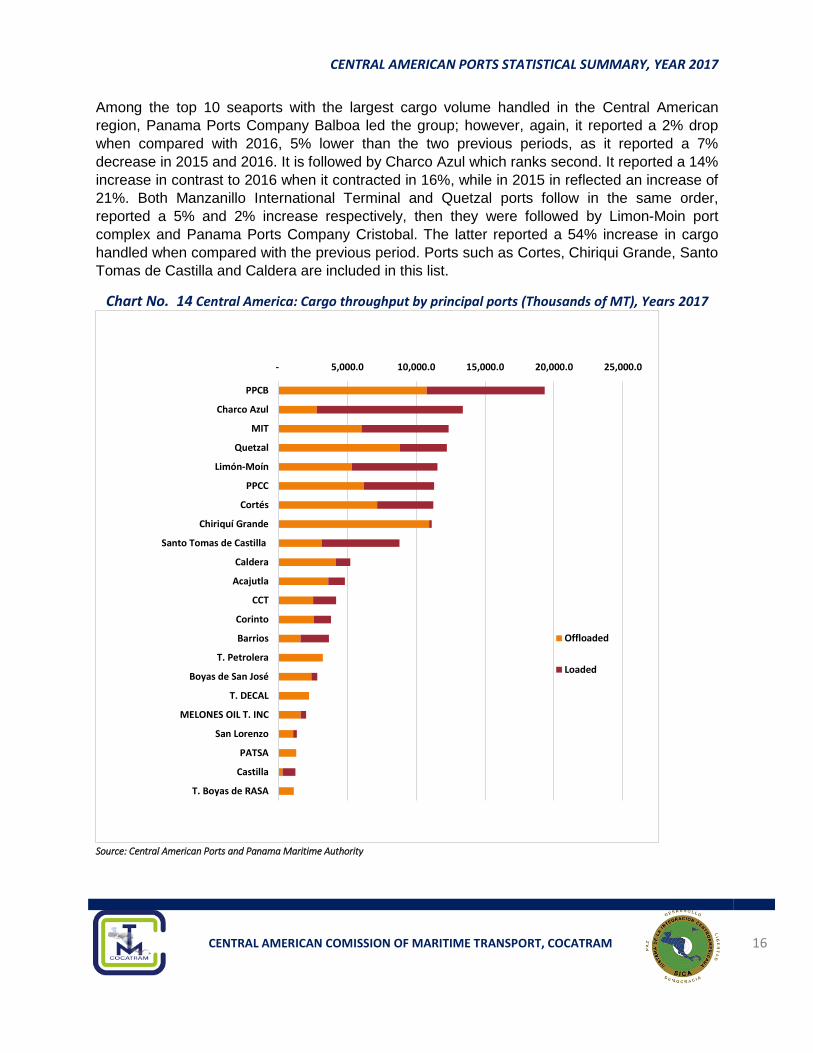
Among the top 10 seaports with the largest cargo volume handled in the Central American
region, Panama Ports Company Balboa led the group; however, again, it reported a 2% drop
when compared with 2016, 5% lower than the two previous periods, as it reported a 7%
decrease in 2015 and 2016. It is followed by Charco Azul which ranks second. It reported a 14%
increase in contrast to 2016 when it contracted in 16%, while in 2015 in reflected an increase of
21%. Both Manzanillo International Terminal and Quetzal ports follow in the same order,
reported a 5% and 2% increase respectively, then they were followed by Limon-Moin port
complex and Panama Ports Company Cristobal. The latter reported a 54% increase in cargo
handled when compared with the previous period. Ports such as Cortes, Chiriqui Grande, Santo
Tomas de Castilla and Caldera are included in this list.
Chart No. 14 Central America: Cargo throughput by principal ports (Thousands of MT), Years 2017
Source: Central American Ports and Panama Maritime Authority
- 5,000.0 10,000.0 15,000.0 20,000.0 25,000.0
PPCB
Charco Azul
MIT
Quetzal
Limón-Moín
PPCC
Cortés
Chiriquí Grande
Santo Tomas de Castilla
Caldera
Acajutla
CCT
Corinto
Barrios
T. Petrolera
Boyas de San José
T. DECAL
MELONES OIL T. INC
San Lorenzo
PATSA
Castilla
T. Boyas de RASA
Offloaded
Loaded
CENTRAL AMERICAN PORTS STATISTICAL SUMMARY, YEAR 2017
CENTRAL AMERICAN COMISSION OF MARITIME TRANSPORT, COCATRAM 17
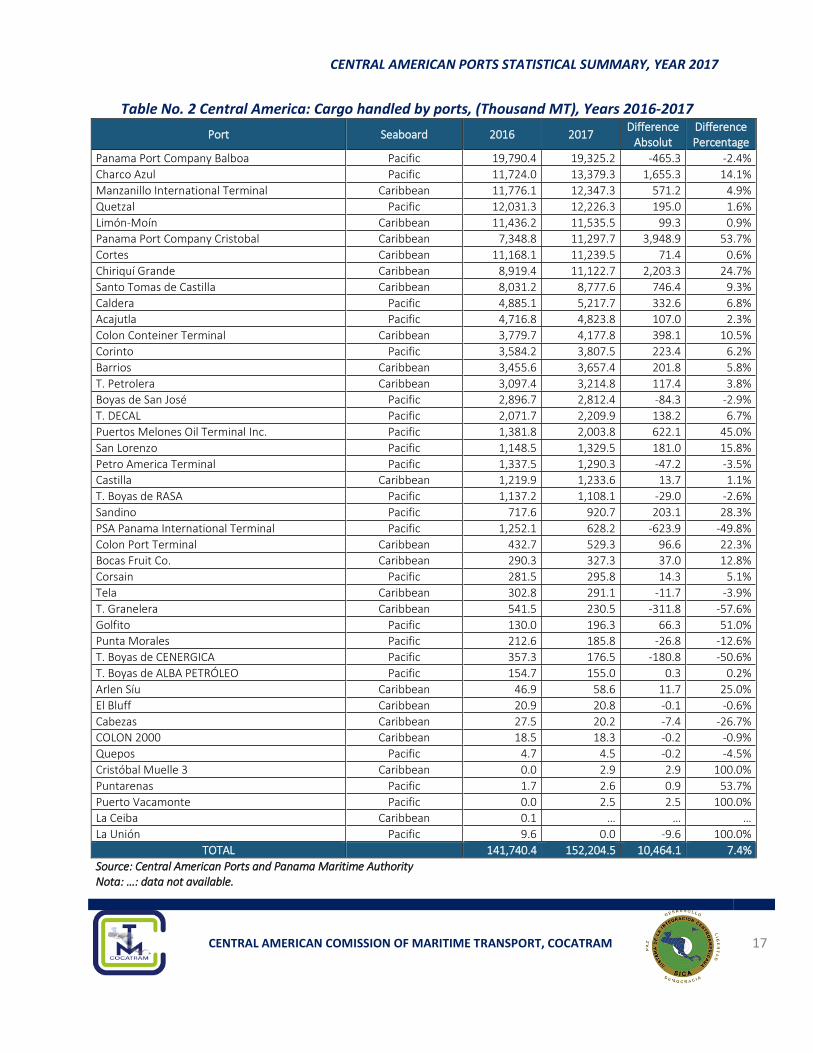
Table No. 2 Central America: Cargo handled by ports, (Thousand MT), Years 2016-2017
Port Seaboard 2016 2017 Difference
Absolut Difference Percentage
Panama Port Company Balboa Pacific 19,790.4 19,325.2 -465.3 -2.4%
Charco Azul Pacific 11,724.0 13,379.3 1,655.3 14.1%
Manzanillo International Terminal Caribbean 11,776.1 12,347.3 571.2 4.9%
Quetzal Pacific 12,031.3 12,226.3 195.0 1.6%
Limón-Moín Caribbean 11,436.2 11,535.5 99.3 0.9%
Panama Port Company Cristobal Caribbean 7,348.8 11,297.7 3,948.9 53.7%
Cortes Caribbean 11,168.1 11,239.5 71.4 0.6%
Chiriquí Grande Caribbean 8,919.4 11,122.7 2,203.3 24.7%
Santo Tomas de Castilla Caribbean 8,031.2 8,777.6 746.4 9.3%
Caldera Pacific 4,885.1 5,217.7 332.6 6.8%
Acajutla Pacific 4,716.8 4,823.8 107.0 2.3%
Colon Conteiner Terminal Caribbean 3,779.7 4,177.8 398.1 10.5%
Corinto Pacific 3,584.2 3,807.5 223.4 6.2%
Barrios Caribbean 3,455.6 3,657.4 201.8 5.8%
T. Petrolera Caribbean 3,097.4 3,214.8 117.4 3.8%
Boyas de San José Pacific 2,896.7 2,812.4 -84.3 -2.9%
T. DECAL Pacific 2,071.7 2,209.9 138.2 6.7%
Puertos Melones Oil Terminal Inc. Pacific 1,381.8 2,003.8 622.1 45.0%
San Lorenzo Pacific 1,148.5 1,329.5 181.0 15.8%
Petro America Terminal Pacific 1,337.5 1,290.3 -47.2 -3.5%
Castilla Caribbean 1,219.9 1,233.6 13.7 1.1%
T. Boyas de RASA Pacific 1,137.2 1,108.1 -29.0 -2.6%
Sandino Pacific 717.6 920.7 203.1 28.3%
PSA Panama International Terminal Pacific 1,252.1 628.2 -623.9 -49.8%
Colon Port Terminal Caribbean 432.7 529.3 96.6 22.3%
Bocas Fruit Co. Caribbean 290.3 327.3 37.0 12.8%
Corsain Pacific 281.5 295.8 14.3 5.1%
Tela Caribbean 302.8 291.1 -11.7 -3.9%
T. Granelera Caribbean 541.5 230.5 -311.8 -57.6%
Golfito Pacific 130.0 196.3 66.3 51.0%
Punta Morales Pacific 212.6 185.8 -26.8 -12.6%
T. Boyas de CENERGICA Pacific 357.3 176.5 -180.8 -50.6%
T. Boyas de ALBA PETRÓLEO Pacific 154.7 155.0 0.3 0.2%
Arlen Síu Caribbean 46.9 58.6 11.7 25.0%
El Bluff Caribbean 20.9 20.8 -0.1 -0.6%
Cabezas Caribbean 27.5 20.2 -7.4 -26.7%
COLON 2000 Caribbean 18.5 18.3 -0.2 -0.9%
Quepos Pacific 4.7 4.5 -0.2 -4.5%
Cristóbal Muelle 3 Caribbean 0.0 2.9 2.9 100.0%
Puntarenas Pacific 1.7 2.6 0.9 53.7%
Puerto Vacamonte Pacific 0.0 2.5 2.5 100.0%
La Ceiba Caribbean 0.1 … … …
La Unión Pacific 9.6 0.0 -9.6 100.0%
TOTAL
141,740.4 152,204.5 10,464.1 7.4%
Source: Central American Ports and Panama Maritime Authority Nota: …: data not available. Por
CENTRAL AMERICAN PORTS STATISTICAL SUMMARY, YEAR 2017
CENTRAL AMERICAN COMISSION OF MARITIME TRANSPORT, COCATRAM 18
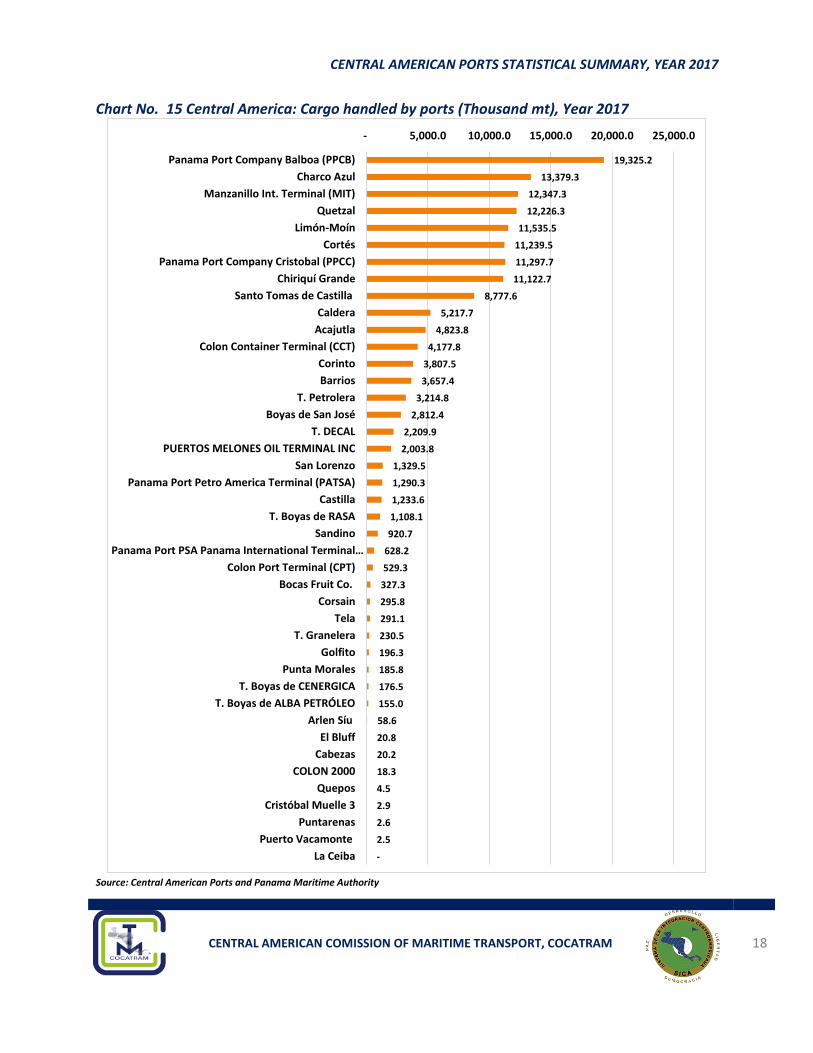
Chart No. 15 Central America: Cargo handled by ports (Thousand mt), Year 2017
Source: Central American Ports and Panama Maritime Authority
19,325.2
13,379.3
12,347.3
12,226.3
11,535.5
11,239.5
11,297.7
11,122.7
8,777.6
5,217.7
4,823.8
4,177.8
3,807.5
3,657.4
3,214.8
2,812.4
2,209.9
2,003.8
1,329.5
1,290.3
1,233.6
1,108.1
920.7
628.2
529.3
327.3
295.8
291.1
230.5
196.3
185.8
176.5
155.0
58.6
20.8
20.2
18.3
4.5
2.9
2.6
2.5
-
- 5,000.0 10,000.0 15,000.0 20,000.0 25,000.0
Panama Port Company Balboa (PPCB)
Charco Azul
Manzanillo Int. Terminal (MIT)
Quetzal
Limón-Moín
Cortés
Panama Port Company Cristobal (PPCC)
Chiriquí Grande
Santo Tomas de Castilla
Caldera
Acajutla
Colon Container Terminal (CCT)
Corinto
Barrios
T. Petrolera
Boyas de San José
T. DECAL
PUERTOS MELONES OIL TERMINAL INC
San Lorenzo
Panama Port Petro America Terminal (PATSA)
Castilla
T. Boyas de RASA
Sandino
Panama Port PSA Panama International Terminal…
Colon Port Terminal (CPT)
Bocas Fruit Co.
Corsain
Tela
T. Granelera
Golfito
Punta Morales
T. Boyas de CENERGICA
T. Boyas de ALBA PETRÓLEO
Arlen Síu
El Bluff
Cabezas
COLON 2000
Quepos
Cristóbal Muelle 3
Puntarenas
Puerto Vacamonte
La Ceiba
CENTRAL AMERICAN PORTS STATISTICAL SUMMARY, YEAR 2017
CENTRAL AMERICAN COMISSION OF MARITIME TRANSPORT, COCATRAM 19
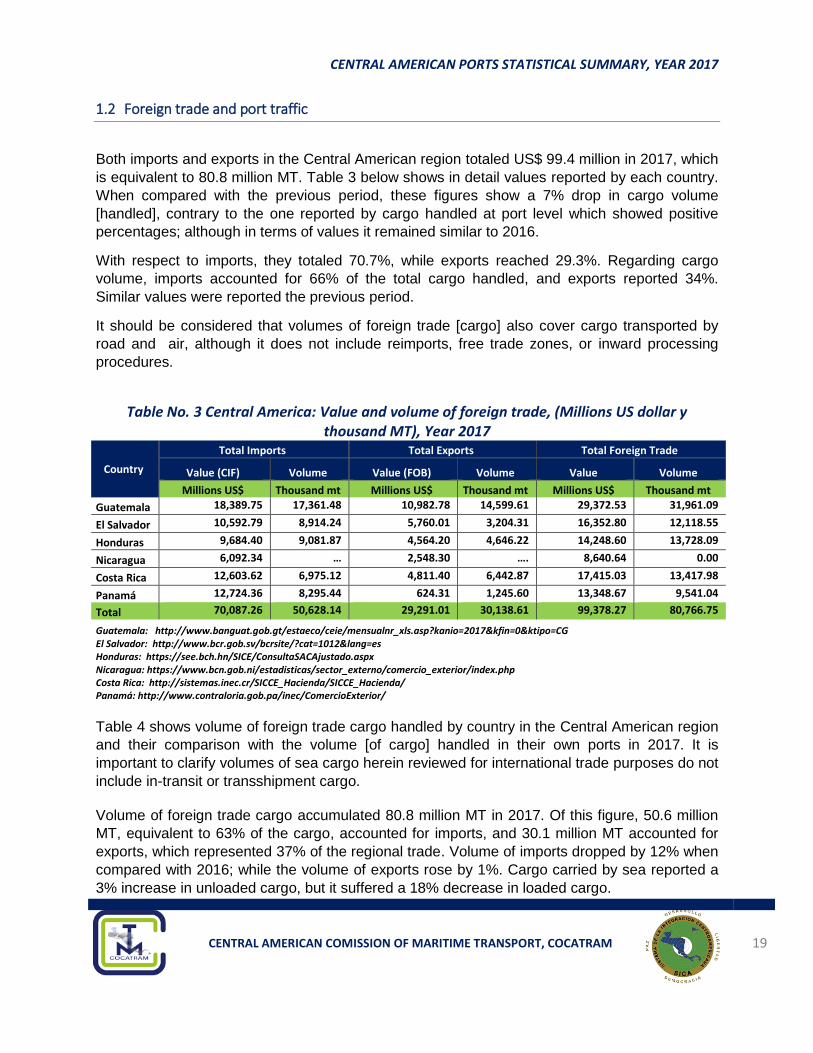
1.2 Foreign trade and port traffic
Both imports and exports in the Central American region totaled US$ 99.4 million in 2017, which
is equivalent to 80.8 million MT. Table 3 below shows in detail values reported by each country.
When compared with the previous period, these figures show a 7% drop in cargo volume
[handled], contrary to the one reported by cargo handled at port level which showed positive
percentages; although in terms of values it remained similar to 2016.
With respect to imports, they totaled 70.7%, while exports reached 29.3%. Regarding cargo
volume, imports accounted for 66% of the total cargo handled, and exports reported 34%.
Similar values were reported the previous period.
It should be considered that volumes of foreign trade [cargo] also cover cargo transported by
road and air, although it does not include reimports, free trade zones, or inward processing
procedures.
Table No. 3 Central America: Value and volume of foreign trade, (Millions US dollar y
thousand MT), Year 2017
Country
Total Imports Total Exports Total Foreign Trade
Value (CIF) Volume Value (FOB) Volume Value Volume
Millions US$ Thousand mt Millions US$ Thousand mt Millions US$ Thousand mt
Guatemala 18,389.75 17,361.48 10,982.78 14,599.61 29,372.53 31,961.09
El Salvador 10,592.79 8,914.24 5,760.01 3,204.31 16,352.80 12,118.55
Honduras 9,684.40 9,081.87 4,564.20 4,646.22 14,248.60 13,728.09
Nicaragua 6,092.34 … 2,548.30 …. 8,640.64 0.00
Costa Rica 12,603.62 6,975.12 4,811.40 6,442.87 17,415.03 13,417.98
Panamá 12,724.36 8,295.44 624.31 1,245.60 13,348.67 9,541.04
Total 70,087.26 50,628.14 29,291.01 30,138.61 99,378.27 80,766.75
Guatemala: http://www.banguat.gob.gt/estaeco/ceie/mensualnr_xls.asp?kanio=2017&kfin=0&ktipo=CG El Salvador: http://www.bcr.gob.sv/bcrsite/?cat=1012&lang=es Honduras: https://see.bch.hn/SICE/ConsultaSACAjustado.aspx Nicaragua: https://www.bcn.gob.ni/estadisticas/sector_externo/comercio_exterior/index.php Costa Rica: http://sistemas.inec.cr/SICCE_Hacienda/SICCE_Hacienda/ Panamá: http://www.contraloria.gob.pa/inec/ComercioExterior/
Table 4 shows volume of foreign trade cargo handled by country in the Central American region
and their comparison with the volume [of cargo] handled in their own ports in 2017. It is
important to clarify volumes of sea cargo herein reviewed for international trade purposes do not
include in-transit or transshipment cargo.
Volume of foreign trade cargo accumulated 80.8 million MT in 2017. Of this figure, 50.6 million
MT, equivalent to 63% of the cargo, accounted for imports, and 30.1 million MT accounted for
exports, which represented 37% of the regional trade. Volume of imports dropped by 12% when
compared with 2016; while the volume of exports rose by 1%. Cargo carried by sea reported a
3% increase in unloaded cargo, but it suffered a 18% decrease in loaded cargo.
CENTRAL AMERICAN PORTS STATISTICAL SUMMARY, YEAR 2017
CENTRAL AMERICAN COMISSION OF MARITIME TRANSPORT, COCATRAM 20
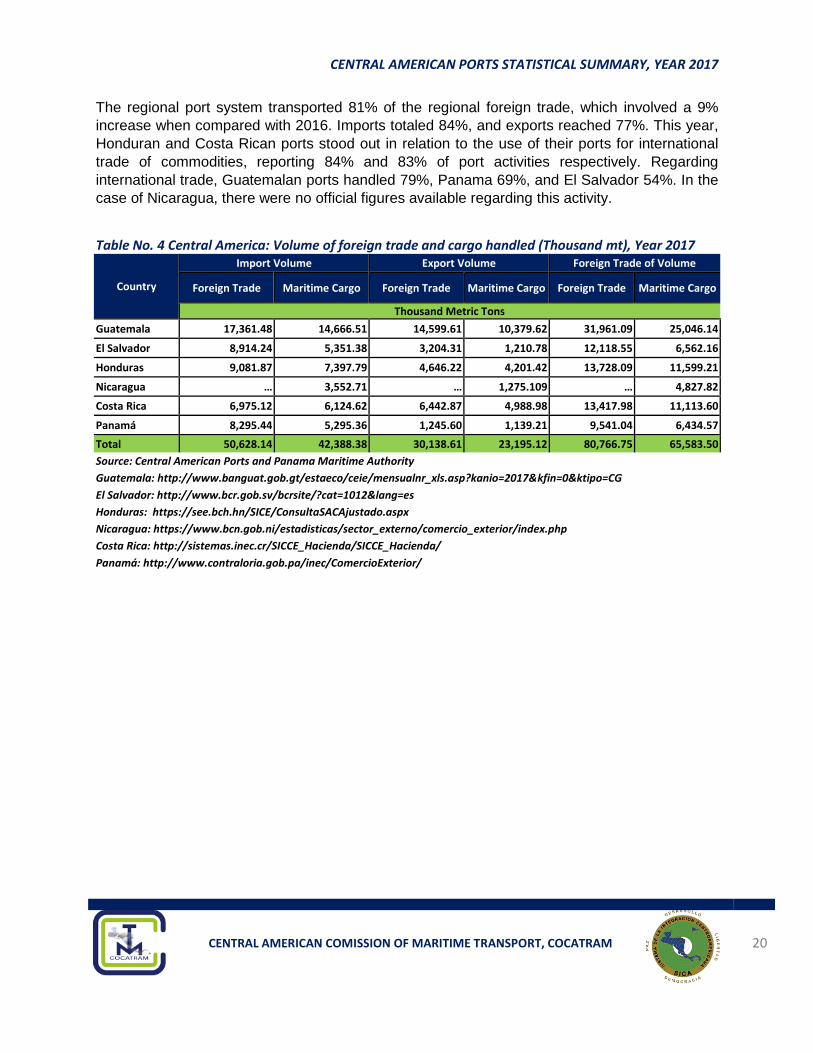
The regional port system transported 81% of the regional foreign trade, which involved a 9%
increase when compared with 2016. Imports totaled 84%, and exports reached 77%. This year,
Honduran and Costa Rican ports stood out in relation to the use of their ports for international
trade of commodities, reporting 84% and 83% of port activities respectively. Regarding
international trade, Guatemalan ports handled 79%, Panama 69%, and El Salvador 54%. In the
case of Nicaragua, there were no official figures available regarding this activity.
Table No. 4 Central America: Volume of foreign trade and cargo handled (Thousand mt), Year 2017
Country
Import Volume Export Volume Foreign Trade of Volume
Foreign Trade Maritime Cargo Foreign Trade Maritime Cargo Foreign Trade Maritime Cargo
Thousand Metric Tons
Guatemala 17,361.48 14,666.51 14,599.61 10,379.62 31,961.09 25,046.14
El Salvador 8,914.24 5,351.38 3,204.31 1,210.78 12,118.55 6,562.16
Honduras 9,081.87 7,397.79 4,646.22 4,201.42 13,728.09 11,599.21
Nicaragua … 3,552.71 … 1,275.109 … 4,827.82
Costa Rica 6,975.12 6,124.62 6,442.87 4,988.98 13,417.98 11,113.60
Panamá 8,295.44 5,295.36 1,245.60 1,139.21 9,541.04 6,434.57
Total 50,628.14 42,388.38 30,138.61 23,195.12 80,766.75 65,583.50
Source: Central American Ports and Panama Maritime Authority
Guatemala: http://www.banguat.gob.gt/estaeco/ceie/mensualnr_xls.asp?kanio=2017&kfin=0&ktipo=CG
El Salvador: http://www.bcr.gob.sv/bcrsite/?cat=1012&lang=es
Honduras: https://see.bch.hn/SICE/ConsultaSACAjustado.aspx
Nicaragua: https://www.bcn.gob.ni/estadisticas/sector_externo/comercio_exterior/index.php
Costa Rica: http://sistemas.inec.cr/SICCE_Hacienda/SICCE_Hacienda/
Panamá: http://www.contraloria.gob.pa/inec/ComercioExterior/
CENTRAL AMERICAN PORTS STATISTICAL SUMMARY, YEAR 2017
CENTRAL AMERICAN COMISSION OF MARITIME TRANSPORT, COCATRAM 21
1.3 Cargo throughput handled by coast
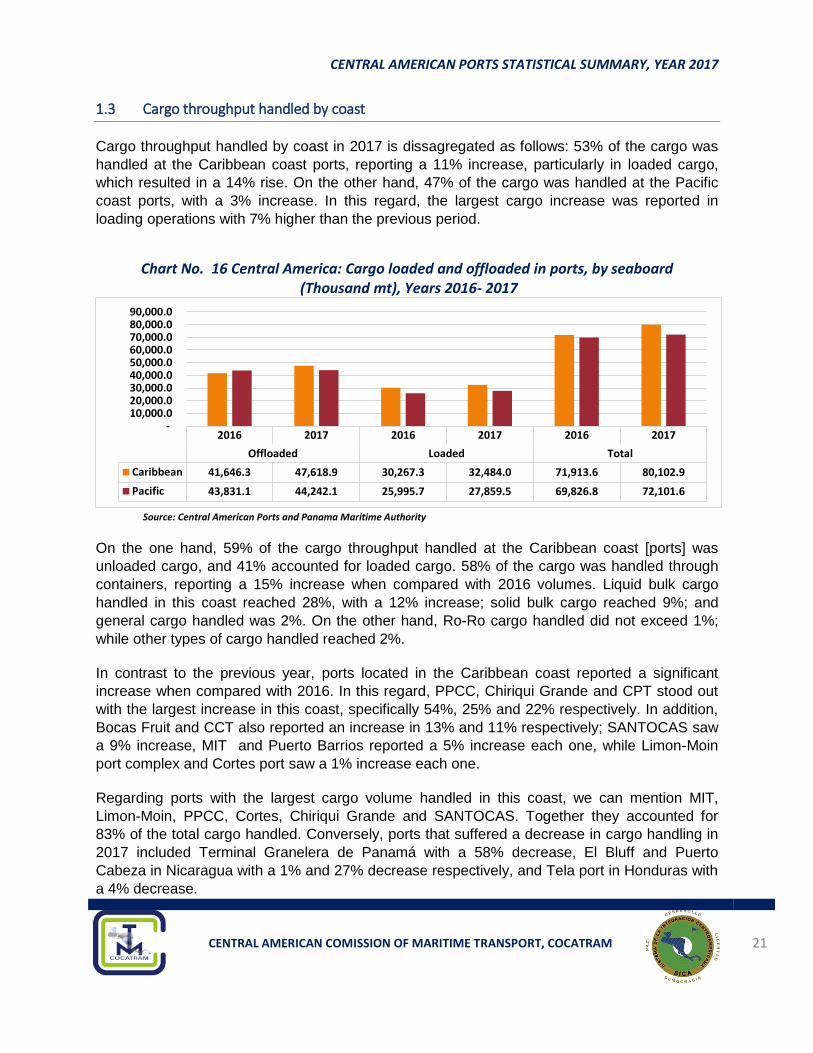
Cargo throughput handled by coast in 2017 is dissagregated as follows: 53% of the cargo was
handled at the Caribbean coast ports, reporting a 11% increase, particularly in loaded cargo,
which resulted in a 14% rise. On the other hand, 47% of the cargo was handled at the Pacific
coast ports, with a 3% increase. In this regard, the largest cargo increase was reported in
loading operations with 7% higher than the previous period.
Chart No. 16 Central America: Cargo loaded and offloaded in ports, by seaboard
(Thousand mt), Years 2016- 2017
Source: Central American Ports and Panama Maritime Authority
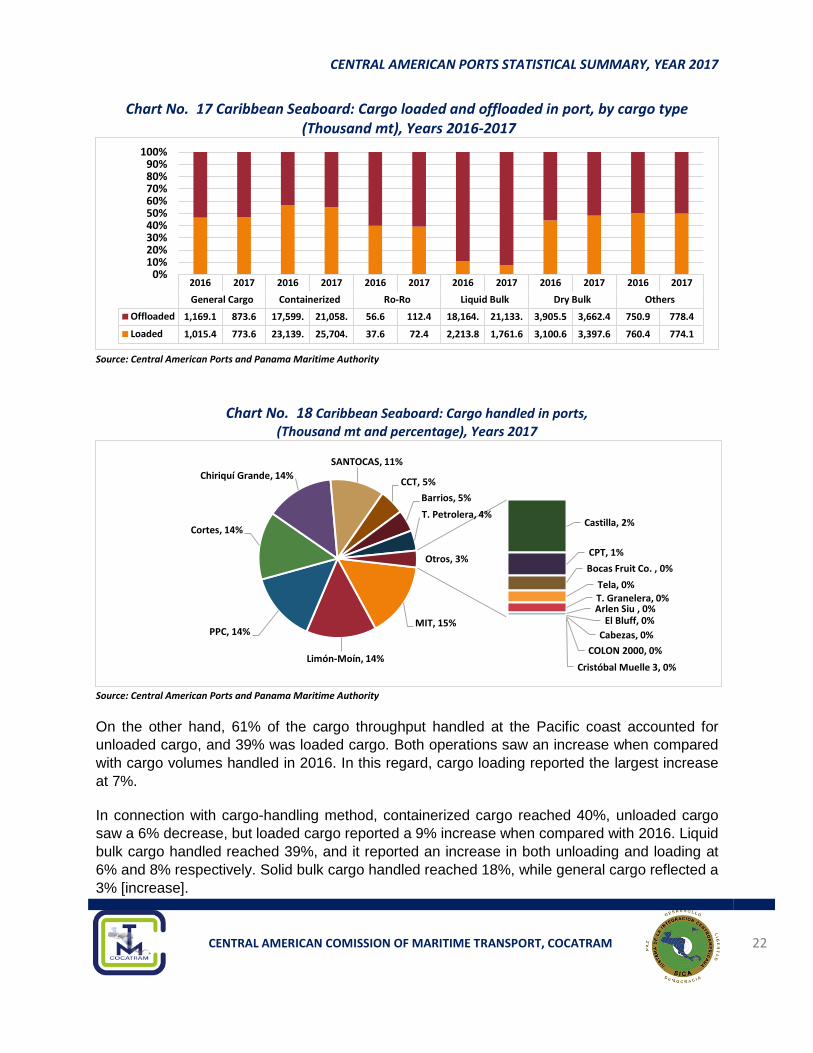
On the one hand, 59% of the cargo throughput handled at the Caribbean coast [ports] was
unloaded cargo, and 41% accounted for loaded cargo. 58% of the cargo was handled through
containers, reporting a 15% increase when compared with 2016 volumes. Liquid bulk cargo
handled in this coast reached 28%, with a 12% increase; solid bulk cargo reached 9%; and
general cargo handled was 2%. On the other hand, Ro-Ro cargo handled did not exceed 1%;
while other types of cargo handled reached 2%.
In contrast to the previous year, ports located in the Caribbean coast reported a significant
increase when compared with 2016. In this regard, PPCC, Chiriqui Grande and CPT stood out
with the largest increase in this coast, specifically 54%, 25% and 22% respectively. In addition,
Bocas Fruit and CCT also reported an increase in 13% and 11% respectively; SANTOCAS saw
a 9% increase, MIT and Puerto Barrios reported a 5% increase each one, while Limon-Moin
port complex and Cortes port saw a 1% increase each one.
Regarding ports with the largest cargo volume handled in this coast, we can mention MIT,
Limon-Moin, PPCC, Cortes, Chiriqui Grande and SANTOCAS. Together they accounted for
83% of the total cargo handled. Conversely, ports that suffered a decrease in cargo handling in
2017 included Terminal Granelera de Panamá with a 58% decrease, El Bluff and Puerto
Cabeza in Nicaragua with a 1% and 27% decrease respectively, and Tela port in Honduras with
a 4% decrease.
2016 2017 2016 2017 2016 2017
Offloaded Loaded Total
Caribbean 41,646.3 47,618.9 30,267.3 32,484.0 71,913.6 80,102.9
Pacific 43,831.1 44,242.1 25,995.7 27,859.5 69,826.8 72,101.6
- 10,000.0 20,000.0 30,000.0 40,000.0 50,000.0 60,000.0 70,000.0 80,000.0 90,000.0
CENTRAL AMERICAN PORTS STATISTICAL SUMMARY, YEAR 2017
CENTRAL AMERICAN COMISSION OF MARITIME TRANSPORT, COCATRAM 22
Chart No. 17 Caribbean Seaboard: Cargo loaded and offloaded in port, by cargo type (Thousand mt), Years 2016-2017
Source: Central American Ports and Panama Maritime Authority
Chart No. 18 Caribbean Seaboard: Cargo handled in ports, (Thousand mt and percentage), Years 2017
Source: Central American Ports and Panama Maritime Authority
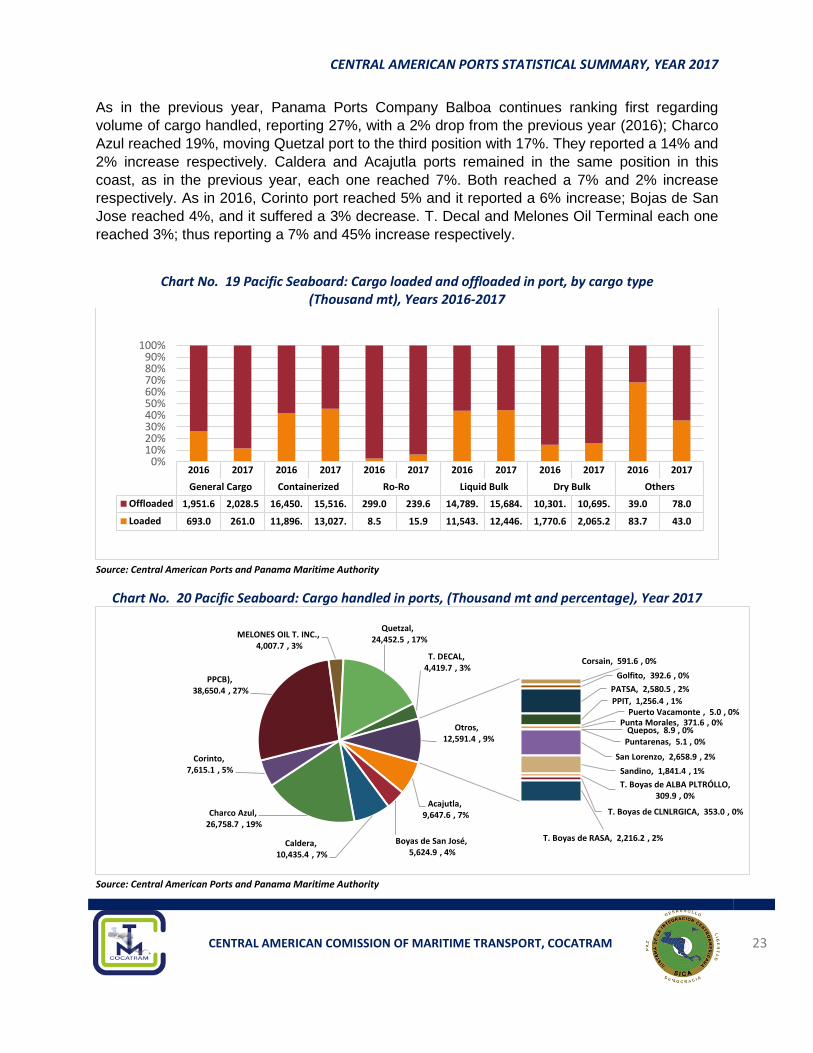
On the other hand, 61% of the cargo throughput handled at the Pacific coast accounted for
unloaded cargo, and 39% was loaded cargo. Both operations saw an increase when compared
with cargo volumes handled in 2016. In this regard, cargo loading reported the largest increase
at 7%.
In connection with cargo-handling method, containerized cargo reached 40%, unloaded cargo
saw a 6% decrease, but loaded cargo reported a 9% increase when compared with 2016. Liquid
bulk cargo handled reached 39%, and it reported an increase in both unloading and loading at
6% and 8% respectively. Solid bulk cargo handled reached 18%, while general cargo reflected a
3% [increase].
2016 2017 2016 2017 2016 2017 2016 2017 2016 2017 2016 2017
General Cargo Containerized Ro-Ro Liquid Bulk Dry Bulk Others
Offloaded 1,169.1 873.6 17,599. 21,058. 56.6 112.4 18,164. 21,133. 3,905.5 3,662.4 750.9 778.4
Loaded 1,015.4 773.6 23,139. 25,704. 37.6 72.4 2,213.8 1,761.6 3,100.6 3,397.6 760.4 774.1
0%10%20%30%40%50%60%70%80%90%
100%
MIT, 15%
Limón-Moín, 14%
PPC, 14%
Cortes, 14%
Chiriquí Grande, 14%
SANTOCAS, 11%
CCT, 5%
Barrios, 5%
T. Petrolera, 4%Castilla, 2%
CPT, 1%
Bocas Fruit Co. , 0%
Tela, 0%T. Granelera, 0%Arlen Siu , 0%
El Bluff, 0%
Cabezas, 0%
COLON 2000, 0%
Cristóbal Muelle 3, 0%
Otros, 3%
CENTRAL AMERICAN PORTS STATISTICAL SUMMARY, YEAR 2017
CENTRAL AMERICAN COMISSION OF MARITIME TRANSPORT, COCATRAM 23
As in the previous year, Panama Ports Company Balboa continues ranking first regarding
volume of cargo handled, reporting 27%, with a 2% drop from the previous year (2016); Charco
Azul reached 19%, moving Quetzal port to the third position with 17%. They reported a 14% and
2% increase respectively. Caldera and Acajutla ports remained in the same position in this
coast, as in the previous year, each one reached 7%. Both reached a 7% and 2% increase
respectively. As in 2016, Corinto port reached 5% and it reported a 6% increase; Bojas de San
Jose reached 4%, and it suffered a 3% decrease. T. Decal and Melones Oil Terminal each one
reached 3%; thus reporting a 7% and 45% increase respectively.
Chart No. 19 Pacific Seaboard: Cargo loaded and offloaded in port, by cargo type
(Thousand mt), Years 2016-2017
Source: Central American Ports and Panama Maritime Authority
Chart No. 20 Pacific Seaboard: Cargo handled in ports, (Thousand mt and percentage), Year 2017
Source: Central American Ports and Panama Maritime Authority
2016 2017 2016 2017 2016 2017 2016 2017 2016 2017 2016 2017
General Cargo Containerized Ro-Ro Liquid Bulk Dry Bulk Others
Offloaded 1,951.6 2,028.5 16,450. 15,516. 299.0 239.6 14,789. 15,684. 10,301. 10,695. 39.0 78.0
Loaded 693.0 261.0 11,896. 13,027. 8.5 15.9 11,543. 12,446. 1,770.6 2,065.2 83.7 43.0
0%10%20%30%40%50%60%70%80%90%
100%
Acajutla, 9,647.6 , 7%
Boyas de San José, 5,624.9 , 4%
Caldera, 10,435.4 , 7%
Charco Azul, 26,758.7 , 19%
Corinto, 7,615.1 , 5%
Corsain, 591.6 , 0%
Golfito, 392.6 , 0%PPCB), 38,650.4 , 27% PATSA, 2,580.5 , 2%
PPIT, 1,256.4 , 1%Puerto Vacamonte , 5.0 , 0%
MELONES OIL T. INC., 4,007.7 , 3%
Punta Morales, 371.6 , 0%
Puntarenas, 5.1 , 0%Quepos, 8.9 , 0%
Quetzal,24,452.5 , 17%
San Lorenzo, 2,658.9 , 2%
Sandino, 1,841.4 , 1%
T. Boyas de ALBA PLTRÓLLO, 309.9 , 0%
T. Boyas de CLNLRGICA, 353.0 , 0%
T. Boyas de RASA, 2,216.2 , 2%
T. DECAL, 4,419.7 , 3%
Otros,12,591.4 , 9%
CENTRAL AMERICAN PORTS STATISTICAL SUMMARY, YEAR 2017
CENTRAL AMERICAN COMISSION OF MARITIME TRANSPORT, COCATRAM 24
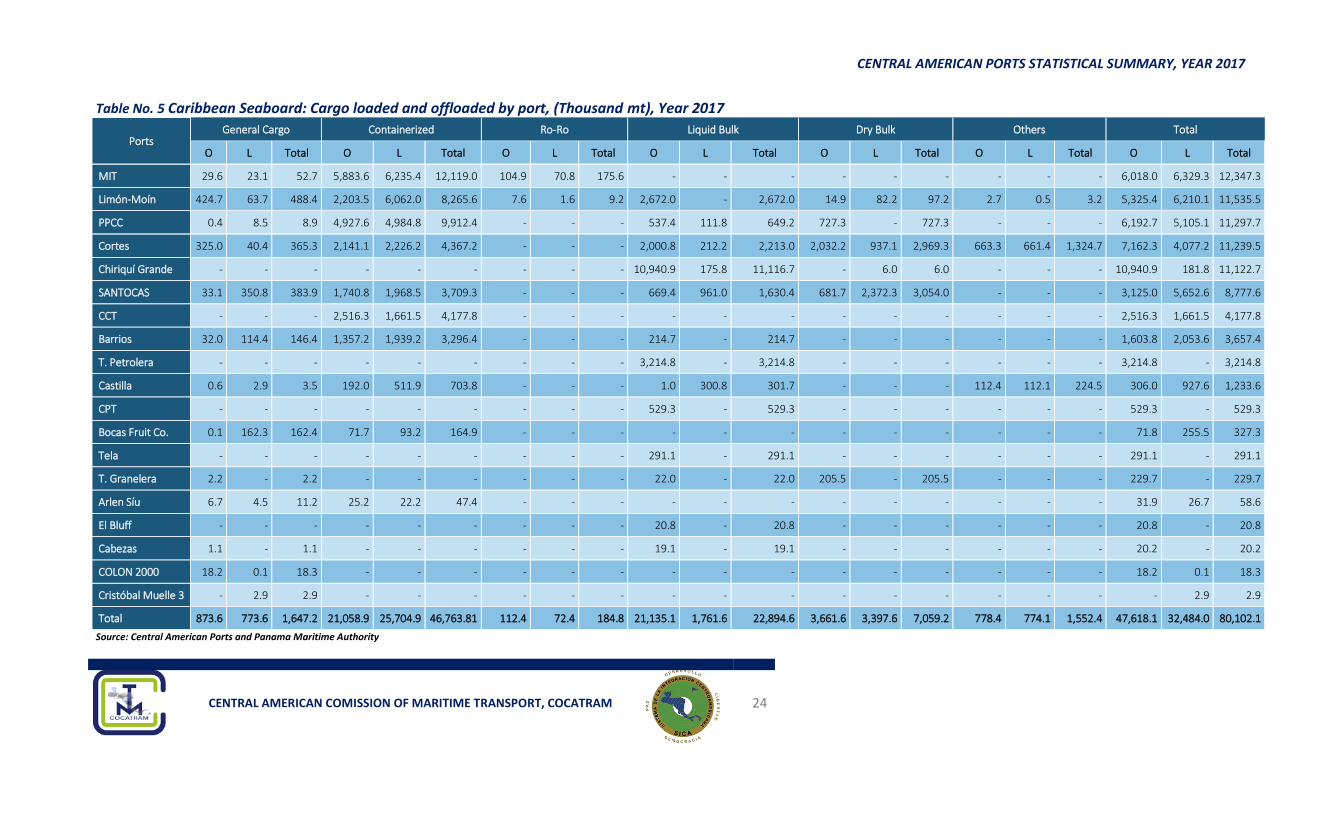
Table No. 5 Caribbean Seaboard: Cargo loaded and offloaded by port, (Thousand mt), Year 2017
Ports General Cargo Containerized Ro-Ro Liquid Bulk Dry Bulk Others Total
O L Total O L Total O L Total O L Total O L Total O L Total O L Total
MIT 29.6 23.1 52.7 5,883.6 6,235.4 12,119.0 104.9 70.8 175.6 - - - - - - - - - 6,018.0 6,329.3 12,347.3
Limón-Moín 424.7 63.7 488.4 2,203.5 6,062.0 8,265.6 7.6 1.6 9.2 2,672.0 - 2,672.0 14.9 82.2 97.2 2.7 0.5 3.2 5,325.4 6,210.1 11,535.5
PPCC 0.4 8.5 8.9 4,927.6 4,984.8 9,912.4 - - - 537.4 111.8 649.2 727.3 - 727.3 - - - 6,192.7 5,105.1 11,297.7
Cortes 325.0 40.4 365.3 2,141.1 2,226.2 4,367.2 - - - 2,000.8 212.2 2,213.0 2,032.2 937.1 2,969.3 663.3 661.4 1,324.7 7,162.3 4,077.2 11,239.5
Chiriquí Grande - - - - - - - - - 10,940.9 175.8 11,116.7 - 6.0 6.0 - - - 10,940.9 181.8 11,122.7
SANTOCAS 33.1 350.8 383.9 1,740.8 1,968.5 3,709.3 - - - 669.4 961.0 1,630.4 681.7 2,372.3 3,054.0 - - - 3,125.0 5,652.6 8,777.6
CCT - - - 2,516.3 1,661.5 4,177.8 - - - - - - - - - - - - 2,516.3 1,661.5 4,177.8
Barrios 32.0 114.4 146.4 1,357.2 1,939.2 3,296.4 - - - 214.7 - 214.7 - - - - - - 1,603.8 2,053.6 3,657.4
T. Petrolera - - - - - - - - - 3,214.8 - 3,214.8 - - - - - - 3,214.8 - 3,214.8
Castilla 0.6 2.9 3.5 192.0 511.9 703.8 - - - 1.0 300.8 301.7 - - - 112.4 112.1 224.5 306.0 927.6 1,233.6
CPT - - - - - - - - - 529.3 - 529.3 - - - - - - 529.3 - 529.3
Bocas Fruit Co. 0.1 162.3 162.4 71.7 93.2 164.9 - - - - - - - - - - - - 71.8 255.5 327.3
Tela - - - - - - - - - 291.1 - 291.1 - - - - - - 291.1 - 291.1
T. Granelera 2.2 - 2.2 - - - - - - 22.0 - 22.0 205.5 - 205.5 - - - 229.7 - 229.7
Arlen Síu 6.7 4.5 11.2 25.2 22.2 47.4 - - - - - - - - - - - - 31.9 26.7 58.6
El Bluff - - - - - - - - - 20.8 - 20.8 - - - - - - 20.8 - 20.8
Cabezas 1.1 - 1.1 - - - - - - 19.1 - 19.1 - - - - - - 20.2 - 20.2
COLON 2000 18.2 0.1 18.3 - - - - - - - - - - - - - - - 18.2 0.1 18.3
Cristóbal Muelle 3 - 2.9 2.9 - - - - - - - - - - - - - - - - 2.9 2.9
Total 873.6 773.6 1,647.2 21,058.9 25,704.9 46,763.81 112.4 72.4 184.8 21,135.1 1,761.6 22,894.6 3,661.6 3,397.6 7,059.2 778.4 774.1 1,552.4 47,618.1 32,484.0 80,102.1
Source: Central American Ports and Panama Maritime Authority
CENTRAL AMERICAN PORTS STATISTICAL SUMMARY, YEAR 2017
CENTRAL AMERICAN COMISSION OF MARITIME TRANSPORT, COCATRAM 25
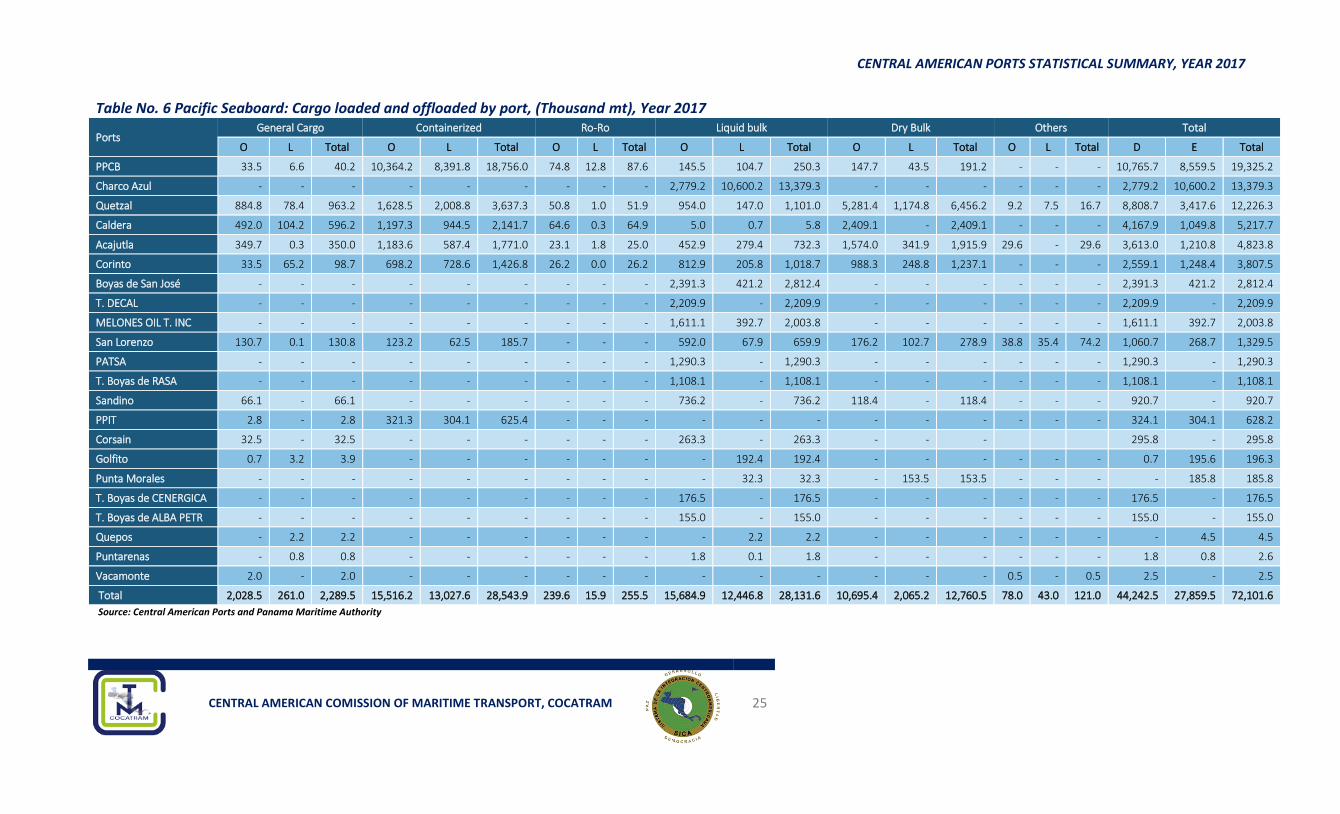
Table No. 6 Pacific Seaboard: Cargo loaded and offloaded by port, (Thousand mt), Year 2017
Ports General Cargo Containerized Ro-Ro Liquid bulk Dry Bulk Others Total
O L Total O L Total O L Total O L Total O L Total O L Total D E Total
PPCB 33.5 6.6 40.2 10,364.2 8,391.8 18,756.0 74.8 12.8 87.6 145.5 104.7 250.3 147.7 43.5 191.2 - - - 10,765.7 8,559.5 19,325.2
Charco Azul - - - - - - - - - 2,779.2 10,600.2 13,379.3 - - - - - - 2,779.2 10,600.2 13,379.3
Quetzal 884.8 78.4 963.2 1,628.5 2,008.8 3,637.3 50.8 1.0 51.9 954.0 147.0 1,101.0 5,281.4 1,174.8 6,456.2 9.2 7.5 16.7 8,808.7 3,417.6 12,226.3
Caldera 492.0 104.2 596.2 1,197.3 944.5 2,141.7 64.6 0.3 64.9 5.0 0.7 5.8 2,409.1 - 2,409.1 - - - 4,167.9 1,049.8 5,217.7
Acajutla 349.7 0.3 350.0 1,183.6 587.4 1,771.0 23.1 1.8 25.0 452.9 279.4 732.3 1,574.0 341.9 1,915.9 29.6 - 29.6 3,613.0 1,210.8 4,823.8
Corinto 33.5 65.2 98.7 698.2 728.6 1,426.8 26.2 0.0 26.2 812.9 205.8 1,018.7 988.3 248.8 1,237.1 - - - 2,559.1 1,248.4 3,807.5
Boyas de San José - - - - - - - - - 2,391.3 421.2 2,812.4 - - - - - - 2,391.3 421.2 2,812.4
T. DECAL - - - - - - - - - 2,209.9 - 2,209.9 - - - - - - 2,209.9 - 2,209.9
MELONES OIL T. INC - - - - - - - - - 1,611.1 392.7 2,003.8 - - - - - - 1,611.1 392.7 2,003.8
San Lorenzo 130.7 0.1 130.8 123.2 62.5 185.7 - - - 592.0 67.9 659.9 176.2 102.7 278.9 38.8 35.4 74.2 1,060.7 268.7 1,329.5
PATSA - - - - - - - - - 1,290.3 - 1,290.3 - - - - - - 1,290.3 - 1,290.3
T. Boyas de RASA - - - - - - - - - 1,108.1 - 1,108.1 - - - - - - 1,108.1 - 1,108.1
Sandino 66.1 - 66.1 - - - - - - 736.2 - 736.2 118.4 - 118.4 - - - 920.7 - 920.7
PPIT 2.8 - 2.8 321.3 304.1 625.4 - - - - - - - - - - - - 324.1 304.1 628.2
Corsain 32.5 - 32.5 - - - - - - 263.3 - 263.3 - - -
295.8 - 295.8
Golfito 0.7 3.2 3.9 - - - - - - - 192.4 192.4 - - - - - - 0.7 195.6 196.3
Punta Morales - - - - - - - - - - 32.3 32.3 - 153.5 153.5 - - - - 185.8 185.8
T. Boyas de CENERGICA - - - - - - - - - 176.5 - 176.5 - - - - - - 176.5 - 176.5
T. Boyas de ALBA PETR - - - - - - - - - 155.0 - 155.0 - - - - - - 155.0 - 155.0
Quepos - 2.2 2.2 - - - - - - - 2.2 2.2 - - - - - - - 4.5 4.5
Puntarenas - 0.8 0.8 - - - - - - 1.8 0.1 1.8 - - - - - - 1.8 0.8 2.6
Vacamonte 2.0 - 2.0 - - - - - - - - - - - - 0.5 - 0.5 2.5 - 2.5
Total 2,028.5 261.0 2,289.5 15,516.2 13,027.6 28,543.9 239.6 15.9 255.5 15,684.9 12,446.8 28,131.6 10,695.4 2,065.2 12,760.5 78.0 43.0 121.0 44,242.5 27,859.5 72,101.6
Source: Central American Ports and Panama Maritime Authority
CENTRAL AMERICAN PORTS STATISTICAL SUMMARY, YEAR 2017
CENTRAL AMERICAN COMISSION OF MARITIME TRANSPORT, COCATRAM 26
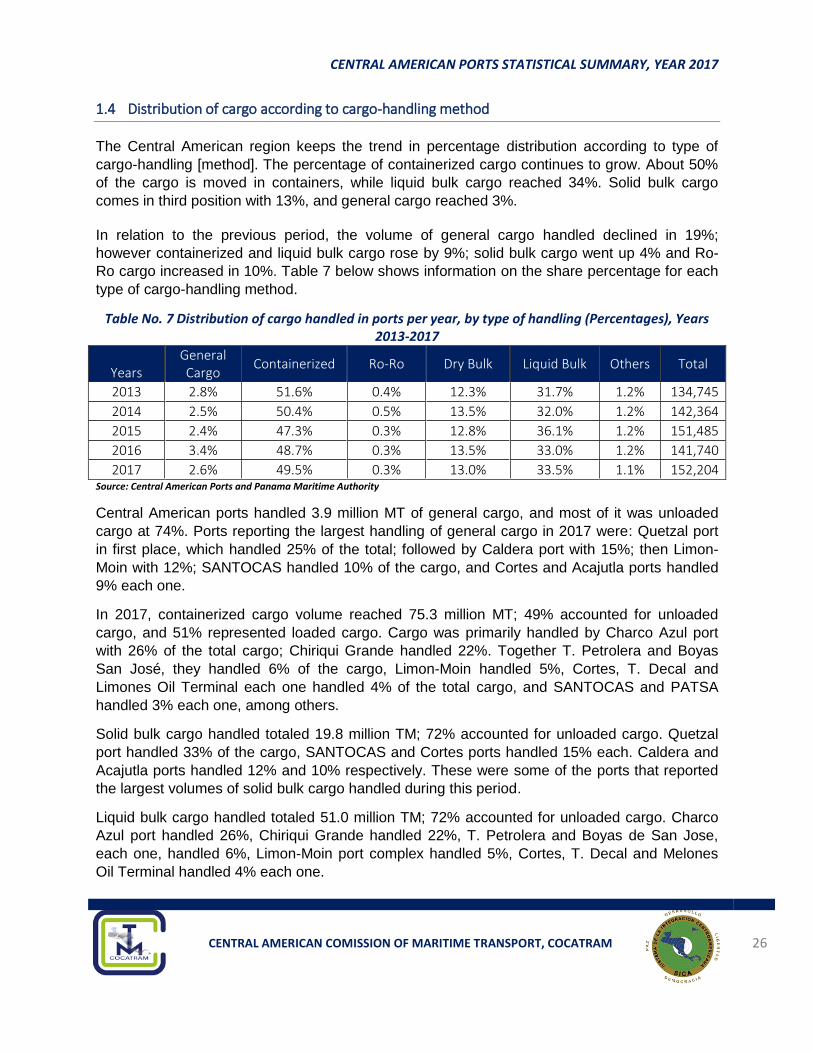
1.4 Distribution of cargo according to cargo-handling method
The Central American region keeps the trend in percentage distribution according to type of
cargo-handling [method]. The percentage of containerized cargo continues to grow. About 50%
of the cargo is moved in containers, while liquid bulk cargo reached 34%. Solid bulk cargo
comes in third position with 13%, and general cargo reached 3%.
In relation to the previous period, the volume of general cargo handled declined in 19%;
however containerized and liquid bulk cargo rose by 9%; solid bulk cargo went up 4% and Ro-
Ro cargo increased in 10%. Table 7 below shows information on the share percentage for each
type of cargo-handling method.
Table No. 7 Distribution of cargo handled in ports per year, by type of handling (Percentages), Years 2013-2017
Years
General Cargo
Containerized Ro-Ro Dry Bulk Liquid Bulk Others Total
2013 2.8% 51.6% 0.4% 12.3% 31.7% 1.2% 134,745
2014 2.5% 50.4% 0.5% 13.5% 32.0% 1.2% 142,364
2015 2.4% 47.3% 0.3% 12.8% 36.1% 1.2% 151,485
2016 3.4% 48.7% 0.3% 13.5% 33.0% 1.2% 141,740
2017 2.6% 49.5% 0.3% 13.0% 33.5% 1.1% 152,204 Source: Central American Ports and Panama Maritime Authority
Central American ports handled 3.9 million MT of general cargo, and most of it was unloaded
cargo at 74%. Ports reporting the largest handling of general cargo in 2017 were: Quetzal port
in first place, which handled 25% of the total; followed by Caldera port with 15%; then Limon-
Moin with 12%; SANTOCAS handled 10% of the cargo, and Cortes and Acajutla ports handled
9% each one.
In 2017, containerized cargo volume reached 75.3 million MT; 49% accounted for unloaded
cargo, and 51% represented loaded cargo. Cargo was primarily handled by Charco Azul port
with 26% of the total cargo; Chiriqui Grande handled 22%. Together T. Petrolera and Boyas
San José, they handled 6% of the cargo, Limon-Moin handled 5%, Cortes, T. Decal and
Limones Oil Terminal each one handled 4% of the total cargo, and SANTOCAS and PATSA
handled 3% each one, among others.
Solid bulk cargo handled totaled 19.8 million TM; 72% accounted for unloaded cargo. Quetzal
port handled 33% of the cargo, SANTOCAS and Cortes ports handled 15% each. Caldera and
Acajutla ports handled 12% and 10% respectively. These were some of the ports that reported
the largest volumes of solid bulk cargo handled during this period.
Liquid bulk cargo handled totaled 51.0 million TM; 72% accounted for unloaded cargo. Charco
Azul port handled 26%, Chiriqui Grande handled 22%, T. Petrolera and Boyas de San Jose,
each one, handled 6%, Limon-Moin port complex handled 5%, Cortes, T. Decal and Melones
Oil Terminal handled 4% each one.
CENTRAL AMERICAN PORTS STATISTICAL SUMMARY, YEAR 2017
CENTRAL AMERICAN COMISSION OF MARITIME TRANSPORT, COCATRAM 27
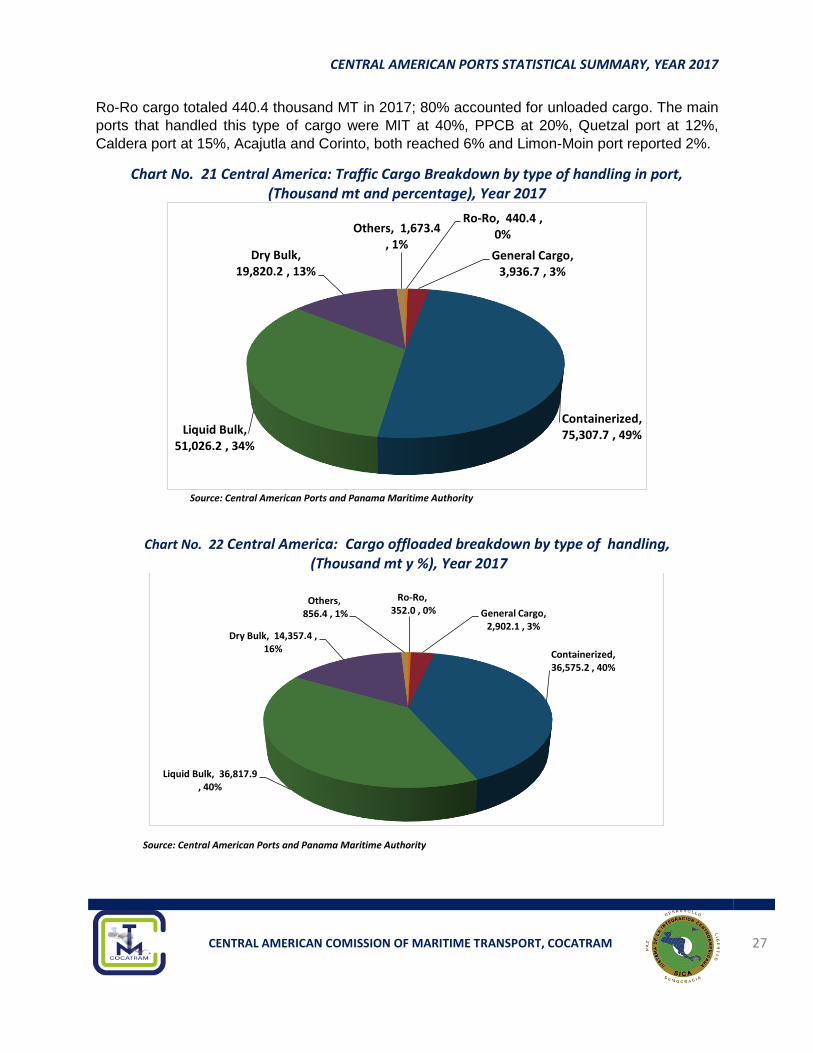
Ro-Ro cargo totaled 440.4 thousand MT in 2017; 80% accounted for unloaded cargo. The main
ports that handled this type of cargo were MIT at 40%, PPCB at 20%, Quetzal port at 12%,
Caldera port at 15%, Acajutla and Corinto, both reached 6% and Limon-Moin port reported 2%.
Chart No. 21 Central America: Traffic Cargo Breakdown by type of handling in port, (Thousand mt and percentage), Year 2017
Source: Central American Ports and Panama Maritime Authority
Chart No. 22 Central America: Cargo offloaded breakdown by type of handling, (Thousand mt y %), Year 2017
Source: Central American Ports and Panama Maritime Authority
Ro-Ro, 440.4 , 0%
General Cargo, 3,936.7 , 3%
Containerized, 75,307.7 , 49%Liquid Bulk,
51,026.2 , 34%
Dry Bulk, 19,820.2 , 13%
Others, 1,673.4 , 1%
Ro-Ro, 352.0 , 0% General Cargo,
2,902.1 , 3%
Containerized, 36,575.2 , 40%
Liquid Bulk, 36,817.9 , 40%
Dry Bulk, 14,357.4 , 16%
Others, 856.4 , 1%
CENTRAL AMERICAN PORTS STATISTICAL SUMMARY, YEAR 2017
CENTRAL AMERICAN COMISSION OF MARITIME TRANSPORT, COCATRAM 28
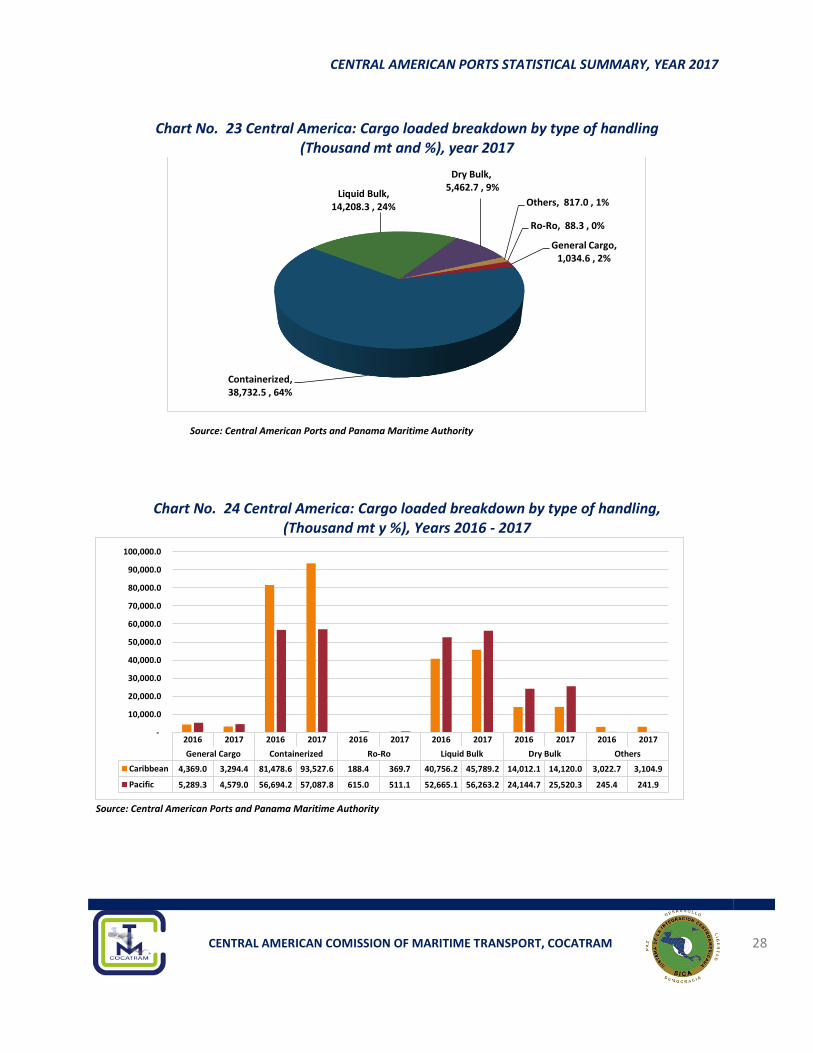
Chart No. 23 Central America: Cargo loaded breakdown by type of handling
(Thousand mt and %), year 2017
Source: Central American Ports and Panama Maritime Authority
Chart No. 24 Central America: Cargo loaded breakdown by type of handling,
(Thousand mt y %), Years 2016 - 2017
Source: Central American Ports and Panama Maritime Authority
Ro-Ro, 88.3 , 0%
General Cargo, 1,034.6 , 2%
Containerized, 38,732.5 , 64%
Liquid Bulk, 14,208.3 , 24%
Dry Bulk, 5,462.7 , 9%
Others, 817.0 , 1%
2016 2017 2016 2017 2016 2017 2016 2017 2016 2017 2016 2017
General Cargo Containerized Ro-Ro Liquid Bulk Dry Bulk Others
Caribbean 4,369.0 3,294.4 81,478.6 93,527.6 188.4 369.7 40,756.2 45,789.2 14,012.1 14,120.0 3,022.7 3,104.9
Pacific 5,289.3 4,579.0 56,694.2 57,087.8 615.0 511.1 52,665.1 56,263.2 24,144.7 25,520.3 245.4 241.9
-
10,000.0
20,000.0
30,000.0
40,000.0
50,000.0
60,000.0
70,000.0
80,000.0
90,000.0
100,000.0
CENTRAL AMERICAN PORTS STATISTICAL SUMMARY, YEAR 2017
CENTRAL AMERICAN COMISSION OF MARITIME TRANSPORT, COCATRAM 29
2 Vessel Calls
Ports in the Central American region reported a total of 17,647 port calls including merchant
vessels and cruise ships; however, it represented a slight drop when compared with the number
of port calls in 2016.
The Central American ports that reported an increase [in port calls] in the region included [those
located in] El Salvador, Honduras and Nicaragua. The latter reported the highest increase at
10% when compared with the previous period, while ports in Guatemala, Costa Rica and
Panama received a lower number of vessels. The largest decrease was reported by
Panamanian ports where the number of port calls dropped at 2%.
Ports with the largest number of port calls in 2017 included MIT, Limón Moín, Cortes, PPCB,
SANTOCAS, PPCC and Quetzal. The first five ports in this list reported a decrease when
compared with 2016. SANTOCAS port reported the most significant decrease, specifically 140
port call less, equivalent to a 9% decrease. Conversely, PPCC and Quetzal reported a 3% and
7% increase respectively. Other ports that showed an increase in the number of vessels arrivals
included CCT at 8%, Acajutla at 9%, Corinto at 10%, Mahogany Bay Cruise Center at 23%, and
Charco Azul at 12%, among others.
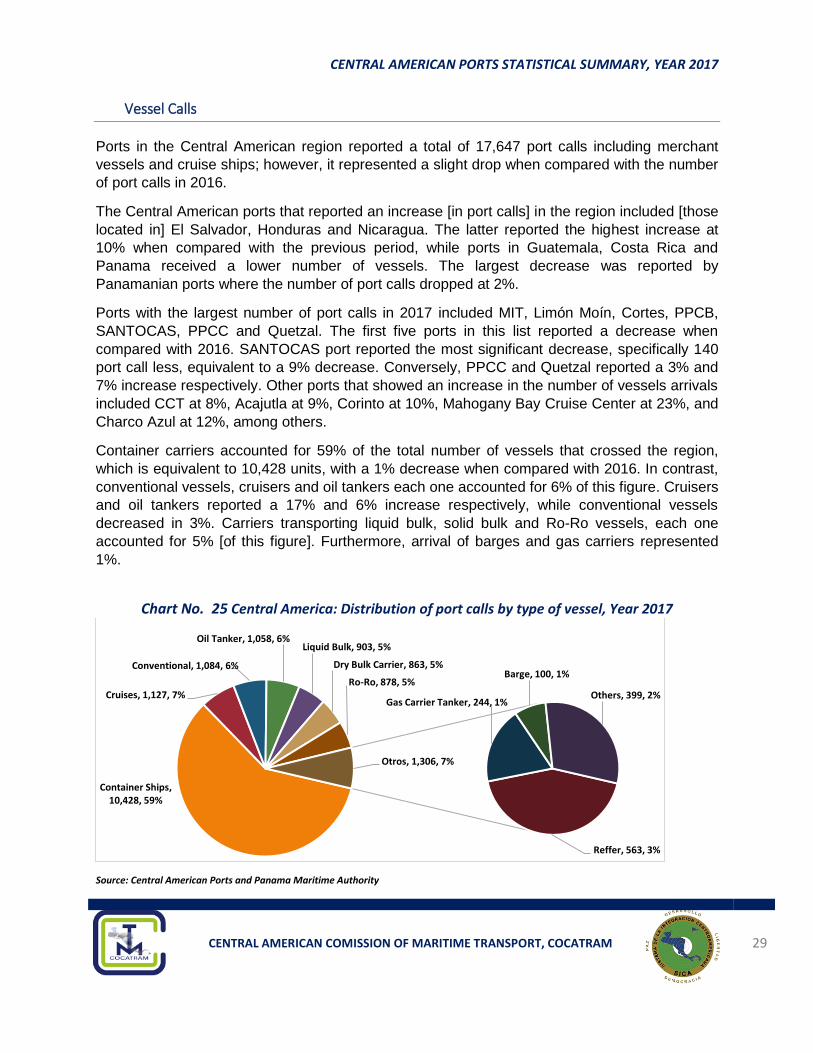
Container carriers accounted for 59% of the total number of vessels that crossed the region,
which is equivalent to 10,428 units, with a 1% decrease when compared with 2016. In contrast,
conventional vessels, cruisers and oil tankers each one accounted for 6% of this figure. Cruisers
and oil tankers reported a 17% and 6% increase respectively, while conventional vessels
decreased in 3%. Carriers transporting liquid bulk, solid bulk and Ro-Ro vessels, each one
accounted for 5% [of this figure]. Furthermore, arrival of barges and gas carriers represented
1%.
Chart No. 25 Central America: Distribution of port calls by type of vessel, Year 2017
Source: Central American Ports and Panama Maritime Authority
Container Ships, 10,428, 59%
Cruises, 1,127, 7%
Conventional, 1,084, 6%
Oil Tanker, 1,058, 6%Liquid Bulk, 903, 5%
Dry Bulk Carrier, 863, 5%
Ro-Ro, 878, 5%
Reffer, 563, 3%
Gas Carrier Tanker, 244, 1%
Barge, 100, 1%
Others, 399, 2%
Otros, 1,306, 7%
CENTRAL AMERICAN PORTS STATISTICAL SUMMARY, YEAR 2017
CENTRAL AMERICAN COMISSION OF MARITIME TRANSPORT, COCATRAM 30
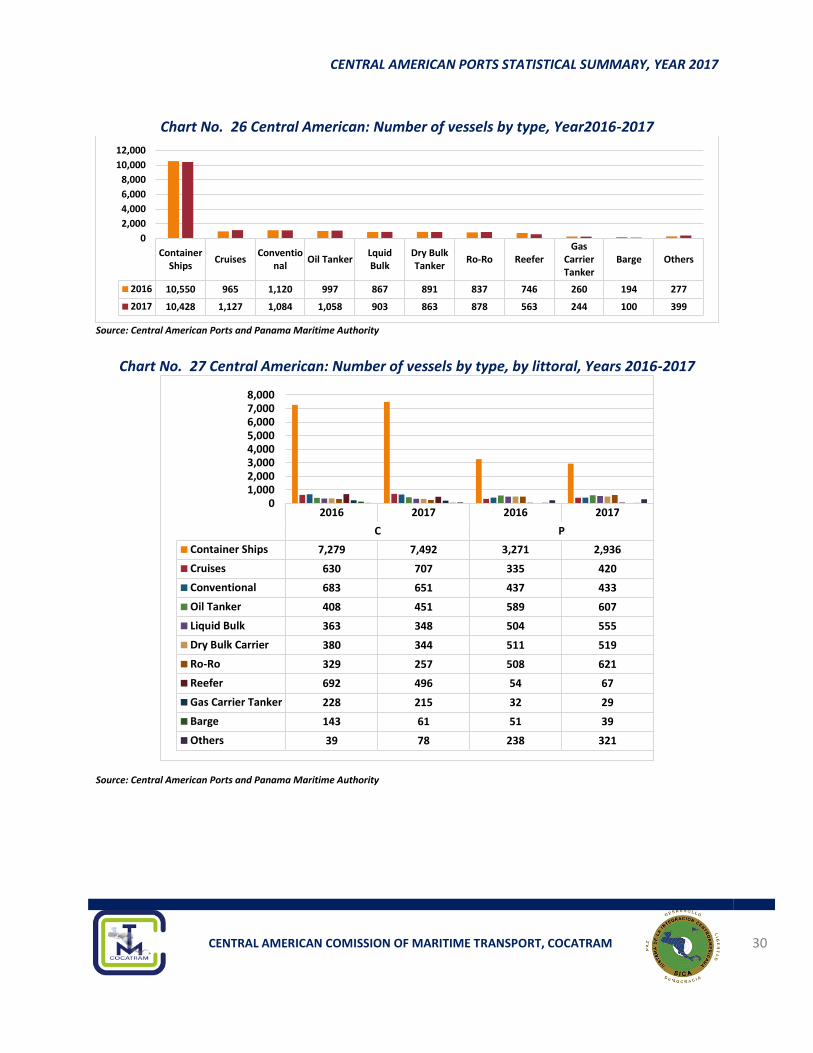
Chart No. 26 Central American: Number of vessels by type, Year2016-2017
Source: Central American Ports and Panama Maritime Authority
Chart No. 27 Central American: Number of vessels by type, by littoral, Years 2016-2017
Source: Central American Ports and Panama Maritime Authority
ContainerShips
CruisesConventio
nalOil Tanker
LquidBulk
Dry BulkTanker
Ro-Ro ReeferGas
CarrierTanker
Barge Others
2016 10,550 965 1,120 997 867 891 837 746 260 194 277
2017 10,428 1,127 1,084 1,058 903 863 878 563 244 100 399
0
2,000
4,000
6,000
8,000
10,000
12,000
2016 2017 2016 2017
C P
Container Ships 7,279 7,492 3,271 2,936
Cruises 630 707 335 420
Conventional 683 651 437 433
Oil Tanker 408 451 589 607
Liquid Bulk 363 348 504 555
Dry Bulk Carrier 380 344 511 519
Ro-Ro 329 257 508 621
Reefer 692 496 54 67
Gas Carrier Tanker 228 215 32 29
Barge 143 61 51 39
Others 39 78 238 321
01,0002,0003,0004,0005,0006,0007,0008,000
CENTRAL AMERICAN PORTS STATISTICAL SUMMARY, YEAR 2017
CENTRAL AMERICAN COMISSION OF MARITIME TRANSPORT, COCATRAM 31
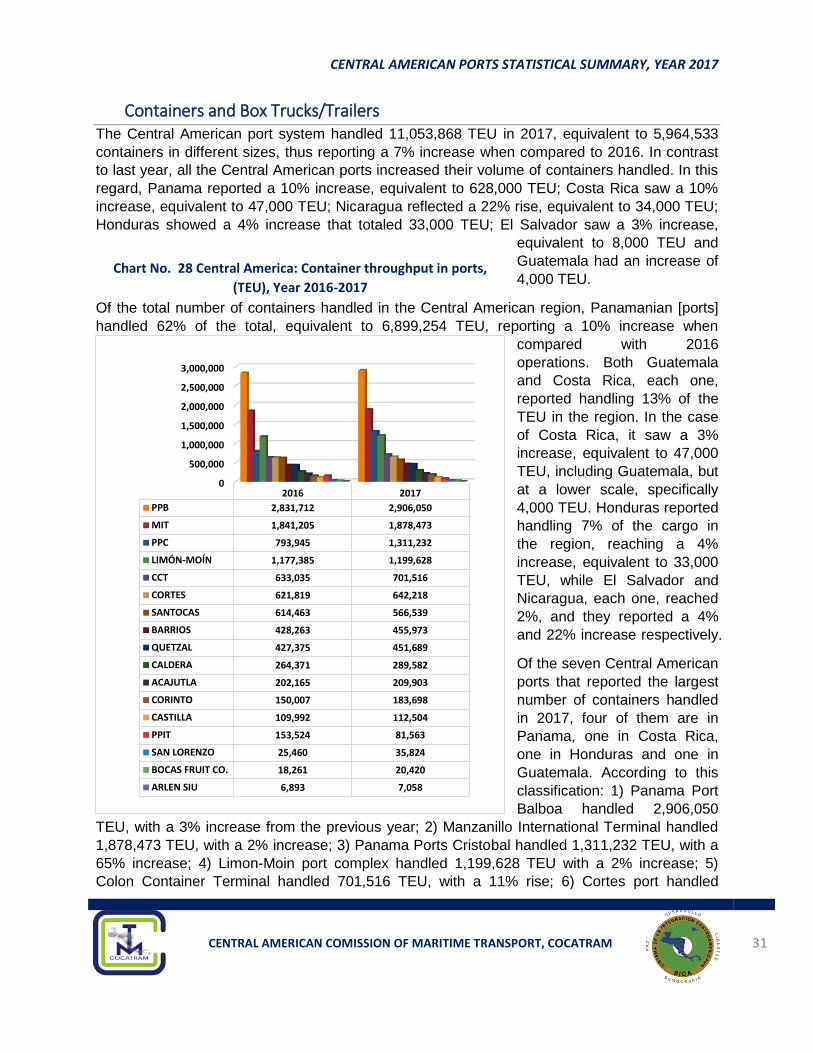
3 Containers and Box Trucks/Trailers The Central American port system handled 11,053,868 TEU in 2017, equivalent to 5,964,533
containers in different sizes, thus reporting a 7% increase when compared to 2016. In contrast
to last year, all the Central American ports increased their volume of containers handled. In this
regard, Panama reported a 10% increase, equivalent to 628,000 TEU; Costa Rica saw a 10%
increase, equivalent to 47,000 TEU; Nicaragua reflected a 22% rise, equivalent to 34,000 TEU;
Honduras showed a 4% increase that totaled 33,000 TEU; El Salvador saw a 3% increase,
equivalent to 8,000 TEU and
Guatemala had an increase of
4,000 TEU.
Of the total number of containers handled in the Central American region, Panamanian [ports]
handled 62% of the total, equivalent to 6,899,254 TEU, reporting a 10% increase when
compared with 2016
operations. Both Guatemala
and Costa Rica, each one,
reported handling 13% of the
TEU in the region. In the case
of Costa Rica, it saw a 3%
increase, equivalent to 47,000
TEU, including Guatemala, but
at a lower scale, specifically
4,000 TEU. Honduras reported
handling 7% of the cargo in
the region, reaching a 4%
increase, equivalent to 33,000
TEU, while El Salvador and
Nicaragua, each one, reached
2%, and they reported a 4%
and 22% increase respectively.
Of the seven Central American
ports that reported the largest
number of containers handled
in 2017, four of them are in
Panama, one in Costa Rica,
one in Honduras and one in
Guatemala. According to this
classification: 1) Panama Port
Balboa handled 2,906,050
TEU, with a 3% increase from the previous year; 2) Manzanillo International Terminal handled
1,878,473 TEU, with a 2% increase; 3) Panama Ports Cristobal handled 1,311,232 TEU, with a
65% increase; 4) Limon-Moin port complex handled 1,199,628 TEU with a 2% increase; 5)
Colon Container Terminal handled 701,516 TEU, with a 11% rise; 6) Cortes port handled
0
500,000
1,000,000
1,500,000
2,000,000
2,500,000
3,000,000
2016 2017
PPB 2,831,712 2,906,050
MIT 1,841,205 1,878,473
PPC 793,945 1,311,232
LIMÓN-MOÍN 1,177,385 1,199,628
CCT 633,035 701,516
CORTES 621,819 642,218
SANTOCAS 614,463 566,539
BARRIOS 428,263 455,973
QUETZAL 427,375 451,689
CALDERA 264,371 289,582
ACAJUTLA 202,165 209,903
CORINTO 150,007 183,698
CASTILLA 109,992 112,504
PPIT 153,524 81,563
SAN LORENZO 25,460 35,824
BOCAS FRUIT CO. 18,261 20,420
ARLEN SIU 6,893 7,058
Chart No. 28 Central America: Container throughput in ports,
(TEU), Year 2016-2017
CENTRAL AMERICAN PORTS STATISTICAL SUMMARY, YEAR 2017
CENTRAL AMERICAN COMISSION OF MARITIME TRANSPORT, COCATRAM 32
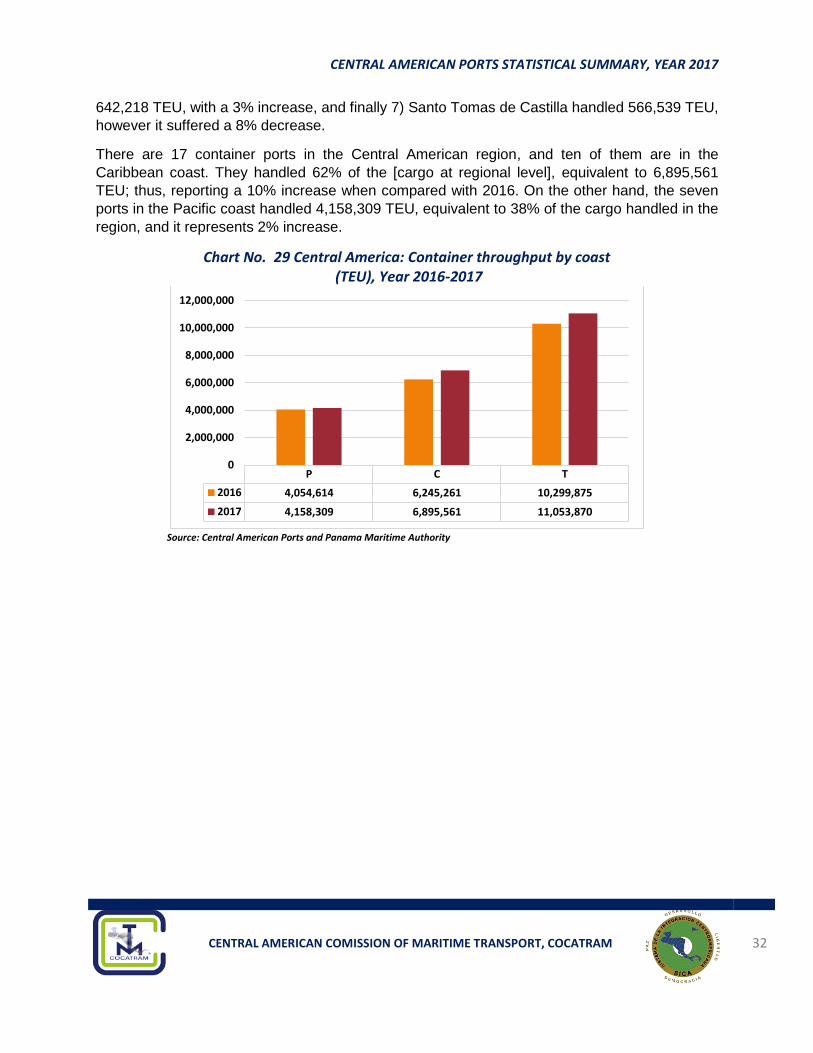
642,218 TEU, with a 3% increase, and finally 7) Santo Tomas de Castilla handled 566,539 TEU,
however it suffered a 8% decrease.
There are 17 container ports in the Central American region, and ten of them are in the
Caribbean coast. They handled 62% of the [cargo at regional level], equivalent to 6,895,561
TEU; thus, reporting a 10% increase when compared with 2016. On the other hand, the seven
ports in the Pacific coast handled 4,158,309 TEU, equivalent to 38% of the cargo handled in the
region, and it represents 2% increase.
Chart No. 29 Central America: Container throughput by coast (TEU), Year 2016-2017
Source: Central American Ports and Panama Maritime Authority
P C T
2016 4,054,614 6,245,261 10,299,875
2017 4,158,309 6,895,561 11,053,870
0
2,000,000
4,000,000
6,000,000
8,000,000
10,000,000
12,000,000
CENTRAL AMERICAN PORTS STATISTICAL SUMMARY, YEAR 2017
CENTRAL AMERICAN COMISSION OF MARITIME TRANSPORT, COCATRAM 33
ANNEXS
CENTRAL AMERICAN PORTS STATISTICAL SUMMARY, YEAR 2017
CENTRAL AMERICAN COMISSION OF MARITIME TRANSPORT, COCATRAM 34
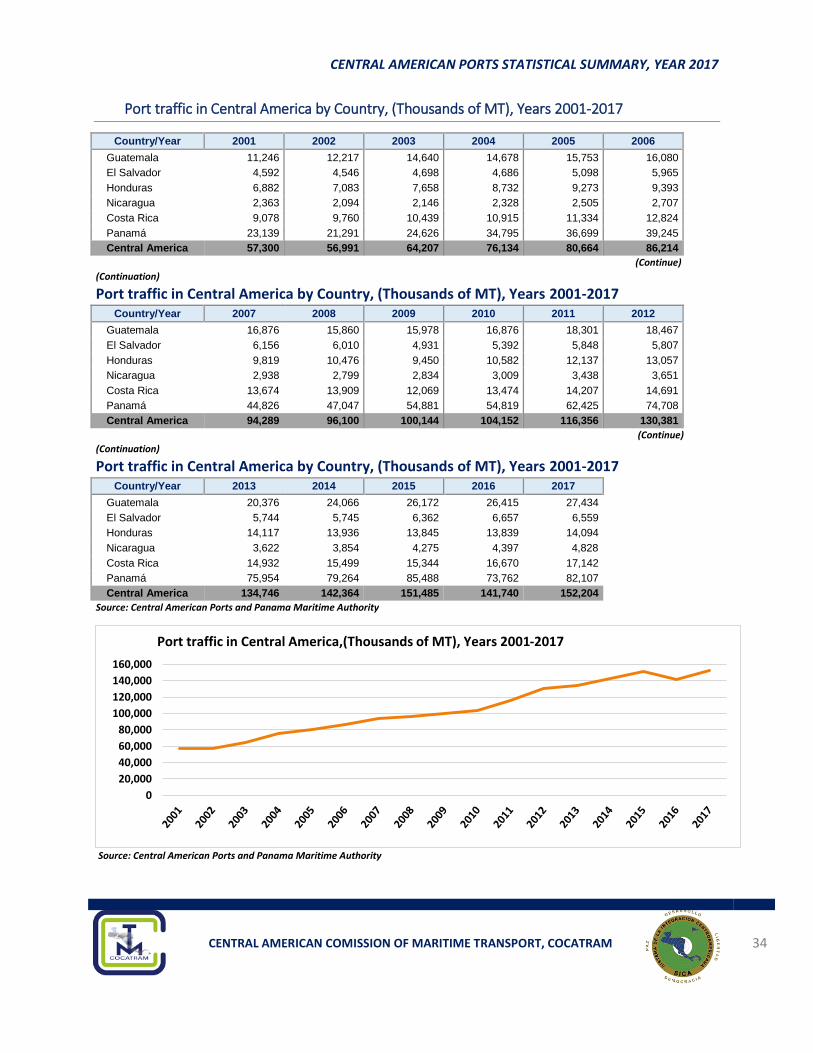
4 Port traffic in Central America by Country, (Thousands of MT), Years 2001-2017
Country/Year 2001 2002 2003 2004 2005 2006
Guatemala 11,246 12,217 14,640 14,678 15,753 16,080
El Salvador 4,592 4,546 4,698 4,686 5,098 5,965
Honduras 6,882 7,083 7,658 8,732 9,273 9,393
Nicaragua 2,363 2,094 2,146 2,328 2,505 2,707
Costa Rica 9,078 9,760 10,439 10,915 11,334 12,824
Panamá 23,139 21,291 24,626 34,795 36,699 39,245
Central America 57,300 56,991 64,207 76,134 80,664 86,214
(Continue)
(Continuation)
Port traffic in Central America by Country, (Thousands of MT), Years 2001-2017 Country/Year 2007 2008 2009 2010 2011 2012
Guatemala 16,876 15,860 15,978 16,876 18,301 18,467
El Salvador 6,156 6,010 4,931 5,392 5,848 5,807
Honduras 9,819 10,476 9,450 10,582 12,137 13,057
Nicaragua 2,938 2,799 2,834 3,009 3,438 3,651
Costa Rica 13,674 13,909 12,069 13,474 14,207 14,691
Panamá 44,826 47,047 54,881 54,819 62,425 74,708
Central America 94,289 96,100 100,144 104,152 116,356 130,381
(Continue)
(Continuation)
Port traffic in Central America by Country, (Thousands of MT), Years 2001-2017 Country/Year 2013 2014 2015 2016 2017
Guatemala 20,376 24,066 26,172 26,415 27,434
El Salvador 5,744 5,745 6,362 6,657 6,559
Honduras 14,117 13,936 13,845 13,839 14,094
Nicaragua 3,622 3,854 4,275 4,397 4,828
Costa Rica 14,932 15,499 15,344 16,670 17,142
Panamá 75,954 79,264 85,488 73,762 82,107
Central America 134,746 142,364 151,485 141,740 152,204
Source: Central American Ports and Panama Maritime Authority
Source: Central American Ports and Panama Maritime Authority
0
20,000
40,000
60,000
80,000
100,000
120,000
140,000
160,000
Port traffic in Central America,(Thousands of MT), Years 2001-2017
CENTRAL AMERICAN PORTS STATISTICAL SUMMARY, YEAR 2017
CENTRAL AMERICAN COMISSION OF MARITIME TRANSPORT, COCATRAM 35
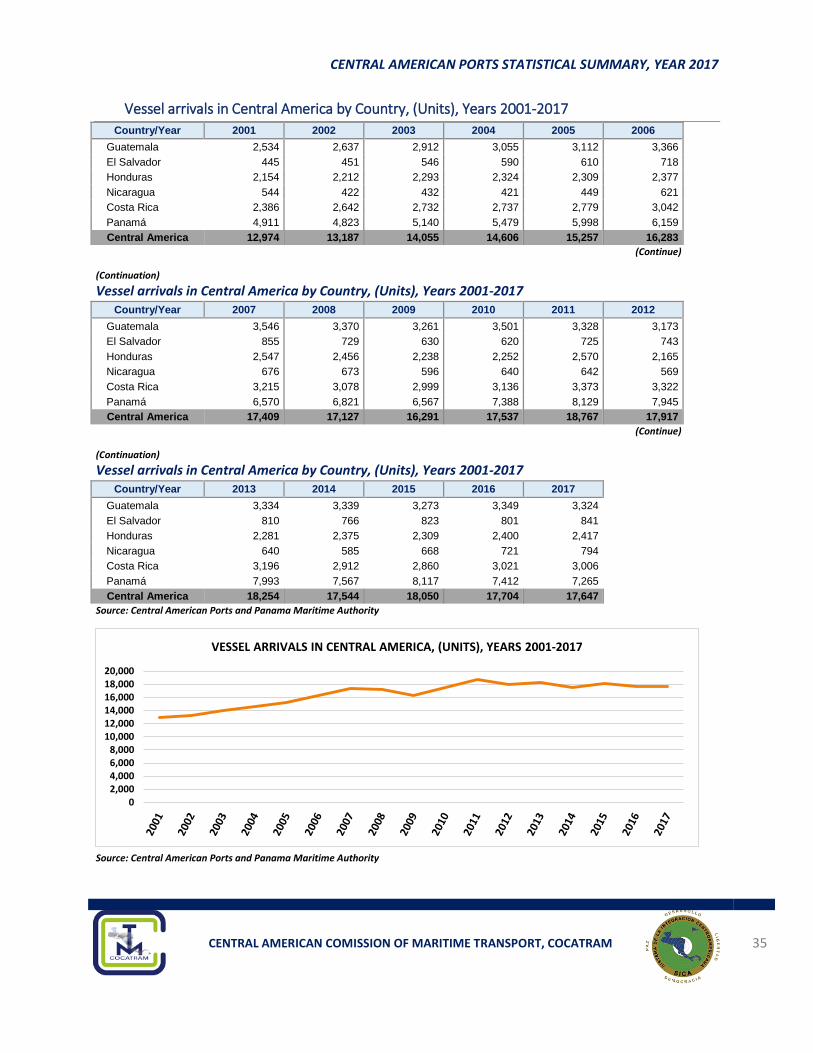
5 Vessel arrivals in Central America by Country, (Units), Years 2001-2017
Country/Year 2001 2002 2003 2004 2005 2006
Guatemala 2,534 2,637 2,912 3,055 3,112 3,366
El Salvador 445 451 546 590 610 718
Honduras 2,154 2,212 2,293 2,324 2,309 2,377
Nicaragua 544 422 432 421 449 621
Costa Rica 2,386 2,642 2,732 2,737 2,779 3,042
Panamá 4,911 4,823 5,140 5,479 5,998 6,159
Central America 12,974 13,187 14,055 14,606 15,257 16,283
(Continue)
(Continuation) Vessel arrivals in Central America by Country, (Units), Years 2001-2017
Country/Year 2007 2008 2009 2010 2011 2012
Guatemala 3,546 3,370 3,261 3,501 3,328 3,173
El Salvador 855 729 630 620 725 743
Honduras 2,547 2,456 2,238 2,252 2,570 2,165
Nicaragua 676 673 596 640 642 569
Costa Rica 3,215 3,078 2,999 3,136 3,373 3,322
Panamá 6,570 6,821 6,567 7,388 8,129 7,945
Central America 17,409 17,127 16,291 17,537 18,767 17,917
(Continue)
(Continuation) Vessel arrivals in Central America by Country, (Units), Years 2001-2017
Country/Year 2013 2014 2015 2016 2017
Guatemala 3,334 3,339 3,273 3,349 3,324
El Salvador 810 766 823 801 841
Honduras 2,281 2,375 2,309 2,400 2,417
Nicaragua 640 585 668 721 794
Costa Rica 3,196 2,912 2,860 3,021 3,006
Panamá 7,993 7,567 8,117 7,412 7,265
Central America 18,254 17,544 18,050 17,704 17,647
Source: Central American Ports and Panama Maritime Authority
Source: Central American Ports and Panama Maritime Authority
02,0004,0006,0008,000
10,00012,00014,00016,00018,00020,000
VESSEL ARRIVALS IN CENTRAL AMERICA, (UNITS), YEARS 2001-2017
CENTRAL AMERICAN PORTS STATISTICAL SUMMARY, YEAR 2017
CENTRAL AMERICAN COMISSION OF MARITIME TRANSPORT, COCATRAM 36
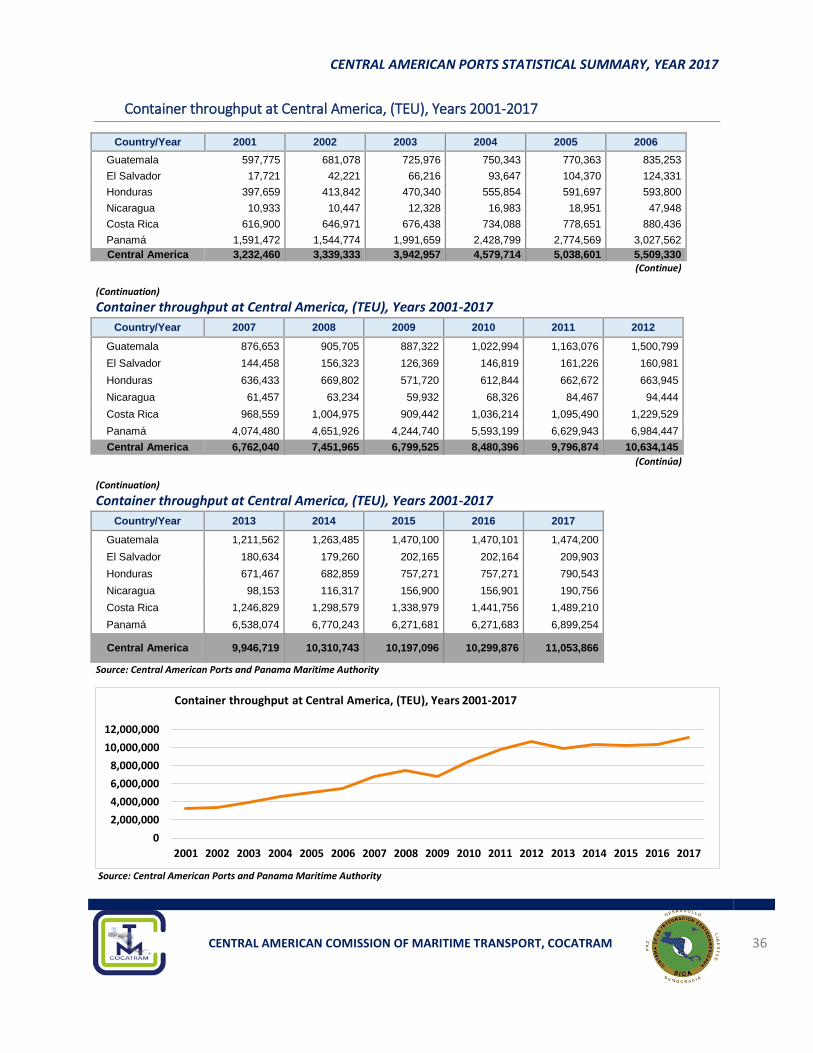
6 Container throughput at Central America, (TEU), Years 2001-2017
Country/Year 2001 2002 2003 2004 2005 2006
Guatemala 597,775 681,078 725,976 750,343 770,363 835,253
El Salvador 17,721 42,221 66,216 93,647 104,370 124,331
Honduras 397,659 413,842 470,340 555,854 591,697 593,800
Nicaragua 10,933 10,447 12,328 16,983 18,951 47,948
Costa Rica 616,900 646,971 676,438 734,088 778,651 880,436
Panamá 1,591,472 1,544,774 1,991,659 2,428,799 2,774,569 3,027,562
Central America 3,232,460 3,339,333 3,942,957 4,579,714 5,038,601 5,509,330
(Continue)
(Continuation) Container throughput at Central America, (TEU), Years 2001-2017
Country/Year 2007 2008 2009 2010 2011 2012
Guatemala 876,653 905,705 887,322 1,022,994 1,163,076 1,500,799
El Salvador 144,458 156,323 126,369 146,819 161,226 160,981
Honduras 636,433 669,802 571,720 612,844 662,672 663,945
Nicaragua 61,457 63,234 59,932 68,326 84,467 94,444
Costa Rica 968,559 1,004,975 909,442 1,036,214 1,095,490 1,229,529
Panamá 4,074,480 4,651,926 4,244,740 5,593,199 6,629,943 6,984,447
Central America 6,762,040 7,451,965 6,799,525 8,480,396 9,796,874 10,634,145
(Continúa)
(Continuation) Container throughput at Central America, (TEU), Years 2001-2017
Country/Year 2013 2014 2015 2016 2017
Guatemala 1,211,562 1,263,485 1,470,100 1,470,101 1,474,200
El Salvador 180,634 179,260 202,165 202,164 209,903
Honduras 671,467 682,859 757,271 757,271 790,543
Nicaragua 98,153 116,317 156,900 156,901 190,756
Costa Rica 1,246,829 1,298,579 1,338,979 1,441,756 1,489,210
Panamá 6,538,074 6,770,243 6,271,681 6,271,683 6,899,254
Central America 9,946,719 10,310,743 10,197,096 10,299,876 11,053,866
Source: Central American Ports and Panama Maritime Authority
Source: Central American Ports and Panama Maritime Authority
0
2,000,000
4,000,000
6,000,000
8,000,000
10,000,000
12,000,000
2001 2002 2003 2004 2005 2006 2007 2008 2009 2010 2011 2012 2013 2014 2015 2016 2017
Container throughput at Central America, (TEU), Years 2001-2017
CENTRAL AMERICAN PORTS STATISTICAL SUMMARY, YEAR 2017
CENTRAL AMERICAN COMISSION OF MARITIME TRANSPORT, COCATRAM 37
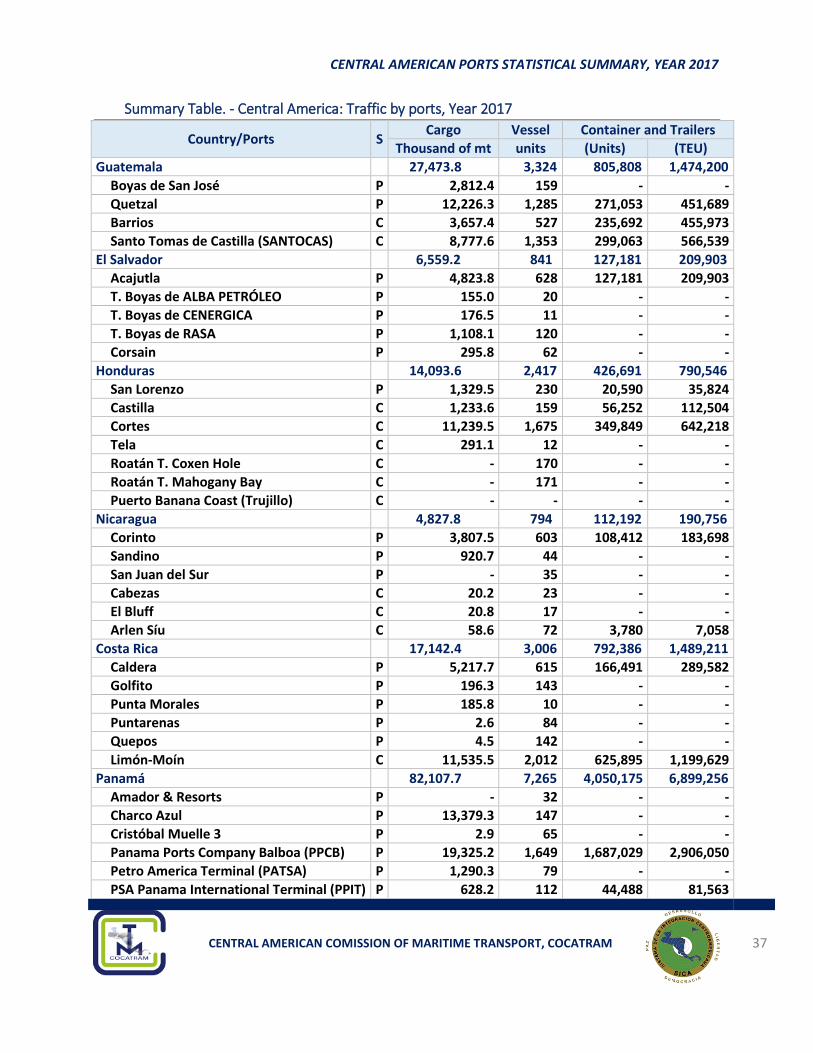
7 Summary Table. - Central America: Traffic by ports, Year 2017
Country/Ports S Cargo Vessel Container and Trailers
Thousand of mt units (Units) (TEU)
Guatemala 27,473.8 3,324 805,808 1,474,200
Boyas de San José P 2,812.4 159 - -
Quetzal P 12,226.3 1,285 271,053 451,689
Barrios C 3,657.4 527 235,692 455,973
Santo Tomas de Castilla (SANTOCAS) C 8,777.6 1,353 299,063 566,539
El Salvador 6,559.2 841 127,181 209,903
Acajutla P 4,823.8 628 127,181 209,903
T. Boyas de ALBA PETRÓLEO P 155.0 20 - -
T. Boyas de CENERGICA P 176.5 11 - -
T. Boyas de RASA P 1,108.1 120 - -
Corsain P 295.8 62 - -
Honduras 14,093.6 2,417 426,691 790,546
San Lorenzo P 1,329.5 230 20,590 35,824
Castilla C 1,233.6 159 56,252 112,504
Cortes C 11,239.5 1,675 349,849 642,218
Tela C 291.1 12 - -
Roatán T. Coxen Hole C - 170 - -
Roatán T. Mahogany Bay C - 171 - -
Puerto Banana Coast (Trujillo) C - - - -
Nicaragua 4,827.8 794 112,192 190,756
Corinto P 3,807.5 603 108,412 183,698
Sandino P 920.7 44 - -
San Juan del Sur P - 35 - -
Cabezas C 20.2 23 - -
El Bluff C 20.8 17 - -
Arlen Síu C 58.6 72 3,780 7,058
Costa Rica 17,142.4 3,006 792,386 1,489,211
Caldera P 5,217.7 615 166,491 289,582
Golfito P 196.3 143 - -
Punta Morales P 185.8 10 - -
Puntarenas P 2.6 84 - -
Quepos P 4.5 142 - -
Limón-Moín C 11,535.5 2,012 625,895 1,199,629
Panamá 82,107.7 7,265 4,050,175 6,899,256
Amador & Resorts P - 32 - -
Charco Azul P 13,379.3 147 - -
Cristóbal Muelle 3 P 2.9 65 - -
Panama Ports Company Balboa (PPCB) P 19,325.2 1,649 1,687,029 2,906,050
Petro America Terminal (PATSA) P 1,290.3 79 - -
PSA Panama International Terminal (PPIT) P 628.2 112 44,488 81,563
CENTRAL AMERICAN PORTS STATISTICAL SUMMARY, YEAR 2017
CENTRAL AMERICAN COMISSION OF MARITIME TRANSPORT, COCATRAM 38
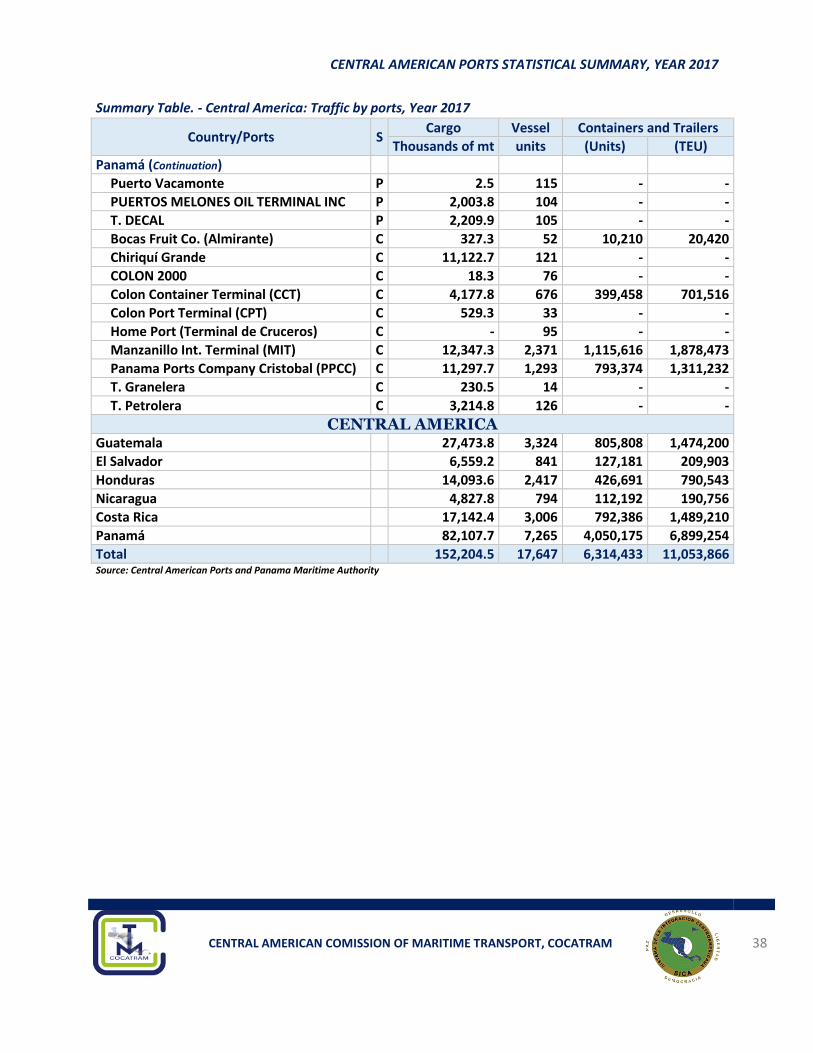
Summary Table. - Central America: Traffic by ports, Year 2017
Country/Ports S Cargo Vessel Containers and Trailers
Thousands of mt units (Units) (TEU)
Panamá (Continuation)
Puerto Vacamonte P 2.5 115 - -
PUERTOS MELONES OIL TERMINAL INC P 2,003.8 104 - -
T. DECAL P 2,209.9 105 - -
Bocas Fruit Co. (Almirante) C 327.3 52 10,210 20,420
Chiriquí Grande C 11,122.7 121 - -
COLON 2000 C 18.3 76 - -
Colon Container Terminal (CCT) C 4,177.8 676 399,458 701,516
Colon Port Terminal (CPT) C 529.3 33 - -
Home Port (Terminal de Cruceros) C - 95 - -
Manzanillo Int. Terminal (MIT) C 12,347.3 2,371 1,115,616 1,878,473
Panama Ports Company Cristobal (PPCC) C 11,297.7 1,293 793,374 1,311,232
T. Granelera C 230.5 14 - -
T. Petrolera C 3,214.8 126 - -
CENTRAL AMERICA Guatemala 27,473.8 3,324 805,808 1,474,200
El Salvador 6,559.2 841 127,181 209,903
Honduras 14,093.6 2,417 426,691 790,543
Nicaragua 4,827.8 794 112,192 190,756
Costa Rica 17,142.4 3,006 792,386 1,489,210
Panamá 82,107.7 7,265 4,050,175 6,899,254
Total 152,204.5 17,647 6,314,433 11,053,866 Source: Central American Ports and Panama Maritime Authority
CENTRAL AMERICAN PORTS STATISTICAL SUMMARY, YEAR 2017
CENTRAL AMERICAN COMISSION OF MARITIME TRANSPORT, COCATRAM 39
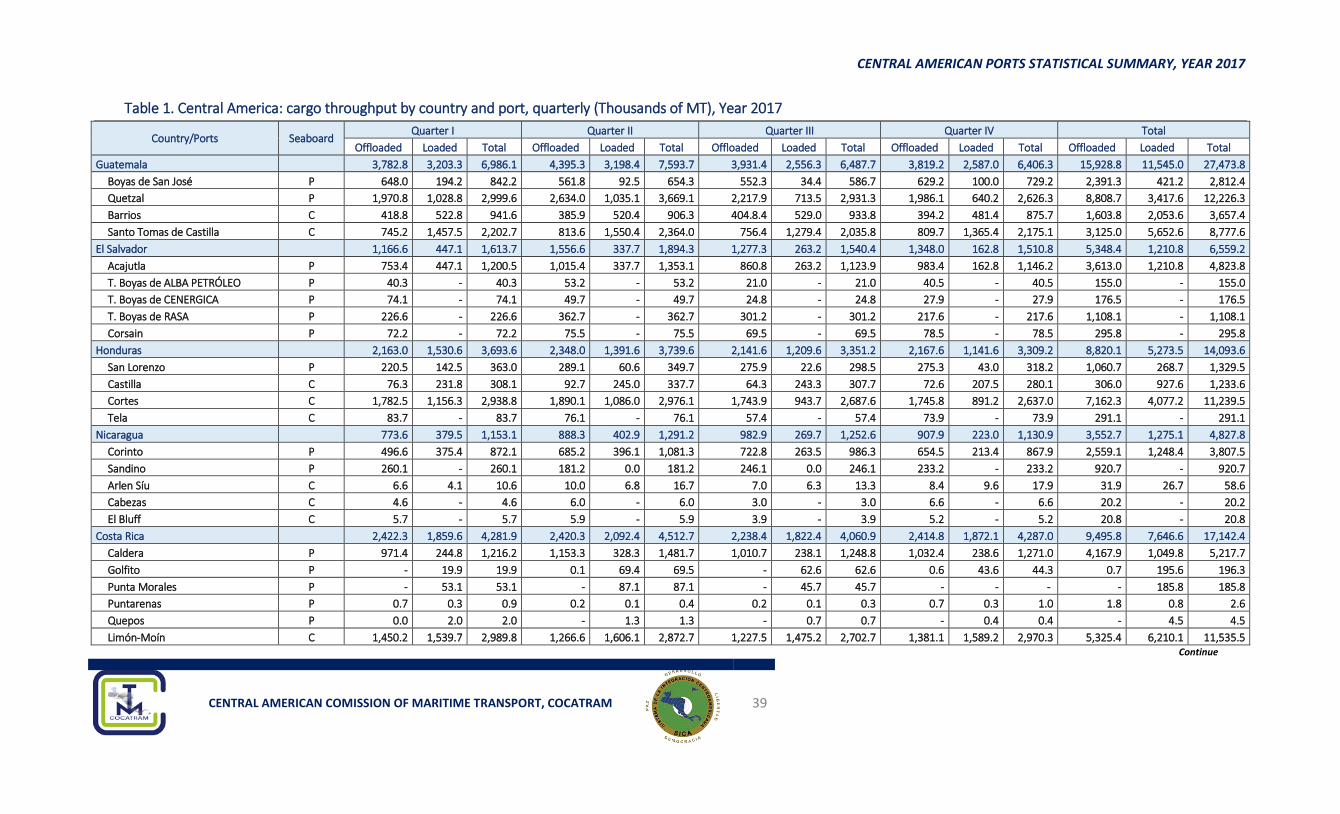
8 Table 1. Central America: cargo throughput by country and port, quarterly (Thousands of MT), Year 2017
Country/Ports Seaboard Quarter I Quarter II Quarter III Quarter IV Total
Offloaded Loaded Total Offloaded Loaded Total Offloaded Loaded Total Offloaded Loaded Total Offloaded Loaded Total
Guatemala 3,782.8 3,203.3 6,986.1 4,395.3 3,198.4 7,593.7 3,931.4 2,556.3 6,487.7 3,819.2 2,587.0 6,406.3 15,928.8 11,545.0 27,473.8
Boyas de San José P 648.0 194.2 842.2 561.8 92.5 654.3 552.3 34.4 586.7 629.2 100.0 729.2 2,391.3 421.2 2,812.4
Quetzal P 1,970.8 1,028.8 2,999.6 2,634.0 1,035.1 3,669.1 2,217.9 713.5 2,931.3 1,986.1 640.2 2,626.3 8,808.7 3,417.6 12,226.3
Barrios C 418.8 522.8 941.6 385.9 520.4 906.3 404.8.4 529.0 933.8 394.2 481.4 875.7 1,603.8 2,053.6 3,657.4
Santo Tomas de Castilla C 745.2 1,457.5 2,202.7 813.6 1,550.4 2,364.0 756.4 1,279.4 2,035.8 809.7 1,365.4 2,175.1 3,125.0 5,652.6 8,777.6
El Salvador 1,166.6 447.1 1,613.7 1,556.6 337.7 1,894.3 1,277.3 263.2 1,540.4 1,348.0 162.8 1,510.8 5,348.4 1,210.8 6,559.2
Acajutla P 753.4 447.1 1,200.5 1,015.4 337.7 1,353.1 860.8 263.2 1,123.9 983.4 162.8 1,146.2 3,613.0 1,210.8 4,823.8
T. Boyas de ALBA PETRÓLEO P 40.3 - 40.3 53.2 - 53.2 21.0 - 21.0 40.5 - 40.5 155.0 - 155.0
T. Boyas de CENERGICA P 74.1 - 74.1 49.7 - 49.7 24.8 - 24.8 27.9 - 27.9 176.5 - 176.5
T. Boyas de RASA P 226.6 - 226.6 362.7 - 362.7 301.2 - 301.2 217.6 - 217.6 1,108.1 - 1,108.1
Corsain P 72.2 - 72.2 75.5 - 75.5 69.5 - 69.5 78.5 - 78.5 295.8 - 295.8
Honduras 2,163.0 1,530.6 3,693.6 2,348.0 1,391.6 3,739.6 2,141.6 1,209.6 3,351.2 2,167.6 1,141.6 3,309.2 8,820.1 5,273.5 14,093.6
San Lorenzo P 220.5 142.5 363.0 289.1 60.6 349.7 275.9 22.6 298.5 275.3 43.0 318.2 1,060.7 268.7 1,329.5
Castilla C 76.3 231.8 308.1 92.7 245.0 337.7 64.3 243.3 307.7 72.6 207.5 280.1 306.0 927.6 1,233.6
Cortes C 1,782.5 1,156.3 2,938.8 1,890.1 1,086.0 2,976.1 1,743.9 943.7 2,687.6 1,745.8 891.2 2,637.0 7,162.3 4,077.2 11,239.5
Tela C 83.7 - 83.7 76.1 - 76.1 57.4 - 57.4 73.9 - 73.9 291.1 - 291.1
Nicaragua 773.6 379.5 1,153.1 888.3 402.9 1,291.2 982.9 269.7 1,252.6 907.9 223.0 1,130.9 3,552.7 1,275.1 4,827.8
Corinto P 496.6 375.4 872.1 685.2 396.1 1,081.3 722.8 263.5 986.3 654.5 213.4 867.9 2,559.1 1,248.4 3,807.5
Sandino P 260.1 - 260.1 181.2 0.0 181.2 246.1 0.0 246.1 233.2 - 233.2 920.7 - 920.7
Arlen Síu C 6.6 4.1 10.6 10.0 6.8 16.7 7.0 6.3 13.3 8.4 9.6 17.9 31.9 26.7 58.6
Cabezas C 4.6 - 4.6 6.0 - 6.0 3.0 - 3.0 6.6 - 6.6 20.2 - 20.2
El Bluff C 5.7 - 5.7 5.9 - 5.9 3.9 - 3.9 5.2 - 5.2 20.8 - 20.8
Costa Rica 2,422.3 1,859.6 4,281.9 2,420.3 2,092.4 4,512.7 2,238.4 1,822.4 4,060.9 2,414.8 1,872.1 4,287.0 9,495.8 7,646.6 17,142.4
Caldera P 971.4 244.8 1,216.2 1,153.3 328.3 1,481.7 1,010.7 238.1 1,248.8 1,032.4 238.6 1,271.0 4,167.9 1,049.8 5,217.7
Golfito P - 19.9 19.9 0.1 69.4 69.5 - 62.6 62.6 0.6 43.6 44.3 0.7 195.6 196.3
Punta Morales P - 53.1 53.1 - 87.1 87.1 - 45.7 45.7 - - - - 185.8 185.8
Puntarenas P 0.7 0.3 0.9 0.2 0.1 0.4 0.2 0.1 0.3 0.7 0.3 1.0 1.8 0.8 2.6
Quepos P 0.0 2.0 2.0 - 1.3 1.3 - 0.7 0.7 - 0.4 0.4 - 4.5 4.5
Limón-Moín C 1,450.2 1,539.7 2,989.8 1,266.6 1,606.1 2,872.7 1,227.5 1,475.2 2,702.7 1,381.1 1,589.2 2,970.3 5,325.4 6,210.1 11,535.5 Continue

CENTRAL AMERICAN PORTS STATISTICAL SUMMARY, YEAR 2017
CENTRAL AMERICAN COMISSION OF MARITIME TRANSPORT, COCATRAM 40
Table 1. Central America: cargo throughput by country and port, quarterly (Thousands of MT), Year 2017
Source: Central American Ports and Panama Maritime Authority
Country/Ports Seaboard Quarter I Quarter II Quarter III Quarter IV Total
Offloaded Loaded Total Offloaded Loaded Total Offloaded Loaded Total Offloaded Loaded Total Offloaded Loaded Total
Panamá 10,946.6 8,216.7 19,163.3 12,019.9 8,148.2 20,168.0 14,135.7 8,011.6 22,147.2 11,613.1 9,016.1 20,629.2 48,715.2 33,392.6 82,107.7
Charco Azul P 50.8 2,822.6 2,873.4 231.9 2,248.1 2,480.0 1,708.4 2,118.1 3,826.5 788.0 3,411.4 4,199.4 2,779.2 10,600.2 13,379.3
Cristóbal Muelle 3 P - 0.2 0.2 - 1.0 1.0 - 0.9 0.9 - 0.9 0.9 - 2.9 2.9
Panama Ports Company Balboa P 2,623.7 1,963.5 4,587.2 2,889.2 2,310.5 5,199.7 2,674.0 2,170.9 4,844.9 2,578.8 2,114.6 4,693.4 10,765.7 8,559.5 19,325.2
Petro America Terminal P 354.3 - 354.3 375.5 - 375.5 400.5 - 400.5 159.8 - 159.8 1,290.3 - 1,290.3
PSA Panama International Terminal P 115.3 70.9 186.2 95.3 71.7 167.0 72.2 85.0 157.2 41.5 76.4 117.9 324.1 304.1 628.2
Puerto Vacamonte P 0.8 - 0.8 0.6 - 0.6 0.4 - 0.4 0.8 - 0.8 2.5 - 2.5
MELONES OIL TERMINAL INC P 320.9 40.4 361.2 514.5 100.8 615.3 320.7 161.4 482.2 455.0 90.1 545.1 1,611.1 392.7 2,003.8
T. DECAL P 658.5 - 658.5 583.0 - 583.0 498.0 - 498.0 470.4 - 470.4 2,209.9 - 2,209.9
Bocas Fruit Co. C 15.2 47.3 62.5 20.1 78.4 98.5 14.8 59.5 74.4 21.8 70.2 92.0 71.8 255.5 327.3
Chiriquí Grande C 2,410.5 78.7 2,489.2 2,655.8 97.1 2,752.9 3,642.4 6.0 3,648.4 2,232.2 0.0 2,232.2 10,940.9 181.8 11,122.7
COLON 2000 C 4.7 - 4.7 5.5 - 5.5 2.4 - 2.4 5.6 0.1 5.6 18.2 0.1 18.3
Colon Conteiner Terminal C 521.7 412.0 933.7 602.9 351.5 954.4 717.8 453.8 1,171.5 673.9 444.1 1,118.1 2,516.3 1,661.5 4,177.8
Colon Port Terminal C 133.9 - 133.9 168.7 - 168.7 90.7 - 90.7 136.0 - 136.0 529.3 - 529.3
Manzanillo Int. Terminal C 1,494.3 1,644.4 3,138.7 1,434.9 1,571.8 3,006.7 1,462.1 1,542.2 3,004.3 1,626.7 1,570.9 3,197.6 6,018.0 6,329.3 12,347.3
Panama Ports Company Cristobal C 1,417.7 1,136.7 2,554.4 1,581.5 1,317.2 2,898.8 1,632.4 1,413.6 3,046.1 1,561.0 1,237.5 2,798.5 6,192.7 5,105.1 11,297.7
T. Granelera C 57.1 - 57.1 44.7 - 44.7 105.9 - 105.9 22.8 - 22.8 230.5 - 230.5
T. Petrolera C 767.4 - 767.4 815.6 - 815.6 793.0 - 793.0 838.8 - 838.8 3,214.8 - 3,214.8
CENTRAL AMERICA
Guatemala 3,782.8 3,203.3 6,986.1 4,395.3 3,198.4 7,593.7 3,931.4 2,556.3 6,487.7 3,819.2 2,587.0 6,406.3 15,928.8 11,545.0 27,473.8
El Salvador 1,166.6 447.1 1,613.7 1,556.6 337.7 1,894.3 1,277.3 263.2 1,540.4 1,348.0 162.8 1,510.8 5,348.4 1,210.8 6,559.2
Honduras 2,163.0 1,530.6 3,693.6 2,348.0 1,391.6 3,739.6 2,141.6 1,209.6 3,351.2 2,167.6 1,141.6 3,309.2 8,820.1 5,273.5 14,093.6
Nicaragua 773.6 379.5 1,153.1 888.3 402.9 1,291.2 982.9 269.7 1,252.6 907.9 223.0 1,130.9 3,552.7 1,275.1 4,827.8
Costa Rica 2,422.3 1,859.6 4,281.9 2,420.3 2,092.4 4,512.7 2,238.4 1,822.4 4,060.9 2,414.8 1,872.1 4,287.0 9,495.8 7,646.6 17,142.4
Panama 10,946.6 8,216.7 19,163.3 12,019.9 8,148.2 20,168.0 14,135.7 8,011.6 22,147.2 11,613.1 9,016.1 20,629.2 48,715.2 33,392.6 82,107.7
Total 21,254.9 15,636.8 36,891.7 23,628.3 15,571.1 39,199.4 24,707.2 14,132.9 38,840.1 22,270.6 15,002.7 37,273.4 91,861.0 60,343.5 152,204.5
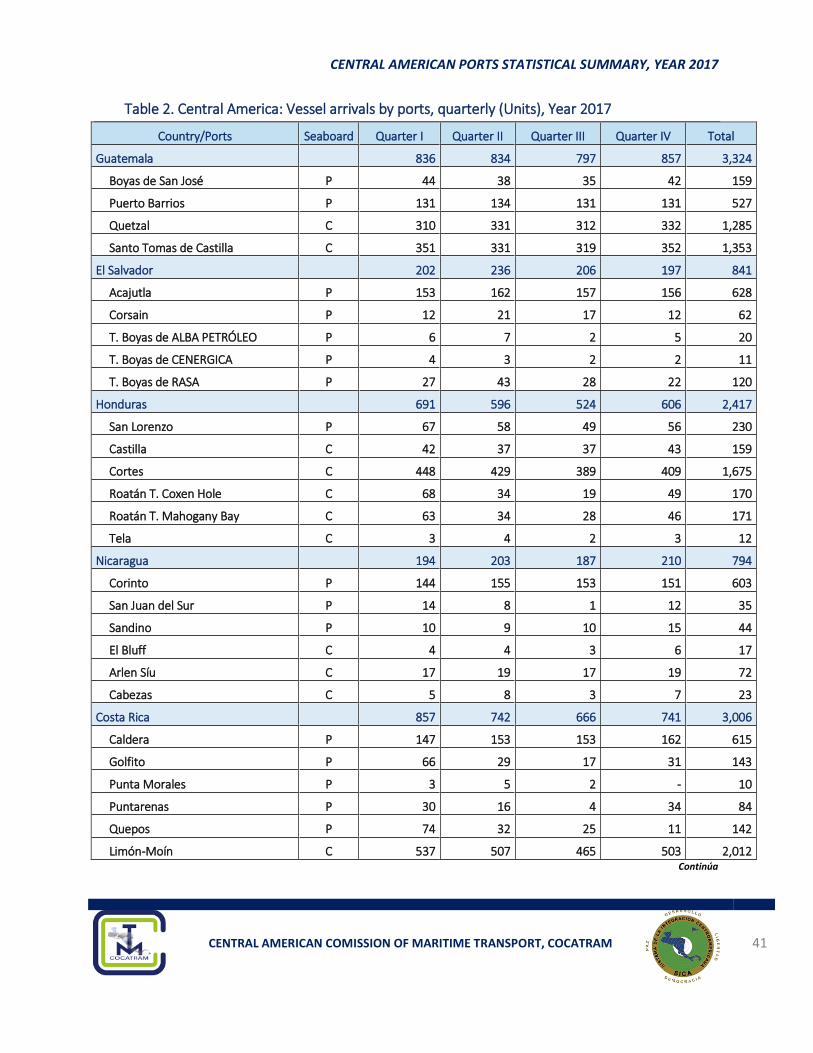
CENTRAL AMERICAN PORTS STATISTICAL SUMMARY, YEAR 2017
CENTRAL AMERICAN COMISSION OF MARITIME TRANSPORT, COCATRAM 41
9 Table 2. Central America: Vessel arrivals by ports, quarterly (Units), Year 2017
Country/Ports Seaboard Quarter I Quarter II Quarter III Quarter IV Total
Guatemala
836 834 797 857 3,324
Boyas de San José P 44 38 35 42 159
Puerto Barrios P 131 134 131 131 527
Quetzal C 310 331 312 332 1,285
Santo Tomas de Castilla C 351 331 319 352 1,353
El Salvador
202 236 206 197 841
Acajutla P 153 162 157 156 628
Corsain P 12 21 17 12 62
T. Boyas de ALBA PETRÓLEO P 6 7 2 5 20
T. Boyas de CENERGICA P 4 3 2 2 11
T. Boyas de RASA P 27 43 28 22 120
Honduras
691 596 524 606 2,417
San Lorenzo P 67 58 49 56 230
Castilla C 42 37 37 43 159
Cortes C 448 429 389 409 1,675
Roatán T. Coxen Hole C 68 34 19 49 170
Roatán T. Mahogany Bay C 63 34 28 46 171
Tela C 3 4 2 3 12
Nicaragua
194 203 187 210 794
Corinto P 144 155 153 151 603
San Juan del Sur P 14 8 1 12 35
Sandino P 10 9 10 15 44
El Bluff C 4 4 3 6 17
Arlen Síu C 17 19 17 19 72
Cabezas C 5 8 3 7 23
Costa Rica
857 742 666 741 3,006
Caldera P 147 153 153 162 615
Golfito P 66 29 17 31 143
Punta Morales P 3 5 2 - 10
Puntarenas P 30 16 4 34 84
Quepos P 74 32 25 11 142
Limón-Moín C 537 507 465 503 2,012 Continúa
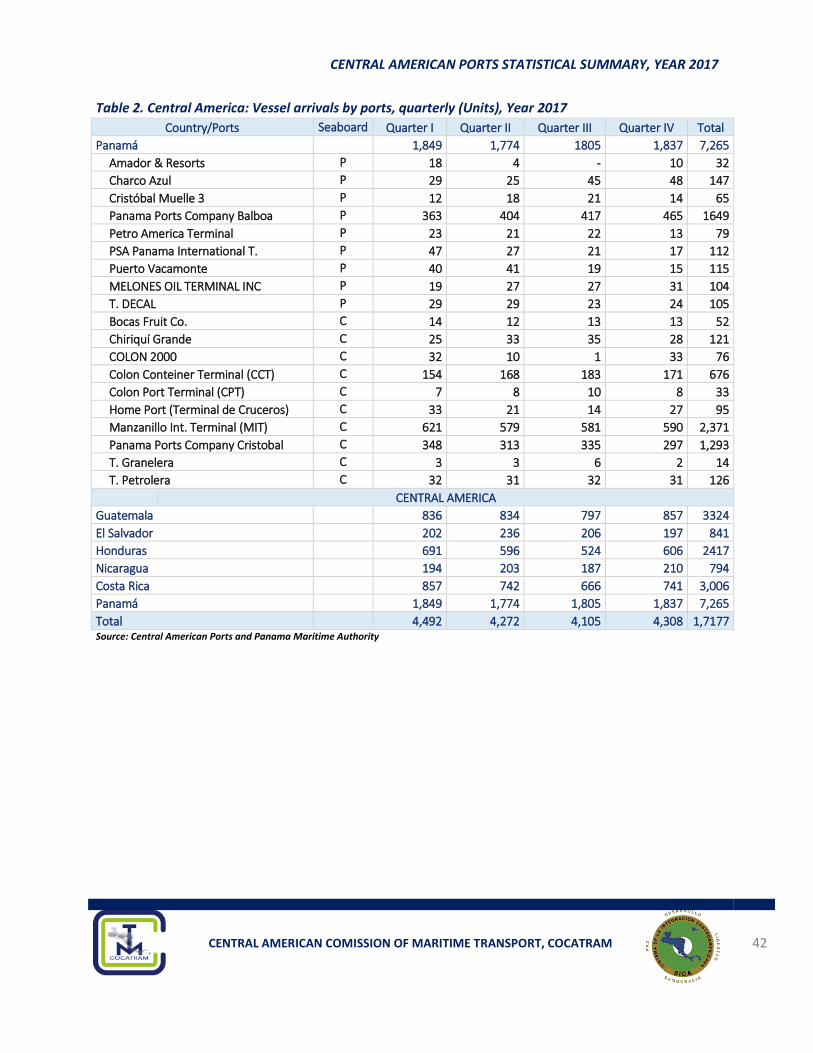
CENTRAL AMERICAN PORTS STATISTICAL SUMMARY, YEAR 2017
CENTRAL AMERICAN COMISSION OF MARITIME TRANSPORT, COCATRAM 42
Table 2. Central America: Vessel arrivals by ports, quarterly (Units), Year 2017
Country/Ports Seaboard Quarter I Quarter II Quarter III Quarter IV Total
Panamá 1,849 1,774 1805 1,837 7,265
Amador & Resorts P 18 4 - 10 32
Charco Azul P 29 25 45 48 147
Cristóbal Muelle 3 P 12 18 21 14 65
Panama Ports Company Balboa P 363 404 417 465 1649
Petro America Terminal P 23 21 22 13 79
PSA Panama International T. P 47 27 21 17 112
Puerto Vacamonte P 40 41 19 15 115
MELONES OIL TERMINAL INC P 19 27 27 31 104
T. DECAL P 29 29 23 24 105
Bocas Fruit Co. C 14 12 13 13 52
Chiriquí Grande C 25 33 35 28 121
COLON 2000 C 32 10 1 33 76
Colon Conteiner Terminal (CCT) C 154 168 183 171 676
Colon Port Terminal (CPT) C 7 8 10 8 33
Home Port (Terminal de Cruceros) C 33 21 14 27 95
Manzanillo Int. Terminal (MIT) C 621 579 581 590 2,371
Panama Ports Company Cristobal C 348 313 335 297 1,293
T. Granelera C 3 3 6 2 14
T. Petrolera C 32 31 32 31 126
CENTRAL AMERICA
Guatemala 836 834 797 857 3324
El Salvador 202 236 206 197 841
Honduras 691 596 524 606 2417
Nicaragua 194 203 187 210 794
Costa Rica 857 742 666 741 3,006
Panamá 1,849 1,774 1,805 1,837 7,265
Total 4,492 4,272 4,105 4,308 1,7177 Source: Central American Ports and Panama Maritime Authority

CENTRAL AMERICAN PORTS STATISTICAL SUMMARY, YEAR 2017
CENTRAL AMERICAN COMISSION OF MARITIME TRANSPORT, COCATRAM 43
10 Table 3. Central America: Vessel arrivals by ship type, (Units) Year 2017 Country/Ports Seaboard Conventional Reefer Container Ships Ro-Ro Dry Bulk Liquid Bulk Gas Carrier Oil Tanker Cruises Barge Others Total
Guatemala 265 149 1,836 104 346 408 14 10 99 22 71 3,324
Boyas de San José P - - - - - 159 - - - - - 159
Quetzal P 87 51 609 104 239 72 14 - 71 1 37 1,285
Puerto Barrios C 14 17 444 - - 31 - - - 21 - 527
Santo Tomas de Castilla C 164 81 783 - 107 146 - 10 28 - 34 1,353
El Salvador 67 - 255 94 120 235 14 - 8 - 48 841
Acajutla P 67 - 255 94 120 84 - - 8 - - 628
Corsain P - - - - - - 14 - - - 48 62
T. Boyas de ALBA PETRÓLEO P - - - - - 20 - - - - - 20
T. Boyas de CENERGICA P - - - - - 11 - - - - - 11
T. Boyas de RASA P - - - - - 120 - - - - - 120
Honduras 116 - 1,420 110 141 81 42 118 348 - 41 2,417
San Lorenzo P 21 - 61 96 14 7 - 29 - - 2 230
Puerto Castilla C 3 - 120 - - 29 - - 4 - 3 159
Puerto Cortes C 92 - 1,239 14 127 45 42 77 3 - 36 1,675
Roatán T. Coxen Hole C - - - - - - - - 170 - - 170
Roatán T. Mahogany Bay C - - - - - - - - 171 - - 171
Tela C - - - - - - - 12 - - - 12
Nicaragua 207 - 259 103 - - - 143 80 1 1 794
Corinto C 102 - 259 103 - - - 92 45 1 1 603
San Juan del Sur C - - - - - - - - 35 - - 35
Sandino C 28 - - - - - - 16 - - - 44
El Bluff P - - - - - - - 17 - - - 17
Puerto Arlen Síu P 72 - - - - - - - - - - 72
Cabezas P 5 - - - - - - 18 - - - 23
Costa Rica 261 358 1,452 110 176 43 100 - 347 36 123 3,006
Caldera P 87 - 253 102 121 1 - - 19 14 18 615
Golfito P 34 - - - - 8 - - 50 22 29 143
Punta Morales P - - - - 8 2 - - - - - 10
Puntarenas P - - - - - - - - 84 - - 84
Quepos P - - - - - - - - 71 - 71 142
Limón-Moín P 140 358 1,199 8 47 32 100 - 123 - 5 2,012
Continúa
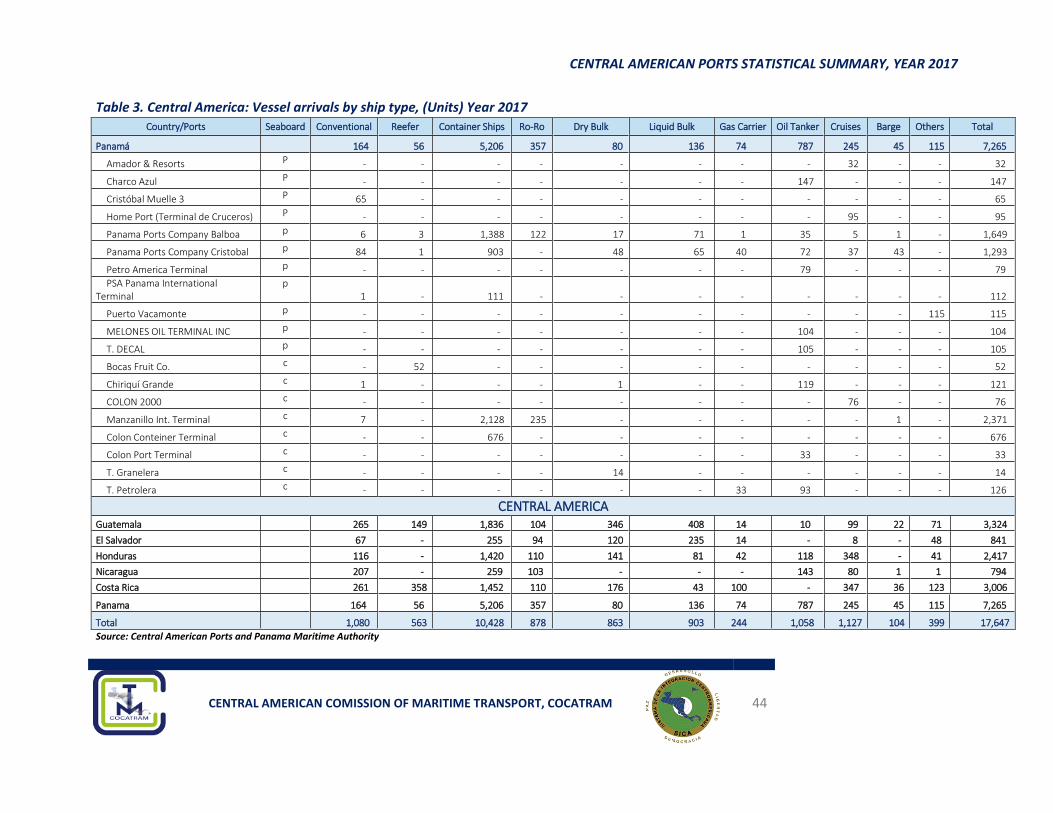
CENTRAL AMERICAN PORTS STATISTICAL SUMMARY, YEAR 2017
CENTRAL AMERICAN COMISSION OF MARITIME TRANSPORT, COCATRAM 44
Table 3. Central America: Vessel arrivals by ship type, (Units) Year 2017 Country/Ports Seaboard Conventional Reefer Container Ships Ro-Ro Dry Bulk Liquid Bulk Gas Carrier Oil Tanker Cruises Barge Others Total
Panamá 164 56 5,206 357 80 136 74 787 245 45 115 7,265
Amador & Resorts P - - - - - - - - 32 - - 32
Charco Azul P - - - - - - - 147 - - - 147
Cristóbal Muelle 3 P 65 - - - - - - - - - - 65
Home Port (Terminal de Cruceros) P - - - - - - - - 95 - - 95
Panama Ports Company Balboa p 6 3 1,388 122 17 71 1 35 5 1 - 1,649
Panama Ports Company Cristobal p 84 1 903 - 48 65 40 72 37 43 - 1,293
Petro America Terminal p - - - - - - - 79 - - - 79
PSA Panama International Terminal
p 1 - 111 - - - - - - - - 112
Puerto Vacamonte p - - - - - - - - - - 115 115
MELONES OIL TERMINAL INC p - - - - - - - 104 - - - 104
T. DECAL p - - - - - - - 105 - - - 105
Bocas Fruit Co. c - 52 - - - - - - - - - 52
Chiriquí Grande c 1 - - - 1 - - 119 - - - 121
COLON 2000 c - - - - - - - - 76 - - 76
Manzanillo Int. Terminal c 7 - 2,128 235 - - - - - 1 - 2,371
Colon Conteiner Terminal c - - 676 - - - - - - - - 676
Colon Port Terminal c - - - - - - - 33 - - - 33
T. Granelera c - - - - 14 - - - - - - 14
T. Petrolera c - - - - - - 33 93 - - - 126
CENTRAL AMERICA Guatemala 265 149 1,836 104 346 408 14 10 99 22 71 3,324
El Salvador 67 - 255 94 120 235 14 - 8 - 48 841
Honduras 116 - 1,420 110 141 81 42 118 348 - 41 2,417
Nicaragua 207 - 259 103 - - - 143 80 1 1 794
Costa Rica 261 358 1,452 110 176 43 100 - 347 36 123 3,006
Panama 164 56 5,206 357 80 136 74 787 245 45 115 7,265
Total 1,080 563 10,428 878 863 903 244 1,058 1,127 104 399 17,647
Source: Central American Ports and Panama Maritime Authority
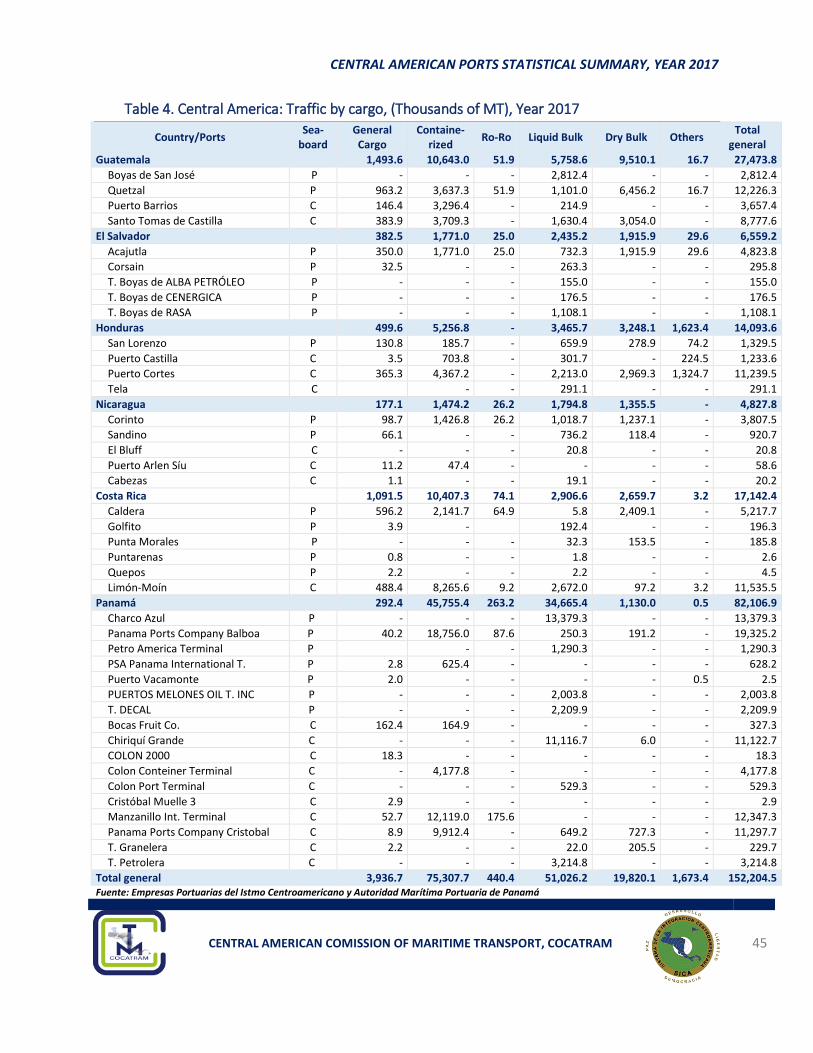
CENTRAL AMERICAN PORTS STATISTICAL SUMMARY, YEAR 2017
CENTRAL AMERICAN COMISSION OF MARITIME TRANSPORT, COCATRAM 45
11 Table 4. Central America: Traffic by cargo, (Thousands of MT), Year 2017
Country/Ports Sea-
board General Cargo
Containe-rized
Ro-Ro Liquid Bulk Dry Bulk Others Total
general
Guatemala 1,493.6 10,643.0 51.9 5,758.6 9,510.1 16.7 27,473.8
Boyas de San José P - - - 2,812.4 - - 2,812.4
Quetzal P 963.2 3,637.3 51.9 1,101.0 6,456.2 16.7 12,226.3
Puerto Barrios C 146.4 3,296.4 - 214.9 - - 3,657.4
Santo Tomas de Castilla C 383.9 3,709.3 - 1,630.4 3,054.0 - 8,777.6
El Salvador 382.5 1,771.0 25.0 2,435.2 1,915.9 29.6 6,559.2
Acajutla P 350.0 1,771.0 25.0 732.3 1,915.9 29.6 4,823.8
Corsain P 32.5 - - 263.3 - - 295.8
T. Boyas de ALBA PETRÓLEO P - - - 155.0 - - 155.0
T. Boyas de CENERGICA P - - - 176.5 - - 176.5
T. Boyas de RASA P - - - 1,108.1 - - 1,108.1
Honduras 499.6 5,256.8 - 3,465.7 3,248.1 1,623.4 14,093.6
San Lorenzo P 130.8 185.7 - 659.9 278.9 74.2 1,329.5
Puerto Castilla C 3.5 703.8 - 301.7 - 224.5 1,233.6
Puerto Cortes C 365.3 4,367.2 - 2,213.0 2,969.3 1,324.7 11,239.5
Tela C
- - 291.1 - - 291.1
Nicaragua 177.1 1,474.2 26.2 1,794.8 1,355.5 - 4,827.8
Corinto P 98.7 1,426.8 26.2 1,018.7 1,237.1 - 3,807.5
Sandino P 66.1 - - 736.2 118.4 - 920.7
El Bluff C - - - 20.8 - - 20.8
Puerto Arlen Síu C 11.2 47.4 - - - - 58.6
Cabezas C 1.1 - - 19.1 - - 20.2
Costa Rica 1,091.5 10,407.3 74.1 2,906.6 2,659.7 3.2 17,142.4
Caldera P 596.2 2,141.7 64.9 5.8 2,409.1 - 5,217.7
Golfito P 3.9 -
192.4 - - 196.3
Punta Morales P - - - 32.3 153.5 - 185.8
Puntarenas P 0.8 - - 1.8 - - 2.6
Quepos P 2.2 - - 2.2 - - 4.5
Limón-Moín C 488.4 8,265.6 9.2 2,672.0 97.2 3.2 11,535.5
Panamá 292.4 45,755.4 263.2 34,665.4 1,130.0 0.5 82,106.9
Charco Azul P - - - 13,379.3 - - 13,379.3
Panama Ports Company Balboa P 40.2 18,756.0 87.6 250.3 191.2 - 19,325.2
Petro America Terminal P
- - 1,290.3 - - 1,290.3
PSA Panama International T. P 2.8 625.4 - - - - 628.2
Puerto Vacamonte P 2.0 - - - - 0.5 2.5
PUERTOS MELONES OIL T. INC P - - - 2,003.8 - - 2,003.8
T. DECAL P - - - 2,209.9 - - 2,209.9
Bocas Fruit Co. C 162.4 164.9 - - - - 327.3
Chiriquí Grande C - - - 11,116.7 6.0 - 11,122.7
COLON 2000 C 18.3 - - - - - 18.3
Colon Conteiner Terminal C - 4,177.8 - - - - 4,177.8
Colon Port Terminal C - - - 529.3 - - 529.3
Cristóbal Muelle 3 C 2.9 - - - - - 2.9
Manzanillo Int. Terminal C 52.7 12,119.0 175.6 - - - 12,347.3
Panama Ports Company Cristobal C 8.9 9,912.4 - 649.2 727.3 - 11,297.7
T. Granelera C 2.2 - - 22.0 205.5 - 229.7
T. Petrolera C - - - 3,214.8 - - 3,214.8
Total general 3,936.7 75,307.7 440.4 51,026.2 19,820.1 1,673.4 152,204.5 Fuente: Empresas Portuarias del Istmo Centroamericano y Autoridad Marítima Portuaria de Panamá
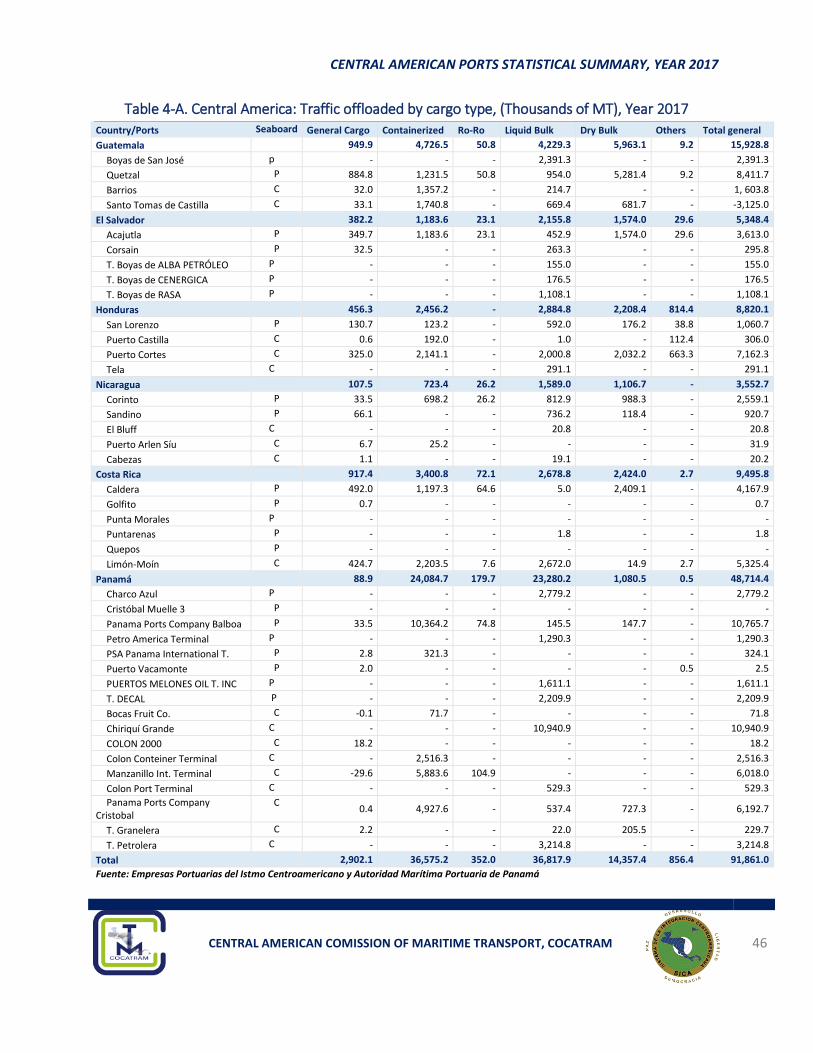
CENTRAL AMERICAN PORTS STATISTICAL SUMMARY, YEAR 2017
CENTRAL AMERICAN COMISSION OF MARITIME TRANSPORT, COCATRAM 46
12 Table 4-A. Central America: Traffic offloaded by cargo type, (Thousands of MT), Year 2017 Country/Ports Seaboard General Cargo Containerized Ro-Ro Liquid Bulk Dry Bulk Others Total general
Guatemala 949.9 4,726.5 50.8 4,229.3 5,963.1 9.2 15,928.8
Boyas de San José p - - - 2,391.3 - - 2,391.3
Quetzal P 884.8 1,231.5 50.8 954.0 5,281.4 9.2 8,411.7
Barrios C 32.0 1,357.2 - 214.7 - - 1, 603.8
Santo Tomas de Castilla C 33.1 1,740.8 - 669.4 681.7 - -3,125.0
El Salvador 382.2 1,183.6 23.1 2,155.8 1,574.0 29.6 5,348.4
Acajutla P 349.7 1,183.6 23.1 452.9 1,574.0 29.6 3,613.0
Corsain P 32.5 - - 263.3 - - 295.8
T. Boyas de ALBA PETRÓLEO P - - - 155.0 - - 155.0
T. Boyas de CENERGICA P - - - 176.5 - - 176.5
T. Boyas de RASA P - - - 1,108.1 - - 1,108.1
Honduras 456.3 2,456.2 - 2,884.8 2,208.4 814.4 8,820.1
San Lorenzo P 130.7 123.2 - 592.0 176.2 38.8 1,060.7
Puerto Castilla C 0.6 192.0 - 1.0 - 112.4 306.0
Puerto Cortes C 325.0 2,141.1 - 2,000.8 2,032.2 663.3 7,162.3
Tela C - - - 291.1 - - 291.1
Nicaragua 107.5 723.4 26.2 1,589.0 1,106.7 - 3,552.7
Corinto P 33.5 698.2 26.2 812.9 988.3 - 2,559.1
Sandino P 66.1 - - 736.2 118.4 - 920.7
El Bluff C - - - 20.8 - - 20.8
Puerto Arlen Síu C 6.7 25.2 - - - - 31.9
Cabezas C 1.1 - - 19.1 - - 20.2
Costa Rica 917.4 3,400.8 72.1 2,678.8 2,424.0 2.7 9,495.8
Caldera P 492.0 1,197.3 64.6 5.0 2,409.1 - 4,167.9
Golfito P 0.7 - - - - - 0.7
Punta Morales P - - - - - - -
Puntarenas P - - - 1.8 - - 1.8
Quepos P - - - - - - -
Limón-Moín C 424.7 2,203.5 7.6 2,672.0 14.9 2.7 5,325.4
Panamá 88.9 24,084.7 179.7 23,280.2 1,080.5 0.5 48,714.4
Charco Azul P - - - 2,779.2 - - 2,779.2
Cristóbal Muelle 3 P - - - - - - -
Panama Ports Company Balboa P 33.5 10,364.2 74.8 145.5 147.7 - 10,765.7
Petro America Terminal P - - - 1,290.3 - - 1,290.3
PSA Panama International T. P 2.8 321.3 - - - - 324.1
Puerto Vacamonte P 2.0 - - - - 0.5 2.5
PUERTOS MELONES OIL T. INC P - - - 1,611.1 - - 1,611.1
T. DECAL P - - - 2,209.9 - - 2,209.9
Bocas Fruit Co. C -0.1 71.7 - - - - 71.8
Chiriquí Grande C - - - 10,940.9 - - 10,940.9
COLON 2000 C 18.2 - - - - - 18.2
Colon Conteiner Terminal C - 2,516.3 - - - - 2,516.3
Manzanillo Int. Terminal C -29.6 5,883.6 104.9 - - - 6,018.0
Colon Port Terminal C - - - 529.3 - - 529.3
Panama Ports Company Cristobal
C 0.4 4,927.6 - 537.4 727.3 - 6,192.7
T. Granelera C 2.2 - - 22.0 205.5 - 229.7
T. Petrolera C - - - 3,214.8 - - 3,214.8
Total 2,902.1 36,575.2 352.0 36,817.9 14,357.4 856.4 91,861.0
Fuente: Empresas Portuarias del Istmo Centroamericano y Autoridad Marítima Portuaria de Panamá
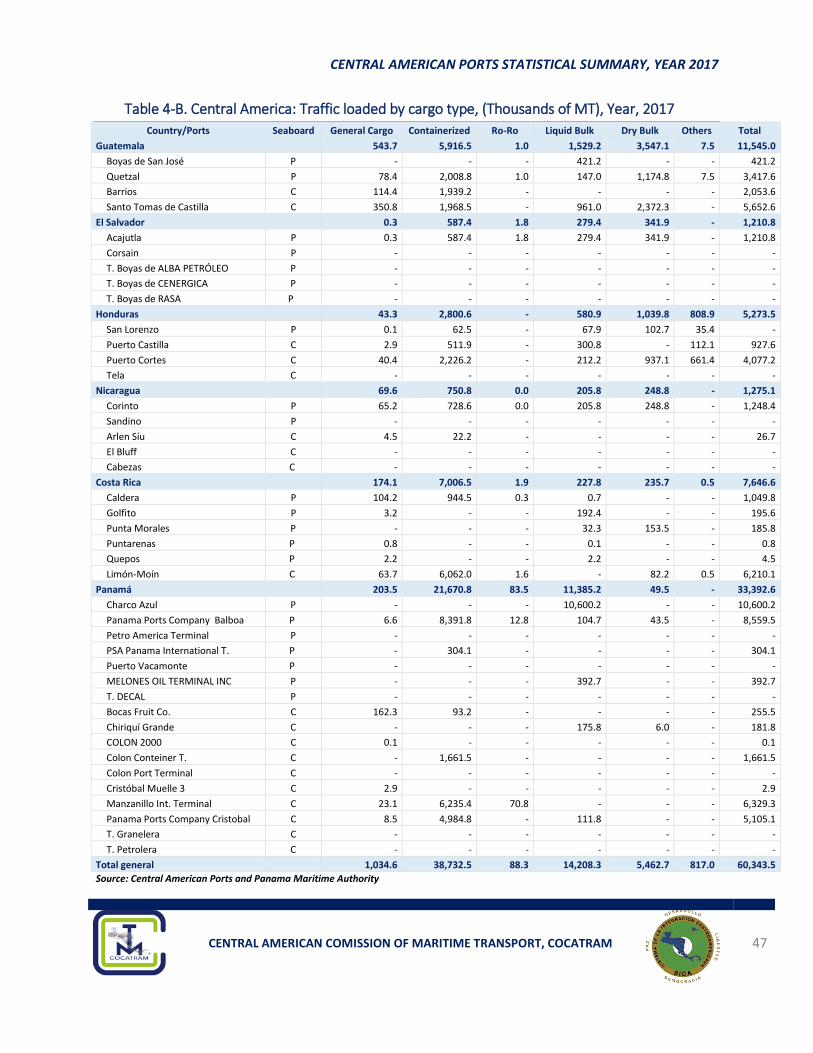
CENTRAL AMERICAN PORTS STATISTICAL SUMMARY, YEAR 2017
CENTRAL AMERICAN COMISSION OF MARITIME TRANSPORT, COCATRAM 47
13 Table 4-B. Central America: Traffic loaded by cargo type, (Thousands of MT), Year, 2017
Country/Ports Seaboard General Cargo Containerized Ro-Ro Liquid Bulk Dry Bulk Others Total
Guatemala 543.7 5,916.5 1.0 1,529.2 3,547.1 7.5 11,545.0
Boyas de San José P - - - 421.2 - - 421.2
Quetzal P 78.4 2,008.8 1.0 147.0 1,174.8 7.5 3,417.6
Barrios C 114.4 1,939.2 - - - - 2,053.6
Santo Tomas de Castilla C 350.8 1,968.5 - 961.0 2,372.3 - 5,652.6
El Salvador 0.3 587.4 1.8 279.4 341.9 - 1,210.8
Acajutla P 0.3 587.4 1.8 279.4 341.9 - 1,210.8
Corsain P - - - - - - -
T. Boyas de ALBA PETRÓLEO P - - - - - - -
T. Boyas de CENERGICA P - - - - - - -
T. Boyas de RASA P - - - - - - -
Honduras 43.3 2,800.6 - 580.9 1,039.8 808.9 5,273.5
San Lorenzo P 0.1 62.5 - 67.9 102.7 35.4 -
Puerto Castilla C 2.9 511.9 - 300.8 - 112.1 927.6
Puerto Cortes C 40.4 2,226.2 - 212.2 937.1 661.4 4,077.2
Tela C - - - - - - -
Nicaragua 69.6 750.8 0.0 205.8 248.8 - 1,275.1
Corinto P 65.2 728.6 0.0 205.8 248.8 - 1,248.4
Sandino P - - - - - - -
Arlen Síu C 4.5 22.2 - - - - 26.7
El Bluff C - - - - - - -
Cabezas C - - - - - - -
Costa Rica 174.1 7,006.5 1.9 227.8 235.7 0.5 7,646.6
Caldera P 104.2 944.5 0.3 0.7 - - 1,049.8
Golfito P 3.2 - - 192.4 - - 195.6
Punta Morales P - - - 32.3 153.5 - 185.8
Puntarenas P 0.8 - - 0.1 - - 0.8
Quepos P 2.2 - - 2.2 - - 4.5
Limón-Moín C 63.7 6,062.0 1.6 - 82.2 0.5 6,210.1
Panamá 203.5 21,670.8 83.5 11,385.2 49.5 - 33,392.6
Charco Azul P - - - 10,600.2 - - 10,600.2
Panama Ports Company Balboa P 6.6 8,391.8 12.8 104.7 43.5 - 8,559.5
Petro America Terminal P - - - - - - -
PSA Panama International T. P - 304.1 - - - - 304.1
Puerto Vacamonte P - - - - - - -
MELONES OIL TERMINAL INC P - - - 392.7 - - 392.7
T. DECAL P - - - - - - -
Bocas Fruit Co. C 162.3 93.2 - - - - 255.5
Chiriquí Grande C - - - 175.8 6.0 - 181.8
COLON 2000 C 0.1 - - - - - 0.1
Colon Conteiner T. C - 1,661.5 - - - - 1,661.5
Colon Port Terminal C - - - - - - -
Cristóbal Muelle 3 C 2.9 - - - - - 2.9
Manzanillo Int. Terminal C 23.1 6,235.4 70.8 - - - 6,329.3
Panama Ports Company Cristobal C 8.5 4,984.8 - 111.8 - - 5,105.1
T. Granelera C - - - - - - -
T. Petrolera C - - - - - - -
Total general 1,034.6 38,732.5 88.3 14,208.3 5,462.7 817.0 60,343.5
Source: Central American Ports and Panama Maritime Authority
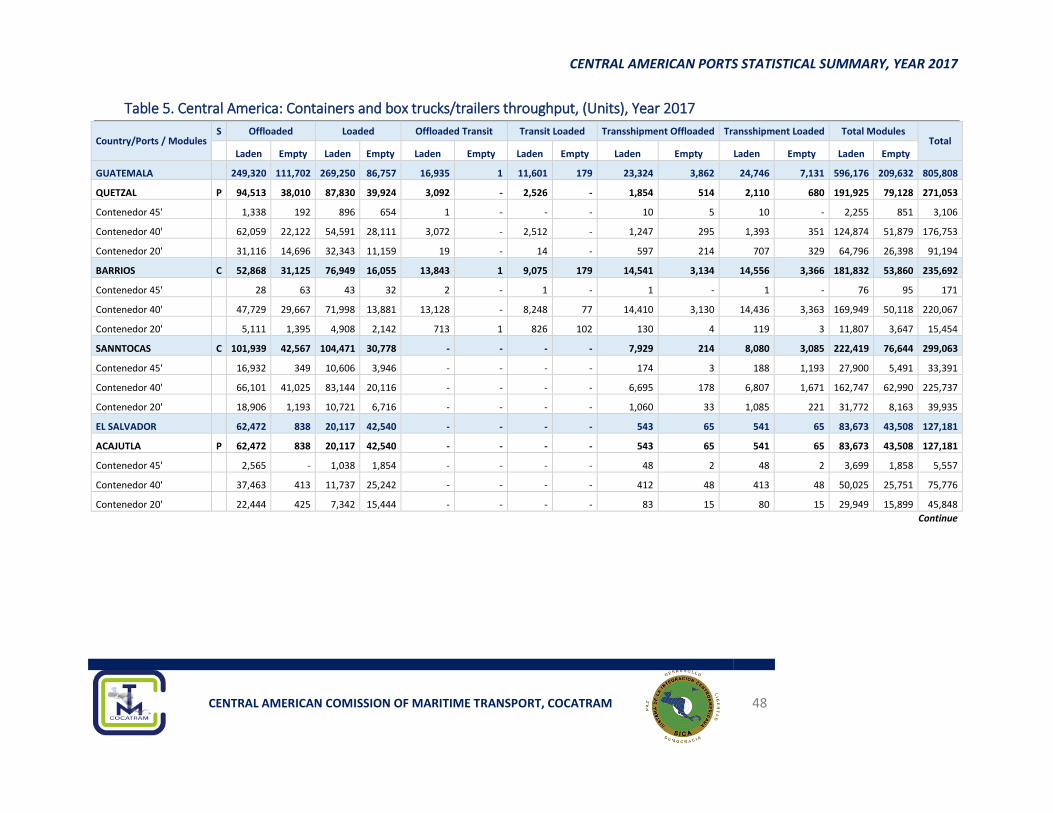
CENTRAL AMERICAN PORTS STATISTICAL SUMMARY, YEAR 2017
CENTRAL AMERICAN COMISSION OF MARITIME TRANSPORT, COCATRAM 48
14 Table 5. Central America: Containers and box trucks/trailers throughput, (Units), Year 2017
Country/Ports / Modules S Offloaded Loaded Offloaded Transit Transit Loaded Transshipment Offloaded Transshipment Loaded Total Modules
Total
Laden Empty Laden Empty Laden Empty Laden Empty Laden Empty Laden Empty Laden Empty
GUATEMALA
249,320 111,702 269,250 86,757 16,935 1 11,601 179 23,324 3,862 24,746 7,131 596,176 209,632 805,808
QUETZAL P 94,513 38,010 87,830 39,924 3,092 - 2,526 - 1,854 514 2,110 680 191,925 79,128 271,053
Contenedor 45'
1,338 192 896 654 1 - - - 10 5 10 - 2,255 851 3,106
Contenedor 40'
62,059 22,122 54,591 28,111 3,072 - 2,512 - 1,247 295 1,393 351 124,874 51,879 176,753
Contenedor 20'
31,116 14,696 32,343 11,159 19 - 14 - 597 214 707 329 64,796 26,398 91,194
BARRIOS C 52,868 31,125 76,949 16,055 13,843 1 9,075 179 14,541 3,134 14,556 3,366 181,832 53,860 235,692
Contenedor 45'
28 63 43 32 2 - 1 - 1 - 1 - 76 95 171
Contenedor 40'
47,729 29,667 71,998 13,881 13,128 - 8,248 77 14,410 3,130 14,436 3,363 169,949 50,118 220,067
Contenedor 20'
5,111 1,395 4,908 2,142 713 1 826 102 130 4 119 3 11,807 3,647 15,454
SANNTOCAS C 101,939 42,567 104,471 30,778 - - - - 7,929 214 8,080 3,085 222,419 76,644 299,063
Contenedor 45'
16,932 349 10,606 3,946 - - - - 174 3 188 1,193 27,900 5,491 33,391
Contenedor 40'
66,101 41,025 83,144 20,116 - - - - 6,695 178 6,807 1,671 162,747 62,990 225,737
Contenedor 20'
18,906 1,193 10,721 6,716 - - - - 1,060 33 1,085 221 31,772 8,163 39,935
EL SALVADOR
62,472 838 20,117 42,540 - - - - 543 65 541 65 83,673 43,508 127,181
ACAJUTLA P 62,472 838 20,117 42,540 - - - - 543 65 541 65 83,673 43,508 127,181
Contenedor 45'
2,565 - 1,038 1,854 - - - - 48 2 48 2 3,699 1,858 5,557
Contenedor 40'
37,463 413 11,737 25,242 - - - - 412 48 413 48 50,025 25,751 75,776
Contenedor 20'
22,444 425 7,342 15,444 - - - - 83 15 80 15 29,949 15,899 45,848
Continue
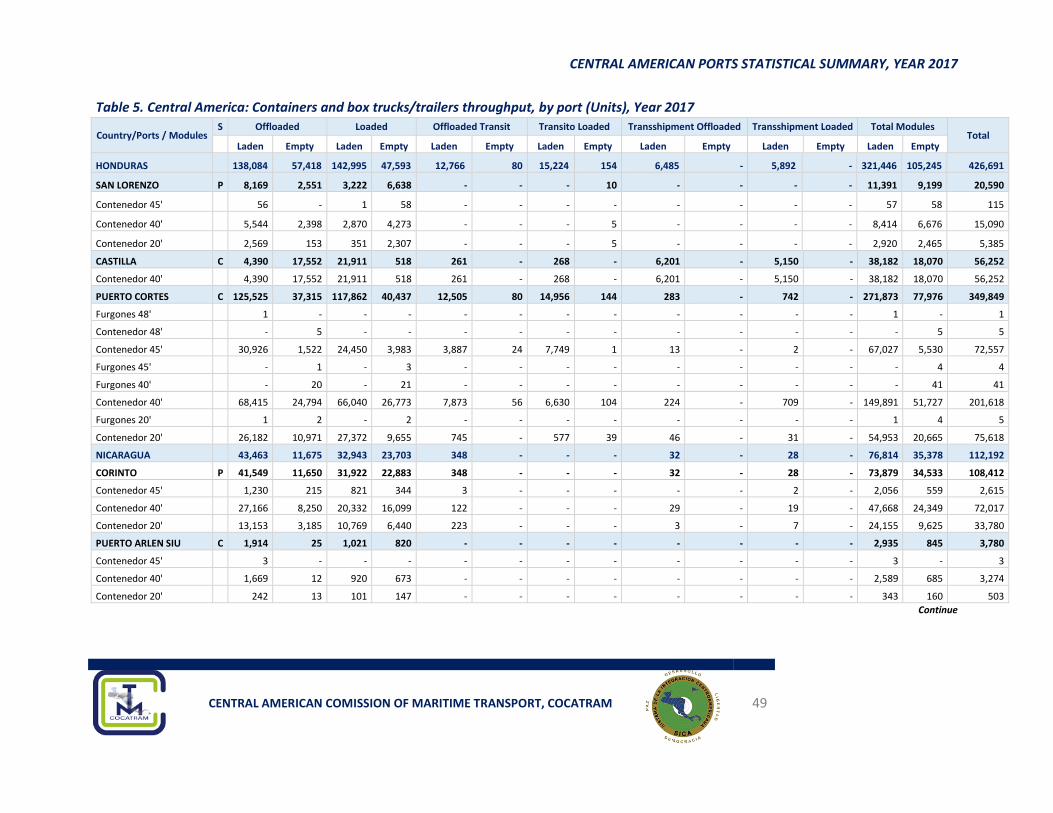
CENTRAL AMERICAN PORTS STATISTICAL SUMMARY, YEAR 2017
CENTRAL AMERICAN COMISSION OF MARITIME TRANSPORT, COCATRAM 49
Table 5. Central America: Containers and box trucks/trailers throughput, by port (Units), Year 2017
Country/Ports / Modules S Offloaded Loaded Offloaded Transit Transito Loaded Transshipment Offloaded Transshipment Loaded Total Modules
Total
Laden Empty Laden Empty Laden Empty Laden Empty Laden Empty Laden Empty Laden Empty
HONDURAS
138,084 57,418 142,995 47,593 12,766 80 15,224 154 6,485 - 5,892 - 321,446 105,245 426,691
SAN LORENZO P 8,169 2,551 3,222 6,638 - - - 10 - - - - 11,391 9,199 20,590
Contenedor 45'
56 - 1 58 - - - - - - - - 57 58 115
Contenedor 40'
5,544 2,398 2,870 4,273 - - - 5 - - - - 8,414 6,676 15,090
Contenedor 20'
2,569 153 351 2,307 - - - 5 - - - - 2,920 2,465 5,385
CASTILLA C 4,390 17,552 21,911 518 261 - 268 - 6,201 - 5,150 - 38,182 18,070 56,252
Contenedor 40'
4,390 17,552 21,911 518 261 - 268 - 6,201 - 5,150 - 38,182 18,070 56,252
PUERTO CORTES C 125,525 37,315 117,862 40,437 12,505 80 14,956 144 283 - 742 - 271,873 77,976 349,849
Furgones 48'
1 - - - - - - - - - - - 1 - 1
Contenedor 48'
- 5 - - - - - - - - - - - 5 5
Contenedor 45'
30,926 1,522 24,450 3,983 3,887 24 7,749 1 13 - 2 - 67,027 5,530 72,557
Furgones 45'
- 1 - 3 - - - - - - - - - 4 4
Furgones 40'
- 20 - 21 - - - - - - - - - 41 41
Contenedor 40'
68,415 24,794 66,040 26,773 7,873 56 6,630 104 224 - 709 - 149,891 51,727 201,618
Furgones 20'
1 2 - 2 - - - - - - - - 1 4 5
Contenedor 20'
26,182 10,971 27,372 9,655 745 - 577 39 46 - 31 - 54,953 20,665 75,618
NICARAGUA
43,463 11,675 32,943 23,703 348 - - - 32 - 28 - 76,814 35,378 112,192
CORINTO P 41,549 11,650 31,922 22,883 348 - - - 32 - 28 - 73,879 34,533 108,412
Contenedor 45'
1,230 215 821 344 3 - - - - - 2 - 2,056 559 2,615
Contenedor 40'
27,166 8,250 20,332 16,099 122 - - - 29 - 19 - 47,668 24,349 72,017
Contenedor 20'
13,153 3,185 10,769 6,440 223 - - - 3 - 7 - 24,155 9,625 33,780
PUERTO ARLEN SIU C 1,914 25 1,021 820 - - - - - - - - 2,935 845 3,780
Contenedor 45'
3 - - - - - - - - - - - 3 - 3
Contenedor 40'
1,669 12 920 673 - - - - - - - - 2,589 685 3,274
Contenedor 20'
242 13 101 147 - - - - - - - - 343 160 503
Continue
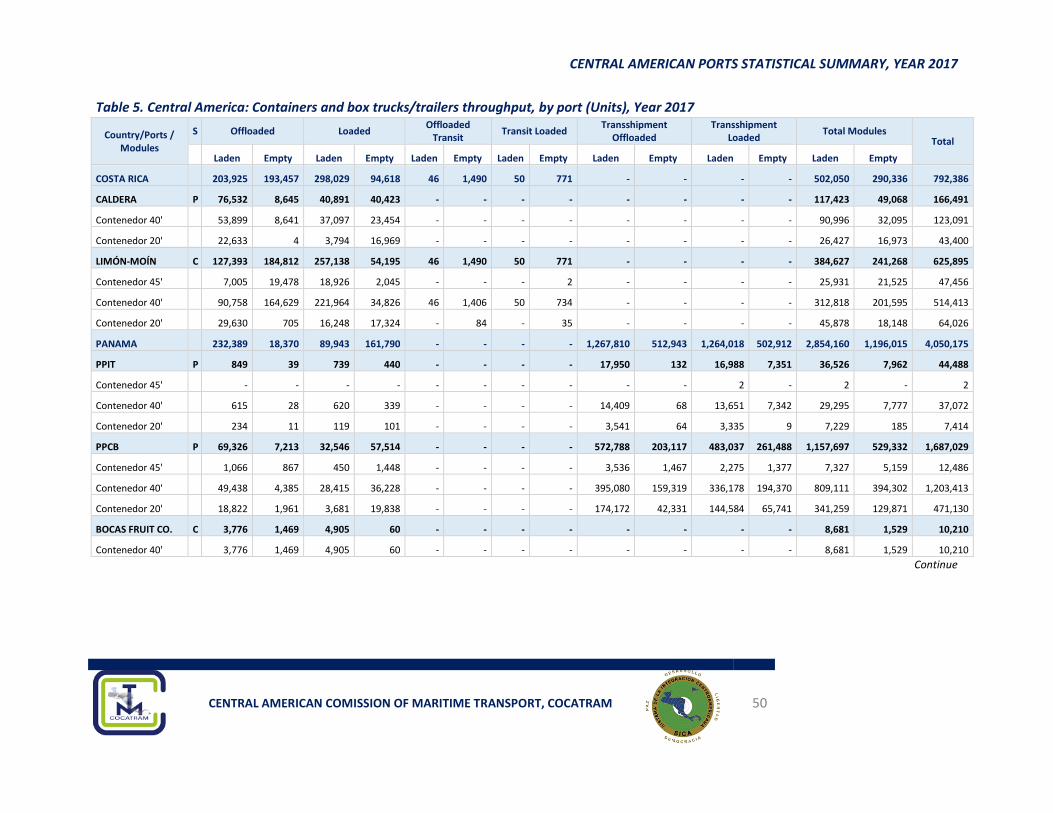
CENTRAL AMERICAN PORTS STATISTICAL SUMMARY, YEAR 2017
CENTRAL AMERICAN COMISSION OF MARITIME TRANSPORT, COCATRAM 50
Table 5. Central America: Containers and box trucks/trailers throughput, by port (Units), Year 2017
Country/Ports / Modules
S Offloaded Loaded Offloaded
Transit Transit Loaded
Transshipment Offloaded
Transshipment Loaded
Total Modules Total
Laden Empty Laden Empty Laden Empty Laden Empty Laden Empty Laden Empty Laden Empty
COSTA RICA
203,925 193,457 298,029 94,618 46 1,490 50 771 - - - - 502,050 290,336 792,386
CALDERA P 76,532 8,645 40,891 40,423 - - - - - - - - 117,423 49,068 166,491
Contenedor 40'
53,899 8,641 37,097 23,454 - - - - - - - - 90,996 32,095 123,091
Contenedor 20'
22,633 4 3,794 16,969 - - - - - - - - 26,427 16,973 43,400
LIMÓN-MOÍN C 127,393 184,812 257,138 54,195 46 1,490 50 771 - - - - 384,627 241,268 625,895
Contenedor 45'
7,005 19,478 18,926 2,045 - - - 2 - - - - 25,931 21,525 47,456
Contenedor 40'
90,758 164,629 221,964 34,826 46 1,406 50 734 - - - - 312,818 201,595 514,413
Contenedor 20'
29,630 705 16,248 17,324 - 84 - 35 - - - - 45,878 18,148 64,026
PANAMA
232,389 18,370 89,943 161,790 - - - - 1,267,810 512,943 1,264,018 502,912 2,854,160 1,196,015 4,050,175
PPIT P 849 39 739 440 - - - - 17,950 132 16,988 7,351 36,526 7,962 44,488
Contenedor 45'
- - - - - - - - - - 2 - 2 - 2
Contenedor 40'
615 28 620 339 - - - - 14,409 68 13,651 7,342 29,295 7,777 37,072
Contenedor 20'
234 11 119 101 - - - - 3,541 64 3,335 9 7,229 185 7,414
PPCB P 69,326 7,213 32,546 57,514 - - - - 572,788 203,117 483,037 261,488 1,157,697 529,332 1,687,029
Contenedor 45'
1,066 867 450 1,448 - - - - 3,536 1,467 2,275 1,377 7,327 5,159 12,486
Contenedor 40'
49,438 4,385 28,415 36,228 - - - - 395,080 159,319 336,178 194,370 809,111 394,302 1,203,413
Contenedor 20'
18,822 1,961 3,681 19,838 - - - - 174,172 42,331 144,584 65,741 341,259 129,871 471,130
BOCAS FRUIT CO. C 3,776 1,469 4,905 60 - - - - - - - - 8,681 1,529 10,210
Contenedor 40'
3,776 1,469 4,905 60 - - - - - - - - 8,681 1,529 10,210
Continue
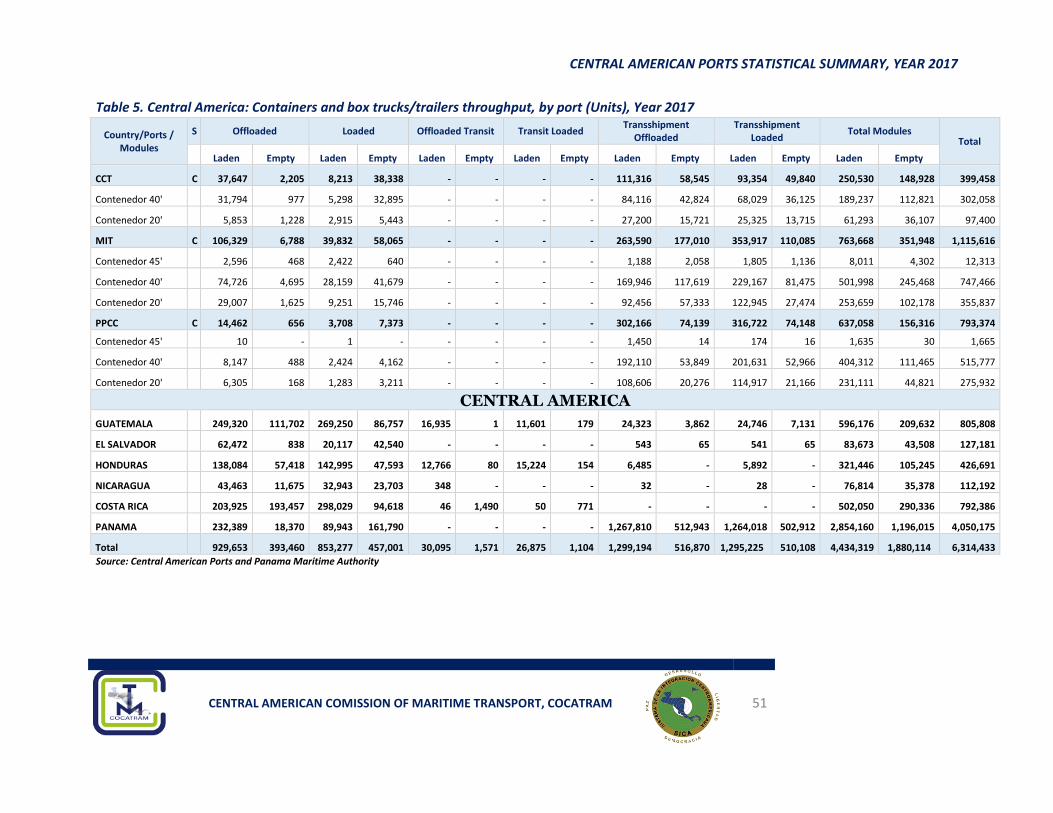
CENTRAL AMERICAN PORTS STATISTICAL SUMMARY, YEAR 2017
CENTRAL AMERICAN COMISSION OF MARITIME TRANSPORT, COCATRAM 51
Table 5. Central America: Containers and box trucks/trailers throughput, by port (Units), Year 2017
Country/Ports / Modules
S Offloaded Loaded Offloaded Transit Transit Loaded Transshipment
Offloaded Transshipment
Loaded Total Modules
Total
Laden Empty Laden Empty Laden Empty Laden Empty Laden Empty Laden Empty Laden Empty
CCT C 37,647 2,205 8,213 38,338 - - - - 111,316 58,545 93,354 49,840 250,530 148,928 399,458
Contenedor 40'
31,794 977 5,298 32,895 - - - - 84,116 42,824 68,029 36,125 189,237 112,821 302,058
Contenedor 20'
5,853 1,228 2,915 5,443 - - - - 27,200 15,721 25,325 13,715 61,293 36,107 97,400
MIT C 106,329 6,788 39,832 58,065 - - - - 263,590 177,010 353,917 110,085 763,668 351,948 1,115,616
Contenedor 45'
2,596 468 2,422 640 - - - - 1,188 2,058 1,805 1,136 8,011 4,302 12,313
Contenedor 40'
74,726 4,695 28,159 41,679 - - - - 169,946 117,619 229,167 81,475 501,998 245,468 747,466
Contenedor 20'
29,007 1,625 9,251 15,746 - - - - 92,456 57,333 122,945 27,474 253,659 102,178 355,837
PPCC C 14,462 656 3,708 7,373 - - - - 302,166 74,139 316,722 74,148 637,058 156,316 793,374
Contenedor 45'
10 - 1 - - - - - 1,450 14 174 16 1,635 30 1,665
Contenedor 40'
8,147 488 2,424 4,162 - - - - 192,110 53,849 201,631 52,966 404,312 111,465 515,777
Contenedor 20'
6,305 168 1,283 3,211 - - - - 108,606 20,276 114,917 21,166 231,111 44,821 275,932
CENTRAL AMERICA
GUATEMALA 249,320 111,702 269,250 86,757 16,935 1 11,601 179 24,323 3,862 24,746 7,131 596,176 209,632 805,808
EL SALVADOR 62,472 838 20,117 42,540 - - - - 543 65 541 65 83,673 43,508 127,181
HONDURAS 138,084 57,418 142,995 47,593 12,766 80 15,224 154 6,485 - 5,892 - 321,446 105,245 426,691
NICARAGUA 43,463 11,675 32,943 23,703 348 - - - 32 - 28 - 76,814 35,378 112,192
COSTA RICA
203,925 193,457 298,029 94,618 46 1,490 50 771 - - - - 502,050 290,336 792,386
PANAMA
232,389 18,370 89,943 161,790 - - - - 1,267,810 512,943 1,264,018 502,912 2,854,160 1,196,015 4,050,175
Total 929,653 393,460 853,277 457,001 30,095 1,571 26,875 1,104 1,299,194 516,870 1,295,225 510,108 4,434,319 1,880,114 6,314,433
Source: Central American Ports and Panama Maritime Authority
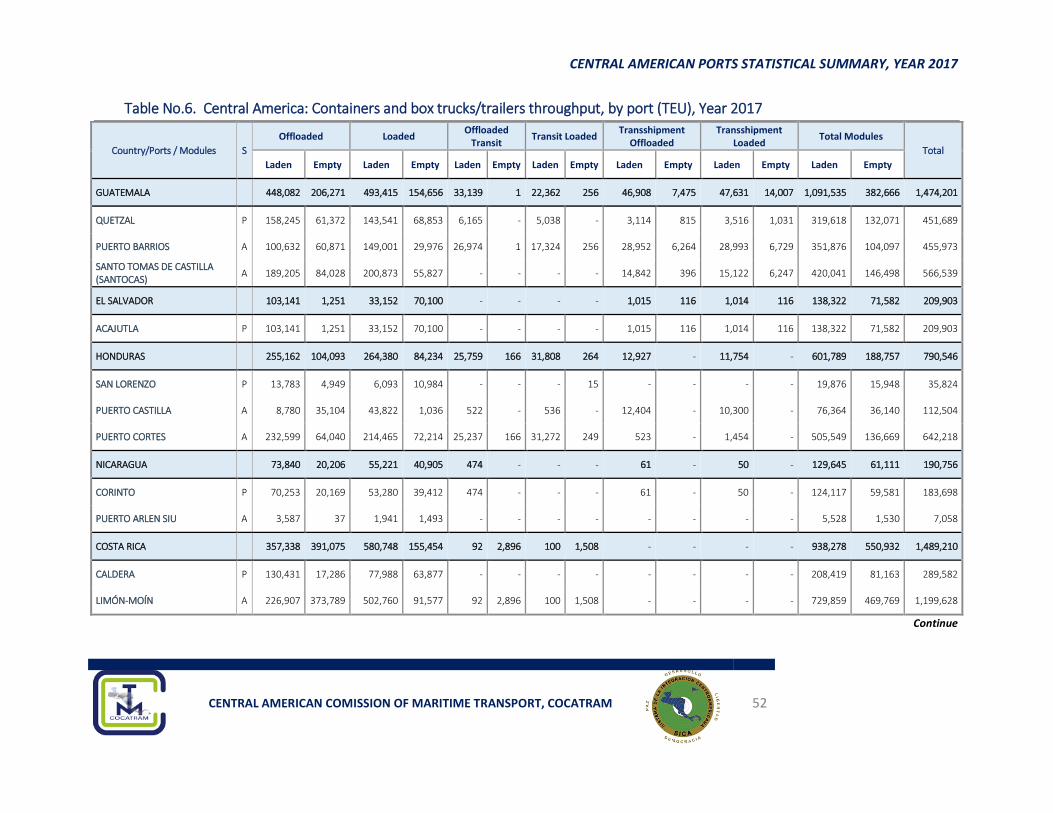
CENTRAL AMERICAN PORTS STATISTICAL SUMMARY, YEAR 2017
CENTRAL AMERICAN COMISSION OF MARITIME TRANSPORT, COCATRAM 52
15 Table No.6. Central America: Containers and box trucks/trailers throughput, by port (TEU), Year 2017
Country/Ports / Modules S
Offloaded Loaded Offloaded
Transit Transit Loaded
Transshipment Offloaded
Transshipment Loaded
Total Modules
Total
Laden Empty Laden Empty Laden Empty Laden Empty Laden Empty Laden Empty Laden Empty
GUATEMALA 448,082 206,271 493,415 154,656 33,139 1 22,362 256 46,908 7,475 47,631 14,007 1,091,535 382,666 1,474,201
QUETZAL P 158,245 61,372 143,541 68,853 6,165 - 5,038 - 3,114 815 3,516 1,031 319,618 132,071 451,689
PUERTO BARRIOS A 100,632 60,871 149,001 29,976 26,974 1 17,324 256 28,952 6,264 28,993 6,729 351,876 104,097 455,973
SANTO TOMAS DE CASTILLA (SANTOCAS)
A 189,205 84,028 200,873 55,827 - - - - 14,842 396 15,122 6,247 420,041 146,498 566,539
EL SALVADOR 103,141 1,251 33,152 70,100 - - - - 1,015 116 1,014 116 138,322 71,582 209,903
ACAJUTLA P 103,141 1,251 33,152 70,100 - - - - 1,015 116 1,014 116 138,322 71,582 209,903
HONDURAS 255,162 104,093 264,380 84,234 25,759 166 31,808 264 12,927 - 11,754 - 601,789 188,757 790,546
SAN LORENZO P 13,783 4,949 6,093 10,984 - - - 15 - - - - 19,876 15,948 35,824
PUERTO CASTILLA A 8,780 35,104 43,822 1,036 522 - 536 - 12,404 - 10,300 - 76,364 36,140 112,504
PUERTO CORTES A 232,599 64,040 214,465 72,214 25,237 166 31,272 249 523 - 1,454 - 505,549 136,669 642,218
NICARAGUA 73,840 20,206 55,221 40,905 474 - - - 61 - 50 - 129,645 61,111 190,756
CORINTO P 70,253 20,169 53,280 39,412 474 - - - 61 - 50 - 124,117 59,581 183,698
PUERTO ARLEN SIU A 3,587 37 1,941 1,493 - - - - - - - - 5,528 1,530 7,058
COSTA RICA 357,338 391,075 580,748 155,454 92 2,896 100 1,508 - - - - 938,278 550,932 1,489,210
CALDERA P 130,431 17,286 77,988 63,877 - - - - - - - - 208,419 81,163 289,582
LIMÓN-MOÍN A 226,907 373,789 502,760 91,577 92 2,896 100 1,508 - - - - 729,859 469,769 1,199,628
Continue
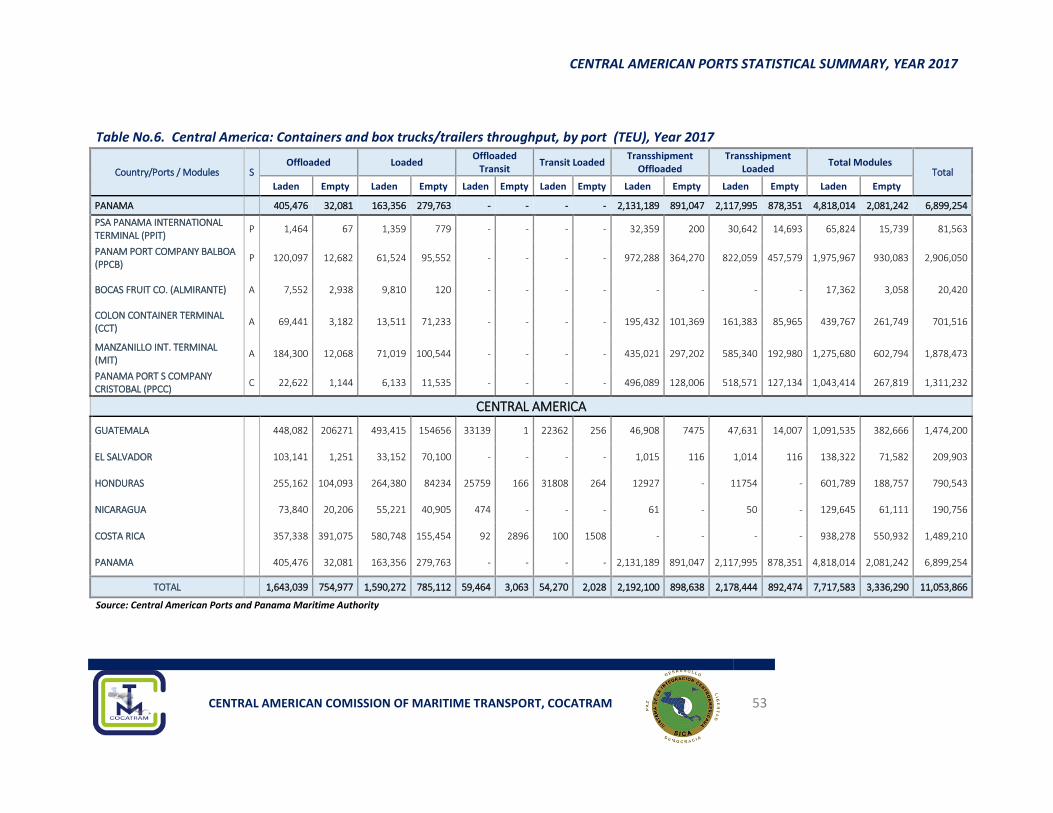
CENTRAL AMERICAN PORTS STATISTICAL SUMMARY, YEAR 2017
CENTRAL AMERICAN COMISSION OF MARITIME TRANSPORT, COCATRAM 53
Table No.6. Central America: Containers and box trucks/trailers throughput, by port (TEU), Year 2017
Country/Ports / Modules S Offloaded Loaded
Offloaded Transit
Transit Loaded Transshipment
Offloaded Transshipment
Loaded Total Modules
Total
Laden Empty Laden Empty Laden Empty Laden Empty Laden Empty Laden Empty Laden Empty
PANAMA 405,476 32,081 163,356 279,763 - - - - 2,131,189 891,047 2,117,995 878,351 4,818,014 2,081,242 6,899,254
PSA PANAMA INTERNATIONAL TERMINAL (PPIT)
P 1,464 67 1,359 779 - - - - 32,359 200 30,642 14,693 65,824 15,739 81,563
PANAM PORT COMPANY BALBOA (PPCB)
P 120,097 12,682 61,524 95,552 - - - - 972,288 364,270 822,059 457,579 1,975,967 930,083 2,906,050
BOCAS FRUIT CO. (ALMIRANTE) A 7,552 2,938 9,810 120 - - - - - - - - 17,362 3,058 20,420
COLON CONTAINER TERMINAL (CCT)
A 69,441 3,182 13,511 71,233 - - - - 195,432 101,369 161,383 85,965 439,767 261,749 701,516
MANZANILLO INT. TERMINAL (MIT)
A 184,300 12,068 71,019 100,544 - - - - 435,021 297,202 585,340 192,980 1,275,680 602,794 1,878,473
PANAMA PORT S COMPANY CRISTOBAL (PPCC)
C 22,622 1,144 6,133 11,535 - - - - 496,089 128,006 518,571 127,134 1,043,414 267,819 1,311,232
CENTRAL AMERICA
GUATEMALA 448,082 206271 493,415 154656 33139 1 22362 256 46,908 7475 47,631 14,007 1,091,535 382,666 1,474,200
EL SALVADOR 103,141 1,251 33,152 70,100 - - - - 1,015 116 1,014 116 138,322 71,582 209,903
HONDURAS 255,162 104,093 264,380 84234 25759 166 31808 264 12927 - 11754 - 601,789 188,757 790,543
NICARAGUA 73,840 20,206 55,221 40,905 474 - - - 61 - 50 - 129,645 61,111 190,756
COSTA RICA 357,338 391,075 580,748 155,454 92 2896 100 1508 - - - - 938,278 550,932 1,489,210
PANAMA 405,476 32,081 163,356 279,763 - - - - 2,131,189 891,047 2,117,995 878,351 4,818,014 2,081,242 6,899,254
TOTAL 1,643,039 754,977 1,590,272 785,112 59,464 3,063 54,270 2,028 2,192,100 898,638 2,178,444 892,474 7,717,583 3,336,290 11,053,866
Source: Central American Ports and Panama Maritime Authority
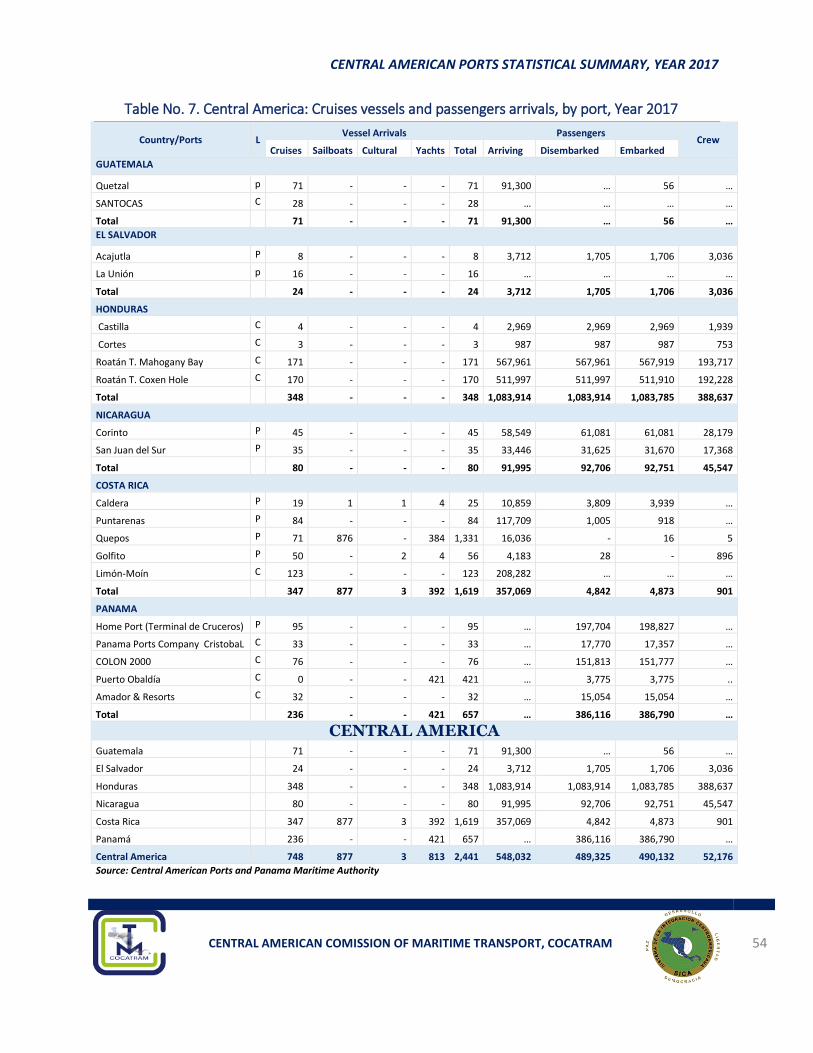
CENTRAL AMERICAN PORTS STATISTICAL SUMMARY, YEAR 2017
CENTRAL AMERICAN COMISSION OF MARITIME TRANSPORT, COCATRAM 54
16 Table No. 7. Central America: Cruises vessels and passengers arrivals, by port, Year 2017
Country/Ports L Vessel Arrivals Passengers
Crew Cruises Sailboats Cultural Yachts Total Arriving Disembarked Embarked
GUATEMALA
Quetzal p 71 - - - 71 91,300 … 56 …
SANTOCAS C 28 - - - 28 … … … …
Total 71 - - - 71 91,300 … 56 …
EL SALVADOR
Acajutla P 8 - - - 8 3,712 1,705 1,706 3,036
La Unión p 16 - - - 16 … … … …
Total 24 - - - 24 3,712 1,705 1,706 3,036
HONDURAS
Castilla C 4 - - - 4 2,969 2,969 2,969 1,939
Cortes C 3 - - - 3 987 987 987 753
Roatán T. Mahogany Bay C 171 - - - 171 567,961 567,961 567,919 193,717
Roatán T. Coxen Hole C 170 - - - 170 511,997 511,997 511,910 192,228
Total 348 - - - 348 1,083,914 1,083,914 1,083,785 388,637
NICARAGUA
Corinto P 45 - - - 45 58,549 61,081 61,081 28,179
San Juan del Sur P 35 - - - 35 33,446 31,625 31,670 17,368
Total 80 - - - 80 91,995 92,706 92,751 45,547
COSTA RICA
Caldera P 19 1 1 4 25 10,859 3,809 3,939 …
Puntarenas P 84 - - - 84 117,709 1,005 918 …
Quepos P 71 876 - 384 1,331 16,036 - 16 5
Golfito P 50 - 2 4 56 4,183 28 - 896
Limón-Moín C 123 - - - 123 208,282 … … …
Total 347 877 3 392 1,619 357,069 4,842 4,873 901
PANAMA
Home Port (Terminal de Cruceros) P 95 - - - 95 … 197,704 198,827 …
Panama Ports Company CristobaL C 33 - - - 33 … 17,770 17,357 …
COLON 2000 C 76 - - - 76 … 151,813 151,777 …
Puerto Obaldía C 0 - - 421 421 … 3,775 3,775 ..
Amador & Resorts C 32 - - - 32 … 15,054 15,054 …
Total 236 - - 421 657 … 386,116 386,790 …
CENTRAL AMERICA Guatemala 71 - - - 71 91,300 … 56 …
El Salvador 24 - - - 24 3,712 1,705 1,706 3,036
Honduras 348 - - - 348 1,083,914 1,083,914 1,083,785 388,637
Nicaragua 80 - - - 80 91,995 92,706 92,751 45,547
Costa Rica 347 877 3 392 1,619 357,069 4,842 4,873 901
Panamá 236 - - 421 657 … 386,116 386,790 …
Central America 748 877 3 813 2,441 548,032 489,325 490,132 52,176
Source: Central American Ports and Panama Maritime Authority
CENTRAL AMERICAN PORTS STATISTICAL SUMMARY, YEAR 2017
CENTRAL AMERICAN COMISSION OF MARITIME TRANSPORT, COCATRAM 55
Glosary of Terms
Arrival: Coming of a vessel at a port to load or offload cargo or passengers or to avoid some
danger.
Docking: To bring (a ship or boat) into a dock or berth.
Box/Trailer: Large transport vehicle with a box or structure for moving cargo on wheels and
without its own means of propulsion and designed to be towed by a truck or tractor.
Cargo: Shipment or effects and merchandise to be transported from one port to another that is
loaded and stowed on a vessel.
Coast: The line or zone where the land meets the sea or some other large expanse of water.
Coastal Traffic Port: A port used for commercial operations between national ports.
Containership: Specialized vessel transporting containers.
Container: Box or structure specially built to move cargo with a re-usable character where
merchandise is packed and transported from point-to-point as a unit and is loaded and
offloaded with a crane.
Containerized Cargo: Cargo loaded and offloaded in containers.
Conventional Vessel: Non specialized ship that mainly transports general cargo and
occasionally transports other types of cargo.
Crew: Traveler on board a vessel or aircraft that carries out activities directly related to the
operation, administration, maintenance, and services of it.
Cruise Ship: Vessel for international crossings with passengers lodged on board participating
in a group program and with temporary stopovers at one or more different ports. During the
crossing, the vessel does not normally take on or disembark other passengers, nor load or
offload any cargo.
Cruise Terminal: Port facility dedicated to attend cruise ships and their passengers.
Draught: Draft. It is the submerged depth of a vessel in the water. In a port, it is the height of
the water surface over the bottom.
Foreign Trade: Exchange of goods across maritime transportation mode from one country to
another.
General Cargo: Cargo in solid, liquid or gaseous form that is packed or not packed and that can
be treated as a unit and is loaded or offloaded using a crane.
CENTRAL AMERICAN PORTS STATISTICAL SUMMARY, YEAR 2017
CENTRAL AMERICAN COMISSION OF MARITIME TRANSPORT, COCATRAM 56
Intermodal Transport: Uses at least two modes of transport and there is no single responsibility
to the user who can take action against one or another of the transporters.
Lift on Lift off (Lo–Lo): Loading or offloading cargo with a crane.
Liquid Bulk Cargo: Liquid cargo loaded or offloaded using pipes and/or hoses.
Liquid Bulk Vessel: Specialized vessel for the transport of liquid products like chemicals,
mineral oil and vegetable oil.
Liquefied Natural Gas Carrier: Specialized vessel for the transport of liquid gas.
Loading: Action of taking the merchandise from land onto the vessel.
Maritime Port: Set of land, maritime waters and facilities on the sea shore having the natural or
artificial physical conditions and organization for carrying out port traffic operations used by
the competent administration for carrying out these activities.
Metric tons: A unit of mass equal to 1,000 kg (2,205 pounds).
Multimodal Transport: A single contract and responsibility for the carriage of goods by at least
two different modes of transport.
National Port System: The set of natural and legal persons, goods, infrastructure, ports,
terminals, and port facilities (public and/or private) that is located in the territory of a country.
Offloading: Action of taking the merchandise from a vessel to land. It also applies to persons.
Oil Tanker: A merchant vessel designed exclusively for the bulk transport of oil.
Oil Terminal: Maritime port facility dedicated mostly to throughput products related to the
petroleum industry.
Other Cargo: Cargo not classified in the other definitions and does not represent a significant
volume.
Passenger: A person traveling on a vessel that is not part of the crew.
Port: Geographic and economic unit of a locality with land or water-based natural or artificial
infrastructure and facilities for the carrying out of port activities.
Port Operations: The entry, leaving, anchoring, casting off, mooring, unmooring and stay of
vessels in the territory of a port.
Port Terminal: Operative units of a port designed to propitiate modal exchange and port
services which includes the infrastructure, temporary deposits, and internal transport routes.
Reefer Vessel: Ship conditioned for the transport of merchandise in storerooms with low
temperatures for preserving it.
CENTRAL AMERICAN PORTS STATISTICAL SUMMARY, YEAR 2017
CENTRAL AMERICAN COMISSION OF MARITIME TRANSPORT, COCATRAM 57
Roll on roll off (Ro –Ro): Operation of transfer on wheels.
Ro-Ro Cargo: Cargo that is loaded or offloaded on a rolling surface by highway vehicles,
trailers or box/trailer on their own wheels or wheels added for this purpose using a maritime-
overland transport ramp.
Ro-Ro Vessel: Ship designed for transport of box/trailers and vehicles loaded and offloaded
using a maritime-overland transport ramp.
Solid Bulk Cargo: Solid material loaded directly into the cargo spaces of a ship without any
intermediate form of containment or packing and is loaded or offloaded with a crane or in
combination with conveyors.
Solid Bulk Vessel: Specialized vessel for the transport of solid bulk products.
Terminal: Facility established in or outside of a port made up by infrastructure, facilities and
surfaces included in its water zone that allows for the full carrying out of port operations.
TEU: Normalized unit based on a 20-foot long ISO container (6.10 meters) that is used as a
statistical measure of traffic flows or capacities. A normalized 40-foot Series 1 ISO container is
equivalent to 2 TEU. Mobile boxes less than 20 feet correspond to 0.75 TEU, those longer than 20
but shorter than 40 feet are 1.5 TEU, and those longer than 40 feet are 2.25 TEU.
Transit: Goods onboard, which upon their arrival at a certain port are to be offloaded at port,
loaded in another transportation mode and ending outside the country borders.
Transshipping: Comprises the transfer of offloaded containers and box/trailers from a ship and
then loaded on a different vessel. However, in those places where geography or infrastructure
allow it, this operation can be complemented by another overland transport mode (e.g. railroad)
that will move the cargo to another port that is sometimes a long distance from the first, in
order to be shipped further.
Type of Cargo: Segment of merchandise moved at ports according to its form and physical
characteristics (General, Containerized, Ro-Ro, Bulk Liquid, Bulk Solid, Others).
CENTRAL AMERICAN PORTS STATISTICAL SUMMARY, YEAR 2017
CENTRAL AMERICAN COMISSION OF MARITIME TRANSPORT, COCATRAM 58