Embed Size (px)
Citation preview
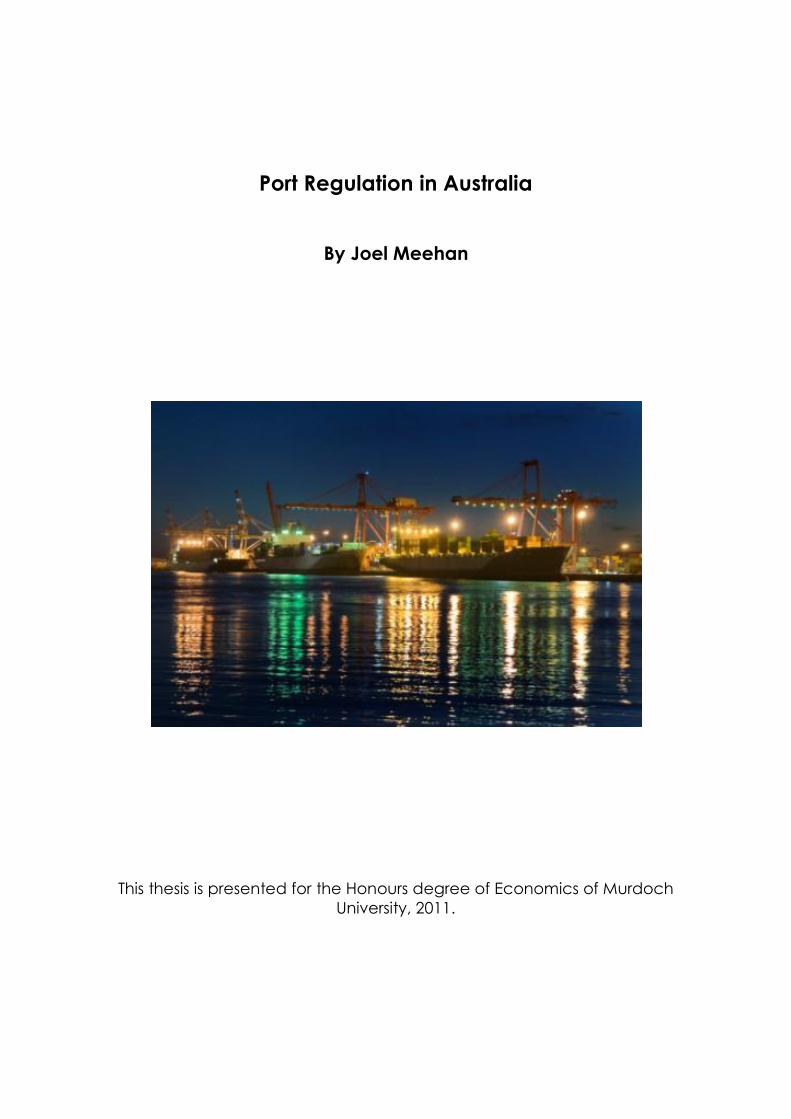
Port Regulation in Australia
By Joel Meehan
This thesis is presented for the Honours degree of Economics of Murdoch
University, 2011.
i
Abstract
As an island nation, Australia is heavily dependent on its ports. Ports are essential
infrastructure, acting as a gateway connecting domestic and international markets. However,
the resources boom has highlighted significant bottlenecks in the supply chain. Port
regulation has at times been criticised for impeding port development and investment. There
are concerns that the level of investment in port infrastructure in Australia is insufficient to
sustain the increase in trade we will see in the future. It therefore seems an appropriate time
to review port regulation in Australia. This paper seeks to analyse the existing port regulatory
framework against a theoretical backdrop. By considering the theories of competition,
equilibrium, market failure and regulation, it is hoped an assessment of the current regime
can be made.
Front Cover: North Quay at night, Fremantle Port. Source: Fremantle Ports.

ii
Declaration
This thesis contains no material that has been accepted for the award of any other degree at
any other University. This thesis is the result of my own research. It contains no material
written or published by another person, accept where due reference is given in the text.
Joel Meehan

iii
Acknowledgements
I would firstly like to thank my supervisor, Malcolm Tull for agreeing to supervise my
research. Malcolm has always made time for me, despite his busy schedule. I am very
grateful to have had a supervisor who shares a similar interest in maritime economics. I have
benefited greatly from Malcolm‟s comprehensive knowledge of ports, port regulation and
Australian maritime history.
Secondly I would like to thank my family. I truly appreciate the interest they have taken in
my Honours studies, and the encouragement they have given me along the way. I am
particularly grateful to my Mum, whose dining room table often disappeared under
mountains of my books and notes.
Finally I would to thank my girlfriend for her encouragement and understanding over the last
year, and also for her help with editing my final draft.
iv
Table of Contents
1 Introduction ............................................................................................................... 1 1.1 The Role of Ports.......................................................................................................... 1 1.2 Overview of Australia’s Maritime Industry .................................................................... 3 1.3 Justification for Research ............................................................................................. 4 1.4 Outline of Thesis .......................................................................................................... 5
2 Literature Review ....................................................................................................... 8 2.1 The Competitive Market .............................................................................................. 8
2.1.1 Introduction ...................................................................................................................... 8 2.1.2 Desirability of the Competitive Outcome ....................................................................... 10 2.1.3 The ‘Classical’ View ......................................................................................................... 11 2.1.4 Partial Equilibrium Analysis ............................................................................................. 11 2.1.5 General Equilibrium Analysis .......................................................................................... 13 2.1.6 Pareto Optimality ............................................................................................................ 16
2.2 Market Failure ........................................................................................................... 21 2.2.1 The Concept of Market Failure ....................................................................................... 21 2.2.2 Public Goods .................................................................................................................... 23 2.2.3 Imperfect Competition .................................................................................................... 28 2.2.4 Natural Monopoly ........................................................................................................... 31 2.2.5 Government Failure ........................................................................................................ 34
2.3 The Potential Role for Government ............................................................................ 35 2.3.1 Competition Policy .......................................................................................................... 36 2.3.2 Characteristics of Good Regulation ................................................................................. 37 2.3.3 Price Regulation .............................................................................................................. 39 2.3.4 Criticisms of Regulation Generally .................................................................................. 43
2.4 Conclusion ................................................................................................................. 44
3 Port Regulation in Australia ..................................................................................... 47 3.1 Background ............................................................................................................... 47 3.2 Western Australia ...................................................................................................... 50 3.3 Northern Territory ..................................................................................................... 52
3.3.1 Price and Access Regulation ............................................................................................ 53 3.4 South Australia .......................................................................................................... 53
3.4.1 Price Regulation .............................................................................................................. 55 3.4.2 Access Regime ................................................................................................................. 56
3.5 Victoria ...................................................................................................................... 57 3.5.1 Price Regulation .............................................................................................................. 58 3.5.2 Access Regime ................................................................................................................. 60
3.6 Queensland ............................................................................................................... 61 3.6.1 Price Regulation .............................................................................................................. 61 3.6.2 Access Regime ................................................................................................................. 61
3.7 New South Wales ....................................................................................................... 63 3.7.1 Price and Access Regulation ............................................................................................ 63
3.8 Tasmania ................................................................................................................... 64 3.8.1 Price and Access Regulation ............................................................................................ 64
3.9 Commonwealth ......................................................................................................... 65 3.9.1 National Access Regime .................................................................................................. 65 3.9.2 Price Surveillance ............................................................................................................ 67 3.9.3 Anti-Competitive Conduct ............................................................................................... 67
3.10 Summary ................................................................................................................... 67

v
3.11 Conclusion ................................................................................................................. 69
4 Case Study: Flinders Ports ........................................................................................ 71 4.1 Introduction .............................................................................................................. 71 4.2 Background ............................................................................................................... 73 4.3 Port Performance Indicators....................................................................................... 75
4.3.1 Financial Indicators ......................................................................................................... 76 4.3.2 Non-Financial Indicators ................................................................................................. 82
4.4 Conclusion ................................................................................................................. 87
5 Conclusion ................................................................................................................ 90 5.1 Summary of Findings .................................................................................................. 90 5.2 The Way Forward ....................................................................................................... 93
Appendix 1: Map of Australian Ports............................................................................... 97
vi
Table of Diagrams and Tables
Diagram 1: Partial Equilibrium ................................................................................................. 12
Diagram 2: Production Possibilities Frontier ........................................................................... 14
Diagram 3: Utility Maximisation .............................................................................................. 15
Diagram 4: Efficiency in a Single Market ................................................................................. 16
Diagram 5: Edgeworth Box Diagram - Efficient Consumption ................................................. 17
Diagram 6: Product Mix Efficiency ........................................................................................... 19
Diagram 7: Private Provision of Public Goods ......................................................................... 26
Diagram 8: Efficient Supply of a Public Good .......................................................................... 27
Diagram 9: Imperfect Competition .......................................................................................... 29
Diagram 10: Monopoly ............................................................................................................ 30
Diagram 11: Cost Subadditivity ................................................................................................ 33
Diagram 12: Natural Monopoly ............................................................................................... 40
Diagram 13: Flinders Ports Pty Ltd Shareholdings ................................................................... 73
Diagram 14: Flinders Ports - Throughput (million tonnes) ...................................................... 74
Diagram 15: Movement of Cumulative Average EMS Charges Relative to 2004-05 ............... 81
Diagram 16: Crane Rate for Five Ports - Containers per hour ................................................. 84
Table 1: Summary of Regulatory Frameworks by Jurisdiction ................................................ 68
Table 2: Flinders Ports Profit .................................................................................................... 76
Table 3: Flinders Ports Profit per Tonne .................................................................................. 77
Table 4: Flinders Ports Return on Assets ................................................................................. 78
Table 5: Flinders Ports Dividend Payout Ratio ......................................................................... 79
Table 7: Ship Turnaround Times (hours) - Adelaide, Melbourne Fremantle ........................... 86
Table 8: Quarterly Crane Rates (lifts per hour) - Adelaide, Melbourne, Fremantle ................ 86
1
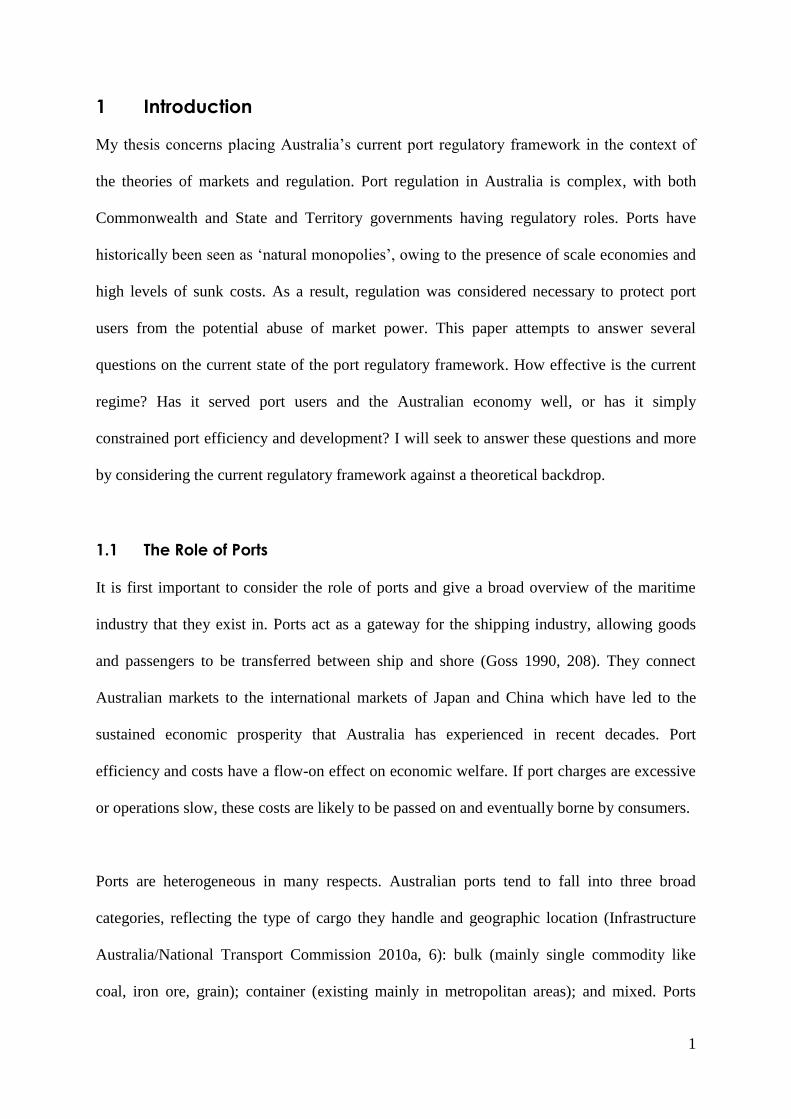
1 Introduction
My thesis concerns placing Australia‟s current port regulatory framework in the context of
the theories of markets and regulation. Port regulation in Australia is complex, with both
Commonwealth and State and Territory governments having regulatory roles. Ports have
historically been seen as „natural monopolies‟, owing to the presence of scale economies and
high levels of sunk costs. As a result, regulation was considered necessary to protect port
users from the potential abuse of market power. This paper attempts to answer several
questions on the current state of the port regulatory framework. How effective is the current
regime? Has it served port users and the Australian economy well, or has it simply
constrained port efficiency and development? I will seek to answer these questions and more
by considering the current regulatory framework against a theoretical backdrop.
1.1 The Role of Ports
It is first important to consider the role of ports and give a broad overview of the maritime
industry that they exist in. Ports act as a gateway for the shipping industry, allowing goods
and passengers to be transferred between ship and shore (Goss 1990, 208). They connect
Australian markets to the international markets of Japan and China which have led to the
sustained economic prosperity that Australia has experienced in recent decades. Port
efficiency and costs have a flow-on effect on economic welfare. If port charges are excessive
or operations slow, these costs are likely to be passed on and eventually borne by consumers.
Ports are heterogeneous in many respects. Australian ports tend to fall into three broad
categories, reflecting the type of cargo they handle and geographic location (Infrastructure
Australia/National Transport Commission 2010a, 6): bulk (mainly single commodity like
coal, iron ore, grain); container (existing mainly in metropolitan areas); and mixed. Ports

2
provide a wide range of services including stevedoring and storage facilities, pilotage and
towage as well as freight forwarding. In Australia, many of these services are contracted out
to the private sector. The users of port services are just as varied, and include those who use
the port as part of the transportation process, including shipping lines, railroads, trucking
firms and shippers (Cullinane and Talley 2006, 1).
Unlike other nations such as the United Kingdom and New Zealand, Australia‟s ports are still
predominantly government owned and operated. Australian governments have consistently
rejected privatisation in favour of sustained commercialisation (Tull and Affleck 2008, 2).
Nevertheless, governments have reduced their direct role in ports and other public utilities
since the introduction of the Commonwealth government‟s micro-economic reform agenda in
the late 1980‟s (Tull and Affleck 2008, 4). Australian port authorities have typically adopted
a „landlord‟ style of port management: where port authorities are responsible for land
management and development issues, while the more contestable services are contracted out
to the private sector (Productivity Commission 1999, xvii).1 One of the potential reasons for
government provision of some port services is that some have the properties of „public goods‟
(Trujillo and Nombella 1999, 13). Public goods are said to be non-rival and/or non-
excludable in consumption.2
Basic port infrastructure tends to possess the non-rival
characteristic: deep water channels, breakwaters, buoys, lights and other navigational aids all
have this characteristic (Trujillo and Nombella 1999, 54). By contrast, wharf and container
use, as well as use of pilots and tugs are examples of excludable port services. These
excludable services are „private goods‟ and are said to be „contestable‟ in the market. In
Australia, these contestable services are typically provided by the private sector.
1 Chapter 2 will discuss why this is so. The arguments for government intervention in the supply of port services hinge primarily on the
concepts of „public goods‟ and „natural monopoly‟. 2 Non-rival goods are not „used up‟ in consumption by one person, since one person‟s consumption does not restrict the consumption of another (Samuelson 1955, 387; Oakland 1987, 485).
3
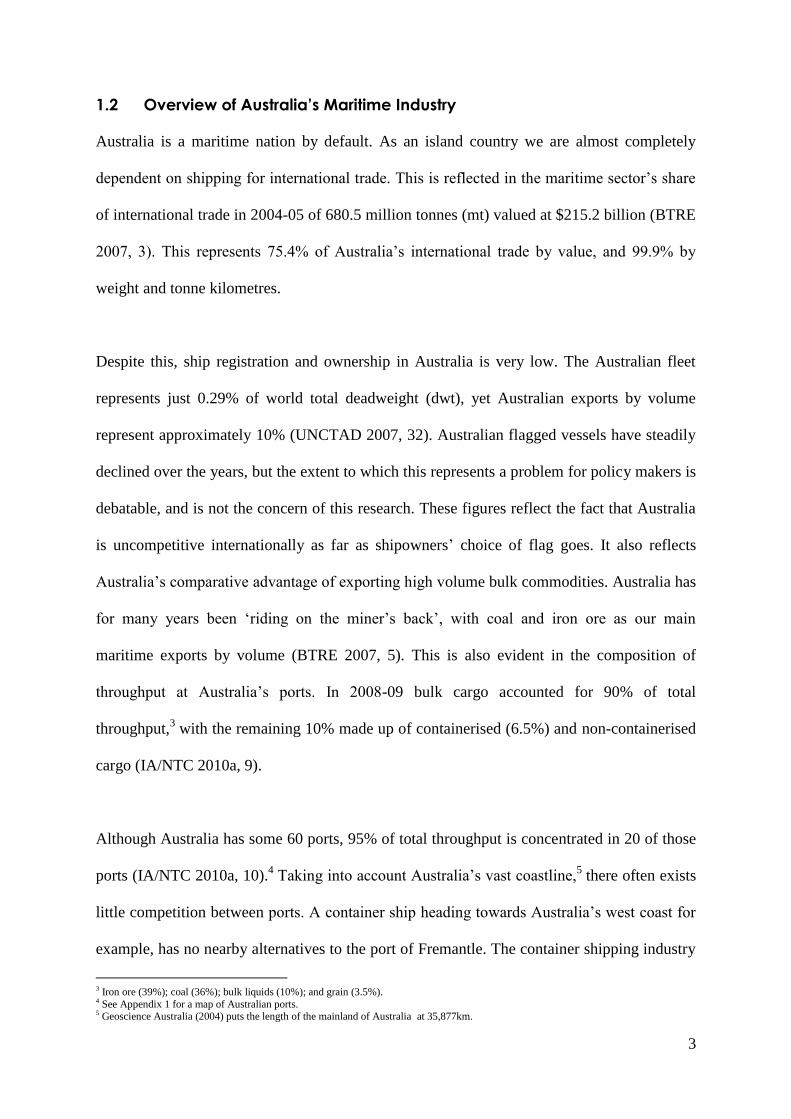
1.2 Overview of Australia’s Maritime Industry
Australia is a maritime nation by default. As an island country we are almost completely
dependent on shipping for international trade. This is reflected in the maritime sector‟s share
of international trade in 2004-05 of 680.5 million tonnes (mt) valued at $215.2 billion (BTRE
2007, 3). This represents 75.4% of Australia‟s international trade by value, and 99.9% by
weight and tonne kilometres.
Despite this, ship registration and ownership in Australia is very low. The Australian fleet
represents just 0.29% of world total deadweight (dwt), yet Australian exports by volume
represent approximately 10% (UNCTAD 2007, 32). Australian flagged vessels have steadily
declined over the years, but the extent to which this represents a problem for policy makers is
debatable, and is not the concern of this research. These figures reflect the fact that Australia
is uncompetitive internationally as far as shipowners‟ choice of flag goes. It also reflects
Australia‟s comparative advantage of exporting high volume bulk commodities. Australia has
for many years been „riding on the miner‟s back‟, with coal and iron ore as our main
maritime exports by volume (BTRE 2007, 5). This is also evident in the composition of
throughput at Australia‟s ports. In 2008-09 bulk cargo accounted for 90% of total
throughput,3 with the remaining 10% made up of containerised (6.5%) and non-containerised
cargo (IA/NTC 2010a, 9).
Although Australia has some 60 ports, 95% of total throughput is concentrated in 20 of those
ports (IA/NTC 2010a, 10).4 Taking into account Australia‟s vast coastline,
5 there often exists
little competition between ports. A container ship heading towards Australia‟s west coast for
example, has no nearby alternatives to the port of Fremantle. The container shipping industry
3 Iron ore (39%); coal (36%); bulk liquids (10%); and grain (3.5%). 4 See Appendix 1 for a map of Australian ports. 5 Geoscience Australia (2004) puts the length of the mainland of Australia at 35,877km.

4
too, is becoming more concentrated, leading to port competitiveness being a contentious topic
(Cullinane and Talley 2006, 6). The Productivity Commission (1998, xv-xvi) found that
Australia‟s „thin‟ trade volumes are insufficient to sustain a large number of ports that could
still provide a high level of service.6 The study also noted that diseconomies may arise since a
port must have sufficient capacity to provide adequate service in periods of high demand; but
due to the relatively higher volatility of Australia‟s shipping trade, there is greater potential
for that capacity to remain idle at other times (Productivity Commission 1998, xv).
Australia‟s maritime industry clearly is disadvantaged relative to some other countries in that
it cannot sustain a high level of inter-port competition. Given that competition is a driver of
efficiency, there exists potential for ports and other actors‟ power. In recent years State and
Commonwealth governments have strived to increase the competitiveness of Australian ports.
However, Chapter 2 will show that intra-port competition (competition within individual
ports) can be supplied by allowing certain port services to be contestable in the market.
1.3 Justification for Research
This research is justified on a number of grounds. As was described above, ports are
extremely important for the Australian economy. Being an open island nation, it is essential
for Australian ports to operate efficiently. Port regulation is also important, since it can
directly affect port efficiency. Poor or unnecessarily burdensome regulation can impede the
operation of ports, and potentially flow on to the rest of the economy.
A number of factors have led to port regulation being at the forefront of debate in recent
years. Firstly, the mining boom has exposed significant bottlenecks in our supply and
logistics chains. It has been argued that regulatory red tape has hindered the port expansion
and investment necessary to meet these growing industry demands (Hepworth 2010).
6 In this sense „thin‟ refers to Australia‟s lower throughput compared to larger nations.
5
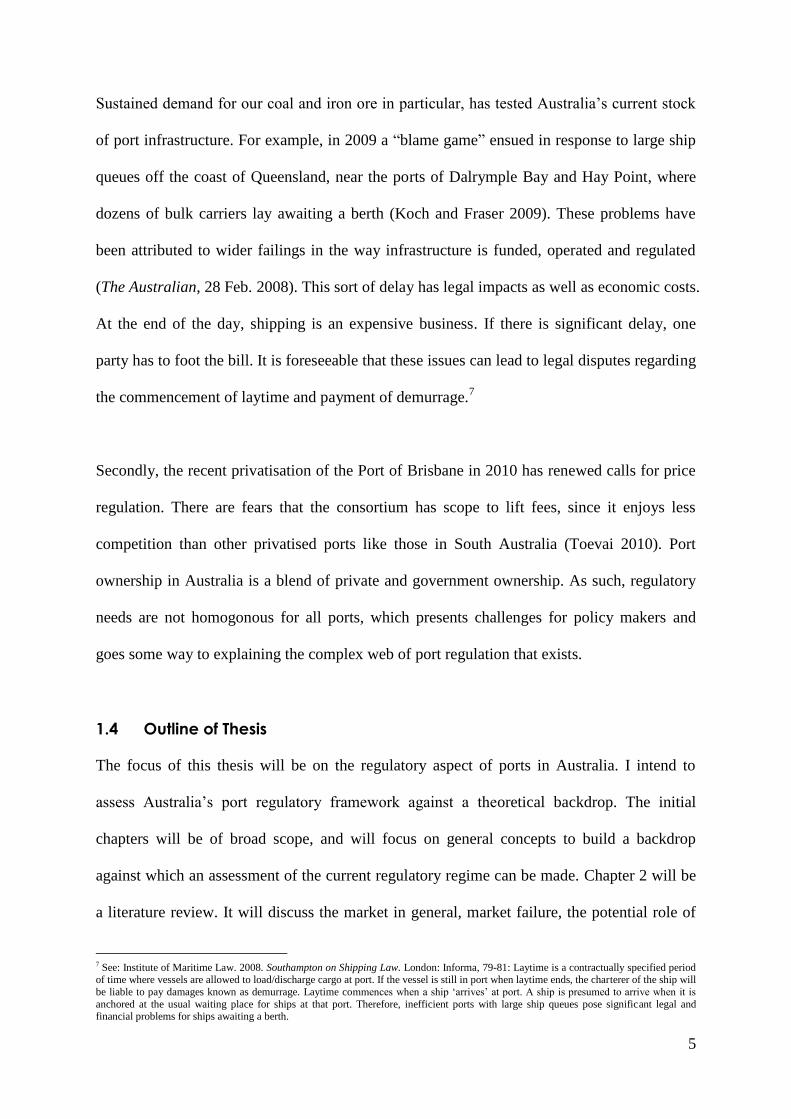
Sustained demand for our coal and iron ore in particular, has tested Australia‟s current stock
of port infrastructure. For example, in 2009 a “blame game” ensued in response to large ship
queues off the coast of Queensland, near the ports of Dalrymple Bay and Hay Point, where
dozens of bulk carriers lay awaiting a berth (Koch and Fraser 2009). These problems have
been attributed to wider failings in the way infrastructure is funded, operated and regulated
(The Australian, 28 Feb. 2008). This sort of delay has legal impacts as well as economic costs.
At the end of the day, shipping is an expensive business. If there is significant delay, one
party has to foot the bill. It is foreseeable that these issues can lead to legal disputes regarding
the commencement of laytime and payment of demurrage.7
Secondly, the recent privatisation of the Port of Brisbane in 2010 has renewed calls for price
regulation. There are fears that the consortium has scope to lift fees, since it enjoys less
competition than other privatised ports like those in South Australia (Toevai 2010). Port
ownership in Australia is a blend of private and government ownership. As such, regulatory
needs are not homogonous for all ports, which presents challenges for policy makers and
goes some way to explaining the complex web of port regulation that exists.
1.4 Outline of Thesis
The focus of this thesis will be on the regulatory aspect of ports in Australia. I intend to
assess Australia‟s port regulatory framework against a theoretical backdrop. The initial
chapters will be of broad scope, and will focus on general concepts to build a backdrop
against which an assessment of the current regulatory regime can be made. Chapter 2 will be
a literature review. It will discuss the market in general, market failure, the potential role of
7 See: Institute of Maritime Law. 2008. Southampton on Shipping Law. London: Informa, 79-81: Laytime is a contractually specified period of time where vessels are allowed to load/discharge cargo at port. If the vessel is still in port when laytime ends, the charterer of the ship will
be liable to pay damages known as demurrage. Laytime commences when a ship „arrives‟ at port. A ship is presumed to arrive when it is
anchored at the usual waiting place for ships at that port. Therefore, inefficient ports with large ship queues pose significant legal and financial problems for ships awaiting a berth.
6
government through competition policy and regulation, and also some problems associated
with regulation. The discussion of port regulation in Australia necessitates an understanding
of these concepts. The concepts introduced here will act as a yardstick, and will be drawn
upon in the later chapters.
Chapter 3 will analyse the current port regulatory framework in Australia. As noted above,
port regulation in Australia exists at State/Territory and Commonwealth levels. The
framework is complex, with regulation stemming from a number of legislative sources. This
chapter seeks to summarise the frameworks of each jurisdiction in order to compare and
assess them. Port regulation in Australia seeks to ensure equitable access to port
infrastructure and to protect consumers from the imposition of monopoly rents (Everett and
Robinson 2007, 1). The ratings given to each jurisdiction in the 2006 Access Economics
Scorecard of the Design of Economic Regulation of Infrastructure („Access Economics
scorecard‟) will also be considered as part of this analysis.
Chapter 4 will be a case study of Flinders Ports Pty Ltd, the owner of seven commercial ports
in South Australia including the port of Adelaide. The purpose of the case study is to discover
whether there have been efficiency gains from privatisation and who has benefited from them.
In essence, the discussion will focus on the extent to which port users have benefited from the
sale through lower prices and increased port efficiency.
Finally a conclusion will be presented. Here I will summarise the findings of this research
and offer some insight into the future of port regulation in Australia. In recent years there
have been calls for a single, national approach to regulation (see Everett 2006). It has been
suggested that doing so is already within the Commonwealth‟s legislative grasp, given the
7
expansive powers it has under the Constitution (Puig and Woods 2008, 790). It will be argued
that despite the regulatory regime‟s complexity, Australia‟s ports are not overregulated. The
current blend of Ministerial and independent regulation is adequate, and accurately reflects
the varied needs of Australia‟s jurisdictions.
8
2 Literature Review
The assessment of Australian port regulation that follows requires an understanding of the
theory behind regulation. Regulation is often justified where there is a market failure: where
market forces fail to generate an efficient allocation of resources. When markets fail, it
potentially establishes a role for government to step in and remedy the market outcome.
Understanding why markets fail first requires an understanding of markets themselves.
Analysing the efficiency and stability of the market mechanism is a necessary precursor to
understanding the causes of market failure and the potential role for government intervention.
2.1 The Competitive Market
2.1.1 Introduction
Perfect competition is said to prevail if there are a large number of buyers and sellers who are
perfectly informed about products and prices, and there are no barriers to entry or exit
(Neumann 2001, 6). The absence of power to control prices distinguishes the competitive
market from imperfect markets such as monopoly (Neumann 2001, 6). Given prevailing
prices, firms driven by self-interest produce a level of output that maximises profit. In the
long-run, prices cannot exceed the average costs of production. If they did, new firms would
be enticed into the market where prices would be competed down until profits disappeared.
This section will discuss the competitive market ideal and equilibrium theory. These concepts
are a necessary starting point upon which later discussion of market failure and the role for
government will build. The unfettered doctrine of laissez-faire will provide an initial insight
into market competition. A partial equilibrium analysis will then be presented as a simple
demonstration as to how equilibrium levels of output can be determined though the operation
of the price mechanism. From there I will consider the concept of general equilibrium. This
will lead to a discussion of the welfare properties of equilibrium. Here I will look at Walras‟
9
law and the conditions for Pareto efficiency. Finally some limitations on the theory of
efficient competition will be introduced.
The concepts introduced in this chapter describe the ideal market, and as such, are often
unrealistic. However, in order to consider the effects and consequences of market failure, and
the potential role for government, it is first necessary to understand what the market is
„failing‟ to do. This chapter will provide the theoretical backdrop against which Australia‟s
port regulatory framework can be assessed.
Although Pareto efficiency will be discussed in greater detail later (see 2.1.6), it is necessary
to provide a brief description of it here since it is relevant throughout the discussion that
follows. A Pareto efficient outcome is one where no agent can be made better off without
adversely affecting others (Abelson 2003, 42). Pareto optimality is clearly desirable from an
efficiency standpoint, but it is does not give a complete picture of the desirability of an
economic outcome. For example, it will be shown that where a market is characterised by a
natural monopoly, Pareto efficient pricing may be insufficient to cover the firms average
costs.
If a Pareto optimal outcome is undesirable for any reason like this, there becomes a problem
of what the „second best‟ alternative is for policy makers. In their seminal paper, Lipsey and
Lancaster (1956, 11-12) discussed the general theory of second best. The theory says that if
one of the Paretian conditions becomes unattainable, then the other conditions may no longer
be desirable outcomes. That is, a second best optimum can only be reached by departing from
all Paretian conditions. Lipsey and Lancaster (1956, 12) suggest that a situation where most
conditions can be met is not necessarily superior to a situation in which fewer conditions are
satisfied.
10
2.1.2 Desirability of the Competitive Outcome
Economists have long considered the competitive market to be an ideal institution, and the
concept has been developed over many centuries. The desirability of perfect competition is
based on a number of arguments that will become more evident later on. Essentially,
competitive pressures lead to an increase in economic welfare through lower prices, higher
levels of output and greater innovation. Abelson suggests three arguments for competitive
markets (2003, 39):
(i) voluntary market exchanges enable agents to act in their own best interest;
(ii) the market system of decentralised exchange is highly efficient, with prices
reflecting relative scarcities; and
(iii) competition promotes economic growth by rewarding risk-taking and technical
innovation.
This idea is formalised in the First Theorem of Welfare Economics (Abelson 2003, 39, 51),
which “provides the intellectual basis for the efficiency of markets”. The First Theorem states
that every equilibrium is an optimum, and every competitive equilibrium is Pareto efficient
(Starr 2007, 144). The First Theorem draws a relationship between the concepts of
competitive equilibria and Pareto optimality (Tan 2008, 2). Discussion of the First Theorem
is crucial, since it is the improvement of economic welfare that is the goal of economic
activity (Starr 2007, 143). With the First Theorem in mind, this next section will begin by
considering the concept of the market and competitive equilibrium.
11
2.1.3 The ‘Classical’ View
The laissez-faire doctrine of the classical school was based on the idea that a competitive
market within a suitable institutional framework was the best means to allocate an economy‟s
scarce resources (Sowell 1974, 17). This faith in the market mechanism is seen in Adam
Smith‟s The Wealth of Nations. For example, Smith believed that economic agents are
motivated by a desire for gain (Smith 1776, quoted in Campbell and Skinner 1982, 168):
By preferring the support of domestick [sic] to that of foreign industry, he intends only of his own
security; and by directing that industry in such a manner as its produce may be of the greatest value, he
intends only his own gain, and he is in this, as in many other cases, lead by an invisible hand to
promote and end which was no part of his intention (emphasis added).
One interpretation of this passage is that by “invoking the parable of the invisible hand”,
Smith had advanced a behavioural theory of the effect that self-interested individuals have on
resource allocation (Sowell 1974, 18). As a result, governments should remove any
impediments to individual activity (Campbell and Skinner 1982, 181).
2.1.4 Partial Equilibrium Analysis
Partial equilibrium refers to the adjustment of prices in a single market so that supply equals
demand (Starr 2007, 3). It is a simple way to see how the market mechanism equilibrates
supply and demand for a single good, keeping all other prices constant. Let P(x) represent the
price of good X. The supply and demand functions respectively are given by:
S(x) = S(x).P(x)
D(x) = D(x).P(x)
In equilibrium, there exists a price P* such that S(x).P(x) = D(x).P(x). That is, supply is equal
to demand at equilibrium price P*.
12
One of the earliest competitive equilibrium models is that of Alfred Marshall (1890), who
geometrically described partial equilibrium with the famous demand and supply curves
(Sharkey 1982, 29). Consider a market with a large number of buyers and sellers of a single
product (Sharkey 1982, 29-31). Each seller is assumed to have a marginal cost curve showing
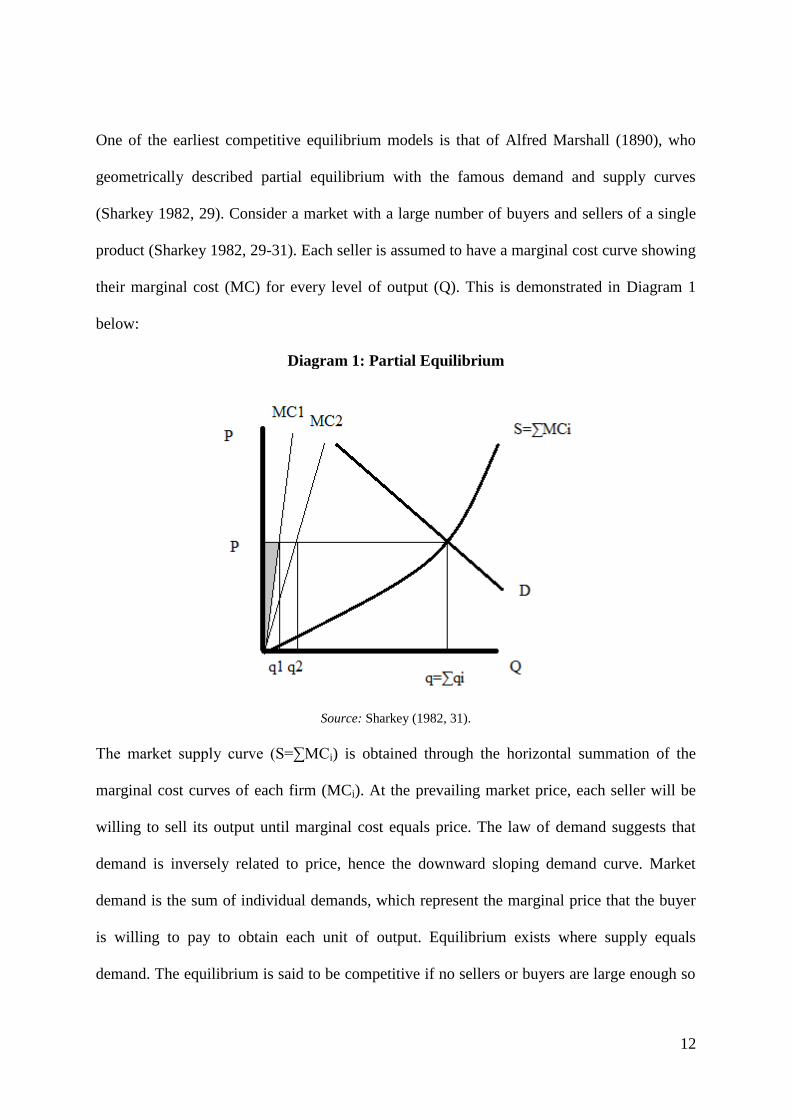
their marginal cost (MC) for every level of output (Q). This is demonstrated in Diagram 1
below:
Diagram 1: Partial Equilibrium
Source: Sharkey (1982, 31).
The market supply curve (S=∑MCi) is obtained through the horizontal summation of the
marginal cost curves of each firm (MCi). At the prevailing market price, each seller will be
willing to sell its output until marginal cost equals price. The law of demand suggests that
demand is inversely related to price, hence the downward sloping demand curve. Market
demand is the sum of individual demands, which represent the marginal price that the buyer
is willing to pay to obtain each unit of output. Equilibrium exists where supply equals
demand. The equilibrium is said to be competitive if no sellers or buyers are large enough so
13
as to affect the price (Sharkey 1982, 30): that is, buyers and sellers are assumed to be „price-
takers‟.
Partial equilibrium analysis is a useful tool for demonstrating how a competitive market
achieves equilibrium through the operation of price. It is limited however, since it is
unrealistic to simply assume that all other market prices are constant (Starr 1997, 17).
2.1.5 General Equilibrium Analysis
It was Walras who first formulated a general equilibrium model of the economy (Starr 1997,
4-7): he suggested that a general equilibrium exists where there is an array of prices such that
supply equals demand simultaneously for each good in the economy. That is:
Zi(p) ≤ 0, i = n
This is known as Walras‟ law. It suggests that equilibrium is defined by non-positive excess
demand (Zi) (Myles 1995, 26-7). Walras believed that the economy was always in
disequilibrium, but constantly undergoing the process of change (Walker 1996, 24). He
believed that prices changed repeatedly, leading to changes in the levels of supply and
demand (Walker 1996, 25). On the other hand, classical economists believed that equilibrium
was the normal state of affairs, and believed that disturbances from equilibrium levels of
output and employment were only temporary (Snowdon and Vane 2005, 37). They had faith
that the market mechanism would soon correct and restore the market to equilibrium. For
example, Adam Smith (1776, book 1, chap 7, para 4) called the equilibrium price the „natural
price‟. This natural price is the „central price‟, “to which the prices of all other commodities
are continually gravitating” (Smith 1776, book 1, chap 7, para 15).
14
For an equilibrium as stated above to be a „competitive equilibrium‟, three conditions must be
satisfied (Tan 2008, 2). The allocation and price system must be:
(i) feasible;
(ii) profit maximising for firms; and
(iii) utility maximising for households.
Firstly, an allocation is said to be feasible if xi ∈ Xi, for all consumers i, and yj ∈ Yj for all
firms j (Tan 2008, 2). Consider the production possibilities frontier (PPF) below:
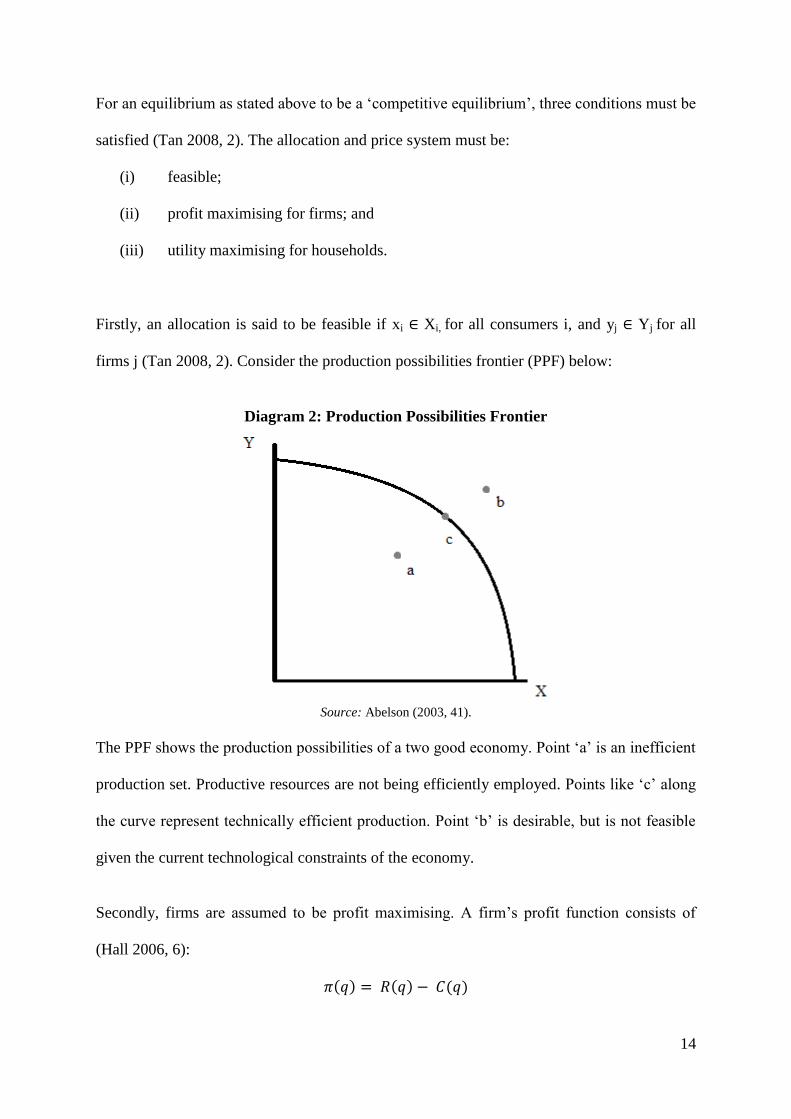
Diagram 2: Production Possibilities Frontier
Source: Abelson (2003, 41).
The PPF shows the production possibilities of a two good economy. Point „a‟ is an inefficient
production set. Productive resources are not being efficiently employed. Points like „c‟ along
the curve represent technically efficient production. Point „b‟ is desirable, but is not feasible
given the current technological constraints of the economy.
Secondly, firms are assumed to be profit maximising. A firm‟s profit function consists of
(Hall 2006, 6):
15
At any given level of output q, a firm‟s profit is the difference between revenue and cost.
Profits are maximised when the slope of the profit function (the first-order derivative) is
equal to zero (Hall 2006, 7):
Since the slope of the revenue function is marginal revenue (MR) and the slope of the cost
function is marginal cost (MC), this implies that profits are maximised where MR = MC
(Chiang 1984, 147). Given the price taking assumption, firms face a horizontal demand curve
so that demand is equal to marginal revenue (D = MR). Therefore, firms will maximise profit
where the price is equal to the marginal cost of producing the output, or P = MC.
Thirdly, consumers are assumed to make consumption choices that maximise their economic
welfare. Again, this is best illustrated with a diagram:
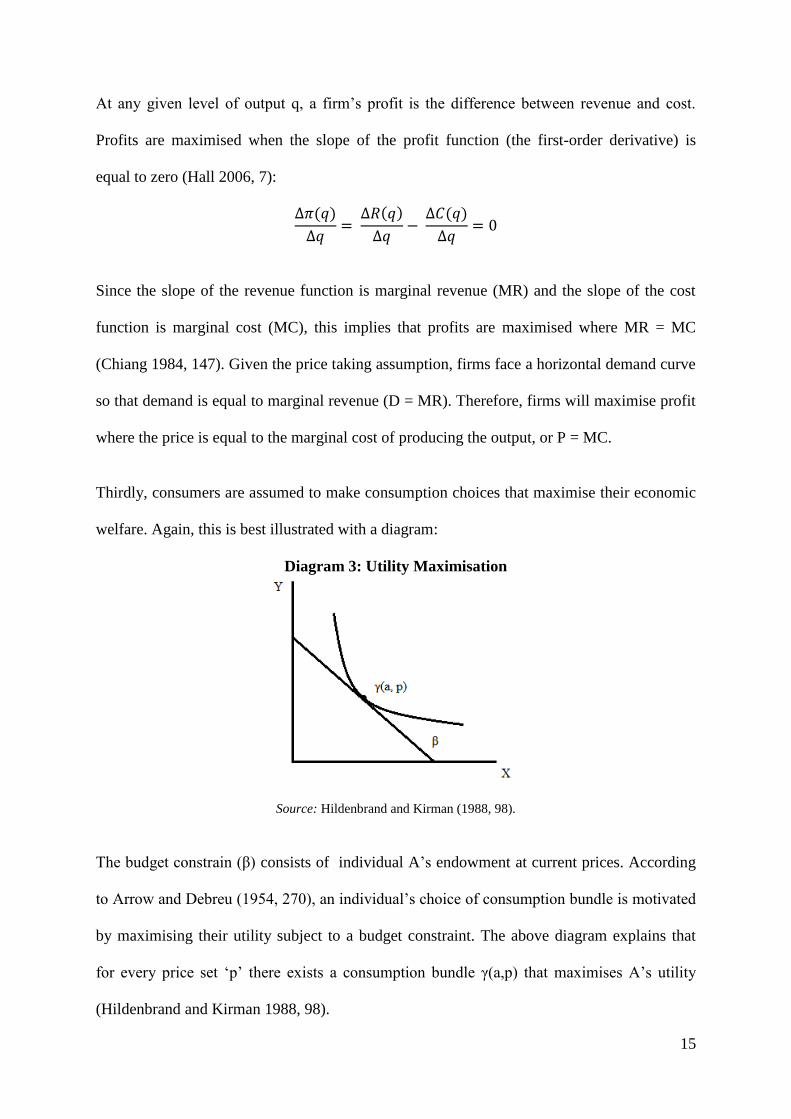
Diagram 3: Utility Maximisation
Source: Hildenbrand and Kirman (1988, 98).
The budget constrain (β) consists of individual A‟s endowment at current prices. According
to Arrow and Debreu (1954, 270), an individual‟s choice of consumption bundle is motivated
by maximising their utility subject to a budget constraint. The above diagram explains that
for every price set „p‟ there exists a consumption bundle γ(a,p) that maximises A‟s utility
(Hildenbrand and Kirman 1988, 98).
16
2.1.6 Pareto Optimality
It was noted earlier that the First Theorem formalises the idea that markets produce an
efficient allocation of resources (Abelson 2003, 39). Since every competitive equilibrium is
Pareto optimal, we must now consider the conditions for Pareto efficiency. A Pareto efficient
allocation of resources is one where no reallocation can make any agent better off without
harming another (Abelson 2003, 42). More formally, an allocation [(xi, yj)] is Pareto optimal
if there is no other feasible allocation [(xi‟, yj‟)] such that ui(xi‟) ≥ ui(xi) for all i and ui(xi‟) >
ui(xi) for some i (Tan 2008, 2). Pareto efficiency in a single market is easily demonstrated
with the simple supply and demand diagram below:
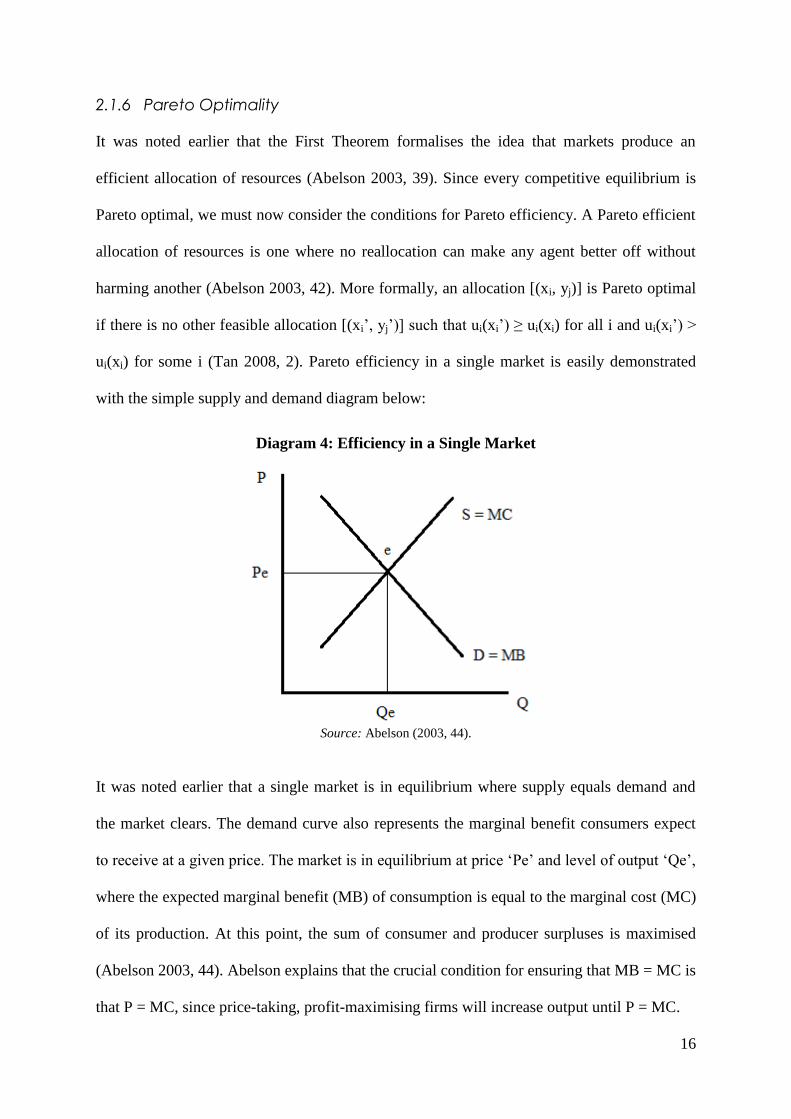
Diagram 4: Efficiency in a Single Market
Source: Abelson (2003, 44).
It was noted earlier that a single market is in equilibrium where supply equals demand and
the market clears. The demand curve also represents the marginal benefit consumers expect
to receive at a given price. The market is in equilibrium at price „Pe‟ and level of output „Qe‟,
where the expected marginal benefit (MB) of consumption is equal to the marginal cost (MC)
of its production. At this point, the sum of consumer and producer surpluses is maximised
(Abelson 2003, 44). Abelson explains that the crucial condition for ensuring that MB = MC is
that P = MC, since price-taking, profit-maximising firms will increase output until P = MC.
17
For an economy to achieve Pareto efficiency across all markets, it must satisfy three
conditions (Abelson 2003, 45):
(i) Efficient technical production, characterised by a point on the PPF;
(ii) Efficient consumption. Consumers maximise their utility subject to their
budget constraint in a way that is compatible with the consumption plans of
others. This is demonstrated with the Edgeworth box diagram; and
(iii) Product mix efficiency. This requires the economy to produce the
commodities that consumers want. An economy cannot be efficient if there are
„missing markets‟.
Efficient technical production means that the output of one good is maximised given the
output of another. In a two good economy, this results in an allocation on the PPF. Efficient
consumption is best demonstrated with the aid of the Edgeworth box diagram below:
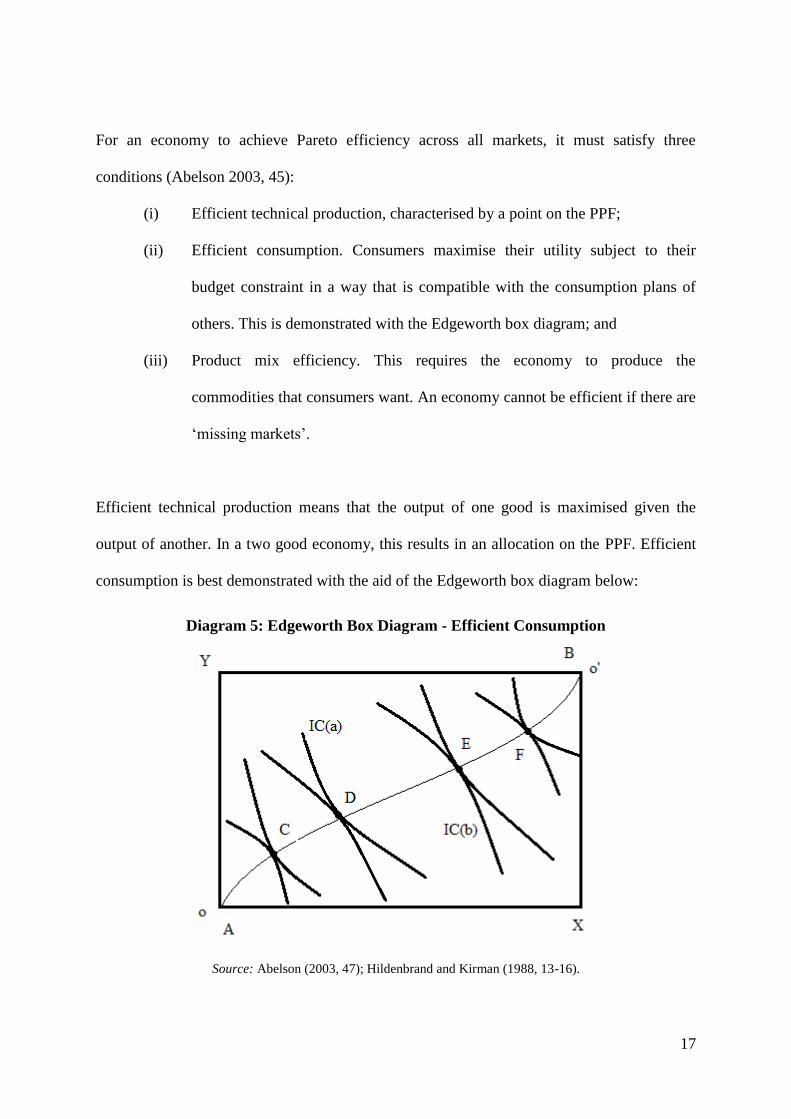
Diagram 5: Edgeworth Box Diagram - Efficient Consumption
Source: Abelson (2003, 47); Hildenbrand and Kirman (1988, 13-16).

18
The indifference curves represent feasible consumption bundles for which the individual
derives the same utility. The slope of an individual‟s indifference curve represents the
marginal rate at which they are willing to substitute one good for the other (Starr 1997, 25).
All points within the box are feasible bundles. An individual‟s choice of a consumption
vector is motivated by maximising utility subject to the budget constraint (Arrow and Debreu
1954, 270). Given that indifference curves are convex to the origin, A prefers bundles north-
east from the origin and B south-west. Points C, D, E, F represent points of tangency. At
these points, both individuals‟ indifference curves have the same slope: that is, A and B have
the same marginal rates of substitution (Starr 1997, 23-25). The points of tangency represent
Pareto efficient allocations. The line joining these points together is called a „contract curve‟,
which represents all Pareto efficient outcomes.
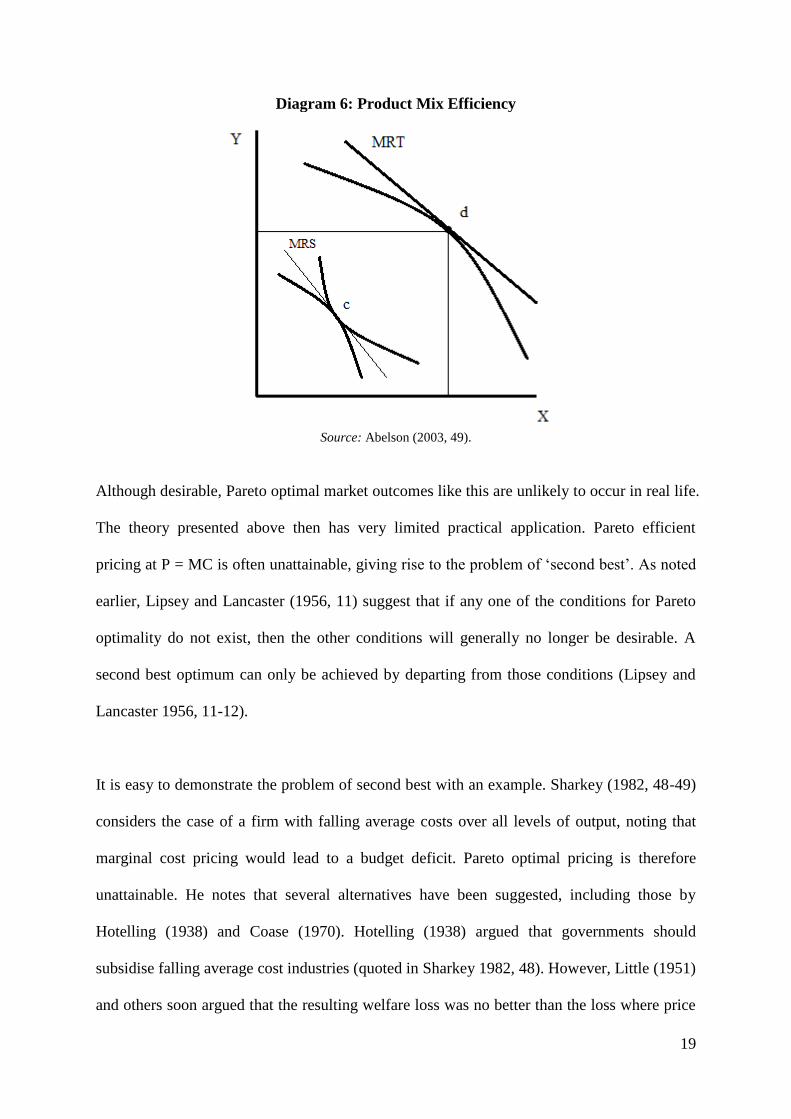
The third requirement for Pareto efficiency is that of product mix efficiency (Abelson 2003,
48-49). A point on the PPF only demonstrates technical efficiency (the efficient use of inputs).
Product mix efficiency also requires that the point on the PPF be optimal given consumers‟
incomes and preferences (Abelson 2003, 48). In the same two person, two good economy
used above, an allocation will be efficient if:
MRSA
xy = MRSB
xy = MRTxy
The left hand side of the equation is familiar from the Edgeworth box treatment of tangential
indifference curves. It simply states that an efficient allocation of resources requires
consumers‟ marginal rates of substitution (MRS) of good x for good y to be equal. This MRS
must then be equal to the marginal rate at which the economy transforms x into y (MRT). In
the diagram below, this means that the MRS „c‟ must be equal to the MRT „d‟.
19
Diagram 6: Product Mix Efficiency
Source: Abelson (2003, 49).
Although desirable, Pareto optimal market outcomes like this are unlikely to occur in real life.
The theory presented above then has very limited practical application. Pareto efficient
pricing at P = MC is often unattainable, giving rise to the problem of „second best‟. As noted
earlier, Lipsey and Lancaster (1956, 11) suggest that if any one of the conditions for Pareto
optimality do not exist, then the other conditions will generally no longer be desirable. A
second best optimum can only be achieved by departing from those conditions (Lipsey and
Lancaster 1956, 11-12).
It is easy to demonstrate the problem of second best with an example. Sharkey (1982, 48-49)
considers the case of a firm with falling average costs over all levels of output, noting that
marginal cost pricing would lead to a budget deficit. Pareto optimal pricing is therefore
unattainable. He notes that several alternatives have been suggested, including those by
Hotelling (1938) and Coase (1970). Hotelling (1938) argued that governments should
subsidise falling average cost industries (quoted in Sharkey 1982, 48). However, Little (1951)
and others soon argued that the resulting welfare loss was no better than the loss where price
20
exceeded marginal cost (quoted in Sharkey 1982, 49). Coase (1970) believed that a subsidy
would introduce a distortion of its own since non-users must pay part of the cost for users of
the service, introducing a political element into the decision of who receives a subsidy
(quoted in Sharkey 1982, 49). Instead, the theory of public enterprise pricing is based on a
synthesis of views: public enterprises should operate with a balanced budget (i.e. ruling out
marginal cost pricing), with prices chosen to maximise aggregate net benefit to consumers
(Sharkey 1982, 49). These and other alternatives to problems of natural monopoly pricing
exist as second best alternatives, since the first best alternative is unfeasible.
Given that a perfectly competitive market is unlikely to be attainable, economists often have
to make do with „workable‟ or „effective‟ competition: the “practical amount of competition
among firms required for efficient exploitation of current product and process technologies”
(Abelson 2003, 69). This concept is closely related the theory of contestability. The theory of
contestable markets says that competitive pressures can be supplied by potential entrants, as
well as incumbents (Baumol and Lee 1991, 2). A market is contestable if there are no barriers
to entry (Spulber 1989, 138), so that firms can freely enter or leave a market. In Spulber‟s
(1989, 138) view, contestability theory is an attempt to extend the concept of perfect
competition to allow for scale economies and natural monopoly. It is believed that the mere
threat of competition will discipline firms into acting competitively (Niekirk 2005, 146). As
noted in 2.1.2, this situation is certainly desirable.
The concepts of contestability and workable competition are highly relevant to this paper,
given the inherent nature of the port industry. Ports are typically characterised by high levels
of „sunk costs‟. Sunk costs are fixed costs that are not easily converted into other productive
uses (Sharkey 1982, 37). Port infrastructure such as wharves, berths and cranes exhibit this
21
characteristic. Markets that involve a high level of sunk costs may lead to the existence of a
single supplier, but this need not mean that the incumbent firm will exploit this situation to
earn monopoly rents (Northern Territory 2009, 11). Consider a port with a single company
providing stevedoring services (as is the case in Adelaide for example) such that it has a
monopoly over those services in that port. The discussion in this chapter would suggest that
this company would tend to use its market power by keeping prices high and output low.
However, if there are no or few barriers to entry, the mere threat of competition might be
sufficient to promote competitive behaviour.
2.2 Market Failure
The previous section concerned the ideal of the competitive market outcome. If utility
maximising individuals and profit maximising firms are joined by a competitive market
covering all goods and services, the market will achieve a Pareto efficient allocation of
resources (Inman 1987, 649). If this scenario ware commonplace, the role of governments
would be limited to ensuring the effective operation of competition (Abelson 2003, 69).
However, markets are unlikely to be perfectly competitive. This section will introduce the
concept of market failure as a potential justification for government intervention. It will be
shown that at least in principle, there is a historical consensus that government intervention is
justified in certain circumstances. Some examples of market failure will be given, with
particular attention paid to public goods and natural monopoly.
2.2.1 The Concept of Market Failure
Perfectly competition requires the existence and completeness of markets, a large number of
buyers and sellers, homogenous goods, decreasing economies of scale and perfect
information (Abelson 2003, 57). If any of these conditions are not met, resources are unlikely
22
to be allocated efficiently and there is said to be a market failure (Abelson 2003, 57). The
market failures I am most concerned with in this chapter are the non-existence of markets for
public goods, imperfect competition and natural monopoly. In Keynes‟ (1926, 46-47) view,
governments role should be concerned with correcting these market failures:
The most important Agenda [sic] of the State relate not to those activities which private individuals are
already fulfilling but to the functions that fall outside the sphere of the individual, to those decisions
who are made by no one if the state does not make them. The important thing for Government is… to
do those things which at present are not done at all. (emphasis in original)
Even classical economists, champions of laissez-faire, saw a role for government in certain
circumstances. Although they favoured the conduct of economic activity through market
process, Sowell (1974, 20-2) argues that this does not mean they believed the market
mechanism was perfect, and were not „rigidly opposed to all government intervention in the
market‟. Smith‟s conception of „natural liberty‟ and laissez-faire was in Viner‟s (1927) view,
never a dogma (Sowell 1974, 21). The following passage evinces Adam Smith‟s intention to
narrowly restrict the involvement of government in the market (Smith 1776, quoted in Viner
1927, 217-218):
According to the system of natural liberty, the sovereign has only three duties to attend to… first, the
duty of protecting the society from the violence and invasion of other independent societies; secondly,
the duty of protecting, as far as possible, every member of society from the injustice or oppression of
every other member of it… and thirdly, the duty of erecting and maintain certain public works and
certain public institutions, which it can never be for the interest of any individual, or small number of
individuals… because the profit could never repay the expense to any individual or small number of
individuals… (emphasis added)

23
A minimalist role for government draws on the ideas of Thomas Hobbes‟ (1651) „state of
nature‟, where prior to the formation of the social contract, people existed in a „state of war‟
where life was “nasty, brutish and short” (quoted in Kelly 1992, 212). At the very least, the
establishment of property rights to initial endowments and the gains from them is necessary
for the use of markets as an institution to achieve a Pareto optimal allocation, and to escape
this Hobbesian state of nature (Inman 1987, 649). Robert Nozick considered that it was
sufficient for a just society that initial endowments would be determined from the state of
nature (Inman 1987, 650-651). Inman (1987, 652) notes that such a view is criticised by those
who embrace an end-state view of social justice, where instead social process is judged by
what people finally receive. Such a minimalist view of the role of government is insufficient
from a social welfare perspective. A more interventionist role for government is often needed
with regard to public goods and imperfect competition.
2.2.2 Public Goods
The unique characteristic of public goods as opposed to private goods is that they are non-
rival in consumption: public goods are not „used up‟ in the process of consumption (Oakland
1987, 485). One individual‟s consumption does not subtract from any other another‟s
(Samuelson 1954, 387). Public goods are also often non-excludable in that a price cannot be
charged for them. Public goods tend to be inefficiently provided by the market mechanism
(Oakland 1987, 485).
A discussion of public goods is relevant to understanding the theory behind port regulation.
Ports supply public goods as well as private goods. For example, Gardner et al (2006, 8)
argues that navigational aids, access channels and access to national road networks all have
the properties of public goods. To illustrate this, consider a port whose access channels need
24
dredging. The work will likely benefit many port users directly (in terms of being able to
access a berth) and indirectly (increased throughput by facilitating larger ships and cargos).
Who should pay for this cost? For this reason there is merit in considering the concept of
public goods and why they tend to be underprovided by the market. The underlying question
in this paper‟s regulatory context is just how inadequate must the private supply of public
goods be in order to justify government intervention?
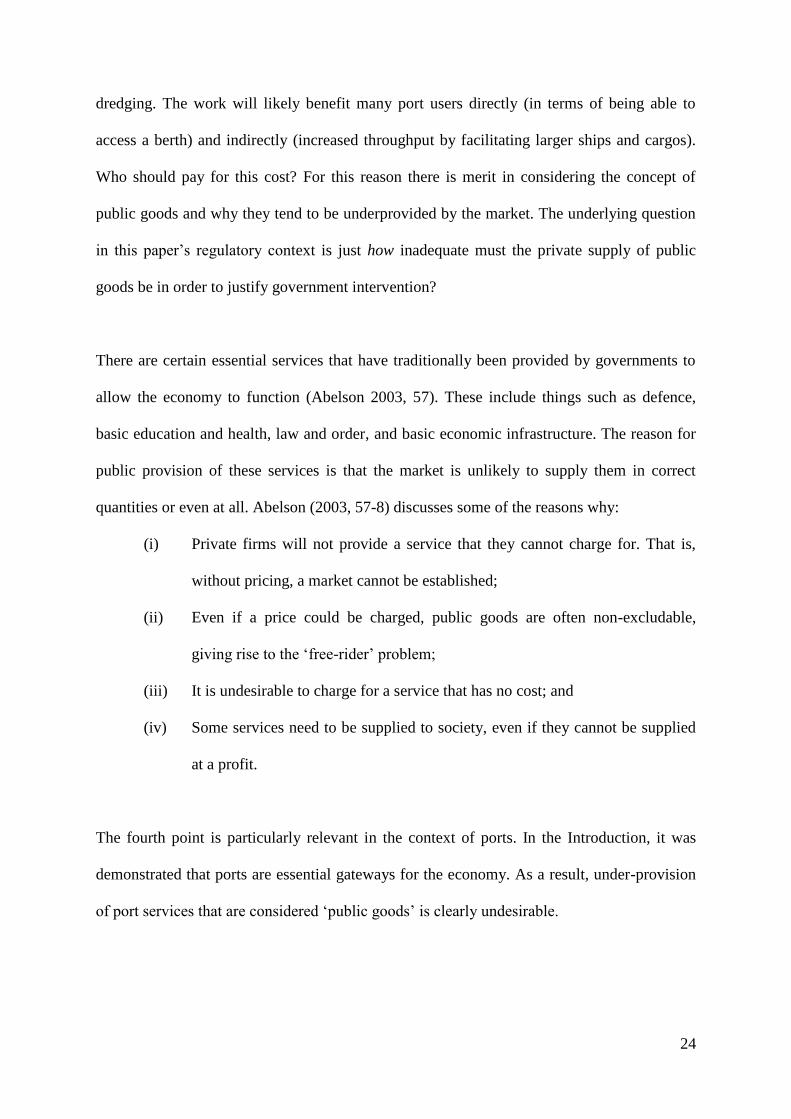
There are certain essential services that have traditionally been provided by governments to
allow the economy to function (Abelson 2003, 57). These include things such as defence,
basic education and health, law and order, and basic economic infrastructure. The reason for
public provision of these services is that the market is unlikely to supply them in correct
quantities or even at all. Abelson (2003, 57-8) discusses some of the reasons why:
(i) Private firms will not provide a service that they cannot charge for. That is,
without pricing, a market cannot be established;
(ii) Even if a price could be charged, public goods are often non-excludable,
giving rise to the „free-rider‟ problem;
(iii) It is undesirable to charge for a service that has no cost; and
(iv) Some services need to be supplied to society, even if they cannot be supplied
at a profit.
The fourth point is particularly relevant in the context of ports. In the Introduction, it was
demonstrated that ports are essential gateways for the economy. As a result, under-provision
of port services that are considered „public goods‟ is clearly undesirable.
25
It is useful now to compare the quantity of a public good that is likely to be provided by the
market as opposed to a private good, to demonstrate that private provision of public goods is
likely to be inefficient. Market performance will depend on a number of factors including the
characteristics of the public good, the number of consumers, the presence of large direct
benefits, and the extent of scale economies (Oakland 1987, 509). Consider a small island
nation with two inhabitants who both have an interest in maintaining a port to facilitate
trade.8 It is clear that if one individual maintains the port, the other will benefit. Assume that
it costs one unit of a private good to maintain one unit of port infrastructure. Therefore:
xi + y
i = Y
i, i = A, B
That is, income (Yi) is equal to public good consumption (x
i) and private good consumption
(yi). The utility of each individual is given by:
ui = u
i (x
A + x
B, y
i)
This shows that each individual gets some utility from the other‟s port maintenance. If each
individual takes the other‟s maintenance as given, the utility maximisation problem is:
uix / u
iy = 1, i = A, B
This says that the marginal benefit of an additional unit of port maintenance is 2 units, while
the cost is only 1 unit. If we assume that an increase in one‟s port maintenance consumption
leads to a decrease in the other‟s, the individuals reaction curves can be demonstrated with a
diagram:
8 This is an adaptation of an example given by Oakland (1987, 509-512). In that example, the public good was the elimination of mosquitoes, where the inhabitants purchased units of mosquito control.
26
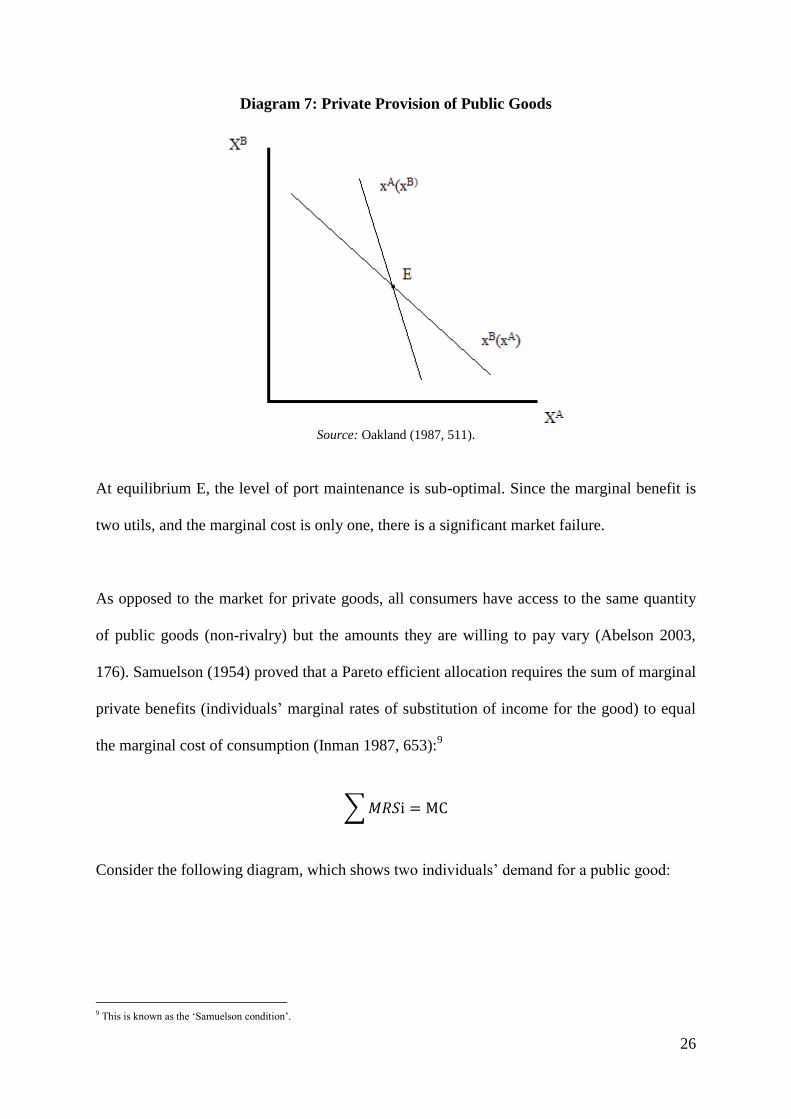
Diagram 7: Private Provision of Public Goods
Source: Oakland (1987, 511).
At equilibrium E, the level of port maintenance is sub-optimal. Since the marginal benefit is
two utils, and the marginal cost is only one, there is a significant market failure.
As opposed to the market for private goods, all consumers have access to the same quantity
of public goods (non-rivalry) but the amounts they are willing to pay vary (Abelson 2003,
176). Samuelson (1954) proved that a Pareto efficient allocation requires the sum of marginal
private benefits (individuals‟ marginal rates of substitution of income for the good) to equal
the marginal cost of consumption (Inman 1987, 653):9
Consider the following diagram, which shows two individuals‟ demand for a public good:
9 This is known as the „Samuelson condition‟.

27
Diagram 8: Efficient Supply of a Public Good
Source: Abelson (2003, 176).
Individual A is only willing to pay price PA but individual B is willing to pay more at PB. The
sum of the individuals‟ willingness to pay, given by the aggregate demand curve (sum of
marginal private benefits) is equal to the marginal cost of production. This result is Pareto
efficient (Abelson 2003, 176). However this example is highly simplified and unrealistic. If
consumption is non-excludable and the quantity is taken as given, the rational consumer has
an incentive to hide their true willingness to pay and „free-ride‟ (Oakland 1987, 514).
Samuelson (1954, 388-9) noted that a decentralised market cannot determine a Pareto
efficient allocation of public goods, instead noting that “it is in the selfish interest of each
person to give false signals, to pretend to have less interest in a given collective consumption
activity than he really has”.
It is clear then that the market mechanism is unlikely to provide a Pareto efficient allocation
of public goods. This creates a potential role for government to step in and provide the public
good. The task of policy makers is to ensure the Samuelson condition holds (Oakland 1987,
28
522): a tall order given that doing so requires, among other things, knowledge of the costs
and tastes associated with the good.
2.2.3 Imperfect Competition
Another form of market failure results when competition is imperfect. As noted earlier, one
of the conditions for perfect competition is a large number of buyers and sellers. When a
market is not large enough to allow significant competition, there is said to be a public
interest in some form of government regulation (Abelson 2003, 213). There are a number of
reasons why a market may not be large enough. We have already considered the case of
public goods, which in some circumstance may not be provided at all. This section will
consider what happens under imperfect competition.
It is recalled that in the long-run, the competitive forces of a market economy ensure there are
no economic profits. Whatever profits existed in the short-run entice new firms into the
market, putting downward pressure on the price until it once again equals marginal cost.
However, Walras supposed that since the difference between price and average cost is
eliminated by competitive forces, it follows that if such forces do not exist, the producer has a
monopoly and can make a surplus in equilibrium (Walker 1996, 299-300). This situation is
undesirable and potentially justifies government intervention in the market to mitigate the
resulting loss in welfare.
Unlike firms in a perfectly competitive market, monopolists have power set prices. Under
competition, a firm who tried to raise prices would not sell any output, since sufficient output
can be supplied at the lower market price. Demand in such circumstances is perfectly elastic:
firms in a competitive market face a horizontal demand curve whereas monopolists face a
downward sloping demand curve (Abelson 2003, 61). Although the monopolist has power to
29
increase prices, he/she knows that doing so will decrease the quantity demanded (Neumann
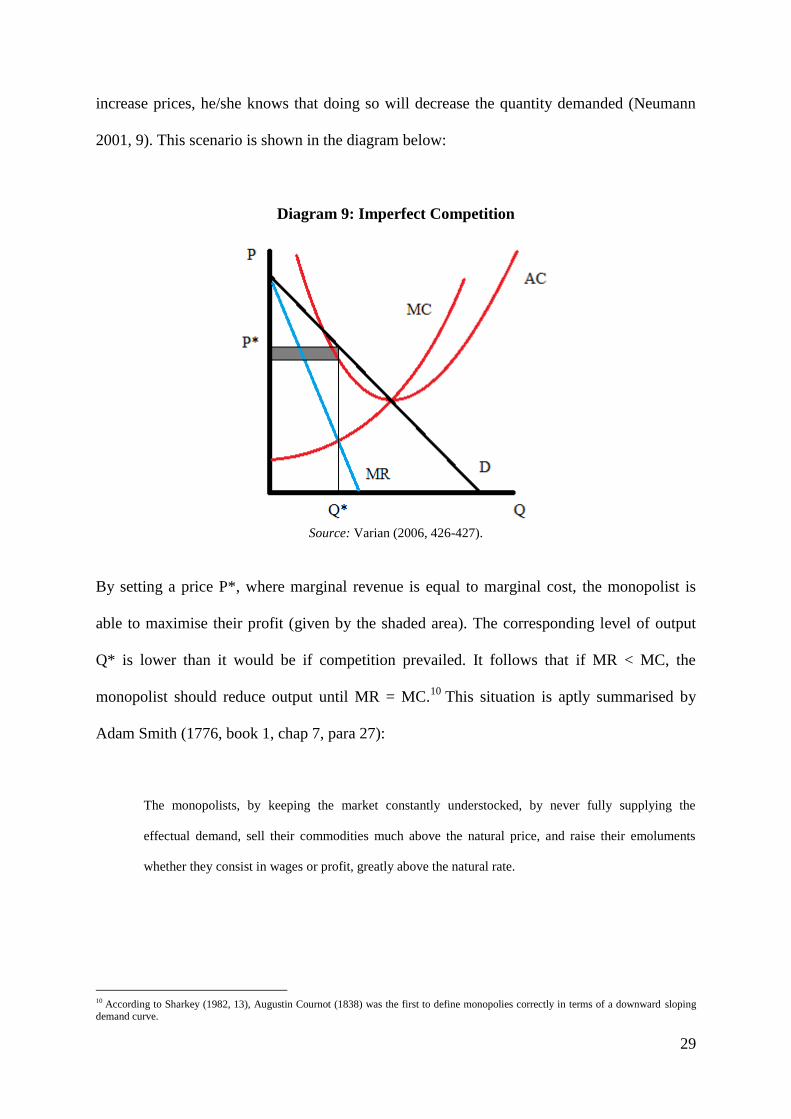
2001, 9). This scenario is shown in the diagram below:
Diagram 9: Imperfect Competition
Source: Varian (2006, 426-427).
By setting a price P*, where marginal revenue is equal to marginal cost, the monopolist is
able to maximise their profit (given by the shaded area). The corresponding level of output
Q* is lower than it would be if competition prevailed. It follows that if MR < MC, the
monopolist should reduce output until MR = MC.10
This situation is aptly summarised by
Adam Smith (1776, book 1, chap 7, para 27):
The monopolists, by keeping the market constantly understocked, by never fully supplying the
effectual demand, sell their commodities much above the natural price, and raise their emoluments
whether they consist in wages or profit, greatly above the natural rate.
10 According to Sharkey (1982, 13), Augustin Cournot (1838) was the first to define monopolies correctly in terms of a downward sloping demand curve.
30
Compared to a competitive market, monopolies lead to an inefficient allocation of resources.
This inefficiency is shown Diagram 10 below:
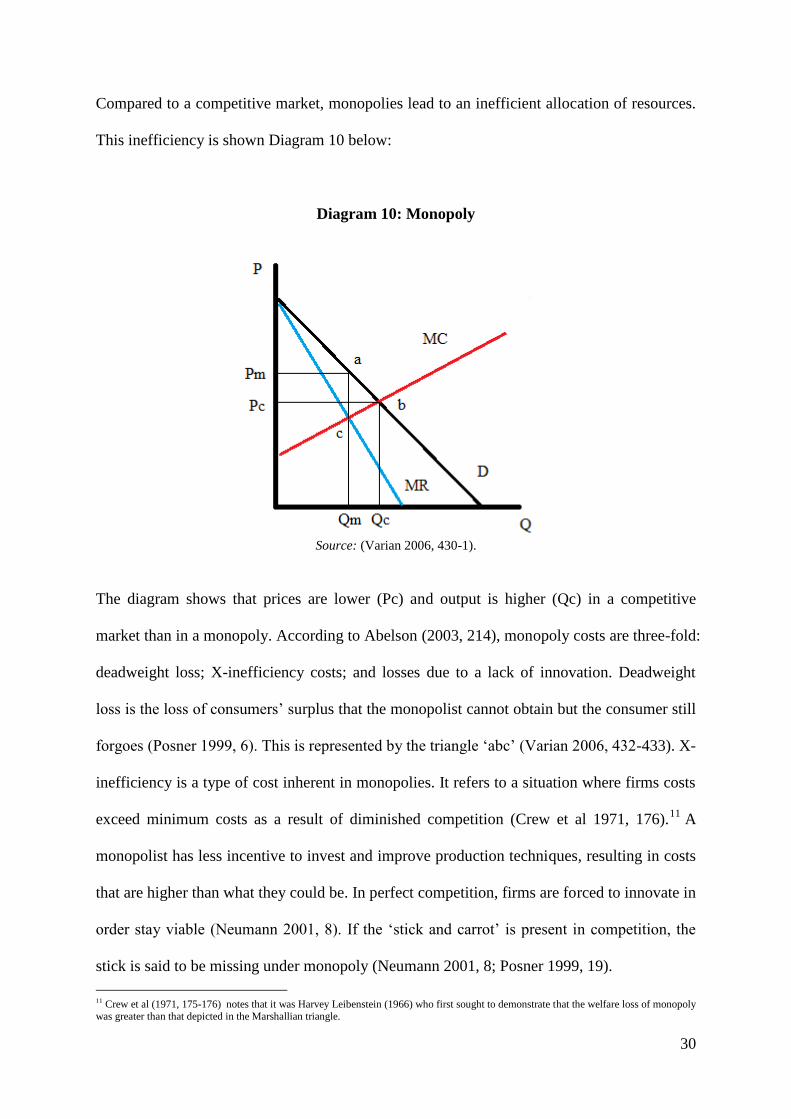
Diagram 10: Monopoly
Source: (Varian 2006, 430-1).
The diagram shows that prices are lower (Pc) and output is higher (Qc) in a competitive
market than in a monopoly. According to Abelson (2003, 214), monopoly costs are three-fold:
deadweight loss; X-inefficiency costs; and losses due to a lack of innovation. Deadweight
loss is the loss of consumers‟ surplus that the monopolist cannot obtain but the consumer still
forgoes (Posner 1999, 6). This is represented by the triangle „abc‟ (Varian 2006, 432-433). X-
inefficiency is a type of cost inherent in monopolies. It refers to a situation where firms costs
exceed minimum costs as a result of diminished competition (Crew et al 1971, 176).11
A
monopolist has less incentive to invest and improve production techniques, resulting in costs
that are higher than what they could be. In perfect competition, firms are forced to innovate in
order stay viable (Neumann 2001, 8). If the „stick and carrot‟ is present in competition, the
stick is said to be missing under monopoly (Neumann 2001, 8; Posner 1999, 19).
11 Crew et al (1971, 175-176) notes that it was Harvey Leibenstein (1966) who first sought to demonstrate that the welfare loss of monopoly was greater than that depicted in the Marshallian triangle.
31
The discussion above has demonstrated that monopolies are inefficient, since they lead to
higher prices at lower levels of output. This creates a potential role for government to
promote competition. However, competition may not always be desirable. There are limited
cases where a monopoly market is preferable on economic welfare grounds. One of those
cases is the existence of natural economies of scale (Abelson 2003, 216). Economies of scale
exist when firm or industry average costs are falling over the long-run. In this case, it may be
more efficient for a single firm to supply the market. This is the argument for the existence of
natural monopolies. Unlike other monopoly industries, social welfare cannot be improved by
increasing competition in a natural monopoly (Sharkey 1982, 54-56).
2.2.4 Natural Monopoly
A natural monopoly exists if a single firm can supply a particular market at a lower cost than
any combination of two or more firms (Sharkey 1982, 54). This typically occurs when
production involves high fixed costs with average costs declining over most or all of the
market range of output (Abelson 2003, 62). Marginal cost pricing therefore is unlikely to be
attainable, since the firm would not recover its substantial overhead costs (Posner 1999, 27).
The first economist to speak of the concept of natural monopoly was John Stuart Mill (1848,
quoted in Sharkey 1982, 14):
It is obvious, for example, how great an economy of labor [sic] would be obtained if London were
supplied by a single gas or water company instead of the existing plurality… Were there only one
establishment, it could make lower charges, consistently with obtaining the rate of profit now realized.
Sharkey (1982, 13-14) provides a succinct historical survey of natural monopoly theory. He
notes that Alfred Marshall thought the likelihood of monopoly was related to the types of
32
costs experienced by the industry. Marshall contended that industries with increasing average
costs were likely to be competitive, while those with falling average costs were likely to be
monopolistic. Furthermore, Marshall believed that if average costs were falling, it might even
be socially desirable for the market to be supplied by a single firm (Sharkey 1982, 14).
Sharkey considers 19th
century railroads as an example of an industry with high levels of
fixed costs and highly variable demand. The presence of scale economies potentially justified
a subsidy to allow efficient production at P = MC (Sharkey 1982, 21).
However, falling average costs is not sufficient to establish the existence of a natural
monopoly. The defining characteristic of natural monopolies is in fact cost subadditivity
(Abelson 2003, 62). If a firm‟s cost function C(q) is subadditive, then a single firm will be
more efficient than a market with „k‟ firms (Sharkey 1982, 58):
That is, the private and social cost of a single firm‟s production at output level q is less than
the sum of costs of that same level of output being produced by k firms. If a firm‟s cost
function satisfies the inequality for k ≥ 2 firms, it is said to be strictly cost subadditive
(Sharkey 1982, 58) and one firm will be more efficient than two or more firms. This can
demonstrated diagrammatically:
33
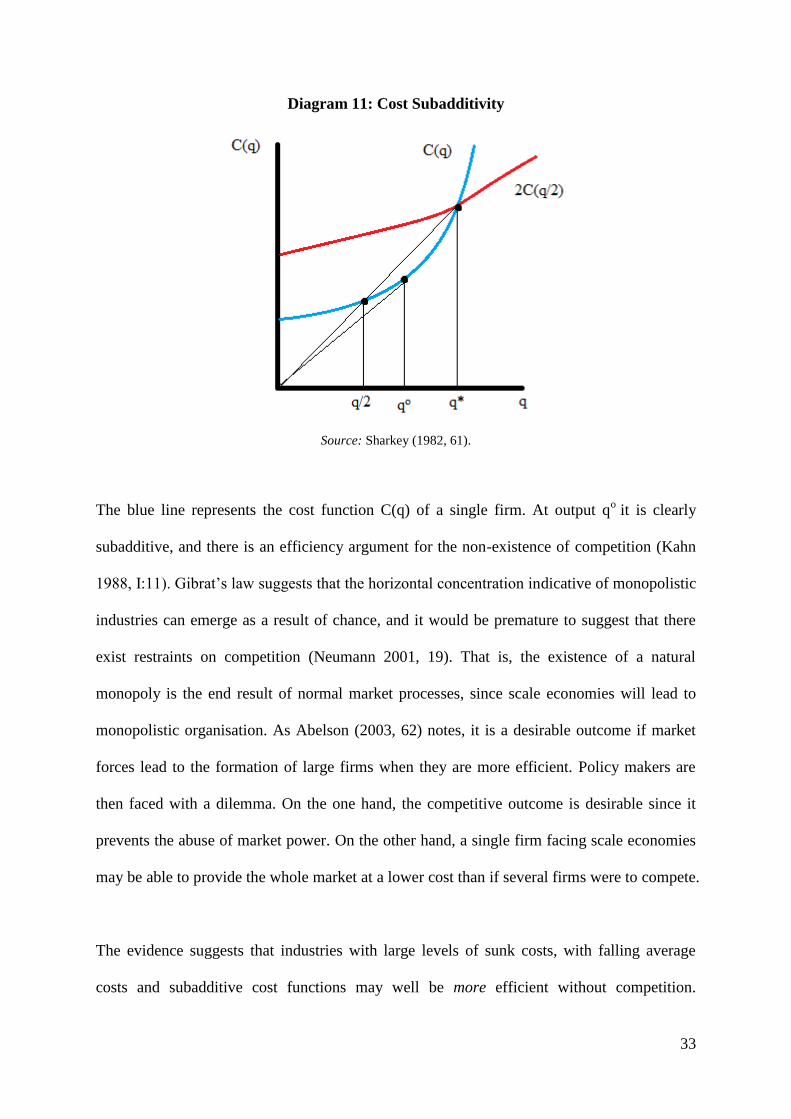
Diagram 11: Cost Subadditivity
Source: Sharkey (1982, 61).
The blue line represents the cost function C(q) of a single firm. At output qo
it is clearly
subadditive, and there is an efficiency argument for the non-existence of competition (Kahn
1988, I:11). Gibrat‟s law suggests that the horizontal concentration indicative of monopolistic
industries can emerge as a result of chance, and it would be premature to suggest that there
exist restraints on competition (Neumann 2001, 19). That is, the existence of a natural
monopoly is the end result of normal market processes, since scale economies will lead to
monopolistic organisation. As Abelson (2003, 62) notes, it is a desirable outcome if market
forces lead to the formation of large firms when they are more efficient. Policy makers are
then faced with a dilemma. On the one hand, the competitive outcome is desirable since it
prevents the abuse of market power. On the other hand, a single firm facing scale economies
may be able to provide the whole market at a lower cost than if several firms were to compete.
The evidence suggests that industries with large levels of sunk costs, with falling average
costs and subadditive cost functions may well be more efficient without competition.
34
However, this does not mean they are efficient. As was discussed in the previous section,
setting prices at MR = MC is inefficient, since the MR curve is to the left of the demand
function, and therefore price exceeds the marginal costs of production. This again comes
back to the problem of second best and potentially opens the door for government to try and
improve on the market outcome through competition policy and regulation.
The above discussion is highly relevant to ports. Ports face large sunk costs and often
variable trade patterns. As a result, ports have are typically regarded as natural monopolies.
In Australia in particular, the natural monopoly of Australian ports have historically been
reinforced by the continent‟s geographical location and the relative thinness of Australian
trade (Trace 1997, 143).
2.2.5 Government Failure
Montgomery and Bean (1999, 403-404) note that a significant body of literature has
developed which speaks of „government failure‟ as opposed to market failure. The Chicago
School has argued that regulation, designed to correct for market failure, is often poorly
directed and results in a range of inefficiencies that are potentially worse than the very market
failures they intended to correct (Treasury 1999, 58). The Treasury (1999, 58-59) notes that a
3 step test proposed by Spulber (1989, 3) can be used to help decide whether a government
should intervene. Firstly Spulber says that there should be a market failure resulting in sub-
optimal allocation of resources. Second, government intervention must be able to alleviate the
misallocation. Thirdly, the potential benefits must outweigh the costs, including
administrative costs and inefficiencies created by the intervention itself.
35
The following section will investigate government intervention in more detail by considering
the different types of regulation and potential problems faced by regulators. As will be shown,
providing effective, efficient regulation is inherently problematic, and sometimes promoting
workable competition may be a better solution than regulation.
2.3 The Potential Role for Government
As discussed in the previous section, the market economy does not always achieve an
efficient outcome. When the conditions for perfect competition are not present, there is said
to be a market failure, potentially creating a role for government. In Anglo-Saxon countries,
public ownership has often been used in cases of public goods and natural monopolies for
this reason. Indeed, most Australian ports are still government owned, although all are run as
commercial entities.12
Government ownership can potentially prevent monopoly exploitation
of consumers by controlling pricing and thus monopoly rents. Some of the justification for
Australian governments retaining ownership of ports has been on the basis that it can prevent
ports from exploiting monopoly rents (Tull and Reveley 2001, 76).
It is worthwhile mentioning that other agents can exhibit rent seeking behaviour (Goss 1990
quoted in Tull and Reveley 2001, 77). Stevedoring firms and port workers (through
restrictive work practices and overstaffing) can also exploit economic rents. In order to
prevent the exploitation of monopoly rents like this, governments may need to become
involved in order to improve economic welfare. Its policy options for doing so include
competition policy and regulation, which will be the focus of this section.
12 The process of reforming government enterprises to operate as commercial entities is known as „commercialisation‟
36
2.3.1 Competition Policy
The doctrine of laissez-faire asserts the supremacy of market forces. Classical economists
view departures from equilibrium to be temporary disturbances. If markets were perfectly
competitive, the role for government would be limited to ensuring the effective operation of
competition (Abelson 2003, 69). In the real world though, such a thing cannot be left to
chance. Competition policy must be concerned with the protection of competition as an
institution (Neumann 2001, 5). Governments use competition policy to try to remove anti-
competitive policy and streamline regulatory procedures (King 1997, 1). Market autonomy
advocated by the doctrine of laissez-faire provides scope for a dominant firm or cartel to
emerge and may interfere with the liberty of others (Neumann 2001, 5).
It should be recalled that the Two Theorems of Welfare Economics provide a basis for claims
of the desirability of the competitive outcome. According to Myles (1995, 18-19), the Two
Theorems have motivated two separate views on the role of economic policy. One is that we
should take them as evidence that policy should always strive to move the economy towards
the competitive ideal. The second is that they show what could be achieved if the economy
was competitive, but also demonstrate why it cannot be achieved in practice: either because
its assumptions are unrealistic or the distributional aspects of competitive equilibrium are
undesirable. Furthermore, the Pareto efficient level of pricing P = MC is unsustainable in the
case of natural monopolies, leading to the problem of second best. It should be recalled from
earlier that often an industry will have to make do with workable or effective competition. If
a market is contestable, then some competitive pressure will exist and potentially produce a
more favourable market outcome. In the context of ports, as was mentioned in the
Introduction, this might mean opening up certain services to competition, such as stevedoring
and towage for example.
37
So what regulatory tools are available to help governments correct, or at least mitigate market
failures? Getting regulation right is a difficult task. It will be shown that the regulatory
approaches mentioned here have all been subject to criticism. In some cases these stem from
a view that there is no net benefit to government intervention. Other criticisms centre on
government failure discussed in 2.2.5.
2.3.2 Characteristics of Good Regulation
Regulation can be defined in a number of ways. It can have economy-wide scope (like the
Competition and Consumer Act 2010 (Cth)), encompassing many industries, or it can be
more specific, aimed at regulating specific industries or parts of them (such as the Port
Authority Act 1999 (WA)). Regulation can be achieved in a number of different ways. It may
be „light handed‟, such as self-regulation by industry codes. Light-handed regulation tends to
have fairly low economic costs associated with it (Coghlan 2003, 21). By contrast a regulator
is said to take a „heavy handed‟ approach if it restricts market entry or uses direct price
control for example. These are likely to involve relatively large economic costs (Coghlan
2003, 22).
Coghlan suggests that good regulation tends to have several of the following characteristics
(2003, 30):
(i) Net benefit to the community in general, and not just the particular industry;
(ii) Set to a minimum necessary level;
(iii) Integrated and consistent with existing law;
(iv) Not unduly prescriptive so as to be flexible. Regulation should also be
specified in terms of performance outcomes;
38
(v) Accessible, transparent and accountable;
(vi) Clear and concise;
(vii) Minimal compliance costs; and
(viii) Enforceable.
Obviously, the characteristics of any given regulation will depend on the industry and the
behaviour it is targeting. Access Economics produced a scorecard on regulation of
infrastructure in 2006 which can give us some additional guidance. Access Economics
considered four broad areas of regulatory design (Access Economics 2006, ii):
(i) Independence from government, industry and other stakeholders;
(ii) Efficiency. Regulation should focus on efficient allocation of resources and only
apply where there is a net benefit from regulation;
(iii) Transparency, predictability and consistency. Decision making processes should
be clear and transparent; and
(iv) Accountability. The regulator should publish reasons for decisions and provide
independent and timely appeal processes.
Common in both lists above, and perhaps one of the most important characteristics of any
regulation, is that it should provide a net benefit to the community. This is a view held by
many. By contrast, the worst possible scenario is where regulation makes things worse. As
Henry Sidgwick (1887, quoted in Inman 1987, 753) noted:
It does not follow that whenever laissez faire falls short, government interference is expedient; since
the inevitable drawbacks of the latter may, in any particular cases, be worse than the shortcomings of
private enterprise.
39
Pigou (1920, 332, quoted in Abelson 2003, 70) also cautioned immediate government
intervention, citing political pressures among other reasons that regulation might be
ineffective. This lends support to the independence criterion mentioned above. One way to
achieve independence is to establish an independent regulatory authority through delegated
legislation. As Chapter 4 will show, independent port regulation does exist in several
Australian states.
2.3.3 Price Regulation
Regulation is said to be indispensible in the case of natural monopolies (Neumann 2001, 163).
Recall that a natural monopoly industry can produce all output at a lower cost as a single firm.
This is the basis for the efficiency argument behind maintaining monopolistic organisation
and also the need for regulation to protect consumers (Kahn 1988, I: 11). Sharkey (1982, 147)
identifies a number of distinct economic objectives that justify regulation for natural
monopolies. One of these is that society may wish to protect consumers from high prices and
attempt to recapture the loss of consumer surplus associated with monopoly pricing. The
previous section demonstrated that monopolists will produce output only up to a level where
MR = MC, resulting in a price that is higher than the MC of production (Sharkey 1982, 147).
The effect of charging such a price is to transfer wealth to the monopolist (Posner 1999, 4).
Unfortunately, recorrecting for this market failure is not as simple setting the price equal to
marginal cost. Doing so would yield losses to the firm, since average costs are higher than
marginal costs at any level of output (Neumann 2001, 161). The problem and solution
therefore, becomes one of second best (Crew and Kleindorfer 2003, 4-5).
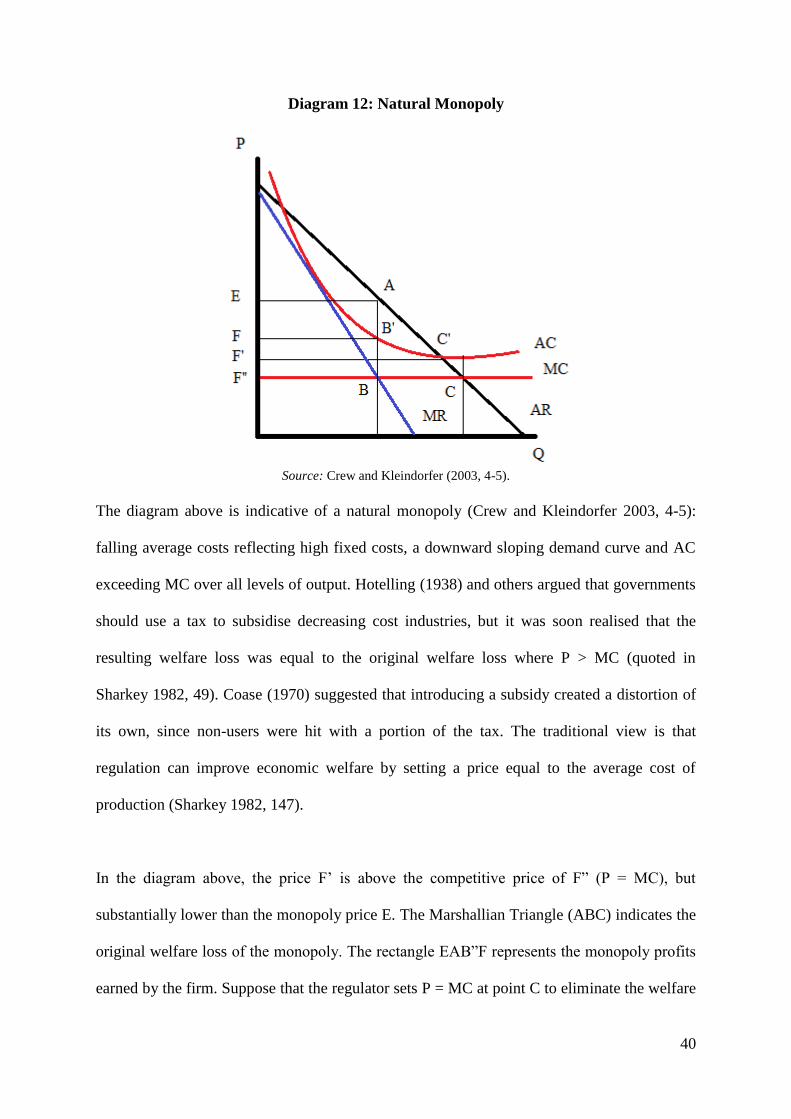
40
Diagram 12: Natural Monopoly
Source: Crew and Kleindorfer (2003, 4-5).
The diagram above is indicative of a natural monopoly (Crew and Kleindorfer 2003, 4-5):
falling average costs reflecting high fixed costs, a downward sloping demand curve and AC
exceeding MC over all levels of output. Hotelling (1938) and others argued that governments
should use a tax to subsidise decreasing cost industries, but it was soon realised that the
resulting welfare loss was equal to the original welfare loss where P > MC (quoted in
Sharkey 1982, 49). Coase (1970) suggested that introducing a subsidy created a distortion of
its own, since non-users were hit with a portion of the tax. The traditional view is that
regulation can improve economic welfare by setting a price equal to the average cost of
production (Sharkey 1982, 147).
In the diagram above, the price F‟ is above the competitive price of F” (P = MC), but
substantially lower than the monopoly price E. The Marshallian Triangle (ABC) indicates the
original welfare loss of the monopoly. The rectangle EAB”F represents the monopoly profits
earned by the firm. Suppose that the regulator sets P = MC at point C to eliminate the welfare
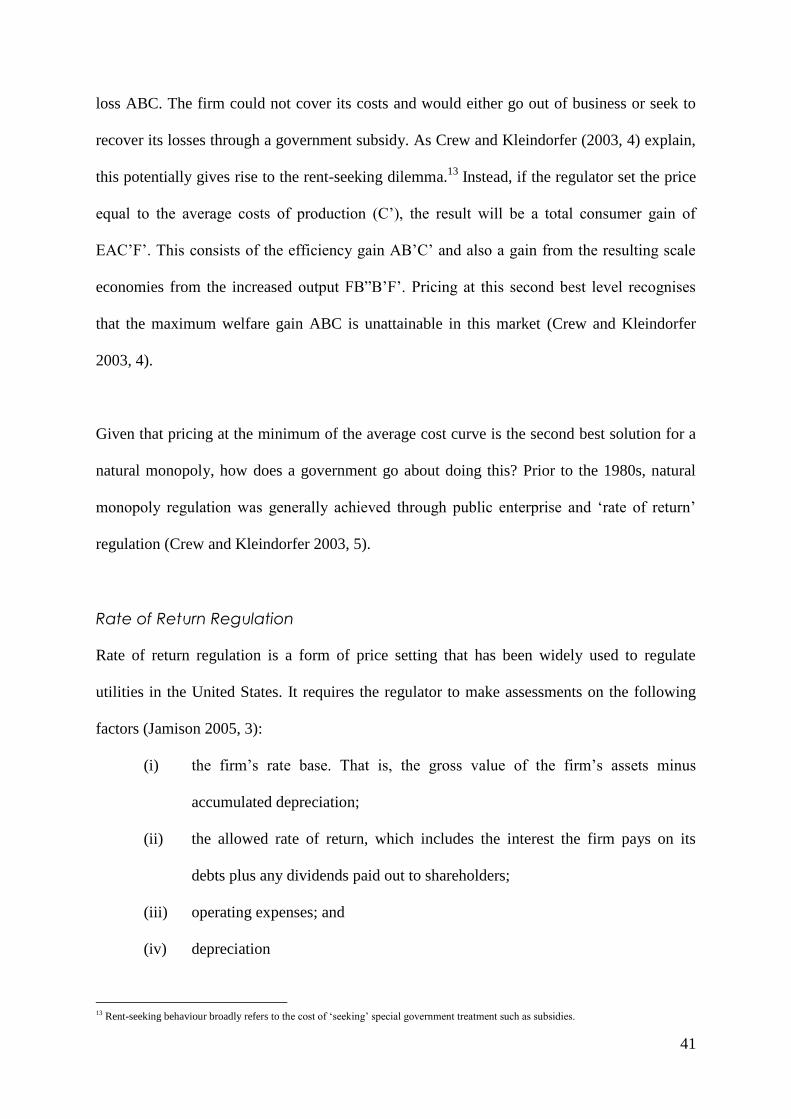
41
loss ABC. The firm could not cover its costs and would either go out of business or seek to
recover its losses through a government subsidy. As Crew and Kleindorfer (2003, 4) explain,
this potentially gives rise to the rent-seeking dilemma.13
Instead, if the regulator set the price
equal to the average costs of production (C‟), the result will be a total consumer gain of
EAC‟F‟. This consists of the efficiency gain AB‟C‟ and also a gain from the resulting scale
economies from the increased output FB”B‟F‟. Pricing at this second best level recognises
that the maximum welfare gain ABC is unattainable in this market (Crew and Kleindorfer
2003, 4).
Given that pricing at the minimum of the average cost curve is the second best solution for a
natural monopoly, how does a government go about doing this? Prior to the 1980s, natural
monopoly regulation was generally achieved through public enterprise and „rate of return‟
regulation (Crew and Kleindorfer 2003, 5).
Rate of Return Regulation
Rate of return regulation is a form of price setting that has been widely used to regulate
utilities in the United States. It requires the regulator to make assessments on the following
factors (Jamison 2005, 3):
(i) the firm‟s rate base. That is, the gross value of the firm‟s assets minus
accumulated depreciation;
(ii) the allowed rate of return, which includes the interest the firm pays on its
debts plus any dividends paid out to shareholders;
(iii) operating expenses; and
(iv) depreciation
13 Rent-seeking behaviour broadly refers to the cost of „seeking‟ special government treatment such as subsidies.
42
This is a significant amount of information. This type of regulation seems desirable, since it
allows the regulator to determine a revenue amount that will keep prices below monopoly
levels whilst still covering the firm‟s costs (Jamison 2005, 3). The regulator is able to set a
price structure to essentially limit profits (Treasury 1999, 61). Kahn (1988, I:198) notes that
considerations of second best are a main justification for allowing a rate of return instead of
equating it to the cost of capital.
Economists believe this form of regulation encourages inefficient production (Abelson 2003,
223). Part of the reason for this is that it links cost with revenue (Crew and Kleindorfer 2003,
6): since allowed revenue directly depends on costs, firms were able to capture some
monopoly rents by showing higher costs. This internal inefficiency (or X-inefficiency) is why
economists consider this type of regulation undesirable (Crew and Kleindorfer 2003, 7).
Price Cap Regulation
Price cap regulation was widely used in the 1980‟s in Great Britain as a response to then
Prime Minister Margaret Thatcher‟s privatisation agenda. It is also currently used in Australia
to regulate utilities. The revenue/cost link characteristic of rate of return regulation is not
present here. Price cap regulation requires the rate of increase in average prices to be less
than the retail price index minus X percent, thereby creating an incentive to produce more
efficiently and reduce costs (Neumann 2001, 161; Crew and Kleindorfer 2003, 7).14
This
regulation has another comparative benefit in that it was not so reliant on information on the
firm, as was the case with rate of return regulation.
14 The author notes that this regulation was introduced in Great Britain in 1983 under the banner „RPI-X‟ regulation. Australia uses a similar method based on the consumer price index (CPI-X).
43
2.3.4 Criticisms of Regulation Generally
One of the major criticisms of regulation is that of information asymmetry (Treasury 1999,
58). The firm is likely to be better informed regarding its own costs of production, which can
potentially lead to rent-seeking behaviour. A related criticism comes by way of extending and
generalising „capture theory‟ (Neumann 2001, 162). Capture theory is based on the
observation that regulatory bodies depend on the firms they regulate for information
(Neumann 2001, 162). A regulated firm might then be motivated to exploit that fact for its
own gain. Despite the many inadequacies of regulation, the fact is that it may be the
preferable option since, in the case of natural monopolies at least, regulation is said to be
indispensible (Neumann 2001, 163).
A related criticism of government action, and by extension regulation, is the concepts of
government failure discussed in 2.2.5. The thrust of this argument is that an intervening
government may not be able to achieve a welfare gain for consumers, when the various costs
of government action (such as a subsidy to an industry with falling AC) are taken into
account. This argument is embodied in the ideas of economists like Coase (1970, quoted in
Sharkey 1982, 49). He was of the opinion that subsidies are undesirable from an efficiency
standpoint, since non-users have to pay part of the costs for users. Another more general
criticism of regulation is that historically, it has a tendency to spread (Kahn 1988, II:28). In
the context of monopoly regulation, Kahn notes that if regulation is successful in limiting
competition (which is desirable in certain circumstances, see 2.2.4), it will have to
continuously widen and deepen its scope.
44
2.4 Conclusion
The first part of this chapter outlined the idea of perfect competition and the classical
conception of the market. If utility maximising individuals and profit maximising firms are
joined by a competitive market, a Pareto efficient allocation of resources is said to result.
Walras‟ law suggests that in equilibrium, a price vector exists such that there is no excess
demand, and all markets clear. The competitive market is desirable because it results in lower
prices and greater output, thereby maximising consumer welfare. However, very few markets
are perfectly competitive. In most cases, one or more of the conditions for Pareto optimality
will not be met, leading to the problem of second best. In practice, economists often have to
rely on workable competition. Contestability theory suggests that if incumbent firms in an
imperfectly competitive market face a „threat‟ of competition from potential entrants, they
will be encouraged to behave in a competitive manner. If there are few barriers to entry and
exit, incumbent firms may be less likely to exploit their market power to earn monopoly rents.
The concept of market failure was discussed in 2.2. A market is said to fail when any of the
conditions for perfect competition are not met. As a result, we are much more likely to
encounter imperfectly competitive markets, where firms may have market power and where
prices may exceed the marginal costs of production. This section considered a number of
types of market failure, including public goods and natural monopoly. Public goods are non-
rival in consumption, and as a result, are unlikely to be adequately provided by the private
sector. A natural monopoly is a market structure whereby a single firm can supply a market at
a lower cost than two or more firms (Sharkey 1982, 54). Monopolies are often thought of as
artificial and inefficient market structures. However, it was shown that a natural monopoly
can emerge from normal market processes including economies of scale.

45
The concepts of public goods and natural monopoly are relevant in the context of ports, and
both create a potential role for government. Access channels, navigational aids and access to
national road networks are examples of port infrastructure that might be considered public
goods. In Australia, these tend to be provided by port authorities, whilst more contestable
services like stevedoring and towage are often contracted out. Likewise, Australian ports
have traditionally been government owned, owing to the perception that they exist as natural
monopolies and that public ownership can potentially prevent the abuse of market power
(Tull and Affleck 2008, 3). Monopoly firms can use their market power to restrict output
whilst keeping prices relatively higher than they would be under competition. This is
undesirable from a social welfare standpoint, and potentially opens the door for government
intervention.
The third part of this chapter sought to discuss some of the many options available to
governments to potentially improve on unfavourable market outcomes. Governments can use
competition policy to promote competition and more efficient resource allocation, thereby
improving economic welfare. Increasing market contestability and removing unnecessary
regulatory burdens are examples of competition policy. Competition reform was widely used
in Australia in the 90‟s under the National Competition Policy, which will be considered in
more detail in Chapter 3. Governments may also deem it necessary to regulate firms or
industries in order to protect consumers from excessive prices. This section considered some
of the characteristics of good regulation. Among other things, regulation should be set to a
minimum necessary level, be clear and concise, and provide a net benefit to the community
(Coghlan 2003, 22). In regard to infrastructure such as ports, the Access Economics
Scorecard (2006) provided some additional guidance. Regulators should be independent,
transparent and accountable (Access Economics 2006, ii).
46
Two types of price regulation were then discussed. Rate of return regulation restricts firm
revenue by allowing a fixed rate of return on its assets. This form of price regulation has been
heavily criticised on efficiency grounds. The significant information requirements can
potentially lead to „regulatory capture‟, since the regulator is heavily reliant on the firm for
information. This in turn encourages rent-seeking behaviour, and inefficient production
(Abelson 2003, 223: Crew and Kleindorfer 2003, 6-7). Finally, the idea of government failure
was briefly considered: where an intervening government may not be able to improve on a
market outcome.
This chapter has attempted to provide the theoretical backdrop against which Australia‟s port
regulatory framework can be assessed. Port regulation and indeed regulation of any kind,
exists as a second best solution. In many circumstances, market forces do not produce
desirable economic outcomes. Prices may be too high, as is often the case with monopolies,
or a good or service may not be produced in sufficient quantities, as is often the case with
public goods. Given that ports and port infrastructure tend to exhibit these characteristics, this
chapter sought to recognise the reasons why ports are regulated, and how they should be
regulated. The next chapter will look at the port regulatory framework in Australia. In light of
the concepts introduced in this chapter, it is hoped that an assessment of the current
regulatory regime can be made.

47
3 Port Regulation in Australia
This chapter will attempt to provide an overview of the regulatory framework that exists for
Australian ports. The focus will primarily be on regulation of pricing and access and will not
consider other aspects such as maritime safety or environmental regulations for example. In
order to understand the pricing and access regulatory framework, it is important to first
consider the legislative framework within which Australian ports derive their power,
functions and obligations. State port legislative frameworks are quite varied in many respects,
although some similarities exist. For example, most port authorities in Australia have adopted
a „landlord‟ model of operation, undertaking only core activities whilst leasing facilities to
stevedoring companies and contracting out or privatising other services like pilotage, towage,
mooring and unmooring (Productivity Commission 1998, 23). Port corporations usually lease
facilities under long-term agreements, granting exclusive access to the operator (Price
Waterhouse Coopers 2007, 19-20). As will be shown, an operator‟s exclusive access may
well be subject to a third party access regime that exists in some jurisdictions.
This chapter will first provide some context to this discussion by considering the various
competition reform agreements since the 1990‟s. These have been an important backdrop for
the economic regulation of infrastructure such as ports. Focus will then turn to the different
regulatory regimes in the States and Territories, before considering the Commonwealth
regulation that exists under the Competition and Consumer Act 2010 (Cth).15
3.1 Background
In 1993 the Heads of Australian Governments presented the National Competition Policy
(NCP), commonly known as the „Hilmer Report‟. The Hilmer Report was an agreement
between all Australian governments that committed them to an extensive program of
15 Formerly known as the Trade Practices Act 1974 (Cth).
48
microeconomic reform (Hollander 2006, 34).16
In terms of regulation, the governments
agreed to avoid restrictions on competition unless doing so could clearly be demonstrated to
be in the public interest (Hilmer Report 1993, 205-6). The Hilmer Report also identified the
problems posed by public monopolies as particularly concerning, and sought to introduce
effective competition by separating regulatory from commercial functions, and natural
monopoly from contestable components such as stevedoring, towage, pilotage, mooring and
unmooring.17
Based on the Hilmer Report, the Council of Australian Governments (COAG) agreed to the
NCP package of reforms including the Competition Principles Agreement (CPA). Among
other things, the governments agreed to:
(i) consider establishing independent sources of government business price oversight
(cl 2.3);
(ii) implement competitive neutrality principles (cl 3.1);
(iii) reform public monopolies, including separating monopoly elements from
potentially competitive elements (cl 4.3);
(iv) remove competitive restrictions from legislation unless there is a public net
benefit (cl 5.1); and
(v) principles of good third party access regimes (cl 6).
Broadly, the National Competition Council‟s approach was informed by the belief that
competitive markets deliver the best outcomes and government intervention comes at a cost
to the community (Hollander 2006, 36). Australian port reform has adopted the landlord
16 Microeconomic reform in Australia has encompassed a wide range of reforms to governmental policy including: changes to regulation in
the public sector (including commercialisation, corporatisation etc), removing trade protection and barriers to entry in product markets
(Borland 2001, 1-2). 17 The concept of contestable markets was introduced in Chapter 2.

49
model, with governments electing to privatise more contestable services (Everett and
Robinson 2007, 266).18
This is consistent with the Hilmer Report which promoted the
separation of contestable port services from core port activities.
Building on the reforms of the CPA, COAG introduced in 2006 the National Reform Agenda
(NRA) which included the Competition and Infrastructure Reform Agreement (CIRA).
Clause 4 of CIRA expressly relates to port competition and reform. Clause 4.1 states that
ports should only be subject to regulation where a clear need exists, and when it is used, it
should conform to a consistent national approach based on:
(i) third party access where possible, should be provided on commercial terms
agreed between the provider and access seeker;19
(ii) commercial outcomes should be promoted by establishing competitive market
frameworks that allow entry into the more contestable port services;
(iii) if economic regulation is needed, it should be done by an independent body;
and
(iv) where access regimes are required, they should be certified in accordance with
the Competition and Consumer Act 2010 (Cth).
Clause 4.2 states that competition will be preferred, unless a transparent review indicates a
net benefit to restricting competition. Each government is also committed to reviewing
existing regulation of ports to ensure consistency with these principles.
This introduction has attempted to provide some context with which to view the current
regulatory arrangements in Australia. Much of the existing regulation exists as a response to
18 See Chapter 2 for a discussion of contestability and „workable‟ or „effective‟ competition, as well as the desirability of the competitive
market. 19 Third party access regimes are those set up to provide an opportunity for potential users of port infrastructure to negotiate terms of access (or use) with the owners of that infrastructure.
50
the reports and agreements mentioned above. As will be shown, most governments have
legislated at least some of these principles. The following section will provide an introduction
into the highly varied port regulatory framework in Australia.
3.2 Western Australia
The Port Authorities Act 1999 (WA) establishes the Fremantle Port Authority and seven
other port authorities in Western Australia (Section 4, sch 1): Albany, Broome, Bunbury,
Dampier, Esperance, Geraldton and Port Hedland. These port authorities are government
owned and operated. Unlike other jurisdictions, WA governments have consistently rejected
models of corporatisation and privatisation, opting for commercialisation instead (Tull and
Affleck 2008, 2). This is embodied in Section 34 of the Act, which requires port authorities to
“act in accordance with prudent commercial principles” and “endeavour to make a profit”.
This commercial approach is also evident in Part 6 of the Act, which requires port authorities
to pay dividends and an amount in lieu of rates to the Treasurer.
Section 37 of the Act gives WA port authorities power to levy “such port charges as the port
authority determines”. In doing so, the port authority is once again to have regard for
commercial principles, and may allow for the making of profit and depreciation of assets.
Port authorities are required to prepare annual statements of corporate intent under Section 58,
which among other things involves specifying any proposed pricing arrangements (Section
60). Part 8 of the Act defines „port charges‟ to include charges for wharfage, berthage,
tonnage and access charges, port improvement rates and charges for port services or
navigational aids provided by the port authority (Section 115).

51
The framers of the Act clearly attempted to distance port authorities from government. It
should be recalled from Chapter 2 that a key criterion of good regulation is that the regulator
should be independent from the government. Although government owned and run, it is clear
that the framers of the legislation intended to create relative autonomy. This independence is
embodied in a number of sections. Section 8 empowers the board of the port authority, as its
governing body, to perform the functions and control the affairs of the port authority. The
port authority is also able to grant easements, leases and licenses under Section 27A.
However, licenses granting exclusive rights to provide port services are subject to the
Minister‟s approval (Section 35(4)). The port authority‟s discretion in performing its
functions is always subject to directions of the Minister under Sections 71 and 72.
3.2.1 Price and Access Regulation
Port prices in WA are subject to oversight by the shareholder Minister (Gray 2009, 70). There
is no independent body who regulates port related prices and access. However, Tull and
Affleck (2008, 8) note that potential exists for the Economic Regulation Authority (ERA) to
fulfil such a role in the future. Currently ports are not a „regulated industry‟ for the purposes
of the Economic Regulation Authority Act 2003 (WA). Despite this, the Minister can request
the ERA to inquire into or report on non-regulated industries (Section 38). The matters that
can be referred to the ERA are broad and include (Section 32):
(a) Prices and prices policy in respect of goods and services provided by the industry;
(b) Quality and reliability of goods and services provided by the industry; and
(c) Investment and business practices in the industry.
52
The Access Economics Scorecard gave Western Australian ports an overall score of „very
poor‟. However, Tull and Affleck (2008, 1-2) argue that the existing legislative framework
“provides much of the focus, transparency and accountability” that Access Economics sought
from a „good‟ regulatory framework. The Port Authorities Act contains many provisions
consistent with „good regulation‟ and with CIRA. For example, Clause 4.1 of CIRA states
that „ports should only be subject to regulation where a clear need for it exists‟ to promote
competition or prevent the misuse of market power. The Draft Review of Western Australian
Ports by Allen Consulting Group (2008, vii) found no need to implement regulation of port
facilities either to promote downstream competition or prevent the misuse of market power
(2008, vii). Nor in their opinion, have service providers provided access on “anything other
than a competitively neutral basis” (2008, x). Despite there being no current independent
review of port prices and access in WA, it is argued that there is currently no need. The
existing framework is currently sufficient to promote good decision making and outcomes.
3.3 Northern Territory
The Port of Darwin was corporatised in 2009 under the Darwin Port Corporation Act 2009
(NT). The functions of the Darwin Port corporation are outlined in Section 16 of the Act and
include the regulation, improvement, management, operation, control and promotion of trade
in the port. The powers of the corporation are given in Section 17, subsection (f) of which
enables the corporation to „impose dues and levy fees‟ in respect of the use of the port facility.
These powers are always subject to directions of the Minister under Section 15. Changes in
the port‟s pricing structure must first be approved by the Minister, although individual
variations do not (Section 17A).
53
3.3.1 Price and Access Regulation
There exists no independent regulatory oversight of prices or access in the Northern Territory.
In 2009 the Northern Territory government released a report on the regulatory framework for
the port of Darwin, declared a „significant‟ port under Appendix 2 of CIRA. In accordance
with CIRA clause 4.2(b), third party access is provided on a competitively neutral basis, with
no formal complaints so far (Northern Territory 2009, 24). The report does however note that
transparency could be improved (Northern Territory 2009, 24), since access criteria is not
publically available, nor are the reasons for access decisions disclosed.
3.4 South Australia
The South Australian government initially pursued a policy of corporatisation by creating the
South Australian Ports Corporation (Everett and Robinson 2007, 266). In 2000, the
government commenced a bidding process which eventually led to the acquisition of the
corporation by Flinders Ports Pty Ltd („Flinders Ports‟) in 2001 (Everett and Robinson, 266).
Flinders Ports acquired the port infrastructure, a 99-year lease and an operating license for
Port Adelaide and six regional ports (Everett and Robinson, 266). Flinders Ports operate Port
Adelaide, Port Giles, Wallaroo, Port Pirie, Port Lincoln, Thevenard and Klein Point (Flinders
Ports Pty Ltd).
The South Australian regulatory arrangement is particularly complex, with a number of
important Acts relevant to South Australian ports. With regard to pricing, the Harbors and
Navigation Act 1993 (SA) gives the Minister power to fix charges for the use of facilities and
services provided by the Minister, and for the entry of vessels into waters controlled by the
Minister (Section 31). Since the sale of the South Australian Port Corporation in 2001
however, these powers have been exercised by Flinders Ports. The authority to do so is
derived from individual „Port Operating Agreements‟ between the South Australian
54
government and Flinders Ports for each of the seven ports. These agreements confer the
rights to operate the port and the lease of the land (South Australia 2002, 1031). At first
glance these powers appear contradictory. The reason the legislation has not been repealed is
because the port was only leased (albeit for 99 years) rather than sold outright. At the end of
the lease, Flinders Ports‟ powers under the agreements will cease, and power to operate the
port will again rest with the Minister under Section 31. Basically, the powers conferred to the
Minister in the Harbors and Navigation Act have been transferred to Flinders Ports for the
period of the lease.
Section 4 of the Essential Services Commission Act 2002 (SA) sets up an independent
economic regulator called the Essential Services Commission (ESCOSA). In conjunction
with the Maritime Services (Access) Act 2000 (SA) (MSA Act), the Essential Services
Commission Act sets out ESCOSA‟s role as economic regulator (ESCOSA 2004, 1). Section
5 of that Act establishes the functions of ESCOSA including:
Regulating prices and performing licensing and other functions;
Monitoring and enforcing compliance with standards and conditions of
services and supply; and
Advising the Minister on matters relating to the economic regulation of
regulated industries.
ESCOSA‟s objectives broadly include protecting consumer interests with regard to price,
quality and reliability of essential services, promoting fair and competitive market conduct,
preventing the misuse of market power and promoting economic efficiency (Section 6, ESC
Act). There are three types of services that come under ESCOSA‟s role (ESCOSA 2004, 2-3):
55
(1) Essential Maritime Services – providing access to a proclaimed port, providing
facilities for loading and unloading at a proclaimed port, and providing berths for
vessels at a proclaimed port;20
(2) Regulated Services – those maritime services proclaimed as regulated services
under the Maritime Services (Access) Act, including providing access to
proclaimed ports, providing pilotage services at proclaimed ports, and providing
access for vessels at certain common user berths; and
(3) Maritime Services – this is a more general role and includes both Essential
Maritime Services and Regulated Services as well as others.
3.4.1 Price Regulation
Under Part 3 of the ESC Act, ESCOSA may make determinations regulating prices for goods
and services in a „regulated industry‟ if authorised to do so (Section 25). Section 6 of the
MSA Act authorises ESCOSA to make price determinations relating to essential maritime
industries, which are „regulated industries‟ for the purposes of the ESC Act. ESCOSA is
given wide discretion to make such determinations including:
(i) Fixing a price or the rate of increase of a price;
(ii) Fixing a maximum price or maximum rate of increase of a price;
(iii) Fixing an average price for a bundle of goods or services;
(iv) Specifying an amount determined by reference to a general price index; and
(v) Monitoring price levels.
In practice however, Flinders Ports has significant autonomy with regard to setting prices for
regulated services. It can adjust prices as it sees fit, subject to any requirements ESCOSA
20 Maritime Services (Access) Act 2000 (SA), s 4.
56
makes in its price monitoring determinations. For example, in 2007 ESCOSA made a price
determination that required regulated service providers to publish a list of prices for Essential
Maritime Services and authorised itself to monitor prices charges for these services
(ESCOSA 2007, clauses 2.1, 2.5).
ESCOSA‟s more general role is outlined in Section 9 of the MSA Act, which requires it to
keep maritime industries under review to determine whether regulation is necessary under the
ESC Act. The ESC acknowledges that Flinders Ports do have potential to exercise market
power, particularly in relation to grain exports at Port Lincoln and Thevenard (ESCOSA 2007,
i). Despite this, it concluded that there was no misuse of that market power (ESCOSA 2007,
i). In the most recent Price Monitoring Report (2010), ESCOSA found no evidence that the
regulated ports were abusing their market power, noting that price movements have generally
reflected increases in the CPI over the year (ESCOSA 2010, 18).
3.4.2 Access Regime
Part 3 of the MSA Act establishes an access regime for regulated services. A regulated
service is a maritime service declared by proclamation to be a regulated service. These
services are proclaimed by the Governor and published in the South Australian Government
Gazette. Regulated service providers are subject to the access regime under Section 10.
The regime essentially sets up a means for access seekers (referred to in the act as „intending
proponents‟) to gain access to regulated services on „fair and commercial terms‟ (Section 11).
A regulated provider must allow access on such terms that are either agreed between the
parties or determined by an arbitrator if parties cannot agree. „Fair‟ terms are terms consistent
with ESCOSA‟s current pricing determination on a regulated price. In practice, a potential
user would first seek access through negotiation with the service provider (Section 13). If a
57
commercial agreement cannot be reached, then a „dispute‟ exists and the matter can be
referred to ESCOSA (Section 15). ESCOSA will first try to resolve the dispute through
conciliation (Section 16), but can refer the matter to an independent arbitrator (Section 18)
who may make an award. The arbitrator is guided by Section 32 when making an award,
which requires him/her to take into account legitimate business interests and the public
benefit of competitive markets and efficient pricing, among other things.
In May 2011, the South Australian access regime was certified as an „Effective Access
Regime‟ under the Competition and Consumer Act 2010 (Cth). It is currently the only
effective access regime under the Act. This Act will be discussed in more detail later on.
3.5 Victoria
Victoria has a unique blend of government owned port corporations (like the Port of
Melbourne) and privatised ports (Port of Geelong, Portland). The Port of Geelong has been
managed by GeelongPort since 1996 and the Port of Portland is now owned by Port of
Portland Pty Ltd since 1996 (Department of Transport Victoria 2011).
Part 5 of the Port Management Act 1995 (Vic) gives the Port of Melbourne Corporation the
power to charge fees for wharfage, and the Victorian Regional Channels Authority (VRCA)
power to charge channel fees for providing access channels for access to port waters of a
channel operator (e.g. the Port of Melbourne Corporation).
58
3.5.1 Price Regulation
The Port Management Act 1995 (Vic) is the primary Act relating to price and access
regulation in Victoria.21
The Act shares many common elements with the South Australian
MSA Act discussed above. As in South Australia, the Act works in conjunction with the
Essential Services Commission Act 2001 (Vic) (ESC Act). Part 3 of the ESC Act gives the
Essential Services Commission of Victoria (ESC) power to regulate “prescribed prices for or
in respect of prescribed goods and services supplied by or within a regulated industry”
(Section 32).
Part 3 of the Act sets out the regulatory framework for port services that is to be regulated by
the ESC. Section 49 establishes port industries within commercial trading ports (the ports
listed above plus the Port of Hastings) to be regulated industries for the purpose of price
regulation. This section also defines the prescribed services which the ESC can regulate,
including:
(i) The provision of channels;
(ii) The provision of berths, buoys or dolphins in connection with the berthing of
vessels at commercial ports; and
(iii) The provision of short term storage or cargo marshalling facilities in
connection with the loading or unloading of vessels.
In 2004, a review by the ESC determined that the Port of Melbourne Corporation (PoMC)
held substantial market power in its container and motor vehicle trades (ESC 2004, 75). This
resulted in a Price Monitoring Determination in 2005 (ESC 2005) which established
principles that the PoMC should have regard to when setting prices of prescribed services
21 This Act was previously called the Port Services Act 1995 (Vic).
59
(ESC 2005, cl. 5.1.1). The PMD 2005 has been modified by the PMD 2010, which retains
price monitoring but distinguishes between prescribed services and regulated prescribed
services. The effect of this is that it the new PMD currently only applies to the PoMC (ESC
2010, 9). The corporation is required to publish annual Reference Tariff Schedules specifying
the charges for each regulated prescribed service (ESC 2010, cl. 2). In setting its Reference
Tariffs for regulated prescribed services, the PoMC must have regard to the „Pricing
Principles‟ set out in the PMD (ESC 2010, cl 5.2), including:
Reference Tariffs should be set so as to generate revenue sufficient to meet
long-run costs of providing Regulated Prescribed Services, including a return
on assets;
They should not be set so as to allow a sustained level of revenue significantly
greater than sufficient to meet long-run costs; and
Reference Tariffs should not be structured in such a way as to favour the
PoMC‟s operations over those of a competitor in a related market.
The main elements of the current price monitoring framework include (ESC 2009, 30):
A requirement of ports to maintain and publish reference tariffs;
A requirement for the PoMC to comply with the pricing principles contained in the
PMD and prepare and publish a Pricing Policy Statement;
A credible threat on the application of more prescriptive regulation if market power is
misused; and
A scheduled review every five years to determine whether the framework is
delivering the objectives set out in the ESC Act and the Port Services Act.

60
The third point above is particularly important. Both the PMD2005 and PMD2010 opted for a
light-handed price monitoring approach. It should be recalled from Chapter 2 that regulators
have a number of options available to them to try to prevent the misuse of market power,
including specifying an allowed rate of return on capital employed, or restricting average
price movements by imposing a CPI-X type constraint. In its Ports Monitoring Report, the
ESC (2011) calculated the PoMC‟s rate of return in providing „prescribed services‟ to be 5.1%
for 2009-10, down from 6.4% in 2008-09 and 8.1% in 2007-08. The PoMC earned a rate of
return on the whole of its business (including prescribed services) of 3.4% in 2009-10. If the
ESC were to conclude that the PoMC was misusing its market power, it could then amend the
most recent PMD to reintroduce price controls for example (ESC 2009, 30).
The discussion in Chapter 2 considered that regulation should always be set to a minimal
level required to achieve its objective. In the absence of evidence that the PoMC is misusing
its market power, price monitoring and fairly onerous reporting requirements seem adequate
for now.
3.5.2 Access Regime
Part 3 Division 4 of the Port Management Act sets up a third party access regime that
requires operators of certain channels to provide access on fair and reasonable terms (Section
58). For the regime to apply, a channel must be declared to be a „significant infrastructure
facility‟ by the Governor in Council. Currently however, no access channels have been so
declared (ESC 2009, 26), so the access regime has not been activated. Once this has occurred,
access seekers can refer disputes (including price disputes) to the Commission for a
determination in accordance with the ESC Act (Port Management Act, Section 60).
61
3.6 Queensland
Until recently, Queensland ports existed as state owned port authority corporations. In
November 2010, the State Government sold the Port of Brisbane Pty Ltd to consortium Q
Port Holdings. Chapter 8, Part 3 of the Transport Infrastructure Act 1994 (Qld) sets up the
functions and power of port authorities. Part 3A sets out the right to collect port charges for a
broad range of port activities including the operation and maintenance of port facilities
(Section 279A). This section also requires the relevant entity to publish its standard charges
and conditions on its website.
3.6.1 Price Regulation
The Queensland Competition Authority (QCA) was established in 1997 to regulate prices and
access under the Queensland Competition Authority Act 1997 (Qld) (QCA Act) (Gray 2009,
63). Its functions include monitoring pricing in monopoly business activities and resolving
access disputes through mediation (Section 10). Under Section 18, the QCA may ask
government to declare a government business activity to be a monopoly business activity.22
The significance of this is that it enables the QCA to conduct ongoing investigation into a
business‟ pricing practices (Section 22). Unlike the independent regulators in South Australia
and Victoria however, the QCA has no power to make pricing determinations. Its powers are
restricted to monitoring and reporting to government.
3.6.2 Access Regime
Part 5 of the QCA Act outlines the State‟s access regime to significant infrastructure. Port
infrastructure is expressly defined to apply. Section 76 outlines the criteria that must be
satisfied before: (a) the QCA can recommend that the Ministers declare a service; and (b) the
Ministers can declare that service. The access criteria are as follows:
22 Non-government business activities may also be declared government monopoly services under Section 21A.
62
(a) That access to the service would promote a material increase in competition in at
least one other market;
(b) That it would be uneconomical to duplicate the facility for the service;
(c) That the facility for the service is significant to the Queensland economy;
(d) That access can be provided safely; and
(e) That access would not be contrary to public interest.
With regards to (b), recall from Chapter 2 that the inherent nature of some port infrastructure
means that it may be more efficiently provided by a single entity, on grounds that it exists as
a natural monopoly. It is in these circumstances that a facility like a port would be
„uneconomical to duplicate‟.
If a service is declared to be monopoly business activity, Section 99 of the QCA Act imposes
an obligation on the facility provider to negotiate an access agreement with the access seeker.
In doing so, the provider must negotiate in good faith (Section 100) and attempt to satisfy the
access seeker‟s reasonable requirements under Section 101. Access disputes can be referred
by the QCA to mediation under Section 115A where appropriate, or to arbitration under
Section 116. The QCA can then make an access determination, for example, requiring the
access provider to provide access to the access seeker and on what terms (Sections 117, 118).
Under Part 5, Division 7, the QCA can approve an access undertaking given to it by an access
provider. Such an undertaking may include how charges are to be calculated, among other
things. In 2006, the QCA approved such an undertaking in respect of the coal handling
services at the Dalrymple Bay Coal Terminal (DBCT), leased by the QLD government to
Babcock and Brown Infrastructure.

63
3.7 New South Wales
New South Wales ports were corporatised in 1995 under three state owned port corporations:
Sydney Ports Corporation, Port Kembla Ports Corporation and Newcastle Ports Corporation.
Similarly to the Port Authorities Act 1999 (WA), the Ports and Maritime Administration Act
1995 (NSW) (PMA Act) intends for port corporations to behave in a commercial manner, to
operate efficiently and promote and facilitate trade (Section 9). Section 10 establishes the
functions of the port corporations which include the management and operation of port
facilities and services. Section 10A expressly requires port corporations to comply with
Ministerial directions in relation to these functions.
3.7.1 Price and Access Regulation
The PMA Act sets out a fairly comprehensive pricing regime in Part 5, which in summary,
allows the Minister to set charges (Gray 2009, 63). Power to set charges is vested in the
„relevant port authority‟.23
Owners of vessels are required to pay a navigation service charge
for general use of the port and its infrastructure to the Port Corporation (Section 50). Pilotage
charges are fixed subject to the Minister‟s approval under Section 54. The Minister also has
the authority to fix port cargo access charges under Section 57. Site occupation (Section 60)
and wharfage (Section 61) charges are also payable. In summary then, there exists significant
scope for Ministerial involvement in fixing charges. NSW ports do not appear to enjoy the
relative autonomy that WA port authorities do for example.
Prices for port services are currently not subject to independent regulatory oversight like they
are in South Australia and Victoria (Price Waterhouse Coopers 2007, 89). However, there
23 The „relevant port authority‟ depends on the charge. For navigation service charges, the port corporation is the relevant port authority, whilst the Minister is the relevant port authority for port cargo access charges. See Section 47 for the full list of relevant port authorities.
64
exists scope for such regulation in the future through the Independent Pricing and Regulatory
Tribunal (IPART). IPART was established by the Independent Pricing and Regulatory
Tribunal Act 1992 (NSW) (IPART Act). IPART investigates and reports to the Minister on
pricing determinations for „government monopoly services‟ and periodic reviews of their
pricing policies (Section 11). Section 4 defines government monopoly services as those
supplied by a government agency and declared by the Minister to be a government monopoly
services. Such a declaration certifies that the service:
(a) Has no other suppliers with which to provide competition in that part of the
market; and
(b) For which there is no contestable market by potential suppliers.
IPART is empowered to make pricing determinations under Part 3 much like the Essential
Services Commissions in South Australia and Victoria. As yet however, no port services have
been declared government monopoly services, so are not subject to IPART regulation. There
exists potential for such regulation in the future however. Likewise, there is no State-based
third party access regime (Price Waterhouse Coopers 2007, 20). The Price Waterhouse
Coopers (2007, 4) review found no evidence to suggest that access had not been provided on
competitively neutral grounds.
3.8 Tasmania
3.8.1 Price and Access Regulation
Like most State governments, Tasmania opted for corporatisation of its ports. The Tasmanian
Ports Corporation was created in 2005 under the Tasmanian Ports Corporation Act 2005
(Tas). The objectives of the corporation are to facilitate trade to benefit Tasmania and operate
in accordance with sound commercial principles (Section 6). The Act does not outline the
65
day-to-day management of Tasmanian ports however. The power to levy fees and charges, to
provide navigational aids, and other functions commonly found in other States‟ legislation
are noticeably absent. Likewise, there is no mention of access to port infrastructure. This
could be explained by the fact that Tasmania is the only jurisdiction (excluding the ACT) that
does not have any „significant‟ ports under CIRA.
It is likely that the Tasmanian Ports Corporation will set port charges subject to Ministerial
approval, as is the case in WA and the NT. However, the legislative source of this power at
the time of writing is unknown.
3.9 Commonwealth
The Competition and Consumer Act 2010 (Cth) provides the framework for the National
Access Regime (NAR), price surveillance and prohibiting anti-competitive practices (Gray
2009, 3). The most important of these for our purpose is the NAR. It should be noted that this
Act applies to all States and Territories. That is, even those States without independent
regulation of pricing and access are within the jurisdiction of the Act.
3.9.1 National Access Regime
The NAR exists under Part IIIA of the Competition and Consumer Act. Essentially, once a
service is „declared‟ under the regime, parties who cannot agree on terms and conditions of
access can apply to the ACCC for an arbitration determination (Gray 2009, 3).
The relevant Minister, or any other person can ask the National Competition Council (NCC)
to recommend that a particular service be declared (Section 44F). Under Section 44H, the
designated Minister may declare a service after receiving a recommendation. Section 44M
enables State or Territory governments to request that the NCC recommend to the
Commonwealth Minister that an access regime is an „effective access regime‟. Upon
66
receiving such a recommendation, the Commonwealth Minister may decide that the access
regime is an effective regime for the service (Section 44N). In making his/her decision, the
Minister must have regard to the relevant principles set out in the Competition Principles
Agreement.
The procedure for access disputes is embodied in Division 2 of Part IIIA. Where a third party
and an access provider cannot agree on terms and conditions of access to a declared service,
either party may notify the ACCC (Section 44S). Under Section 44V, the ACCC can make an
arbitration determination which might include requiring the access provider to provide access
and on what terms. A final determination must take into account the matters outlined in
Section 44X including the legitimate business interests of the provider, public interest, the
direct cost of provision, the economically efficient operation of the facility and the pricing
principles outlined in Section 44ZZCA. These principles include setting the price so as to
generate revenue at least sufficient to cover the costs of providing access plus a rate of return,
and provide incentives to reduce costs.
The Act also allows the ACCC to certify access undertakings as effective under Section
44ZZA. An access undertaking set out the terms and conditions of third party access to the
access provider‟s infrastructure (McInerney, Nadarajah and Perkins 2007, 28).
Currently in Australia, there is only one port access regime that has been certified as effective
under the Act. In May 2011, the South Australian Ports Access Regime was certified as an
effective regime under Section 44N of the Act.
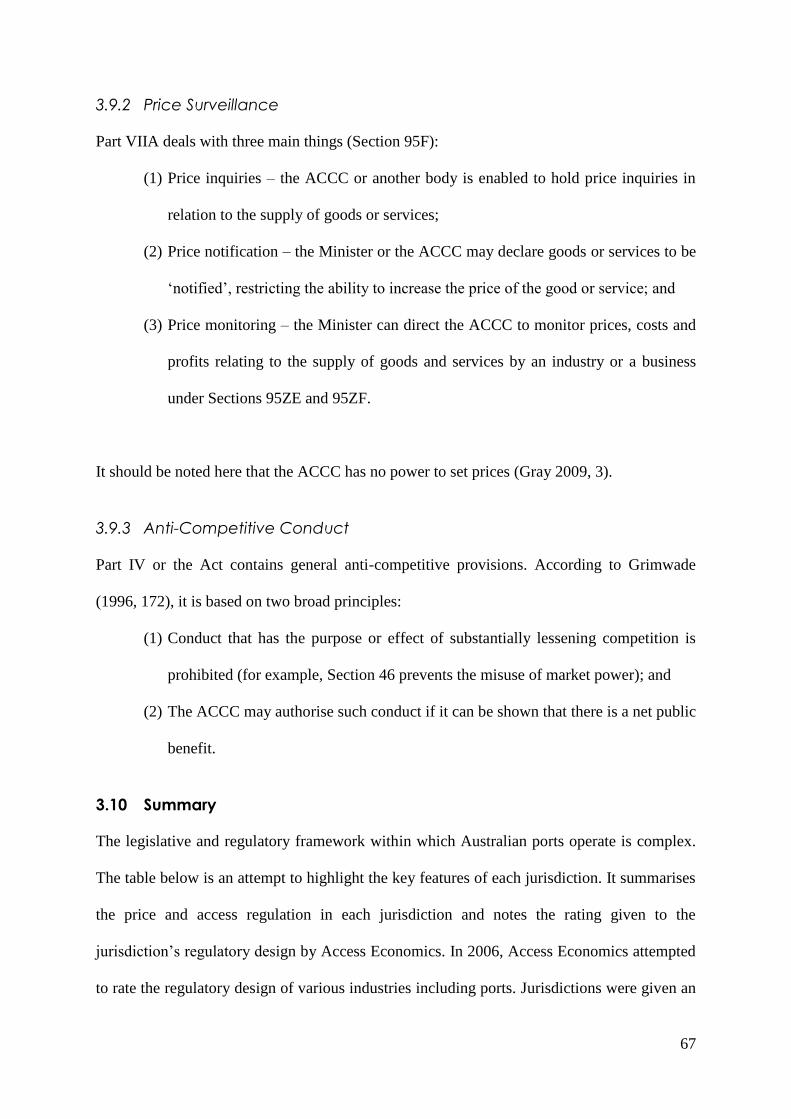
67
3.9.2 Price Surveillance
Part VIIA deals with three main things (Section 95F):
(1) Price inquiries – the ACCC or another body is enabled to hold price inquiries in
relation to the supply of goods or services;
(2) Price notification – the Minister or the ACCC may declare goods or services to be
„notified‟, restricting the ability to increase the price of the good or service; and
(3) Price monitoring – the Minister can direct the ACCC to monitor prices, costs and
profits relating to the supply of goods and services by an industry or a business
under Sections 95ZE and 95ZF.
It should be noted here that the ACCC has no power to set prices (Gray 2009, 3).
3.9.3 Anti-Competitive Conduct
Part IV or the Act contains general anti-competitive provisions. According to Grimwade
(1996, 172), it is based on two broad principles:
(1) Conduct that has the purpose or effect of substantially lessening competition is
prohibited (for example, Section 46 prevents the misuse of market power); and
(2) The ACCC may authorise such conduct if it can be shown that there is a net public
benefit.
3.10 Summary
The legislative and regulatory framework within which Australian ports operate is complex.
The table below is an attempt to highlight the key features of each jurisdiction. It summarises
the price and access regulation in each jurisdiction and notes the rating given to the
jurisdiction‟s regulatory design by Access Economics. In 2006, Access Economics attempted
to rate the regulatory design of various industries including ports. Jurisdictions were given an
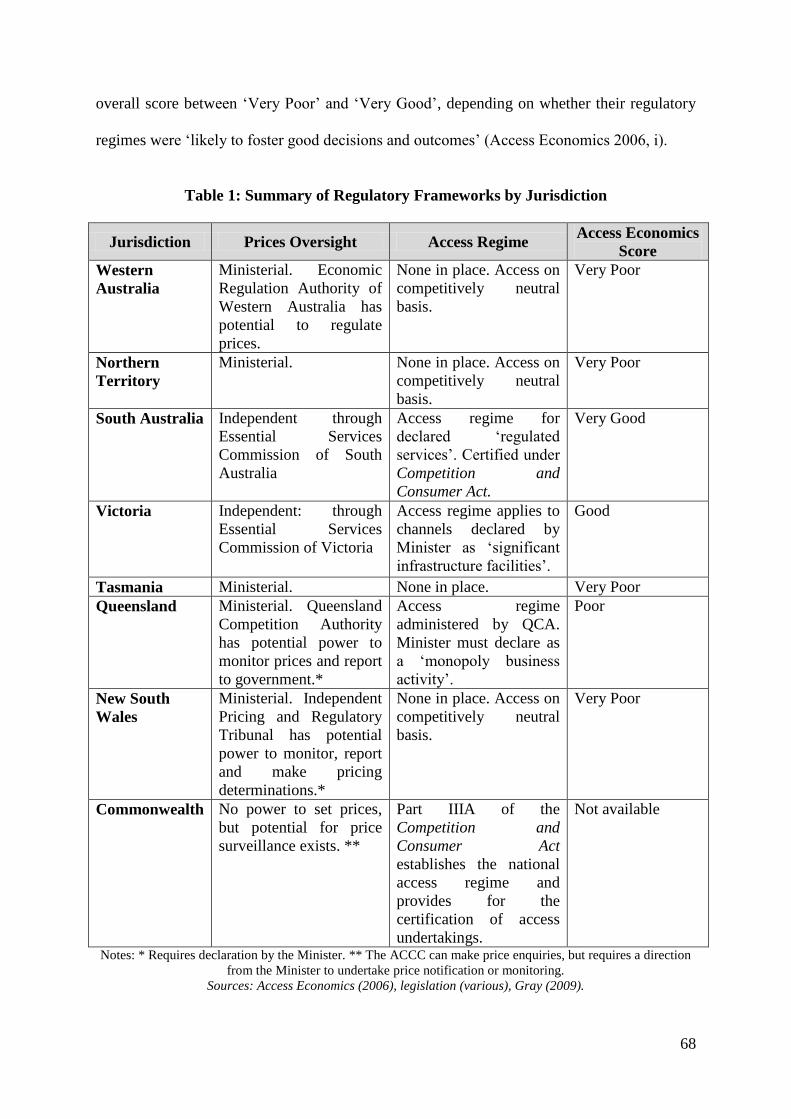
68
overall score between „Very Poor‟ and „Very Good‟, depending on whether their regulatory
regimes were „likely to foster good decisions and outcomes‟ (Access Economics 2006, i).
Table 1: Summary of Regulatory Frameworks by Jurisdiction
Jurisdiction Prices Oversight Access Regime Access Economics
Score
Western
Australia
Ministerial. Economic
Regulation Authority of
Western Australia has
potential to regulate
prices.
None in place. Access on
competitively neutral
basis.
Very Poor
Northern
Territory
Ministerial. None in place. Access on
competitively neutral
basis.
Very Poor
South Australia Independent through
Essential Services
Commission of South
Australia
Access regime for
declared „regulated
services‟. Certified under
Competition and
Consumer Act.
Very Good
Victoria Independent: through
Essential Services
Commission of Victoria
Access regime applies to
channels declared by
Minister as „significant
infrastructure facilities‟.
Good
Tasmania Ministerial. None in place. Very Poor
Queensland Ministerial. Queensland
Competition Authority
has potential power to
monitor prices and report
to government.*
Access regime
administered by QCA.
Minister must declare as
a „monopoly business
activity‟.
Poor
New South
Wales
Ministerial. Independent
Pricing and Regulatory
Tribunal has potential
power to monitor, report
and make pricing
determinations.*
None in place. Access on
competitively neutral
basis.
Very Poor
Commonwealth No power to set prices,
but potential for price
surveillance exists. **
Part IIIA of the
Competition and
Consumer Act
establishes the national
access regime and
provides for the
certification of access
undertakings.
Not available
Notes: * Requires declaration by the Minister. ** The ACCC can make price enquiries, but requires a direction
from the Minister to undertake price notification or monitoring.
Sources: Access Economics (2006), legislation (various), Gray (2009).
69
3.11 Conclusion
This section has attempted to summarise the current regulatory framework that Australia‟s
ports exist in. The framework is complex, with ports operating under a „plethora of regulators‟
(Everett 2007, 108-109). Despite this, Australian ports do not appear to be over-regulated:
whilst there are numerous sources of regulation, the substance is not overly burdensome.
Although Victorian and South Australian ports are subject to price and access regulation by
independent bodies (and potentially, Western Australia and Queensland too), regulation is
currently limited to price monitoring. The existing regulatory frameworks in those
jurisdictions are contingent upon regular reviews of pricing and access arrangements. The
Essential Service Commissions of South Australia and Victoria can implement more
prescriptive regulation if they deem it necessary to prevent the misuse of market power.
It is useful to compare the regulatory environment in Australia with that of New Zealand. The
New Zealand government partially or fully privatised six of its commercial ports in the 1990s
(Layton 2010, 4-5). The majority of these ports have been retained by local authorities. New
Zealand ports also operate under several sources of legislation, with the primary Port
Companies Act 1988 (NZ) insisting that ports „operate a commercial business‟ (Layton 2010,
8). Port reform in the 1980‟s led to improved financial performance of New Zealand ports
(Reveley and Tull 2008, 38). However, there is evidence that the benefits of privatisation and
port reform have not flowed on to New Zealand port users (see Tull and Reveley 2001, 92).
Port reform and privatisation have not addressed the “chaotic port development and chronic
overcapacity” (Reveley and Tull 2008, 38).
The Access Economics scorecard rated port regulation in NSW, WA, NT and Tasmania as
„very poor‟, with QLD getting a score of „poor‟ (Access Economics 2006, iii). According to
that review, “these regimes lacked an independent or transparent regulatory process, with
70
pricing and access decisions made inside publically owned corporations” (2006, iii). It has
been suggested that the review of WA had a „narrow focus‟ that did not consider actual
performance outcomes adequately take into account the existing legislation which promotes
“focus, transparency and accountability” (Tull and Affleck 2008, 2-6).24
Those authors also
note (2008, 7) that a 2001 review into port reform in Victoria by the Department of
Infrastructure (2001, 73, 80, 80-85) found that there had been no overall reduction in costs to
shippers, favoured privately owned ports and restricted the publically owned ports in terms of
new capital expenditure and maintaining existing capital.
Everett (2006) offers a different perspective. She questions the reason behind the regulation
of privately owned terminals as „natural monopolies‟, asking if „regulated competition‟ does
not somewhat contradict the objectives of deregulation and the NCP (Everett 2006, 55): “if
the ability to respond to market forces is not feasible for a privately owned „natural
monopoly‟, is this perhaps a valid argument in favour of retaining government ownership?”
Government ownership need not mean the absence of good regulatory principles. As Reveley
and Tull (2008, 39) suggest, efficient ports can emerge from a range of institutional
frameworks. Everett (2006, 51, 55) considers that the privatisation of some Australian
terminals has arguably necessitated regulation to protect users‟ interests.25
Perhaps by
extension then, the lack of current independent regulation in the other jurisdictions is not an
institutional failure, but instead a result of there being no „clear need‟ (citing CIRA cl. 4.1)
for it.
24 The Access Economics Scorecard restricts itself in this regard, instead focusing on whether a particular regulatory framework is “likely to
foster good decisions and outcomes” (Access Economics 2006, i). 25 It should be noted that Everett‟s article was written before the privatisation of the Port of Brisbane in 2010.

71
4 Case Study: Flinders Ports 4.1 Introduction
The focus of this chapter will be a case study of Flinders Ports. The purpose of doing so is to
see whether there have been efficiency gains, and determine who has benefited from them.
That is, have the benefits of privatisation been passed on to port users or have they merely
benefited the company‟s shareholders. Originally, I intended to undertake a case study of the
recently privatised Port of Brisbane. The Port of Brisbane was leased for 99 years by the
Queensland government in November of 2010 to the Q Port Holdings consortium and the
Abu Dhabi Investment Authority. Unfortunately, the lack of financial performance
information available made this impossible. At the time of writing, there were no financial
reports lodged with the Australian Securities and Investment Commission (ASIC). This is
likely because a whole financial year has not passed since the port‟s sale. Furthermore, the
annual report of Port of Brisbane Pty Ltd contains no financial information with which to
make an assessment.26
Assessing port performance is a difficult task and a number of different approaches can be
taken. Talley (1994, 339) notes that port performance has traditionally been assessed by
comparing actual throughput against optimum throughput for a given time period. Talley
(1994, 340) refers to this as the „engineering optimum‟ rather than the „economic optimum‟.
The latter is one which satisfies an economic objective or some other objective of the port,
recognising that private and publically owned ports may have different objectives. Where a
26 The report does not include information such as revenue, profit or the rate of return on assets, among other indicators of operational performance.
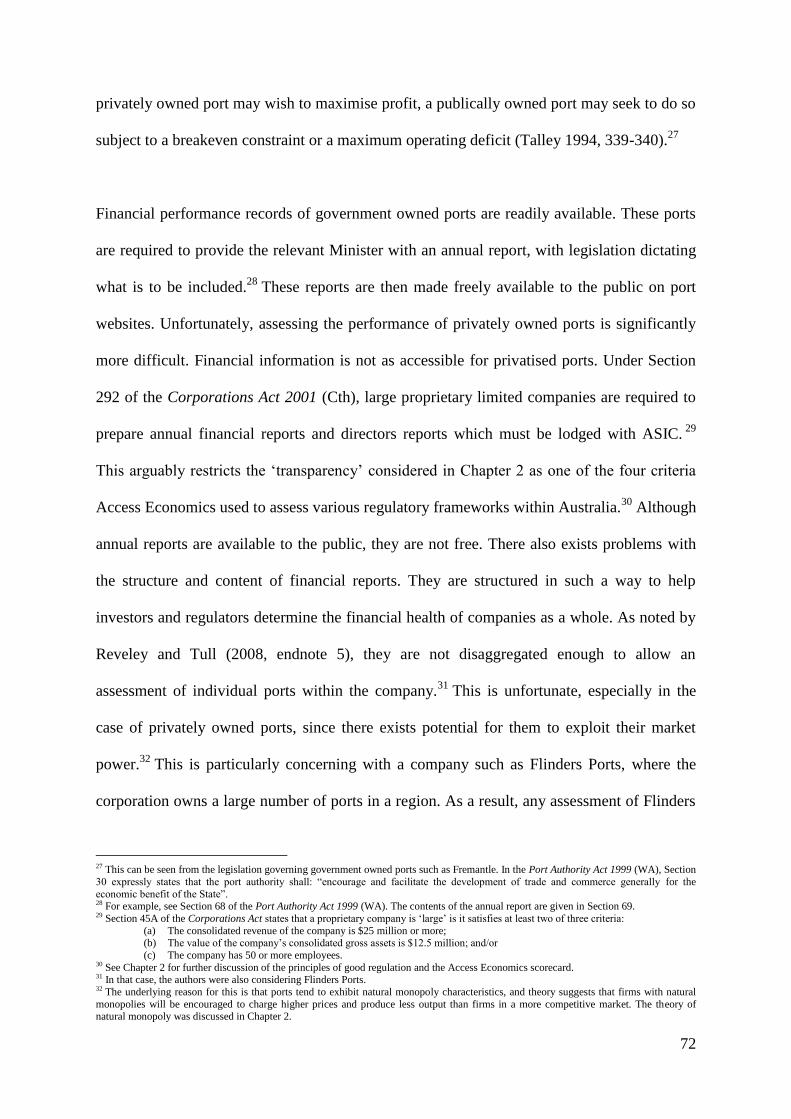
72
privately owned port may wish to maximise profit, a publically owned port may seek to do so
subject to a breakeven constraint or a maximum operating deficit (Talley 1994, 339-340).27
Financial performance records of government owned ports are readily available. These ports
are required to provide the relevant Minister with an annual report, with legislation dictating
what is to be included.28
These reports are then made freely available to the public on port
websites. Unfortunately, assessing the performance of privately owned ports is significantly
more difficult. Financial information is not as accessible for privatised ports. Under Section
292 of the Corporations Act 2001 (Cth), large proprietary limited companies are required to
prepare annual financial reports and directors reports which must be lodged with ASIC. 29
This arguably restricts the „transparency‟ considered in Chapter 2 as one of the four criteria
Access Economics used to assess various regulatory frameworks within Australia.30
Although
annual reports are available to the public, they are not free. There also exists problems with
the structure and content of financial reports. They are structured in such a way to help
investors and regulators determine the financial health of companies as a whole. As noted by
Reveley and Tull (2008, endnote 5), they are not disaggregated enough to allow an
assessment of individual ports within the company.31
This is unfortunate, especially in the
case of privately owned ports, since there exists potential for them to exploit their market
power.32
This is particularly concerning with a company such as Flinders Ports, where the
corporation owns a large number of ports in a region. As a result, any assessment of Flinders
27 This can be seen from the legislation governing government owned ports such as Fremantle. In the Port Authority Act 1999 (WA), Section
30 expressly states that the port authority shall: “encourage and facilitate the development of trade and commerce generally for the
economic benefit of the State”. 28 For example, see Section 68 of the Port Authority Act 1999 (WA). The contents of the annual report are given in Section 69. 29 Section 45A of the Corporations Act states that a proprietary company is „large‟ is it satisfies at least two of three criteria:
(a) The consolidated revenue of the company is $25 million or more; (b) The value of the company‟s consolidated gross assets is $12.5 million; and/or
(c) The company has 50 or more employees. 30 See Chapter 2 for further discussion of the principles of good regulation and the Access Economics scorecard. 31 In that case, the authors were also considering Flinders Ports. 32 The underlying reason for this is that ports tend to exhibit natural monopoly characteristics, and theory suggests that firms with natural
monopolies will be encouraged to charge higher prices and produce less output than firms in a more competitive market. The theory of natural monopoly was discussed in Chapter 2.
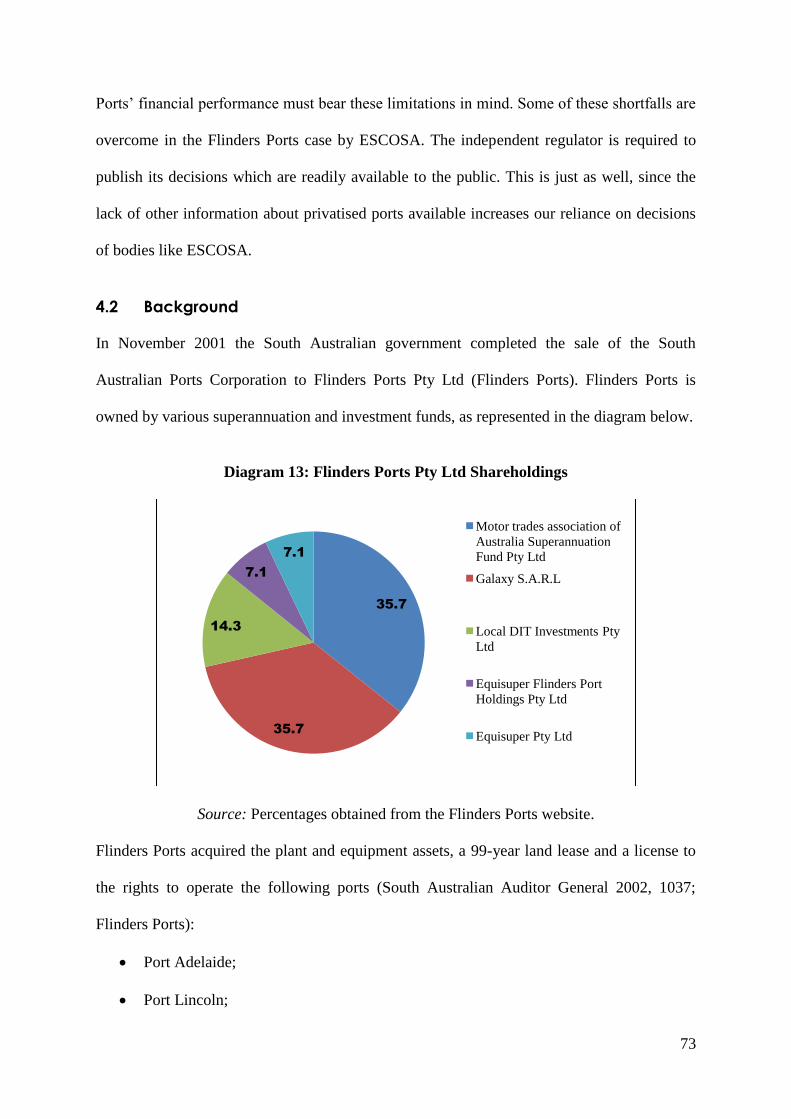
73
Ports‟ financial performance must bear these limitations in mind. Some of these shortfalls are
overcome in the Flinders Ports case by ESCOSA. The independent regulator is required to
publish its decisions which are readily available to the public. This is just as well, since the
lack of other information about privatised ports available increases our reliance on decisions
of bodies like ESCOSA.
4.2 Background
In November 2001 the South Australian government completed the sale of the South
Australian Ports Corporation to Flinders Ports Pty Ltd (Flinders Ports). Flinders Ports is
owned by various superannuation and investment funds, as represented in the diagram below.
Diagram 13: Flinders Ports Pty Ltd Shareholdings
Source: Percentages obtained from the Flinders Ports website.
Flinders Ports acquired the plant and equipment assets, a 99-year land lease and a license to
the rights to operate the following ports (South Australian Auditor General 2002, 1037;
Flinders Ports):
Port Adelaide;
Port Lincoln;
35.7
35.7
14.3
7.1
7.1
Motor trades association of
Australia Superannuation
Fund Pty Ltd
Galaxy S.A.R.L
Local DIT Investments Pty
Ltd
Equisuper Flinders Port
Holdings Pty Ltd
Equisuper Pty Ltd
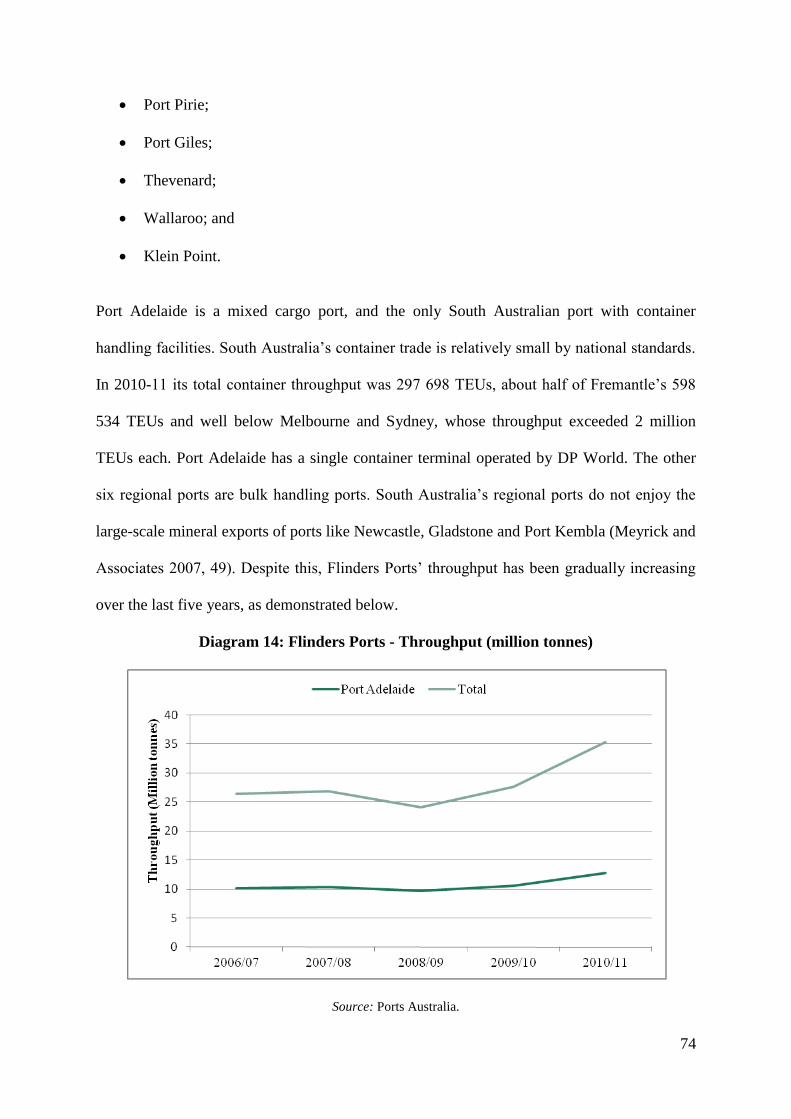
74
Port Pirie;
Port Giles;
Thevenard;
Wallaroo; and
Klein Point.
Port Adelaide is a mixed cargo port, and the only South Australian port with container
handling facilities. South Australia‟s container trade is relatively small by national standards.
In 2010-11 its total container throughput was 297 698 TEUs, about half of Fremantle‟s 598
534 TEUs and well below Melbourne and Sydney, whose throughput exceeded 2 million
TEUs each. Port Adelaide has a single container terminal operated by DP World. The other
six regional ports are bulk handling ports. South Australia‟s regional ports do not enjoy the
large-scale mineral exports of ports like Newcastle, Gladstone and Port Kembla (Meyrick and
Associates 2007, 49). Despite this, Flinders Ports‟ throughput has been gradually increasing
over the last five years, as demonstrated below.
Diagram 14: Flinders Ports - Throughput (million tonnes)
Source: Ports Australia.
75
4.3 Port Performance Indicators
An alternative methodology to evaluating port performance by comparing actual to optimum
throughput is to use performance indicators (Talley 2007, 500). The purpose of using
indicators is to gauge the change in the utilisation and productivity of port resources, either
over time, or relative to other ports (Talley 2007, 507). The main objective of this study is to
try to determine the extent to which the benefits of privatisation have flowed on to port users
in terms of increased efficiency and lower prices. Central to this issue is the potential
incompatibility of port user and shareholder interests. One theory of corporations is that they
exist to maximise the interests of shareholders by maximising the value of the company
(Keay 2007, 577-8). Section 181 of the Corporations Act 2001 (Cth) embodies a
corporation‟s paramount duty to its shareholders (Bottomley and Forsyth 2006, 12).33
It is
easy to see the potential conflict between the interests of port users and shareholders of a
privately owned port such as Flinders Ports. Port users would clearly favour lower port
charges, whereas shareholders might favour higher charges where it would increase the value
of their shareholding.
The following assessment of Flinders Ports will rely on some performance indicators which
are commonly used when evaluating port performance outcomes. It is necessary to consider a
range of performance indicators, as various stakeholders (e.g. shareholders, users,
government) have different interests (Tull and Reveley 2001, 86; Tull and Affleck 2008, 12).
Both financial and non-financial indicators will be used as it is generally accepted that ports
compete on price and non-price grounds (Reveley and Tull 2008, 28). Indicators of financial
performance include return on assets, dividend payout ratios and changes in port costs per
unit of cargo. These indicators suggest the port‟s financial health, and whether profits are
33 Section 181(1) of the Act requires directors and officers of the company to “exercise their powers and discharge their duties: (a) in good faith in the best interests of the corporation”.

76
being pumped back into the port to benefit users or instead, paid as dividends to benefit
shareholders. Financial indicators only give a partial view of the performance of a port. It is
helpful to consider other indicators that focus on the operational side of the port business,
including physical measures of output and levels of service (Tull and Affleck 2008, 3). For
example, ship turnaround times and their variation are useful indicators of port efficiency and
reliability. A shipping line who has the choice of two ports would clearly prefer to visit the
port where it could unload/load cargo most quickly, all other things being equal. In using a
combination of performance indicators, this chapter will attempt to evaluate the performance
of Flinders Ports over the last five years, with comparisons to other Australian ports where
appropriate.
4.3.1 Financial Indicators
In 2010-11 Flinders Ports posted after-tax profits some 227% higher than last year‟s efforts.
This follows two years of falling profits, likely caused by the effect of the GFC on global
trade and freight markets. However, Flinders Ports do not offer any explanation on their
website about the annual performance of their ports.
Table 2: Flinders Ports Profit
($'000)
2006/07 2007/08 2008/09 2009/10 2010/11
Before Tax 14920 20398 10984 9513 22380
After Tax 10584 24404 10122 6890 15674
Source: ASIC, Annual Financial Reports: Flinders Ports Pty Ltd, 2005-06 to 2010-11.
The table above shows before tax and after tax profits over the period 2006-07 to 2010-11.
Flinders Ports have remained consistently profitable throughout this period. If we then
consider this profit against total throughput, we can get an idea as to how profitable the port
is for each tonne of cargo it handles.
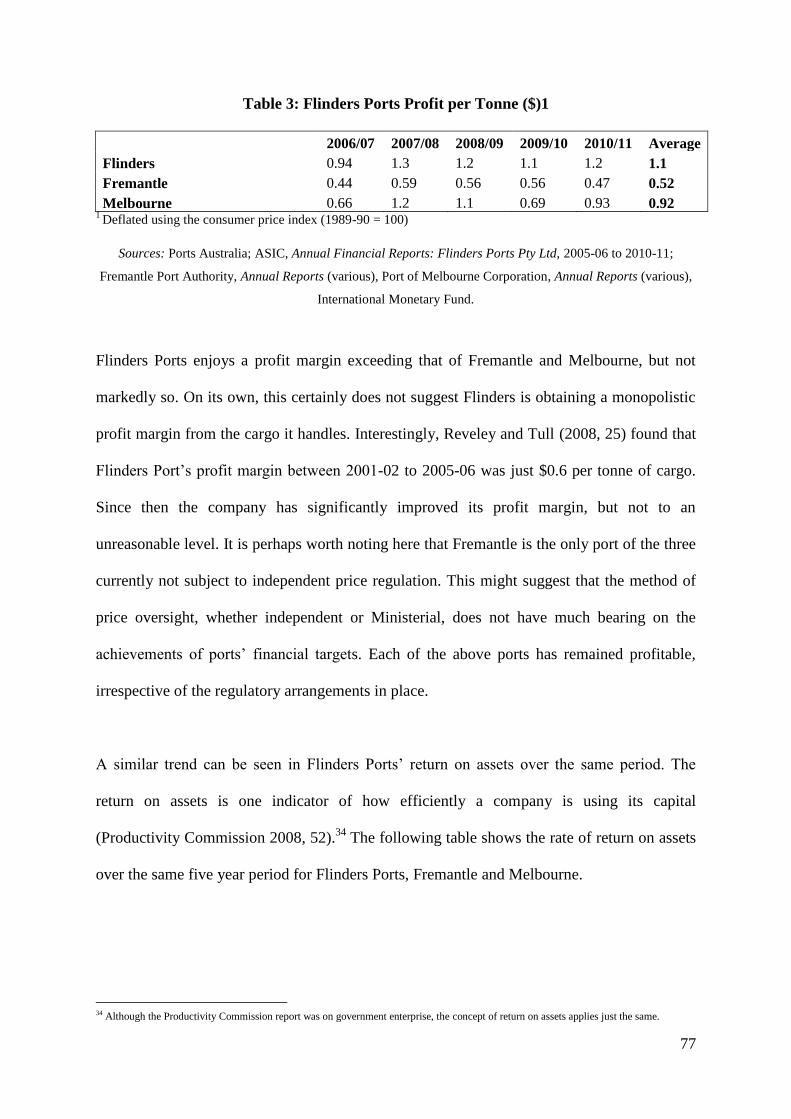
77
Table 3: Flinders Ports Profit per Tonne ($)1
2006/07 2007/08 2008/09 2009/10 2010/11 Average
Flinders 0.94 1.3 1.2 1.1 1.2 1.1
Fremantle 0.44 0.59 0.56 0.56 0.47 0.52
Melbourne 0.66 1.2 1.1 0.69 0.93 0.92 1 Deflated using the consumer price index (1989-90 = 100)
Sources: Ports Australia; ASIC, Annual Financial Reports: Flinders Ports Pty Ltd, 2005-06 to 2010-11;
Fremantle Port Authority, Annual Reports (various), Port of Melbourne Corporation, Annual Reports (various),
International Monetary Fund.
Flinders Ports enjoys a profit margin exceeding that of Fremantle and Melbourne, but not
markedly so. On its own, this certainly does not suggest Flinders is obtaining a monopolistic
profit margin from the cargo it handles. Interestingly, Reveley and Tull (2008, 25) found that
Flinders Port‟s profit margin between 2001-02 to 2005-06 was just $0.6 per tonne of cargo.
Since then the company has significantly improved its profit margin, but not to an
unreasonable level. It is perhaps worth noting here that Fremantle is the only port of the three
currently not subject to independent price regulation. This might suggest that the method of
price oversight, whether independent or Ministerial, does not have much bearing on the
achievements of ports‟ financial targets. Each of the above ports has remained profitable,
irrespective of the regulatory arrangements in place.
A similar trend can be seen in Flinders Ports‟ return on assets over the same period. The
return on assets is one indicator of how efficiently a company is using its capital
(Productivity Commission 2008, 52).34
The following table shows the rate of return on assets
over the same five year period for Flinders Ports, Fremantle and Melbourne.
34 Although the Productivity Commission report was on government enterprise, the concept of return on assets applies just the same.

78
Table 4: Flinders Ports Return on Assets (%)
2006/07 2007/08 2008/09 2009/10 2010/11 Average
Flinders 8.3 11.1 8.5 9.1 14 10.2
Fremantle 9.6 12.7 8.6 6.9 6.1 8.78
Melbourne 3.4 5 4 3.4 3.9 3.94
Sources: ASIC, Annual Financial Reports: Flinders Ports Pty Ltd, 2005-06 to 2010-11; Fremantle Port
Authority, Annual Reports (various); Port of Melbourne Corporation, Annual Reports (various). 35
Flinders Ports‟ return on assets has remained quite stable over the 5 year period. Although
higher than the government owned ports of Fremantle and Melbourne, Flinders Ports‟ rates of
return do not suggest they have been exploiting monopoly power. Indeed, the difference in
average rates of return of Flinders Ports and Fremantle is only marginal. As mentioned earlier,
the financial data used to calculate Flinders Ports‟ financial performance exists in aggregate,
across the entire company. It does not allow an examination of financial performance on a
port-by-port basis.
Flinders Port‟s return on assets of 14% in 2010-11 is certainly not excessive by commercial
standards.36
The average rate of return over the period 2006-07 to 2010-11 of 10.2% is the
same as that observed by Reveley and Tull (2008, 26) over the 10 year period 1993-94 to
2004-05. Notwithstanding the one year gap in the data, Flinders Ports‟ return on assets is
remarkably stable over this extended period.
Profits and return on assets do not give us a complete financial picture of Flinders Ports.
Another potentially useful tool is to consider the dividend payout ratio: the ratio of dividends
paid to shareholders as a proportion of net profit. The dividend payout ratio can give us an
idea as to the eventual use of that profit. A low ratio suggests that profits are retained by the
35 Total average assets is taken by averaging the total assets (current and non-current) at the beginning and end of the financial period. The
rate of return on assets was followed the following formula: earnings before interest and tax (EBIT) / total average assets. 36 A „commercial rate of return‟ is difficult to define, but would likely include a government bond rate plus a premium for the risk involved.

79
port, potentially to benefit users by funding infrastructure developments or reducing costs. By
contrast, a high ratio might suggest that these surpluses are escaping the port, and benefiting
shareholders rather than port users. Obviously, privatised ports like Flinders are likely to pay
greater dividends than government owned ports. The reason for this is simply that companies
exist primarily to benefit their owners, the shareholders. The following table shows dividend
payments as a percentage of net profit.
Table 5: Flinders Ports Dividend Payout Ratio (%)
2006/07 2007/08 2008/09 2009/10 2010/11
Paid or Provided for
($'000) 11488 12407 11000 10500 31500
Ratio (%) 108.5 50.8 108.7 152.4 201.0
Source: ASIC, Annual Financial Reports: Flinders Ports Pty Ltd, 2005-06 to 2010-11.
These ratios are significantly higher than the dividends paid by government owned ports to
the government. WA ports for example are required to pay 50% of after tax profits
(Fremantle Ports 2011, 86). Four of the five financial years show payout ratios in excess of
100 per cent, indicating that Flinders ports paid out all of its current profits plus some
retained profits. Bearing in mind the aggregate nature of the data, it appears that a significant
amount of the producer surplus is being paid out to shareholders, rather than being pumped
back into the ports to benefit port users. While this is expected to an extent, it does suggest
that a privatised port corporation‟s duty to its shareholders may conflict with the interests of
port users.
Another indicator of port performance is price. As discussed in Chapter 2, there is potential
for firms with market power to exploit their position and charge monopoly prices. In 2007,
Meyrick and Associates delivered a report to ESCOSA benchmarking port prices in Australia,
focusing primarily on Essential Maritime Services (EMS). Recall from Chapter 3 that these
80
are broadly outlined in Section 4 of the ESC Act and include charges for allowing access to a
port, providing loading/unloading facilities and providing berths. Overall, it found that
charges for Essential Maritime Services were an estimated 17% higher in South Australia
than in the other interstate comparator ports (Meyrick and Associates 2007, iv). However the
report did find charges for grain and other dry-bulk cargos were generally lower than other
States (2007, 49).
Despite this, Meyrick and Associates concluded that there was no evidence of excessive price
increases, and that existing market pressures combined with the current regulatory
arrangement seem to adequately protect the interests of port users (Meyrick and Associates
2007, vii). The report attributed some of the reason for the price differences to the structure of
the South Australian port industry. Meyrick and Associates (2007, iv) advanced two reasons
that might help to explain the disparity in port charges. Firstly, there are diseconomies of
scale associated with operating a number of geographically dispersed sites, such as low asset
utilisation at remote sites. Secondly, the report noted the under-pricing of many government
owned ports and their failure to achieve adequate returns on assets (perhaps sustainable in a
GBE with other non-profit motivations), contributed to the price difference.
Likewise, ESCOSA in its 2007 Price Monitoring Report, concluded that price movements to
2007 were generally in line with movements in the CPI. ESCOSA acknowledged the Meyrick
and Associates report, ESCOSA (2007, 21) and agreed that the differences in prices are more
likely attributable to the greater presence of economies of scale in other States, rather than the
exercise of market power by Flinders Ports in South Australia. ESCOSA‟s current
methodology seems to be to examine price changes in relation to the CPI. Where price
changes exceed the CPI, ESCOSA seeks to determine whether it is justified and not a
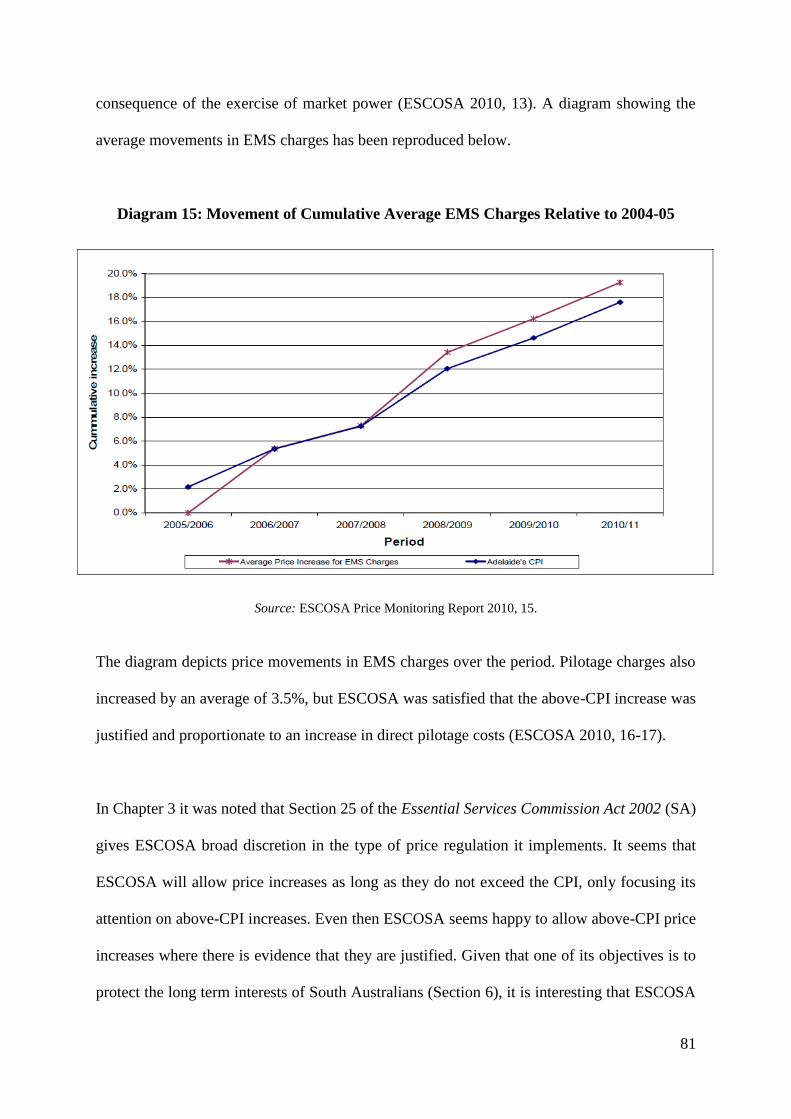
81
consequence of the exercise of market power (ESCOSA 2010, 13). A diagram showing the
average movements in EMS charges has been reproduced below.
Diagram 15: Movement of Cumulative Average EMS Charges Relative to 2004-05
Source: ESCOSA Price Monitoring Report 2010, 15.
The diagram depicts price movements in EMS charges over the period. Pilotage charges also
increased by an average of 3.5%, but ESCOSA was satisfied that the above-CPI increase was
justified and proportionate to an increase in direct pilotage costs (ESCOSA 2010, 16-17).
In Chapter 3 it was noted that Section 25 of the Essential Services Commission Act 2002 (SA)
gives ESCOSA broad discretion in the type of price regulation it implements. It seems that
ESCOSA will allow price increases as long as they do not exceed the CPI, only focusing its
attention on above-CPI increases. Even then ESCOSA seems happy to allow above-CPI price
increases where there is evidence that they are justified. Given that one of its objectives is to
protect the long term interests of South Australians (Section 6), it is interesting that ESCOSA

82
has not opted for a CPI-X type criterion instead, in order promote efficiency and downward
pressure on prices. The fact that it explicitly examines prices with reference to the CPI could
perhaps affect the behaviour of Flinders Ports. There is no real incentive for Flinders Ports to
reduce its prices if the regulator allows them to increase on a CPI basis. Is it not reasonable to
expect a privately owned port company to be able to reduce its charges over time, rather than
increasing them in line with the CPI? It is open to question whether Flinders Ports would be
able to increase its prices this way if the market were more competitive. Despite the
conclusions of Meyrick and Associates and ESCOSA to the contrary, there is evidence to
suggest that Flinders Ports has been exercising market power with regard to pricing.
4.3.2 Non-Financial Indicators
Ports compete on non-price as well as price characteristics (Reveley and Tull 2008, 28). Ports
can lower the cost incurred by shipping lines and other port users by reducing their time in
port (Talley 1994, 339). An efficient port is likely to be more attractive to a potential port
user than an inefficient one. There a number of measures of port efficiency, but I intend to
focus on ship turnaround times and crane rates.
Ship turnaround times refer to the number of hours a container ship is in the port (BITRE
2011, 58). A port with lower turnaround times is likely to be more attractive to shipping lines
and other port users. The average turnaround times at the port of Adelaide are given in the
Table 7, with the ports of Melbourne and Fremantle included for comparison. Over the five
year period to 2010-11, the average turnaround time at Adelaide was 23.3 hours, compared
with 26.9 hours at Fremantle and 31 hours at Melbourne. However, as Reveley and Tull
(2008, 28) explain, differences and variations in shipping and cargo volumes limit the
usefulness of a comparison of these figures.
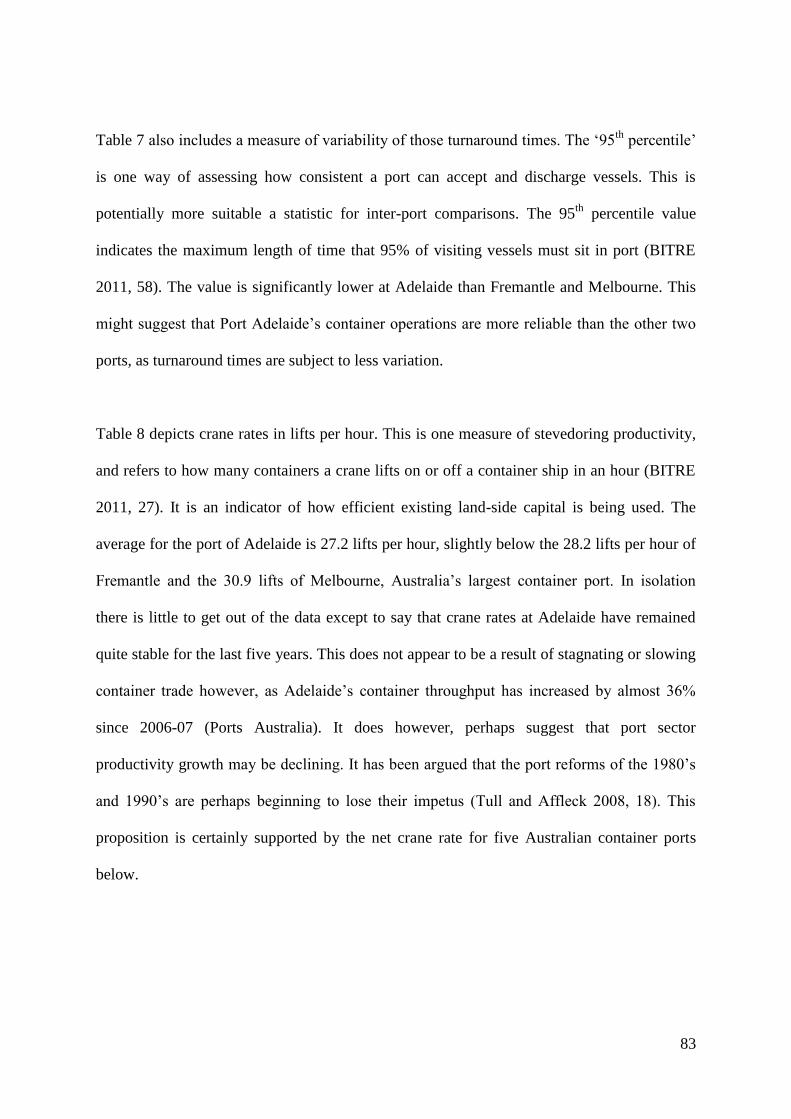
83
Table 7 also includes a measure of variability of those turnaround times. The „95th
percentile‟
is one way of assessing how consistent a port can accept and discharge vessels. This is
potentially more suitable a statistic for inter-port comparisons. The 95th
percentile value
indicates the maximum length of time that 95% of visiting vessels must sit in port (BITRE
2011, 58). The value is significantly lower at Adelaide than Fremantle and Melbourne. This
might suggest that Port Adelaide‟s container operations are more reliable than the other two
ports, as turnaround times are subject to less variation.
Table 8 depicts crane rates in lifts per hour. This is one measure of stevedoring productivity,
and refers to how many containers a crane lifts on or off a container ship in an hour (BITRE
2011, 27). It is an indicator of how efficient existing land-side capital is being used. The
average for the port of Adelaide is 27.2 lifts per hour, slightly below the 28.2 lifts per hour of
Fremantle and the 30.9 lifts of Melbourne, Australia‟s largest container port. In isolation
there is little to get out of the data except to say that crane rates at Adelaide have remained
quite stable for the last five years. This does not appear to be a result of stagnating or slowing
container trade however, as Adelaide‟s container throughput has increased by almost 36%
since 2006-07 (Ports Australia). It does however, perhaps suggest that port sector
productivity growth may be declining. It has been argued that the port reforms of the 1980‟s
and 1990‟s are perhaps beginning to lose their impetus (Tull and Affleck 2008, 18). This
proposition is certainly supported by the net crane rate for five Australian container ports
below.
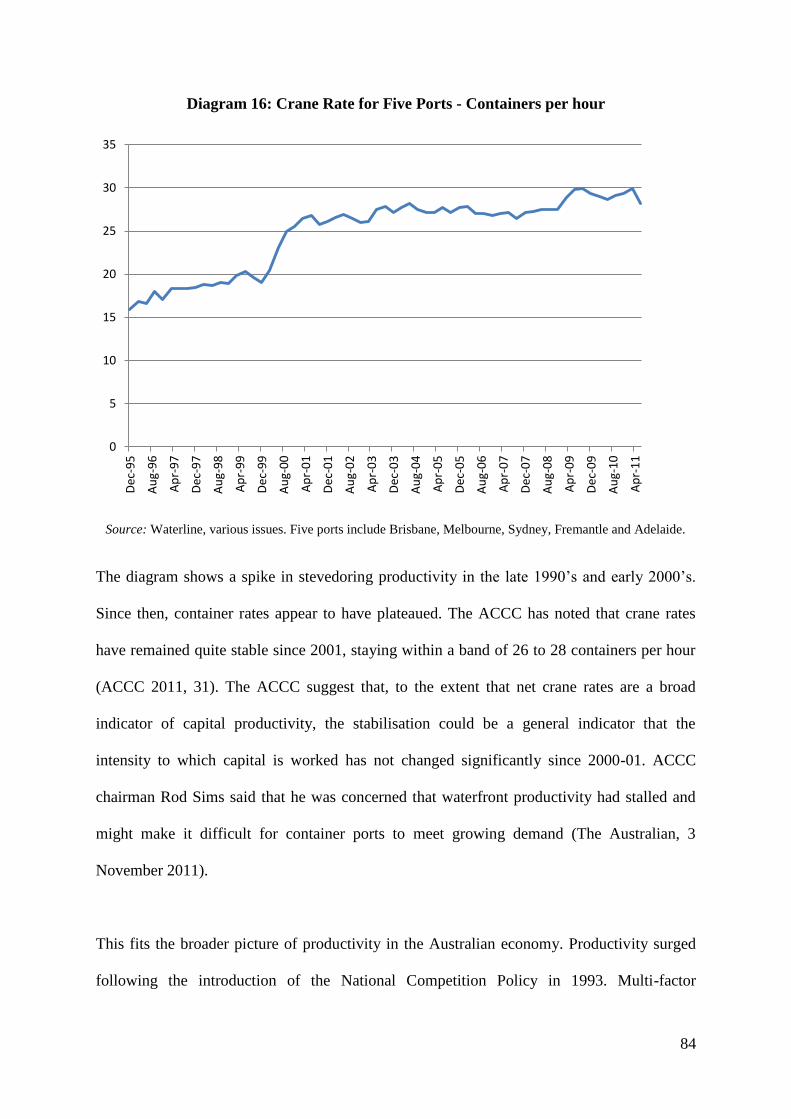
84
Diagram 16: Crane Rate for Five Ports - Containers per hour
Source: Waterline, various issues. Five ports include Brisbane, Melbourne, Sydney, Fremantle and Adelaide.
The diagram shows a spike in stevedoring productivity in the late 1990‟s and early 2000‟s.
Since then, container rates appear to have plateaued. The ACCC has noted that crane rates
have remained quite stable since 2001, staying within a band of 26 to 28 containers per hour
(ACCC 2011, 31). The ACCC suggest that, to the extent that net crane rates are a broad
indicator of capital productivity, the stabilisation could be a general indicator that the
intensity to which capital is worked has not changed significantly since 2000-01. ACCC
chairman Rod Sims said that he was concerned that waterfront productivity had stalled and
might make it difficult for container ports to meet growing demand (The Australian, 3
November 2011).
This fits the broader picture of productivity in the Australian economy. Productivity surged
following the introduction of the National Competition Policy in 1993. Multi-factor
0
5
10
15
20
25
30
35 D
ec-9
5
Au
g-9
6
Ap
r-9
7
Dec
-97
Au
g-9
8
Ap
r-9
9
Dec
-99
Au
g-0
0
Ap
r-0
1
Dec
-01
Au
g-0
2
Ap
r-0
3
Dec
-03
Au
g-0
4
Ap
r-0
5
Dec
-05
Au
g-0
6
Ap
r-0
7
Dec
-07
Au
g-0
8
Ap
r-0
9
Dec
-09
Au
g-1
0
Ap
r-1
1
85
productivity increased 2.3% between 1993-94 and 1998-99, followed by a 1.1% increase
between 1998-99 and 2003-05 (House Standing Committee on Economics 2010, 7). However,
productivity fell by 0.2% between 2003-04 and 2007-08 (ABS 2010, 1370.0). The
Productivity Commission (2009, 20) has suggested that we have exhausted the gains to be
had from earlier reforms. Treasury secretary Dr Martin Parkinson suggested that a „new wave
of reform‟ is needed if we are to increase living standards in the future, noting that the decline
in productivity has coincided with increased incomes from the mining boom (Megalogenis
2011).

86
Table 6: Ship Turnaround Times (hours) - Adelaide, Melbourne Fremantle*
Source: BITRE Waterline 49 and 50. * Container ships only. The „95
th percentile‟ means that 95% of turnaround times are below the stated time (BITRE 2011, 58).
Table 7: Quarterly Crane Rates (lifts per hour) - Adelaide, Melbourne, Fremantle*
Source: BTRE Waterline 50.
*Container ships only.
Jul-Dec 2006 Jan-Jun 2007 Jul-Dec 2007 Jan-Jun 2008 Jul-Dec 2008 Jan-Jun 2009 Jul-Dec 2009 Jan-Jun 2010 Jul-Dec 2010 Jan-Jun 2011 Average
Port of Adelaide
Turnaround time 20 21 20 21 25 24 28 26 25 25.0 23.5
95th percentile 32 35 34 35 39 48 54 42 40 40.0 39.9
Melbourne
Turnaround time 31 31 32 30 31 30 30 32 32 30.0 30.9
95th percentile 62 63 65 56 62 56 62 70 67 69.0 63.2
Fremantle
Turnaround time 25 27 26 29 31 28 26 29 21 24.0 26.6
95th percentile 54 55 51 62 67 57 46 60 47 51.0 55
Jun-08 Sep-08 Dec-08 Mar-09 Jun-09 Sep-09 Dec-09 Mar-10 Jun-10 Sep-10 Dec-10 Mar-11 Jun-11 Average
Adelaide 29.6 29.3 26.5 27.8 26.9 25.2 26.4 25.7 25.4 27.6 27.5 28.0 27.7 27.2
Melbourne 29.4 29.6 30.1 30.3 31.4 31.9 32.0 32.1 31.9 31.3 31.2 32.0 28.8 30.9
Fremantle 27.8 26.2 26.7 29.1 29.9 29.8 30.3 27.6 27.5 26.5 27.9 29.7 27.3 28.2
87
4.4 Conclusion
In the previous chapter it was noted that efficient ports can emerge from a range of
institutional frameworks (Reveley and Tull 2008, 39). The performance indicators presented
in the above discussion certainly lend credence to this argument. Independent regulation of
port pricing does not correlate with stymied profitability. Flinders Ports have remained
profitable since privatisation. By the same token, just because government ownership has
been retained, a port need not be characterised by inefficiency and a failure to achieve
sustainable financial outcomes. There is evidence to suggest that ownership is not a critical
determinant of port performance in Australia, or in New Zealand for that matter (Reveley and
Tull 2008, 39).
The preceding discussion sought to shed some light on the performance of Flinders Ports in
the last five years. In doing so a number of financial and non-financial indicators were
considered. Flinders Ports has proved to be a consistently profitable company. On the
information presented, it could be argued that Flinders Ports has to some degree exploited its
market power, based on the following:
The Meyrick and Associates Report‟s finding that Flinders Ports‟ prices were
generally higher than interstate ports;
ESCOSA‟s apparent acceptance of consistent price increases so long as they are in
line with movements in the CPI;
The fact that Flinders Ports has consistently has been consistently profitable; and
The high dividend payout ratio, suggesting that the company‟s profits are not being
passed on to port users.
88
The weight of this evidence could suggest that Flinders Ports has exercised market power.
ESCOSA has taken a different view and seems convinced that further regulation is
unnecessary. Perhaps this would change if stakeholders were to express concerns to the
contrary. ESCOSA seeks submissions from stakeholders as part of its mandatory port pricing
reviews. Following its draft reports, several submissions were made to ESCOSA in 2003 and
2007 from stakeholders including ABB Grain and AusBulk (who later merged to form
Viterra). The only stakeholder to mention the relatively higher prices was National Bulk
Commodities Group Inc (NBCG, 2007). NBCG represents bulk commodity shippers and
consignees including AWB and the Minerals Council of Australia (NBCG, 2007). In its
submission, it noted that „a recent study‟ found Flinders Ports to be more expensive for dry
bulk commodities, and suggested that ESCOSA should monitor those prices more closely
(NBCG 2007, 2).37
In summary then, we have a situation where South Australian ports are
relatively more expensive than other states, where the aggregate level of prices for EMS are
seemingly allowed to increasing in line with the CPI, and yet most stakeholders do not appear
unhappy. Furthermore, the high dividend payouts suggest that port users may not be
benefiting as much as they could be. Instead of profits being passed on to port users in the
form of better infrastructure or lower charges, they seem to be getting paid out as dividends
to shareholders.
It was argued in Chapter 3 that the mere threat of more prescriptive regulation may encourage
firms like Flinders Ports to behave in a competitive manner. The information presented in this
chapter perhaps suggests that this has not been the case so far. That is not to say it cannot
work, and a light-handed approach to regulation should be abandoned only if a clear need for
greater regulation exists. At the very least however, ESCOSA should abandon its
37 The report NBCG refer to is presumably the Meyrick and Associates Report submitted to ESCOSA.

89
methodology of assessing prices against the CPI, as this is arguably contributing to the price
increases by not providing an incentive to reduce them. Failing that, perhaps ESCOSA should
reconsider the use of more prescriptive regulation.
90
5 Conclusion 5.1 Summary of Findings
The aim of this research was to critically evaluate the regulatory framework of Australia‟s
ports. My justification for doing so was several fold. Firstly, ports are essential infrastructure,
particularly to an island nation such as Australia. Ports act as a gateway for trade, connecting
Australian consumers and producers to international markets such as China and Japan who
have helped sustain economic growth here in recent years. One indicator of our reliance on
ports is the fact that the maritime sector is responsible for moving over 99% of our trade by
volume. Ports therefore, need to be efficient, as increased costs at the port are likely to be
passed on throughout the economy. Secondly, Australia‟s mining boom highlighted a number
of bottlenecks in the national supply chain. Some of the blame has been levelled specifically
at ports. There have been concerns that some of these bottlenecks were contributed to by
poorly designed regulation.
Among other things, I wanted to assess the quality of Australia‟s port regulation. To do this,
my focus was on comparing the existing regulatory framework against a theoretical backdrop.
The literature survey in Chapter 2 attempted to discuss the economic theory relevant to ports
and port regulation. This started with perfect competition and concepts of equilibrium. The
competitive market is often the yardstick against which other market forms are measured, and
rightfully so. Competitive markets tend to be more efficient, result in lower prices and
promote innovation and growth. The theory suggests that if utility maximising households
and profit maximising firms are joined by a competitive market, the resulting allocation of
resources will be Pareto optimal (Inman 1987, 649).
91
However, markets are rarely perfectly competitive. Chapter 2 also discussed the concept and
various forms of market failure. A market is said to fail when it cannot achieve an efficient
allocation of resources. Examples of market failure include public goods, imperfect
competition and natural monopoly. Public goods are non-rival and non-excludable in
consumption, and are unlikely to be adequately provided by the market, creating a potential
role for government to step in and provide them. In the context of ports, infrastructure such as
navigational aids and access channels tend to be non-rival in consumption. This infrastructure
is essential for ports to operate effectively, potentially justifying the intervention of
government to supply them.
Imperfect competition results when competitive pressures required to produce a Pareto
optimal market outcome are absent. If competitive forces are insufficient, the producer will
have market power and can make a surplus in equilibrium (Walker 1996, 299-300). This is
undesirable from a social welfare perspective, since imperfect competition tends to lead to
lower output at higher prices. In a monopoly, welfare losses take the form of deadweight loss,
X-inefficiency costs and a lack of innovation (Abelson 2003, 214). There are certain
circumstances however where limited competition may in fact be preferable from a social
welfare standpoint. Natural monopolies can arise naturally out of market processes, since the
presence of scale economies tends to lead to monopolistic organisation. As Neumann (2001,
16) notes, it would be premature to conclude that the existence of horizontal market
concentration suggests that there are restraints on competition. In the context of this research,
ports tend to exhibit the high levels of sunk costs indicative of natural monopolies. Owing to
this perception, ports have historically been government owned, as it was hoped that public
ownership could prevent the abuse of market power (Tull and Affleck 2008, 3).
92
The consideration of market failure was followed by a discussion of the potential role for
government. Governments try to correct market failures through competition policy and
regulation. Competition policy is aimed at increasing the level of competition in order to
produce more favourable economic outcomes. Competition policy took centre stage in
Australia during the 1990‟s and had a significant effect on Australian ports and port
regulation. Regulation is one tool available to government to protect consumers from the
exercise of market power by monopolies. Choosing to regulate an industry or business is a
second best solution, since the first best solution (leaving it up to the market) is often
impossible. The characteristics of good regulation were considered, including independence
from government, transparency, predictability and efficiency. Regulation should also be
„light-handed‟ where possible, since regulation tends to introduce distortions and
inefficiencies such as rent-seeking behaviour. Another criticism of regulation is that it can
result in political capture, given the inherent information asymmetries involved with forms of
regulation such as rate of return regulation.
Chapter 3 considered Australia‟s current regulatory framework. Most ports remain
government owned, although all have undergone commercialisation and many have
corporatised their businesses. South Australia and Victoria are the only States whose ports are
currently subject to independent price regulation. However, there is potential for independent
regulation in Western Australia, New South Wales and Queensland if deemed necessary by
the Minister. The current framework is largely State-based and often confusing, particularly
in those States subject to some form of independent regulation. Although the sources of
regulation are often numerous, their substance is light in effect, and not overly burdensome.
Indeed, the lack of independent regulation in most States should not be seen as an
institutional failure, but rather as there being no clear need for further regulation. It was

93
argued that efficient ports can emerge from a variety of institutional frameworks (Tull and
Affleck 2008, 2). Likewise, government ownership of ports has proven to be a viable
alternative to privatisation and the enhanced regulation that is arguably required.
Chapter 4 presented a case study of Flinders Ports. Flinders Ports has been profitable since it
acquired South Australia‟s commercial ports in 2001. However, the evidence suggests that
many of the benefits of privatisation are not making their way to port users. Prices for certain
maritime services have been found to be consistently higher than inter-State ports. Despite
arguments that the price differential is mainly due to the greater presence of scale economies
in those States (ESCOSA; Meyrick and Associates), Flinders Ports does appear to be
exercising market power. The case study also called ESCOSA‟s methodology of assessing
price increases into question. It was suggested that by assessing price changes against the CPI,
Flinders Ports has no incentive to reduce or even maintain prices. Furthermore, stagnating
productivity data at the five capital city ports suggest that the impetus of earlier reforms is
wearing off. As a result, we need a new wave of reforms if our ports are to cope with the
increased trade volumes of the future.
5.2 The Way Forward
At the inaugural „Infrastructure: Investment and Regulation Conference‟ held in Sydney on
21 October 2011, the general consensus from the transport panel seemed to indicate that our
current supply chain inefficiencies are a result of a lack of infrastructure, and a failure to
adequately manage the entire supply chain, rather than regulatory constraints on efficiency or
investment.38
Brendon Lyon, CEO of Infrastructure Partnerships Australia remarked that
38 The panellists were: Brendon Lyon, CEO Infrastructure Partnerships Australia; Anthony Timbrell, CEO Dalrymple Bay Coal Terminal
Management; Craig Fenton, partner Price Waterhouse Coopers; and Anthony Wing, General Manager, Transport and General Prices
Oversight, ACCC. The presentations and information on the conference is available online at: http://www.nextevent.com.au/index.php/infrastructure-investment-and-regulation-conference-2011-presentations.html.
94
there is a massive backlog of investment that is required. He suggested that State
governments currently lack the funds to invest in infrastructure, and the Commonwealth
government is under pressure to return to a surplus budget. As a result, Lyon said that it is
about managing existing infrastructure as well as boosting infrastructure when investment
capital becomes available. Anthony Wing of the ACCC emphasised the importance of
complementary investment over the whole supply chain (ports, road, rail). Likewise, Anthony
Timbrell of Dalrymple Bay Coal Terminal Management, said that regulation was a “non-
issue” for them, since they have been able to work effectively within the regulatory
framework. He also noted that it had not held up investment at the port. These anecdotes are
interesting given criticism directed to Queensland coal terminals over the last few years.
In December 2010, Infrastructure Australia (IA) and the National Transport Commission
(NTC) released the National Ports Strategy (NPS) for consideration by COAG. The NPS
accepts the fact that ports and related land-side logistics chains are essential for the
competitiveness of Australian business (IA/NTC 2010b, 5). The IA/NTC partnership
recommends a national coordinated port strategy (2010b, 7-8). The NPS expressly favours
„national coordination‟ over „central planning‟. Centralised planning of ports has been used in
New Zealand and the UK in the past.39
Although there were some successes, the national
bodies generally failed to produce national port plans (Tull and Reveley 2002, 151-158).
Infrastructure Australia (2010, 13) noted in its draft strategy that diversity among ports
necessarily precludes a strategy based on a „one size fits all approach‟.
Among other things, the NPS sets out to improve regulatory and governance frameworks, as
well as improving planning of port and related infrastructure with a view to attracting private
39 See Reveley and Tull (2002) for a discussion of centralised port planning experiences of New Zealand and the United Kingdom. Among
other things, the authors found evidence of self-seeking behaviour of the National Ports Council (UK), information requirements that proved too onerous, and a lack of commitment from successive governments.
95
investment (2010, 5). A national approach to ports certainly has merit, since the large number
of decision makers (including various levels of government and private stakeholders) can
make the coordination of port development difficult (Reveley and Tull 2002, 142). The NPS
is currently a broad statement of principle, rather than a detailed plan of port reform. From
the information available, there is potential for the NPS to streamline aspects of port
governance, regulation and planning to facilitate greater investment in ports and related
infrastructure. The draft strategy, released on 6 May 2010, has been criticised as an
“opportunity lost”, that “does not outline a comprehensive strategy for ports in the future”
(Griffiths 2010, 52).
Over the years there have been calls for national regulation of ports (see Everett 2006). It is
unlikely that we would see a move to a single national regulator, nor should we. Part of the
reason that the State-based framework is so complex is probably that it reflects the different
needs of each State. The existing port regulatory framework in Australia is adequate. In terms
of the theory outlined in Chapter 2, the framework has sound economic grounds. There is an
acceptance that ports tend to exist as natural monopolies, and that privatised ports arguably
need more closer supervision to ensure consumers‟ interests are protected. With this in mind,
the current blend of Ministerial and independent supervision of Australia‟s ports reflects the
need or lack of need for closer scrutiny of port pricing and access. Furthermore, Australian
governments‟ commitment to periodically review regulation under CIRA should help to
ensure that the framework continues to reflect the need for regulation. Of course, if State
governments continue to privatise ports, greater regulation will likely be necessary. The Port
of Brisbane exists as an opportunity for further research. In this regard, time will tell whether
the regulatory arrangements in place in Queensland are sufficient to prevent the exercise of
96
market power by consortium. Right now there is insufficient information with which to make
an assessment of the effects of privatisation.
The current economic climate, with governments running deficit budgets, means that further
privatisation of ports will remain a possibility. Whilst privatisation remains attractive as a
means of freeing up capital for State governments to invest, government ownership of ports
remains a viable alternative. What is certainly needed is further reform. There is evidence to
suggest we have reaped all of the rewards of the reforms of the 1980‟s and 1990‟s.
Australia‟s ability to capitalise on Asian growth is greatly dependent on our ports‟ ability to
handle the increasing trade volumes. It will only be able to do so with greater investment in
infrastructure across the whole supply chain, combined with further reform to boost the
productivity of the port sector.
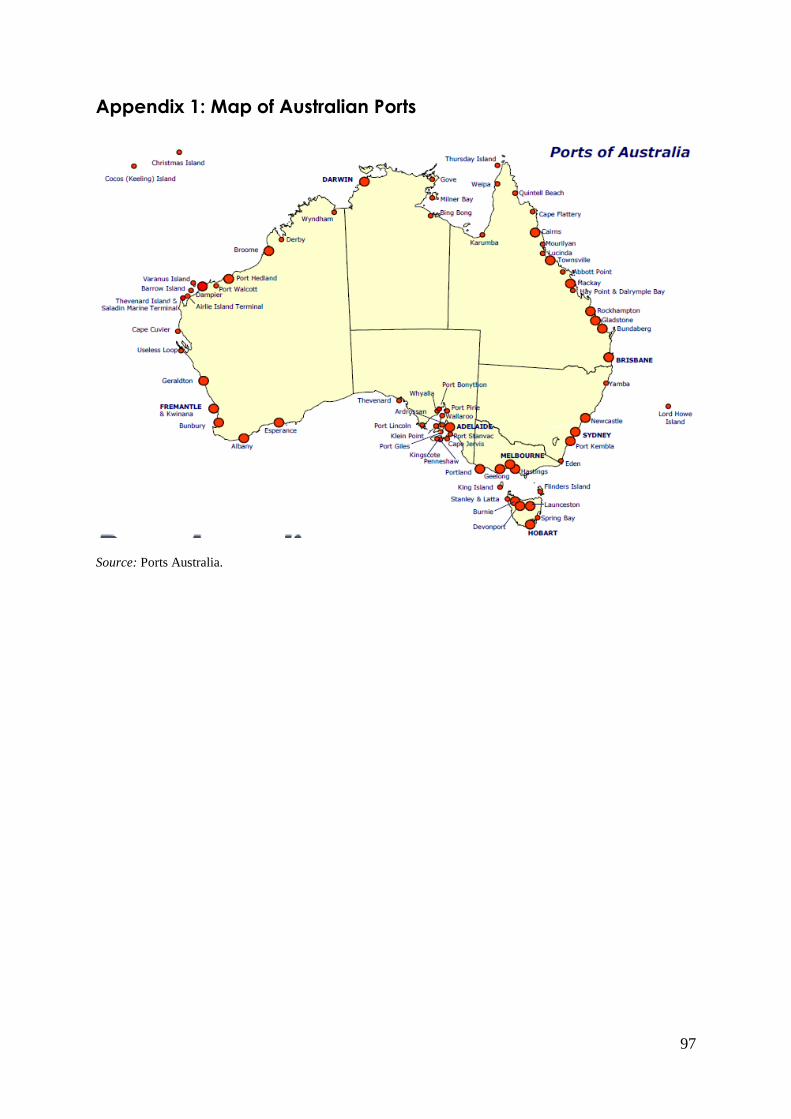
97
Appendix 1: Map of Australian Ports
Source: Ports Australia.
98
Bibliography
“Get Regulation Right – World‟s Worst Port Shows Our Infrastructure Failings.” 2008. The
Australian, 28 February. Factiva.
Abelson, Peter. 2003. Public Economics: Principles and Practice. Sydney: Applied
Economics.
ABS (Australian Bureau of Statistics). 2010. Measures of Australia’s Progress 2010 (cat. no.
1370.0). AusStats. http://www.abs.gov.au/ausstats/[email protected]/mf/1370.0.
Access Economics. 2006. A Scorecard of the Design of Economic Regulation of
Infrastructure. Report for Australian Council of Infrastructure and Trade
Development, 18 February.
Allen Consulting Group. 2008. “Council of Australian Governments Review of Western
Australian Ports: Draft Report.” Submitted to Department of Planning and
Infrastructure, Western Australia. http://www.transport.wa.gov.au/mediafiles/
marine_ports_review_issues.pdf.
Arrow, Kenneth J. and Gerard Debreu. 1954. “Existence of an Equilibrium for a Competitive
Economy.” Econometrica 22(3): 265-290. JSTOR.
Australia. House Standing Committee on Economics. 2010. Inquiry Into Raising the
Productivity Growth Rate in the Australian Economy. House of Representatives. April.
Canberra.
Australia. Independent Committee of Inquiry into a National Competition Policy (Hilmer
Report). 1993. National Competition Policy. 25 August. Canberra: AGPS.
http://ncp.ncc.gov.au/docs/Hilmer-001.pdf.
Australia. McInerney, L, C Nadarajah, and F Perkins. 2007. Australia’s Infrastructure Policy
and the National Reform Agenda. Economic Roundup Summer 2007. Canberra:
AGPS, 17-49. http://www.treasury.gov.au/documents/1221/PDF/02_NRA.pdf.
Australia. Productivity Commission. 1998. International Benchmarking of the Australian
Waterfront. Canberra: AusInfo.
Australia. Productivity Commission. 2008. Financial Performance of Government Trading
Enterprises 2004-05 to 2006-07. Research Paper, July. Canberra.
Australia. Productivity Commission. 2009. Submission to the House of Representatives
Standing Committee on Economics: Inquiry into Raising the Level of Productivity
Growth in Australia. September, Canberra.

99
Australia. Treasury. 1999. Price Regulation of Utilities. Economic Roundup Summer 1999.
Canberra: AGPS, 57-69. http://www.treasury.gov.au/contentitem.asp?ContentID=
194&NavID=.
Australian Competition and Consumer Commission. 2011. Container Stevedoring
Monitoring Report No. 13. October. Canberra.
Australian Securities and Investment Commission. Annual Financial Reports: Flinders Ports
Pty Ltd, 2005-06 to 2010-11.
Baumol, William J., and Kyn Sik Lee. 1991. “Contestable Markets, Trade and Development.”
The World Bank Research Observer 6(1): 1-17. doi: 10.1093/wbro/6.1.1.
Borland, Jeff. 2001. “Microeconomic Reform in Australia – An Introduction.” Unpublished.
http://www.economics.unimelb.edu.au/staff/jib/documents/micref.pdf.
Bottomley, Stephen, and Anthony Forsyth. 2006. “The New Corporate Law.” Working Paper
1, Corporate Law and Accountability Research Group, Monash University.
http://www.buseco.monash.edu.au/blt/wclrg/working-paper-1.pdf.
Bureau of Infrastructure, Transport and Regional Economics. 2007. “Australian Maritime
Trade: 2001-02 to 2004-05.” Working Paper 69, Canberra.
Bureau of Infrastructure, Transport and Regional Economics. Waterline (various issues).
Canberra. http://www.btre.gov.au/info.aspx?NodeId=81.
Campbell, R. H., A. S. Skinner, and W. B. Todd. 1976. Adam Smith: An Inquiry into the
Nature and Causes of the of Nations, vol 1. London: Oxford University Press.
Chiang, Alpha C. 1984. Fundamental Methods of Mathematical Economics. Singapore:
McGraw-Hill.
Coghlan, Paul. 2003. “The Principles of Good Regulation.” In Regulation and Market Access,
edited by Alexandra Sidorenko and Christopher Findlay, 17-39.
Council of Australian Governments. 1995. Competition Principles Agreement. 13 April.
http://ncp.ncc.gov.au/docs/cpa%20amended%202007.pdf.
Cowan, Simon. 2001. “Regulatory Reform: Lessons from the UK.” Paper presented at the
Trade and Industrial Policy Strategies Forum, Johannesburg, September 10-12.
http://www.tips.org.za/files/Regulatory_Reform-Lessons_from_the_UK.pdf.
Crew, M. A., M. W. Jones-Lee, and C. K. Crowley. 1971. “X-Theory Versus Management
Discretion Theory.” Southern Economic Journal 38(2): 173-184. Proquest.
100
Crew, Michael A., and Paul R. Kleindorfer. 2003. “Regulation Redux.” In Markets, Pricing
and Deregulation of Utilities, edited by Michael A. Crew and Joseph C. Schuh, 1-26.
Boston: Kluwer Academic Publishers.
Cullinane, Kevin, and Wayne K. Talley. 2006. “Introduction”. In Port Economics, edited by
Kevin Cullinane and Wayne K. Talley, vol 16, 1-11. Amsterdam: Elsevier JAI.
Essential Services Commission of South Australia. 2004. “Port Regulation in South Australia:
Advisory Bulletin 1”. November. http://www.escosa.sa.gov.au/library/041029-
PortsAdvisoryBulletinNo1-RegulationInSA.pdf.
Essential Services Commission of South Australia. 2007. “2007 Ports Price Determination:
Final Price Determination.” October. http://www.escosa.sa.gov.au/library/071016-
PortsPriceDetermination_2007-FinalDetermination.pdf.
Essential Services Commission of South Australia. 2010. “Price Monitoring Report.”
November. http://www.escosa.sa.gov.au/library/101101-2010_PortsPriceMonitoring
Report.pdf.
Essential Services Commission of Victoria. 2004. “Regulation of the Victorian Ports: Final
Report”. June. http://www.esc.vic.gov.au/NR/rdonlyres/EA17657E-0EFC-425B-
B2E5-FF100BF74811/0/FinalReportPortsReview300604.pdf.
Essential Services Commission of Victoria. 2005. “Price Monitoring Determination for the
Victorian Ports.” 30 March. http://www.esc.vic.gov.au/NR/rdonlyres/155AB0A4-
D95E-4EBC-A2C1-62EEC163BD25/0/PriceMonitoringDeterminationVictorianPorts
Mar05.pdf.
Essential Services Commission of Victoria. 2009. “Review of Victorian Ports Regulation:
Issues Paper. January. http://www.esc.vic.gov.au/NR/rdonlyres/A9784A47-CDEC-
4964-AA6C-1BF57525E061/0/ISPreviewofvictorianportsregulationissuespaperfinal
20090107.pdf.
Essential Services Commission of Victoria. 2010. “Price Monitoring Determination for
Victorian Ports 2010: Final Decision”. 4 May. http://www.esc.vic.gov.au/NR/
rdonlyres/63A9FBF7-04EE-4F23-8279-4F33A8C80C57/0/FDPPriceMonitoring
DeterminationforVictorianPorts2010FinalDecision20100504.pdf.
Essential Services Commission of Victoria. 2011. “Price Monitoring Report 2009-10.” March.
http://www.esc.vic.gov.au/NR/rdonlyres/3D729959-9E50-4D2F-B32E-34EFC0BA3F
91/0/PBLPortsMonitoringReport20091020110323.pdf.
Estache, Antonio, Marianela Gonzalez and Lourdes Trujillo. 2002. “Efficiency Gains from
Port Reform and the Potential for Yardstick Competition: Lessons from Mexico.”
World Devlopment 30(4): 545-560. doi:10.1016/S0305-750X(01)00129-2.
101
Everett, Sophia, and Ross Robinson. 2007. “Port Reform: The Australian Experience.” In
Devolution, Port Governance and Port Performance, edited by Mary R Brooks and
Kevin Cullinane, vol 17, 259-284.
Everett, Sophia, and Ross Robinson. 2007. “Supply Chain Inefficiencies: Regulation
Misdirected? An Examination of Queensland‟s Dalrymple Bay Coal Terminal.”
Public Infrastructure Bulletin 1(6): 1-8. http://epublications.bond.edu.au/
pib/vol1/iss6/5/.
Everett, Sophia. 2006. “Port Regulation: Will a Single Regulator Resolve Congestion?”
Public Administration Today 9: 51-55. APA-FT.
Everett, Sophia. 2007. “Port Reform in Australia: Regulation Constraints on Efficiency.”
Maritime Policy and Management 34(2): 107-119. doi: 10.1080/03088830701240086.
Flinders Ports Pty Ltd. 2011. www.flindersports.com.au.
Fremantle Port Authority. Annual Reports (various years). www.fremantleports.com.au.
Gardner, Bernard, Peter Marlow, and Stephen Pettit. 2006. “Full Cost Recovery in EU Ports
Operating as Commercial Undertakings.” Transport Policy 13: 2-21. doi:10.1016/
j.tranpol.2005.06.011.
Goss, R. O. 1990. “Economic Policies and Seaports: The Economic Functions of
Seaports.”Maritime Policy and Management 17(3): 207-219. Taylor & Francis
Journals Complete.
Gray, Harriet. 2009. “Evolution of Infrastructure Regulation in Australia.” Working Paper 1,
Australian Competition and Consumer Commission/Australian Energy Regulator,
Canberra. http://www.accc.gov.au/content/index.phtml/itemId/878998.
Griffiths, Richard. 2010. “The Draft Proposed National Ports Strategy.” Australian Journal of
Maritime and Ocean Affairs 2(2): 48-52. Proquest.
Grimwade, Tim. 1996. “Solving Market Problems the Australian Way.” Consumer Policy
Review 6(5): 172-176.
Hall, George J. 2006. “Profit Maximization.” PowerPoint lecture notes.
http://www.econ.yale.edu/~gjh9/econ115b/slides9.pdf.
Hepworth, Annabel. 2010. “Ports Flounder in Red Tape, Says Report.” The Australian, 28
June. http://www.theaustralian.com.au/archive/business-old/ports-flounder-in-red-
tape-says-report/sory-e6frg97o-1225884941912.
Hildenbrand, W., and A. P. Kirman. 1988. Equilibrium Analysis: Variations on Themes by
Edgeworth and Walras. Amsterdam: JAI Press.
102
Hollander, Robyn. 2006. “National Competition Policy, Regulatory Reform and Australian
Federalism.” Australian Journal of Public Administration 65(2): 33-47. Wiley Online
Library.
Infrastructure Australia and National Transport Commission. 2010a. “National Port Strategy:
Background Paper.” http://www.infrastructureaustralia.gov.au/gateways/files/
ports_strategy_background_paper_20_December_2010.pdf.
Infrastructure Australia and National Transport Commission. 2010b. “National Ports
Strategy.” December. http://www.ntc.gov.au/filemedia/Reports/PortsStrategy
Jan11.pdf.
Inman, Robert P. 1987. “Markets, Governments, and the “New” Political Economy.” In
Handbook of Public Economics, edited by Alan J. Auerbach and Martin Feldstein, vol
2, 647-779. North-Holland: Elsevier.
Jamison, Mark A. 2005. “Rate of Return Regulation.” Unpublished.
http://warrington.ufl.edu/purc/purcdocs/PAPERS/TRAINING/Jamaica/July2006/adva
ncedreadings/Jamison%20Rate%20of%20Return%20Regulation.pdf.
Kahn, Alfred E. 1988. The Economics of Regulation. 2 vols. Cambridge, Mass: MIT Press.
Keay, Andrew. 2007. “Tackling the Issue of the Corporate Objective: An Analysis of the
United Kingdom‟s „Enlightened Shareholder Value Approach‟.” Sydney Law Review
29: 577. Agis Plus Text.
Kelly, John M. 1992. A Short History of Western Legal Theory. Oxford: Clarendon Press.
Keynes, John Maynard. 1926. The End of Laisse-Faire. London: Leonard & Virginia Woolf.
King, Stephen P. 1997. “Access Pricing Under Rate-of-Return Regulation.” Discussion Paper
366, Centre for Economic Policy Research, Australian National University, Canberra.
Koch, Tony, and Andrew Fraser. 2009. “Delays at Queensland‟s Dalrymple Bay Coal
Terminal Cost Firms $500m.” The Australian , 2 October.
http://www.theaustralian.com.au/business/mining-energy/delays-at-queenslands-
dalrymple-bay-coal-terminal-cost-firms-500m/story-e6frg9df-1225781848103.
Layton, Brent. 2010. Port Performance and Ownership: An Assessment of the Evidence.
Report to the Local Government Forum. 9 August. New Zealand Institute of
Economic Research.
Leibenstein, Harvey. 1966. “Allocative Efficiency vs. X-Efficiency”. American Economic
Review 56(3): 392-415. JSTOR.
Lewis, Philip, Anne Garnett, Kim Hawtrey and Malcolm Treadgold. 2006. Issues, Indicators
and Ideas. 4th
ed. Frenchs Forest, NSW: Pearson.
103
Megalogenis, George. 2011. “„We Need a New Wave of Reform‟: Treasury Chief Martin
Parkinson.” The Australian, 1 July. http://www.theaustralian.com.au/national-
affairs/we-need-a-new-wave-of-reform-treasury-chief-martin-parkinson/story-
fn961iy1-1226085202600.
Melbourne Port Corporation. Annual Reports (various years). www.portofmelbourne.com.
Meyrick and Associates. 2007. Benchmarking of Port Prices in Australia: Final Report
Prepared for ESCOSA, April 2007. http://archive.escosa.sa.gov.au/webdata/resources/
files/070427-D-MeyrickPortsBench markingAust.pdf.
Montgomery, Michael R., and Richard Bean. 1999. “Market Failure, Government Failure,
and the Private Supply of Public Goods: The Case of Climate-Controlled Walkway
Networks.” Public Choice 99(3/4): 403-437. Proquest.
Myles, Gareth D. 1995. General Equilibrium and Welfare Economics. Cambridge:
Cambridge University Press.
National Bulk Commodities Group. 2007. Re: Essential Services Commission of SA 2007
Ports Pricing and Access Review. Submission to ESCOSA, 29 June.
http://www.escosa.sa.gov.au/library/070629-PortsPrice_2007Review-DraftPaper-
Submission-NBCG.pdf.
Neumann, Manfred. 2001. Competition Policy: History, Theory and Practice. Cheltenham,
UK: Edward Elgar.
Northern Territory. Treasury. 2009. “Review of the Regulatory Framework for the Port of
Darwin: Final Report”.
Oakland, William H. 1987. “Theory of Public Goods.” In Handbook of Public Economics,
edited by Alan J. Auerbach and Martin Feldstein, vol 2, 485-537. North-Holland:
Elsevier.
Owen, Richard. 2005. “Coal Ships Queue Up as Miners Struggle to Meet Schedules.” The
Australian, 11 October. Factiva.
Ports Australia. 2011. www.portsaustralia.com.au.
Posner, Richard A. 1999. Natural Monopoly and its Regulation. Washington: Cato Institute.
Price Waterhouse Coopers. 2007. “Review of Port Competition and Regulation in NSW:
Issues Paper.” New South Wales.
Puig, Gonzalo Villalta, and Michael Woods. 2008. “The Constitutionality of National Port
Regulation.” Australian Law Journal 82: 789-807. Legal Online.

104
Reveley, James and Malcolm Tull. 1994. “Privatisation Postponed: Convergence and
Divergence in Australian and New Zealand Port Reform.” In Port Privatisation: The
Asia-Pacific Experience, edited by James Reveley and Malcolm Tull, 17-50.
Cheltenham, UK: Edward Elgar.
Reveley, James and Malcolm Tull. Forthcoming. “Institutional Path Dependence in Port
Regulation: A Comparison of New Zealand and Australia.”
Salusinszky, Imre, and Adele Ferguson. 2009. “Demand Afloat as Ships Queue.” The
Australian, 24 July. Factiva.
Samuelson, Paul A. 1955. “The Pure Theory of Public Expenditure.” The Review of
Economics and Statistics 36(4): 387-389. JSTOR.
Sharkey, William W. The Theory of Natural Monopoly. Cambridge: Cambridge University
Press.
Smith, Adam. 1776. The Wealth of Nations: The Original Classic. Chichester: John Wiley &
Sons. Capstone Classics.
Snowdon, Brian and Howard R. Vane. 2005. Modern Macroeconomics. Cheltenham, UK:
Edward Elgar.
South Australia. 2002. “Report of the Auditor General for the Year Ended 20 June 2002.”
Part B, vol 3: South Australia: Government Printer. http://www.audit.sa.gov.au/02-
03/b/volume3.pdf.
Sowell, Thomas. 1974. Classical Economics Reconsidered. Princeton: Princeton University
Press.
Spulber, Daniel F. 1989. Regulation and Markets. Massachusetts: MIT Press.
Starr, Ross M. 1997. General Equilibrium Theory: An Introduction. Cambridge: Cambridge
University Press.
Talley, Wayne K. 1994. “Performance Indicators and Port Performance Evaluation.”
Logistics and Transportation Review 30(4): 339-352. Proquest.
Talley, Wayne. 2007. “Port Performance: An Economics Perspective.” In Devolution, Port
Governance and Port Performance, edited by Mary Brooks and Kevin Cullinane, vol
17: 499-516. Oxford: Elsevier.
Tan, Kegon Teng Kok. 2008. “The First Fundamental Theorem of Welfare Economics.”
Unpublished. http://www.math.uchicago.edu/~may/VIGRE/VIGRE2008/REUPapers/
Tan.pdf.
105
Toevai, Sineva. 2010. “Brisbane in Private Hands – Shippings‟ Price Hike Fears.” Lloyd’s
List DCN, November 18, 3.
Trace, Keith. 1997. “Promoting Efficiency and Contestability in Australia‟s Ports.” Agenda
4(2): 143-154.
Triffin, Robert. Monopolistic Competition and General Equilibrium Theory. Cambridge,
Mass: Harvard University Press.
Tull, Malcolm and Fred Affleck. 2008. “The Performance of Western Australian Ports.”
Ocean Economics Review of China 2(1): 1-33.
Tull, Malcolm and James Reveley. 2001. “The Merits of Public Versus Private Ownership: A
Comparative Study of Australian and New Zealand Seaports.” Economic Papers
20(3): 75-99.
United Nations Conference on Trade and Development. 2007. Review of Maritime Transport
2007. United Nations: Geneva. http://www.unctad.org/eii/docs/nnt2007 en.pdf.
Varian, Hal R. 2006. Intermediate Microeconomics: A Modern Approach. 7th
ed. New York:
W.W. Norton and Co.
Victoria. Department of Transport. 2011. http://www.transport.vic.gov.au/freight/ports/about-
victorian-ports.
Viner, Jacob. 1927. “Adam Smith and Laissez Faire.” Journal of Political Economy 35(2):
198-232. JSTOR.
Walker, Donald A. 1996. Walras’s Market Models. Cambridge: Cambridge University Press.
Legislation
Competition and Consumer Act 201 (Cth).
Corporations Act 2001 (Cth).
Darwin Port Corporation Act 2009 (NT).
Economic Regulation Authority Act 2003 (WA).
Essential Services Commission Act 2001 (Vic).
Essential Services Commission Act 2002 (SA).
Harbors and Navigation Act 1993 (SA).
Independent Pricing and Regulatory Tribunal Act 1992 (NSW).
106
Maritime Services (Access) Act 2000 (SA).
Port Authority Act 1999 (WA).
Port Management Act 1995 (Vic).
Ports and Maritime Administration Act 1995 (NSW).
Queensland Competition Authority Act 1997 (Qld).
Tasmanian Ports Corporation Act 2005 (Tas).
Transport Infrastructure Act 1994 (Qld).