Embed Size (px)
Citation preview
HARBOR AMBIENT WATER QUALITY SUMMARY IN SUPPORT OF THE
PORT OF LOS ANGELES AND PORT OF LONG BEACH WATER RESOURCES ACTION PLAN
Prepared for: Port of Los Angeles
425 South Palos Verdes St. San Pedro, California 90731
and Port of Long Beach 925 Harbor Plaza
Long Beach, California 90802
Submitted by: AMEC Earth & Environmental, Inc.
9210 Sky Park Court, Suite 200 San Diego, California 92123
(858) 300-4300
21 July 2009
AMEC Project No. 7151000609

Harbor Ambient Water Quality SummaryJuly 2009
Page i
TABLE OF CONTENTS
1.0 INTRODUCTION...............................................................................................................1 2.0 WATER QUALITY STUDIES EVALUATED.....................................................................3
2.1 Port of Los Angeles Port-wide Water Quality Studies ........................................... 3 2.2 Port of Long Beach Port-wide Water Quality Studies............................................ 3 2.3 Surface Water Ambient Monitoring Program (SWAMP)........................................ 5 2.4 Additional Special Studies..................................................................................... 5
3.0 HARBOR WATER QUALITY ...........................................................................................7 3.1 Dissolved Metals in Harbor Waters ....................................................................... 7 3.2 Organics in Harbor Waters .................................................................................. 14
3.2.1 Tributyltin ................................................................................................. 14 3.2.2 Chlorinated Pesticides............................................................................. 16 3.2.3 Polychlorinated Biphenyls (PCBs)........................................................... 17 3.2.4 Polycyclic Aromatic Hydrocarbons (PAHs).............................................. 17 3.2.5 Phenols.................................................................................................... 18 3.2.6 Phthalates................................................................................................ 18
3.3 Metals and Organics Summary ........................................................................... 18 3.4 Dissolved Oxygen Levels in Harbor Waters ........................................................ 25 3.5 Bacteria Levels in Harbor Waters........................................................................ 27
LIST OF FIGURES
Figure 1. POLA/POLB Water Quality Stations and TMDL Area ........................................... 4 Figure 2. Dissolved Copper .................................................................................................. 9 Figure 3. Dissolved Zinc ....................................................................................................... 9 Figure 4. Dissolved Silver ................................................................................................... 10 Figure 5. Dissolved Nickel .................................................................................................. 10 Figure 6. Dissolved Mercury............................................................................................... 11 Figure 7. Dissolved Lead.................................................................................................... 11 Figure 8. Dissolved Chromium ........................................................................................... 12 Figure 9. Dissolved Cadmium ............................................................................................ 12 Figure 10. Dissolved Arsenic................................................................................................ 13 Figure 11. Total Tributyltin Concentrations........................................................................... 16 Figure 12. Port of Los Angeles Monitoring Stations Exceeding Aquatic Life Water
Quality Criteria..................................................................................................... 21 Figure 13. Port of Long Beach Monitoring Stations Exceeding Aquatic Life Water
Quality Criteria..................................................................................................... 23 Figure 14. POLA Dissolved Oxygen – Surface (1999-2008) ................................................ 25 Figure 15. POLA Dissolved Oxygen – Bottom (1999-2008) ................................................. 25 Figure 16. POLB Dissolved Oxygen (2006-2009) ................................................................ 26 Figure 17. POLA Bacteria – Enterococcus (2005-2008) ...................................................... 29
Harbor Ambient Water Quality Summary July 2009
Figure 18. POLA Bacteria – Fecal Coliform (2005-2008) ..................................................... 29 Figure 19. POLA Bacteria – Total Coliform (2005-2008)...................................................... 30 Figure 20. Los Angeles Harbor Bacteria TMDL Study Stations (2006-2007) ....................... 32
LIST OF TABLES
Table 1. Los Angeles Harbor Enhanced Water Quality Study Collection Events................ 5 Table 2. CTR Water Quality Criteria for Dissolved Metals for the Protection of
Aquatic Life............................................................................................................ 8 Table 3. Dissolved Copper CCC Exceedances in Los Angeles/Long Beach Harbors ...... 14 Table 4. POLA and POLB Organics Overview.................................................................. 15 Table 5. Los Angeles Harbor Dissolved Oxygen (1999-2008) .......................................... 26 Table 6. Summary of Bacteria Exceedances from the Los Angeles Harbor Bacteria
TMDL Main Ship Channel Study (2006-2007)..................................................... 33
Page ii
Harbor Ambient Water Quality Summary July 2009
Page 1
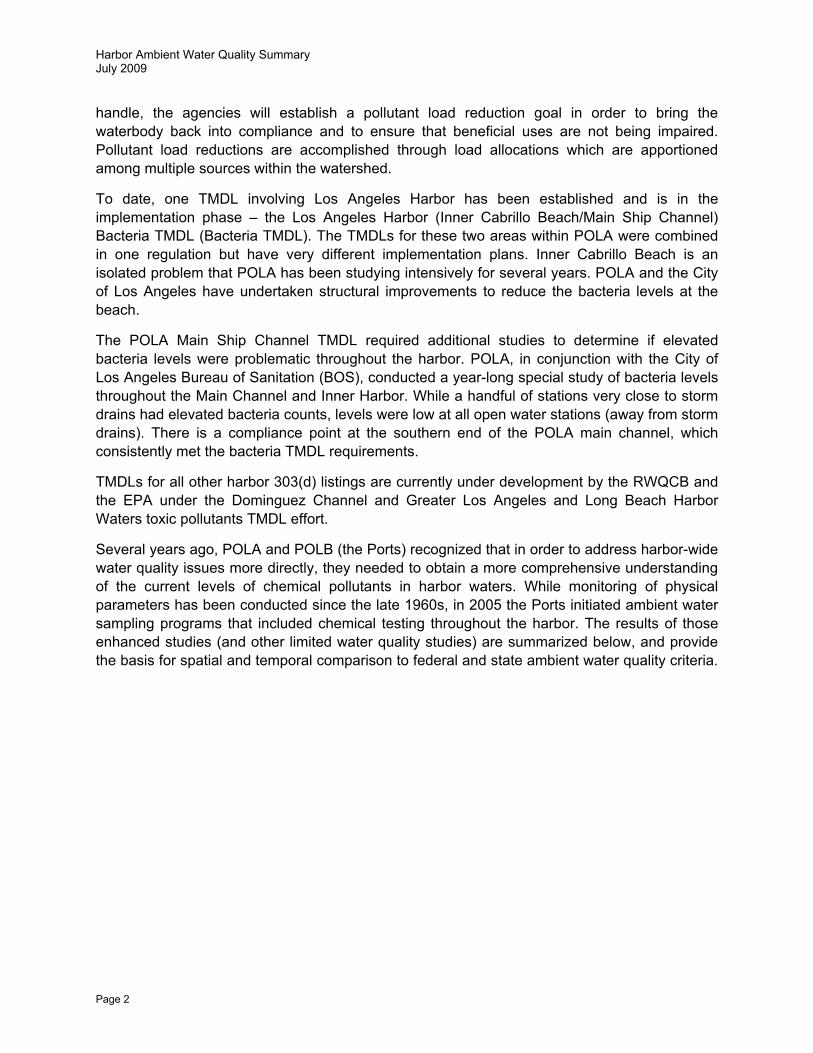
1.0 Introduction Prior to the 1970s, elevated levels of chemical and bacterial pollutants and debris entering the Los Angeles/Long Beach Harbor complex (harbor) severely degraded harbor water quality. As a result, harbor waters in many locations were murky, had unpleasant odors, were littered with debris, and, consequently, were an inhospitable environment for marine life. Since the passage of the Clean Water Act (CWA) in 1972, water quality has improved to a point where much of the harbor supports healthy and diverse biological communities. These water quality improvements were accomplished primarily by eliminating most “point-source” effluent discharges from the Dominguez Channel and harbor, while at the same time regulating and monitoring all other discharges under the National Pollutant Discharge Elimination System (NPDES) provision in the CWA.
With the harbor-wide improvements in water quality observed over the past 30 years, focus has shifted from point sources to non-point sources of pollutants. Non-point source pollutants are discharged to harbor waters from many locations, including the Dominguez Channel and Los Angeles River, storm drains, runoff from port facilities, aerial deposition, in-water vessel maintenance activities, resuspension of contaminated sediments, and others. The Ports of Los Angeles and Long Beach (POLA and POLB, respectively), along with federal, state, and local water quality agencies and other interested parties, are working together to identify pollutant sources, the types and concentrations of pollutants, and the potential impacts of these pollutants on harbor waters, sediments, and marine life.
To evaluate the impact of chemicals on ambient surface waters, California has identified 64 “priority pollutants”, and developed numerical water quality standards for those pollutants that are designed to be protective of aquatic organisms and human health. The 64 “priority pollutants” and their numerical standards are defined under the California Toxics Rule (CTR). The water quality standards were developed by conducting numerous laboratory and field toxicity studies. For this report, the CTR standards are used for both harbors, treating the harbor complex as a single “enclosed bay.”
From a regulatory standpoint, the harbor is currently listed as not meeting many of its designated beneficial uses. The U.S. Environmental Protection Agency (EPA) and California State Water Resources Control Board (SWRCB) have listed most of the harbor areas as impaired waterbodies under Section 303(d) of the CWA. The designation of “impaired” is based upon available data that indicates that portions of the harbor fail to meet federal water, sediment, or fish tissue standards due to elevated concentrations of particular pollutants. These pollutants include bacteria, heavy metals (such as copper and zinc), polycyclic aromatic hydrocarbons (PAHs) (chemicals found in coal and oil that are by-products of the combustion process), polychlorinated biphenyls (PCBs), and pesticides (such as DDT).
As a result of these impairment listings, the Los Angeles Regional Water Quality Control Board (RWQCB) and the EPA are working together to set Total Maximum Daily Loads (TMDLs) for the listed pollutant/waterbody combinations. The TMDL process was established under the CWA as a mechanism to address water quality problems in a comprehensive manner (such as on a watershed-wide basis). The first goal of the TMDL process is to establish the maximum amount of a pollutant (for example, pounds of copper per year) that a waterbody can receive and still be able to meet water quality standards. If a waterbody is receiving more pollutant than it can
Harbor Ambient Water Quality Summary July 2009
handle, the agencies will establish a pollutant load reduction goal in order to bring the waterbody back into compliance and to ensure that beneficial uses are not being impaired. Pollutant load reductions are accomplished through load allocations which are apportioned among multiple sources within the watershed.
To date, one TMDL involving Los Angeles Harbor has been established and is in the implementation phase – the Los Angeles Harbor (Inner Cabrillo Beach/Main Ship Channel) Bacteria TMDL (Bacteria TMDL). The TMDLs for these two areas within POLA were combined in one regulation but have very different implementation plans. Inner Cabrillo Beach is an isolated problem that POLA has been studying intensively for several years. POLA and the City of Los Angeles have undertaken structural improvements to reduce the bacteria levels at the beach.
The POLA Main Ship Channel TMDL required additional studies to determine if elevated bacteria levels were problematic throughout the harbor. POLA, in conjunction with the City of Los Angeles Bureau of Sanitation (BOS), conducted a year-long special study of bacteria levels throughout the Main Channel and Inner Harbor. While a handful of stations very close to storm drains had elevated bacteria counts, levels were low at all open water stations (away from storm drains). There is a compliance point at the southern end of the POLA main channel, which consistently met the bacteria TMDL requirements.
TMDLs for all other harbor 303(d) listings are currently under development by the RWQCB and the EPA under the Dominguez Channel and Greater Los Angeles and Long Beach Harbor Waters toxic pollutants TMDL effort.
Several years ago, POLA and POLB (the Ports) recognized that in order to address harbor-wide water quality issues more directly, they needed to obtain a more comprehensive understanding of the current levels of chemical pollutants in harbor waters. While monitoring of physical parameters has been conducted since the late 1960s, in 2005 the Ports initiated ambient water sampling programs that included chemical testing throughout the harbor. The results of those enhanced studies (and other limited water quality studies) are summarized below, and provide the basis for spatial and temporal comparison to federal and state ambient water quality criteria.
Page 2
Harbor Ambient Water Quality Summary July 2009
Page 3
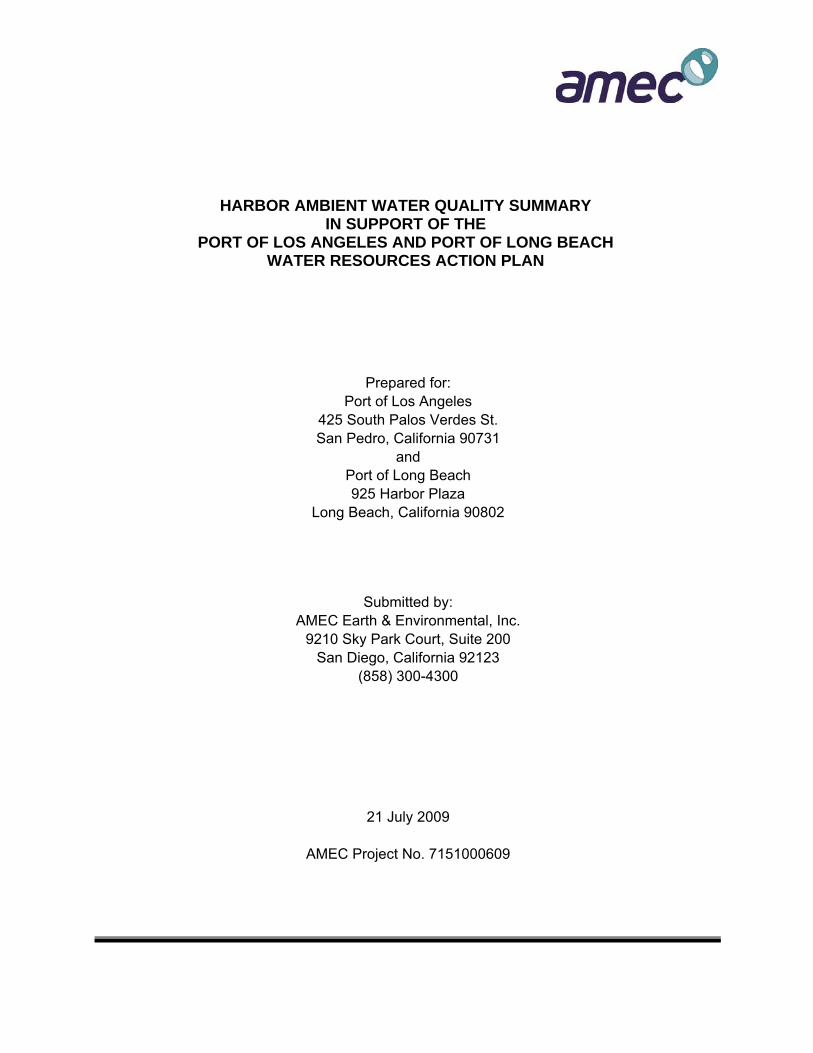
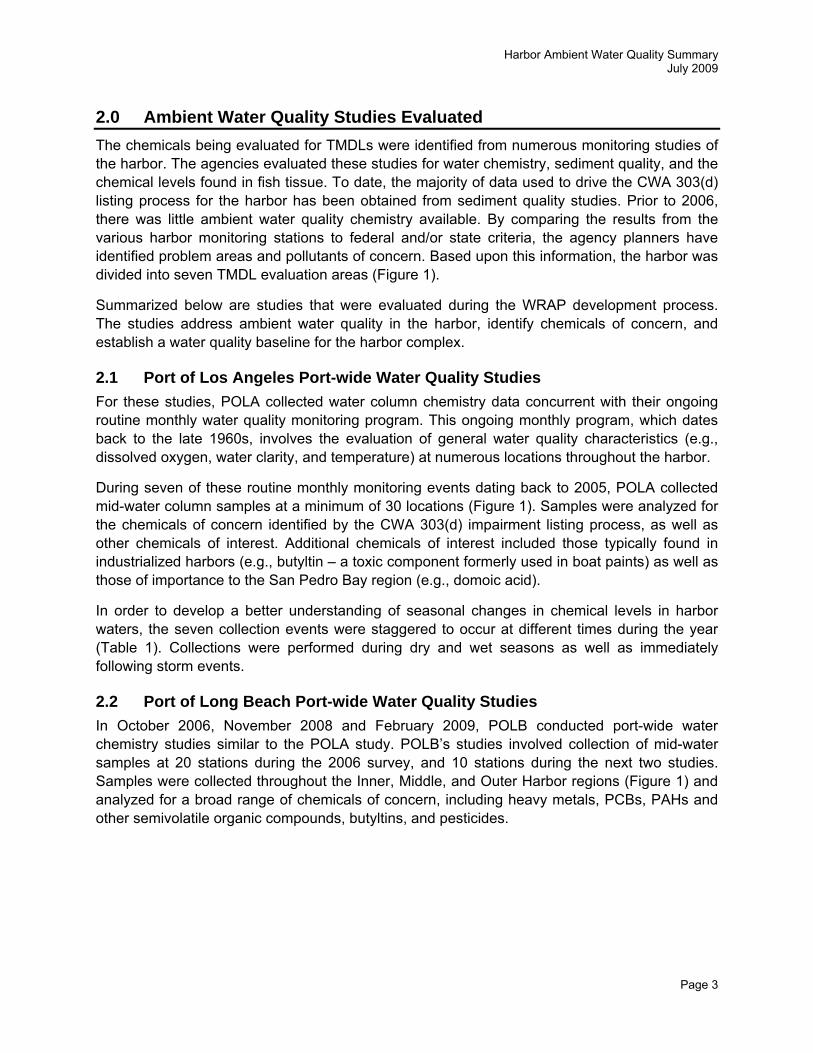
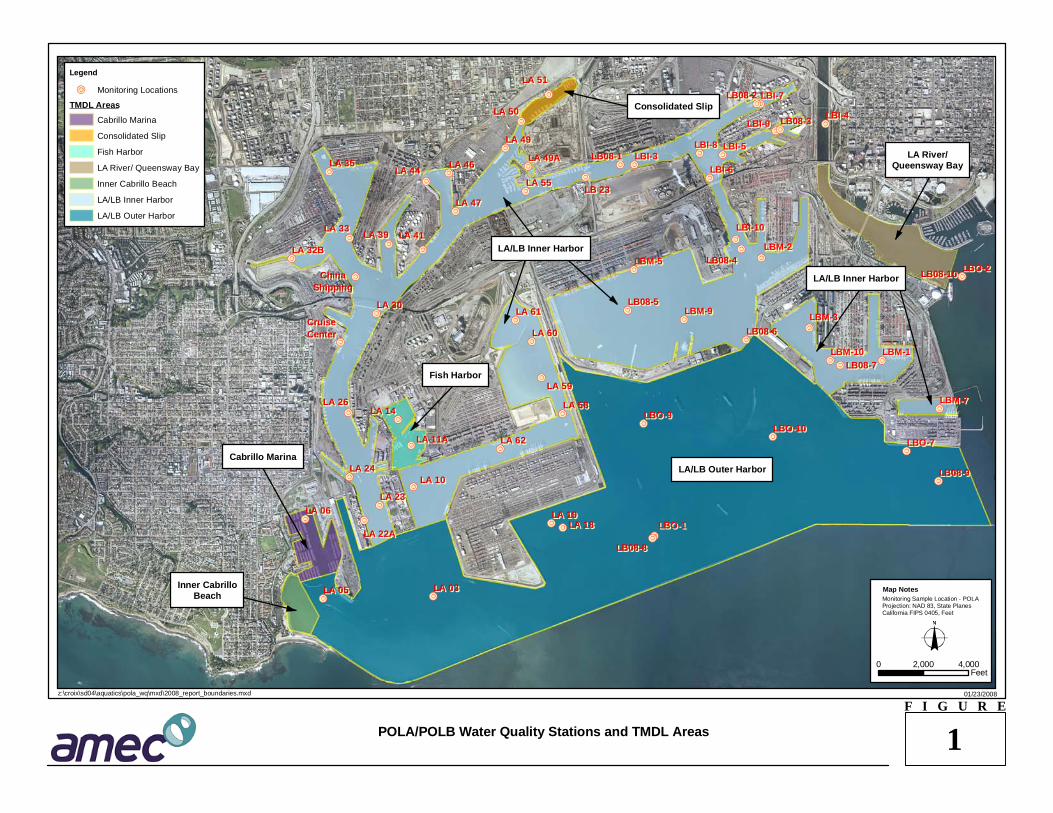
2.0 Ambient Water Quality Studies Evaluated The chemicals being evaluated for TMDLs were identified from numerous monitoring studies of the harbor. The agencies evaluated these studies for water chemistry, sediment quality, and the chemical levels found in fish tissue. To date, the majority of data used to drive the CWA 303(d) listing process for the harbor has been obtained from sediment quality studies. Prior to 2006, there was little ambient water quality chemistry available. By comparing the results from the various harbor monitoring stations to federal and/or state criteria, the agency planners have identified problem areas and pollutants of concern. Based upon this information, the harbor was divided into seven TMDL evaluation areas (Figure 1).
Summarized below are studies that were evaluated during the WRAP development process. The studies address ambient water quality in the harbor, identify chemicals of concern, and establish a water quality baseline for the harbor complex.
2.1 Port of Los Angeles Port-wide Water Quality Studies For these studies, POLA collected water column chemistry data concurrent with their ongoing routine monthly water quality monitoring program. This ongoing monthly program, which dates back to the late 1960s, involves the evaluation of general water quality characteristics (e.g., dissolved oxygen, water clarity, and temperature) at numerous locations throughout the harbor.
During seven of these routine monthly monitoring events dating back to 2005, POLA collected mid-water column samples at a minimum of 30 locations (Figure 1). Samples were analyzed for the chemicals of concern identified by the CWA 303(d) impairment listing process, as well as other chemicals of interest. Additional chemicals of interest included those typically found in industrialized harbors (e.g., butyltin – a toxic component formerly used in boat paints) as well as those of importance to the San Pedro Bay region (e.g., domoic acid).
In order to develop a better understanding of seasonal changes in chemical levels in harbor waters, the seven collection events were staggered to occur at different times during the year (Table 1). Collections were performed during dry and wet seasons as well as immediately following storm events.
2.2 Port of Long Beach Port-wide Water Quality Studies In October 2006, November 2008 and February 2009, POLB conducted port-wide water chemistry studies similar to the POLA study. POLB’s studies involved collection of mid-water samples at 20 stations during the 2006 survey, and 10 stations during the next two studies. Samples were collected throughout the Inner, Middle, and Outer Harbor regions (Figure 1) and analyzed for a broad range of chemicals of concern, including heavy metals, PCBs, PAHs and other semivolatile organic compounds, butyltins, and pesticides.
Consolidated Slip
LA/LB Inner Harbor
Inner CabrilloBeach
LA 10LA 10
LA 03LA 03LA 05LA 05
LA 06LA 06
LA 11ALA 11A
LA 14LA 14
LA 19LA 19LA 18LA 18
LA 22ALA 22A
LA 23LA 23
LA 24LA 24
LA 26LA 26
LA 30LA 30
LA 32BLA 32B
LA 33LA 33
LA 35LA 35
LA 39LA 39 LA 41LA 41
LA 44LA 44 LA 46LA 46
LA 47LA 47
LA 49LA 49
LA 49ALA 49A
LA 50LA 50
LA 51LA 51
LA 55LA 55
LA 58LA 58
LA 59LA 59
LA 60LA 60
LA 62LA 62
LB 23LB 23
ChinaChinaShippingShipping
CruiseCruiseCenterCenter
LA 61LA 61
LA/LB Inner Harbor
LA/LB Outer HarborCabrillo Marina
Fish Harbor
LA River/Queensway Bay
LBI-3LBI-3
LBI-4LBI-4
LBI-5LBI-5
LBI-6LBI-6
LBI-7LBI-7
LBI-8LBI-8
LBI-9LBI-9
LBI-10LBI-10
LBM-1LBM-1
LBM-2LBM-2
LBM-3LBM-3
LBM-5LBM-5
LBM-7LBM-7
LBM-9LBM-9
LBM-10LBM-10
LBO-1LBO-1
LBO-2LBO-2
LBO-7LBO-7
LBO-9LBO-9LBO-10LBO-10
LB08-1LB08-1
LB08-2LB08-2
LB08-3LB08-3
LB08-4LB08-4
LB08-5LB08-5
LB08-6LB08-6
LB08-7LB08-7
LB08-8LB08-8
LB08-9LB08-9
LB08-10LB08-10
POLA/POLB Water Quality Stations and TMDL Areas
z:\croix\sd04\aquatics\pola_wq\mxd\2008_report_boundaries.mxd 01/23/2008
F I G U R E
1
Legend
Monitoring Locations
TMDL Areas
Cabrillo Marina
Consolidated Slip
Fish Harbor
LA River/ Queensway Bay
Inner Cabrillo Beach
LA/LB Inner Harbor
LA/LB Outer Harbor
Map NotesMonitoring Sample Location - POLAProjection: NAD 83, State Planes California FIPS 0405, Feet
0 4,0002,000Feet
Harbor Ambient Water Quality Summary July 2009
Page 5
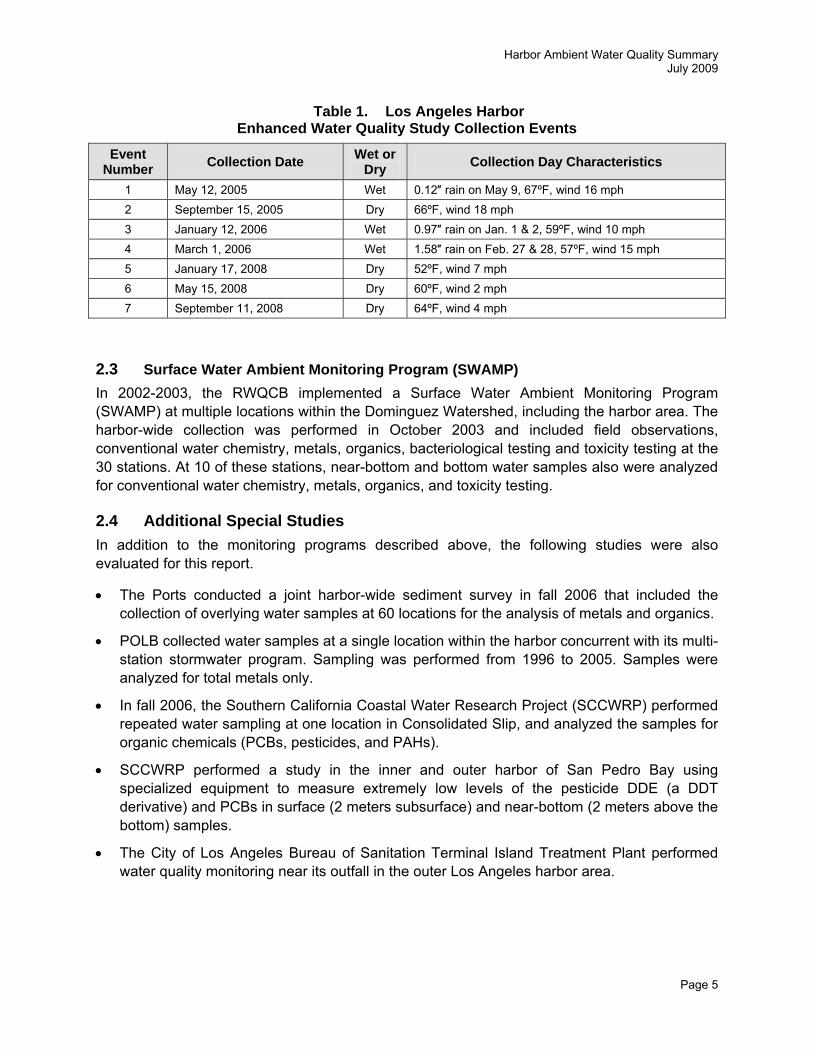
Table 1. Los Angeles Harbor Enhanced Water Quality Study Collection Events
Event Number Collection Date Wet or
Dry Collection Day Characteristics
1 May 12, 2005 Wet 0.12″ rain on May 9, 67ºF, wind 16 mph 2 September 15, 2005 Dry 66ºF, wind 18 mph 3 January 12, 2006 Wet 0.97″ rain on Jan. 1 & 2, 59ºF, wind 10 mph 4 March 1, 2006 Wet 1.58″ rain on Feb. 27 & 28, 57ºF, wind 15 mph 5 January 17, 2008 Dry 52ºF, wind 7 mph 6 May 15, 2008 Dry 60ºF, wind 2 mph 7 September 11, 2008 Dry 64ºF, wind 4 mph
2.3 Surface Water Ambient Monitoring Program (SWAMP) In 2002-2003, the RWQCB implemented a Surface Water Ambient Monitoring Program (SWAMP) at multiple locations within the Dominguez Watershed, including the harbor area. The harbor-wide collection was performed in October 2003 and included field observations, conventional water chemistry, metals, organics, bacteriological testing and toxicity testing at the 30 stations. At 10 of these stations, near-bottom and bottom water samples also were analyzed for conventional water chemistry, metals, organics, and toxicity testing.
2.4 Additional Special Studies In addition to the monitoring programs described above, the following studies were also evaluated for this report.
• The Ports conducted a joint harbor-wide sediment survey in fall 2006 that included the collection of overlying water samples at 60 locations for the analysis of metals and organics.
• POLB collected water samples at a single location within the harbor concurrent with its multi-station stormwater program. Sampling was performed from 1996 to 2005. Samples were analyzed for total metals only.
• In fall 2006, the Southern California Coastal Water Research Project (SCCWRP) performed repeated water sampling at one location in Consolidated Slip, and analyzed the samples for organic chemicals (PCBs, pesticides, and PAHs).
• SCCWRP performed a study in the inner and outer harbor of San Pedro Bay using specialized equipment to measure extremely low levels of the pesticide DDE (a DDT derivative) and PCBs in surface (2 meters subsurface) and near-bottom (2 meters above the bottom) samples.
• The City of Los Angeles Bureau of Sanitation Terminal Island Treatment Plant performed water quality monitoring near its outfall in the outer Los Angeles harbor area.
Harbor Ambient Water Quality Summary July 2009
This page intentionally left blank.
Page 6
Harbor Ambient Water Quality Summary July 2009
Page 7
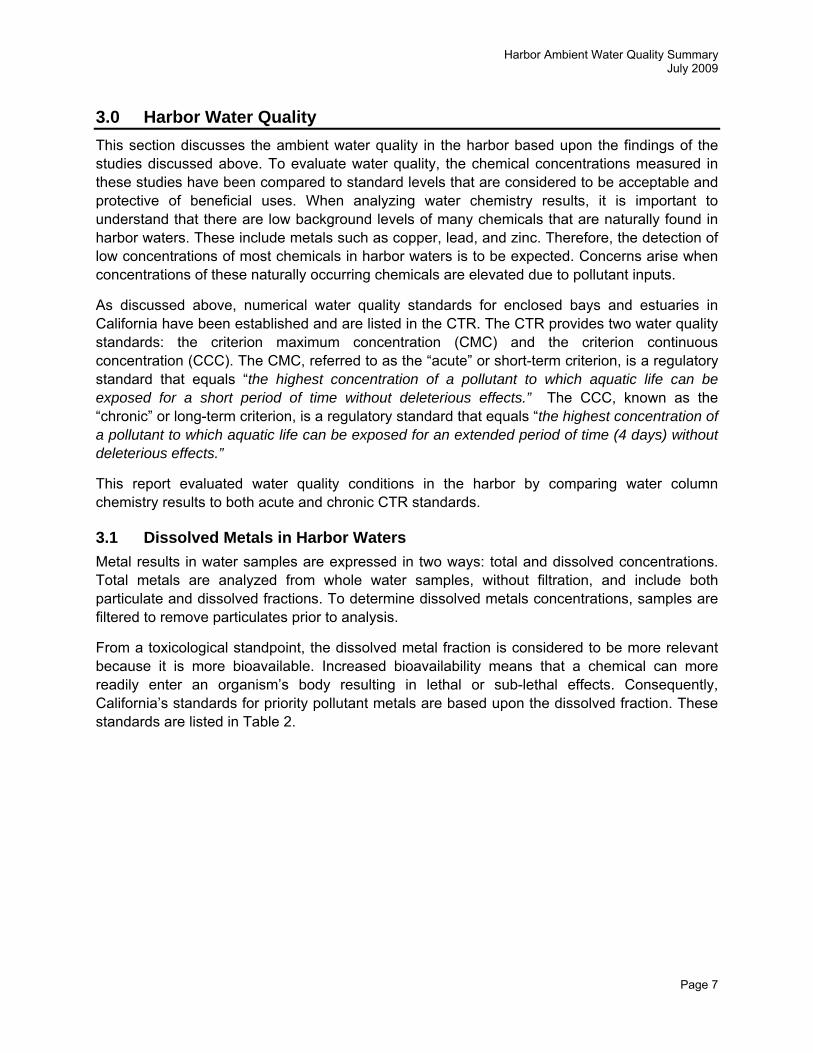
3.0 Harbor Water Quality This section discusses the ambient water quality in the harbor based upon the findings of the studies discussed above. To evaluate water quality, the chemical concentrations measured in these studies have been compared to standard levels that are considered to be acceptable and protective of beneficial uses. When analyzing water chemistry results, it is important to understand that there are low background levels of many chemicals that are naturally found in harbor waters. These include metals such as copper, lead, and zinc. Therefore, the detection of low concentrations of most chemicals in harbor waters is to be expected. Concerns arise when concentrations of these naturally occurring chemicals are elevated due to pollutant inputs.
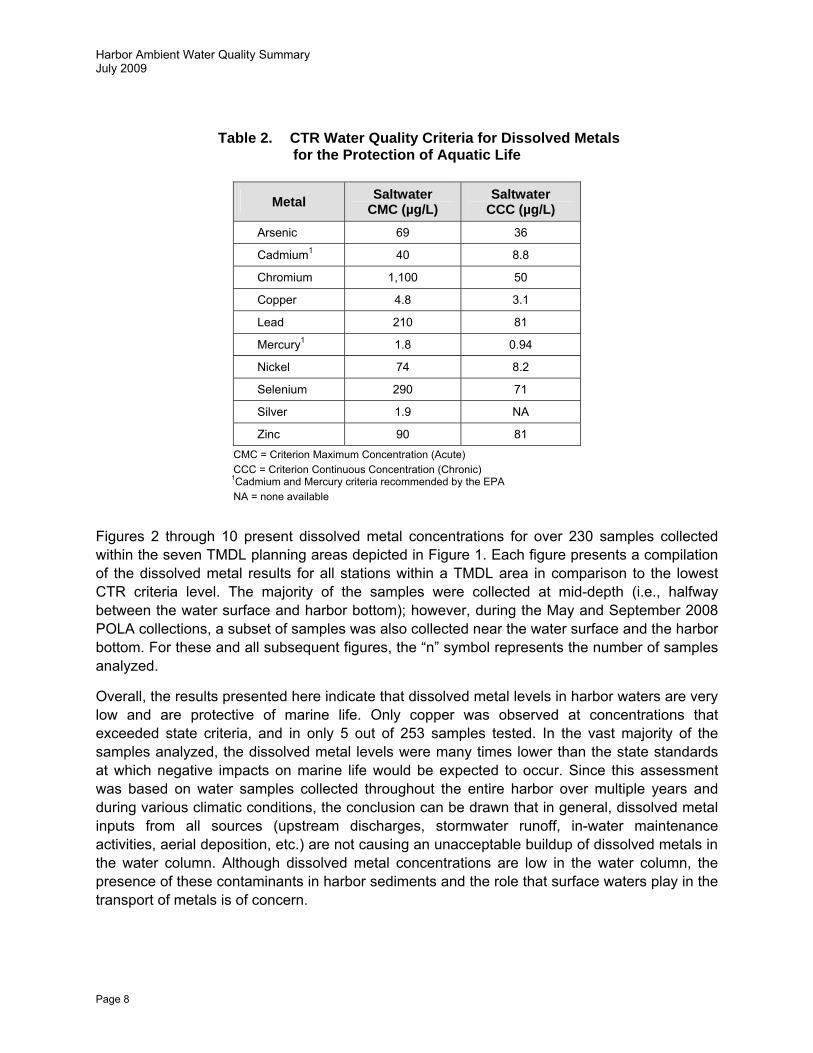
As discussed above, numerical water quality standards for enclosed bays and estuaries in California have been established and are listed in the CTR. The CTR provides two water quality standards: the criterion maximum concentration (CMC) and the criterion continuous concentration (CCC). The CMC, referred to as the “acute” or short-term criterion, is a regulatory standard that equals “the highest concentration of a pollutant to which aquatic life can be exposed for a short period of time without deleterious effects.” The CCC, known as the “chronic” or long-term criterion, is a regulatory standard that equals “the highest concentration of a pollutant to which aquatic life can be exposed for an extended period of time (4 days) without deleterious effects.”
This report evaluated water quality conditions in the harbor by comparing water column chemistry results to both acute and chronic CTR standards.
3.1 Dissolved Metals in Harbor Waters Metal results in water samples are expressed in two ways: total and dissolved concentrations. Total metals are analyzed from whole water samples, without filtration, and include both particulate and dissolved fractions. To determine dissolved metals concentrations, samples are filtered to remove particulates prior to analysis.
From a toxicological standpoint, the dissolved metal fraction is considered to be more relevant because it is more bioavailable. Increased bioavailability means that a chemical can more readily enter an organism’s body resulting in lethal or sub-lethal effects. Consequently, California’s standards for priority pollutant metals are based upon the dissolved fraction. These standards are listed in Table 2.
Harbor Ambient Water Quality Summary July 2009
Table 2. CTR Water Quality Criteria for Dissolved Metals for the Protection of Aquatic Life
Metal Saltwater CMC (µg/L)
Saltwater CCC (µg/L)
Arsenic 69 36
Cadmium1 40 8.8
Chromium 1,100 50
Copper 4.8 3.1
Lead 210 81
Mercury1 1.8 0.94
Nickel 74 8.2
Selenium 290 71
Silver 1.9 NA
Zinc 90 81 CMC = Criterion Maximum Concentration (Acute) CCC = Criterion Continuous Concentration (Chronic)
1Cadmium and Mercury criteria recommended by the EPA NA = none available
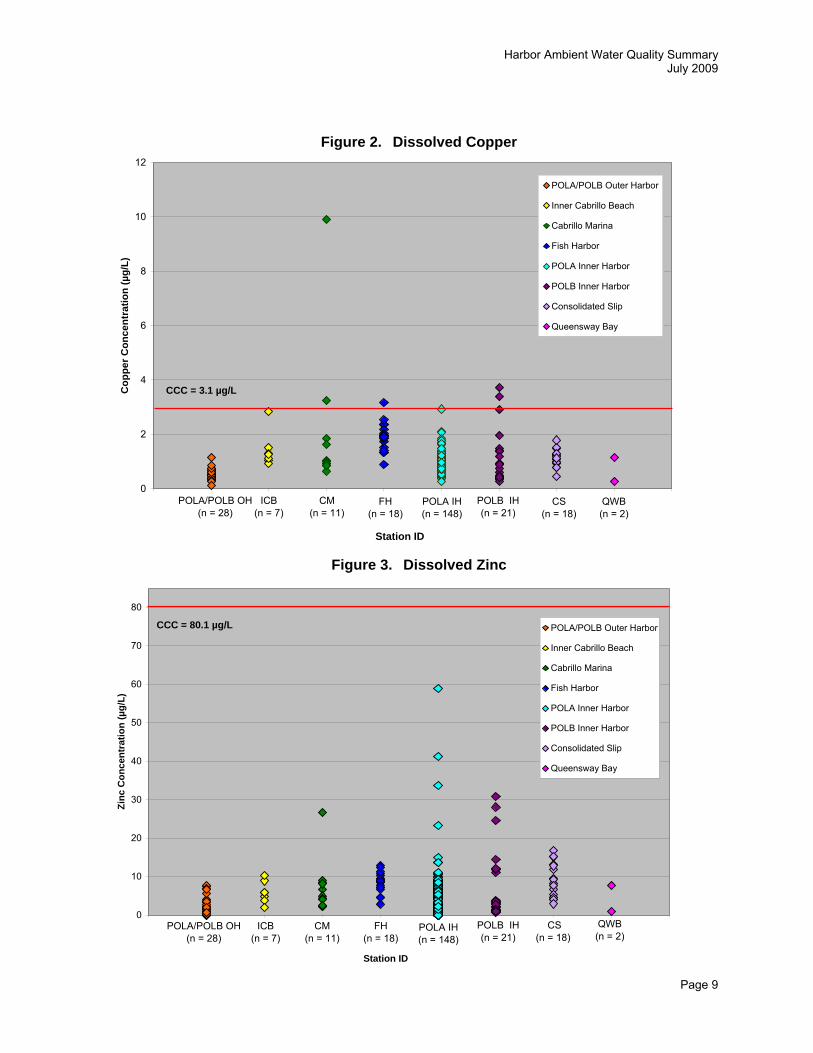
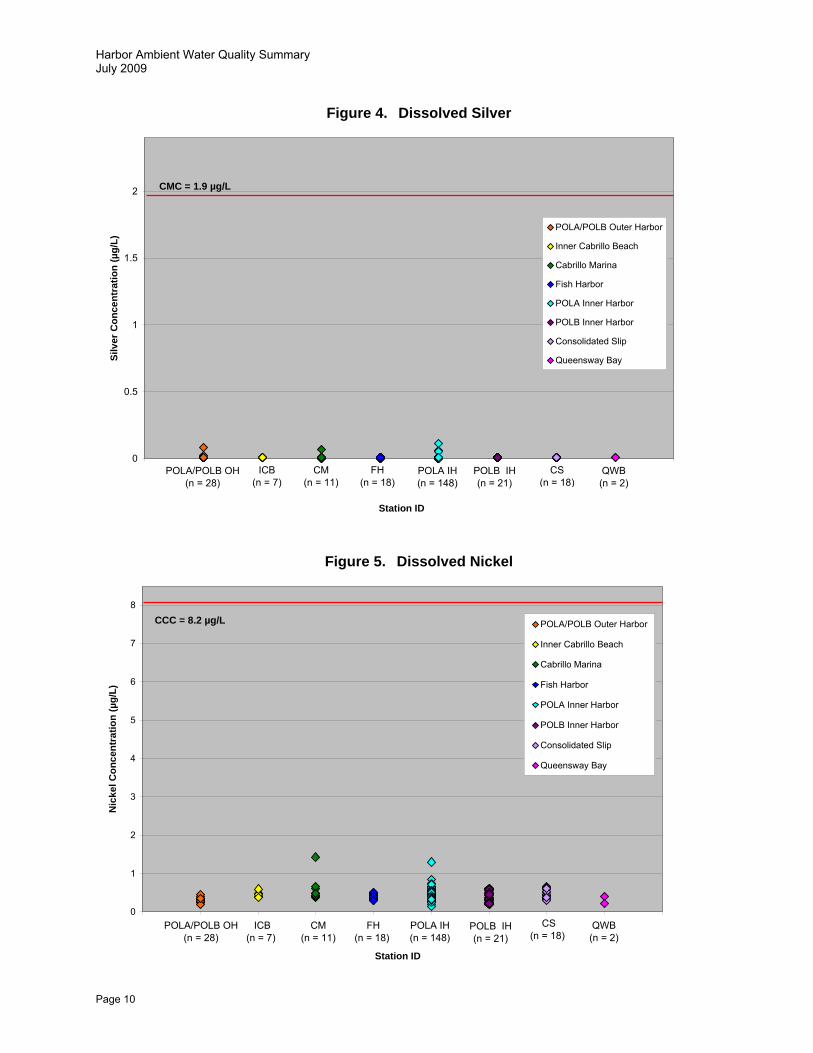
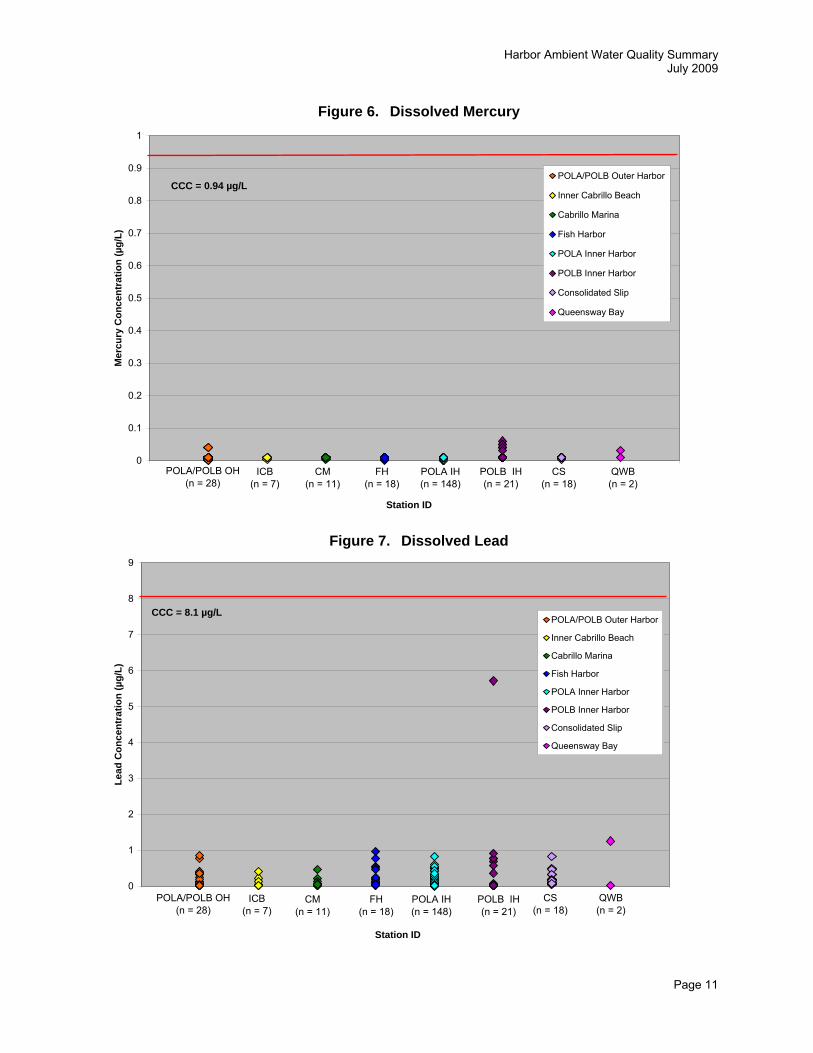
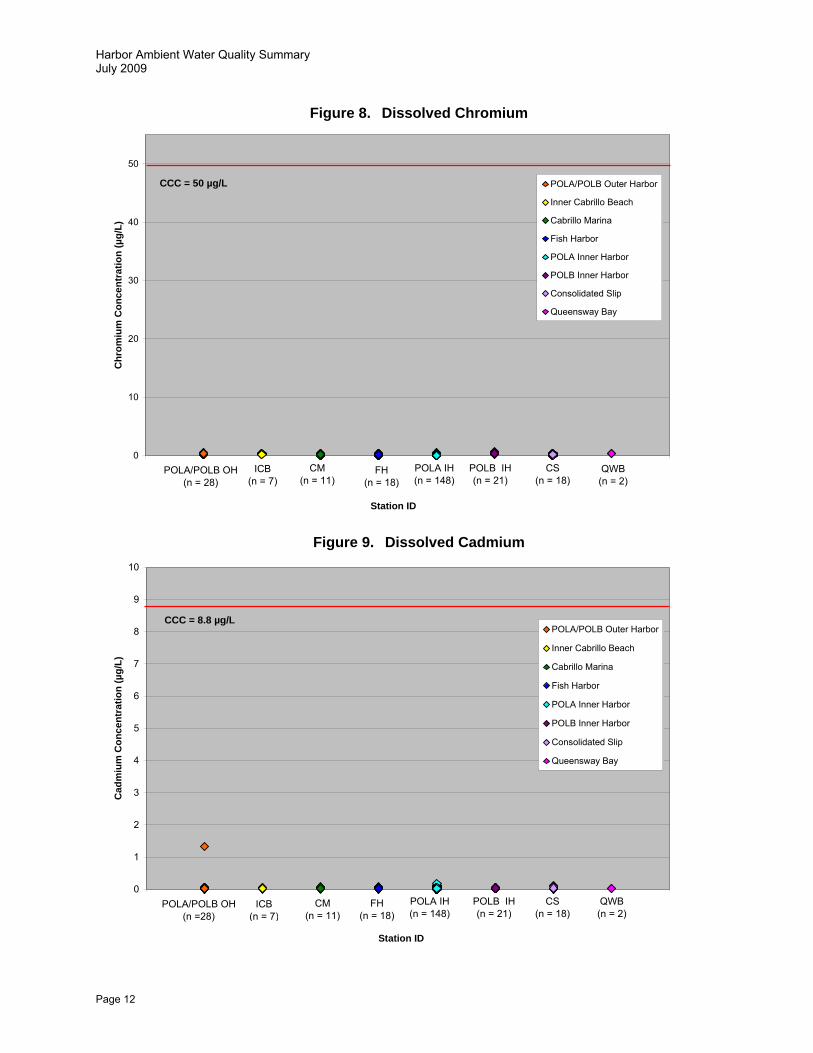
Figures 2 through 10 present dissolved metal concentrations for over 230 samples collected within the seven TMDL planning areas depicted in Figure 1. Each figure presents a compilation of the dissolved metal results for all stations within a TMDL area in comparison to the lowest CTR criteria level. The majority of the samples were collected at mid-depth (i.e., halfway between the water surface and harbor bottom); however, during the May and September 2008 POLA collections, a subset of samples was also collected near the water surface and the harbor bottom. For these and all subsequent figures, the “n” symbol represents the number of samples analyzed.
Overall, the results presented here indicate that dissolved metal levels in harbor waters are very low and are protective of marine life. Only copper was observed at concentrations that exceeded state criteria, and in only 5 out of 253 samples tested. In the vast majority of the samples analyzed, the dissolved metal levels were many times lower than the state standards at which negative impacts on marine life would be expected to occur. Since this assessment was based on water samples collected throughout the entire harbor over multiple years and during various climatic conditions, the conclusion can be drawn that in general, dissolved metal inputs from all sources (upstream discharges, stormwater runoff, in-water maintenance activities, aerial deposition, etc.) are not causing an unacceptable buildup of dissolved metals in the water column. Although dissolved metal concentrations are low in the water column, the presence of these contaminants in harbor sediments and the role that surface waters play in the transport of metals is of concern.
Page 8
Harbor Ambient Water Quality Summary July 2009
Figure 2. Dissolved Copper
0
2
4
6
8
10
12
Station ID
Cop
per C
once
ntra
tion
(µg/
L)
POLA/POLB Outer Harbor
Inner Cabrillo Beach
Cabrillo Marina
Fish Harbor
POLA Inner Harbor
POLB Inner Harbor
Consolidated Slip
Queensway Bay
CCC = 3.1 µg/L
POLA/POLB OH (n = 28)
ICB (n = 7)
CM(n = 11)
FH(n = 18)
POLA IH(n = 148)
POLB IH(n = 21)
CS(n = 18)
QWB(n = 2)
Figure 3. Dissolved Zinc
Page 9
0
10
20
30
40
50
60
70
80
Station ID
Zinc
Con
cent
ratio
n (µ
g/L)
POLA/POLB Outer Harbor
Inner Cabrillo Beach
Cabrillo Marina
Fish Harbor
POLA Inner Harbor
POLB Inner Harbor
Consolidated Slip
Queensway Bay
CCC = 80.1 µg/L
POLA/POLB OH(n = 28)
ICB(n = 7)
CM(n = 11)
FH(n = 18)
POLA IH(n = 148)
POLB IH(n = 21)
CS(n = 18)
QWB(n = 2)
Harbor Ambient Water Quality Summary July 2009
Figure 4. Dissolved Silver
0
0.5
1
1.5
2
Station ID
Silv
er C
once
ntra
tion
(µg/
L)
POLA/POLB Outer Harbor
Inner Cabrillo Beach
Cabrillo Marina
Fish Harbor
POLA Inner Harbor
POLB Inner Harbor
Consolidated Slip
Queensway Bay
POLA/POLB OH(n = 28)
ICB(n = 7)
CM(n = 11)
FH(n = 18)
POLA IH(n = 148)
POLB IH(n = 21)
CS(n = 18)
QWB(n = 2)
CMC = 1.9 µg/L
Figure 5. Dissolved Nickel
0
1
2
3
4
5
6
7
8
Station ID
Nic
kel C
once
ntra
tion
(µg/
L)
POLA/POLB Outer Harbor
Inner Cabrillo Beach
Cabrillo Marina
Fish Harbor
POLA Inner Harbor
POLB Inner Harbor
Consolidated Slip
Queensway Bay
POLA/POLB OH(n = 28)
ICB(n = 7)
CM(n = 11)
FH(n = 18)
POLA IH(n = 148)
POLB IH(n = 21)
CS(n = 18)
QWB(n = 2)
CCC = 8.2 µg/L
Page 10
Harbor Ambient Water Quality Summary July 2009
Page 11
Figure 6. Dissolved Mercury
0
0.1
0.2
0.3
0.4
0.5
0.6
0.7
0.8
0.9
1
Station ID
Mer
cury
Con
cent
ratio
n (µ
g/L)
POLA/POLB Outer Harbor
Inner Cabrillo Beach
Cabrillo Marina
Fish Harbor
POLA Inner Harbor
POLB Inner Harbor
Consolidated Slip
Queensway Bay
POLA/POLB OH(n = 28)
ICB (n = 7)
CM(n = 11)
FH(n = 18)
POLA IH(n = 148)
POLB IH(n = 21)
CS(n = 18)
QWB (n = 2)
CCC = 0.94 µg/L
Figure 7. Dissolved Lead
0
1
2
3
4
5
6
7
8
9
Station ID
Lead
Con
cent
ratio
n (µ
g/L)
POLA/POLB Outer Harbor
Inner Cabrillo Beach
Cabrillo Marina
Fish Harbor
POLA Inner Harbor
POLB Inner Harbor
Consolidated Slip
Queensway Bay
POLA/POLB OH(n = 28)
ICB (n = 7)
CM(n = 11)
FH(n = 18)
POLA IH(n = 148)
POLB IH(n = 21)
CS(n = 18)
QWB(n = 2)
CCC = 8.1 µg/L
Harbor Ambient Water Quality Summary July 2009
Figure 8. Dissolved Chromium
0
10
20
30
40
50
Station ID
Chr
omiu
m C
once
ntra
tion
(µg/
L)
POLA/POLB Outer Harbor
Inner Cabrillo Beach
Cabrillo Marina
Fish Harbor
POLA Inner Harbor
POLB Inner Harbor
Consolidated Slip
Queensway Bay
POLA/POLB OH(n = 28)
ICB(n = 7)
CM(n = 11)
FH(n = 18)
POLA IH(n = 148)
POLB IH(n = 21)
CS(n = 18)
QWB(n = 2)
CCC = 50 µg/L
Figure 9. Dissolved Cadmium
0
1
2
3
4
5
6
7
8
9
10
Station ID
Cad
miu
m C
once
ntra
tion
(µg/
L)
POLA/POLB Outer Harbor
Inner Cabrillo Beach
Cabrillo Marina
Fish Harbor
POLA Inner Harbor
POLB Inner Harbor
Consolidated Slip
Queensway Bay
POLA/POLB OH(n =28)
ICB (n = 7)
CM(n = 11)
FH(n = 18)
POLA IH(n = 148)
POLB IH(n = 21)
CS(n = 18)
QWB(n = 2)
CCC = 8.8 µg/L
Page 12
Harbor Ambient Water Quality Summary July 2009
Page 13
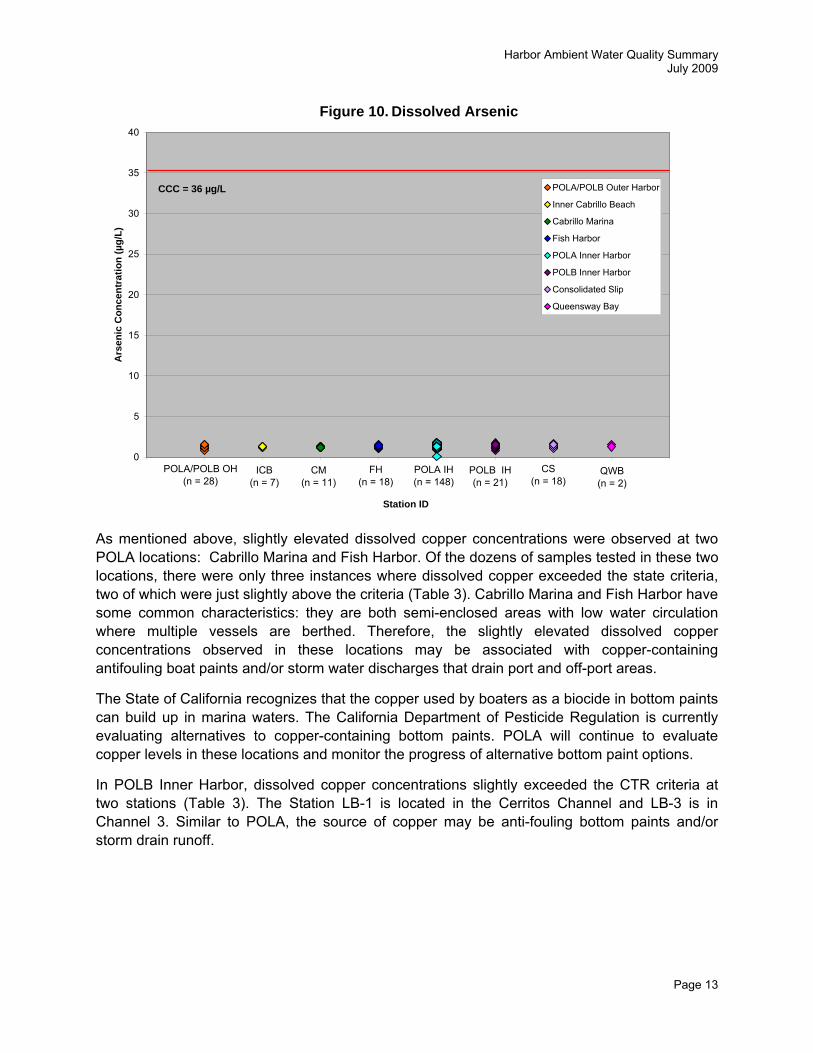
Figure 10. Dissolved Arsenic
0
5
10
15
20
25
30
35
40
Station ID
Ars
enic
Con
cent
ratio
n (µ
g/L)
POLA/POLB Outer Harbor
Inner Cabrillo Beach
Cabrillo Marina
Fish Harbor
POLA Inner Harbor
POLB Inner Harbor
Consolidated Slip
Queensway Bay
POLA/POLB OH(n = 28)
ICB (n = 7)
CM(n = 11)
FH(n = 18)
POLA IH(n = 148)
POLB IH(n = 21)
CS(n = 18)
QWB(n = 2)
CCC = 36 µg/L
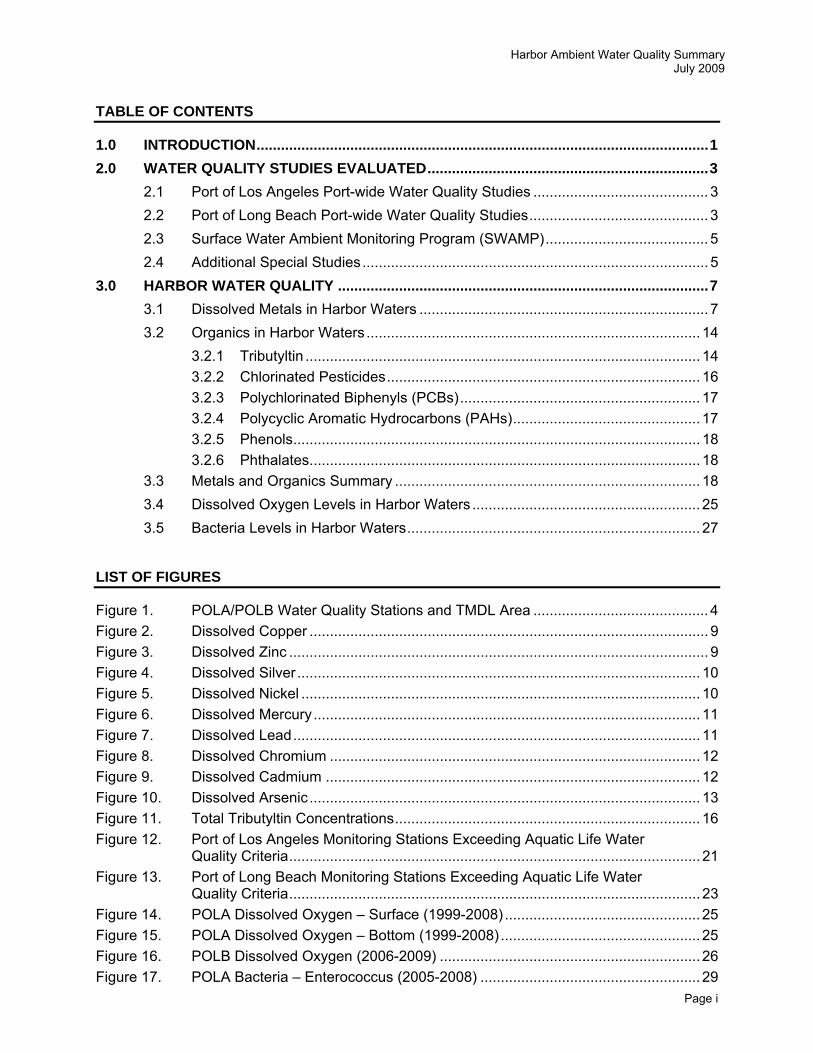
As mentioned above, slightly elevated dissolved copper concentrations were observed at two POLA locations: Cabrillo Marina and Fish Harbor. Of the dozens of samples tested in these two locations, there were only three instances where dissolved copper exceeded the state criteria, two of which were just slightly above the criteria (Table 3). Cabrillo Marina and Fish Harbor have some common characteristics: they are both semi-enclosed areas with low water circulation where multiple vessels are berthed. Therefore, the slightly elevated dissolved copper concentrations observed in these locations may be associated with copper-containing antifouling boat paints and/or storm water discharges that drain port and off-port areas.
The State of California recognizes that the copper used by boaters as a biocide in bottom paints can build up in marina waters. The California Department of Pesticide Regulation is currently evaluating alternatives to copper-containing bottom paints. POLA will continue to evaluate copper levels in these locations and monitor the progress of alternative bottom paint options.
In POLB Inner Harbor, dissolved copper concentrations slightly exceeded the CTR criteria at two stations (Table 3). The Station LB-1 is located in the Cerritos Channel and LB-3 is in Channel 3. Similar to POLA, the source of copper may be anti-fouling bottom paints and/or storm drain runoff.
Harbor Ambient Water Quality Summary July 2009
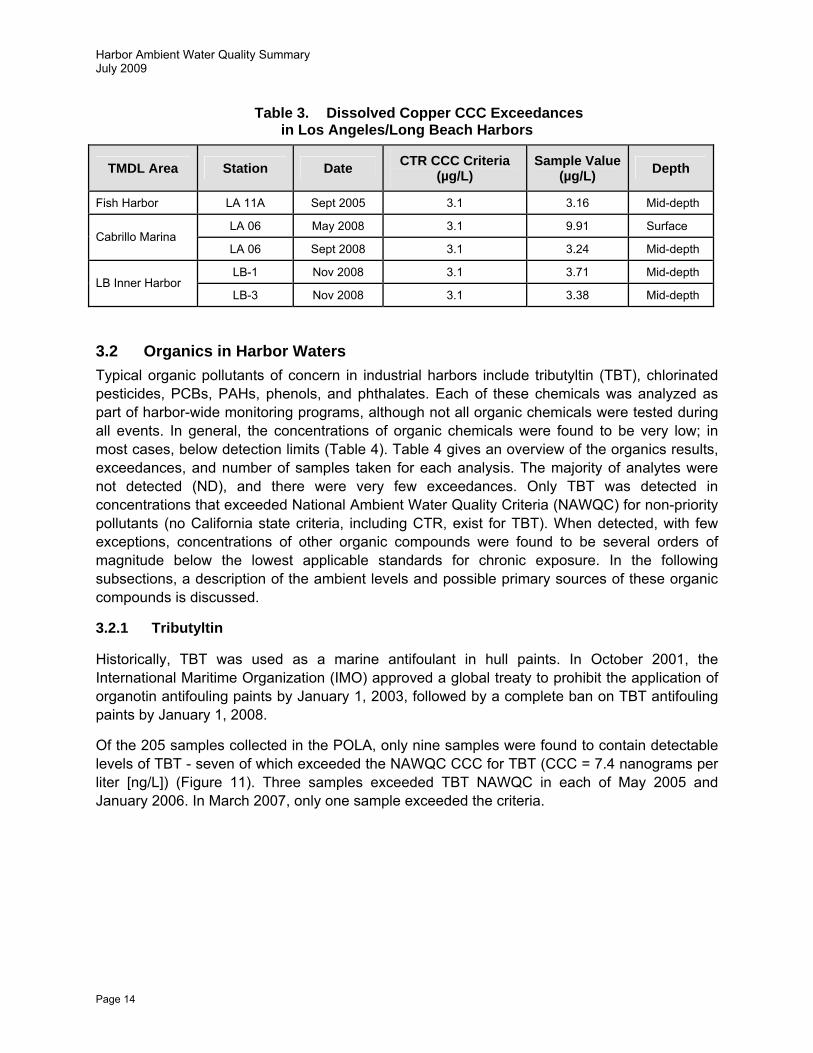
Table 3. Dissolved Copper CCC Exceedances in Los Angeles/Long Beach Harbors
TMDL Area Station Date CTR CCC Criteria (µg/L)
Sample Value (µg/L) Depth
Fish Harbor LA 11A Sept 2005 3.1 3.16 Mid-depth
LA 06 May 2008 3.1 9.91 Surface Cabrillo Marina
LA 06 Sept 2008 3.1 3.24 Mid-depth
LB-1 Nov 2008 3.1 3.71 Mid-depth LB Inner Harbor
LB-3 Nov 2008 3.1 3.38 Mid-depth
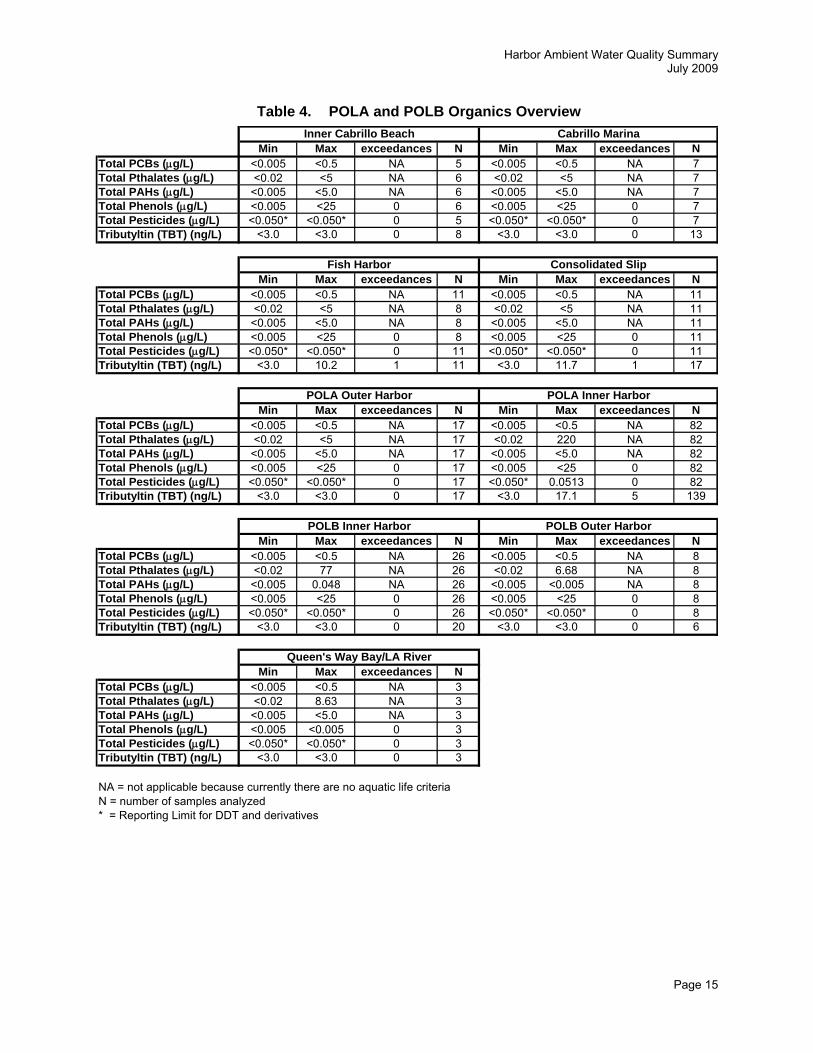
3.2 Organics in Harbor Waters Typical organic pollutants of concern in industrial harbors include tributyltin (TBT), chlorinated pesticides, PCBs, PAHs, phenols, and phthalates. Each of these chemicals was analyzed as part of harbor-wide monitoring programs, although not all organic chemicals were tested during all events. In general, the concentrations of organic chemicals were found to be very low; in most cases, below detection limits (Table 4). Table 4 gives an overview of the organics results, exceedances, and number of samples taken for each analysis. The majority of analytes were not detected (ND), and there were very few exceedances. Only TBT was detected in concentrations that exceeded National Ambient Water Quality Criteria (NAWQC) for non-priority pollutants (no California state criteria, including CTR, exist for TBT). When detected, with few exceptions, concentrations of other organic compounds were found to be several orders of magnitude below the lowest applicable standards for chronic exposure. In the following subsections, a description of the ambient levels and possible primary sources of these organic compounds is discussed.
3.2.1 Tributyltin
Historically, TBT was used as a marine antifoulant in hull paints. In October 2001, the International Maritime Organization (IMO) approved a global treaty to prohibit the application of organotin antifouling paints by January 1, 2003, followed by a complete ban on TBT antifouling paints by January 1, 2008.
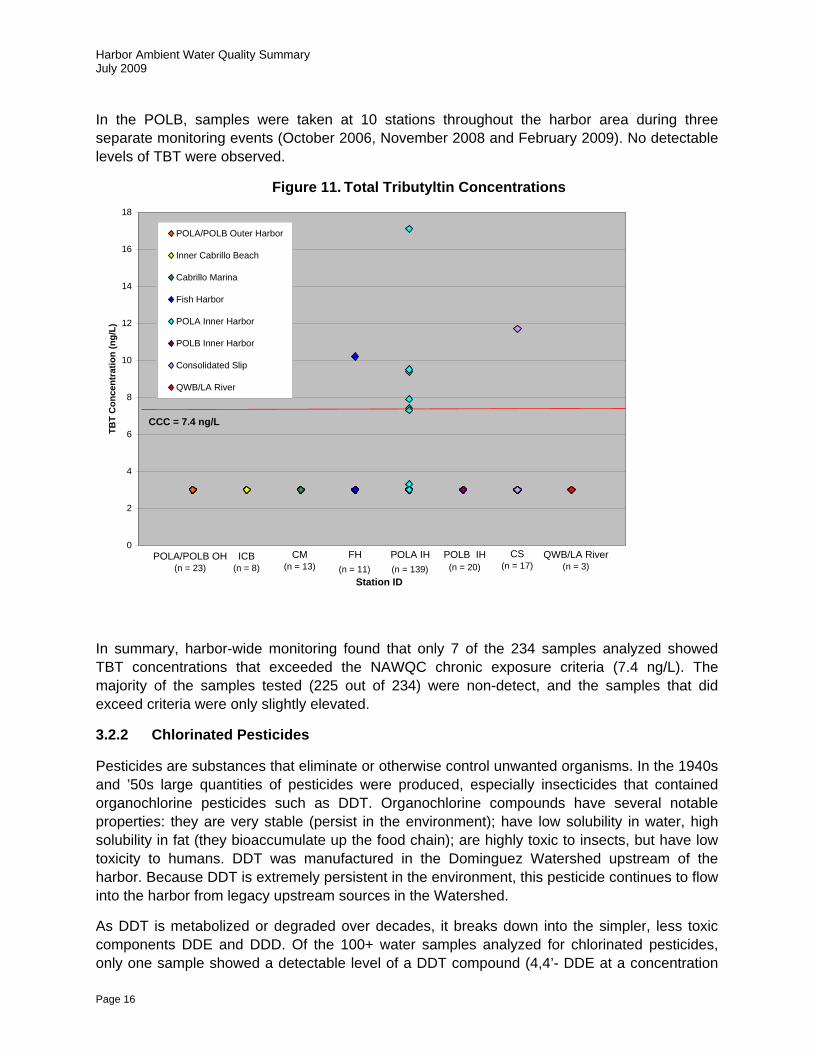
Of the 205 samples collected in the POLA, only nine samples were found to contain detectable levels of TBT - seven of which exceeded the NAWQC CCC for TBT (CCC = 7.4 nanograms per liter [ng/L]) (Figure 11). Three samples exceeded TBT NAWQC in each of May 2005 and January 2006. In March 2007, only one sample exceeded the criteria.
Page 14
Harbor Ambient Water Quality Summary July 2009
Page 15
Table 4. POLA and POLB Organics Overview
Min Max exceedances N Min Max exceedances NTotal PCBs (μg/L) <0.005 <0.5 NA 5 <0.005 <0.5 NA 7Total Pthalates (μg/L) <0.02 <5 NA 6 <0.02 <5 NA 7Total PAHs (μg/L) <0.005 <5.0 NA 6 <0.005 <5.0 NA 7Total Phenols (μg/L) <0.005 <25 0 6 <0.005 <25 0 7Total Pesticides (μg/L) <0.050* <0.050* 0 5 <0.050* <0.050* 0 7Tributyltin (TBT) (ng/L) <3.0 <3.0 0 8 <3.0 <3.0 0 13
Min Max exceedances N Min Max exceedances NTotal PCBs (μg/L) <0.005 <0.5 NA 11 <0.005 <0.5 NA 11Total Pthalates (μg/L) <0.02 <5 NA 8 <0.02 <5 NA 11Total PAHs (μg/L) <0.005 <5.0 NA 8 <0.005 <5.0 NA 11Total Phenols (μg/L) <0.005 <25 0 8 <0.005 <25 0 11Total Pesticides (μg/L) <0.050* <0.050* 0 11 <0.050* <0.050* 0 11Tributyltin (TBT) (ng/L) <3.0 10.2 1 11 <3.0 11.7 1 17
Min Max exceedances N Min Max exceedances NTotal PCBs (μg/L) <0.005 <0.5 NA 17 <0.005 <0.5 NA 82Total Pthalates (μg/L) <0.02 <5 NA 17 <0.02 220 NA 82Total PAHs (μg/L) <0.005 <5.0 NA 17 <0.005 <5.0 NA 82Total Phenols (μg/L) <0.005 <25 0 17 <0.005 <25 0 82Total Pesticides (μg/L) <0.050* <0.050* 0 17 <0.050* 0.0513 0 82Tributyltin (TBT) (ng/L) <3.0 <3.0 0 17 <3.0 17.1 5 139
Min Max exceedances N Min Max exceedances NTotal PCBs (μg/L) <0.005 <0.5 NA 26 <0.005 <0.5 NA 8Total Pthalates (μg/L) <0.02 77 NA 26 <0.02 6.68 NA 8Total PAHs (μg/L) <0.005 0.048 NA 26 <0.005 <0.005 NA 8Total Phenols (μg/L) <0.005 <25 0 26 <0.005 <25 0 8Total Pesticides (μg/L) <0.050* <0.050* 0 26 <0.050* <0.050* 0 8Tributyltin (TBT) (ng/L) <3.0 <3.0 0 20 <3.0 <3.0 0 6
Min Max exceedances NTotal PCBs (μg/L) <0.005 <0.5 NA 3Total Pthalates (μg/L) <0.02 8.63 NA 3Total PAHs (μg/L) <0.005 <5.0 NA 3Total Phenols (μg/L) <0.005 <0.005 0 3Total Pesticides (μg/L) <0.050* <0.050* 0 3Tributyltin (TBT) (ng/L) <3.0 <3.0 0 3
NA = not applicable because currently there are no aquatic life criteriaN = number of samples analyzed* = Reporting Limit for DDT and derivatives
Inner Cabrillo Beach Cabrillo Marina
Fish Harbor Consolidated Slip
POLA Inner Harbor
Queen's Way Bay/LA River
POLB Inner Harbor POLB Outer Harbor
POLA Outer Harbor
Harbor Ambient Water Quality Summary July 2009
Page 16
In the POLB, samples were taken at 10 stations throughout the harbor area during three separate monitoring events (October 2006, November 2008 and February 2009). No detectable levels of TBT were observed.
Figure 11. Total Tributyltin Concentrations
0
2
4
6
8
10
12
14
16
18
Station ID
TBT
Con
cent
ratio
n (n
g/L)
POLA/POLB Outer Harbor
Inner Cabrillo Beach
Cabrillo Marina
Fish Harbor
POLA Inner Harbor
POLB Inner Harbor
Consolidated Slip
QWB/LA River
CCC = 7.4 ng/L
POLA/POLB OH(n = 23)
ICB(n = 8)
CM(n = 13)
FH POLA IH POLB IH(n = 20)
CS(n = 17)(n = 11) (n = 139)
QWB/LA River(n = 3)
In summary, harbor-wide monitoring found that only 7 of the 234 samples analyzed showed TBT concentrations that exceeded the NAWQC chronic exposure criteria (7.4 ng/L). The majority of the samples tested (225 out of 234) were non-detect, and the samples that did exceed criteria were only slightly elevated.
3.2.2 Chlorinated Pesticides
Pesticides are substances that eliminate or otherwise control unwanted organisms. In the 1940s and ’50s large quantities of pesticides were produced, especially insecticides that contained organochlorine pesticides such as DDT. Organochlorine compounds have several notable properties: they are very stable (persist in the environment); have low solubility in water, high solubility in fat (they bioaccumulate up the food chain); are highly toxic to insects, but have low toxicity to humans. DDT was manufactured in the Dominguez Watershed upstream of the harbor. Because DDT is extremely persistent in the environment, this pesticide continues to flow into the harbor from legacy upstream sources in the Watershed.
As DDT is metabolized or degraded over decades, it breaks down into the simpler, less toxic components DDE and DDD. Of the 100+ water samples analyzed for chlorinated pesticides, only one sample showed a detectable level of a DDT compound (4,4’- DDE at a concentration
Harbor Ambient Water Quality Summary July 2009
Page 17
of 0.05 µg/L). There are no aquatic life CTR criteria for 4,4’- DDE. These findings indicate that, in general, chlorinated pesticides are not an ambient water column issue in the harbor.
In addition to the Port-wide study results described above, SCCWRP conducted a limited set of analyses on water samples collected at several Inner and Outer Harbor locations as well as in Consolidated Slip. SCCWRP’s studies employed the use of specialized scientific equipment designed to measure organic chemical concentrations at extremely low levels. Results from four stations within Inner and Outer Harbor waters show elevated levels of DDE in comparison to CTR human health numeric criteria (0.00059 µg/L). In SCCWRP’s Consolidated Slip study, average results showed elevated levels of total DDT in comparison to CTR human health criteria for consumption of organisms only. The very low levels of DDE observed in water samples in the SCCWRP study were not at levels where impacts to aquatic organisms would be expected. However, these levels are considered to be a concern to human health, due to the ability of chlorinated pesticides to biomagnify in the food chain.
3.2.3 Polychlorinated Biphenyls (PCBs)
Polychlorinated biphenyls (PCBs) were used extensively as a coolant in electrical transformers and in the manufacture of lubricants, sealants and wiring components, among a variety of other uses. In 1970 they were banned in the United States due to their toxicity to humans, persistence in the environment, resistance to break down over time, and tendency to bioaccumulate in living systems. PCBs are analyzed as individual congeners or families of congeners called Aroclors, as determined by the amount of chlorine they contain.
The vast majority of PCB results for both harbors were non-detect. There were only three instances where PCBs were detected: one in POLA Main Channel and two in POLB Harbor Channel Two. All three samples were only slightly above the analytical detection level of 0.001 μg/L, and well below the CTR CCC criteria of 0.03 µg/L. The results of harbor monitoring for PCBs indicate that these chemicals are not of concern in the water column.
As described above, SCCWRP conducted a limited set of analyses using specialized equipment on water samples collected at several Inner and Outer Harbor locations, as well as in Consolidated Slip. Results from four stations within Inner and Outer Harbor waters show levels of PCBs that exceeded the CTR human health numeric criteria at these stations; aquatic life criteria were not exceeded. In SCCWRP’s Consolidated Slip study, average results showed elevated levels of total PCBs in comparison to CTR human health criteria for consumption of organisms only.
3.2.4 Polycyclic Aromatic Hydrocarbons (PAHs)
Polycyclic aromatic hydrocarbons (PAHs) are a product of the incomplete combustion of fuels such as oil, coal tar, forest fires, and engine exhaust. Likely sources of PAHs found in harbor waters include oil or fuel spills, or storm and dry weather runoff from upstream. Similar to PCBs in structure, they tend to persist in the environment, prefer to bind to sediments rather than dissolve in water, and can bioaccumulate.
In Los Angeles Harbor, PAHs were not generally detected in water samples in the initial four field collection events. Starting with the fifth event, however, a new, ultra low detection method was employed. Method detection limits dropped from 5.0 µg/L to 0.001 µg/L. Using this new sensitive analytical method, PAHs were detected in most samples. Although there are no CTR
Harbor Ambient Water Quality Summary July 2009
ambient water criteria for PAHs for aquatic life effects for comparison, the results obtained in this study were only slightly above analytical detection.
In Long Beach Harbor, PAHs were not detected in the initial October 2006 sampling. Analyses from the ultra low detection testing of November 2008 and February 2009 samples detected less than 1 µg/L total PAH in samples from stations scattered throughout the harbor, with the highest concentrations and number of individual PAHs showing up at two stations in the inner harbor (Channel Three and Cerritos Channel).
3.2.5 Phenols
Phenols are organic compounds with many uses, including antiseptics, herbicides, synthetic resins, and ingredients of sunscreens and cosmetics. They degrade very easily and do not last long in the environment. Typically, if phenols are found in fish tissue or water samples it indicates a current and/or chronic exposure. No phenolic compounds were detected in any of the samples taken in either harbor.
3.2.6 Phthalates
Phthalates are used to improve flexibility in many common plastic products. Their most common mode of entry into the environment is off-gassing from plastics. As the plastics de-gas, the phthalates attach to particles in the atmosphere and eventually enter marine waters via storm drains or aerial deposition. Phthalates generally biodegrade fairly quickly, tend not to bioaccumulate, and have a relatively low impact on human health.
Low levels of phthalates were found at stations throughout both harbors. The first observed multiple occurrences of phthalates in POLA water samples were noted in March 2006. This sampling event occurred within 24 hours of a significant rain event (1.58 inches of rain). These results may be due to the transport of phthalates in stormwater to the harbor environment. Phthalates were detected at multiple locations in the POLA in March 2006 and January 2008, and in POLB in November 2008 and February 2009. The most common phthalates measured were bis (2-ethylhexyl) phthalate, butylbenzyl phthalate, and diethyl phthalate which is consistent with the wide-ranging uses of these phthalates in plastics. The levels at which phthalates cause effects on marine organisms in surface waters are not well understood, and are currently the focus of considerable scientific research. There are no aquatic life CTR criteria for phthalates in surface waters.
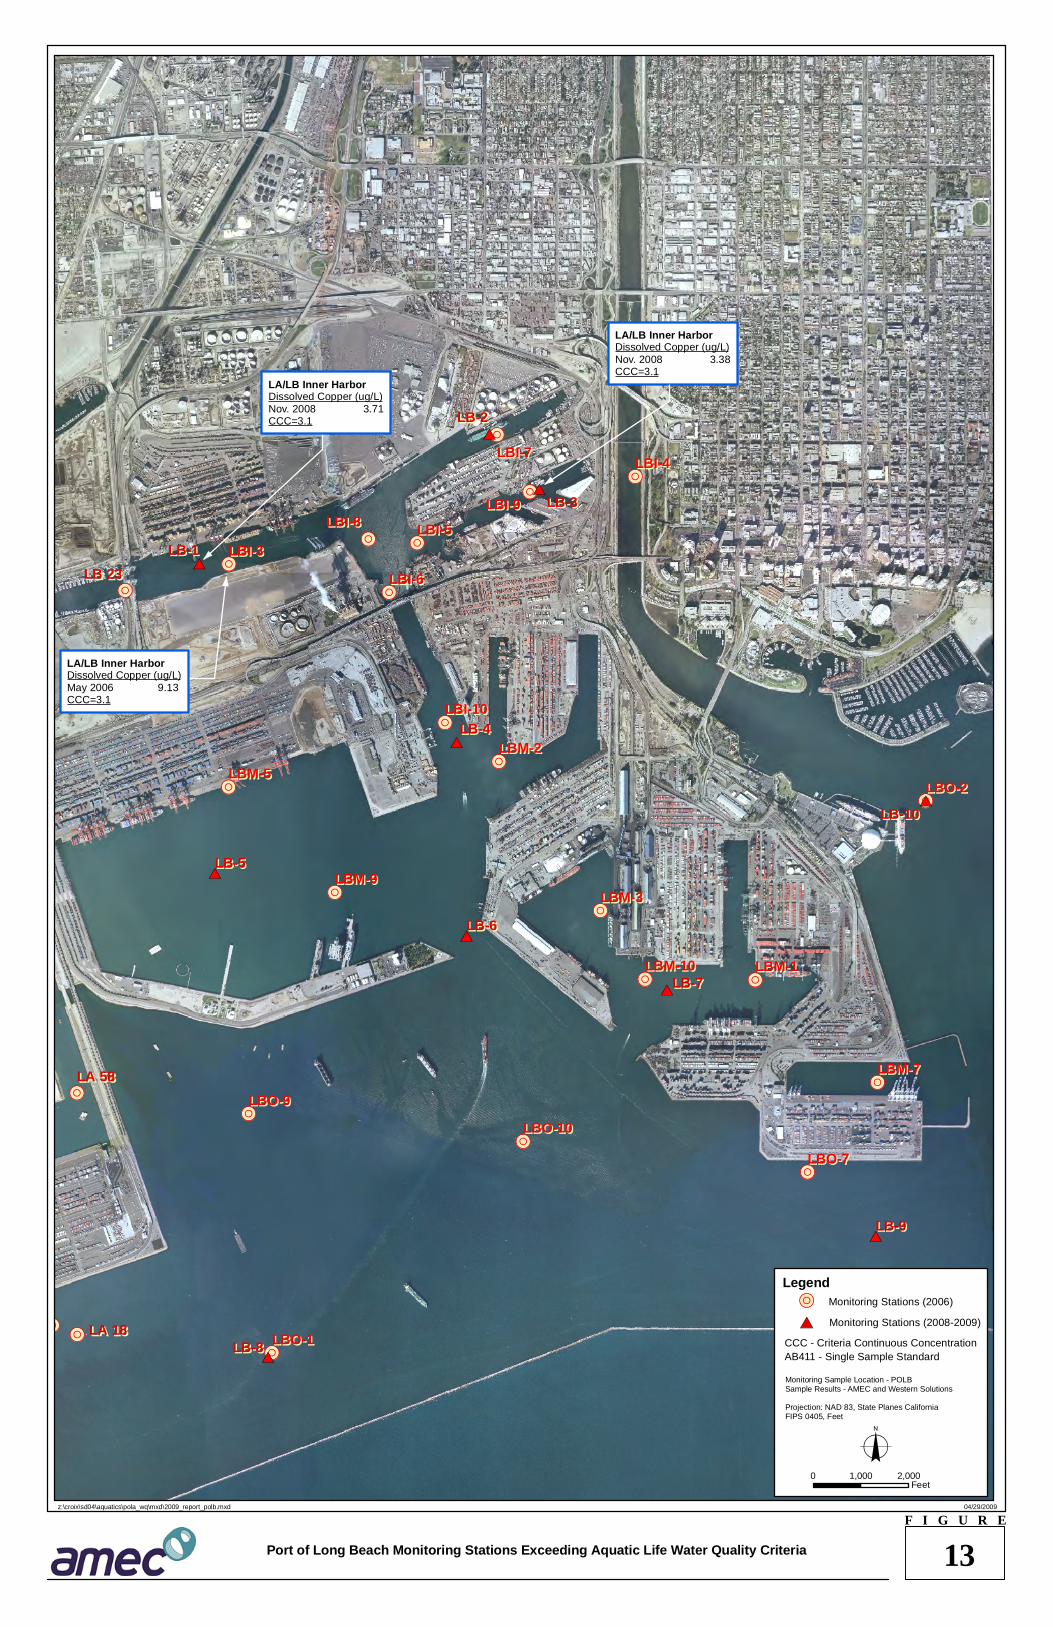
3.3 Metals and Organics Summary As discussed previously, the only two pollutants to exceed state water quality criteria were copper and tributyltin. Figures 12 and 13 depict the locations at which aquatic life water quality criteria were exceeded in POLA and POLB, respectively.
3.4 Dissolved Oxygen Levels in Harbor Waters As discussed previously, POLA began conducting harbor-wide water quality sampling in the late 1960s. POLA’s ongoing monthly monitoring involves the measurement of basic water quality parameters such as dissolved oxygen (DO), temperature, and water clarity. In the late 1960s, it was not uncommon for DO concentrations in the POLA to average 1-2 mg/L, particularly in the inner harbor area with its combination of high pollutant inputs from the Dominguez Channel and
Page 18
Harbor Ambient Water Quality Summary July 2009
Page 19
low tidal flushing with fresh ocean water. As such, due to low DO concentrations the harbor’s marine life was severely impacted.
Although implementation of the state Porter-Cologne Act in 1969 helped improve POLA water quality, it wasn’t until the implementation in 1972 of the CWA, coupled with the reduction in point source discharges into the harbor, that dissolved oxygen concentrations reached the levels necessary for sustaining a healthy environment for aquatic organisms (i.e., 5-6 mg/L).
Minimum levels of dissolved oxygen in harbor water are regulated by the RWQCB. The Los Angeles Basin Plan standard for DO in harbor waters reads as follows:
For that area known as the Outer Harbor area of Los Angeles-Long Beach Harbors, the mean dissolved oxygen concentrations must be 6.0 mg/L or greater, provided that no single concentration be less than 5.0 mg/L.
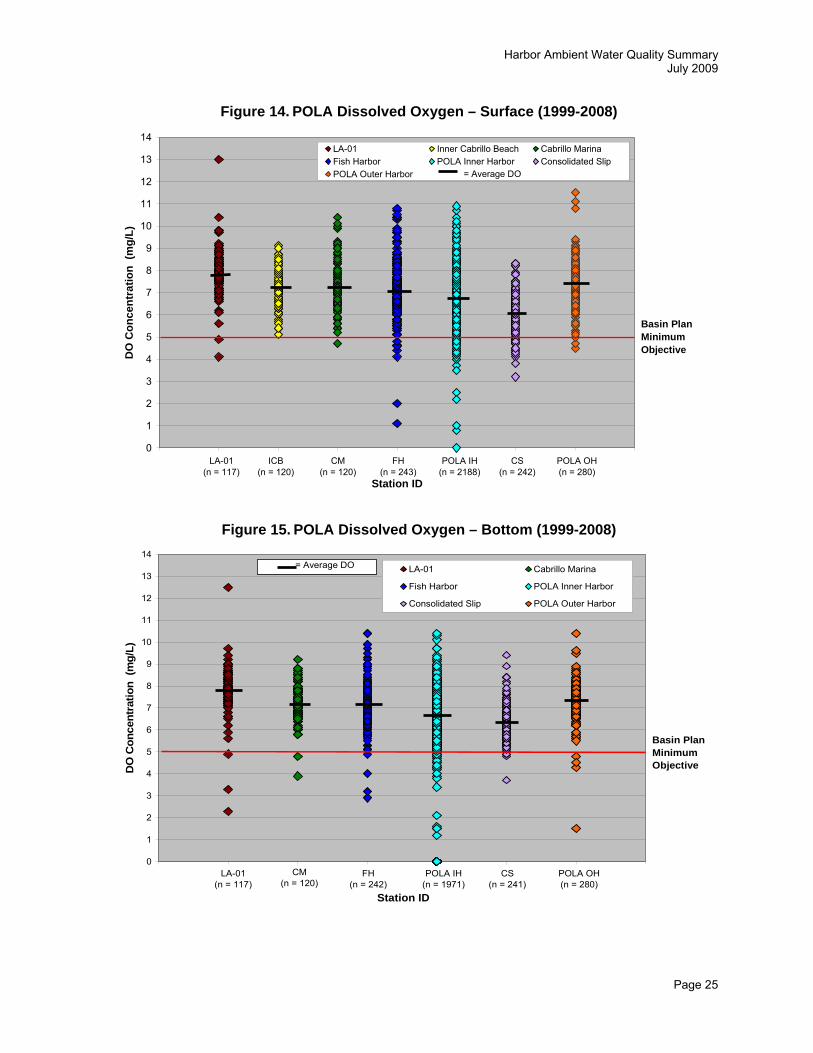
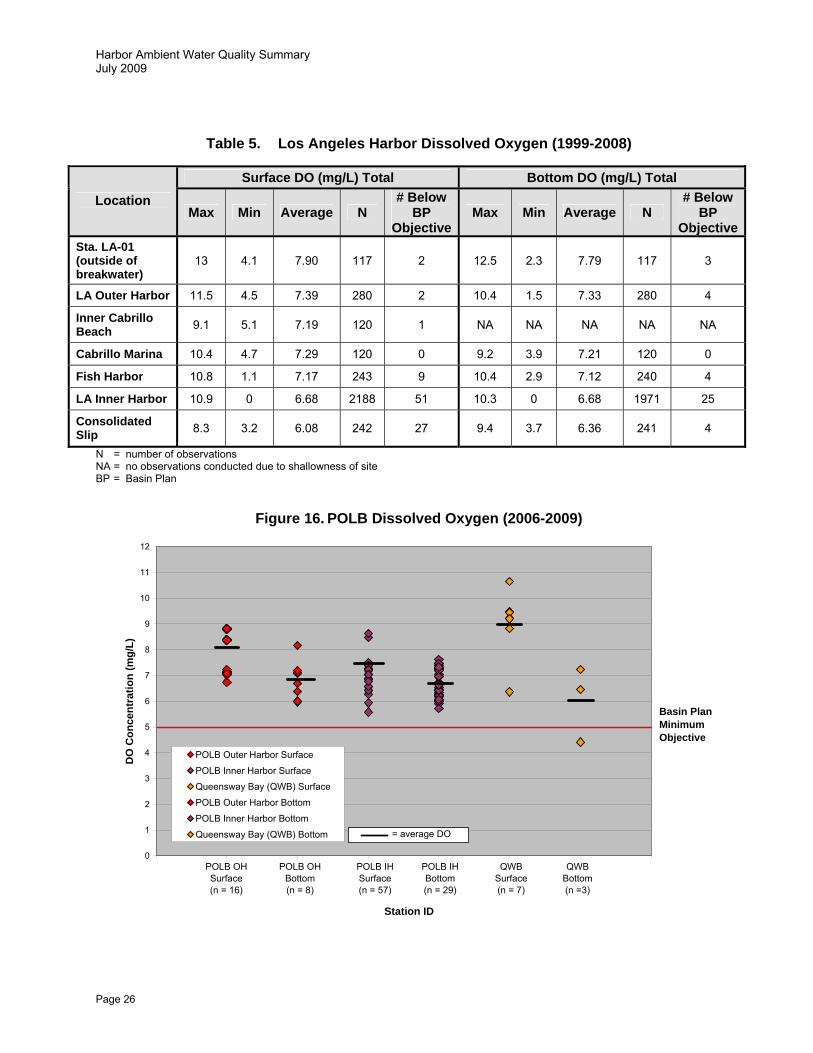
For the past several decades, DO levels measured in POLA waters have generally met or exceeded the 5 mg/L standard. Over the past decade, the average DO from individual sample grabs has remained in the 6-8 mg/L range (Table 5). There were times when the DO concentration dropped below 5 mg/L. The number of samples below the Basin Plan Objective (5.0 mg/L) relative to the total number of samples collected is listed in Table 5. Surface and bottom DO levels are depicted graphically in Figures 14 and 15.
In the POLB, while there is no long-term historical record of ambient water quality characteristics, several recent harbor-wide water quality monitoring events starting in October 2006 found dissolved oxygen concentrations to be above the 5-6 mg/L standard at all stations (Figure 16). As in the POLA, average DO concentrations in the POLB were in the 6-8 mg/L range. The only monitoring location to drop below 5.0 mg/L was in Queensway Bay, at the mouth of the Los Angeles River.
In summary, recent monitoring events in the harbors show that dissolved oxygen is generally found at concentrations that meet the Los Angeles Basin Plan water quality objectives to support a variety of biological communities.
Harbor Ambient Water Quality Summary July 2009
This page intentionally left blank.
Page 20
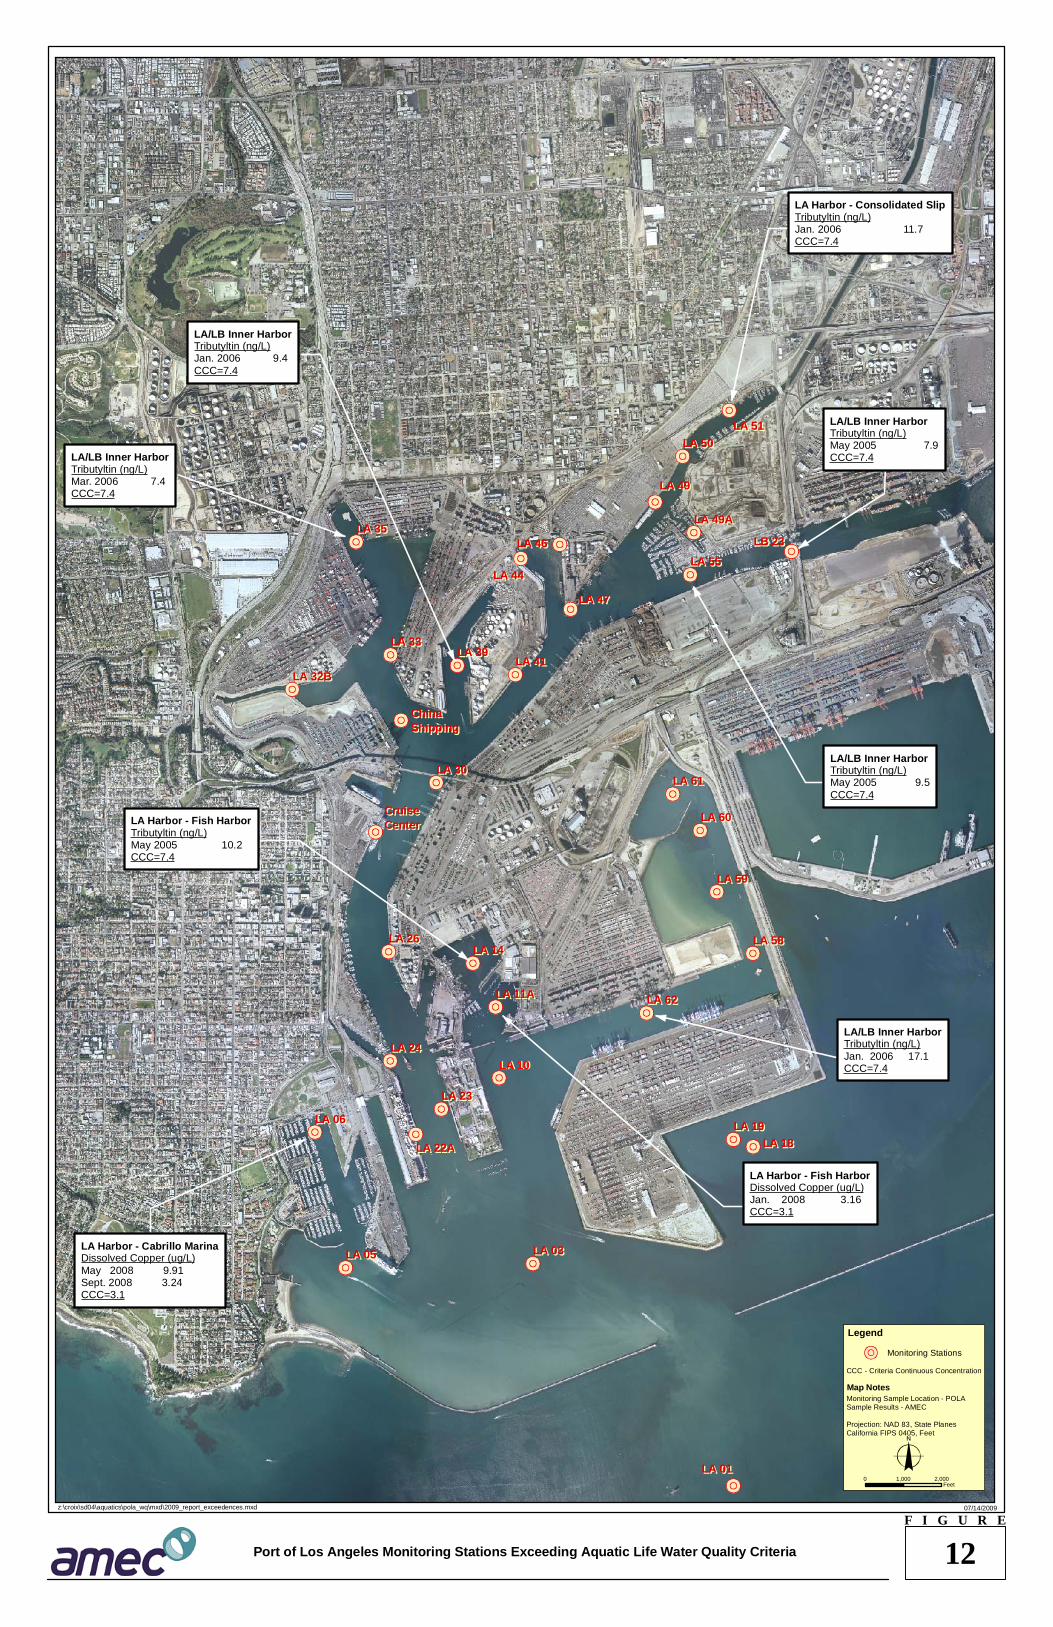
Port of Los Angeles Monitoring Stations Exceeding Aquatic Life Water Quality Criteria
z:\croix\sd04\aquatics\pola_wq\mxd\2009_report_exceedences.mxd 07/14/2009
F I G U R E
12
ChinaChinaShippingShipping
Cruise Cruise CenterCenterLA Harbor - Fish Harbor
Tributyltin (ng/L)May 2005 10.2CCC=7.4
LA Harbor - Cabrillo MarinaDissolved Copper (ug/L)May 2008 9.91Sept. 2008 3.24CCC=3.1
LA/LB Inner HarborTributyltin (ng/L)Jan. 2006 17.1CCC=7.4
LA/LB Inner HarborTributyltin (ng/L)Jan. 2006 9.4CCC=7.4
LA/LB Inner HarborTributyltin (ng/L)Mar. 2006 7.4CCC=7.4
LA/LB Inner HarborTributyltin (ng/L)May 2005 9.5CCC=7.4
LA Harbor - Consolidated SlipTributyltin (ng/L)Jan. 2006 11.7CCC=7.4
LA Harbor - Fish HarborDissolved Copper (ug/L)Jan. 2008 3.16CCC=3.1
LA/LB Inner HarborTributyltin (ng/L)May 2005 7.9CCC=7.4
LA 01LA 01
LA 03LA 03LA 05LA 05
LA 06LA 06
LA 11ALA 11A
LA 14LA 14
LA 19LA 19LA 18LA 18LA 22ALA 22A
LA 23LA 23
LA 24LA 24
LA 26LA 26
LA 30LA 30
LA 32BLA 32B
LA 33LA 33
LA 35LA 35
LA 39LA 39LA 41LA 41
LA 44LA 44
LA 46LA 46
LA 47LA 47
LA 49LA 49
LA 49ALA 49A
LA 50LA 50LA 51LA 51
LA 55LA 55
LA 58LA 58
LA 59LA 59
LA 60LA 60
LA 62LA 62
LB 23LB 23
LA 61LA 61
LA 10LA 10
CCC - Criteria Continuous Concentration
Legend
Monitoring Stations
Map NotesMonitoring Sample Location - POLASample Results - AMEC
Projection: NAD 83, State Planes California FIPS 0405, Feet
0 2,0001,000Feet
!R!R
!R
!R
!R
!R
!R
!R
!R
!R
!R
!R
!R
!R
!R
!R
!R
!R
!R
!R
!R
!R
!R
!R
!R
#*
#*
#*
#*
#*
#*
#*
#*
#*
#*
LA/LB Inner HarborDissolved Copper (ug/L)Nov. 2008 3.38CCC=3.1
LA/LB Inner HarborDissolved Copper (ug/L)Nov. 2008 3.71CCC=3.1
LA/LB Inner HarborDissolved Copper (ug/L)May 2006 9.13CCC=3.1
LA 19LA 19
LA 18LA 18
LA 49LA 49
LA 49ALA 49A
LA 50LA 50
LA 51LA 51
LA 55LA 55
LA 58LA 58
LA 59LA 59
LA 60LA 60
LA 62LA 62
LB 23LB 23
LA 61LA 61
LBI-3LBI-3
LBI-4LBI-4
LBI-5LBI-5
LBI-6LBI-6
LBI-7LBI-7
LBI-8LBI-8LBI-9LBI-9
LBI-10LBI-10
LBM-1LBM-1
LBM-2LBM-2
LBM-3LBM-3
LBM-5LBM-5
LBM-7LBM-7
LBM-9LBM-9
LBM-10LBM-10
LBO-1LBO-1
LBO-2LBO-2
LBO-7LBO-7
LBO-9LBO-9LBO-10LBO-10
LB-1LB-1
LB-2LB-2
LB-3LB-3
LB-4LB-4
LB-5LB-5
LB-6LB-6
LB-7LB-7
LB-8LB-8
LB-9LB-9
LB-10LB-10
Port of Long Beach Monitoring Stations Exceeding Aquatic Life Water Quality Criteria
z:\croix\sd04\aquatics\pola_wq\mxd\2009_report_polb.mxd 04/29/2009
F I G U R E
13
Map Notes
Legend!R Monitoring Stations (2006)
Monitoring Stations (2008-2009)#*
o0 2,0001,000
Feet
Monitoring Sample Location - POLBSample Results - AMEC and Western Solutions
Projection: NAD 83, State Planes CaliforniaFIPS 0405, Feet
CCC - Criteria Continuous ConcentrationAB411 - Single Sample Standard
Harbor Ambient Water Quality Summary July 2009
Page 25
Figure 14. POLA Dissolved Oxygen – Surface (1999-2008)
0
1
2
3
4
5
6
7
8
9
10
11
12
13
14
Station ID
DO
Con
cent
ratio
n (m
g/L)
LA-01 Inner Cabrillo Beach Cabrillo MarinaFish Harbor POLA Inner Harbor Consolidated SlipPOLA Outer Harbor
LA-01(n = 117)
ICB(n = 120)
CM(n = 120)
FH(n = 243)
POLA IH(n = 2188)
CS(n = 242)
POLA OH(n = 280)
Basin PlanMinimumObjective
= Average DO
Figure 15. POLA Dissolved Oxygen – Bottom (1999-2008)
0
1
2
3
4
5
6
7
8
9
10
11
12
13
14
Station ID
DO
Con
cent
ratio
n (m
g/L)
LA-01 Cabrillo Marina
Fish Harbor POLA Inner Harbor
Consolidated Slip POLA Outer Harbor
LA-01(n = 117)
CM(n = 120)
FH(n = 242)
POLA IH(n = 1971)
CS(n = 241)
POLA OH(n = 280)
Basin Plan MinimumObjective
= Average DO
Harbor Ambient Water Quality Summary July 2009
Table 5. Los Angeles Harbor Dissolved Oxygen (1999-2008)
Surface DO (mg/L) Total Bottom DO (mg/L) Total Location
Max Min Average N # Below
BP Objective
Max Min Average N # Below
BP Objective
Sta. LA-01 (outside of breakwater)
13 4.1 7.90 117 2 12.5 2.3 7.79 117 3
LA Outer Harbor 11.5 4.5 7.39 280 2 10.4 1.5 7.33 280 4
Inner Cabrillo Beach 9.1 5.1 7.19 120 1 NA NA NA NA NA
Cabrillo Marina 10.4 4.7 7.29 120 0 9.2 3.9 7.21 120 0
Fish Harbor 10.8 1.1 7.17 243 9 10.4 2.9 7.12 240 4
LA Inner Harbor 10.9 0 6.68 2188 51 10.3 0 6.68 1971 25
Consolidated Slip 8.3 3.2 6.08 242 27 9.4 3.7 6.36 241 4
N = number of observations NA = no observations conducted due to shallowness of site BP = Basin Plan
Figure 16. POLB Dissolved Oxygen (2006-2009)
0
1
2
3
4
5
6
7
8
9
10
11
12
Station ID
DO
Con
cent
ratio
n (m
g/L)
POLB Outer Harbor Surface
POLB Inner Harbor Surface
Queensway Bay (QWB) Surface
POLB Outer Harbor Bottom
POLB Inner Harbor Bottom
Queensway Bay (QWB) Bottom
POLB OHSurface(n = 16)
POLB IHSurface(n = 57)
QWBSurface(n = 7)
Basin PlanMinimumObjective
POLB OHBottom(n = 8)
POLB IHBottom(n = 29)
QWBBottom(n =3)
= average DO
Page 26
Harbor Ambient Water Quality Summary July 2009
Page 27
3.5 Bacteria Levels in Harbor Waters Bacteria tests are conducted on ambient water samples in order to identify total and fecal coliform bacteria and enterococcus levels. The concentration of these indicator bacteria determines whether a water body is safe for human contact, or should be avoided. People who swim in waters with elevated bacteria levels are more likely to contract acute infectious illnesses like gastroenteritis, upper respiratory infections, sore throats and fevers. In addition to impacting humans, high levels of bacteria in harbor waters may be an indicator of potential problems upstream (such as the illicit discharge of wastes, stormwater runoff, etc.) that need to be identified and controlled.
The California Department of Health Services has developed minimum protective bacteriological standards for the waters adjacent to public beaches and water-contact sports areas. Assembly Bill 411 (AB 411) states that the following limits should not be exceeded for bacterial indicators: 10,000 MPN/100 mL for total coliform, 400 MPN/100 mL for fecal coliform, and 104 MPN/100 mL for enterococcus.
This section discusses the results of bacteria testing conducted in the POLA, much of which has been associated with the bacteria TMDL. In addition to the sampling conducted as part of a special study for the TMDL, bacteria tests were conducted concurrent with each of the seven enhanced monthly port-wide water quality sampling events. An additional special study was performed in the East Basin/Consolidated Slip area in conjunction with a sailing center siting study. Collection events occurred during dry and wet seasons, as well as immediately following storm events.
The POLB does not have a bacteria TMDL, as the harbor is designated for “non-contact water recreation” only. As a result, POLB has not conducted bacteria testing.
3.5.1 Port of Los Angeles Enhanced Water Quality Study (2006-2008)
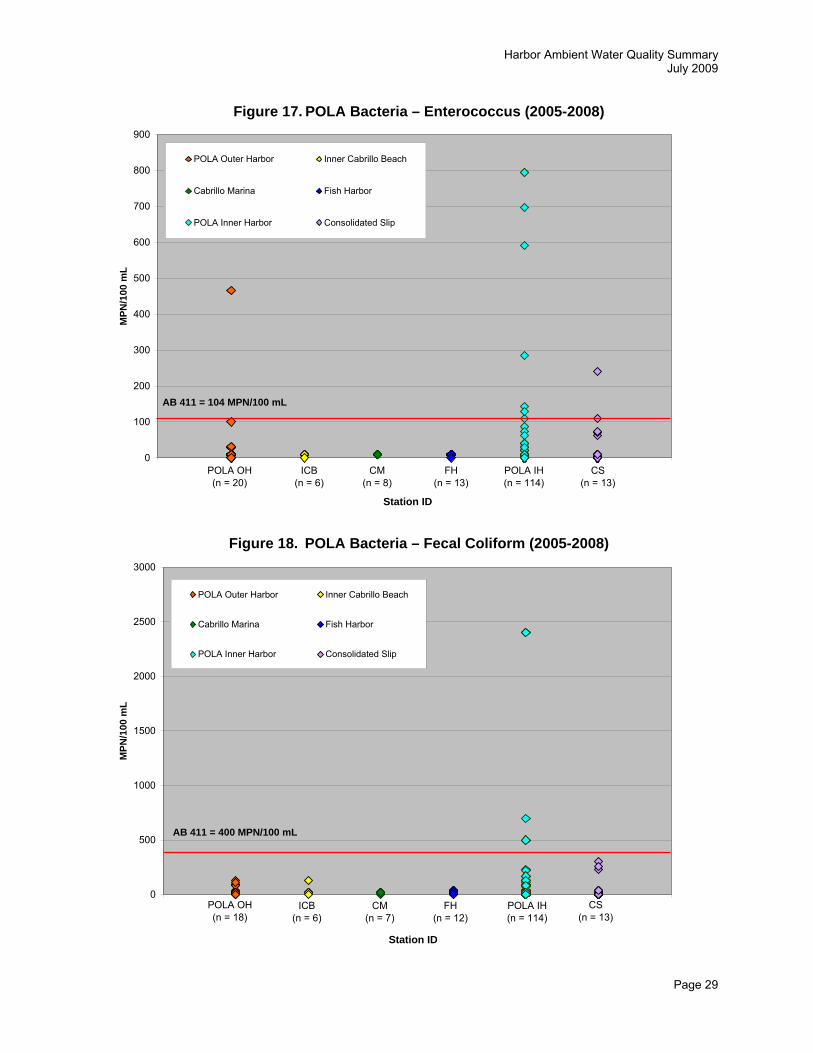
The seven POLA-wide sampling events consisted of four dry events and three wet events (wet events had measurable rain within 2 weeks prior to the collection). The vast majority of the samples collected during the four dry weather events had non-detectable levels of indicator bacteria. Only one dry weather sample exceeded AB 411 criteria: Outer Harbor Station LA18 with an enterococcus level of 465 MPN/100 mL, as shown in Figure 17.
As expected, the majority of the AB 411 exceedances were observed following storm events. The magnitude of the storm, and the time lag between the storm event and the actual sample collection, correlated directly to the observed concentrations of indicator bacteria. The wet event samples in May 2005 and January 2006 found more instances of detectable bacteria than did dry events, but only minimal exceedances of AB 411 criteria.
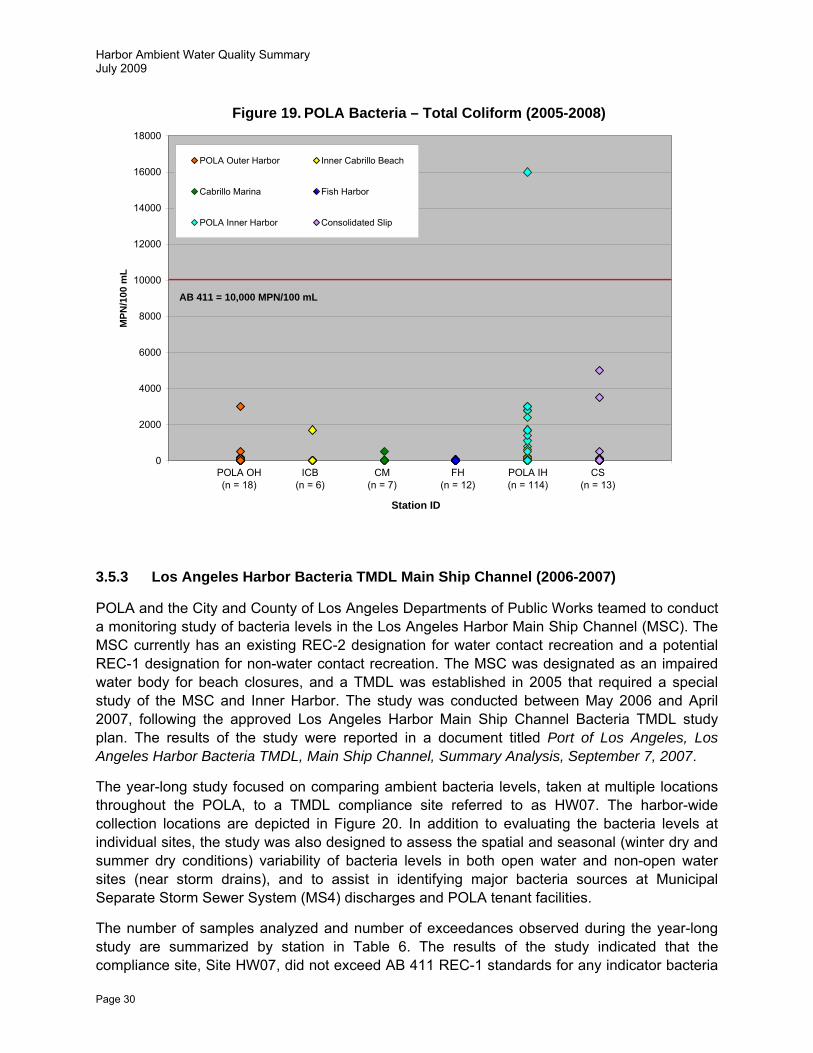
The March 2006 collection event took place immediately (within 48 hours) following a 1.58-inch rainfall. That study identified eight locations in the Inner Harbor and two in Consolidated Slip with enterococcus concentrations (ranging from 109 to 795 MPN/100 mL) that exceeded the AB 411 criteria level of 104 MPN/100 mL (Figure 17). Five Inner Harbor stations (ranging from 500 to 2,400 MPN/100 mL) exceeded the fecal coliform AB 411 criterion (400 MPN/100 mL, Figure 18). One station (at 16,000 MPN/100 mL) exceeded the total coliform bacteria criterion (10,000 MPN/ 100 mL, Figure 19). Bacteria exceedances following this wet event were limited to the Inner Harbor and Consolidated Slip areas only, particularly within the East Channel, Slip 1
Harbor Ambient Water Quality Summary July 2009
and Slip 5. There was one enterococcus exceedance (465 MPN/100 ML) in the Outer Harbor, at LA 18, which resides at the opening of the Terminal Island Treatment Plant.
3.5.2 Port of Los Angeles Marina Temporal Bacteria Study (2006)
In March/April 2006, POLA conducted a focused study of bacteria concentrations in the East Basin and Consolidated Slip areas of the Inner Harbor. This location was being investigated as a potential site for a recreational sailing school for Wilmington residents. Daily samples were collected for five days immediately following a wet weather event characterized by a minimum accumulation of at least 0.25 inch of rain.
Bacteria concentrations were compared to AB 411 criteria for water contact. There were three exceedances in the initial sampling when the event began 28 March 2006. Twenty-four hours later, all stations recorded concentrations of the three indicator bacteria well above regulatory standards. On the third day of the study, 48 hours after the start of the rain event, 15 of the 21 stations (over 70 percent) exceeded regulatory standards. The concentrations of bacteria had decreased, but were still above regulatory standards at the majority of the stations. By 72 hours, the enterococci concentrations were all below regulatory standards; however, almost all stations still exceeded the fecal and total coliform standards. By hour 96, enterococci were non-detectable, total coliform bacteria were below regulatory criteria concentrations at all stations, and fecal coliform bacteria had dropped below AB 411 standards at all but two stations.
Page 28
Harbor Ambient Water Quality Summary July 2009
Page 29
Figure 17. POLA Bacteria – Enterococcus (2005-2008)
0
100
200
300
400
500
600
700
800
900
Station ID
MPN
/100
mL
POLA Outer Harbor Inner Cabrillo Beach
Cabrillo Marina Fish Harbor
POLA Inner Harbor Consolidated Slip
AB 411 = 104 MPN/100 mL
POLA OH(n = 20)
ICB (n = 6)
CM(n = 8)
FH(n = 13)
POLA IH(n = 114)
CS(n = 13)
Figure 18. POLA Bacteria – Fecal Coliform (2005-2008)
0
500
1000
1500
2000
2500
3000
Station ID
MPN
/100
mL
POLA Outer Harbor Inner Cabrillo Beach
Cabrillo Marina Fish Harbor
POLA Inner Harbor Consolidated Slip
AB 411 = 400 MPN/100 mL
POLA OH(n = 18)
ICB (n = 6)
CM(n = 7)
FH(n = 12)
POLA IH(n = 114)
CS(n = 13)
Harbor Ambient Water Quality Summary July 2009
Figure 19. POLA Bacteria – Total Coliform (2005-2008)
0
2000
4000
6000
8000
10000
12000
14000
16000
18000
Station ID
MPN
/100
mL
POLA Outer Harbor Inner Cabrillo Beach
Cabrillo Marina Fish Harbor
POLA Inner Harbor Consolidated Slip
AB 411 = 10,000 MPN/100 mL
POLA OH(n = 18)
ICB (n = 6)
CM(n = 7)
FH(n = 12)
POLA IH(n = 114)
CS(n = 13)
3.5.3 Los Angeles Harbor Bacteria TMDL Main Ship Channel (2006-2007)
POLA and the City and County of Los Angeles Departments of Public Works teamed to conduct a monitoring study of bacteria levels in the Los Angeles Harbor Main Ship Channel (MSC). The MSC currently has an existing REC-2 designation for water contact recreation and a potential REC-1 designation for non-water contact recreation. The MSC was designated as an impaired water body for beach closures, and a TMDL was established in 2005 that required a special study of the MSC and Inner Harbor. The study was conducted between May 2006 and April 2007, following the approved Los Angeles Harbor Main Ship Channel Bacteria TMDL study plan. The results of the study were reported in a document titled Port of Los Angeles, Los Angeles Harbor Bacteria TMDL, Main Ship Channel, Summary Analysis, September 7, 2007.
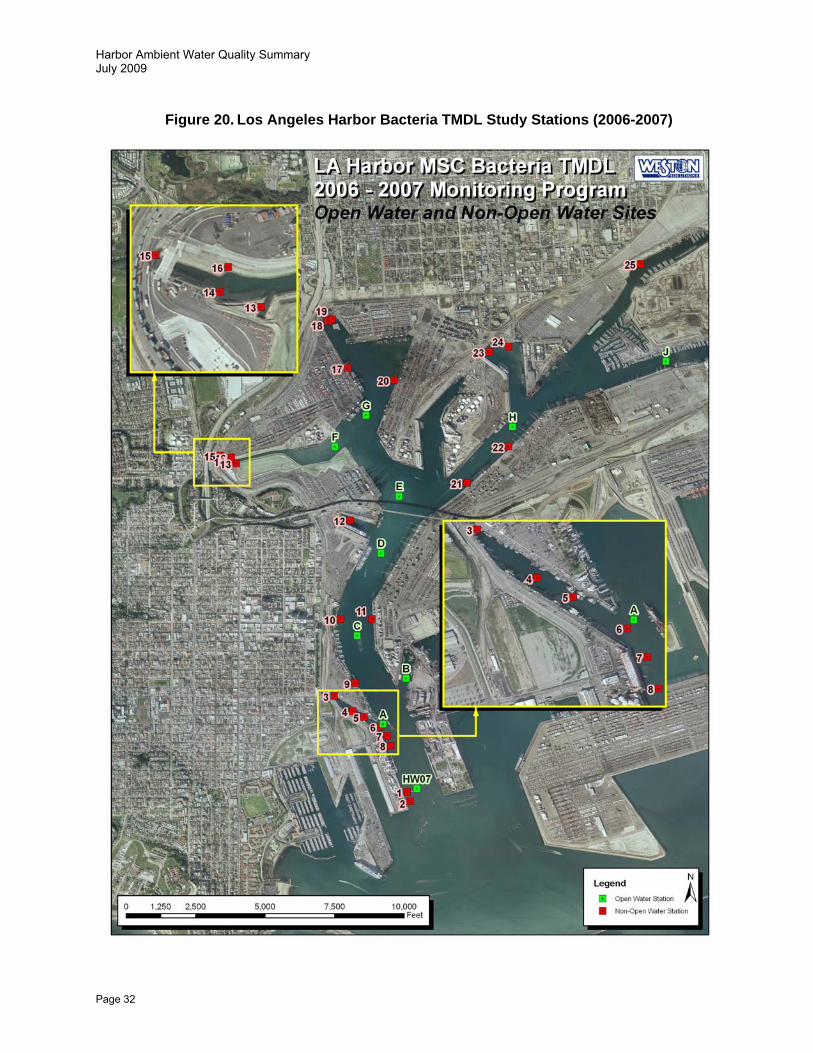
The year-long study focused on comparing ambient bacteria levels, taken at multiple locations throughout the POLA, to a TMDL compliance site referred to as HW07. The harbor-wide collection locations are depicted in Figure 20. In addition to evaluating the bacteria levels at individual sites, the study was also designed to assess the spatial and seasonal (winter dry and summer dry conditions) variability of bacteria levels in both open water and non-open water sites (near storm drains), and to assist in identifying major bacteria sources at Municipal Separate Storm Sewer System (MS4) discharges and POLA tenant facilities.
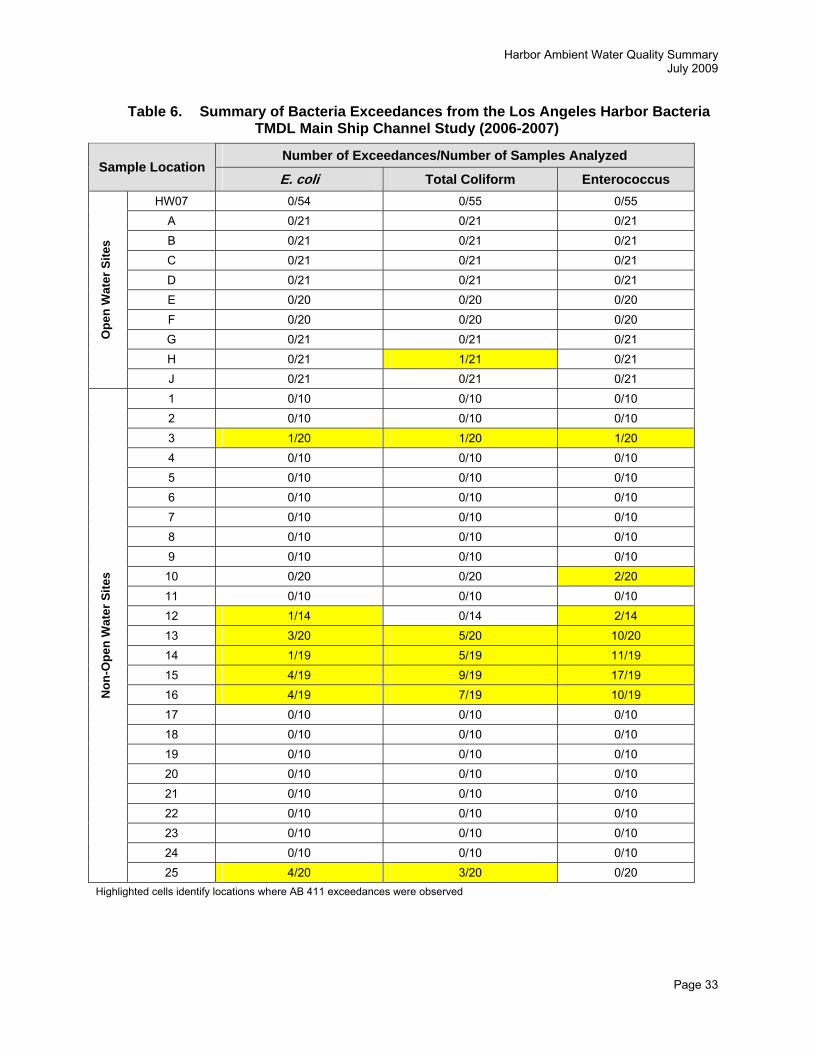
The number of samples analyzed and number of exceedances observed during the year-long study are summarized by station in Table 6. The results of the study indicated that the compliance site, Site HW07, did not exceed AB 411 REC-1 standards for any indicator bacteria
Page 30
Harbor Ambient Water Quality Summary July 2009
Page 31
during the monitoring period. These results meet the summer dry and winter dry TMDL requirements for this site. All other open water sites (Sites A through H and J) had no exceedance of standards for any indicator bacteria, with the exception of one site (Site H), which exceeded the Total Coliform AB 411 single sample standard one time.
Non-open water site (Sites 1 through 25) results showed that there were four localized areas that required further study: Southwest Slip (Sites 13, 14, 15, and 16), Consolidated Slip (Site 25), the Cruise Terminal (Site 12), and the Maritime Museum (Site 10). Of the 25 non-open water sites monitored in the study, seven sites had bacterial indicator standard exceedance frequencies greater than 10 percent. Of those seven sites, Sites 13, 15 and 16 had exceedance frequencies greater than 10 percent for Total Coliform, Enterococcus and E. coli. In addition, Sites 10 and 12 had frequencies of exceedance greater than 10 percent for Enterococcus, whereas Site 14 had a frequency of exceedance for both Total Coliform and Enterococcus. The only site that was found to be in exceedance for only Total Coliform and E. coli was Site 25.
Based on the study results, the report concluded that the TMDL compliance site. Site HW07, met the TMDL summer dry and winter dry requirements for the May 2006 to April 2007 time period. The nine other open water sites analyzed were also free of exceedances (with the exception of one station, Station H, at one sampling event). However, there were localized areas within the Los Angeles Harbor that displayed AB 411 exceedances, including the area located near the storm drains in Southwest Slip (Sites 13-16), the area located near the storm drain at Maritime Museum (Site 10), the storm drain near the Cruise Terminal (Site 12), and Consolidated Slip (Site 25).
Based upon this study, a TMDL implementation plan was developed by POLA and its study partners, and approved by the RWQCB. The implementation plan involves conducting bacteria monitoring at three stations; the MSC compliance point HW-07, as well as Site 10 (the Maritime Museum) and Site 12 (the Cruise Ship Terminal). Monitoring is ongoing.
3.6 Bacteria Summary In summary, AB 411 indicator bacteria levels in the POLA are typically low during dry-weather conditions and elevated immediately following storm events. The Inner Harbor is more susceptible to elevated bacteria levels compared to the Outer Harbor, indicating that the Dominguez Channel and other storm drains in the vicinity are the primary source of the observed bacteria.
Harbor Ambient Water Quality Summary July 2009
Figure 20. Los Angeles Harbor Bacteria TMDL Study Stations (2006-2007)
Page 32
Harbor Ambient Water Quality Summary July 2009
Page 33
Table 6. Summary of Bacteria Exceedances from the Los Angeles Harbor Bacteria TMDL Main Ship Channel Study (2006-2007)
Number of Exceedances/Number of Samples Analyzed Sample Location
E. coli Total Coliform Enterococcus HW07 0/54 0/55 0/55
A 0/21 0/21 0/21 B 0/21 0/21 0/21 C 0/21 0/21 0/21 D 0/21 0/21 0/21 E 0/20 0/20 0/20 F 0/20 0/20 0/20 G 0/21 0/21 0/21 H 0/21 1/21 0/21
Ope
n W
ater
Site
s
J 0/21 0/21 0/21 1 0/10 0/10 0/10 2 0/10 0/10 0/10 3 1/20 1/20 1/20 4 0/10 0/10 0/10 5 0/10 0/10 0/10 6 0/10 0/10 0/10 7 0/10 0/10 0/10 8 0/10 0/10 0/10 9 0/10 0/10 0/10 10 0/20 0/20 2/20 11 0/10 0/10 0/10 12 1/14 0/14 2/14 13 3/20 5/20 10/20 14 1/19 5/19 11/19 15 4/19 9/19 17/19 16 4/19 7/19 10/19 17 0/10 0/10 0/10 18 0/10 0/10 0/10 19 0/10 0/10 0/10 20 0/10 0/10 0/10 21 0/10 0/10 0/10 22 0/10 0/10 0/10 23 0/10 0/10 0/10 24 0/10 0/10 0/10
Non
-Ope
n W
ater
Site
s
25 4/20 3/20 0/20 Highlighted cells identify locations where AB 411 exceedances were observed