Embed Size (px)
Citation preview
Port of Los Angeles Clean Truck Program Presentation to the Los Angeles Board of Harbor Commissioners
March 6th, 2008
1BCG presentation to LA Harbor Commission 06Mar08 - Final.ppt
Context and objectives for this meeting
This document was presented by members of The Boston Consulting Group, Inc., to the Los Angeles Board of Harbor Commissioners on March 6, 2008 in Los Angeles, CA
During the presentation, the slides served as the focus for the discussion; they are incomplete without the accompanying oral commentary. This document will be most meaningful, therefore, to those who attended the meeting
BCG was retained by the Executive Director of the Harbor Department to conduct an analysis of and create a business case for the Clean Truck Program (CTP). This presentation summarizes the outcome of BCGs analysis. This presentation is an extract from a longer document containing all of BCGs findings and analysis.
The objectives of this meeting is to provide the Board of Harbor Commissioners with an opportunity to review the draft findings from the BCG analysis and
• Understand the approach used to evaluate the CTP• Review the CTP options considered
2BCG presentation to LA Harbor Commission 06Mar08 - Final.ppt
Truck drayage is a key element of the complex port goods movement system
Drayage
Rail
Manufactureror
Consolidator Term
inal
Ope
rato
r
Shipping Line
Beneficial Cargo Owner (BCO)
Term
inal
O
pera
tor
Dis
trib
utio
n C
ente
r
LMC
Flow of goods (imports)
Port of LA / LB
National / State / City governments
Flow of paymentsfreight
forwarder
Port imposed fees
Permitting
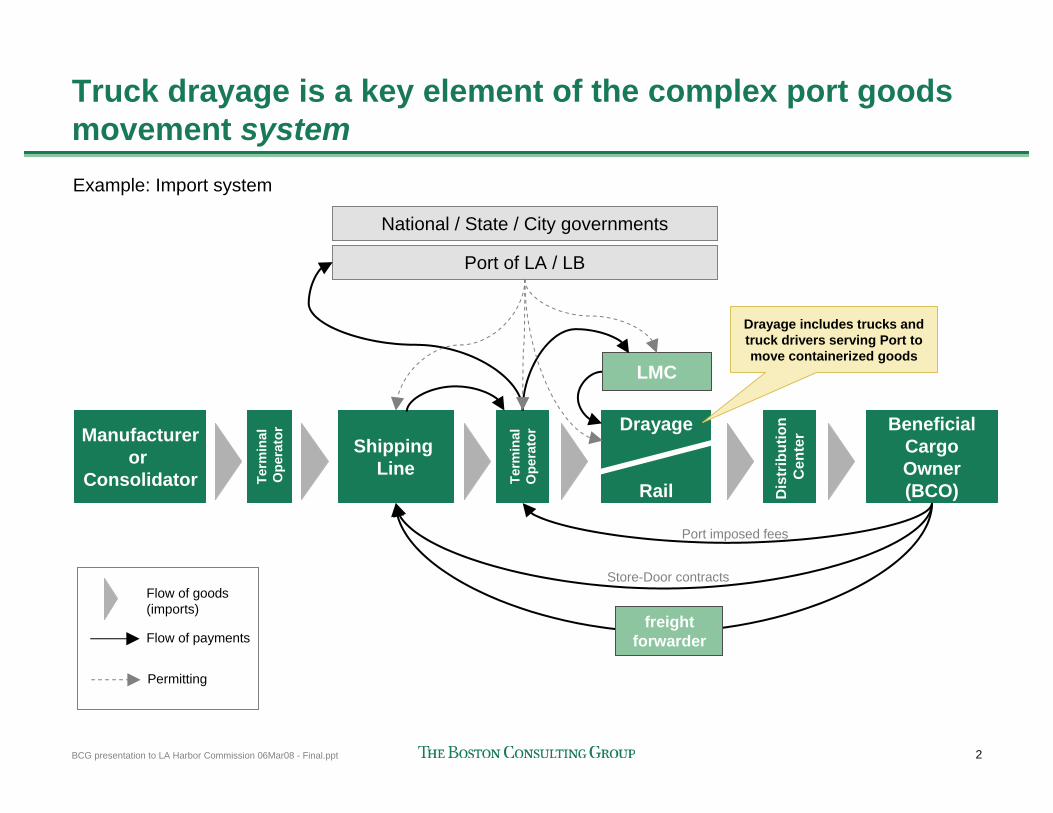
Example: Import system
Store-Door contracts
Drayage includes trucks and truck drivers serving Port to move containerized goods
3BCG presentation to LA Harbor Commission 06Mar08 - Final.ppt
Today: Current state of SPB drayage market
Pre-CTP
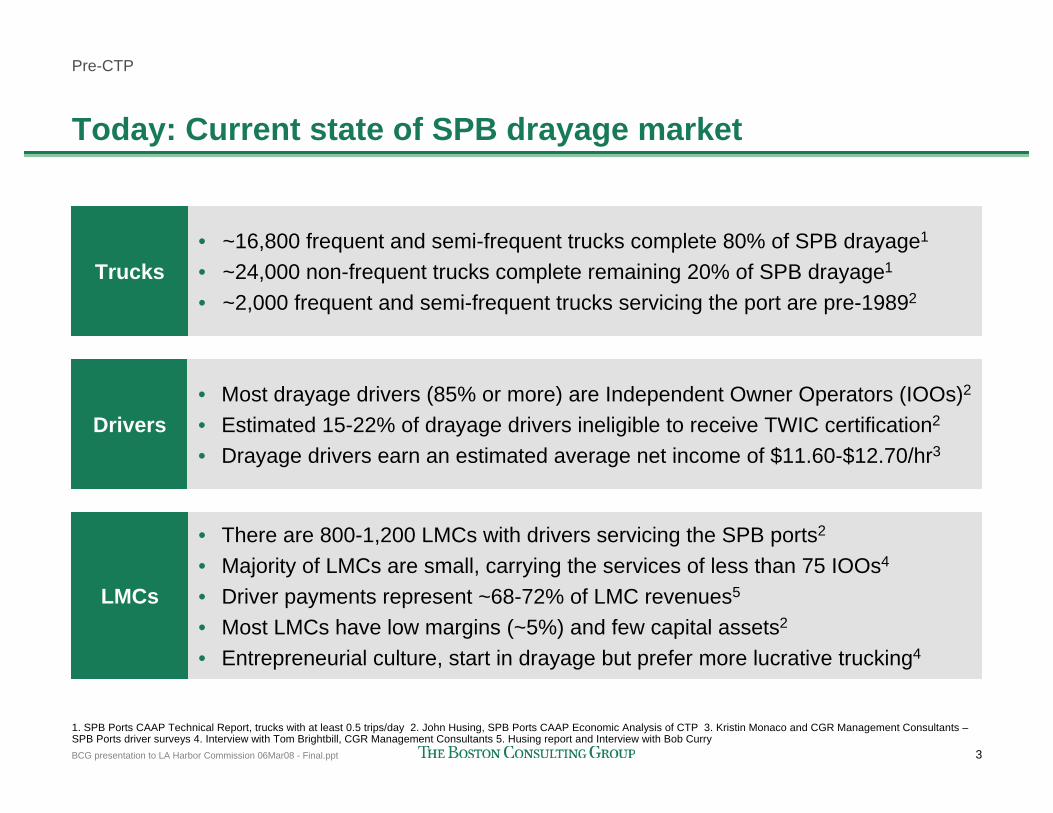
Trucks• ~16,800 frequent and semi-frequent trucks complete 80% of SPB drayage1
• ~24,000 non-frequent trucks complete remaining 20% of SPB drayage1
• ~2,000 frequent and semi-frequent trucks servicing the port are pre-19892
Drivers• Most drayage drivers (85% or more) are Independent Owner Operators (IOOs)2
• Estimated 15-22% of drayage drivers ineligible to receive TWIC certification2
• Drayage drivers earn an estimated average net income of $11.60-$12.70/hr3
LMCs
• There are 800-1,200 LMCs with drivers servicing the SPB ports2
• Majority of LMCs are small, carrying the services of less than 75 IOOs4
• Driver payments represent ~68-72% of LMC revenues5
• Most LMCs have low margins (~5%) and few capital assets2
• Entrepreneurial culture, start in drayage but prefer more lucrative trucking4
1. SPB Ports CAAP Technical Report, trucks with at least 0.5 trips/day 2. John Husing, SPB Ports CAAP Economic Analysis of CTP 3. Kristin Monaco and CGR Management Consultants –SPB Ports driver surveys 4. Interview with Tom Brightbill, CGR Management Consultants 5. Husing report and Interview with Bob Curry
4BCG presentation to LA Harbor Commission 06Mar08 - Final.ppt
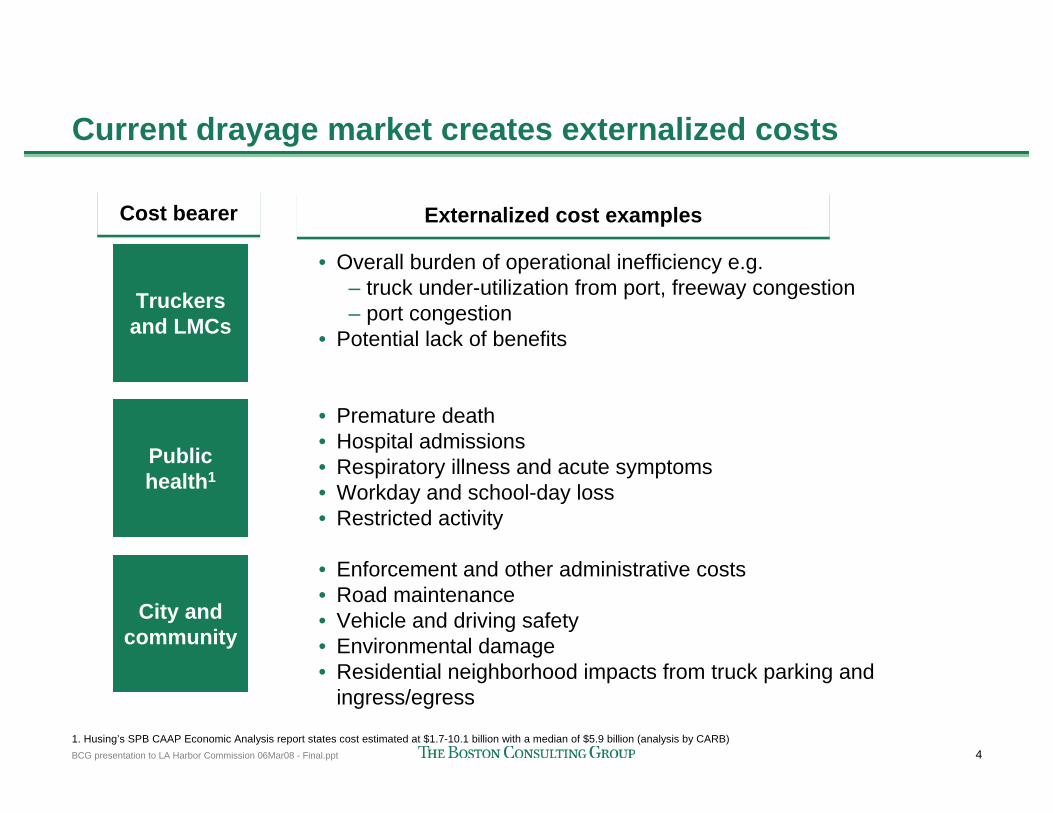
Current drayage market creates externalized costs
Externalized cost examplesExternalized cost examples
• Overall burden of operational inefficiency e.g.– truck under-utilization from port, freeway congestion– port congestion
• Potential lack of benefits
• Premature death• Hospital admissions• Respiratory illness and acute symptoms• Workday and school-day loss• Restricted activity
• Enforcement and other administrative costs• Road maintenance• Vehicle and driving safety• Environmental damage• Residential neighborhood impacts from truck parking and
ingress/egress
Truckers and LMCs
Publichealth1
City and community
Cost bearerCost bearer
1. Husing’s SPB CAAP Economic Analysis report states cost estimated at $1.7-10.1 billion with a median of $5.9 billion (analysis by CARB)
5BCG presentation to LA Harbor Commission 06Mar08 - Final.ppt
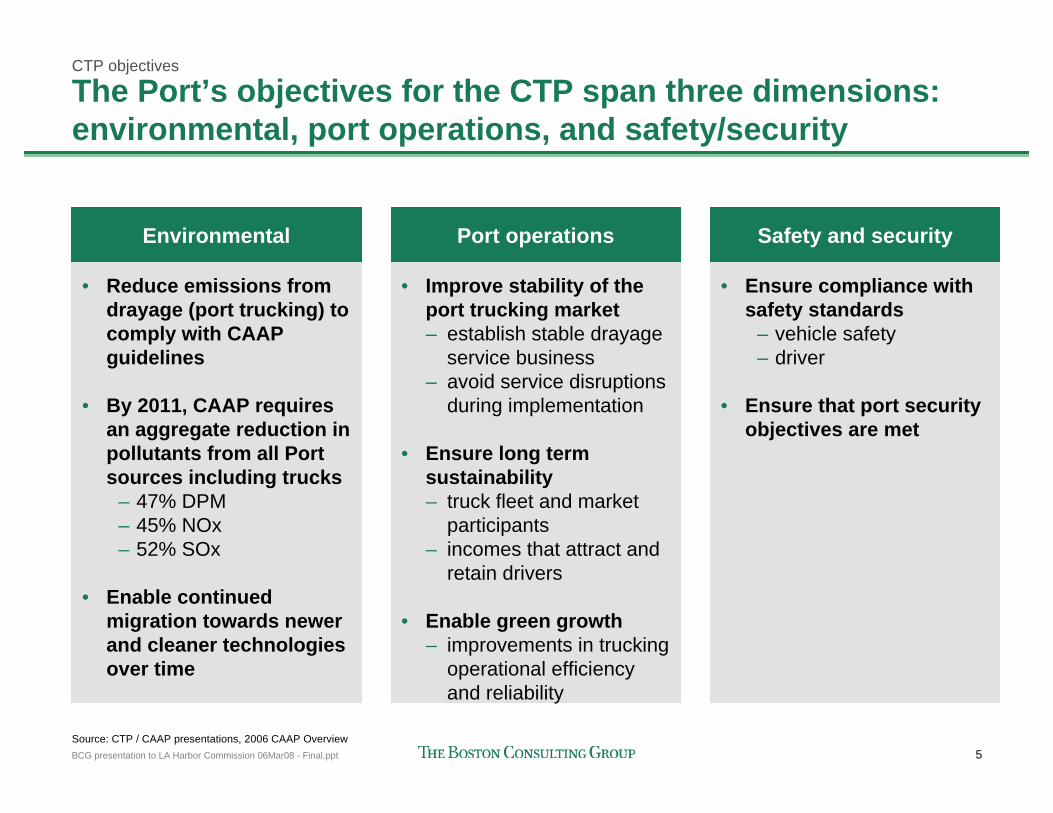
The Port’s objectives for the CTP span three dimensions: environmental, port operations, and safety/security
CTP objectives
Port operations
• Improve stability of the port trucking market– establish stable drayage
service business– avoid service disruptions
during implementation
• Ensure long term sustainability– truck fleet and market
participants– incomes that attract and
retain drivers
• Enable green growth– improvements in trucking
operational efficiency and reliability
Environmental
• Reduce emissions from drayage (port trucking) to comply with CAAP guidelines
• By 2011, CAAP requires an aggregate reduction in pollutants from all Port sources including trucks
– 47% DPM– 45% NOx– 52% SOx
• Enable continued migration towards newer and cleaner technologies over time
Safety and security
• Ensure compliance with safety standards
– vehicle safety– driver
• Ensure that port security objectives are met
Source: CTP / CAAP presentations, 2006 CAAP Overview
6BCG presentation to LA Harbor Commission 06Mar08 - Final.ppt
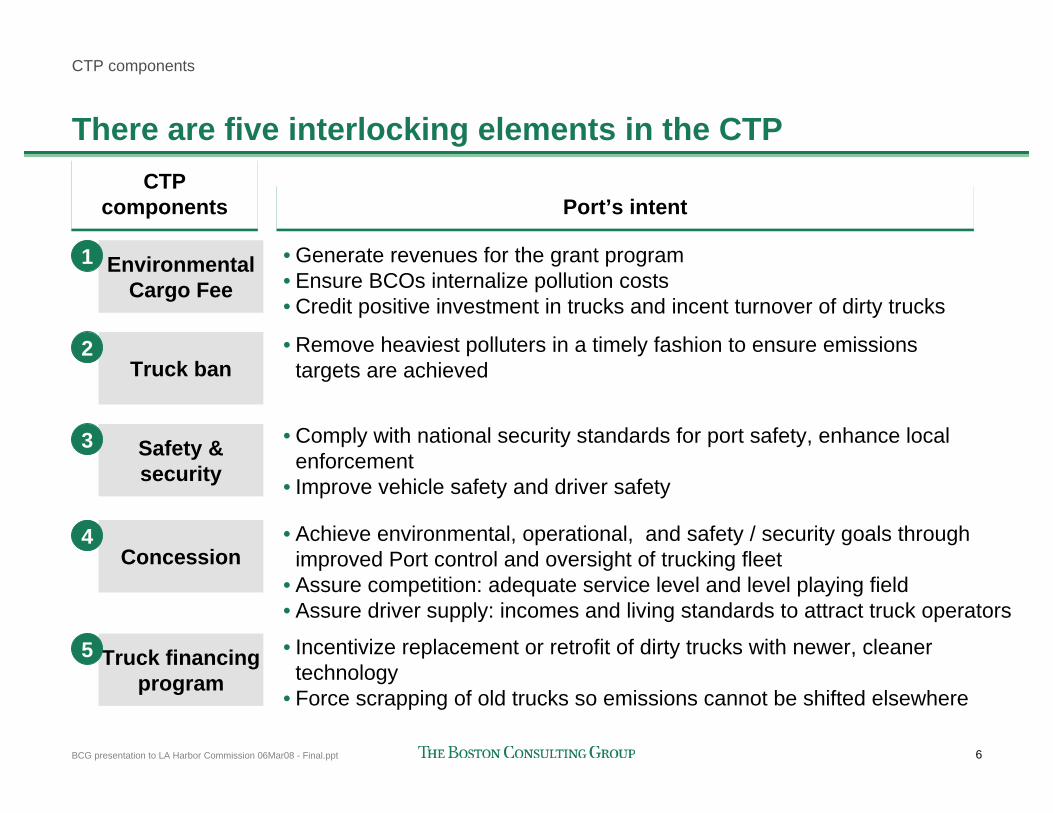
There are five interlocking elements in the CTP
Port’s intentPort’s intent
• Generate revenues for the grant program • Ensure BCOs internalize pollution costs • Credit positive investment in trucks and incent turnover of dirty trucks
• Remove heaviest polluters in a timely fashion to ensure emissions targets are achieved
• Comply with national security standards for port safety, enhance local enforcement
• Improve vehicle safety and driver safety
• Achieve environmental, operational, and safety / security goals through improved Port control and oversight of trucking fleet
• Assure competition: adequate service level and level playing field• Assure driver supply: incomes and living standards to attract truck operators
• Incentivize replacement or retrofit of dirty trucks with newer, cleaner technology
• Force scrapping of old trucks so emissions cannot be shifted elsewhere
CTP components
CTP components
CTP components
Environmental Cargo Fee
1
Truck ban 2
Safety & security
3
Concession4
Truck financing program
5
7BCG presentation to LA Harbor Commission 06Mar08 - Final.ppt
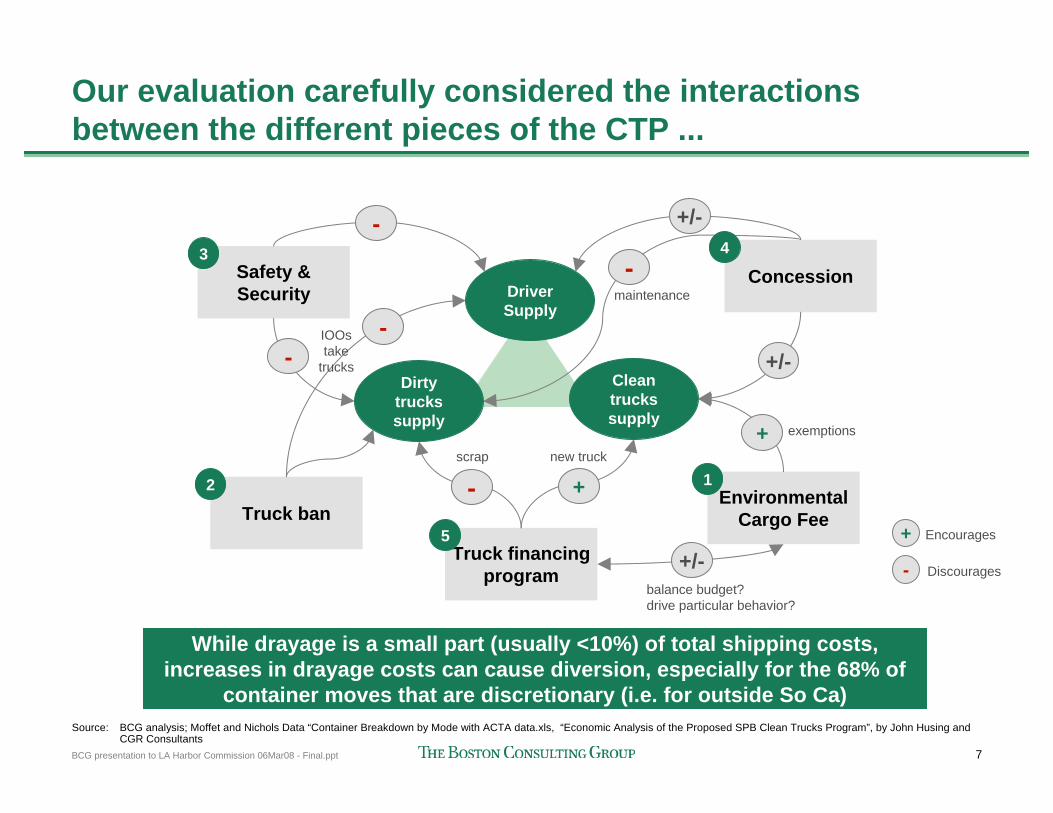
Our evaluation carefully considered the interactions between the different pieces of the CTP ...
Driver Supply
Clean trucks supply
Dirty trucks supply
While drayage is a small part (usually <10%) of total shipping costs, increases in drayage costs can cause diversion, especially for the 68% of
container moves that are discretionary (i.e. for outside So Ca)
Environmental Cargo Fee
1
Truck ban 2
Safety & Security
3Concession
4
Truck financing program
5+/-
+-
-
balance budget?drive particular behavior?
IOOstake
trucks +/-
+/--
+
-
-
exemptions
scrap new truck
maintenance
+
-
Encourages
Discourages
Source: BCG analysis; Moffet and Nichols Data “Container Breakdown by Mode with ACTA data.xls, “Economic Analysis of the Proposed SPB Clean Trucks Program”, by John Husing andCGR Consultants
8BCG presentation to LA Harbor Commission 06Mar08 - Final.ppt
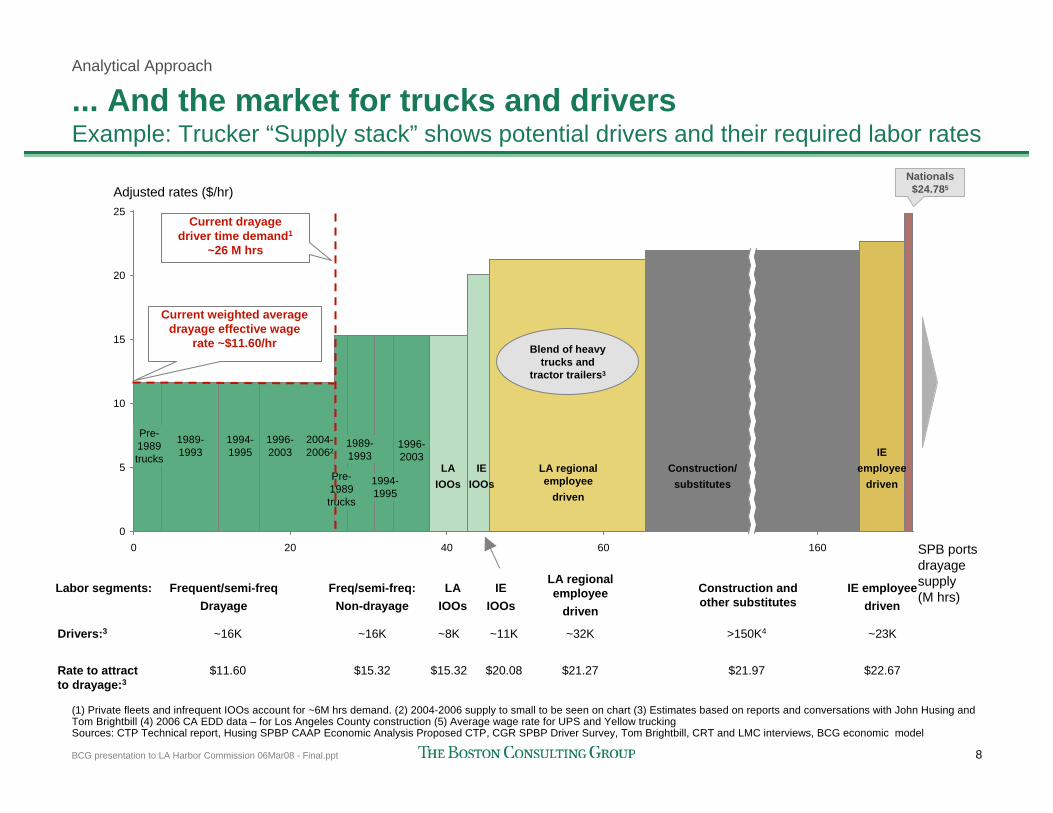
... And the market for trucks and driversExample: Trucker “Supply stack” shows potential drivers and their required labor rates
25
Adjusted rates ($/hr)
0 SPB portsdrayage supply(M hrs)
1606040
20
10
0
15
5
20
1989-1993
1994-1995
1996-2003
Pre-1989trucks
Pre-1989trucks
1989-1993
1994-1995
1996-2003
2004-20062
LA IOOs
IE IOOs
LA regional employee
driven
IE employee
driven
Nationals$24.785
Current drayage driver time demand1
~26 M hrs
Current weighted average drayage effective wage
rate ~$11.60/hr
Frequent/semi-freqDrayage
Freq/semi-freq:Non-drayage
Labor segments:LA regional employee
driven
IE employeedriven
IE IOOs
LA IOOs
~16KDrivers:3 ~16K ~11K ~32K ~23K~8K
$11.60Rate to attract to drayage:3
$15.32 $20.08 $21.27 $22.67$15.32
Construction and other substitutes
>150K4
$21.97
(1) Private fleets and infrequent IOOs account for ~6M hrs demand. (2) 2004-2006 supply to small to be seen on chart (3) Estimates based on reports and conversations with John Husing and Tom Brightbill (4) 2006 CA EDD data – for Los Angeles County construction (5) Average wage rate for UPS and Yellow truckingSources: CTP Technical report, Husing SPBP CAAP Economic Analysis Proposed CTP, CGR SPBP Driver Survey, Tom Brightbill, CRT and LMC interviews, BCG economic model
Analytical Approach
Construction/substitutes
Blend of heavy trucks and
tractor trailers3
9BCG presentation to LA Harbor Commission 06Mar08 - Final.ppt
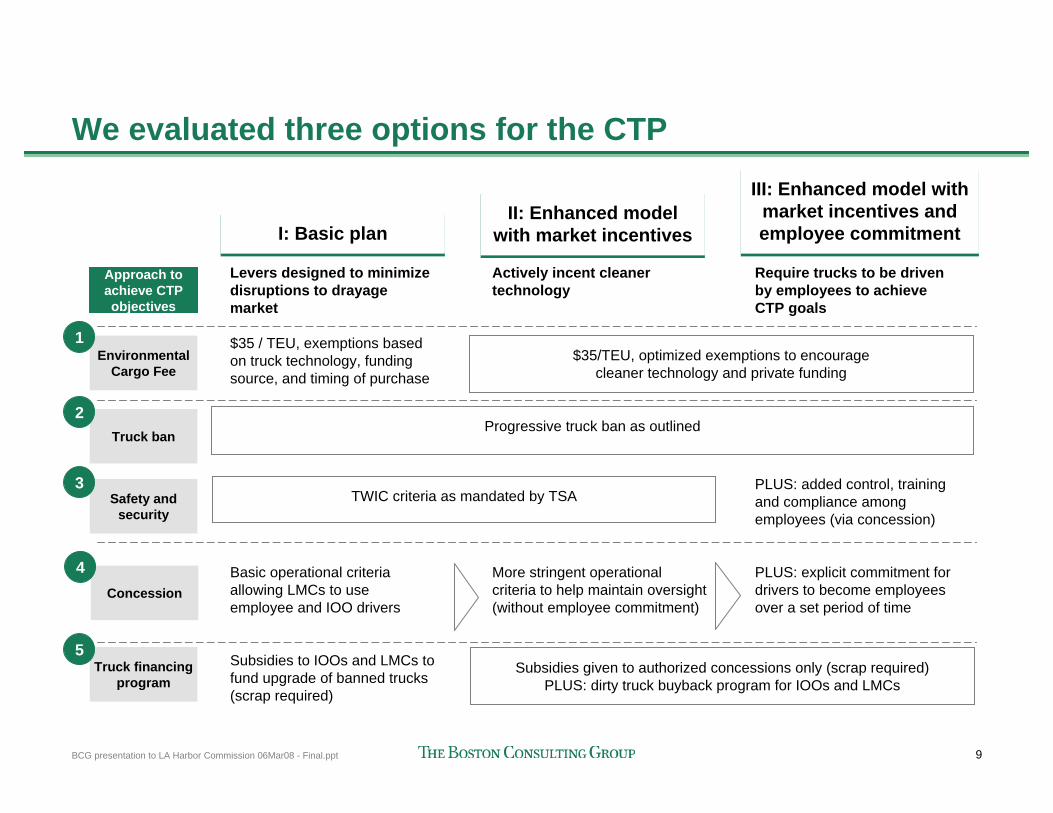
We evaluated three options for the CTP
I: Basic planI: Basic plan
Levers designed to minimize disruptions to drayage market
$35 / TEU, exemptions based on truck technology, funding source, and timing of purchase
Basic operational criteria allowing LMCs to use employee and IOO drivers
Subsidies to IOOs and LMCs to fund upgrade of banned trucks (scrap required)
III: Enhanced model with market incentives and employee commitment
III: Enhanced model with market incentives and employee commitment
Actively incent cleaner technology
More stringent operational criteria to help maintain oversight (without employee commitment)
Require trucks to be driven by employees to achieve CTP goals
PLUS: added control, training and compliance among employees (via concession)
PLUS: explicit commitment for drivers to become employees over a set period of time
Environmental Cargo Fee
Truck ban
2
Safety and security
3
Concession
4
Truck financing program
5
1
Approach to achieve CTP objectives
Progressive truck ban as outlined
TWIC criteria as mandated by TSA
$35/TEU, optimized exemptions to encourage cleaner technology and private funding
Subsidies given to authorized concessions only (scrap required)PLUS: dirty truck buyback program for IOOs and LMCs
II: Enhanced model with market incentives
II: Enhanced model with market incentives
10BCG presentation to LA Harbor Commission 06Mar08 - Final.ppt
Enforcement
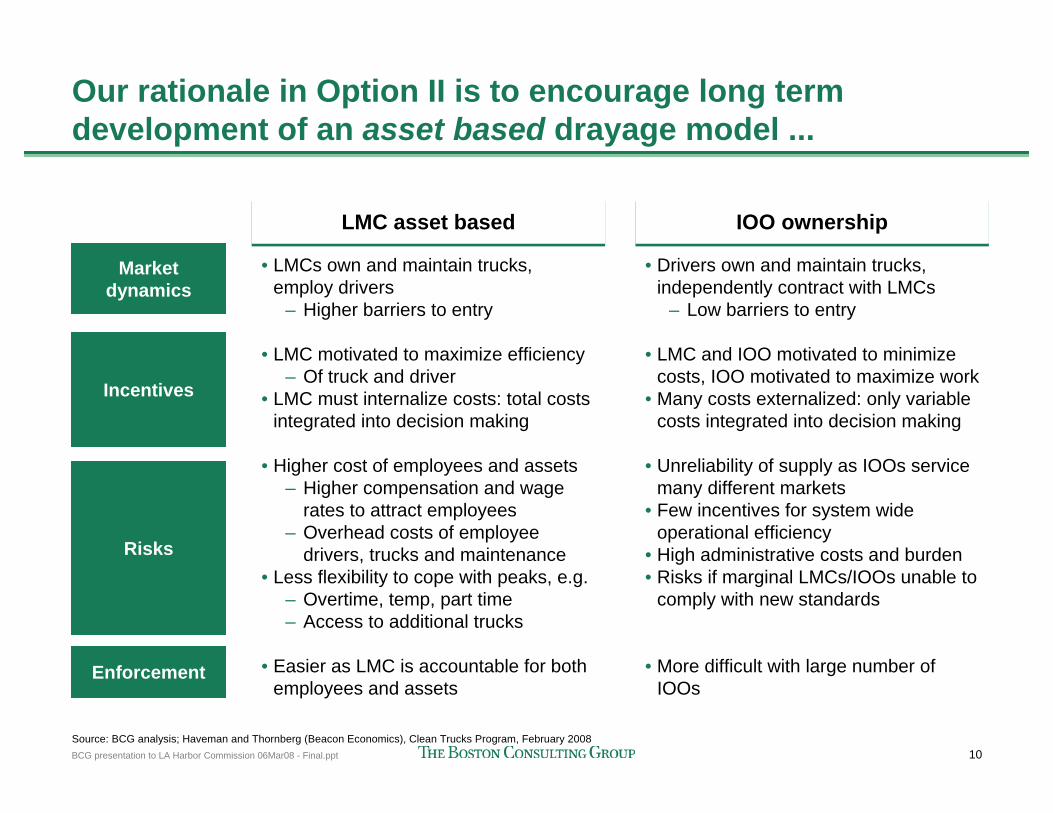
Our rationale in Option II is to encourage long term development of an asset based drayage model ...
LMC asset basedLMC asset based
• LMCs own and maintain trucks, employ drivers
– Higher barriers to entry
• LMC motivated to maximize efficiency– Of truck and driver
• LMC must internalize costs: total costs integrated into decision making
• Higher cost of employees and assets– Higher compensation and wage
rates to attract employees– Overhead costs of employee
drivers, trucks and maintenance• Less flexibility to cope with peaks, e.g.
– Overtime, temp, part time– Access to additional trucks
• Easier as LMC is accountable for both employees and assets
IOO ownershipIOO ownership
• Drivers own and maintain trucks, independently contract with LMCs
– Low barriers to entry
• LMC and IOO motivated to minimize costs, IOO motivated to maximize work
• Many costs externalized: only variable costs integrated into decision making
• Unreliability of supply as IOOs service many different markets
• Few incentives for system wide operational efficiency
• High administrative costs and burden• Risks if marginal LMCs/IOOs unable to
comply with new standards
• More difficult with large number of IOOs
Source: BCG analysis; Haveman and Thornberg (Beacon Economics), Clean Trucks Program, February 2008
Risks
Incentives
Market dynamics
11BCG presentation to LA Harbor Commission 06Mar08 - Final.ppt
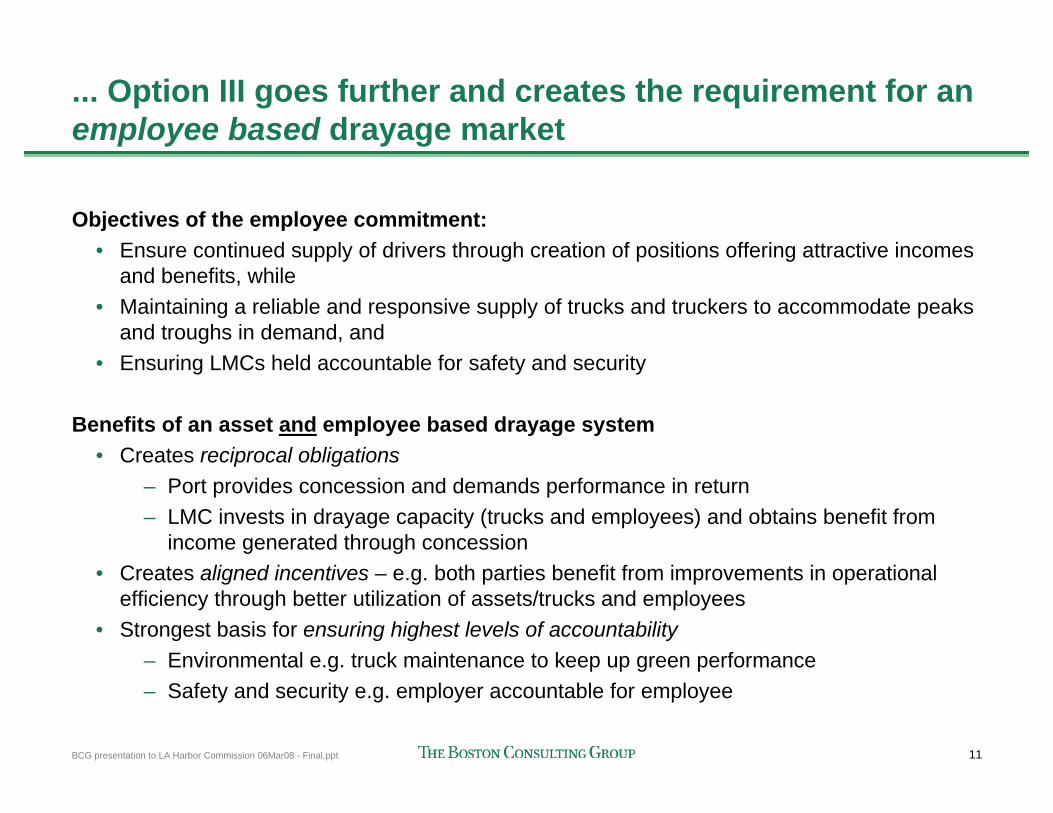
... Option III goes further and creates the requirement for an employee based drayage market
Objectives of the employee commitment:• Ensure continued supply of drivers through creation of positions offering attractive incomes
and benefits, while• Maintaining a reliable and responsive supply of trucks and truckers to accommodate peaks
and troughs in demand, and• Ensuring LMCs held accountable for safety and security
Benefits of an asset and employee based drayage system• Creates reciprocal obligations
– Port provides concession and demands performance in return– LMC invests in drayage capacity (trucks and employees) and obtains benefit from
income generated through concession• Creates aligned incentives – e.g. both parties benefit from improvements in operational
efficiency through better utilization of assets/trucks and employees• Strongest basis for ensuring highest levels of accountability
– Environmental e.g. truck maintenance to keep up green performance– Safety and security e.g. employer accountable for employee
12BCG presentation to LA Harbor Commission 06Mar08 - Final.ppt
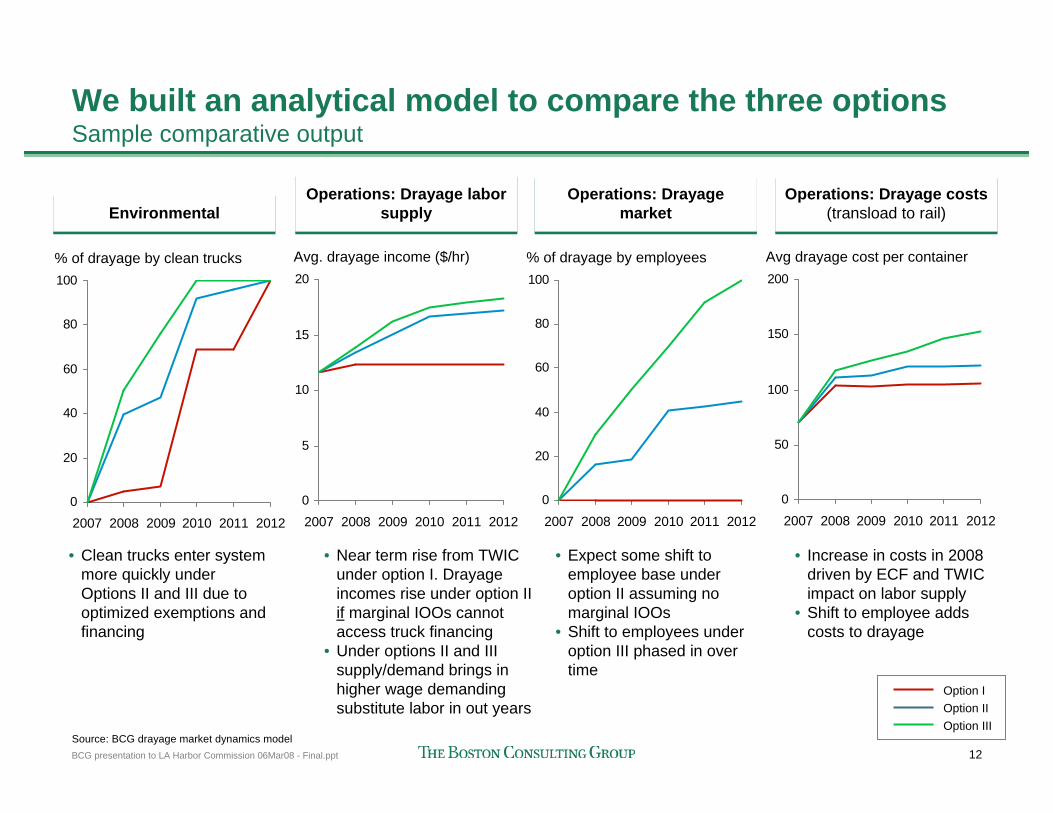
We built an analytical model to compare the three optionsSample comparative output
EnvironmentalEnvironmentalOperations: Drayage labor
supplyOperations: Drayage labor
supplyOperations: Drayage
marketOperations: Drayage
market
0
20
40
60
80
100% of drayage by clean trucks
2007 2008 2009 2010 2011 2012
0
5
10
15
20
2009 2010 2011
Avg. drayage income ($/hr)
201220082007
0
20
40
60
80
100
2007 2008 2009
% of drayage by employees
201220112010
Operations: Drayage costs (transload to rail)
Operations: Drayage costs (transload to rail)
0
50
100
150
200
2007 2008 2009
Avg drayage cost per container
201220112010
• Clean trucks enter system more quickly under Options II and III due to optimized exemptions and financing
• Near term rise from TWICunder option I. Drayage incomes rise under option II if marginal IOOs cannot access truck financing
• Under options II and III supply/demand brings in higher wage demanding substitute labor in out years
• Expect some shift to employee base under option II assuming no marginal IOOs
• Shift to employees under option III phased in over time
• Increase in costs in 2008 driven by ECF and TWICimpact on labor supply
• Shift to employee adds costs to drayage
Option IOption IIOption III
Source: BCG drayage market dynamics model
13BCG presentation to LA Harbor Commission 06Mar08 - Final.ppt
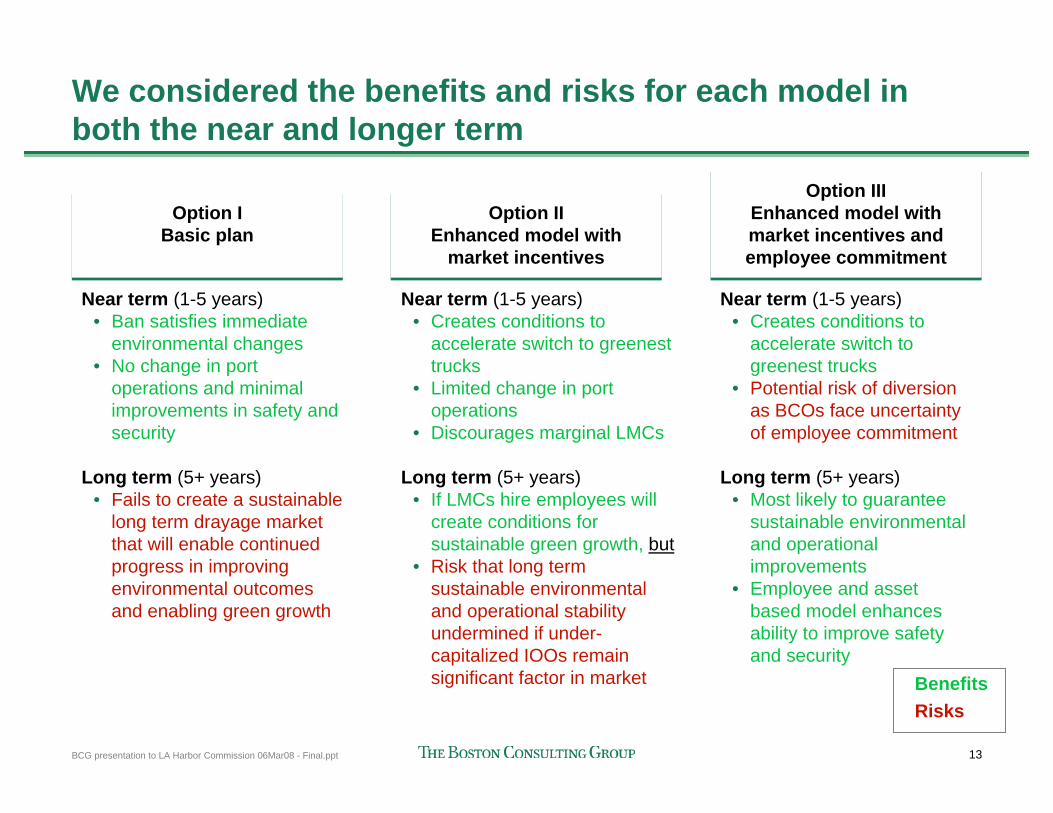
We considered the benefits and risks for each model in both the near and longer term
Option IBasic plan
Option IBasic plan
Near term (1-5 years)• Ban satisfies immediate
environmental changes• No change in port
operations and minimal improvements in safety and security
Long term (5+ years)• Fails to create a sustainable
long term drayage market that will enable continued progress in improving environmental outcomes and enabling green growth
Option IIEnhanced model with
market incentives
Option IIEnhanced model with
market incentives
Option IIIEnhanced model with market incentives and employee commitment
Option IIIEnhanced model with market incentives and employee commitment
Near term (1-5 years)• Creates conditions to
accelerate switch to greenest trucks
• Limited change in port operations
• Discourages marginal LMCs
Long term (5+ years)• If LMCs hire employees will
create conditions for sustainable green growth, but
• Risk that long term sustainable environmental and operational stability undermined if under-capitalized IOOs remain significant factor in market
Near term (1-5 years)• Creates conditions to
accelerate switch to greenest trucks
• Potential risk of diversion as BCOs face uncertainty of employee commitment
Long term (5+ years)• Most likely to guarantee
sustainable environmental and operational improvements
• Employee and asset based model enhances ability to improve safety and security
BenefitsRisks
14BCG presentation to LA Harbor Commission 06Mar08 - Final.ppt
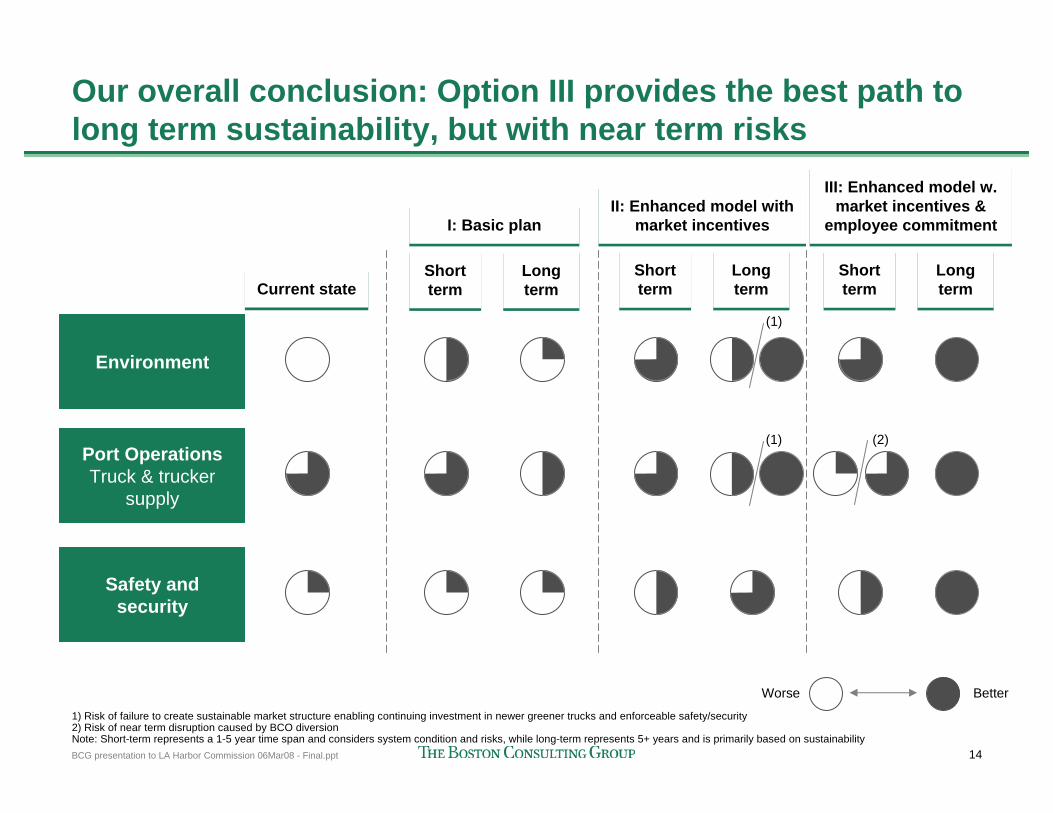
Our overall conclusion: Option III provides the best path to long term sustainability, but with near term risks
I: Basic planI: Basic plan
III: Enhanced model w. market incentives &
employee commitment
III: Enhanced model w. market incentives &
employee commitment
Current stateCurrent state
Environment
Port OperationsTruck & trucker
supply
Safety and security
Long termLong term
Short termShort term
Long termLong term
Short termShort term
Long termLong term
Short termShort term
1) Risk of failure to create sustainable market structure enabling continuing investment in newer greener trucks and enforceable safety/security2) Risk of near term disruption caused by BCO diversionNote: Short-term represents a 1-5 year time span and considers system condition and risks, while long-term represents 5+ years and is primarily based on sustainability
Worse Better
(1) (2)
(1)
II: Enhanced model with market incentives
II: Enhanced model with market incentives
15BCG presentation to LA Harbor Commission 06Mar08 - Final.ppt
Conclusion
1. Option I will not create a sustainable long term drayage market that will deliver reliable supply, ensure continued progress in improving environmental outcomes, and enable green growth (e.g. through creating incentives for operational efficiency)
2. Both Options II and III have the potential to create a drayage market that meets the CAAPand CTP objectives (environmental, operational and safety/security) not only in the near term (the terms of the ban) but also in the long term (creates a sustainable drayage market)
3. Option II carries the risk that long term sustainability is undermined if market participants or third parties find ways to hold employee incomes below prevailing levels needed to ensure a reliable supply of truckers (e.g. by financing existing IOOs)
4. Option III directly addresses this risk and offers the best guarantee of long term sustainability, but at the cost of introducing a new element of operational uncertainty
5. One potential outcome could be that the ports of Long Beach and Los Angeles adopt different programs. The Port of Long Beach has adopted a program like Option I. Were the Port of Los Angeles to adopt either of Options II or III there is risk that volume of containers and supply of truckers could divert from Los Angeles to Long Beach.
6. In conclusion we recommend that decision makers seek a unified approach to the San Pedro Bay Clean Truck Program. Decision makers’ preference between Options II and III will hinge on the relative weight they give to risk of LMC/BCO actions versus risk of market participants exploiting loopholes to sustain a lower wage, marginal economics based SPB drayage market and failure to achieve sustainable advantages in line with CAAP goals
16BCG presentation to LA Harbor Commission 06Mar08 - Final.ppt
Agenda
Appendix: Description of the three options
17BCG presentation to LA Harbor Commission 06Mar08 - Final.ppt
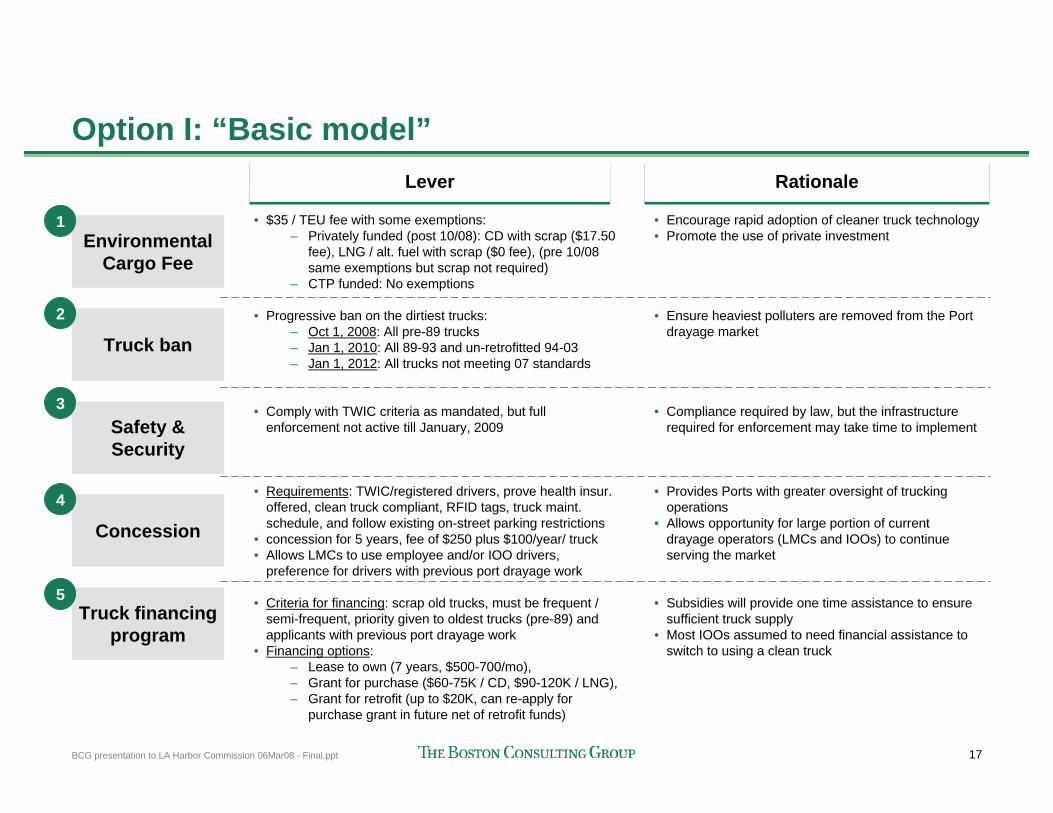
Option I: “Basic model”LeverLever
• $35 / TEU fee with some exemptions:– Privately funded (post 10/08): CD with scrap ($17.50
fee), LNG / alt. fuel with scrap ($0 fee), (pre 10/08 same exemptions but scrap not required)
– CTP funded: No exemptions
• Progressive ban on the dirtiest trucks:– Oct 1, 2008: All pre-89 trucks– Jan 1, 2010: All 89-93 and un-retrofitted 94-03– Jan 1, 2012: All trucks not meeting 07 standards
• Comply with TWIC criteria as mandated, but full enforcement not active till January, 2009
• Requirements: TWIC/registered drivers, prove health insur. offered, clean truck compliant, RFID tags, truck maint. schedule, and follow existing on-street parking restrictions
• concession for 5 years, fee of $250 plus $100/year/ truck • Allows LMCs to use employee and/or IOO drivers,
preference for drivers with previous port drayage work
• Criteria for financing: scrap old trucks, must be frequent / semi-frequent, priority given to oldest trucks (pre-89) and applicants with previous port drayage work
• Financing options: – Lease to own (7 years, $500-700/mo), – Grant for purchase ($60-75K / CD, $90-120K / LNG), – Grant for retrofit (up to $20K, can re-apply for
purchase grant in future net of retrofit funds)
RationaleRationale
• Encourage rapid adoption of cleaner truck technology• Promote the use of private investment
• Ensure heaviest polluters are removed from the Port drayage market
• Compliance required by law, but the infrastructure required for enforcement may take time to implement
• Provides Ports with greater oversight of trucking operations
• Allows opportunity for large portion of current drayage operators (LMCs and IOOs) to continue serving the market
• Subsidies will provide one time assistance to ensure sufficient truck supply
• Most IOOs assumed to need financial assistance to switch to using a clean truck
Environmental Cargo Fee
1
Truck ban 2
Safety & Security
3
Concession4
Truck financingprogram
5
18BCG presentation to LA Harbor Commission 06Mar08 - Final.ppt
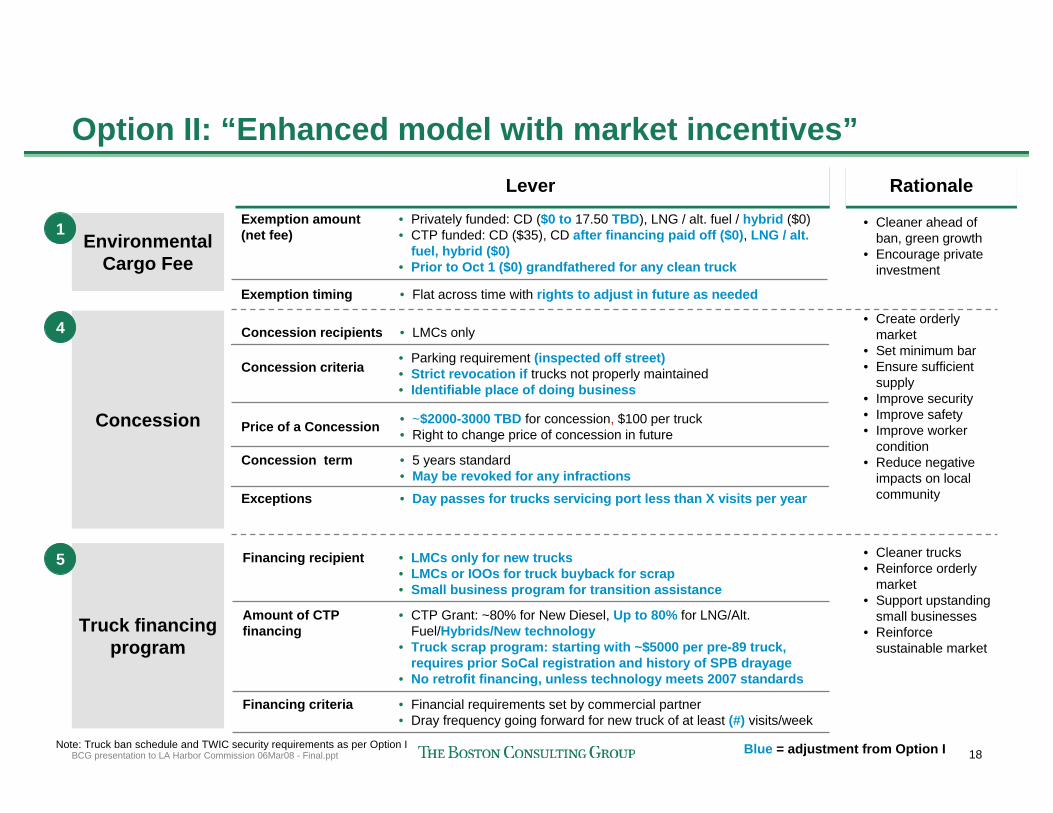
• Flat across time with rights to adjust in future as neededExemption timing
• Privately funded: CD ($0 to 17.50 TBD), LNG / alt. fuel / hybrid ($0)• CTP funded: CD ($35), CD after financing paid off ($0), LNG / alt.
fuel, hybrid ($0)• Prior to Oct 1 ($0) grandfathered for any clean truck
Exemption amount (net fee)
LeverLever
Option II: “Enhanced model with market incentives”
Concession
4
Truck financingprogram
5
Environmental Cargo Fee
1
• LMCs only for new trucks• LMCs or IOOs for truck buyback for scrap• Small business program for transition assistance
Financing recipient
• Financial requirements set by commercial partner• Dray frequency going forward for new truck of at least (#) visits/week
Financing criteria
• CTP Grant: ~80% for New Diesel, Up to 80% for LNG/Alt. Fuel/Hybrids/New technology
• Truck scrap program: starting with ~$5000 per pre-89 truck, requires prior SoCal registration and history of SPB drayage
• No retrofit financing, unless technology meets 2007 standards
Amount of CTP financing
• LMCs onlyConcession recipients
• 5 years standard• May be revoked for any infractions
Concession term
• Day passes for trucks servicing port less than X visits per yearExceptions
• ~$2000-3000 TBD for concession, $100 per truck • Right to change price of concession in futurePrice of a Concession
• Parking requirement (inspected off street)• Strict revocation if trucks not properly maintained• Identifiable place of doing business
Concession criteria
Blue = adjustment from Option I
• Create orderly market
• Set minimum bar• Ensure sufficient
supply• Improve security• Improve safety• Improve worker
condition• Reduce negative
impacts on local community
• Cleaner trucks• Reinforce orderly
market• Support upstanding
small businesses• Reinforce
sustainable market
• Cleaner ahead of ban, green growth
• Encourage private investment
RationaleRationale
Note: Truck ban schedule and TWIC security requirements as per Option I
19BCG presentation to LA Harbor Commission 06Mar08 - Final.ppt
Component
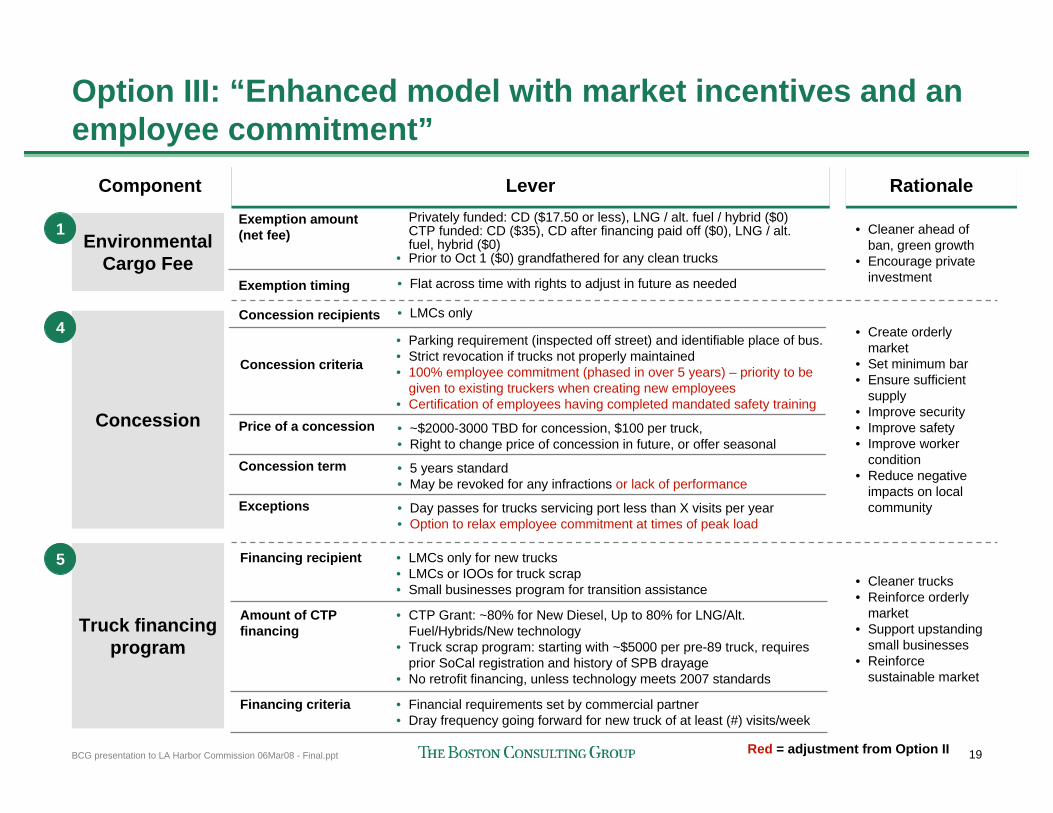
• Flat across time with rights to adjust in future as neededExemption timing
• Privately funded: CD ($17.50 or less), LNG / alt. fuel / hybrid ($0)• CTP funded: CD ($35), CD after financing paid off ($0), LNG / alt.
fuel, hybrid ($0)• Prior to Oct 1 ($0) grandfathered for any clean trucks
Exemption amount (net fee)
Option III: “Enhanced model with market incentives and an employee commitment”
Concession
4
Truck financingprogram
5
Environmental Cargo Fee
1
• LMCs onlyConcession recipients
• Parking requirement (inspected off street) and identifiable place of bus.• Strict revocation if trucks not properly maintained• 100% employee commitment (phased in over 5 years) – priority to be
given to existing truckers when creating new employees• Certification of employees having completed mandated safety training
Concession criteria
• 5 years standard• May be revoked for any infractions or lack of performance
Concession term
• Day passes for trucks servicing port less than X visits per year• Option to relax employee commitment at times of peak load
Exceptions
• ~$2000-3000 TBD for concession, $100 per truck, • Right to change price of concession in future, or offer seasonal
Price of a concession
Red = adjustment from Option II
• LMCs only for new trucks• LMCs or IOOs for truck scrap• Small businesses program for transition assistance
Financing recipient
• Financial requirements set by commercial partner• Dray frequency going forward for new truck of at least (#) visits/week
Financing criteria
• CTP Grant: ~80% for New Diesel, Up to 80% for LNG/Alt. Fuel/Hybrids/New technology
• Truck scrap program: starting with ~$5000 per pre-89 truck, requires prior SoCal registration and history of SPB drayage
• No retrofit financing, unless technology meets 2007 standards
Amount of CTP financing
LeverLever RationaleRationale
• Create orderly market
• Set minimum bar• Ensure sufficient
supply• Improve security• Improve safety• Improve worker
condition• Reduce negative
impacts on local community
• Cleaner trucks• Reinforce orderly
market• Support upstanding
small businesses• Reinforce
sustainable market
• Cleaner ahead of ban, green growth
• Encourage private investment
20BCG presentation to LA Harbor Commission 06Mar08 - Final.ppt
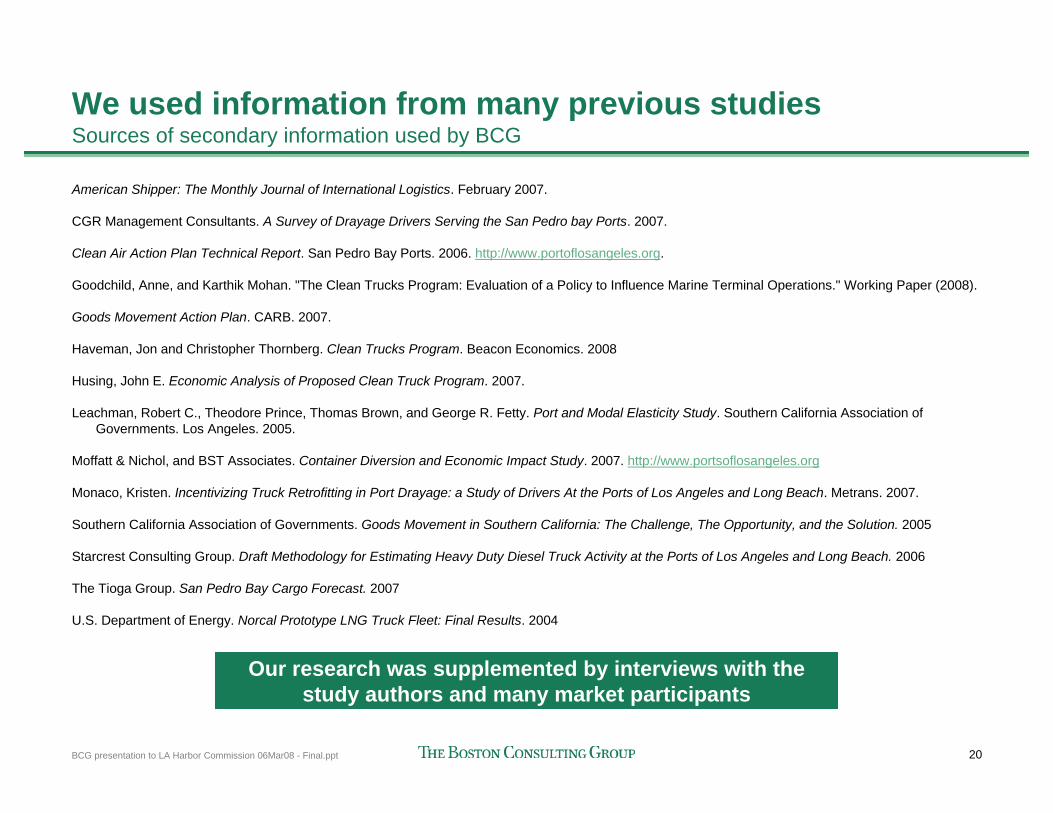
We used information from many previous studiesSources of secondary information used by BCG
American Shipper: The Monthly Journal of International Logistics. February 2007.
CGR Management Consultants. A Survey of Drayage Drivers Serving the San Pedro bay Ports. 2007.
Clean Air Action Plan Technical Report. San Pedro Bay Ports. 2006. http://www.portoflosangeles.org.
Goodchild, Anne, and Karthik Mohan. "The Clean Trucks Program: Evaluation of a Policy to Influence Marine Terminal Operations." Working Paper (2008).
Goods Movement Action Plan. CARB. 2007.
Haveman, Jon and Christopher Thornberg. Clean Trucks Program. Beacon Economics. 2008
Husing, John E. Economic Analysis of Proposed Clean Truck Program. 2007.
Leachman, Robert C., Theodore Prince, Thomas Brown, and George R. Fetty. Port and Modal Elasticity Study. Southern California Association of Governments. Los Angeles. 2005.
Moffatt & Nichol, and BST Associates. Container Diversion and Economic Impact Study. 2007. http://www.portsoflosangeles.org
Monaco, Kristen. Incentivizing Truck Retrofitting in Port Drayage: a Study of Drivers At the Ports of Los Angeles and Long Beach. Metrans. 2007.
Southern California Association of Governments. Goods Movement in Southern California: The Challenge, The Opportunity, and the Solution. 2005
Starcrest Consulting Group. Draft Methodology for Estimating Heavy Duty Diesel Truck Activity at the Ports of Los Angeles and Long Beach. 2006
The Tioga Group. San Pedro Bay Cargo Forecast. 2007
U.S. Department of Energy. Norcal Prototype LNG Truck Fleet: Final Results. 2004
Our research was supplemented by interviews with the study authors and many market participants