Embed Size (px)
Citation preview
Port Hueneme, California 93043-4370 Technical Report TR-NAVFAC-EXWC-EV-1303
BEST PRACTICES FOR INJECTION AND DISTRIBUTION OF
AMENDMENTS
Battelle Memorial Institute and
NAVFAC Alternative Restoration Technology Team
March 2013
Distribution Statement A: Approved for public release, distribution is unlimited

ii
This page is intentionally left blank.

iii
REPORT DOCUMENTATION PAGE (SF 298) Form Approved OMB No. 0704-0811
The public reporting burden for this collection of information is estimated to average 1 hour per response, including the time for reviewing instructions, searching existing data sources, gathering and maintaining the data needed, and completing and reviewing the collection of information. Send comments regarding this burden estimate or any other aspect of this collection of information, including suggestions for reducing the burden to Department of Defense, Washington Headquarters Services, Directorate for Information Operations and Reports (0704-0188), 1215 Jefferson Davis Highway, Suite 1204, Arlington, VA 22202-4302. Respondents should be aware that notwithstanding any other provision of law, no person shall be subject to any penalty for failing to comply with a collection of information, it if does not display a currently valid OMB control number. PLEASE DO NOT RETURN YOUR FORM TO THE ABOVE ADDRESS. 1. REPORT DATE (DD-MM-YYYY) 2. REPORT TYPE 3. DATES COVERED (From – To)
19/03/2013 Technical Report 4. TITLE AND SUBTITLE 5a. CONTRACT NUMBER
Best Practices for Injection and Distribution of Amendments ESAT N62583-11-D-0515 / DO 0020 5b. GRANT NUMBER
5c. PROGRAM ELEMENT NUMBER
6. AUTHOR(S) 5d. PROJECT NUMBER
Steve Rosansky, Wendy Condit, and Russ Sirabian 5e. TASK NUMBER
5f. WORK UNIT NUMBER
7. PERFORMING ORGANIZATION NAME(S) AND ADDRESSES 8. PERFORMING ORGANIZATION REPORT
NUMBER
Battelle 9. SPONSORING/MONITORING AGENCY NAME(S) AND ADDRESS(ES) 10. SPONSOR/MONITORS ACRONYM(S)
11. SPONSOR/MONITOR’S REPORT
NUMBER(S)
12. DISTRIBUTION/AVAILABILITY STATEMENT
13. SUPPLEMENTARY NOTES
14. ABSTRACT
The objective of this document is to present current “best practices” for introducing liquid- and solid-phase amendments into aquifers and improve the likelihood that these amendments are adequately distributed. Best practices and lessons learned through evaluation of past applications of these technologies are provided. 15. SUBJECT TERMS
16. SECURITY CLASSIFICATION OF: 17. LIMITATION OF
ABSTRACT 18.NUMBER OF PAGES
19a. NAME OF RESPONSIBLE PERSON
a. REPORT b. ABSTRACT c. THIS PAGE U U U 19b. TELEPHONE NUMBER (include area code)
iv
DISCLAIMER The publication of this document does not indicate endorsement by the Department of Defense or NAVFAC EXWC, nor should the contents be construed as reflecting the official position of those Agencies. Mention of specific product names, vendors or source of information does not constitute an endorsement by any of the authoring organizations. The information pertaining to the technology performance was collected from various sources, including consultant's reports, government documents, conference proceedings, and more. The source of the information is made available in the reference section.
v
EXECUTIVE SUMMARY
Over the last two decades, many in situ environmental restoration technologies have been developed to treat chlorinated solvents, petroleum hydrocarbons, energetics, and other contaminants of concern (COCs) encountered at Department of the Navy sites. In recent years, the application of technologies such as in situ chemical oxidation (ISCO), in situ chemical reduction (ISCR), and enhanced in situ bioremediation (EISB) has increased and will continue to be applied with growing frequency into the foreseeable future. These technologies have successfully achieved remedial action objectives (RAOs) and remedial goals (RGs) at many sites. However, there have been sites where concentrations of COCs were not reduced significantly or a greater number of anticipated amendment applications were required, resulting in increased cost and time to achieve site cleanup. There are many reasons for the sub-optimal performance of in situ technologies at these sites including unrealistic RGs and uncertainties in the conceptual site model (CSM). However, one common underlying cause appears to be an inability to achieve adequate distribution and contact between the reagents, substrates, and COCs. The objective of this document is to present current “best practices” for introducing liquid- and solid-phase amendments into aquifers and improve the likelihood that these amendments are adequately distributed. Best practices and lessons learned through evaluation of past applications of these technologies are provided. After a brief introduction in Section 1, a technology overview for ISCO, EISB, and ISCR is provided in Section 2 that describes the basic principles for each of the technologies and summarizes typical amendments used during application. Additionally, a series of tables is provided to describe some of the common design factors that must be considered to successfully apply these technologies at a site. Section 3 provides additional design guidance common to all three technologies. The importance of developing and maintaining an up-to-date CSM is stressed. Identifying uncertainties and addressing them through additional characterization as well as bench- and pilot-scale tests is presented. The key components of an injection design plan are introduced and additional design considerations including health and safety, sustainability, and regulatory issues are provided. In addition, design considerations specific to applying amendments at sites that contain dense non-aqueous phase liquid (DNAPL) are provided. Delivery methods for introduction of amendments into the aquifer are presented in Section 4. Three types of injection points are discussed: direct push points, fixed vertical wells, and fixed horizontal wells. The section also provides five methods of injection, including pressure injection, pull-push, recirculation systems, pneumatic fracturing and hydraulic fracturing. Specific design, installation, and operation considerations for each technique are presented in a series of tables.
vi
An overview of monitoring techniques used to gauge the extent of distribution of delivered amendments is provided in Section 5. Field assessment techniques are the primary focus due to their importance for application process monitoring. Section 6 provides an overview of key lessons learned and stresses overarching techniques for optimizing the remedial design and remedial action operation that are applicable to all three technologies. Finally, Section 7 illustrates many of the concepts and challenges described in the document through three detailed case studies, including performing ISCO and transitioning to EISB at Naval Air Station (NAS) Alameda; EISB at NAS Seal Beach; and ISCR using zero-valent iron (ZVI) at Hunters Point Naval Shipyard (HPNS).
vii
ACRONYMS AND ABBREVIATIONS
3-D three-dimension bgs below ground surface CERCLA Comprehensive Environmental Response,
Compensation and Liability Act cfm cubic feet per minute CO2e carbon dioxide equivalent COC contaminant of concern CORT3D Chemical Oxidation Reactive Transport in 3-D CSM conceptual site model DCE dichloroethene DHC Dehalococcoides DNAPL dense non-aqueous phase liquid DO dissolved oxygen DOC dissolved organic carbon DON U.S. Department of the Navy DPT direct push technology EDTA ethylenediamine tetraacetic acid EISB enhanced in situ bioremediation ESTCP Environmental Security Technology Certification
Program EVO emulsified vegetable oil EZVI emulsified zero valent iron GCW groundwater circulation well gpm gallons per minute GSR green and sustainable remediation HPNS Hunters Point Naval Shipyard IR Installation Restoration ISCO in situ chemical oxidation ISCR in situ chemical reduction ITRC Interstate Technology and Regulatory Council lbf pounds of force m-ZVI micro-scale zero valent iron n-ZVI nano-scale zero valent iron NAPL non-aqueous phase liquid
viii
NAS Naval Air Station NOD natural oxidant demand NOM natural organic matter ORP oxidation-reduction potential PCE tetrachloroethene PPT pressure pulse technology PRB permeable reactive barrier psi pound per square inch PV pore volume RAO remedial action objective RCRA Resource Conservation and Recovery Act RG remedial goal ROI radius of influence RPM Remedial Project Manager SAB source area biobarrier SATG source area treatment grid SDWA Safe Drinking Water Act SERDP Strategic Environmental and Research Development
Program TCE trichloroethene TOC total organic carbon TTZ target treatment zone UIC Underground Injection Control U.S. EPA U.S. Environmental Protection Agency VC vinyl chloride VFA volatile fatty acid VOC volatile organic compound ZVI zero valent iron ZVZ zero valent zinc
ix
TABLE OF CONTENTS
EXECUTIVE SUMMARY ...........................................................................................................v ACRONYMS AND ABBREVIATIONS ................................................................................... vii 1.0 Introduction ........................................................................................................................1
1.1 Purpose of Document ............................................................................................... 1 1.2 Applicability ............................................................................................................. 2
2.0 Technology Overview ........................................................................................................3
2.1 In Situ Chemical Oxidation .................................................................................... 3 2.2 Enhanced In Situ Bioremediation .......................................................................... 6 2.3 In Situ Chemical Reduction .................................................................................... 7
3.0 Design Considerations .....................................................................................................10
3.1 The Observational Approach and the Conceptual Site Model .......................... 10 3.2 Bench-Scale and Pilot Tests .................................................................................. 13 3.3 Injection Plan ......................................................................................................... 14 3.4 Dense Non-Aqueous Phase Liquids ...................................................................... 19 3.5 Other Technology-Specific Design Considerations............................................. 20 3.6 Green and Sustainable Remediation .................................................................... 22 3.7 Health and Safety ................................................................................................... 23 3.8 Regulatory Considerations .................................................................................... 24
4.0 Methods for Introducing and Distributing Amendments ............................................28
4.1 Injection Strategies ................................................................................................ 28 4.2 Application Tooling and Techniques ................................................................... 33 4.3 Other Operational Considerations ....................................................................... 42
5.0 Monitoring and Verification Requirements for Evaluating Distribution of
Amendments .....................................................................................................................47 5.1 Field Assessment Techniques ................................................................................ 47 5.2 Laboratory Analysis .............................................................................................. 49
6.0 Lessons Learned and Recommendations for Best Practice .........................................50 7.0 Case Studies ......................................................................................................................52
7.1 In Situ Chemical Oxidation and Enhanced Bioremediation ............................. 52 7.2 Enhanced Bioremediation for Source Area Treatment and Plume Control .... 57 7.3 Application of ZVI Using Hydraulic and Pneumatic Fracturing ...................... 61
REFERENCES .............................................................................................................................66
x
LIST OF TABLES
Table 2-1. Common Oxidants and Activators Used for Remediation Projects.......................... 4 Table 2-2. Design Considerations for the Application of ISCO Amendments .......................... 5 Table 2-3. Characteristics of Biostimulants ............................................................................... 7 Table 2-4. Properties and Advantages and Limitations of Various ZVI Compounds ............... 9 Table 3-1. Impacts of Several Site-Specific Factors on Amendment Distribution .................. 12 Table 3-2. Guidance for Bench- and Pilot-Scale Tests ............................................................ 13 Table 3-3. Select Bench-Scale and Pilot Testing Guidance Resources ................................... 14 Table 3-4. General Guidance for Determining Amendment Dosing ....................................... 17 Table 3-5. Examples of Endpoints, Milestones, and Metrics ................................................... 18 Table 3-6. Strategies for Application and Distribution of Amendments in DNAPL
Source Zones ........................................................................................................... 19 Table 3-7. Potential Hazards Associated with the Application of Commonly Used
ISCO, EISB, and ISCR Reagents ........................................................................... 26 Table 3-8. Regulatory Considerations ...................................................................................... 27 Table 4-1. Summary of Literature Search Results for ISCO Reagent Placement
Methods................................................................................................................... 28 Table 4-2. Injection Strategies for Introducing Reagents into Aquifer Material ..................... 29 Table 4-3. Comparison of DPT Injection Points and Permanent Wells for Introducing
Amendments into the Aquifer ................................................................................. 29 Table 4-4. Site-Specific Impacts on Reagent Distribution Technique ..................................... 34 Table 4-5. Design, Installation, and Operation Guidance for Vertical Wells to
Optimize Amendment Distribution......................................................................... 36 Table 4-6. Advantages and Limitations of DPT Points for Amendment Distribution ............. 36 Table 4-7. Design, Installation, and Operation Guidance for DPT Points and Wells to
Optimize Amendment Distribution......................................................................... 38 Table 4-8. Design, Installation, and Operation Guidance for Horizontal Wells to
Optimize Amendment Distribution......................................................................... 40 Table 4-9. Design, Installation, and Operation Guidance for Creating and Emplacing
Amendments in Fractures ....................................................................................... 42 Table 4-10. Preventative Measures and Mitigation of Daylighting ........................................... 44 Table 4-11. Best Practices to Address Well Fouling.................................................................. 46 Table 5-1. Common Process Monitoring for Injection of Liquid and Solid Amendments ...... 48 Table 7-1. Summary of Lessons Learned from ISCO-EISB Application at Alameda
Site 26 ..................................................................................................................... 56 Table 7-2. Well Details ............................................................................................................ 59 Table 7-3. Lessons Learned from EISB Application at Naval Weapons Station Seal
Beach....................................................................................................................... 61 Table 7-4. Lessons Learned from Pneumatic Fracturing and Placement of ZVI at HPNS ...... 65
xi
LIST OF FIGURES
Figure 3-1. Observational Approach ...........................................................................................10 Figure 3-2. Typical Treatment Layouts .......................................................................................15 Figure 3-3. Gas Generation during Application of Iron-Activated Hydrogen Peroxide .............20 Figure 3-4. Comparison of Greenhouse Gas Emissions for Several Remedial
Alternatives at the Marine Recruit Facility Parris Island Site 45 .............................23 Figure 4-1. Conceptual Illustration of a Direct Injection Process ...............................................30 Figure 4-2. Typical Recirculation System ...................................................................................31 Figure 4-3. Recirculation Module Design and Installed At Site 14, Former NAS
Alameda ....................................................................................................................32 Figure 4-4. Conceptual Illustration of a Recirculation Well .......................................................33 Figure 4-5. Clogged Injection Tooling ........................................................................................37 Figure 4-6. Direct Push Injection Wells ......................................................................................37 Figure 4-7. Surface Fracture and Uplift Formed during Pneumatic Injection of ZVI .................41 Figure 4-8. Surfacing of Groundwater during Application of ISCO Using Iron-Activated
Sodium Persulfate .....................................................................................................43 Figure 4-9. Fouling in a Deep Recovery Well .............................................................................44 Figure 7-1. ISCO Target Treatment Area ....................................................................................53 Figure 7-2. EISB Target Treatment Area and Design .................................................................54 Figure 7-3. DPT Points ................................................................................................................55 Figure 7-4. Bioaugmentation Equipment ....................................................................................56 Figure 7-5. TCE Plume and Treatment Zones .............................................................................57 Figure 7-6. Cross-Section of TCE Plume and Lithologic Units ..................................................58 Figure 7-7. Hunters Point Parcel G..............................................................................................62 Figure 7-8. Layout of the Seven ZVI Injection Barriers within IR-71 ........................................63

xii
This page is intentionally left blank.
1
1.0 INTRODUCTION Over the last two decades, many in situ environmental restoration technologies have been developed to treat chlorinated solvents, petroleum hydrocarbons, energetic, and other contaminants of concern (COCs) encountered at Department of the Navy (DON) sites. During the early 1990s, technologies such as bioventing and soil vapor extraction (which facilitate the movement of air through the subsurface to stimulate biodegradation and/or volatilization of volatile organic compounds [VOCs]), were demonstrated to effectively remediate sites contaminated with petroleum hydrocarbons and chlorinated solvents. Other technologies that relied on the introduction of gases such as ozone, methane, and nitrogen were demonstrated and used to treat other COCs commonly found at DON sites, including chlorinated solvents, energetics, and some metals. In recent years, the environmental practitioner’s toolbox has expanded to include a number of technologies that rely on the introduction of various liquid- and/or solid-phase amendments into an aquifer. Frequently applied technologies include in situ chemical oxidation (ISCO), in situ chemical reduction (ISCR), and enhanced in situ bioremediation (EISB). Application of these technologies has successfully achieved remedial action objectives (RAOs) and remedial goals (RGs) at many sites. However, there are a number of sites at which the concentrations of COCs were not significantly reduced. At some sites, a greater number of amendment applications were required. At others, a new remedy was required. In either case, the results were substantial additional project cost and time to achieve site cleanup. There are many reasons for the sub-optimal performance at these sites including unrealistic RGs and uncertainties in the conceptual site model (CSM). However, one common underlying cause appears to be the inability to achieve adequate distribution and contact between the reagents, substrates, and COCs. Bench-scale tests tend to over-predict removal rates due to the near complete level of mixing of aquifer material and reagents that is achieved in the laboratory, but nearly impossible to achieve in the field. In situ mixing of amendments with the contaminated media in field applications is limited by laminar flow of fluid from the injection wells, vertical and horizontal heterogeneities in the formation, reaction kinetics and various other soil properties. Many times, field applications must rely on molecular diffusion of the amendments, which can be a slow and sometimes impractical process. These factors contribute to unrealistic expectations during design and application, resulting in a higher than predicted life-cycle cost for the project. 1.1 Purpose of Document Introducing and adequately mixing amendments in the subsurface is one of the most challenging components of an in situ remedial action and comprises a substantial portion of the cost of the project. Historical applications of in situ technologies have resulted in a wealth of knowledge that must be leveraged by remedial project managers (RPMs) and their contractors to optimize approaches for future applications. The objective of this document is to present current “best practices” for introducing amendments into the aquifer and improving the likelihood that these amendments are adequately distributed. Specifically, this document was developed to:
• Provide an overview of current injection techniques and practices
2
• Identify “red flag” issues that prevent the uniform distribution of amendments based on various site or design characteristics
• Illustrate how poor amendment distribution can become a principal limiting factor for many in situ technologies to achieve RGs
• Provide guidance on how to improve/optimize the distribution of amendments in the subsurface to maximize treatment effectiveness and minimize wasteful use of these amendments
• Demonstrate best practices to monitor performance and measure success. 1.2 Applicability This document focuses on ISCO, ISCR, and EISB since these technologies rely heavily on the introduction of amendments. Their application has increased over the last several years and will likely continue to be heavily applied in the foreseeable future. Best practices and lessons learned through historical applications of these technologies are provided. Application of liquid- and solid-phase amendments is discussed in this document. Applications of ISCO, ISCR, and EISB that utilize compressible amendments (i.e., gas) such as ISCO with ozone or EISB using hydrogen as an electron donor are not considered. The design and application of these gaseous amendments require a very different approach, which has its own set of challenges, lessons learned, and optimization strategies. This document also provides guidance pertaining to the application of amendments through injection points or wells. It does not consider applications in which the media are placed via excavated pits or trenches or applications where soil mixing is performed. The three technologies covered in this document are described in Section 2, with emphasis placed on considerations and challenges associated with amendment introduction into the aquifer. Section 3 provides various design considerations and Section 4 presents conventional and innovative injection practices. Process monitoring is discussed in Section 5. Section 6 presents key lessons learned and a summary of best practices developed based on historical applications. Finally, Section 7 presents three case studies that describe site-specific challenges, results, and lessons learned while applying these technologies.
3
2.0 TECHNOLOGY OVERVIEW This section provides an overview of ISCO, ISCR, and EISB technologies, along with a summary of typical amendments used and a discussion of the various considerations and challenges associated with amendment introduction into the aquifer. Additional design guidance for each of these technologies can be found in many sources, several of which are listed below. Many documents and design resources are provided in this document and further information can be found in the reference section of this document. ISCO
• In Situ Chemical Oxidation Fact Sheet (Draft) [1]. • In Situ Chemical Oxidation for Groundwater Remediation, sponsored by SERDP and
ESTCP. [2] • Technical and Regulatory Guidance for In Situ Chemical Oxidation of Contaminated Soil
and Groundwater [3]
EISB
• Using Bioremediation in Dense Non-Aqueous Phase Source Zones [4] • Interstate Technology and Regulatory Council (ITRC). 2008. Technical and Regulatory
Guidance for In Situ Bioremediation of Chlorinated Ethene: DNAPL Source Zones [5] • Principles and Practices of Enhanced Anaerobic Bioremediation of Chlorinated Solvents
[6] • Protocol for In Situ Bioremediation of Chlorinated Solvents Using Edible Oil [7] • Engineered Approaches to In Situ Bioremediation of Chlorinated Solvents: Fundamentals
and Field Applications [8]
ISCR
• In Situ Biogeochemical Transformation of Chlorinated Solvents [9]. • Emulsified Zero-Valent Nano-Scale Iron Treatment of Chlorinated Solvent DNAPL
Source Areas [10] • Permeable Reactive Barrier (PRB) Technology Update [11]
2.1 In Situ Chemical Oxidation ISCO is a remediation technology involving the injection of a chemical oxidant into the subsurface to transform contaminants in groundwater and soil into innocuous byproducts. It can be considered for contaminant mass removal at sites where groundwater and/or porous media contain COCs such as petroleum hydrocarbons, chlorinated solvents, and energetic compounds, which are amenable to oxidation. Detailed information pertaining to the principles, design, and implementation of ISCO can be found in various sources in the literature [1-3]. Common ISCO reagents include hydrogen peroxide, sodium persulfate, potassium permanganate, sodium percarbonate, and ozone. These oxidants are supplied in various forms as listed in Table 2-1. However, with the exception of ozone, which is a gas, all of these oxidants typically are
4
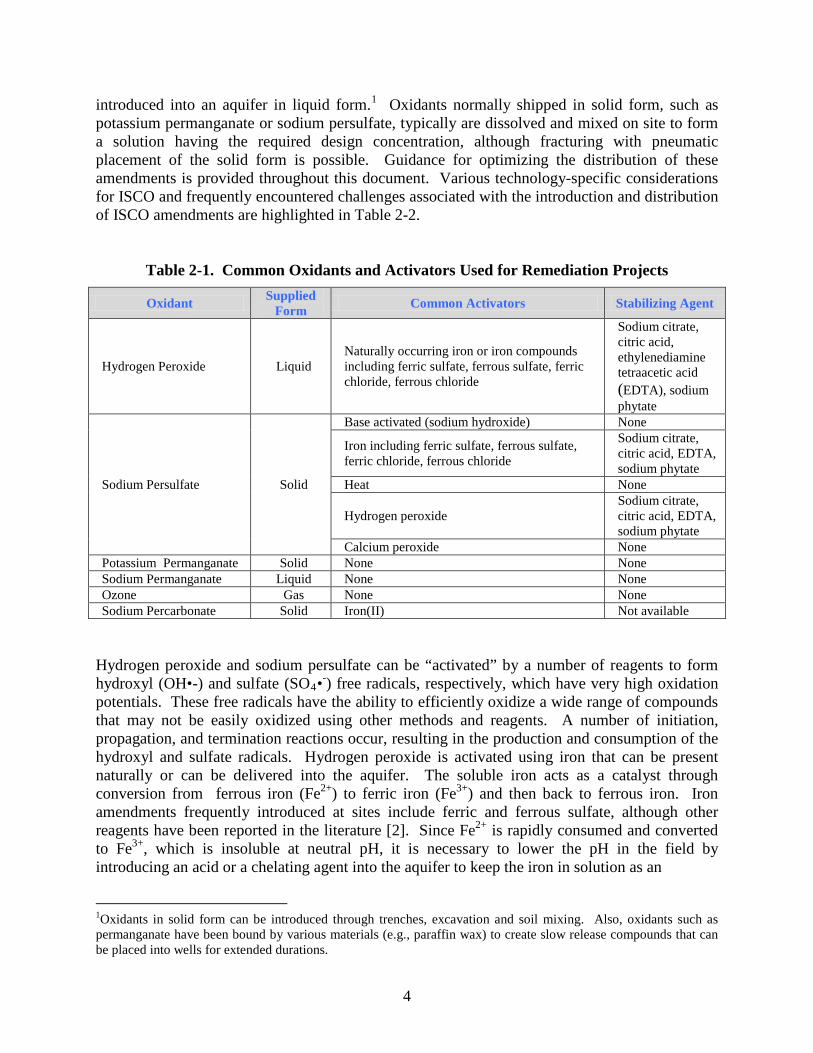
introduced into an aquifer in liquid form.1 Oxidants normally shipped in solid form, such as potassium permanganate or sodium persulfate, typically are dissolved and mixed on site to form a solution having the required design concentration, although fracturing with pneumatic placement of the solid form is possible. Guidance for optimizing the distribution of these amendments is provided throughout this document. Various technology-specific considerations for ISCO and frequently encountered challenges associated with the introduction and distribution of ISCO amendments are highlighted in Table 2-2.
Table 2-1. Common Oxidants and Activators Used for Remediation Projects
Oxidant Supplied Form Common Activators Stabilizing Agent
Hydrogen Peroxide Liquid Naturally occurring iron or iron compounds including ferric sulfate, ferrous sulfate, ferric chloride, ferrous chloride
Sodium citrate, citric acid, ethylenediamine tetraacetic acid (EDTA), sodium phytate
Sodium Persulfate Solid
Base activated (sodium hydroxide) None
Iron including ferric sulfate, ferrous sulfate, ferric chloride, ferrous chloride
Sodium citrate, citric acid, EDTA, sodium phytate
Heat None
Hydrogen peroxide Sodium citrate, citric acid, EDTA, sodium phytate
Calcium peroxide None Potassium Permanganate Solid None None Sodium Permanganate Liquid None None Ozone Gas None None Sodium Percarbonate Solid Iron(II) Not available
Hydrogen peroxide and sodium persulfate can be “activated” by a number of reagents to form hydroxyl (OH•-) and sulfate (SO4•-) free radicals, respectively, which have very high oxidation potentials. These free radicals have the ability to efficiently oxidize a wide range of compounds that may not be easily oxidized using other methods and reagents. A number of initiation, propagation, and termination reactions occur, resulting in the production and consumption of the hydroxyl and sulfate radicals. Hydrogen peroxide is activated using iron that can be present naturally or can be delivered into the aquifer. The soluble iron acts as a catalyst through conversion from ferrous iron (Fe2+) to ferric iron (Fe3+) and then back to ferrous iron. Iron amendments frequently introduced at sites include ferric and ferrous sulfate, although other reagents have been reported in the literature [2]. Since Fe2+ is rapidly consumed and converted to Fe3+, which is insoluble at neutral pH, it is necessary to lower the pH in the field by introducing an acid or a chelating agent into the aquifer to keep the iron in solution as an
1Oxidants in solid form can be introduced through trenches, excavation and soil mixing. Also, oxidants such as permanganate have been bound by various materials (e.g., paraffin wax) to create slow release compounds that can be placed into wells for extended durations.

5
Table 2-2. Design Considerations for the Application of ISCO Amendments ISCO Reagent Injection/Distribution Design Considerations and Challenges
Hydrogen Peroxide
• Reaction is exothermic and generates gases • Vapor intrusion can occur into nearby buildings due to heat and vapor produced during
reaction with organic matter and COCs, which can volatilize and transport COCs • Surfacing of reagents is common due to the formation of a large volume of gas • Reagent is short-lived, which limits ability to distribute via diffusion processes • Natural organic matter (NOM) has a large natural oxidant demand, which can limit
distribution of peroxide due to reactions in the immediate vicinity of the injection • May require injection and distribution of additional reagents to activate (iron and acid or
chelating agent2), which must also be distributed into the aquifer • If significant heat is generated in the subsurface, it may be necessary to use materials
other than polyvinyl chloride to construct injection and monitoring wells
Persulfate
• Highly corrosive. Compatibility of injection equipment with persulfate should be considered.
• May require injection and distribution of additional reagents to activate (strong bases, iron catalyst, chelating agent, hydrogen or calcium peroxide)
• The presence of carbonate or bicarbonate has been noted to reduce oxidation rates, which could impact distribution [2]
• Being the most recent of the oxidants to be applied, there is less of a knowledge-base of specific factors that may impact transport and distribution
Permanganate
• Long-lasting in the aquifer; hence, both advection and diffusion processes contribute to distribution
• Can be used in reactive barriers to intersect plume and prevent further down-gradient migration
• Deep purple color, which can be observed in nearby surface water bodies and groundwater supply wells if the permanganate distribution is not adequately controlled
• Manganese dioxide, an insoluble precipitate, which can reduce the permeability of the aquifer, is formed as a byproduct of the reaction
organometallic complex. Commonly used acids include hydrochloric and sulfuric acid. Commonly used chelating agents include citric acid, sodium citrate, and EDTA. Similar to hydrogen peroxide, activation of sodium persulfate can be achieved by adding iron-bearing compounds such as iron sulfate and either lowering the pH3 or adding a chelating agent. However, alkaline activation (i.e., the addition of sodium hydroxide to achieve a pH of at least 11), heat, and the addition of hydrogen peroxide also can be used to facilitate the formation of the persulfate radical. With the exception of heat, the addition of all of the activation agents described above is performed in the liquid phase. Activating agents are either purchased in the liquid form and then diluted on site to the design concentration, or in some cases, may be purchased in solid form and mixed on site at the desired concentration.
2Chelating agents are chemicals that form soluble, complex molecules with certain metal ions. In this case, carboxyl groups of inorganic acids such as citric acid and EDTA are used to bind ferrous iron to maintain its solubility [3]. 3Injection of an acid may not be practical if the aquifer material has a high buffering capacity, which would necessitate the use of a cost-prohibitive quantity of acid. Furthermore, reducing the pH can result in the dissolution of naturally-occurring metals, which potentially can be transported downgradient of the site.
6
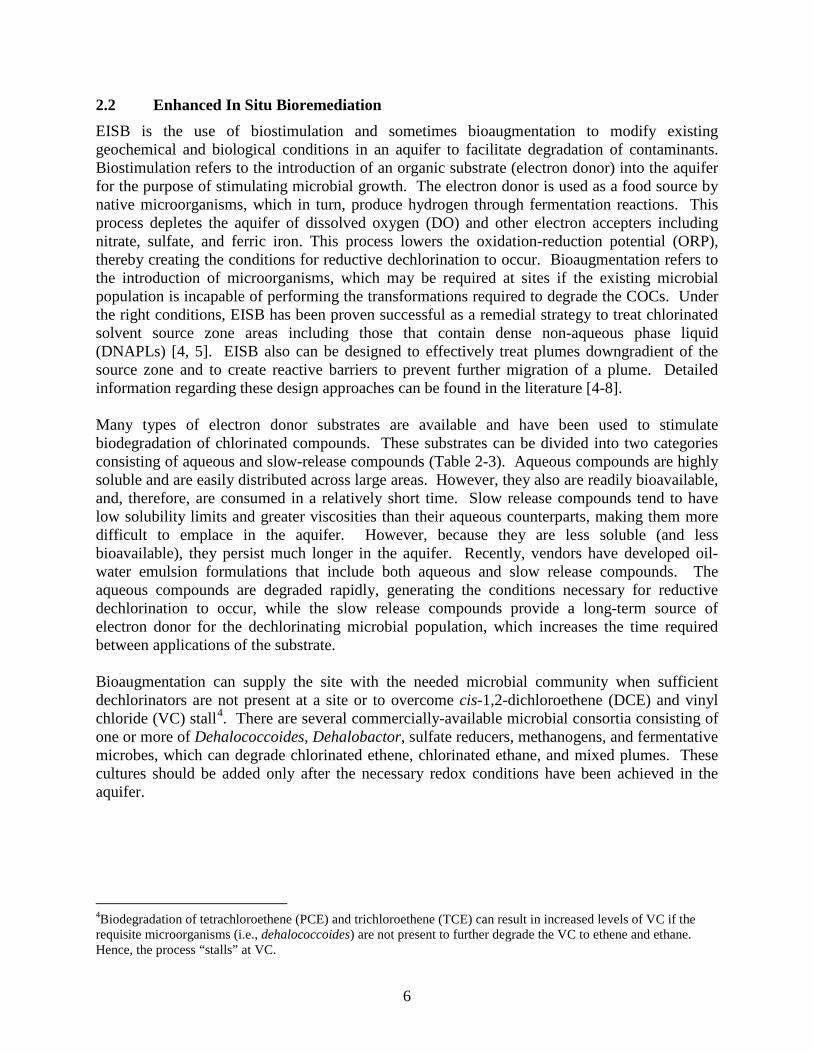
2.2 Enhanced In Situ Bioremediation EISB is the use of biostimulation and sometimes bioaugmentation to modify existing geochemical and biological conditions in an aquifer to facilitate degradation of contaminants. Biostimulation refers to the introduction of an organic substrate (electron donor) into the aquifer for the purpose of stimulating microbial growth. The electron donor is used as a food source by native microorganisms, which in turn, produce hydrogen through fermentation reactions. This process depletes the aquifer of dissolved oxygen (DO) and other electron accepters including nitrate, sulfate, and ferric iron. This process lowers the oxidation-reduction potential (ORP), thereby creating the conditions for reductive dechlorination to occur. Bioaugmentation refers to the introduction of microorganisms, which may be required at sites if the existing microbial population is incapable of performing the transformations required to degrade the COCs. Under the right conditions, EISB has been proven successful as a remedial strategy to treat chlorinated solvent source zone areas including those that contain dense non-aqueous phase liquid (DNAPLs) [4, 5]. EISB also can be designed to effectively treat plumes downgradient of the source zone and to create reactive barriers to prevent further migration of a plume. Detailed information regarding these design approaches can be found in the literature [4-8]. Many types of electron donor substrates are available and have been used to stimulate biodegradation of chlorinated compounds. These substrates can be divided into two categories consisting of aqueous and slow-release compounds (Table 2-3). Aqueous compounds are highly soluble and are easily distributed across large areas. However, they also are readily bioavailable, and, therefore, are consumed in a relatively short time. Slow release compounds tend to have low solubility limits and greater viscosities than their aqueous counterparts, making them more difficult to emplace in the aquifer. However, because they are less soluble (and less bioavailable), they persist much longer in the aquifer. Recently, vendors have developed oil-water emulsion formulations that include both aqueous and slow release compounds. The aqueous compounds are degraded rapidly, generating the conditions necessary for reductive dechlorination to occur, while the slow release compounds provide a long-term source of electron donor for the dechlorinating microbial population, which increases the time required between applications of the substrate. Bioaugmentation can supply the site with the needed microbial community when sufficient dechlorinators are not present at a site or to overcome cis-1,2-dichloroethene (DCE) and vinyl chloride (VC) stall4. There are several commercially-available microbial consortia consisting of one or more of Dehalococcoides, Dehalobactor, sulfate reducers, methanogens, and fermentative microbes, which can degrade chlorinated ethene, chlorinated ethane, and mixed plumes. These cultures should be added only after the necessary redox conditions have been achieved in the aquifer.
4Biodegradation of tetrachloroethene (PCE) and trichloroethene (TCE) can result in increased levels of VC if the requisite microorganisms (i.e., dehalococcoides) are not present to further degrade the VC to ethene and ethane. Hence, the process “stalls” at VC.
7
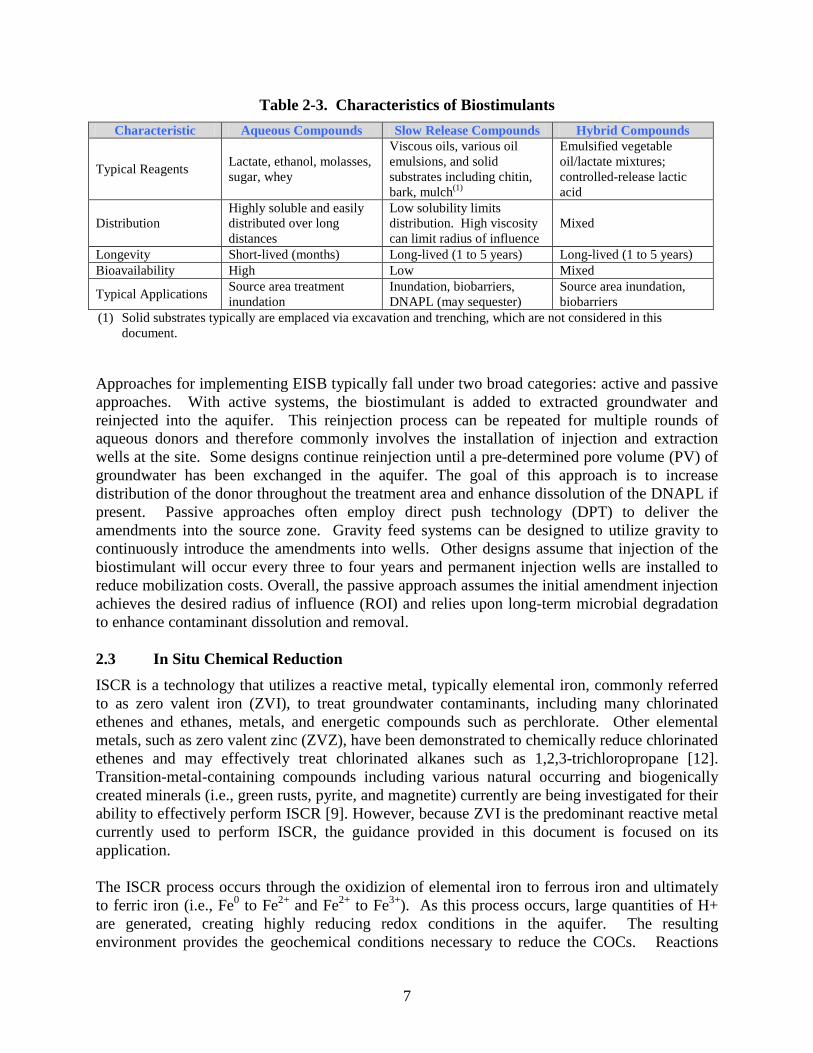
Table 2-3. Characteristics of Biostimulants Characteristic Aqueous Compounds Slow Release Compounds Hybrid Compounds
Typical Reagents Lactate, ethanol, molasses, sugar, whey
Viscous oils, various oil emulsions, and solid substrates including chitin, bark, mulch(1)
Emulsified vegetable oil/lactate mixtures; controlled-release lactic acid
Distribution Highly soluble and easily distributed over long distances
Low solubility limits distribution. High viscosity can limit radius of influence
Mixed
Longevity Short-lived (months) Long-lived (1 to 5 years) Long-lived (1 to 5 years) Bioavailability High Low Mixed
Typical Applications Source area treatment inundation
Inundation, biobarriers, DNAPL (may sequester)
Source area inundation, biobarriers
(1) Solid substrates typically are emplaced via excavation and trenching, which are not considered in this document.
Approaches for implementing EISB typically fall under two broad categories: active and passive approaches. With active systems, the biostimulant is added to extracted groundwater and reinjected into the aquifer. This reinjection process can be repeated for multiple rounds of aqueous donors and therefore commonly involves the installation of injection and extraction wells at the site. Some designs continue reinjection until a pre-determined pore volume (PV) of groundwater has been exchanged in the aquifer. The goal of this approach is to increase distribution of the donor throughout the treatment area and enhance dissolution of the DNAPL if present. Passive approaches often employ direct push technology (DPT) to deliver the amendments into the source zone. Gravity feed systems can be designed to utilize gravity to continuously introduce the amendments into wells. Other designs assume that injection of the biostimulant will occur every three to four years and permanent injection wells are installed to reduce mobilization costs. Overall, the passive approach assumes the initial amendment injection achieves the desired radius of influence (ROI) and relies upon long-term microbial degradation to enhance contaminant dissolution and removal. 2.3 In Situ Chemical Reduction ISCR is a technology that utilizes a reactive metal, typically elemental iron, commonly referred to as zero valent iron (ZVI), to treat groundwater contaminants, including many chlorinated ethenes and ethanes, metals, and energetic compounds such as perchlorate. Other elemental metals, such as zero valent zinc (ZVZ), have been demonstrated to chemically reduce chlorinated ethenes and may effectively treat chlorinated alkanes such as 1,2,3-trichloropropane [12]. Transition-metal-containing compounds including various natural occurring and biogenically created minerals (i.e., green rusts, pyrite, and magnetite) currently are being investigated for their ability to effectively perform ISCR [9]. However, because ZVI is the predominant reactive metal currently used to perform ISCR, the guidance provided in this document is focused on its application. The ISCR process occurs through the oxidizion of elemental iron to ferrous iron and ultimately to ferric iron (i.e., Fe0 to Fe2+ and Fe2+ to Fe3+). As this process occurs, large quantities of H+ are generated, creating highly reducing redox conditions in the aquifer. The resulting environment provides the geochemical conditions necessary to reduce the COCs. Reactions
8
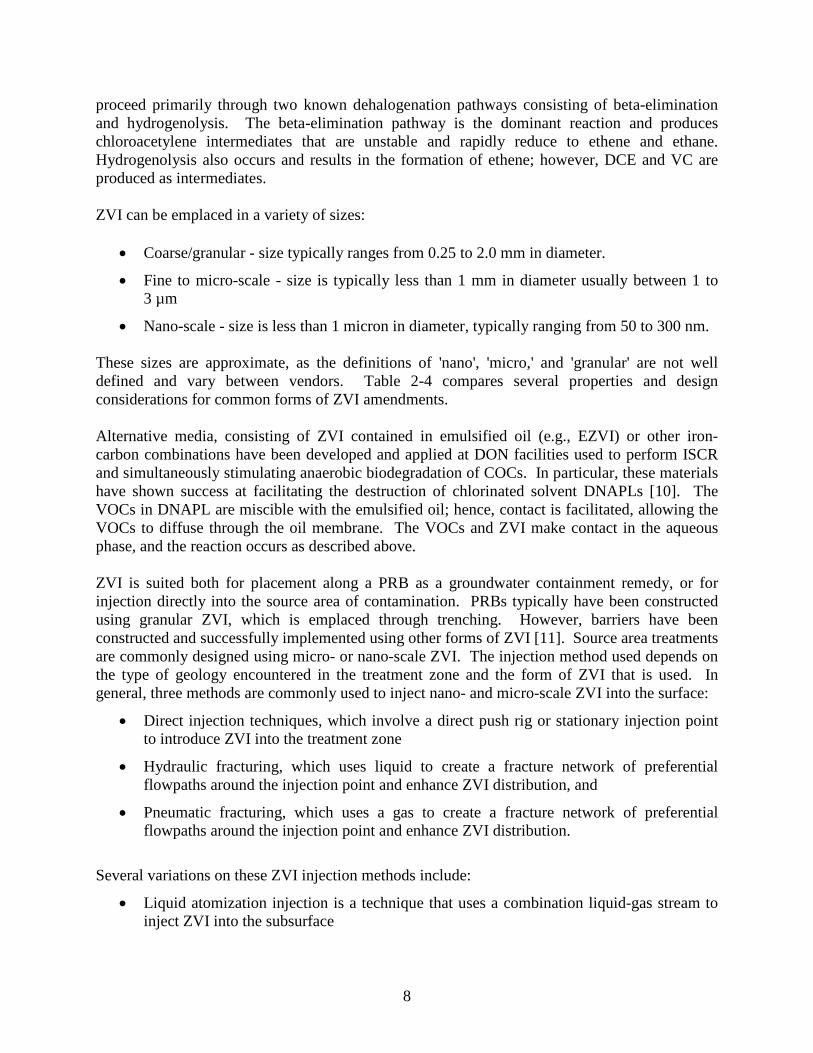
proceed primarily through two known dehalogenation pathways consisting of beta-elimination and hydrogenolysis. The beta-elimination pathway is the dominant reaction and produces chloroacetylene intermediates that are unstable and rapidly reduce to ethene and ethane. Hydrogenolysis also occurs and results in the formation of ethene; however, DCE and VC are produced as intermediates. ZVI can be emplaced in a variety of sizes:
• Coarse/granular - size typically ranges from 0.25 to 2.0 mm in diameter.
• Fine to micro-scale - size is typically less than 1 mm in diameter usually between 1 to 3 µm
• Nano-scale - size is less than 1 micron in diameter, typically ranging from 50 to 300 nm. These sizes are approximate, as the definitions of 'nano', 'micro,' and 'granular' are not well defined and vary between vendors. Table 2-4 compares several properties and design considerations for common forms of ZVI amendments. Alternative media, consisting of ZVI contained in emulsified oil (e.g., EZVI) or other iron-carbon combinations have been developed and applied at DON facilities used to perform ISCR and simultaneously stimulating anaerobic biodegradation of COCs. In particular, these materials have shown success at facilitating the destruction of chlorinated solvent DNAPLs [10]. The VOCs in DNAPL are miscible with the emulsified oil; hence, contact is facilitated, allowing the VOCs to diffuse through the oil membrane. The VOCs and ZVI make contact in the aqueous phase, and the reaction occurs as described above. ZVI is suited both for placement along a PRB as a groundwater containment remedy, or for injection directly into the source area of contamination. PRBs typically have been constructed using granular ZVI, which is emplaced through trenching. However, barriers have been constructed and successfully implemented using other forms of ZVI [11]. Source area treatments are commonly designed using micro- or nano-scale ZVI. The injection method used depends on the type of geology encountered in the treatment zone and the form of ZVI that is used. In general, three methods are commonly used to inject nano- and micro-scale ZVI into the surface:
• Direct injection techniques, which involve a direct push rig or stationary injection point to introduce ZVI into the treatment zone
• Hydraulic fracturing, which uses liquid to create a fracture network of preferential flowpaths around the injection point and enhance ZVI distribution, and
• Pneumatic fracturing, which uses a gas to create a fracture network of preferential flowpaths around the injection point and enhance ZVI distribution.
Several variations on these ZVI injection methods include:
• Liquid atomization injection is a technique that uses a combination liquid-gas stream to inject ZVI into the subsurface
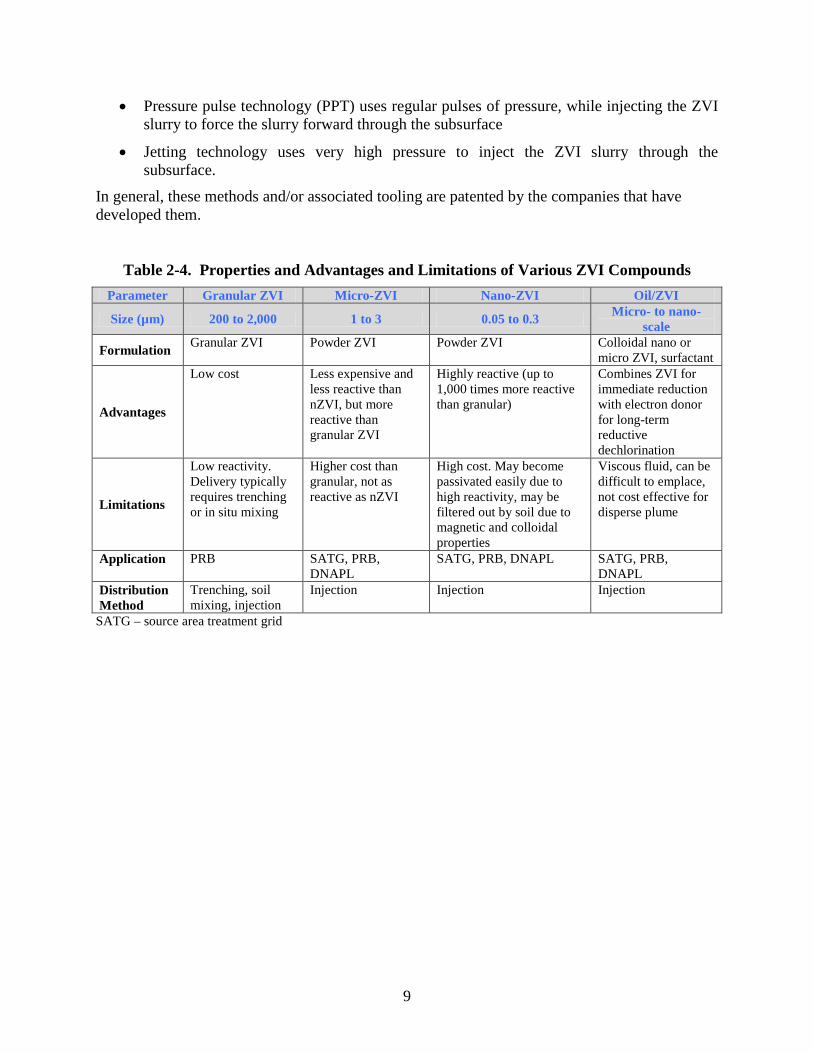
9
• Pressure pulse technology (PPT) uses regular pulses of pressure, while injecting the ZVI slurry to force the slurry forward through the subsurface
• Jetting technology uses very high pressure to inject the ZVI slurry through the subsurface.
In general, these methods and/or associated tooling are patented by the companies that have developed them.
Table 2-4. Properties and Advantages and Limitations of Various ZVI Compounds Parameter Granular ZVI Micro-ZVI Nano-ZVI Oil/ZVI
Size (µm) 200 to 2,000 1 to 3 0.05 to 0.3 Micro- to nano-scale
Formulation Granular ZVI Powder ZVI Powder ZVI Colloidal nano or micro ZVI, surfactant
Advantages
Low cost Less expensive and less reactive than nZVI, but more reactive than granular ZVI
Highly reactive (up to 1,000 times more reactive than granular)
Combines ZVI for immediate reduction with electron donor for long-term reductive dechlorination
Limitations
Low reactivity. Delivery typically requires trenching or in situ mixing
Higher cost than granular, not as reactive as nZVI
High cost. May become passivated easily due to high reactivity, may be filtered out by soil due to magnetic and colloidal properties
Viscous fluid, can be difficult to emplace, not cost effective for disperse plume
Application PRB SATG, PRB, DNAPL
SATG, PRB, DNAPL SATG, PRB, DNAPL
Distribution Method
Trenching, soil mixing, injection
Injection Injection Injection
SATG – source area treatment grid
10
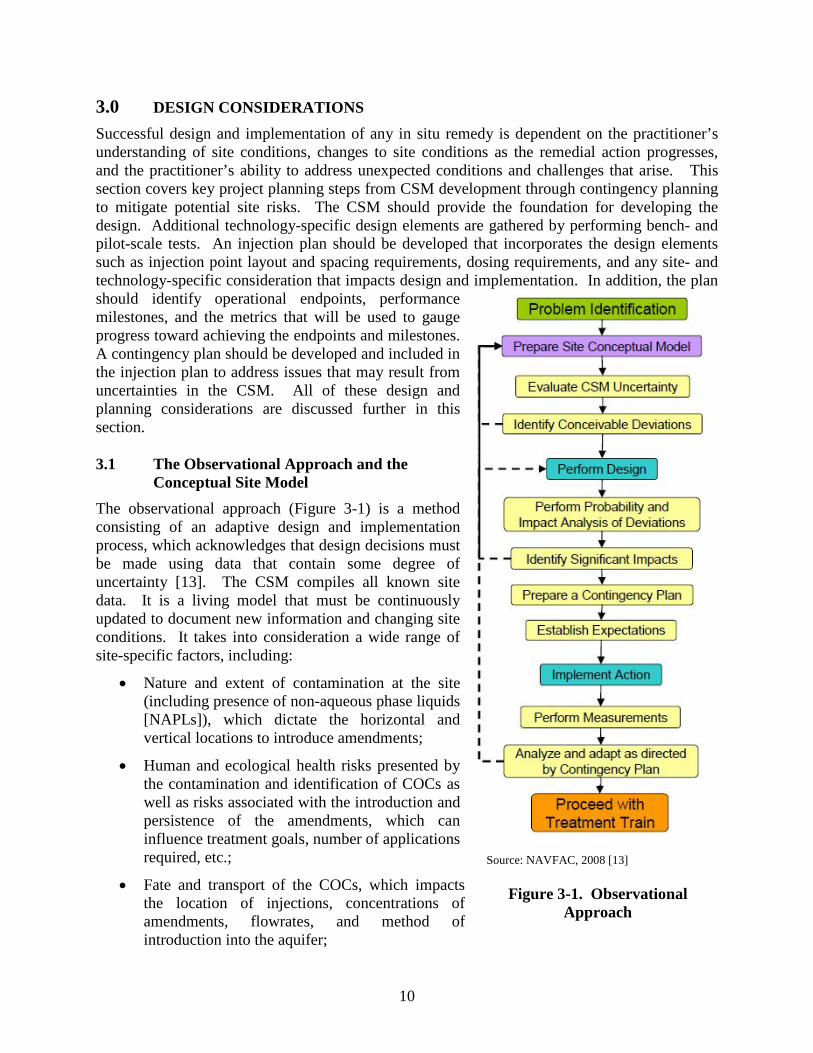
3.0 DESIGN CONSIDERATIONS Successful design and implementation of any in situ remedy is dependent on the practitioner’s understanding of site conditions, changes to site conditions as the remedial action progresses, and the practitioner’s ability to address unexpected conditions and challenges that arise. This section covers key project planning steps from CSM development through contingency planning to mitigate potential site risks. The CSM should provide the foundation for developing the design. Additional technology-specific design elements are gathered by performing bench- and pilot-scale tests. An injection plan should be developed that incorporates the design elements such as injection point layout and spacing requirements, dosing requirements, and any site- and technology-specific consideration that impacts design and implementation. In addition, the plan should identify operational endpoints, performance milestones, and the metrics that will be used to gauge progress toward achieving the endpoints and milestones. A contingency plan should be developed and included in the injection plan to address issues that may result from uncertainties in the CSM. All of these design and planning considerations are discussed further in this section. 3.1 The Observational Approach and the
Conceptual Site Model The observational approach (Figure 3-1) is a method consisting of an adaptive design and implementation process, which acknowledges that design decisions must be made using data that contain some degree of uncertainty [13]. The CSM compiles all known site data. It is a living model that must be continuously updated to document new information and changing site conditions. It takes into consideration a wide range of site-specific factors, including:
• Nature and extent of contamination at the site (including presence of non-aqueous phase liquids [NAPLs]), which dictate the horizontal and vertical locations to introduce amendments;
• Human and ecological health risks presented by the contamination and identification of COCs as well as risks associated with the introduction and persistence of the amendments, which can influence treatment goals, number of applications required, etc.;
• Fate and transport of the COCs, which impacts the location of injections, concentrations of amendments, flowrates, and method of introduction into the aquifer;
Figure 3-1. Observational Approach
Source: NAVFAC, 2008 [13]
11
• Site-specific infrastructure and characteristics (urban vs. rural environment, presence of buildings and utilities, proximity to nearby receptors, current and future land use, etc.), which influence injection locations and overall strategy;
• Lithology (lithologic units, heterogeneities, grain size, permeability, presence of bedrock, etc.) and hydrogeology (gradients, confined or unconfined conditions, saturated thickness, conductivities, etc.), which are key factors to determine the approach that will be used to introduce the amendments into the aquifer.
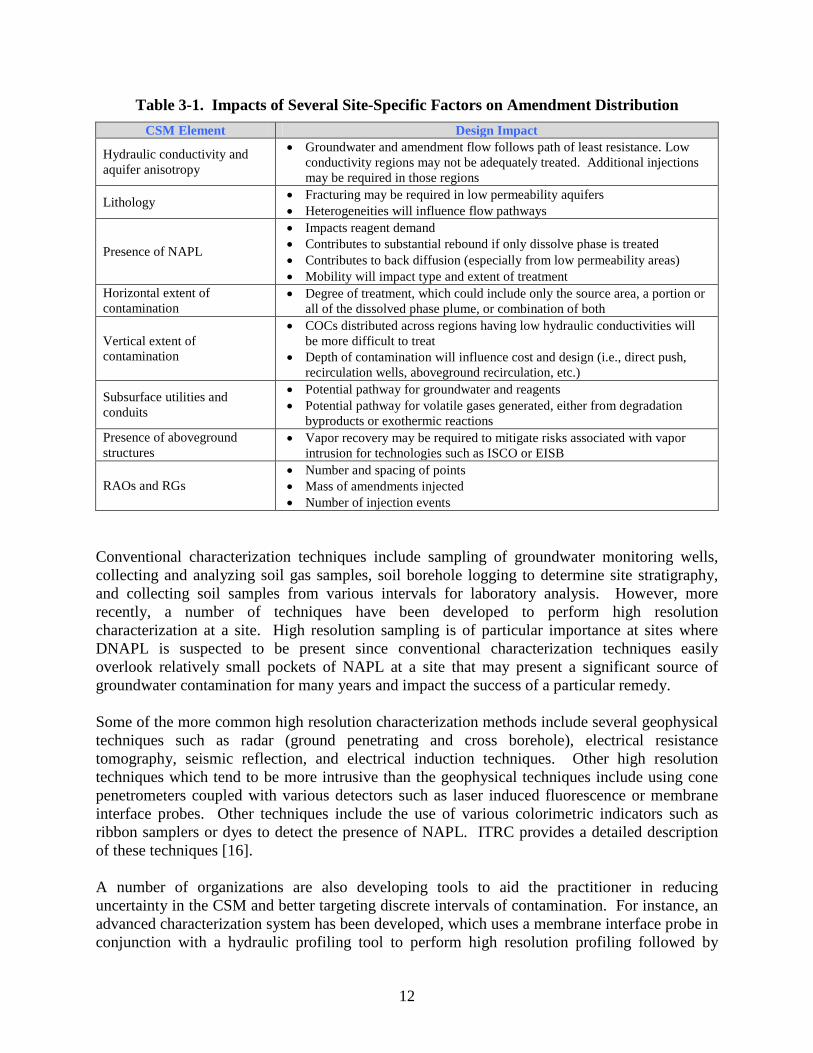
It is particularly important to have a thorough understanding of the CSM when designing and applying in situ treatment technologies. A detailed understanding of geochemical and lithologic characteristics of the site, flow and mass transport, and transformation and retardation of contaminants and the proposed amendments is required to ensure adequate distribution and contact of the amendments with the COCs. Failure to address these components in the design can have a negative impact on technology performance. For instance, at NAS Pensacola, at a site treated using iron-activated hydrogen peroxide, site geochemistry was not incorporated into the design. As a result of high iron levels in the groundwater resulting from an abnormally low groundwater pH, once the peroxide was injected into the aquifer, the reaction proceeded very quickly in the immediate vicinity of the well and the peroxide was consumed without achieving the design ROI. After further evaluation of the site geochemistry, the reagent and catalyst were modified to account for the high ferrous iron in groundwater. The subsequent oxidation treatments with Fenton’s reagent were deemed successful. Areas of uncertainty identified in the CSM must be determined and key data gaps may be addressed through additional characterization and bench- and pilot-scale tests as necessary. The CSM is used to further refine the problem statement (e.g., TCE concentrations in groundwater greater than 50 µg/L present a risk to human health via vapor intrusion). The initial design is based on the most probable site conditions as determined from the CSM, but contingencies for conceivable deviations must be developed and incorporated into a plan to mitigate them. Performance objectives and treatment milestones are established. The remedial action is implemented and adapted based on real-time observations and measurements following mitigation strategies presented in the contingency plan. The outputs from this process result in further updates to the CSM, new uncertainties, and potential impacts and updates to the contingency plan. Additional discussion of the observational approach can be found in Siegrist et al. (2011) and ITRC (2005) [2, 3]. Additional information and guidance for the development of CSMs and selecting an appropriate remedy is available from a number of Federal sources such as the Naval Facilities Engineering Command [14] and ITRC [15]. Assuming that the CSM demonstrates that introduction of liquid or solid amendments is appropriate, there are a number of elements of the CSM that require specific consideration to develop the remedial design. These are highlighted in Table 3-1.
12
Table 3-1. Impacts of Several Site-Specific Factors on Amendment Distribution CSM Element Design Impact
Hydraulic conductivity and aquifer anisotropy
• Groundwater and amendment flow follows path of least resistance. Low conductivity regions may not be adequately treated. Additional injections may be required in those regions
Lithology • Fracturing may be required in low permeability aquifers • Heterogeneities will influence flow pathways
Presence of NAPL
• Impacts reagent demand • Contributes to substantial rebound if only dissolve phase is treated • Contributes to back diffusion (especially from low permeability areas) • Mobility will impact type and extent of treatment
Horizontal extent of contamination
• Degree of treatment, which could include only the source area, a portion or all of the dissolved phase plume, or combination of both
Vertical extent of contamination
• COCs distributed across regions having low hydraulic conductivities will be more difficult to treat
• Depth of contamination will influence cost and design (i.e., direct push, recirculation wells, aboveground recirculation, etc.)
Subsurface utilities and conduits
• Potential pathway for groundwater and reagents • Potential pathway for volatile gases generated, either from degradation
byproducts or exothermic reactions Presence of aboveground structures
• Vapor recovery may be required to mitigate risks associated with vapor intrusion for technologies such as ISCO or EISB
RAOs and RGs • Number and spacing of points • Mass of amendments injected • Number of injection events
Conventional characterization techniques include sampling of groundwater monitoring wells, collecting and analyzing soil gas samples, soil borehole logging to determine site stratigraphy, and collecting soil samples from various intervals for laboratory analysis. However, more recently, a number of techniques have been developed to perform high resolution characterization at a site. High resolution sampling is of particular importance at sites where DNAPL is suspected to be present since conventional characterization techniques easily overlook relatively small pockets of NAPL at a site that may present a significant source of groundwater contamination for many years and impact the success of a particular remedy. Some of the more common high resolution characterization methods include several geophysical techniques such as radar (ground penetrating and cross borehole), electrical resistance tomography, seismic reflection, and electrical induction techniques. Other high resolution techniques which tend to be more intrusive than the geophysical techniques include using cone penetrometers coupled with various detectors such as laser induced fluorescence or membrane interface probes. Other techniques include the use of various colorimetric indicators such as ribbon samplers or dyes to detect the presence of NAPL. ITRC provides a detailed description of these techniques [16]. A number of organizations are also developing tools to aid the practitioner in reducing uncertainty in the CSM and better targeting discrete intervals of contamination. For instance, an advanced characterization system has been developed, which uses a membrane interface probe in conjunction with a hydraulic profiling tool to perform high resolution profiling followed by
13
targeted injection of amendments into discrete intervals. Various stratigraphic techniques have been developed to evaluate grain-size distribution patterns throughout the project site and maps discrete permeable layers in three dimensions (3-D). Hence, the practitioner is able to better target the application of reagents into more discrete intervals.
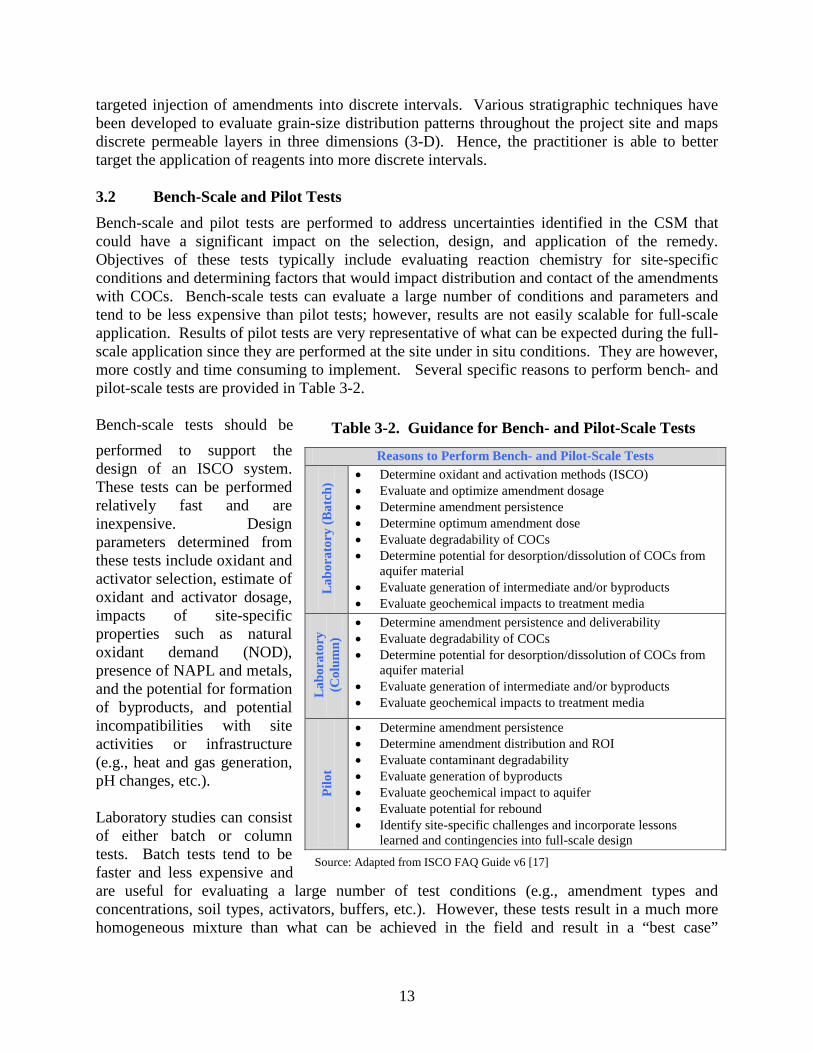
3.2 Bench-Scale and Pilot Tests Bench-scale and pilot tests are performed to address uncertainties identified in the CSM that could have a significant impact on the selection, design, and application of the remedy. Objectives of these tests typically include evaluating reaction chemistry for site-specific conditions and determining factors that would impact distribution and contact of the amendments with COCs. Bench-scale tests can evaluate a large number of conditions and parameters and tend to be less expensive than pilot tests; however, results are not easily scalable for full-scale application. Results of pilot tests are very representative of what can be expected during the full-scale application since they are performed at the site under in situ conditions. They are however, more costly and time consuming to implement. Several specific reasons to perform bench- and pilot-scale tests are provided in Table 3-2. Bench-scale tests should be performed to support the design of an ISCO system. These tests can be performed relatively fast and are inexpensive. Design parameters determined from these tests include oxidant and activator selection, estimate of oxidant and activator dosage, impacts of site-specific properties such as natural oxidant demand (NOD), presence of NAPL and metals, and the potential for formation of byproducts, and potential incompatibilities with site activities or infrastructure (e.g., heat and gas generation, pH changes, etc.). Laboratory studies can consist of either batch or column tests. Batch tests tend to be faster and less expensive and are useful for evaluating a large number of test conditions (e.g., amendment types and concentrations, soil types, activators, buffers, etc.). However, these tests result in a much more homogeneous mixture than what can be achieved in the field and result in a “best case”
Reasons to Perform Bench- and Pilot-Scale Tests
Labo
rato
ry (B
atch
) • Determine oxidant and activation methods (ISCO) • Evaluate and optimize amendment dosage • Determine amendment persistence • Determine optimum amendment dose • Evaluate degradability of COCs • Determine potential for desorption/dissolution of COCs from
aquifer material • Evaluate generation of intermediate and/or byproducts • Evaluate geochemical impacts to treatment media
Labo
rato
ry
(Col
umn)
• Determine amendment persistence and deliverability • Evaluate degradability of COCs • Determine potential for desorption/dissolution of COCs from
aquifer material • Evaluate generation of intermediate and/or byproducts • Evaluate geochemical impacts to treatment media
Pilo
t
• Determine amendment persistence • Determine amendment distribution and ROI • Evaluate contaminant degradability • Evaluate generation of byproducts • Evaluate geochemical impact to aquifer • Evaluate potential for rebound • Identify site-specific challenges and incorporate lessons
learned and contingencies into full-scale design Source: Adapted from ISCO FAQ Guide v6 [17]
Table 3-2. Guidance for Bench- and Pilot-Scale Tests
14
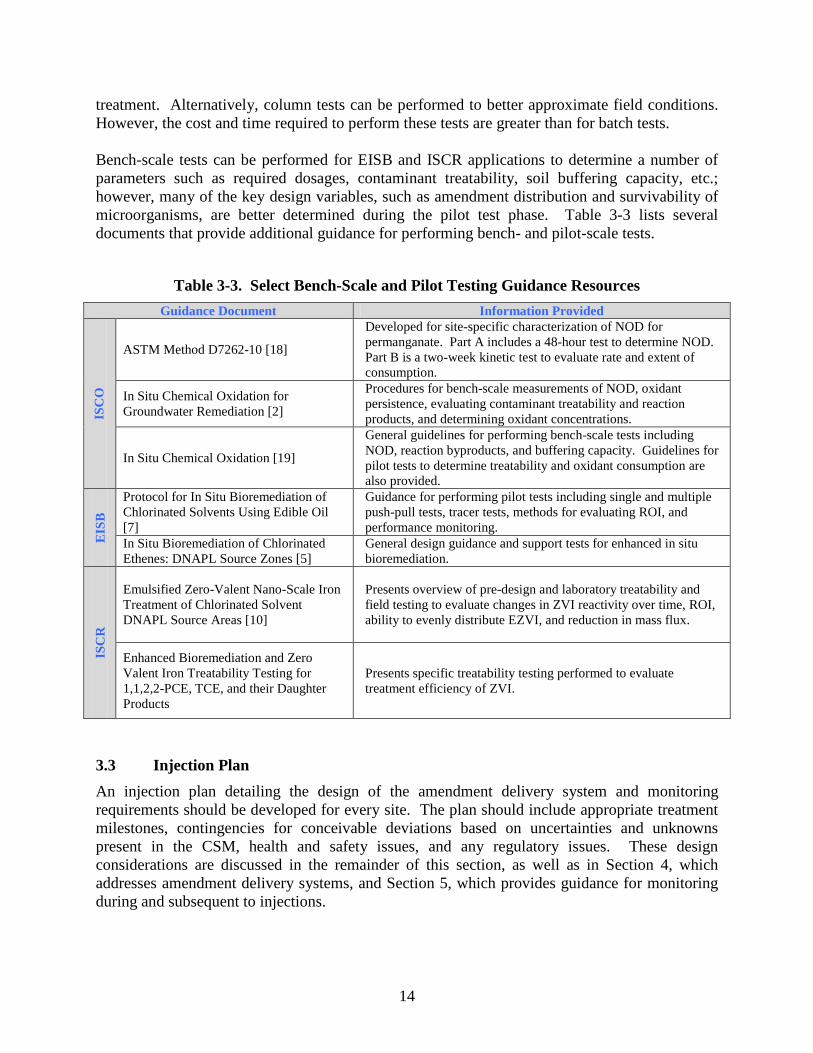
treatment. Alternatively, column tests can be performed to better approximate field conditions. However, the cost and time required to perform these tests are greater than for batch tests. Bench-scale tests can be performed for EISB and ISCR applications to determine a number of parameters such as required dosages, contaminant treatability, soil buffering capacity, etc.; however, many of the key design variables, such as amendment distribution and survivability of microorganisms, are better determined during the pilot test phase. Table 3-3 lists several documents that provide additional guidance for performing bench- and pilot-scale tests.
Table 3-3. Select Bench-Scale and Pilot Testing Guidance Resources Guidance Document Information Provided
ISC
O
ASTM Method D7262-10 [18]
Developed for site-specific characterization of NOD for permanganate. Part A includes a 48-hour test to determine NOD. Part B is a two-week kinetic test to evaluate rate and extent of consumption.
In Situ Chemical Oxidation for Groundwater Remediation [2]
Procedures for bench-scale measurements of NOD, oxidant persistence, evaluating contaminant treatability and reaction products, and determining oxidant concentrations.
In Situ Chemical Oxidation [19]
General guidelines for performing bench-scale tests including NOD, reaction byproducts, and buffering capacity. Guidelines for pilot tests to determine treatability and oxidant consumption are also provided.
EISB
Protocol for In Situ Bioremediation of Chlorinated Solvents Using Edible Oil [7]
Guidance for performing pilot tests including single and multiple push-pull tests, tracer tests, methods for evaluating ROI, and performance monitoring.
In Situ Bioremediation of Chlorinated Ethenes: DNAPL Source Zones [5]
General design guidance and support tests for enhanced in situ bioremediation.
ISC
R
Emulsified Zero-Valent Nano-Scale Iron Treatment of Chlorinated Solvent DNAPL Source Areas [10]
Presents overview of pre-design and laboratory treatability and field testing to evaluate changes in ZVI reactivity over time, ROI, ability to evenly distribute EZVI, and reduction in mass flux.
Enhanced Bioremediation and Zero Valent Iron Treatability Testing for 1,1,2,2-PCE, TCE, and their Daughter Products
Presents specific treatability testing performed to evaluate treatment efficiency of ZVI.
3.3 Injection Plan An injection plan detailing the design of the amendment delivery system and monitoring requirements should be developed for every site. The plan should include appropriate treatment milestones, contingencies for conceivable deviations based on uncertainties and unknowns present in the CSM, health and safety issues, and any regulatory issues. These design considerations are discussed in the remainder of this section, as well as in Section 4, which addresses amendment delivery systems, and Section 5, which provides guidance for monitoring during and subsequent to injections.
15
3.3.1 Treatment Layout
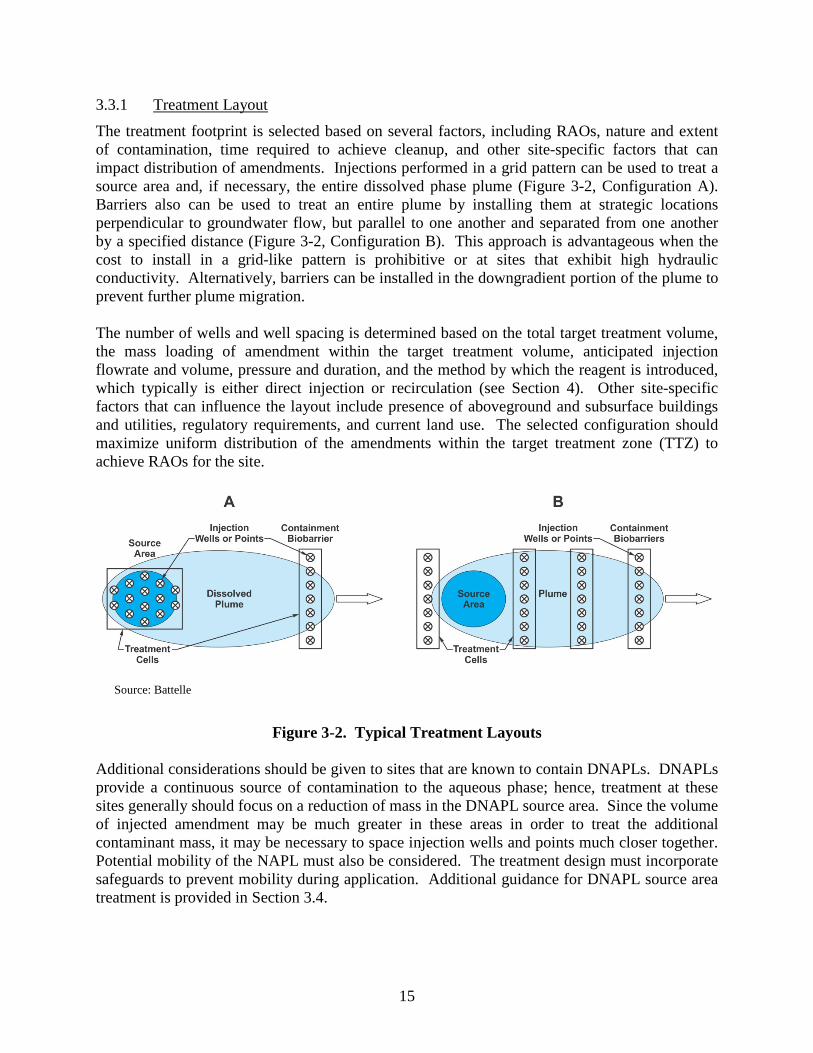
The treatment footprint is selected based on several factors, including RAOs, nature and extent of contamination, time required to achieve cleanup, and other site-specific factors that can impact distribution of amendments. Injections performed in a grid pattern can be used to treat a source area and, if necessary, the entire dissolved phase plume (Figure 3-2, Configuration A). Barriers also can be used to treat an entire plume by installing them at strategic locations perpendicular to groundwater flow, but parallel to one another and separated from one another by a specified distance (Figure 3-2, Configuration B). This approach is advantageous when the cost to install in a grid-like pattern is prohibitive or at sites that exhibit high hydraulic conductivity. Alternatively, barriers can be installed in the downgradient portion of the plume to prevent further plume migration. The number of wells and well spacing is determined based on the total target treatment volume, the mass loading of amendment within the target treatment volume, anticipated injection flowrate and volume, pressure and duration, and the method by which the reagent is introduced, which typically is either direct injection or recirculation (see Section 4). Other site-specific factors that can influence the layout include presence of aboveground and subsurface buildings and utilities, regulatory requirements, and current land use. The selected configuration should maximize uniform distribution of the amendments within the target treatment zone (TTZ) to achieve RAOs for the site.
Figure 3-2. Typical Treatment Layouts Additional considerations should be given to sites that are known to contain DNAPLs. DNAPLs provide a continuous source of contamination to the aqueous phase; hence, treatment at these sites generally should focus on a reduction of mass in the DNAPL source area. Since the volume of injected amendment may be much greater in these areas in order to treat the additional contaminant mass, it may be necessary to space injection wells and points much closer together. Potential mobility of the NAPL must also be considered. The treatment design must incorporate safeguards to prevent mobility during application. Additional guidance for DNAPL source area treatment is provided in Section 3.4.
Source: Battelle
16
3.3.2 Amendment Dosing and Longevity
Dosing of reagents and substrates must consider the volume, concentration, and frequency of introductions into the aquifer. Insufficient loading rates increase the probability that the amendments will not be adequately distributed and reduce the likelihood of achieving RAOs. Conversely, excess amendments can create undesirable changes in the aquifer (i.e., plugging the formation with insoluble reaction products, uncontrolled fermentation reactions that reduce the pH of the aquifer to a level not optimum for reductive dechlorination, etc.), which can compromise the efficacy of the remedy. Required mass loadings, flowrates, and concentrations are highly dependent on the in situ technology used as well as the specific amendment(s) used. For instance, at ISCO sites, research and experience indicate that increasing oxidant volume by increasing the flowrate will more effectively distribute reagents than increasing the volume by increasing injection duration since less oxidant will react nonproductively with aquifer media [17]. Conversely, at sites where EISB is applied, it may be more effective to inject using lower flowrates for longer periods to minimize the potential for creating preferential pathways since the reaction kinetics are much slower. The first step in determining appropriate amendment dosing is to calculate the target treatment volume, which is based on the TTZ area, the saturated zone thickness, and the porosity of the aquifer material. The practitioner must then consider many site- and application-specific factors such as aquifer properties like total organic carbon (TOC), hydraulic conductivity, anisotropy; chemical and physical properties of the amendments including viscosity, density, solubility, sorption coefficients, etc.; reaction kinetics and thermodynamics of the system; and the practitioner’s experience applying amendments at other sites. In general, it is recommended that bench-scale tests be performed to test proposed dosages, evaluate reaction kinetics and byproducts, and determine any other technology- and amendment-specific parameters that may be required. Results of these tests are used to determine optimal amendment concentration and the percentage of the PV in the TTZ that will be treated, which can range from a fraction of a PV to greater than 100% depending on the amendment and the injection design. As a result of the number of variables and complexities, the final design often relies to a large extent on the practitioner’s experience and lessons learned at previous sites. Table 3-4 provides a summary of some recommended practices and lessons learned for determining dosages of commonly used reagents and substrates. There also are a variety of guidance documents available for the design and application of these technologies. Several useful references include:
• In Situ Chemical Oxidation for Groundwater Remediation [2]
• Technical and Regulatory Guidance for In Situ Chemical Oxidation of Contaminated Soil and Groundwater [3]
• Delivery and Mixing in the Subsurface: Processes and Design Principles for in Situ Remediation [20]
• Loading Rates and Impacts of Substrate Delivery for Enhanced Anaerobic Bioremediation [21]
• In Situ Bioremediation of Chlorinated Ethene: DNAPL Source Zones [5]
• Protocol for In Situ Bioremediation of Chlorinated Solvents Using Edible Oil [7]
17
• Emulsified Zero-Valent Nano-Scale Iron Treatment of Chlorinated Solvent DNAPL Source Areas [10]
• PRBs: Lessons Learned and New Directions [22] In addition, several design tools are available to aid the practitioner on developing an injection plan; the tools have been developed through sponsorships with organizations such as Strategic Environmental and Research Development Program (SERDP) and Environmental Security Technology Certification Program (ESTCP) [23, 24] and by others to support application of various products [25].
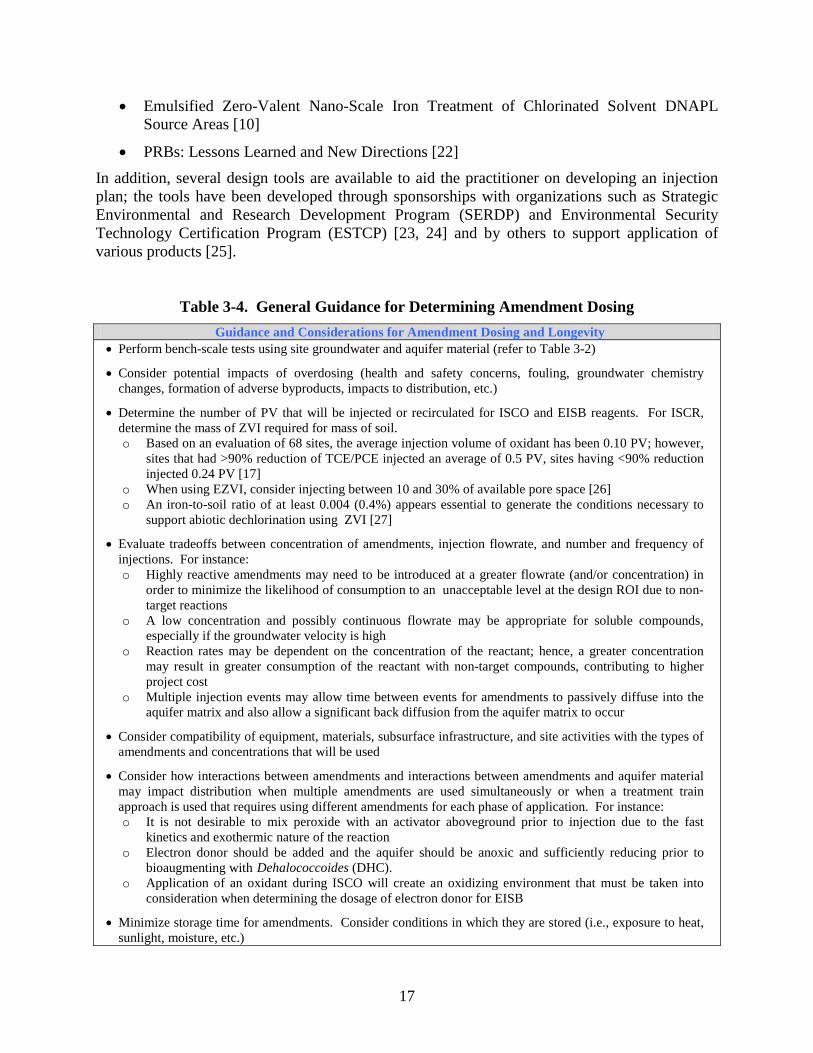
Table 3-4. General Guidance for Determining Amendment Dosing Guidance and Considerations for Amendment Dosing and Longevity
• Perform bench-scale tests using site groundwater and aquifer material (refer to Table 3-2)
• Consider potential impacts of overdosing (health and safety concerns, fouling, groundwater chemistry changes, formation of adverse byproducts, impacts to distribution, etc.)
• Determine the number of PV that will be injected or recirculated for ISCO and EISB reagents. For ISCR, determine the mass of ZVI required for mass of soil. o Based on an evaluation of 68 sites, the average injection volume of oxidant has been 0.10 PV; however,
sites that had >90% reduction of TCE/PCE injected an average of 0.5 PV, sites having <90% reduction injected 0.24 PV [17]
o When using EZVI, consider injecting between 10 and 30% of available pore space [26] o An iron-to-soil ratio of at least 0.004 (0.4%) appears essential to generate the conditions necessary to
support abiotic dechlorination using ZVI [27]
• Evaluate tradeoffs between concentration of amendments, injection flowrate, and number and frequency of injections. For instance: o Highly reactive amendments may need to be introduced at a greater flowrate (and/or concentration) in
order to minimize the likelihood of consumption to an unacceptable level at the design ROI due to non-target reactions
o A low concentration and possibly continuous flowrate may be appropriate for soluble compounds, especially if the groundwater velocity is high
o Reaction rates may be dependent on the concentration of the reactant; hence, a greater concentration may result in greater consumption of the reactant with non-target compounds, contributing to higher project cost
o Multiple injection events may allow time between events for amendments to passively diffuse into the aquifer matrix and also allow a significant back diffusion from the aquifer matrix to occur
• Consider compatibility of equipment, materials, subsurface infrastructure, and site activities with the types of amendments and concentrations that will be used
• Consider how interactions between amendments and interactions between amendments and aquifer material may impact distribution when multiple amendments are used simultaneously or when a treatment train approach is used that requires using different amendments for each phase of application. For instance: o It is not desirable to mix peroxide with an activator aboveground prior to injection due to the fast
kinetics and exothermic nature of the reaction o Electron donor should be added and the aquifer should be anoxic and sufficiently reducing prior to
bioaugmenting with Dehalococcoides (DHC). o Application of an oxidant during ISCO will create an oxidizing environment that must be taken into
consideration when determining the dosage of electron donor for EISB
• Minimize storage time for amendments. Consider conditions in which they are stored (i.e., exposure to heat, sunlight, moisture, etc.)
18
3.3.3 Establishing Appropriate Endpoints and Milestones for Amendment Distribution
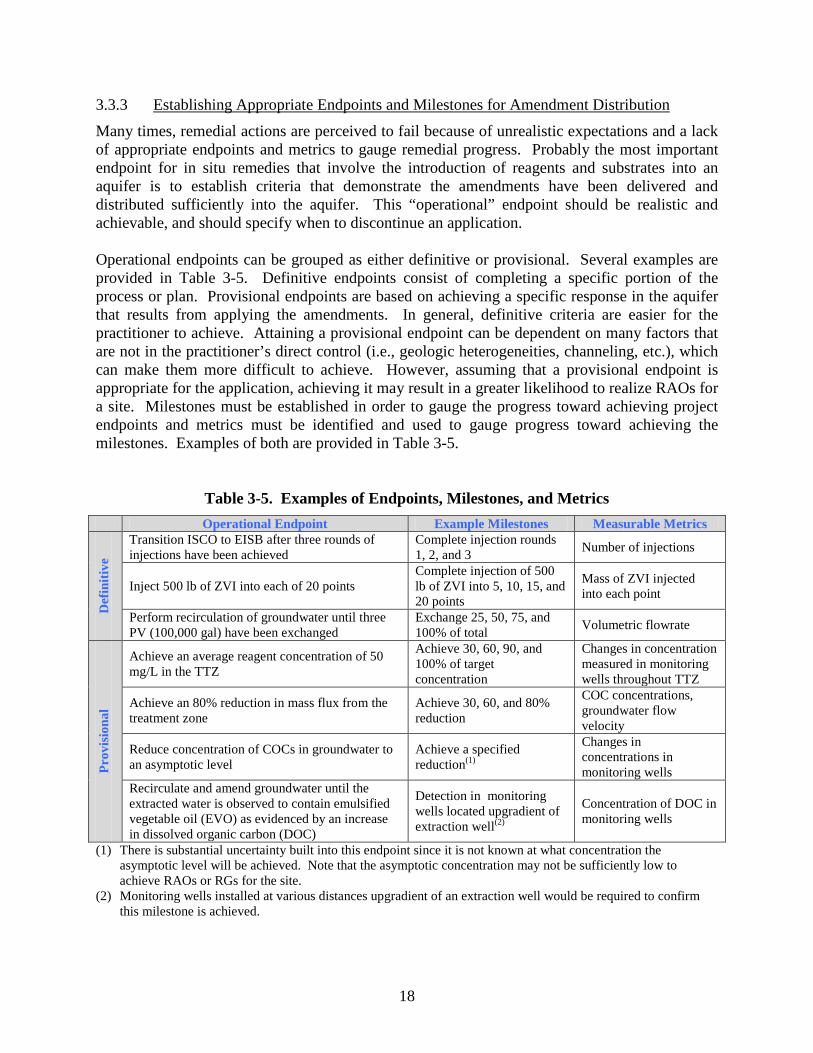
Many times, remedial actions are perceived to fail because of unrealistic expectations and a lack of appropriate endpoints and metrics to gauge remedial progress. Probably the most important endpoint for in situ remedies that involve the introduction of reagents and substrates into an aquifer is to establish criteria that demonstrate the amendments have been delivered and distributed sufficiently into the aquifer. This “operational” endpoint should be realistic and achievable, and should specify when to discontinue an application. Operational endpoints can be grouped as either definitive or provisional. Several examples are provided in Table 3-5. Definitive endpoints consist of completing a specific portion of the process or plan. Provisional endpoints are based on achieving a specific response in the aquifer that results from applying the amendments. In general, definitive criteria are easier for the practitioner to achieve. Attaining a provisional endpoint can be dependent on many factors that are not in the practitioner’s direct control (i.e., geologic heterogeneities, channeling, etc.), which can make them more difficult to achieve. However, assuming that a provisional endpoint is appropriate for the application, achieving it may result in a greater likelihood to realize RAOs for a site. Milestones must be established in order to gauge the progress toward achieving project endpoints and metrics must be identified and used to gauge progress toward achieving the milestones. Examples of both are provided in Table 3-5.
Table 3-5. Examples of Endpoints, Milestones, and Metrics Operational Endpoint Example Milestones Measurable Metrics
Def
initi
ve
Transition ISCO to EISB after three rounds of injections have been achieved
Complete injection rounds 1, 2, and 3 Number of injections
Inject 500 lb of ZVI into each of 20 points Complete injection of 500 lb of ZVI into 5, 10, 15, and 20 points
Mass of ZVI injected into each point
Perform recirculation of groundwater until three PV (100,000 gal) have been exchanged
Exchange 25, 50, 75, and 100% of total Volumetric flowrate
Prov
ision
al
Achieve an average reagent concentration of 50 mg/L in the TTZ
Achieve 30, 60, 90, and 100% of target concentration
Changes in concentration measured in monitoring wells throughout TTZ
Achieve an 80% reduction in mass flux from the treatment zone
Achieve 30, 60, and 80% reduction
COC concentrations, groundwater flow velocity
Reduce concentration of COCs in groundwater to an asymptotic level
Achieve a specified reduction(1)
Changes in concentrations in monitoring wells
Recirculate and amend groundwater until the extracted water is observed to contain emulsified vegetable oil (EVO) as evidenced by an increase in dissolved organic carbon (DOC)
Detection in monitoring wells located upgradient of extraction well(2)
Concentration of DOC in monitoring wells
(1) There is substantial uncertainty built into this endpoint since it is not known at what concentration the asymptotic level will be achieved. Note that the asymptotic concentration may not be sufficiently low to achieve RAOs or RGs for the site.
(2) Monitoring wells installed at various distances upgradient of an extraction well would be required to confirm this milestone is achieved.
19
3.4 Dense Non-Aqueous Phase Liquids The design and application of amendments are greatly impacted by the presence of DNAPL. Treatment of DNAPLs provides unique challenges, which impact the cost, performance, and time to remediate the site using these technologies. For example:
• Reactions typically occur in the aqueous phase at the DNAPL-water interface. Dissolution of the DNAPL into the aqueous phase needs to occur and is a time-consuming process.
• Potential mobilization of DNAPL during application is a concern.
• A very large mass of amendment may be required to adequately treat the DNAPL.
• Inability to accurately target DNAPLs for treatment, which therefore requires a broad application of a large mass of amendment throughout the TTZ.
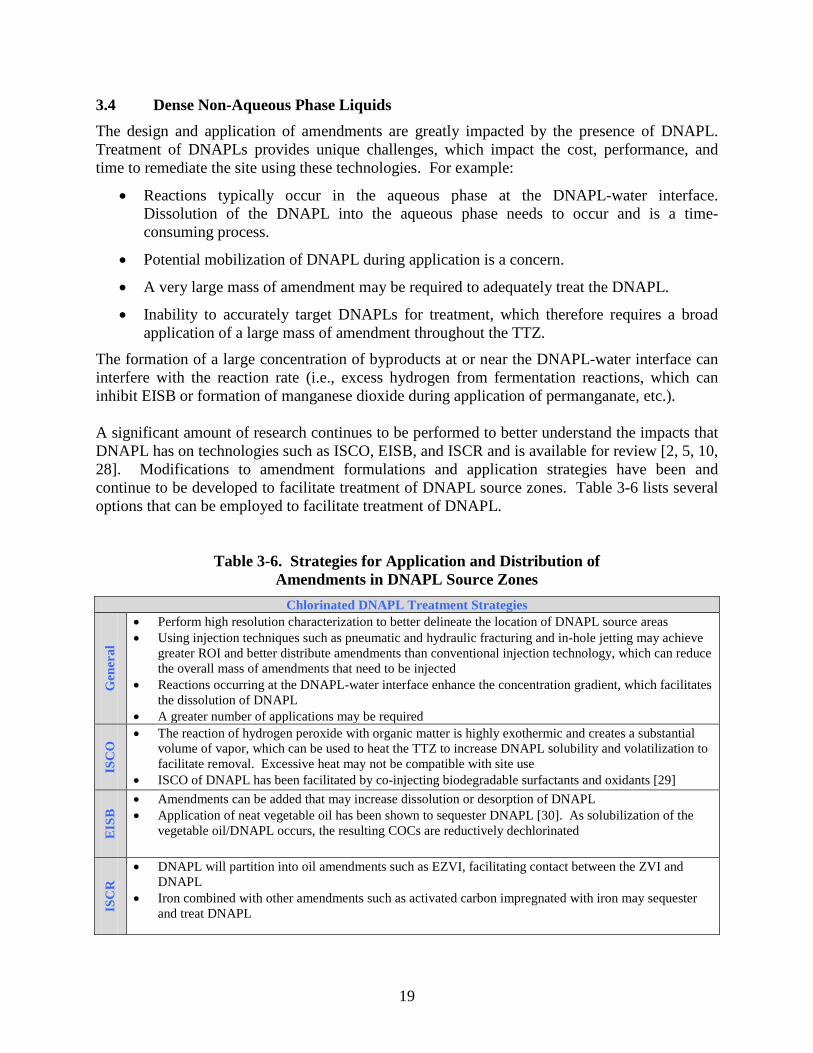
The formation of a large concentration of byproducts at or near the DNAPL-water interface can interfere with the reaction rate (i.e., excess hydrogen from fermentation reactions, which can inhibit EISB or formation of manganese dioxide during application of permanganate, etc.). A significant amount of research continues to be performed to better understand the impacts that DNAPL has on technologies such as ISCO, EISB, and ISCR and is available for review [2, 5, 10, 28]. Modifications to amendment formulations and application strategies have been and continue to be developed to facilitate treatment of DNAPL source zones. Table 3-6 lists several options that can be employed to facilitate treatment of DNAPL.
Table 3-6. Strategies for Application and Distribution of Amendments in DNAPL Source Zones
Chlorinated DNAPL Treatment Strategies
Gen
eral
• Perform high resolution characterization to better delineate the location of DNAPL source areas • Using injection techniques such as pneumatic and hydraulic fracturing and in-hole jetting may achieve
greater ROI and better distribute amendments than conventional injection technology, which can reduce the overall mass of amendments that need to be injected
• Reactions occurring at the DNAPL-water interface enhance the concentration gradient, which facilitates the dissolution of DNAPL
• A greater number of applications may be required
ISC
O • The reaction of hydrogen peroxide with organic matter is highly exothermic and creates a substantial
volume of vapor, which can be used to heat the TTZ to increase DNAPL solubility and volatilization to facilitate removal. Excessive heat may not be compatible with site use
• ISCO of DNAPL has been facilitated by co-injecting biodegradable surfactants and oxidants [29]
EIS
B • Amendments can be added that may increase dissolution or desorption of DNAPL
• Application of neat vegetable oil has been shown to sequester DNAPL [30]. As solubilization of the vegetable oil/DNAPL occurs, the resulting COCs are reductively dechlorinated
ISC
R
• DNAPL will partition into oil amendments such as EZVI, facilitating contact between the ZVI and DNAPL
• Iron combined with other amendments such as activated carbon impregnated with iron may sequester and treat DNAPL
20
3.5 Other Technology-Specific Design Considerations There are many commonalities pertaining to the design and application of amendment distribution systems for ISCO, ESB, and ISCR applications including the need to perform bench tests, methods of introduction into the aquifer, etc. However, there also are several important considerations that are specific to each of these technologies. Below are bulleted lists of some important considerations for these technologies that impact the distribution and reactivity of amendments. In Situ Chemical Oxidation
• Due to the reactive nature of oxidants, a number of health and safety considerations are related to their application that must be considered.
• The ROI for ISCO reagents may be limited due to the reactive nature of the oxidants. In particular, hydrogen peroxide may have a very limited ROI due to its fast reaction kinetics. In general, a typical ROI for ISCO reagents may range from about 5 to 15 feet per delivery point [19].
• If an activating agent is used (i.e., iron, heat, alkaline, etc.), monitoring should be performed to gauge the distribution of the activating agent to ensure that the reagent is activated according to design [29]. Activators may not be distributed the same distance as the oxidants due to different reaction rates, retardation factors, etc. In some cases, sequential application of the activator and oxidant may be more desirable than to apply the oxidant and the activator at the same time to minimize unproductive consumption of the reagents and alleviate health and safety issues.
• The solubility of permanganate drops with temperature. Hence, the injection of a saturated solution prepared at ambient temperatures may form a precipitate when exposed to the cooler subsurface temperatures.
• High concentrations of manganese dioxide have been reported to form when using permanganate to treat DNAPL, which reduces the rate of dissolution of the DNAPL.
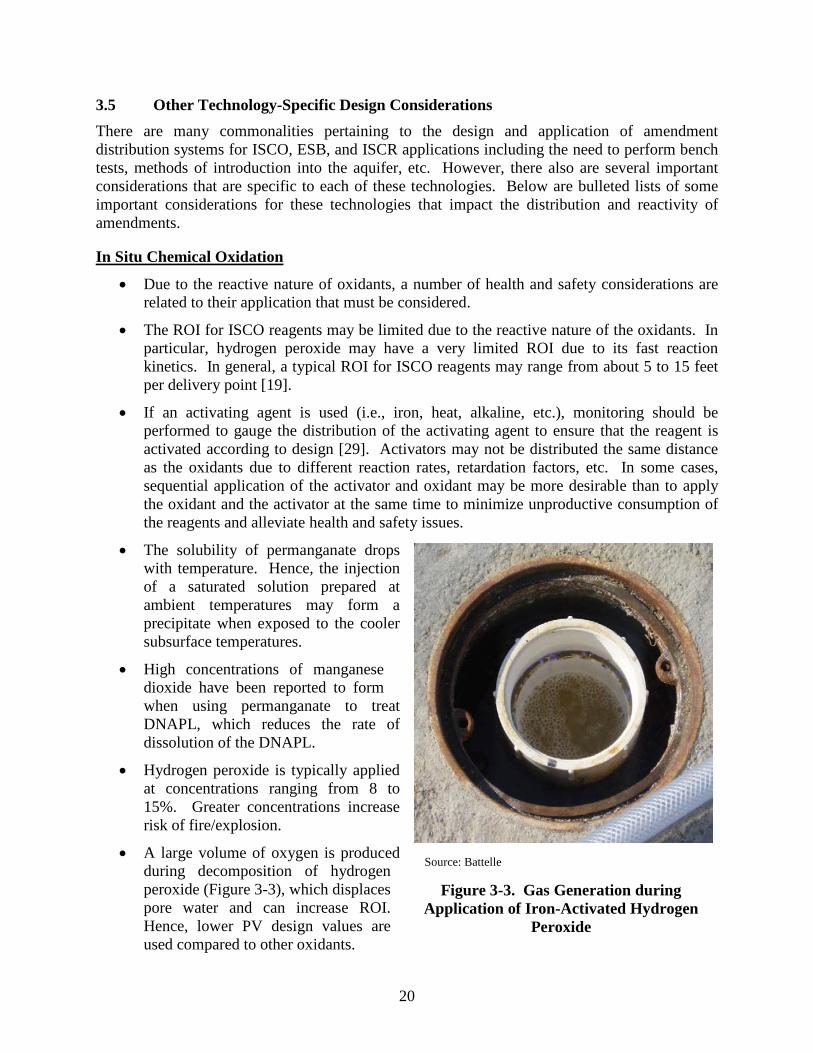
• Hydrogen peroxide is typically applied at concentrations ranging from 8 to 15%. Greater concentrations increase risk of fire/explosion.
• A large volume of oxygen is produced during decomposition of hydrogen peroxide (Figure 3-3), which displaces pore water and can increase ROI. Hence, lower PV design values are used compared to other oxidants.
Figure 3-3. Gas Generation during Application of Iron-Activated Hydrogen
Peroxide
Source: Battelle
21
• Conventional modeling may not be effective because of the reactive nature of the oxidants. Consider using a reactive transport model, which accounts for aquifer changes as the oxidant reacts with the COCs and aquifer materials (see Section 4.1.2).
Enhanced In Situ Bioremediation
• Based on an evaluation of 15 field applications, it was determined that the ability to effectively distribute substrate is often impacted by site-specific lithology and groundwater hydraulics (low or high rates of groundwater flow). In some cases, the quantity of substrate that can be injected also is limited by a low aquifer buffering capacity and adverse lowering of pH [21].
• Biological and mineral fouling is common (see Section 6.0). If multiple injection events are required, the injection plan should include procedures for addressing fouling.
• The addition of electron donor may result in a decrease of aquifer pH to a level detrimental to microbial activity. If baseline alkalinity is less than 300 mg/L and background pH is less than 6 to 6.5, then it is likely that a buffering agent will be necessary [7].
• Anaerobic microbes require DO less than 0.5 mg/L, ORP less than 0.5 mV and pH between about 5 and 85.
• More frequent injections, each using a lower concentration of electron donor, may help alleviate substantial reduction in pH.
• Microbial testing should be performed to determine if indigenous microbes having the necessary enzymes are present to degrade the COCs. If not present, bioaugmentation should be considered.
• Concentration of electron donor in the treatment area is highly dependent on groundwater flow velocity. Permeable formations having high hydraulic conductivity may require a continuous supply of aqueous (soluble) substrates. This is especially important if the upgradient aquifer is naturally aerobic.
• Oil retention is an important design factor. Bench-scale oil retention tests should be performed to determine the amount of oil that will be retained by the aquifer matrix.
In Situ Chemical Reduction
• Care should be taken to avoid contact between nZVI and oxygen or other oxidized species during storage and mixing to avoid deactivation [5]. It is advantageous if the aquifer is anaerobic before injecting nZVI because less mass of nZVI will become deactivated before the required redox conditions are achieved. Prevention of nZVI from becoming deactivated will improve long-term effectiveness.
• There are unknowns regarding the efficacy of applying emulsified ZVI at sites. In particular, field application of EZVI and treatment of DNAPL are being performed, which will provide additional information regarding the efficacy of the technology. A
5Manufacturers of microbial cultures should be consulted for their required specifications.
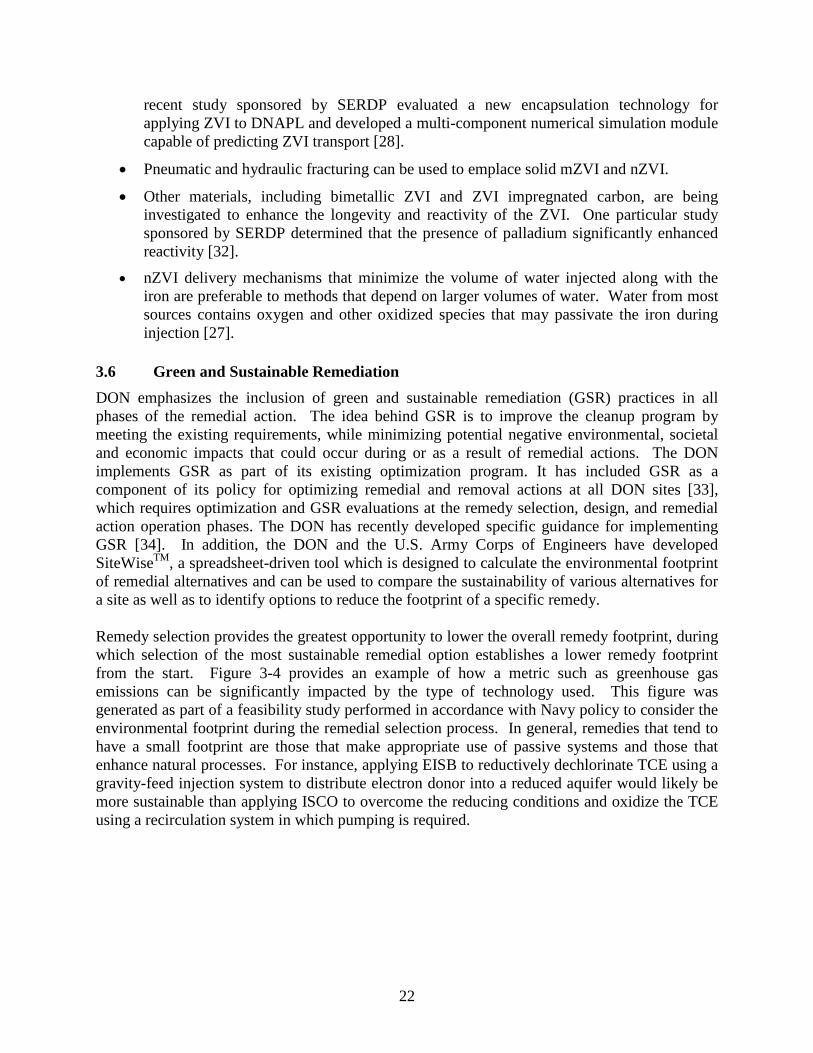
22
recent study sponsored by SERDP evaluated a new encapsulation technology for applying ZVI to DNAPL and developed a multi-component numerical simulation module capable of predicting ZVI transport [28].
• Pneumatic and hydraulic fracturing can be used to emplace solid mZVI and nZVI.
• Other materials, including bimetallic ZVI and ZVI impregnated carbon, are being investigated to enhance the longevity and reactivity of the ZVI. One particular study sponsored by SERDP determined that the presence of palladium significantly enhanced reactivity [32].
• nZVI delivery mechanisms that minimize the volume of water injected along with the iron are preferable to methods that depend on larger volumes of water. Water from most sources contains oxygen and other oxidized species that may passivate the iron during injection [27].
3.6 Green and Sustainable Remediation DON emphasizes the inclusion of green and sustainable remediation (GSR) practices in all phases of the remedial action. The idea behind GSR is to improve the cleanup program by meeting the existing requirements, while minimizing potential negative environmental, societal and economic impacts that could occur during or as a result of remedial actions. The DON implements GSR as part of its existing optimization program. It has included GSR as a component of its policy for optimizing remedial and removal actions at all DON sites [33], which requires optimization and GSR evaluations at the remedy selection, design, and remedial action operation phases. The DON has recently developed specific guidance for implementing GSR [34]. In addition, the DON and the U.S. Army Corps of Engineers have developed SiteWiseTM, a spreadsheet-driven tool which is designed to calculate the environmental footprint of remedial alternatives and can be used to compare the sustainability of various alternatives for a site as well as to identify options to reduce the footprint of a specific remedy. Remedy selection provides the greatest opportunity to lower the overall remedy footprint, during which selection of the most sustainable remedial option establishes a lower remedy footprint from the start. Figure 3-4 provides an example of how a metric such as greenhouse gas emissions can be significantly impacted by the type of technology used. This figure was generated as part of a feasibility study performed in accordance with Navy policy to consider the environmental footprint during the remedial selection process. In general, remedies that tend to have a small footprint are those that make appropriate use of passive systems and those that enhance natural processes. For instance, applying EISB to reductively dechlorinate TCE using a gravity-feed injection system to distribute electron donor into a reduced aquifer would likely be more sustainable than applying ISCO to overcome the reducing conditions and oxidize the TCE using a recirculation system in which pumping is required.
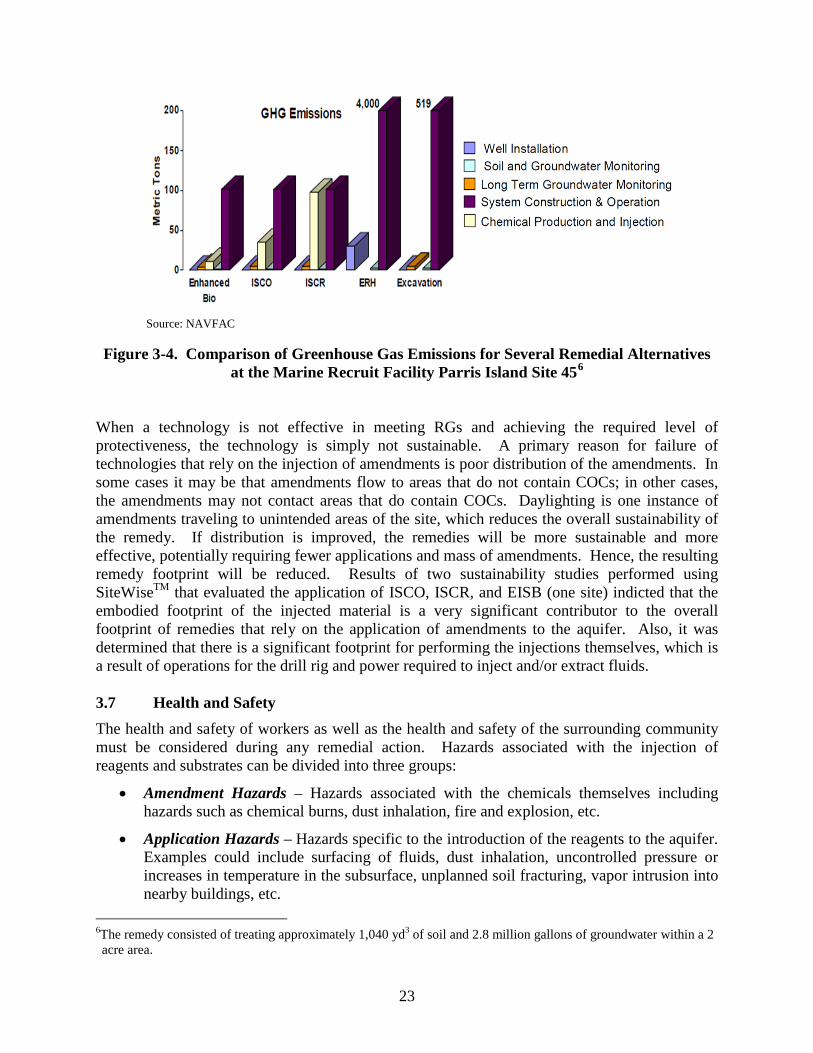
23
Figure 3-4. Comparison of Greenhouse Gas Emissions for Several Remedial Alternatives at the Marine Recruit Facility Parris Island Site 456
When a technology is not effective in meeting RGs and achieving the required level of protectiveness, the technology is simply not sustainable. A primary reason for failure of technologies that rely on the injection of amendments is poor distribution of the amendments. In some cases it may be that amendments flow to areas that do not contain COCs; in other cases, the amendments may not contact areas that do contain COCs. Daylighting is one instance of amendments traveling to unintended areas of the site, which reduces the overall sustainability of the remedy. If distribution is improved, the remedies will be more sustainable and more effective, potentially requiring fewer applications and mass of amendments. Hence, the resulting remedy footprint will be reduced. Results of two sustainability studies performed using SiteWiseTM that evaluated the application of ISCO, ISCR, and EISB (one site) indicted that the embodied footprint of the injected material is a very significant contributor to the overall footprint of remedies that rely on the application of amendments to the aquifer. Also, it was determined that there is a significant footprint for performing the injections themselves, which is a result of operations for the drill rig and power required to inject and/or extract fluids. 3.7 Health and Safety The health and safety of workers as well as the health and safety of the surrounding community must be considered during any remedial action. Hazards associated with the injection of reagents and substrates can be divided into three groups:
• Amendment Hazards – Hazards associated with the chemicals themselves including hazards such as chemical burns, dust inhalation, fire and explosion, etc.
• Application Hazards – Hazards specific to the introduction of the reagents to the aquifer. Examples could include surfacing of fluids, dust inhalation, uncontrolled pressure or increases in temperature in the subsurface, unplanned soil fracturing, vapor intrusion into nearby buildings, etc.
6The remedy consisted of treating approximately 1,040 yd3 of soil and 2.8 million gallons of groundwater within a 2 acre area.
Source: NAVFAC
24
• Post-Application Hazards – Hazards that may be present immediately to several months (or years) after the reagents have been applied. Examples include increases in concentrations of byproducts such as hydrogen sulfide and vapor intrusion into nearby buildings, migration of reagents into nearby surface water bodies, and solubilization and migration of heavy metals outside of the treatment zone.
Table 3-7 lists specific hazards associated with some of the most commonly used ISCO, EISB, and ISCR reagents. In addition to the hazards listed in Table 3-7, as with all in situ technologies, the installation of direct push injection points, injection and extraction wells, and/or monitoring points requires penetrations into the subsurface. Hence, it is important to know the location of all utilities. All states provide various free services, when contacted prior to digging, to mark existing utility lines. In addition, it is advisable to use geophysical methods such as ground penetrating radar, electromagnetic induction, and/or geomagnetic to confirm the absence of utilities in areas where subsurface artifacts will be installed. 3.8 Regulatory Considerations Innovative treatment technologies that require the introduction of reagents into the aquifer have gained regulatory acceptance over the last decade. ISCO, ISCR, and EISB have been implemented under various federal programs including the Comprehensive Environmental Response, Compensation, and Liability Act (CERCLA) and the Resource Conservation and Recovery Act (RCRA). In addition, environmental restoration using these technologies has been implemented in the majority if not all states. However, there remain inconsistencies from state to state and within the various federal programs; hence, the practitioner should have an understanding of the federal and state requirements that apply to any site at which these technologies are proposed. Several regulatory and permitting considerations related to the application of reagents at sites are listed in Table 3-8. However, this is not an inclusive list of considerations. The appropriate agencies should be consulted prior to commencing any restoration project to ensure all applicable permits have been acquired and the remedial action is performed in accordance with all federal, state, and local laws. A primary consideration associated with the in situ application of reagents to treat contaminated sites has been the injection of the reagents and reinjection of potentially contaminated groundwater that has been amended with reagents. Injection of reagents is permitted under RCRA subtitle C, provided that the reagents are not considered hazardous wastes. However, the Safe Drinking Water Act (SDWA) regulates injection wells under the Underground Injection Control (UIC) program. The UIC program requires that injection cannot violate primary drinking water standards or have adverse health effects. Injection wells used for in situ remediation are designated as Class V under the UIC program. These wells are not authorized by rule and do not require a separate UIC permit; however, Class V wells regulated by a state UIC program may require a permit [35]. Many times this requirement is waived for the introduction of food-grade substances (i.e., vegetable oil) [36]. Modeling of the contaminant plume and monitoring during and after the application may be required to demonstrate that the injected reagents are contained and that the application does not result in further migration of COCs. The appropriate state agency should be contacted for additional guidance.

25
The U.S. Environmental Protection Agency (U.S. EPA) permits reinjection of treated contaminated groundwater from an aquifer if the restoration activities are associated with a CERCLA response action or a RCRA corrective action; the contaminated water is treated to substantially reduce hazardous constituents prior to reinjection; and the action is sufficient to protect human health and the environment. It is important to note that the U.S. EPA has clarified that reduction of the COCs in the groundwater may occur after the groundwater has been reinjected into the aquifer [37]. Hence, “treatment” may be interpreted as the introduction of the reagents that will later result in substantial reduction.
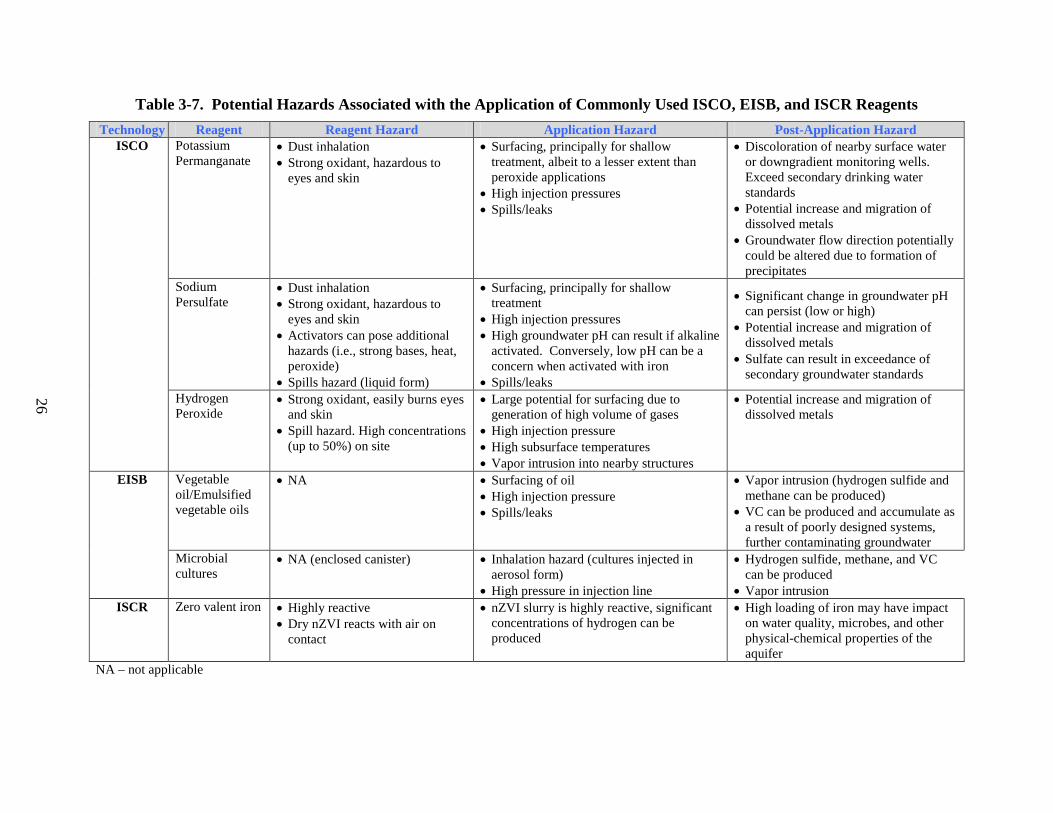
26
Table 3-7. Potential Hazards Associated with the Application of Commonly Used ISCO, EISB, and ISCR Reagents Technology Reagent Reagent Hazard Application Hazard Post-Application Hazard
ISCO Potassium Permanganate
• Dust inhalation • Strong oxidant, hazardous to
eyes and skin
• Surfacing, principally for shallow treatment, albeit to a lesser extent than peroxide applications
• High injection pressures • Spills/leaks
• Discoloration of nearby surface water or downgradient monitoring wells. Exceed secondary drinking water standards
• Potential increase and migration of dissolved metals
• Groundwater flow direction potentially could be altered due to formation of precipitates
Sodium Persulfate
• Dust inhalation • Strong oxidant, hazardous to
eyes and skin • Activators can pose additional
hazards (i.e., strong bases, heat, peroxide)
• Spills hazard (liquid form)
• Surfacing, principally for shallow treatment
• High injection pressures • High groundwater pH can result if alkaline
activated. Conversely, low pH can be a concern when activated with iron
• Spills/leaks
• Significant change in groundwater pH can persist (low or high)
• Potential increase and migration of dissolved metals
• Sulfate can result in exceedance of secondary groundwater standards
Hydrogen Peroxide
• Strong oxidant, easily burns eyes and skin
• Spill hazard. High concentrations (up to 50%) on site
• Large potential for surfacing due to generation of high volume of gases
• High injection pressure • High subsurface temperatures • Vapor intrusion into nearby structures
• Potential increase and migration of dissolved metals
EISB Vegetable oil/Emulsified vegetable oils
• NA • Surfacing of oil • High injection pressure • Spills/leaks
• Vapor intrusion (hydrogen sulfide and methane can be produced)
• VC can be produced and accumulate as a result of poorly designed systems, further contaminating groundwater
Microbial cultures
• NA (enclosed canister) • Inhalation hazard (cultures injected in aerosol form)
• High pressure in injection line
• Hydrogen sulfide, methane, and VC can be produced
• Vapor intrusion ISCR Zero valent iron • Highly reactive
• Dry nZVI reacts with air on contact
• nZVI slurry is highly reactive, significant concentrations of hydrogen can be produced
• High loading of iron may have impact on water quality, microbes, and other physical-chemical properties of the aquifer
NA – not applicable
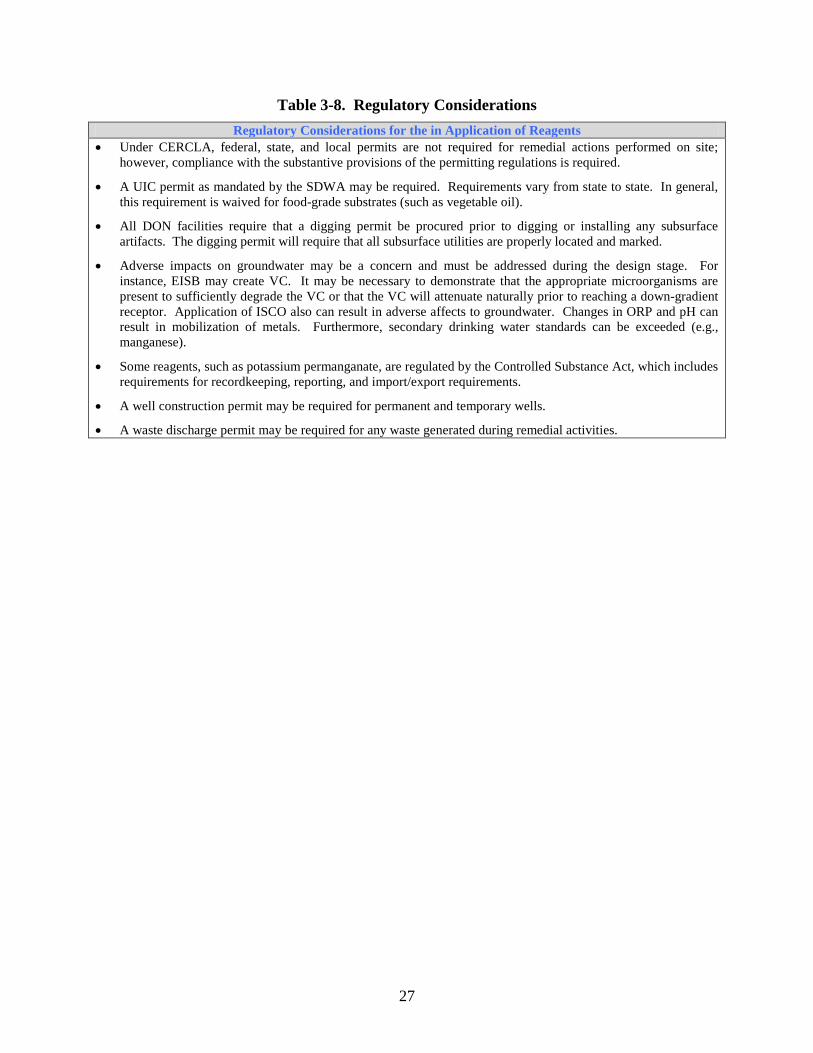
27
Table 3-8. Regulatory Considerations Regulatory Considerations for the in Application of Reagents
• Under CERCLA, federal, state, and local permits are not required for remedial actions performed on site; however, compliance with the substantive provisions of the permitting regulations is required.
• A UIC permit as mandated by the SDWA may be required. Requirements vary from state to state. In general, this requirement is waived for food-grade substrates (such as vegetable oil).
• All DON facilities require that a digging permit be procured prior to digging or installing any subsurface artifacts. The digging permit will require that all subsurface utilities are properly located and marked.
• Adverse impacts on groundwater may be a concern and must be addressed during the design stage. For instance, EISB may create VC. It may be necessary to demonstrate that the appropriate microorganisms are present to sufficiently degrade the VC or that the VC will attenuate naturally prior to reaching a down-gradient receptor. Application of ISCO also can result in adverse affects to groundwater. Changes in ORP and pH can result in mobilization of metals. Furthermore, secondary drinking water standards can be exceeded (e.g., manganese).
• Some reagents, such as potassium permanganate, are regulated by the Controlled Substance Act, which includes requirements for recordkeeping, reporting, and import/export requirements.
• A well construction permit may be required for permanent and temporary wells.
• A waste discharge permit may be required for any waste generated during remedial activities.
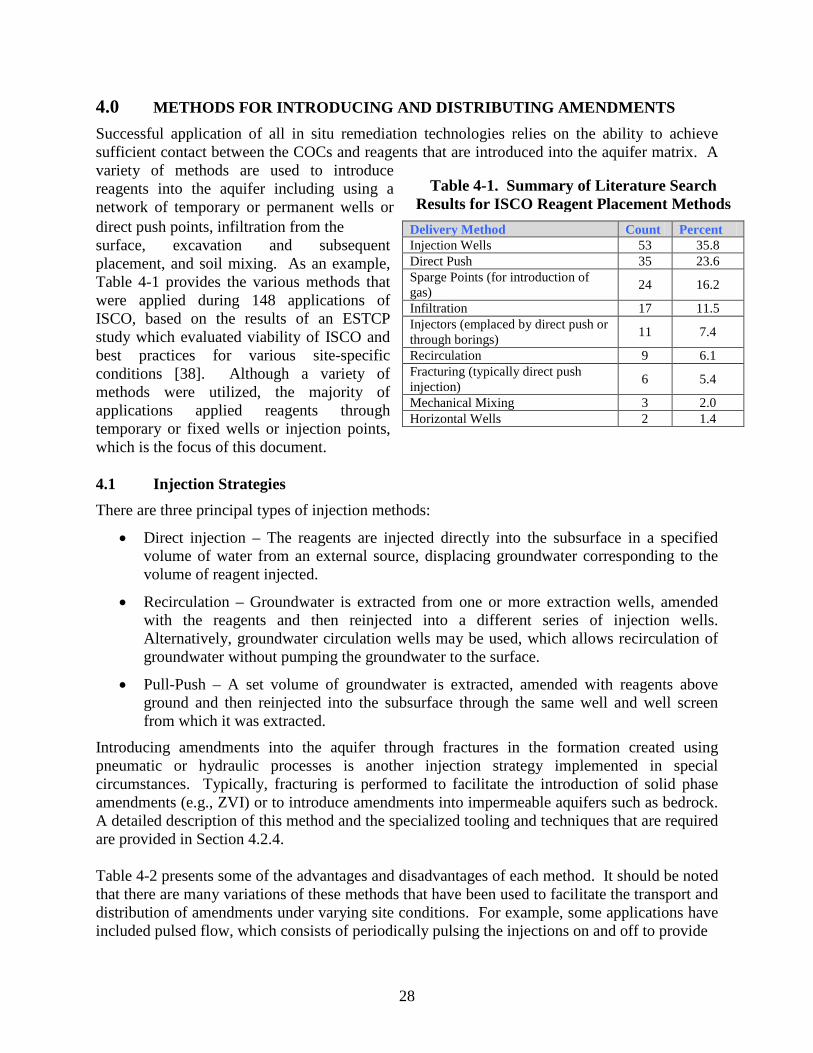
28
4.0 METHODS FOR INTRODUCING AND DISTRIBUTING AMENDMENTS Successful application of all in situ remediation technologies relies on the ability to achieve sufficient contact between the COCs and reagents that are introduced into the aquifer matrix. A variety of methods are used to introduce reagents into the aquifer including using a network of temporary or permanent wells or direct push points, infiltration from the surface, excavation and subsequent placement, and soil mixing. As an example, Table 4-1 provides the various methods that were applied during 148 applications of ISCO, based on the results of an ESTCP study which evaluated viability of ISCO and best practices for various site-specific conditions [38]. Although a variety of methods were utilized, the majority of applications applied reagents through temporary or fixed wells or injection points, which is the focus of this document. 4.1 Injection Strategies There are three principal types of injection methods:
• Direct injection – The reagents are injected directly into the subsurface in a specified volume of water from an external source, displacing groundwater corresponding to the volume of reagent injected.
• Recirculation – Groundwater is extracted from one or more extraction wells, amended with the reagents and then reinjected into a different series of injection wells. Alternatively, groundwater circulation wells may be used, which allows recirculation of groundwater without pumping the groundwater to the surface.
• Pull-Push – A set volume of groundwater is extracted, amended with reagents above ground and then reinjected into the subsurface through the same well and well screen from which it was extracted.
Introducing amendments into the aquifer through fractures in the formation created using pneumatic or hydraulic processes is another injection strategy implemented in special circumstances. Typically, fracturing is performed to facilitate the introduction of solid phase amendments (e.g., ZVI) or to introduce amendments into impermeable aquifers such as bedrock. A detailed description of this method and the specialized tooling and techniques that are required are provided in Section 4.2.4. Table 4-2 presents some of the advantages and disadvantages of each method. It should be noted that there are many variations of these methods that have been used to facilitate the transport and distribution of amendments under varying site conditions. For example, some applications have included pulsed flow, which consists of periodically pulsing the injections on and off to provide
Delivery Method Count Percent Injection Wells 53 35.8 Direct Push 35 23.6 Sparge Points (for introduction of gas) 24 16.2
Infiltration 17 11.5 Injectors (emplaced by direct push or through borings) 11 7.4
Recirculation 9 6.1 Fracturing (typically direct push injection) 6 5.4
Mechanical Mixing 3 2.0 Horizontal Wells 2 1.4
Table 4-1. Summary of Literature Search Results for ISCO Reagent Placement Methods
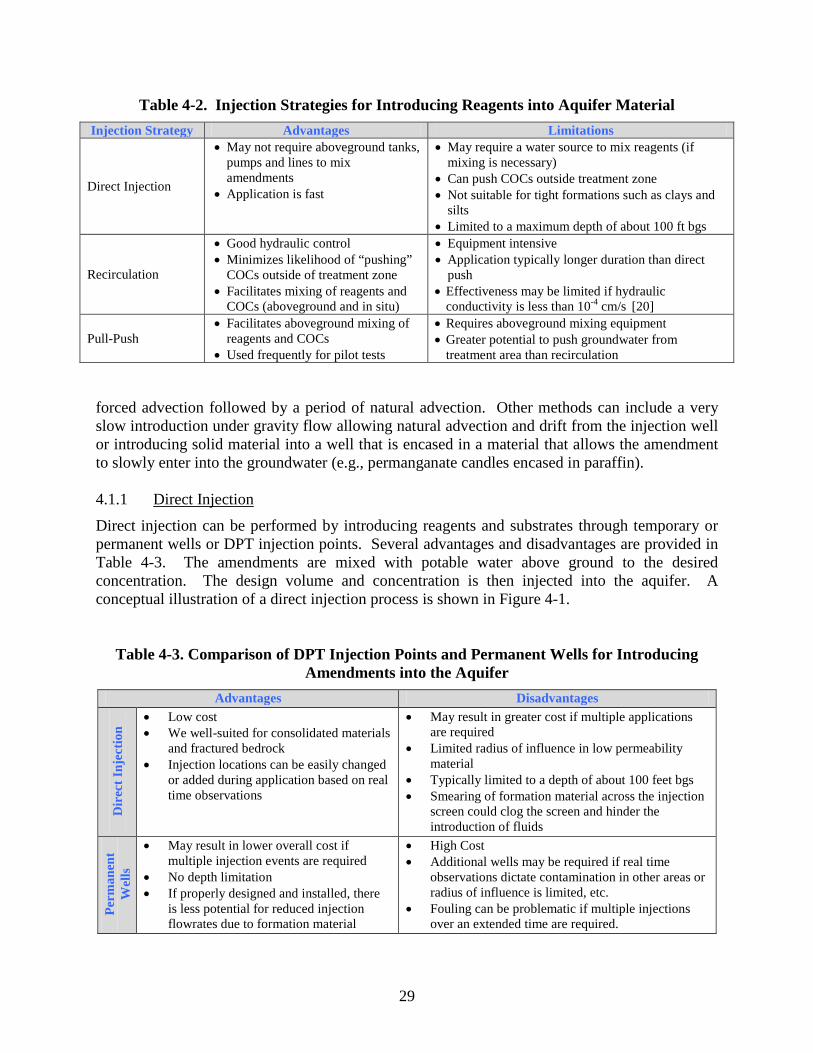
29
Table 4-2. Injection Strategies for Introducing Reagents into Aquifer Material Injection Strategy Advantages Limitations
Direct Injection
• May not require aboveground tanks, pumps and lines to mix amendments
• Application is fast
• May require a water source to mix reagents (if mixing is necessary)
• Can push COCs outside treatment zone • Not suitable for tight formations such as clays and
silts • Limited to a maximum depth of about 100 ft bgs
Recirculation
• Good hydraulic control • Minimizes likelihood of “pushing”
COCs outside of treatment zone • Facilitates mixing of reagents and
COCs (aboveground and in situ)
• Equipment intensive • Application typically longer duration than direct
push • Effectiveness may be limited if hydraulic
conductivity is less than 10-4 cm/s [20]
Pull-Push • Facilitates aboveground mixing of
reagents and COCs • Used frequently for pilot tests
• Requires aboveground mixing equipment • Greater potential to push groundwater from
treatment area than recirculation forced advection followed by a period of natural advection. Other methods can include a very slow introduction under gravity flow allowing natural advection and drift from the injection well or introducing solid material into a well that is encased in a material that allows the amendment to slowly enter into the groundwater (e.g., permanganate candles encased in paraffin). 4.1.1 Direct Injection
Direct injection can be performed by introducing reagents and substrates through temporary or permanent wells or DPT injection points. Several advantages and disadvantages are provided in Table 4-3. The amendments are mixed with potable water above ground to the desired concentration. The design volume and concentration is then injected into the aquifer. A conceptual illustration of a direct injection process is shown in Figure 4-1.
Table 4-3. Comparison of DPT Injection Points and Permanent Wells for Introducing Amendments into the Aquifer
Advantages Disadvantages
Dir
ect I
njec
tion
• Low cost • We well-suited for consolidated materials
and fractured bedrock • Injection locations can be easily changed
or added during application based on real time observations
• May result in greater cost if multiple applications are required
• Limited radius of influence in low permeability material
• Typically limited to a depth of about 100 feet bgs • Smearing of formation material across the injection
screen could clog the screen and hinder the introduction of fluids
Perm
anen
t W
ells
• May result in lower overall cost if multiple injection events are required
• No depth limitation • If properly designed and installed, there
is less potential for reduced injection flowrates due to formation material
• High Cost • Additional wells may be required if real time
observations dictate contamination in other areas or radius of influence is limited, etc.
• Fouling can be problematic if multiple injections over an extended time are required.
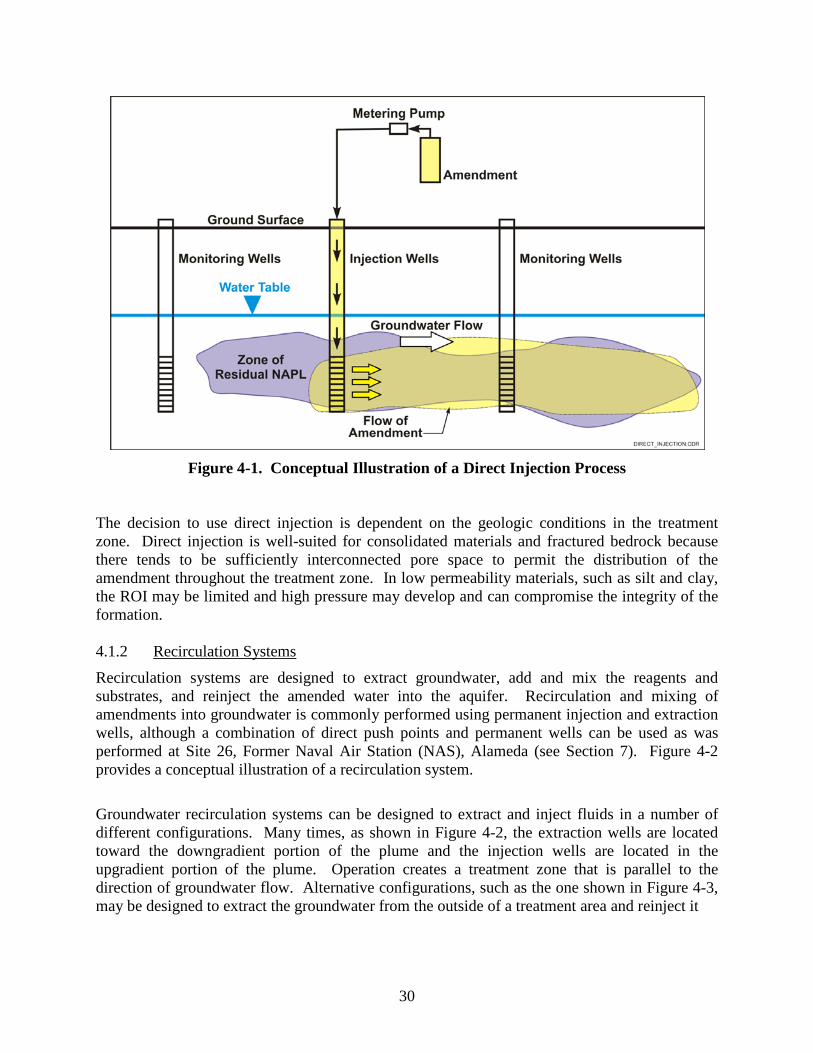
30
Figure 4-1. Conceptual Illustration of a Direct Injection Process
The decision to use direct injection is dependent on the geologic conditions in the treatment zone. Direct injection is well-suited for consolidated materials and fractured bedrock because there tends to be sufficiently interconnected pore space to permit the distribution of the amendment throughout the treatment zone. In low permeability materials, such as silt and clay, the ROI may be limited and high pressure may develop and can compromise the integrity of the formation. 4.1.2 Recirculation Systems
Recirculation systems are designed to extract groundwater, add and mix the reagents and substrates, and reinject the amended water into the aquifer. Recirculation and mixing of amendments into groundwater is commonly performed using permanent injection and extraction wells, although a combination of direct push points and permanent wells can be used as was performed at Site 26, Former Naval Air Station (NAS), Alameda (see Section 7). Figure 4-2 provides a conceptual illustration of a recirculation system.
Groundwater recirculation systems can be designed to extract and inject fluids in a number of different configurations. Many times, as shown in Figure 4-2, the extraction wells are located toward the downgradient portion of the plume and the injection wells are located in the upgradient portion of the plume. Operation creates a treatment zone that is parallel to the direction of groundwater flow. Alternative configurations, such as the one shown in Figure 4-3, may be designed to extract the groundwater from the outside of a treatment area and reinject it
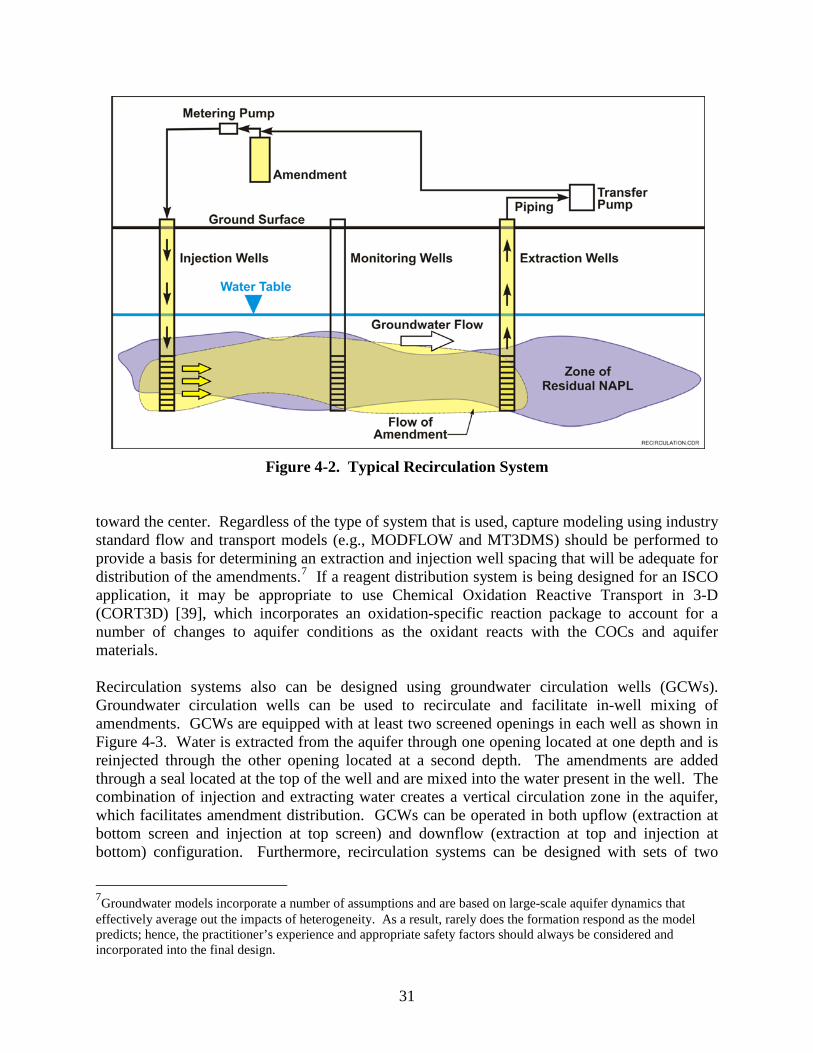
31
Figure 4-2. Typical Recirculation System
toward the center. Regardless of the type of system that is used, capture modeling using industry standard flow and transport models (e.g., MODFLOW and MT3DMS) should be performed to provide a basis for determining an extraction and injection well spacing that will be adequate for distribution of the amendments.7 If a reagent distribution system is being designed for an ISCO application, it may be appropriate to use Chemical Oxidation Reactive Transport in 3-D (CORT3D) [39], which incorporates an oxidation-specific reaction package to account for a number of changes to aquifer conditions as the oxidant reacts with the COCs and aquifer materials. Recirculation systems also can be designed using groundwater circulation wells (GCWs). Groundwater circulation wells can be used to recirculate and facilitate in-well mixing of amendments. GCWs are equipped with at least two screened openings in each well as shown in Figure 4-3. Water is extracted from the aquifer through one opening located at one depth and is reinjected through the other opening located at a second depth. The amendments are added through a seal located at the top of the well and are mixed into the water present in the well. The combination of injection and extracting water creates a vertical circulation zone in the aquifer, which facilitates amendment distribution. GCWs can be operated in both upflow (extraction at bottom screen and injection at top screen) and downflow (extraction at top and injection at bottom) configuration. Furthermore, recirculation systems can be designed with sets of two
7Groundwater models incorporate a number of assumptions and are based on large-scale aquifer dynamics that effectively average out the impacts of heterogeneity. As a result, rarely does the formation respond as the model predicts; hence, the practitioner’s experience and appropriate safety factors should always be considered and incorporated into the final design.
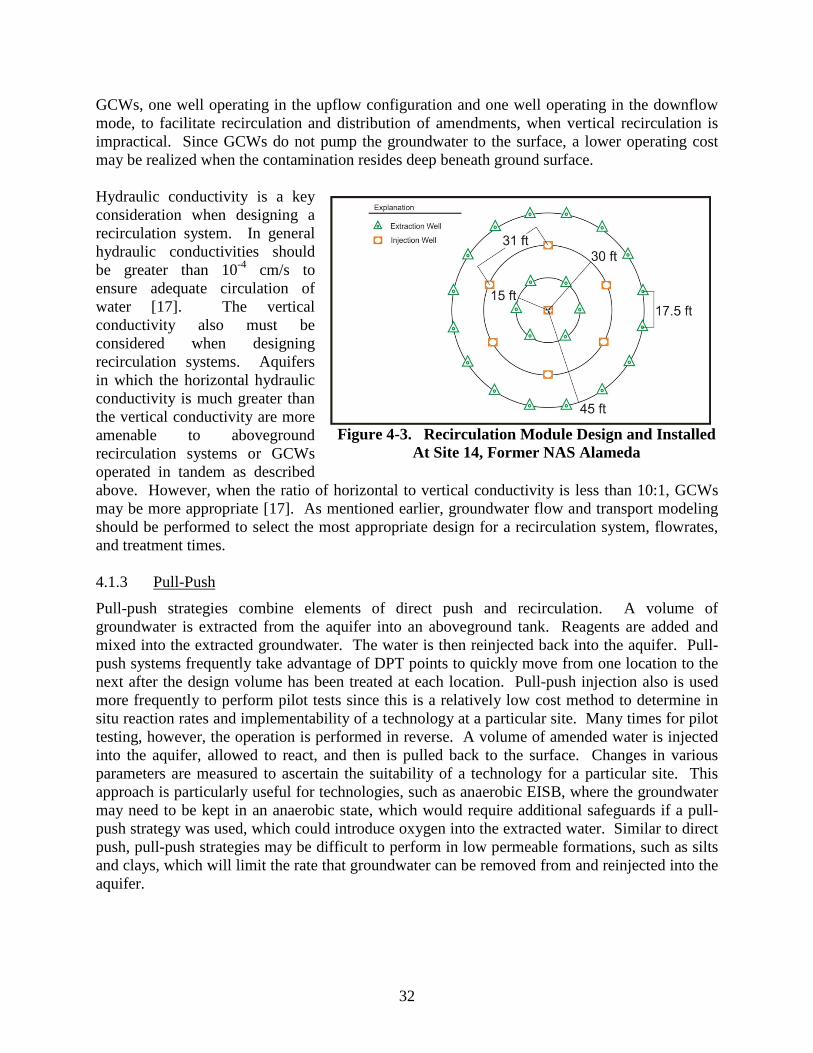
32
GCWs, one well operating in the upflow configuration and one well operating in the downflow mode, to facilitate recirculation and distribution of amendments, when vertical recirculation is impractical. Since GCWs do not pump the groundwater to the surface, a lower operating cost may be realized when the contamination resides deep beneath ground surface. Hydraulic conductivity is a key consideration when designing a recirculation system. In general hydraulic conductivities should be greater than 10-4 cm/s to ensure adequate circulation of water [17]. The vertical conductivity also must be considered when designing recirculation systems. Aquifers in which the horizontal hydraulic conductivity is much greater than the vertical conductivity are more amenable to aboveground recirculation systems or GCWs operated in tandem as described above. However, when the ratio of horizontal to vertical conductivity is less than 10:1, GCWs may be more appropriate [17]. As mentioned earlier, groundwater flow and transport modeling should be performed to select the most appropriate design for a recirculation system, flowrates, and treatment times. 4.1.3 Pull-Push
Pull-push strategies combine elements of direct push and recirculation. A volume of groundwater is extracted from the aquifer into an aboveground tank. Reagents are added and mixed into the extracted groundwater. The water is then reinjected back into the aquifer. Pull-push systems frequently take advantage of DPT points to quickly move from one location to the next after the design volume has been treated at each location. Pull-push injection also is used more frequently to perform pilot tests since this is a relatively low cost method to determine in situ reaction rates and implementability of a technology at a particular site. Many times for pilot testing, however, the operation is performed in reverse. A volume of amended water is injected into the aquifer, allowed to react, and then is pulled back to the surface. Changes in various parameters are measured to ascertain the suitability of a technology for a particular site. This approach is particularly useful for technologies, such as anaerobic EISB, where the groundwater may need to be kept in an anaerobic state, which would require additional safeguards if a pull-push strategy was used, which could introduce oxygen into the extracted water. Similar to direct push, pull-push strategies may be difficult to perform in low permeable formations, such as silts and clays, which will limit the rate that groundwater can be removed from and reinjected into the aquifer.
Figure 4-3. Recirculation Module Design and Installed At Site 14, Former NAS Alameda
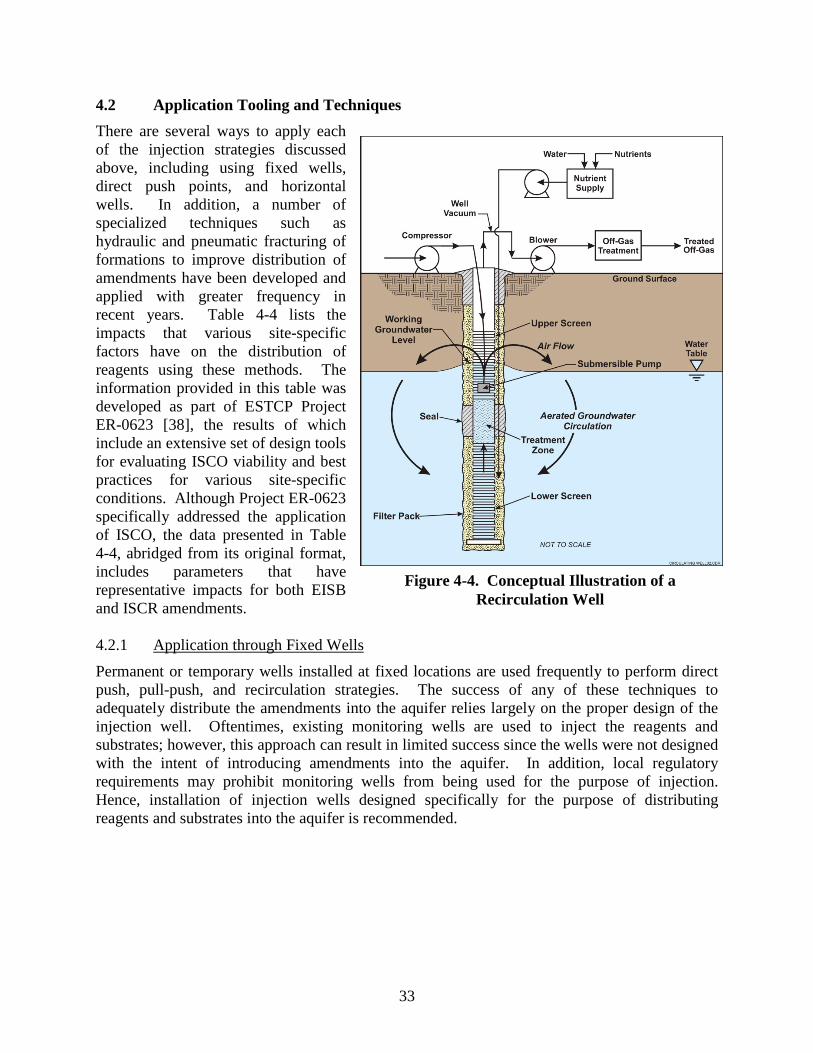
33
4.2 Application Tooling and Techniques There are several ways to apply each of the injection strategies discussed above, including using fixed wells, direct push points, and horizontal wells. In addition, a number of specialized techniques such as hydraulic and pneumatic fracturing of formations to improve distribution of amendments have been developed and applied with greater frequency in recent years. Table 4-4 lists the impacts that various site-specific factors have on the distribution of reagents using these methods. The information provided in this table was developed as part of ESTCP Project ER-0623 [38], the results of which include an extensive set of design tools for evaluating ISCO viability and best practices for various site-specific conditions. Although Project ER-0623 specifically addressed the application of ISCO, the data presented in Table 4-4, abridged from its original format, includes parameters that have representative impacts for both EISB and ISCR amendments. 4.2.1 Application through Fixed Wells
Permanent or temporary wells installed at fixed locations are used frequently to perform direct push, pull-push, and recirculation strategies. The success of any of these techniques to adequately distribute the amendments into the aquifer relies largely on the proper design of the injection well. Oftentimes, existing monitoring wells are used to inject the reagents and substrates; however, this approach can result in limited success since the wells were not designed with the intent of introducing amendments into the aquifer. In addition, local regulatory requirements may prohibit monitoring wells from being used for the purpose of injection. Hence, installation of injection wells designed specifically for the purpose of distributing reagents and substrates into the aquifer is recommended.
Figure 4-4. Conceptual Illustration of a Recirculation Well
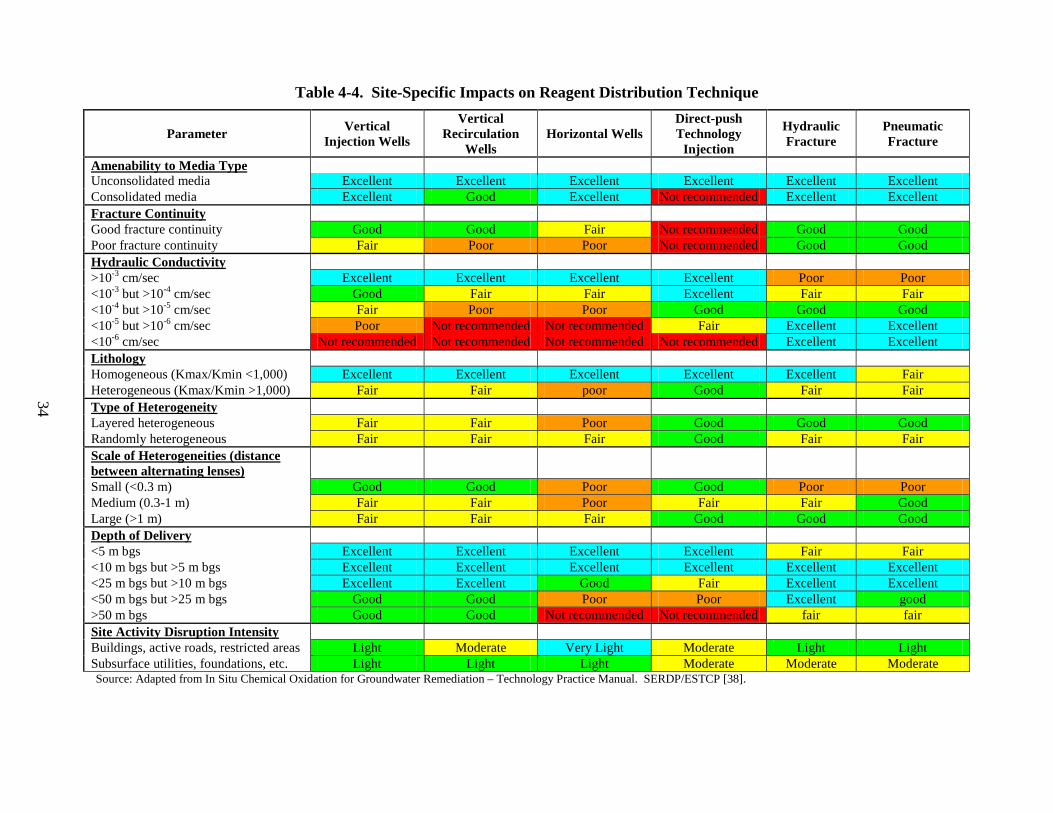
34
Table 4-4. Site-Specific Impacts on Reagent Distribution Technique
Parameter Vertical Injection Wells
Vertical Recirculation
Wells Horizontal Wells
Direct-push Technology
Injection
Hydraulic Fracture
Pneumatic Fracture
Amenability to Media Type Unconsolidated media Excellent Excellent Excellent Excellent Excellent Excellent Consolidated media Excellent Good Excellent Not recommended Excellent Excellent Fracture Continuity Good fracture continuity Good Good Fair Not recommended Good Good Poor fracture continuity Fair Poor Poor Not recommended Good Good Hydraulic Conductivity >10-3 cm/sec Excellent Excellent Excellent Excellent Poor Poor <10-3 but >10-4 cm/sec Good Fair Fair Excellent Fair Fair <10-4 but >10-5 cm/sec Fair Poor Poor Good Good Good <10-5 but >10-6 cm/sec Poor Not recommended Not recommended Fair Excellent Excellent <10-6 cm/sec Not recommended Not recommended Not recommended Not recommended Excellent Excellent Lithology Homogeneous (Kmax/Kmin <1,000) Excellent Excellent Excellent Excellent Excellent Fair Heterogeneous (Kmax/Kmin >1,000) Fair Fair poor Good Fair Fair Type of Heterogeneity Layered heterogeneous Fair Fair Poor Good Good Good Randomly heterogeneous Fair Fair Fair Good Fair Fair Scale of Heterogeneities (distance between alternating lenses)
Small (<0.3 m) Good Good Poor Good Poor Poor Medium (0.3-1 m) Fair Fair Poor Fair Fair Good Large (>1 m) Fair Fair Fair Good Good Good Depth of Delivery <5 m bgs Excellent Excellent Excellent Excellent Fair Fair <10 m bgs but >5 m bgs Excellent Excellent Excellent Excellent Excellent Excellent <25 m bgs but >10 m bgs Excellent Excellent Good Fair Excellent Excellent <50 m bgs but >25 m bgs Good Good Poor Poor Excellent good >50 m bgs Good Good Not recommended Not recommended fair fair Site Activity Disruption Intensity Buildings, active roads, restricted areas Light Moderate Very Light Moderate Light Light Subsurface utilities, foundations, etc. Light Light Light Moderate Moderate Moderate Source: Adapted from In Situ Chemical Oxidation for Groundwater Remediation – Technology Practice Manual. SERDP/ESTCP [38].
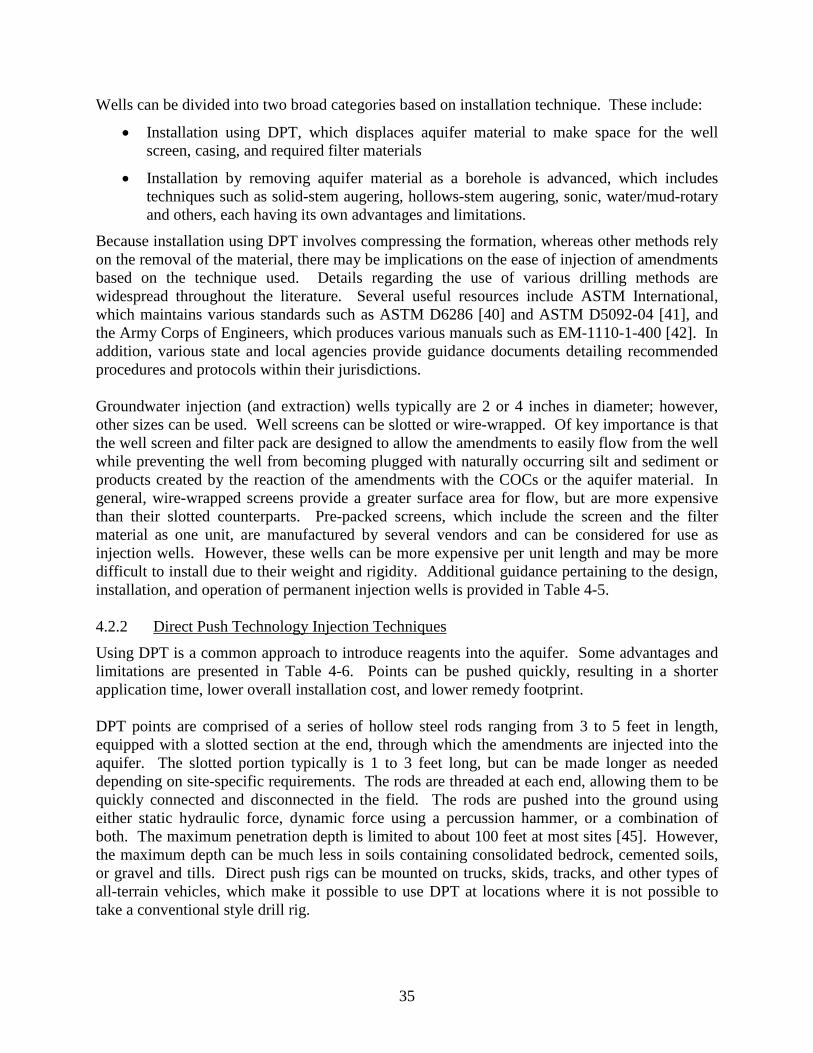
35
Wells can be divided into two broad categories based on installation technique. These include:
• Installation using DPT, which displaces aquifer material to make space for the well screen, casing, and required filter materials
• Installation by removing aquifer material as a borehole is advanced, which includes techniques such as solid-stem augering, hollows-stem augering, sonic, water/mud-rotary and others, each having its own advantages and limitations.
Because installation using DPT involves compressing the formation, whereas other methods rely on the removal of the material, there may be implications on the ease of injection of amendments based on the technique used. Details regarding the use of various drilling methods are widespread throughout the literature. Several useful resources include ASTM International, which maintains various standards such as ASTM D6286 [40] and ASTM D5092-04 [41], and the Army Corps of Engineers, which produces various manuals such as EM-1110-1-400 [42]. In addition, various state and local agencies provide guidance documents detailing recommended procedures and protocols within their jurisdictions. Groundwater injection (and extraction) wells typically are 2 or 4 inches in diameter; however, other sizes can be used. Well screens can be slotted or wire-wrapped. Of key importance is that the well screen and filter pack are designed to allow the amendments to easily flow from the well while preventing the well from becoming plugged with naturally occurring silt and sediment or products created by the reaction of the amendments with the COCs or the aquifer material. In general, wire-wrapped screens provide a greater surface area for flow, but are more expensive than their slotted counterparts. Pre-packed screens, which include the screen and the filter material as one unit, are manufactured by several vendors and can be considered for use as injection wells. However, these wells can be more expensive per unit length and may be more difficult to install due to their weight and rigidity. Additional guidance pertaining to the design, installation, and operation of permanent injection wells is provided in Table 4-5.
4.2.2 Direct Push Technology Injection Techniques
Using DPT is a common approach to introduce reagents into the aquifer. Some advantages and limitations are presented in Table 4-6. Points can be pushed quickly, resulting in a shorter application time, lower overall installation cost, and lower remedy footprint.
DPT points are comprised of a series of hollow steel rods ranging from 3 to 5 feet in length, equipped with a slotted section at the end, through which the amendments are injected into the aquifer. The slotted portion typically is 1 to 3 feet long, but can be made longer as needed depending on site-specific requirements. The rods are threaded at each end, allowing them to be quickly connected and disconnected in the field. The rods are pushed into the ground using either static hydraulic force, dynamic force using a percussion hammer, or a combination of both. The maximum penetration depth is limited to about 100 feet at most sites [45]. However, the maximum depth can be much less in soils containing consolidated bedrock, cemented soils, or gravel and tills. Direct push rigs can be mounted on trucks, skids, tracks, and other types of all-terrain vehicles, which make it possible to use DPT at locations where it is not possible to take a conventional style drill rig.
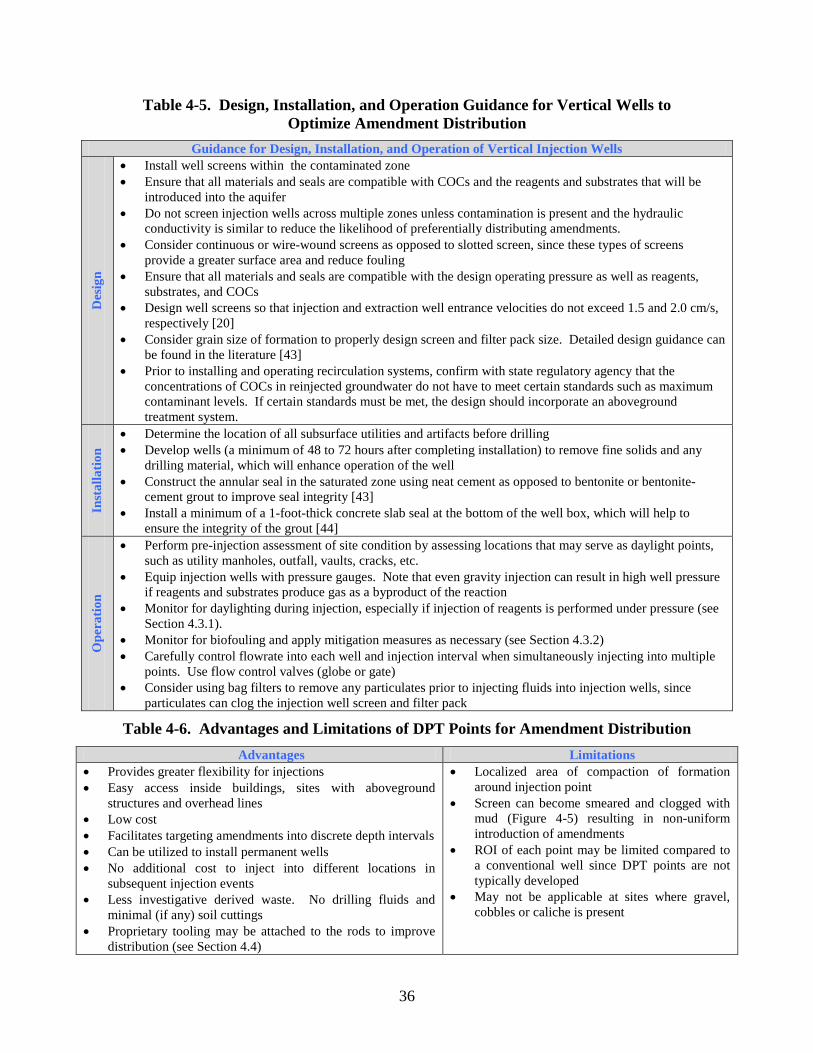
36
Table 4-5. Design, Installation, and Operation Guidance for Vertical Wells to Optimize Amendment Distribution
Guidance for Design, Installation, and Operation of Vertical Injection Wells
Des
ign
• Install well screens within the contaminated zone • Ensure that all materials and seals are compatible with COCs and the reagents and substrates that will be
introduced into the aquifer • Do not screen injection wells across multiple zones unless contamination is present and the hydraulic
conductivity is similar to reduce the likelihood of preferentially distributing amendments. • Consider continuous or wire-wound screens as opposed to slotted screen, since these types of screens
provide a greater surface area and reduce fouling • Ensure that all materials and seals are compatible with the design operating pressure as well as reagents,
substrates, and COCs • Design well screens so that injection and extraction well entrance velocities do not exceed 1.5 and 2.0 cm/s,
respectively [20] • Consider grain size of formation to properly design screen and filter pack size. Detailed design guidance can
be found in the literature [43] • Prior to installing and operating recirculation systems, confirm with state regulatory agency that the
concentrations of COCs in reinjected groundwater do not have to meet certain standards such as maximum contaminant levels. If certain standards must be met, the design should incorporate an aboveground treatment system.
Inst
alla
tion
• Determine the location of all subsurface utilities and artifacts before drilling • Develop wells (a minimum of 48 to 72 hours after completing installation) to remove fine solids and any
drilling material, which will enhance operation of the well • Construct the annular seal in the saturated zone using neat cement as opposed to bentonite or bentonite-
cement grout to improve seal integrity [43] • Install a minimum of a 1-foot-thick concrete slab seal at the bottom of the well box, which will help to
ensure the integrity of the grout [44]
Ope
ratio
n
• Perform pre-injection assessment of site condition by assessing locations that may serve as daylight points, such as utility manholes, outfall, vaults, cracks, etc.
• Equip injection wells with pressure gauges. Note that even gravity injection can result in high well pressure if reagents and substrates produce gas as a byproduct of the reaction
• Monitor for daylighting during injection, especially if injection of reagents is performed under pressure (see Section 4.3.1).
• Monitor for biofouling and apply mitigation measures as necessary (see Section 4.3.2) • Carefully control flowrate into each well and injection interval when simultaneously injecting into multiple
points. Use flow control valves (globe or gate) • Consider using bag filters to remove any particulates prior to injecting fluids into injection wells, since
particulates can clog the injection well screen and filter pack
Table 4-6. Advantages and Limitations of DPT Points for Amendment Distribution Advantages Limitations
• Provides greater flexibility for injections • Easy access inside buildings, sites with aboveground
structures and overhead lines • Low cost • Facilitates targeting amendments into discrete depth intervals • Can be utilized to install permanent wells • No additional cost to inject into different locations in
subsequent injection events • Less investigative derived waste. No drilling fluids and
minimal (if any) soil cuttings • Proprietary tooling may be attached to the rods to improve
distribution (see Section 4.4)
• Localized area of compaction of formation around injection point
• Screen can become smeared and clogged with mud (Figure 4-5) resulting in non-uniform introduction of amendments
• ROI of each point may be limited compared to a conventional well since DPT points are not typically developed
• May not be applicable at sites where gravel, cobbles or caliche is present
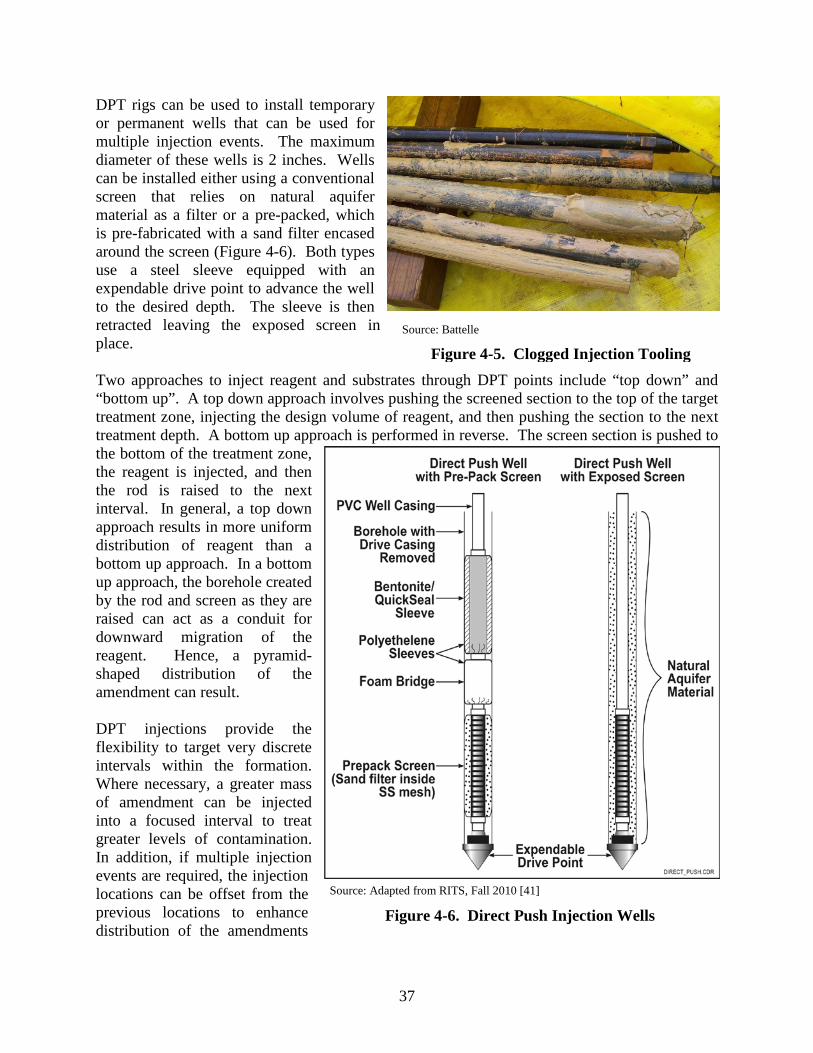
37
Source: Adapted from RITS, Fall 2010 [41]
Figure 4-6. Direct Push Injection Wells
DPT rigs can be used to install temporary or permanent wells that can be used for multiple injection events. The maximum diameter of these wells is 2 inches. Wells can be installed either using a conventional screen that relies on natural aquifer material as a filter or a pre-packed, which is pre-fabricated with a sand filter encased around the screen (Figure 4-6). Both types use a steel sleeve equipped with an expendable drive point to advance the well to the desired depth. The sleeve is then retracted leaving the exposed screen in place. Two approaches to inject reagent and substrates through DPT points include “top down” and “bottom up”. A top down approach involves pushing the screened section to the top of the target treatment zone, injecting the design volume of reagent, and then pushing the section to the next treatment depth. A bottom up approach is performed in reverse. The screen section is pushed to the bottom of the treatment zone, the reagent is injected, and then the rod is raised to the next interval. In general, a top down approach results in more uniform distribution of reagent than a bottom up approach. In a bottom up approach, the borehole created by the rod and screen as they are raised can act as a conduit for downward migration of the reagent. Hence, a pyramid-shaped distribution of the amendment can result. DPT injections provide the flexibility to target very discrete intervals within the formation. Where necessary, a greater mass of amendment can be injected into a focused interval to treat greater levels of contamination. In addition, if multiple injection events are required, the injection locations can be offset from the previous locations to enhance distribution of the amendments
Source: Battelle
Figure 4-5. Clogged Injection Tooling
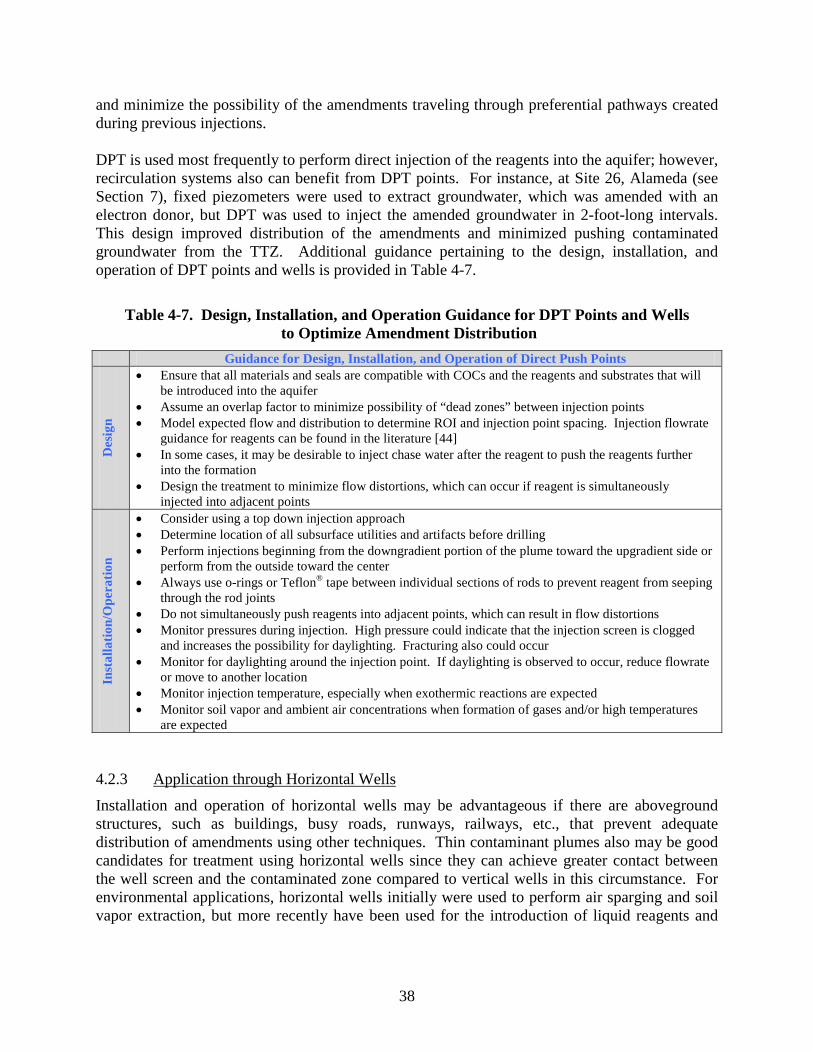
38
and minimize the possibility of the amendments traveling through preferential pathways created during previous injections. DPT is used most frequently to perform direct injection of the reagents into the aquifer; however, recirculation systems also can benefit from DPT points. For instance, at Site 26, Alameda (see Section 7), fixed piezometers were used to extract groundwater, which was amended with an electron donor, but DPT was used to inject the amended groundwater in 2-foot-long intervals. This design improved distribution of the amendments and minimized pushing contaminated groundwater from the TTZ. Additional guidance pertaining to the design, installation, and operation of DPT points and wells is provided in Table 4-7.
Table 4-7. Design, Installation, and Operation Guidance for DPT Points and Wells
to Optimize Amendment Distribution Guidance for Design, Installation, and Operation of Direct Push Points
Des
ign
• Ensure that all materials and seals are compatible with COCs and the reagents and substrates that will be introduced into the aquifer
• Assume an overlap factor to minimize possibility of “dead zones” between injection points • Model expected flow and distribution to determine ROI and injection point spacing. Injection flowrate
guidance for reagents can be found in the literature [44] • In some cases, it may be desirable to inject chase water after the reagent to push the reagents further
into the formation • Design the treatment to minimize flow distortions, which can occur if reagent is simultaneously
injected into adjacent points
Inst
alla
tion/
Ope
ratio
n
• Consider using a top down injection approach • Determine location of all subsurface utilities and artifacts before drilling • Perform injections beginning from the downgradient portion of the plume toward the upgradient side or
perform from the outside toward the center • Always use o-rings or Teflon® tape between individual sections of rods to prevent reagent from seeping
through the rod joints • Do not simultaneously push reagents into adjacent points, which can result in flow distortions • Monitor pressures during injection. High pressure could indicate that the injection screen is clogged
and increases the possibility for daylighting. Fracturing also could occur • Monitor for daylighting around the injection point. If daylighting is observed to occur, reduce flowrate
or move to another location • Monitor injection temperature, especially when exothermic reactions are expected • Monitor soil vapor and ambient air concentrations when formation of gases and/or high temperatures
are expected 4.2.3 Application through Horizontal Wells
Installation and operation of horizontal wells may be advantageous if there are aboveground structures, such as buildings, busy roads, runways, railways, etc., that prevent adequate distribution of amendments using other techniques. Thin contaminant plumes also may be good candidates for treatment using horizontal wells since they can achieve greater contact between the well screen and the contaminated zone compared to vertical wells in this circumstance. For environmental applications, horizontal wells initially were used to perform air sparging and soil vapor extraction, but more recently have been used for the introduction of liquid reagents and
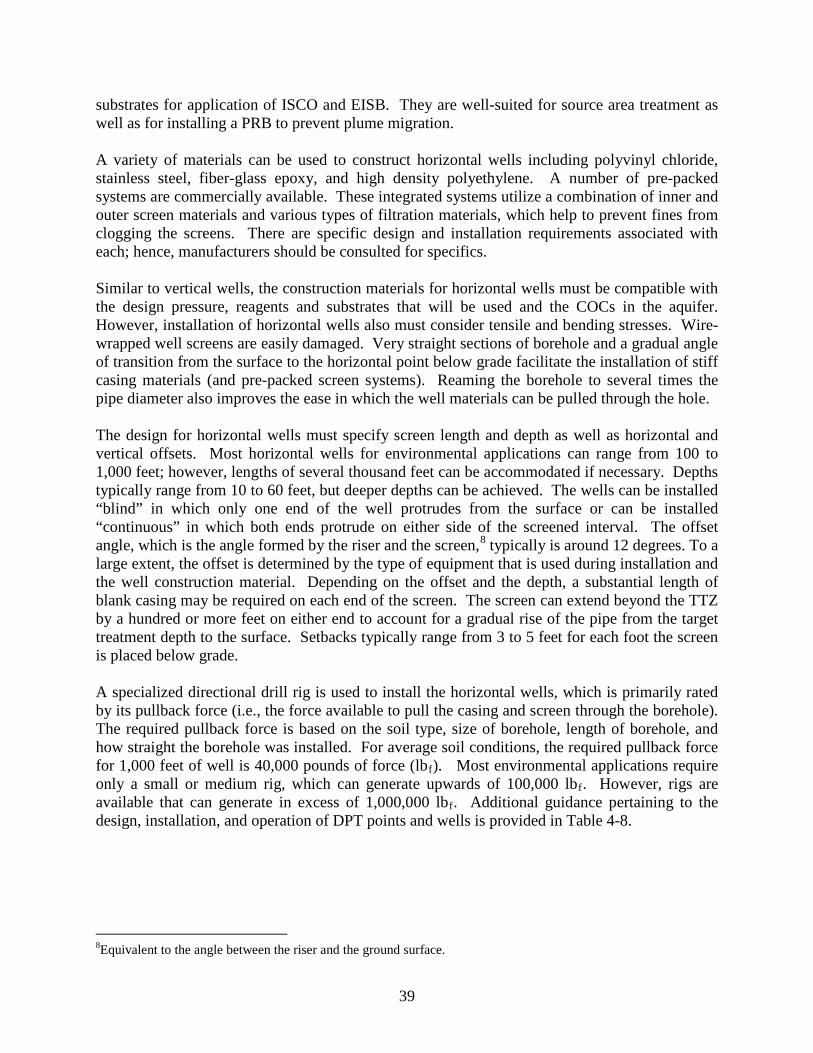
39
substrates for application of ISCO and EISB. They are well-suited for source area treatment as well as for installing a PRB to prevent plume migration. A variety of materials can be used to construct horizontal wells including polyvinyl chloride, stainless steel, fiber-glass epoxy, and high density polyethylene. A number of pre-packed systems are commercially available. These integrated systems utilize a combination of inner and outer screen materials and various types of filtration materials, which help to prevent fines from clogging the screens. There are specific design and installation requirements associated with each; hence, manufacturers should be consulted for specifics. Similar to vertical wells, the construction materials for horizontal wells must be compatible with the design pressure, reagents and substrates that will be used and the COCs in the aquifer. However, installation of horizontal wells also must consider tensile and bending stresses. Wire-wrapped well screens are easily damaged. Very straight sections of borehole and a gradual angle of transition from the surface to the horizontal point below grade facilitate the installation of stiff casing materials (and pre-packed screen systems). Reaming the borehole to several times the pipe diameter also improves the ease in which the well materials can be pulled through the hole. The design for horizontal wells must specify screen length and depth as well as horizontal and vertical offsets. Most horizontal wells for environmental applications can range from 100 to 1,000 feet; however, lengths of several thousand feet can be accommodated if necessary. Depths typically range from 10 to 60 feet, but deeper depths can be achieved. The wells can be installed “blind” in which only one end of the well protrudes from the surface or can be installed “continuous” in which both ends protrude on either side of the screened interval. The offset angle, which is the angle formed by the riser and the screen,8 typically is around 12 degrees. To a large extent, the offset is determined by the type of equipment that is used during installation and the well construction material. Depending on the offset and the depth, a substantial length of blank casing may be required on each end of the screen. The screen can extend beyond the TTZ by a hundred or more feet on either end to account for a gradual rise of the pipe from the target treatment depth to the surface. Setbacks typically range from 3 to 5 feet for each foot the screen is placed below grade. A specialized directional drill rig is used to install the horizontal wells, which is primarily rated by its pullback force (i.e., the force available to pull the casing and screen through the borehole). The required pullback force is based on the soil type, size of borehole, length of borehole, and how straight the borehole was installed. For average soil conditions, the required pullback force for 1,000 feet of well is 40,000 pounds of force (lbf). Most environmental applications require only a small or medium rig, which can generate upwards of 100,000 lbf. However, rigs are available that can generate in excess of 1,000,000 lbf. Additional guidance pertaining to the design, installation, and operation of DPT points and wells is provided in Table 4-8.
8Equivalent to the angle between the riser and the ground surface.
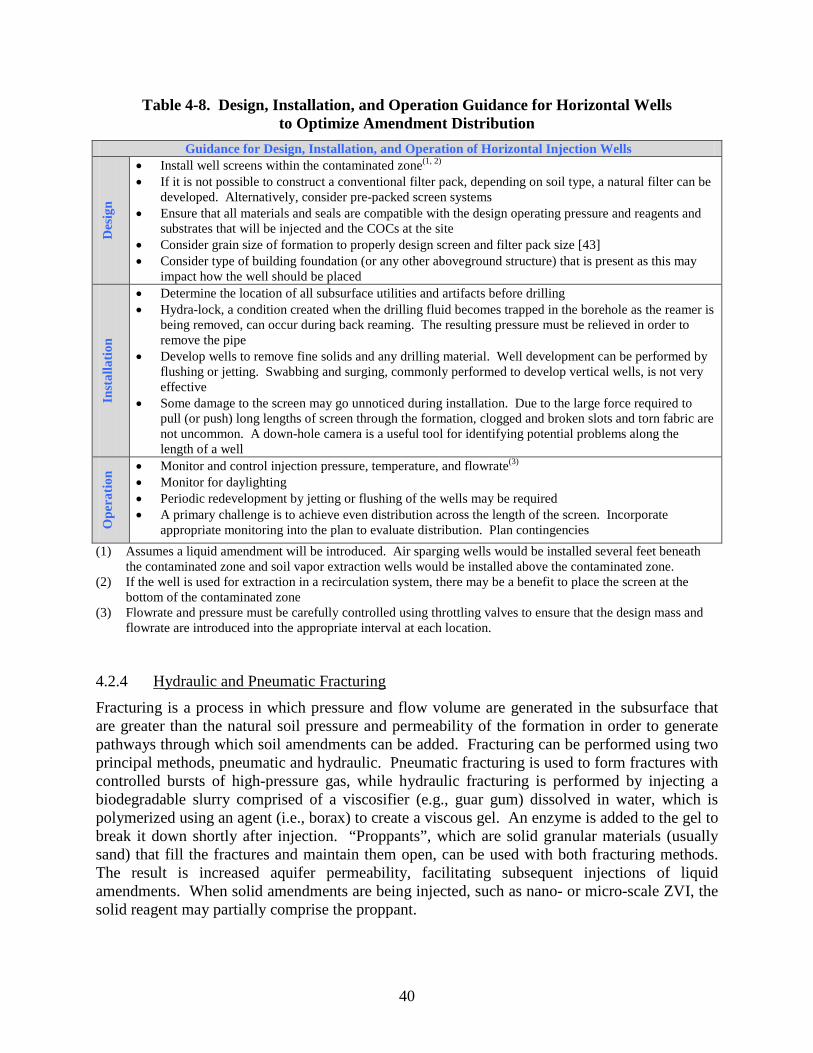
40
Table 4-8. Design, Installation, and Operation Guidance for Horizontal Wells to Optimize Amendment Distribution
Guidance for Design, Installation, and Operation of Horizontal Injection Wells
Des
ign
• Install well screens within the contaminated zone(1, 2) • If it is not possible to construct a conventional filter pack, depending on soil type, a natural filter can be
developed. Alternatively, consider pre-packed screen systems • Ensure that all materials and seals are compatible with the design operating pressure and reagents and
substrates that will be injected and the COCs at the site • Consider grain size of formation to properly design screen and filter pack size [43] • Consider type of building foundation (or any other aboveground structure) that is present as this may
impact how the well should be placed
Inst
alla
tion
• Determine the location of all subsurface utilities and artifacts before drilling • Hydra-lock, a condition created when the drilling fluid becomes trapped in the borehole as the reamer is
being removed, can occur during back reaming. The resulting pressure must be relieved in order to remove the pipe
• Develop wells to remove fine solids and any drilling material. Well development can be performed by flushing or jetting. Swabbing and surging, commonly performed to develop vertical wells, is not very effective
• Some damage to the screen may go unnoticed during installation. Due to the large force required to pull (or push) long lengths of screen through the formation, clogged and broken slots and torn fabric are not uncommon. A down-hole camera is a useful tool for identifying potential problems along the length of a well
Ope
ratio
n • Monitor and control injection pressure, temperature, and flowrate(3) • Monitor for daylighting • Periodic redevelopment by jetting or flushing of the wells may be required • A primary challenge is to achieve even distribution across the length of the screen. Incorporate
appropriate monitoring into the plan to evaluate distribution. Plan contingencies (1) Assumes a liquid amendment will be introduced. Air sparging wells would be installed several feet beneath
the contaminated zone and soil vapor extraction wells would be installed above the contaminated zone. (2) If the well is used for extraction in a recirculation system, there may be a benefit to place the screen at the
bottom of the contaminated zone (3) Flowrate and pressure must be carefully controlled using throttling valves to ensure that the design mass and
flowrate are introduced into the appropriate interval at each location. 4.2.4 Hydraulic and Pneumatic Fracturing
Fracturing is a process in which pressure and flow volume are generated in the subsurface that are greater than the natural soil pressure and permeability of the formation in order to generate pathways through which soil amendments can be added. Fracturing can be performed using two principal methods, pneumatic and hydraulic. Pneumatic fracturing is used to form fractures with controlled bursts of high-pressure gas, while hydraulic fracturing is performed by injecting a biodegradable slurry comprised of a viscosifier (e.g., guar gum) dissolved in water, which is polymerized using an agent (i.e., borax) to create a viscous gel. An enzyme is added to the gel to break it down shortly after injection. “Proppants”, which are solid granular materials (usually sand) that fill the fractures and maintain them open, can be used with both fracturing methods. The result is increased aquifer permeability, facilitating subsequent injections of liquid amendments. When solid amendments are being injected, such as nano- or micro-scale ZVI, the solid reagent may partially comprise the proppant.
41
Fracturing is performed to increase the permeability and conductivity of the formation, which allows the practitioner to achieve a greater injection well ROI. Hence, fracturing is most applicable to low permeability formations, clay soils, glacial tills, bedrock, etc. in which the injection ROI is limited. Fracture propagation distances of 30 to 60 feet are common in rock formations. Propagation distances of 20 to 40 feet can be achieved in unconsolidated materials such as silts and clays. In most cases, amendments are introduced either during the fracturing process or immediately after with the equipment used to generate the fractures. However, if it is determined that it will be necessary to inject amendments at a future date or to perform multiple injections, wells can be installed. The wells may be nested, each having one or more screens intersecting a series of fractures. The propagated geometry of the fractures is monitored in real time to ensure that overlap of the fractures takes place as desired. Monitoring can be performed by evaluating changes in resistance of the formation using downhole resistivity sensors. In addition, pressure influence at surrounding monitoring wells can be measured using surface gauges and downhole pressure transducers. In the case of pneumatic fracturing, visual evidence of off-gassing of the carrier gas (e.g., nitrogen) may be apparent in nearby monitoring wells. Surface monitoring should be performed in the vicinity of the injection points. Heave rods and transits can be used; however, monitoring using biaxial tiltmeters can measure very small deflections of ground surface (i.e., 0.0001 degrees). It is especially important to monitor for surface changes when buildings and utilities are present. Also, surface changes tend to be greatest when solid proppants are used. Figure 4-7 illustrates a crack and uplift that was noted during the injection of a proppant consisting of sand and ZVI at a site located in northern California. Methods and tooling used to create the fractures and introduce amendments into the aquifer matrix vary from vendor to vendor. Much of the tooling is proprietary and/or patented. However, the general approach consists of first creating a borehole at the desired location. A high pressure tool is used to create a notch in the direction of the desired fracture. Packers can be used to isolate the correct vertical interval. Pressurized gas or liquid is then introduced through a nozzle at a high flowrate to propagate the fractures outward from the notch. Depending on the type of amendment and the carrier fluid used, the amendment can be added at the time the fracture is created or it can be added immediately after it is formed. The process is repeated multiple times at different intervals and in different boreholes to create the desired
Source: NAVFAC Cost and Performance Report for Persulfate Treatability Studies [27]
Figure 4-7. Surface Fracture and Uplift Formed during Pneumatic Injection of ZVI
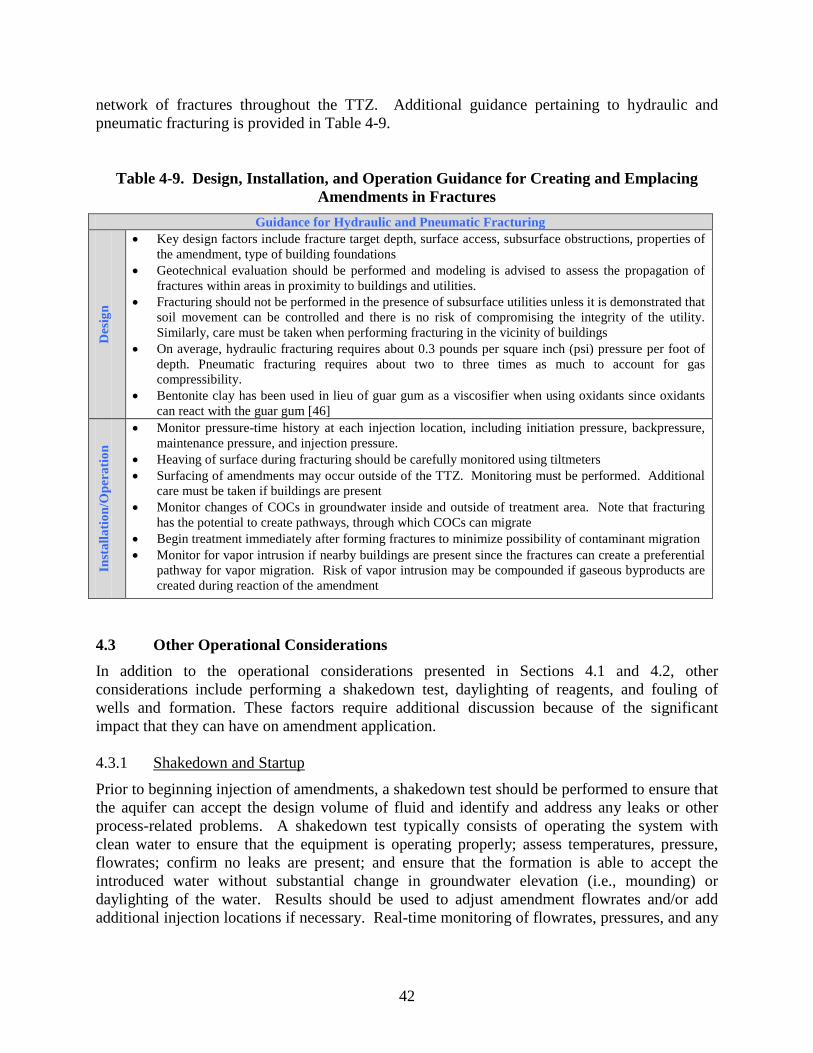
42
network of fractures throughout the TTZ. Additional guidance pertaining to hydraulic and pneumatic fracturing is provided in Table 4-9.
Table 4-9. Design, Installation, and Operation Guidance for Creating and Emplacing Amendments in Fractures
Guidance for Hydraulic and Pneumatic Fracturing
Des
ign
• Key design factors include fracture target depth, surface access, subsurface obstructions, properties of the amendment, type of building foundations
• Geotechnical evaluation should be performed and modeling is advised to assess the propagation of fractures within areas in proximity to buildings and utilities.
• Fracturing should not be performed in the presence of subsurface utilities unless it is demonstrated that soil movement can be controlled and there is no risk of compromising the integrity of the utility. Similarly, care must be taken when performing fracturing in the vicinity of buildings
• On average, hydraulic fracturing requires about 0.3 pounds per square inch (psi) pressure per foot of depth. Pneumatic fracturing requires about two to three times as much to account for gas compressibility.
• Bentonite clay has been used in lieu of guar gum as a viscosifier when using oxidants since oxidants can react with the guar gum [46]
Inst
alla
tion/
Ope
ratio
n
• Monitor pressure-time history at each injection location, including initiation pressure, backpressure, maintenance pressure, and injection pressure.
• Heaving of surface during fracturing should be carefully monitored using tiltmeters • Surfacing of amendments may occur outside of the TTZ. Monitoring must be performed. Additional
care must be taken if buildings are present • Monitor changes of COCs in groundwater inside and outside of treatment area. Note that fracturing
has the potential to create pathways, through which COCs can migrate • Begin treatment immediately after forming fractures to minimize possibility of contaminant migration • Monitor for vapor intrusion if nearby buildings are present since the fractures can create a preferential
pathway for vapor migration. Risk of vapor intrusion may be compounded if gaseous byproducts are created during reaction of the amendment
4.3 Other Operational Considerations In addition to the operational considerations presented in Sections 4.1 and 4.2, other considerations include performing a shakedown test, daylighting of reagents, and fouling of wells and formation. These factors require additional discussion because of the significant impact that they can have on amendment application. 4.3.1 Shakedown and Startup
Prior to beginning injection of amendments, a shakedown test should be performed to ensure that the aquifer can accept the design volume of fluid and identify and address any leaks or other process-related problems. A shakedown test typically consists of operating the system with clean water to ensure that the equipment is operating properly; assess temperatures, pressure, flowrates; confirm no leaks are present; and ensure that the formation is able to accept the introduced water without substantial change in groundwater elevation (i.e., mounding) or daylighting of the water. Results should be used to adjust amendment flowrates and/or add additional injection locations if necessary. Real-time monitoring of flowrates, pressures, and any
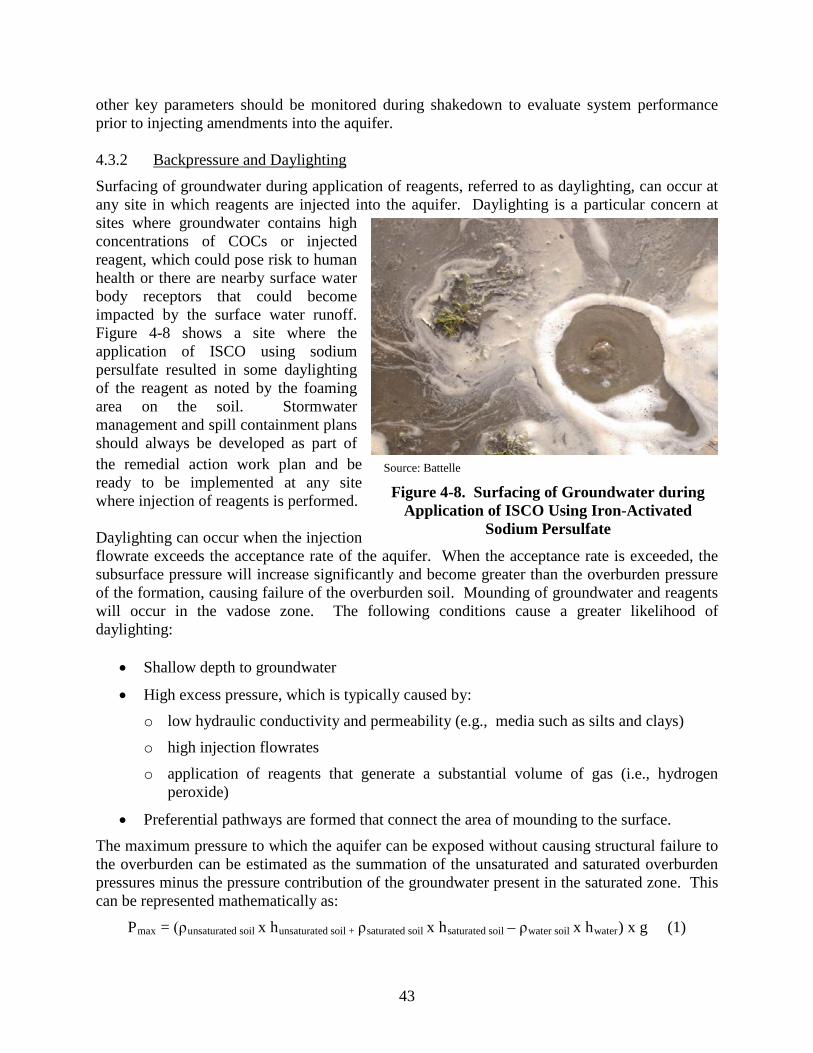
43
other key parameters should be monitored during shakedown to evaluate system performance prior to injecting amendments into the aquifer. 4.3.2 Backpressure and Daylighting
Surfacing of groundwater during application of reagents, referred to as daylighting, can occur at any site in which reagents are injected into the aquifer. Daylighting is a particular concern at sites where groundwater contains high concentrations of COCs or injected reagent, which could pose risk to human health or there are nearby surface water body receptors that could become impacted by the surface water runoff. Figure 4-8 shows a site where the application of ISCO using sodium persulfate resulted in some daylighting of the reagent as noted by the foaming area on the soil. Stormwater management and spill containment plans should always be developed as part of the remedial action work plan and be ready to be implemented at any site where injection of reagents is performed. Daylighting can occur when the injection flowrate exceeds the acceptance rate of the aquifer. When the acceptance rate is exceeded, the subsurface pressure will increase significantly and become greater than the overburden pressure of the formation, causing failure of the overburden soil. Mounding of groundwater and reagents will occur in the vadose zone. The following conditions cause a greater likelihood of daylighting:
• Shallow depth to groundwater
• High excess pressure, which is typically caused by: o low hydraulic conductivity and permeability (e.g., media such as silts and clays)
o high injection flowrates
o application of reagents that generate a substantial volume of gas (i.e., hydrogen peroxide)
• Preferential pathways are formed that connect the area of mounding to the surface. The maximum pressure to which the aquifer can be exposed without causing structural failure to the overburden can be estimated as the summation of the unsaturated and saturated overburden pressures minus the pressure contribution of the groundwater present in the saturated zone. This can be represented mathematically as:
Pmax = (ρunsaturated soil x hunsaturated soil + ρsaturated soil x hsaturated soil – ρwater soil x hwater) x g (1)
Source: Battelle
Figure 4-8. Surfacing of Groundwater during Application of ISCO Using Iron-Activated
Sodium Persulfate
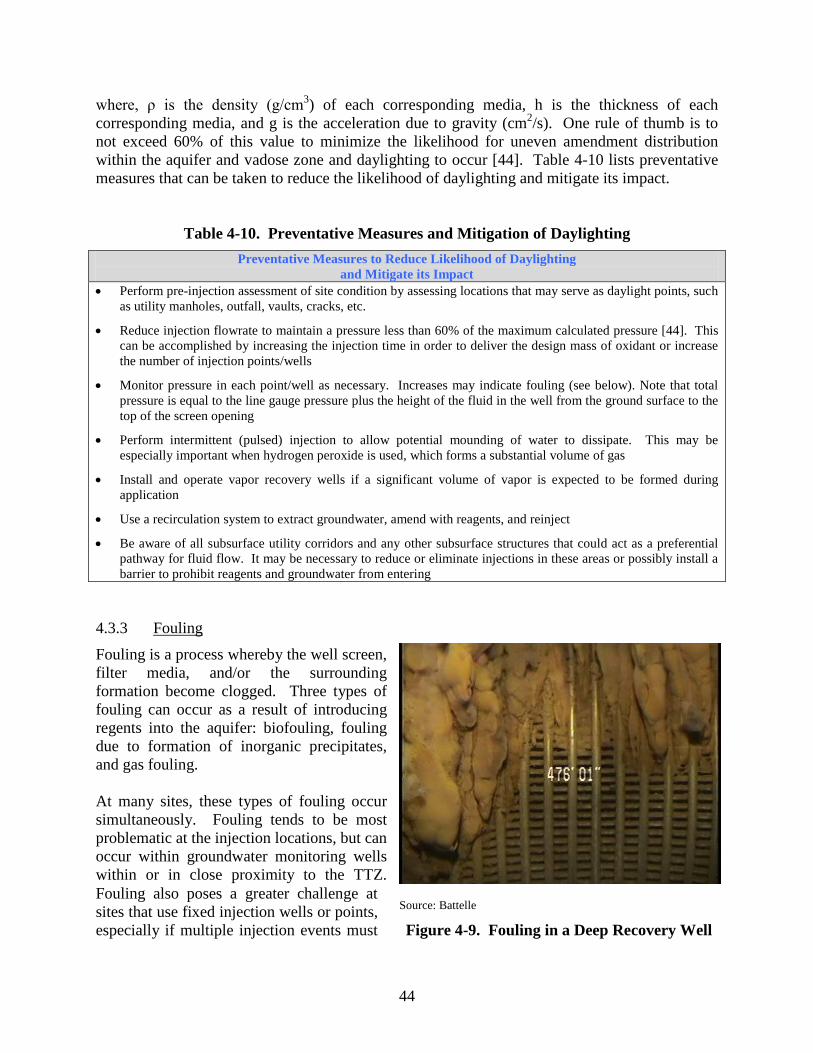
44
where, ρ is the density (g/cm3) of each corresponding media, h is the thickness of each corresponding media, and g is the acceleration due to gravity (cm2/s). One rule of thumb is to not exceed 60% of this value to minimize the likelihood for uneven amendment distribution within the aquifer and vadose zone and daylighting to occur [44]. Table 4-10 lists preventative measures that can be taken to reduce the likelihood of daylighting and mitigate its impact.
Table 4-10. Preventative Measures and Mitigation of Daylighting Preventative Measures to Reduce Likelihood of Daylighting
and Mitigate its Impact • Perform pre-injection assessment of site condition by assessing locations that may serve as daylight points, such
as utility manholes, outfall, vaults, cracks, etc.
• Reduce injection flowrate to maintain a pressure less than 60% of the maximum calculated pressure [44]. This can be accomplished by increasing the injection time in order to deliver the design mass of oxidant or increase the number of injection points/wells
• Monitor pressure in each point/well as necessary. Increases may indicate fouling (see below). Note that total pressure is equal to the line gauge pressure plus the height of the fluid in the well from the ground surface to the top of the screen opening
• Perform intermittent (pulsed) injection to allow potential mounding of water to dissipate. This may be especially important when hydrogen peroxide is used, which forms a substantial volume of gas
• Install and operate vapor recovery wells if a significant volume of vapor is expected to be formed during application
• Use a recirculation system to extract groundwater, amend with reagents, and reinject
• Be aware of all subsurface utility corridors and any other subsurface structures that could act as a preferential pathway for fluid flow. It may be necessary to reduce or eliminate injections in these areas or possibly install a barrier to prohibit reagents and groundwater from entering
4.3.3 Fouling
Fouling is a process whereby the well screen, filter media, and/or the surrounding formation become clogged. Three types of fouling can occur as a result of introducing regents into the aquifer: biofouling, fouling due to formation of inorganic precipitates, and gas fouling. At many sites, these types of fouling occur simultaneously. Fouling tends to be most problematic at the injection locations, but can occur within groundwater monitoring wells within or in close proximity to the TTZ. Fouling also poses a greater challenge at sites that use fixed injection wells or points, especially if multiple injection events must
Source: Battelle Figure 4-9. Fouling in a Deep Recovery Well
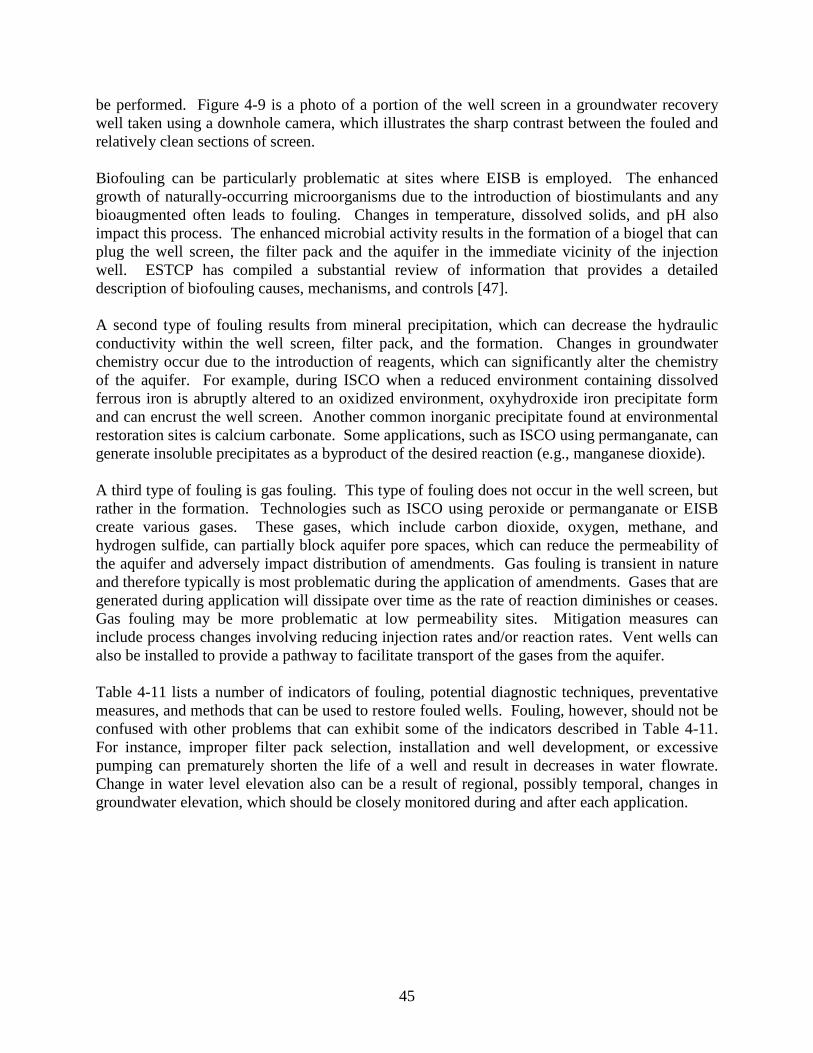
45
be performed. Figure 4-9 is a photo of a portion of the well screen in a groundwater recovery well taken using a downhole camera, which illustrates the sharp contrast between the fouled and relatively clean sections of screen. Biofouling can be particularly problematic at sites where EISB is employed. The enhanced growth of naturally-occurring microorganisms due to the introduction of biostimulants and any bioaugmented often leads to fouling. Changes in temperature, dissolved solids, and pH also impact this process. The enhanced microbial activity results in the formation of a biogel that can plug the well screen, the filter pack and the aquifer in the immediate vicinity of the injection well. ESTCP has compiled a substantial review of information that provides a detailed description of biofouling causes, mechanisms, and controls [47]. A second type of fouling results from mineral precipitation, which can decrease the hydraulic conductivity within the well screen, filter pack, and the formation. Changes in groundwater chemistry occur due to the introduction of reagents, which can significantly alter the chemistry of the aquifer. For example, during ISCO when a reduced environment containing dissolved ferrous iron is abruptly altered to an oxidized environment, oxyhydroxide iron precipitate form and can encrust the well screen. Another common inorganic precipitate found at environmental restoration sites is calcium carbonate. Some applications, such as ISCO using permanganate, can generate insoluble precipitates as a byproduct of the desired reaction (e.g., manganese dioxide). A third type of fouling is gas fouling. This type of fouling does not occur in the well screen, but rather in the formation. Technologies such as ISCO using peroxide or permanganate or EISB create various gases. These gases, which include carbon dioxide, oxygen, methane, and hydrogen sulfide, can partially block aquifer pore spaces, which can reduce the permeability of the aquifer and adversely impact distribution of amendments. Gas fouling is transient in nature and therefore typically is most problematic during the application of amendments. Gases that are generated during application will dissipate over time as the rate of reaction diminishes or ceases. Gas fouling may be more problematic at low permeability sites. Mitigation measures can include process changes involving reducing injection rates and/or reaction rates. Vent wells can also be installed to provide a pathway to facilitate transport of the gases from the aquifer. Table 4-11 lists a number of indicators of fouling, potential diagnostic techniques, preventative measures, and methods that can be used to restore fouled wells. Fouling, however, should not be confused with other problems that can exhibit some of the indicators described in Table 4-11. For instance, improper filter pack selection, installation and well development, or excessive pumping can prematurely shorten the life of a well and result in decreases in water flowrate. Change in water level elevation also can be a result of regional, possibly temporal, changes in groundwater elevation, which should be closely monitored during and after each application.
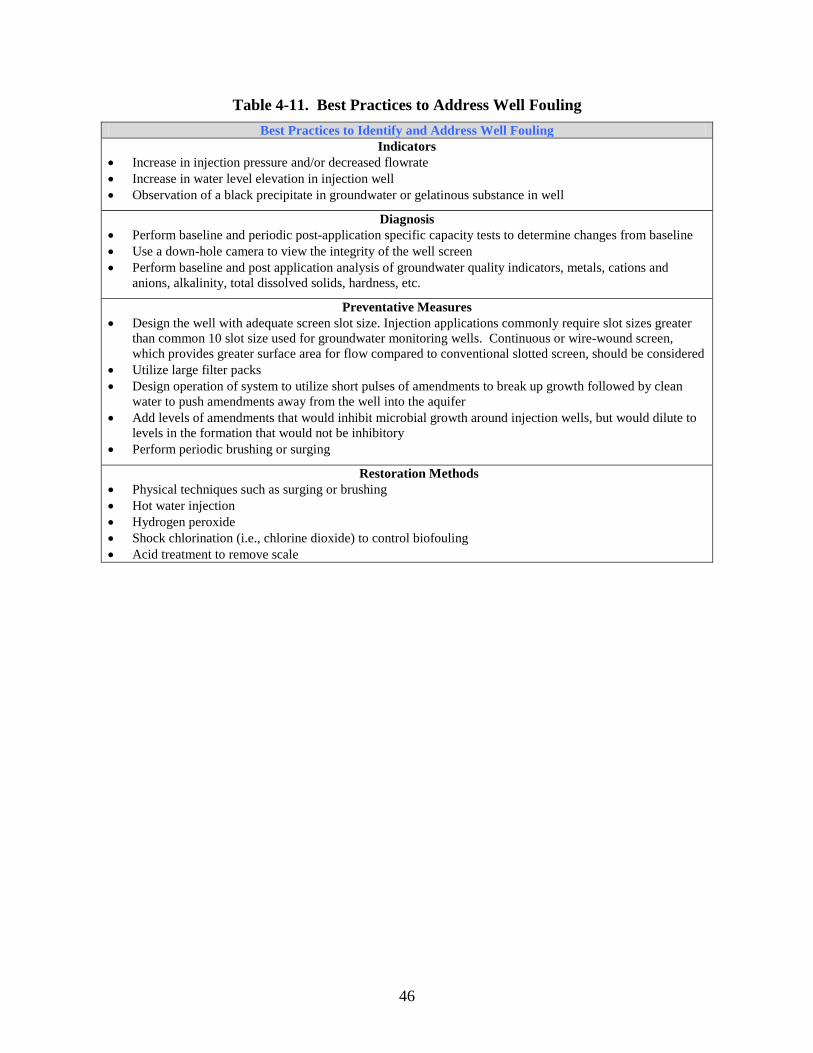
46
Table 4-11. Best Practices to Address Well Fouling Best Practices to Identify and Address Well Fouling
Indicators • Increase in injection pressure and/or decreased flowrate • Increase in water level elevation in injection well • Observation of a black precipitate in groundwater or gelatinous substance in well
Diagnosis • Perform baseline and periodic post-application specific capacity tests to determine changes from baseline • Use a down-hole camera to view the integrity of the well screen • Perform baseline and post application analysis of groundwater quality indicators, metals, cations and
anions, alkalinity, total dissolved solids, hardness, etc.
Preventative Measures • Design the well with adequate screen slot size. Injection applications commonly require slot sizes greater
than common 10 slot size used for groundwater monitoring wells. Continuous or wire-wound screen, which provides greater surface area for flow compared to conventional slotted screen, should be considered
• Utilize large filter packs • Design operation of system to utilize short pulses of amendments to break up growth followed by clean
water to push amendments away from the well into the aquifer • Add levels of amendments that would inhibit microbial growth around injection wells, but would dilute to
levels in the formation that would not be inhibitory • Perform periodic brushing or surging
Restoration Methods • Physical techniques such as surging or brushing • Hot water injection • Hydrogen peroxide • Shock chlorination (i.e., chlorine dioxide) to control biofouling • Acid treatment to remove scale
47
5.0 MONITORING AND VERIFICATION REQUIREMENTS FOR EVALUATING DISTRIBUTION OF AMENDMENTS
A performance monitoring program should be developed as part of the injection plan. It should provide the framework for evaluating compliance with performance objectives, evaluate the efficacy of the injections, and optimize the strategy for future injection events. Specifically, the performance monitoring program should prescribe the following:
• The measurements that will be performed
• The metrics by which the measurements will be evaluated
• Applicable milestones
• Contingency triggers (i.e., additional injections, alternate technology) in the event that milestones are not being achieved
• Specific criteria that define the end point of the technology that is being applied. The performance monitoring plan includes two distinct categories of monitoring: process monitoring and performance monitoring. Process monitoring involves monitoring those parameters that provide information on the state of the remedial action during implementation. This consists of confirming that the amendments are introduced and distributed into the aquifer according to the design. This includes measuring changes in physical parameters such as pressures, temperatures, flowrates and groundwater levels in injection and monitoring wells. Chemical changes in the aquifer such as changes in DO, ORP, pH, and conductivity are measured to evaluate the distribution of amendments and the need to perform additional injections. Also, there are a number of monitoring techniques that can be employed to further evaluate the distribution of specific amendments using a particular technology. Table 5-1 lists a number of process monitoring parameters that are measured routinely during the application of amendments. Performance monitoring includes monitoring parameters that provide information on the potential success of the remedial action to achieve RGs for the phase of remediation and for the overall project. This is accomplished through sampling and analysis of groundwater and sometimes soil for the target contaminants within and possibly downgradient of the target area to estimate mass removal efficiency. At most sites, the parameters that were measured during process monitoring are also measured at regular intervals to evaluate their return to baseline conditions. Performance monitoring is very important for evaluating if and when additional injections are required and will help to optimize dosing and injection spacing should additional injections be necessary.9 5.1 Field Assessment Techniques There are a number of different sampling and analytical techniques that can be used to measure remedial progress. Many of these techniques can be performed in the field to yield real-time data. Hence, they are commonly applied as part of the process monitoring strategy. Immediate results allow decisions to be made on site to optimize the injection strategy to enhance
9Performance monitoring should not be initiated too soon after injection because the delay of contaminant rebound can give a false indication that contaminants have been remediated.
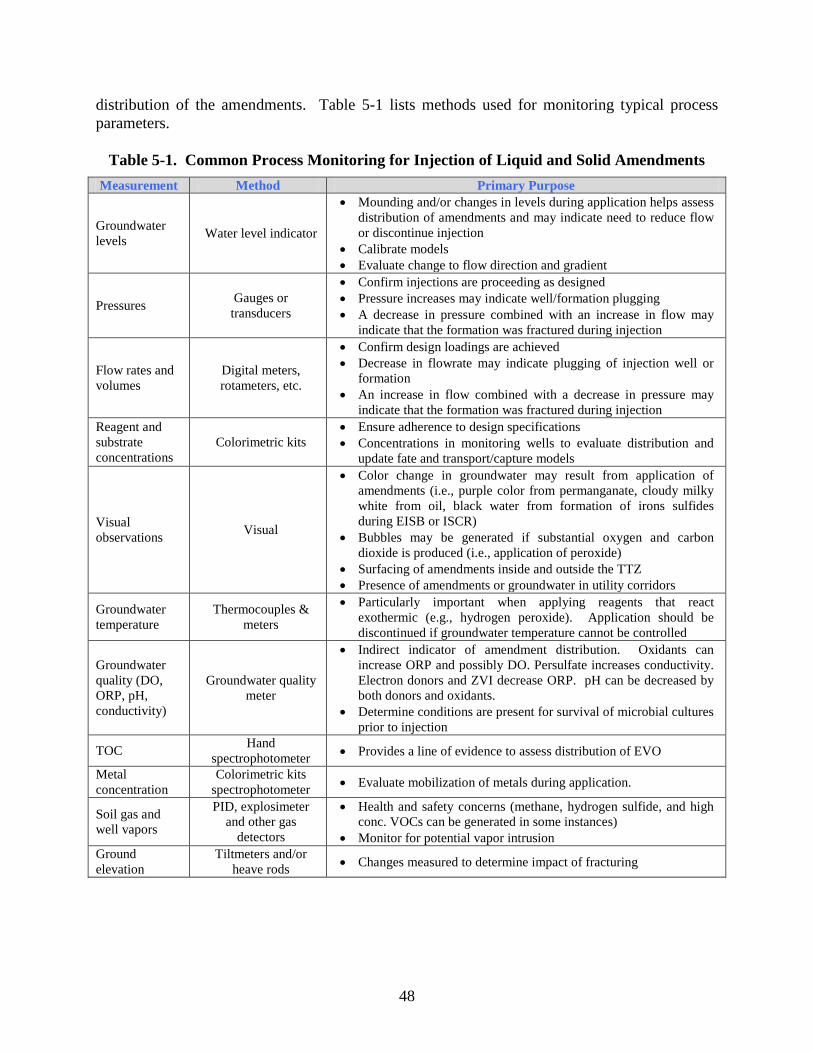
48
distribution of the amendments. Table 5-1 lists methods used for monitoring typical process parameters.
Table 5-1. Common Process Monitoring for Injection of Liquid and Solid Amendments
Measurement Method Primary Purpose
Groundwater levels Water level indicator
• Mounding and/or changes in levels during application helps assess distribution of amendments and may indicate need to reduce flow or discontinue injection
• Calibrate models • Evaluate change to flow direction and gradient
Pressures Gauges or transducers
• Confirm injections are proceeding as designed • Pressure increases may indicate well/formation plugging • A decrease in pressure combined with an increase in flow may
indicate that the formation was fractured during injection
Flow rates and volumes
Digital meters, rotameters, etc.
• Confirm design loadings are achieved • Decrease in flowrate may indicate plugging of injection well or
formation • An increase in flow combined with a decrease in pressure may
indicate that the formation was fractured during injection Reagent and substrate concentrations
Colorimetric kits • Ensure adherence to design specifications • Concentrations in monitoring wells to evaluate distribution and
update fate and transport/capture models
Visual observations Visual
• Color change in groundwater may result from application of amendments (i.e., purple color from permanganate, cloudy milky white from oil, black water from formation of irons sulfides during EISB or ISCR)
• Bubbles may be generated if substantial oxygen and carbon dioxide is produced (i.e., application of peroxide)
• Surfacing of amendments inside and outside the TTZ • Presence of amendments or groundwater in utility corridors
Groundwater temperature
Thermocouples & meters
• Particularly important when applying reagents that react exothermic (e.g., hydrogen peroxide). Application should be discontinued if groundwater temperature cannot be controlled
Groundwater quality (DO, ORP, pH, conductivity)
Groundwater quality meter
• Indirect indicator of amendment distribution. Oxidants can increase ORP and possibly DO. Persulfate increases conductivity. Electron donors and ZVI decrease ORP. pH can be decreased by both donors and oxidants.
• Determine conditions are present for survival of microbial cultures prior to injection
TOC Hand spectrophotometer • Provides a line of evidence to assess distribution of EVO
Metal concentration
Colorimetric kits spectrophotometer • Evaluate mobilization of metals during application.
Soil gas and well vapors
PID, explosimeter and other gas
detectors
• Health and safety concerns (methane, hydrogen sulfide, and high conc. VOCs can be generated in some instances)
• Monitor for potential vapor intrusion Ground elevation
Tiltmeters and/or heave rods • Changes measured to determine impact of fracturing
49
In addition to the methods listed in Table 5-1, other techniques are occasionally used to help assess the distribution of amendments. As discussed in Section 3.1, a number of high resolution field techniques have been developed to identify and target the permeable areas that contain COCs as well as monitor the distribution of amendments as they are being introduced into the aquifer. Field evaluation methods also include using a tracer such as sodium bromide or rhodamine dye to trace the movement of injected fluids and groundwater during application. However, tracers tend to be used less during full-scale application than pilot testing due to the large number of primary and secondary indicators that are available to evaluate the distribution of the majority of amendments used. Other methods used to evaluate amendment distribution include various geophysical tools, which use non-invasive techniques. Methods include:
• Ground penetrating radar • Electrical resistance tomography • Seismic refraction.
In some instances, it may be appropriate to use these techniques to better characterize the placement and distribution of amendments. Seismic monitoring using tiltmeters to evaluate fracture networks is becoming common at sites where pneumatic and hydraulic placement of amendments is performed (see Section 7). However, in general, the cost and limitations of these technologies have limited their use for confirming and optimizing distribution of amendments. Additional research is being performed to better determine real-time placement of amendments. For instance, the DON, in collaboration with SERDP and ESTCP, is investigating a system to automatically collect and map in near real time the time-lapsed spatial distribution of injected amendments [48]. 5.2 Laboratory Analysis In general, laboratory analyses are geared more toward long-term performance monitoring than process monitoring since, as shown in Table 5-1, there are a variety of methods and indicators that are readily available in the field to assess the distribution of amendments and because several days to several weeks typically are required to receive laboratory results. Samples sent to laboratories generally include groundwater and sometimes soil to analyze for COCs after the amendments have been added and possible byproducts of the application, such as an increased level of metals. Analysis of the presence and concentrations of amendments that persist for an extended duration can also be performed. Detailed discussion of analytical methods and procedures associated with performance monitoring can be found in the documents listed in Section 3.3.2.
50
6.0 LESSONS LEARNED AND RECOMMENDATIONS FOR BEST PRACTICE There are many lessons that have been learned relating to the use of specific technologies and amendments. Many of these have been described throughout this document and additional insight is provided in the associated references. However, the most important lessons learned are common to all of the technologies and amendments that have been applied at sites. Of particular importance is that project success is largely a function of the ability to adequately distribute the amendments, which in turn is contingent on the level of understanding site conditions. There are always uncertainties in the CSM. It is important to understand potential impacts of these uncertainties and to plan for appropriate contingencies. Furthermore, adequate process monitoring must be employed and flexibility maintained in the field so that deviations from the plan can be easily identified and strategies and approaches adapted to optimize application of the remedy. Great strides have been made to address these lessons including using approaches such as the observational method, as well as the development and application of advanced tools to better characterize sites and collect real-time data to better evaluate application performance and amendment distribution. Remedy optimization must be part of the strategy in order to respond to unanticipated outcomes resulting from uncertainties in the CSM, changes to the site as the remedy progresses, and also to incorporate advances in technology that have occurred over the course of the remedy. Optimization should be considered during remedy selection, design, and operation and should include practices such as:
• Establish and agree upon realistic and achievable operational milestones and metrics by which to measure the progress of the remedy. A treatment train approach is a proven strategy for achieving RAOs and RGs. Incorporate appropriate milestones and goals to determine when it is appropriate to transition from one technology to another.
• Ensure that the CSM is as complete as possible, is updated with all available data, and is continuously updated throughout the remedial process. A detailed understanding of geochemical and lithologic characteristics of the site, flow and mass transport, and transformation and retardations of contaminants and the proposed amendments is required to ensure adequate distribution and contact of the amendments with the COCs.
• Perform bench-scale and pilot testing to address critical data gaps in the CSM. Although additional time and costs are associated with this testing, experience has shown that these tests help to reduce uncertainty, which in turn reduces the overall life-cycle cost for the project.
• Incorporate a flexible design plan to allow design modifications and operating adjustments during the remedial action operation phase, without the need for high cost construction efforts. As an example, if multiple injection events are required and there is a concern for preferential pathways to develop during application, an appropriate design approach would be to introduce amendments through DPT points as opposed to permanent wells since the points can be relocated easily for each injection event.
• Utilize high resolution profiling where possible to target discrete intervals, thereby potentially reducing the mass of amendments and number and frequency of injections required.
51
• Consider a passive delivery system when possible to reduce both capital equipment and operating costs, and result in a more sustainable remedy.
• Incorporate a sufficient level of site characterization between injection events and use the results to update the CSM and subsequently the design for future amendment delivery events. In some cases, less reagent or substrate may be required after the initial event either because the TTZ has been reduced or concentrations of COCs have been reduced. However, it is important to note that sufficient time must be allowed after injecting amendments to allow the TTZ to return to equilibrium in order to evaluate any permanent changes that may have resulted from the application.
• Incorporate GSR practices into the design. Recent studies have shown that transportation of amendments and the amendments themselves are significant contributors to the carbon footprint. Optimizing the treatment system to reduce the mass of these chemicals will decrease the remedy footprint as well as reduce the overall life-cycle cost for the project.
52
7.0 CASE STUDIES Three projects for which the remedy consisted of in situ application of reagents and substrates are presented in this section. The first case study used a treatment train approach to apply ISCO using direct push injections and a recirculation approach followed by enhanced bioremediation and bioaugmentation to treat a chlorinated ethene plume. The second case study utilized a recirculation approach to perform source area treatment and install a series of downgradient biobarriers to treat a chlorinated solvent plume. The third project involved pneumatic fracturing to introduce ZVI to perform abiotic reductive dechlorination of a TCE plume. Each of these case studies emphasizes various principals and guidance discussed in this document. Lessons learned during each of these case studies are highlighted. 7.1 In Situ Chemical Oxidation and Enhanced Bioremediation Installation Restoration (IR) Site 26, located at former NAS Alameda, California, has groundwater contaminated with low levels of chlorinated solvents to a depth of approximately 15 ft below ground surface (bgs). The contamination is a result of activities at an aircraft wash-down area located toward the northwestern portion of the site. The RAO for groundwater at the site is to protect human health by preventing exposure of potential residents and occupational workers to VOCs in indoor air that could migrate from contaminated groundwater beneath the site. To achieve this RAO, groundwater RGs of 5 micrograms per liter (µg/L) for TCE, 6 µg/L for DCE, and 0.5 µg/L for VC were established. The remedy selected in the Record of Decision [49] consisted of performing ISCO followed by EISB. Peroxide Application ISCO was performed in two applications. The first application consisted of injecting approximately 8% hydrogen peroxide and 20 mmole citric acid (stabilizer) into the subsurface through 17 injection point clusters. Each cluster consisted of three injection points: a shallow point screened between 3 to 7 ft bgs, an intermediate point screened from 7 to 11 ft bgs, and a deep point screened from 11 to 15 ft bgs. The peroxide injection points (numbers 101 through 117) are shown in Figure 7-1. It was necessary to perform the first application in two rounds because of frequent surfacing of groundwater and increasing temperatures in the subsurface. The period between the injections allowed subsurface conditions to partially equilibrate before applying the remaining oxidant. Approximately 30,000 gallons of hydrogen peroxide was injected. A greater volume of oxidant was injected into the intermediate and deep points to target the higher levels of TCE and DCE known to be present at that depth. The volume of oxidant injected into each point also varied as a result of the ability of the point to accept the fluid. It was not possible to inject into a couple of the shallow points due to short circuiting of the oxidant to the surface. Post-ISCO performance monitoring consisted of collecting groundwater samples at 14 wells and piezometers and using a stainless steel sampling tool that is capable of collecting a representative groundwater sample at discrete depths without requiring the installation of a ground water monitoring well. The groundwater samples were analyzed for VOCs and metals. Field measurements of groundwater quality parameters including DO, ORP, pH, temperature, and conductivity were made at the time each sample was collected.
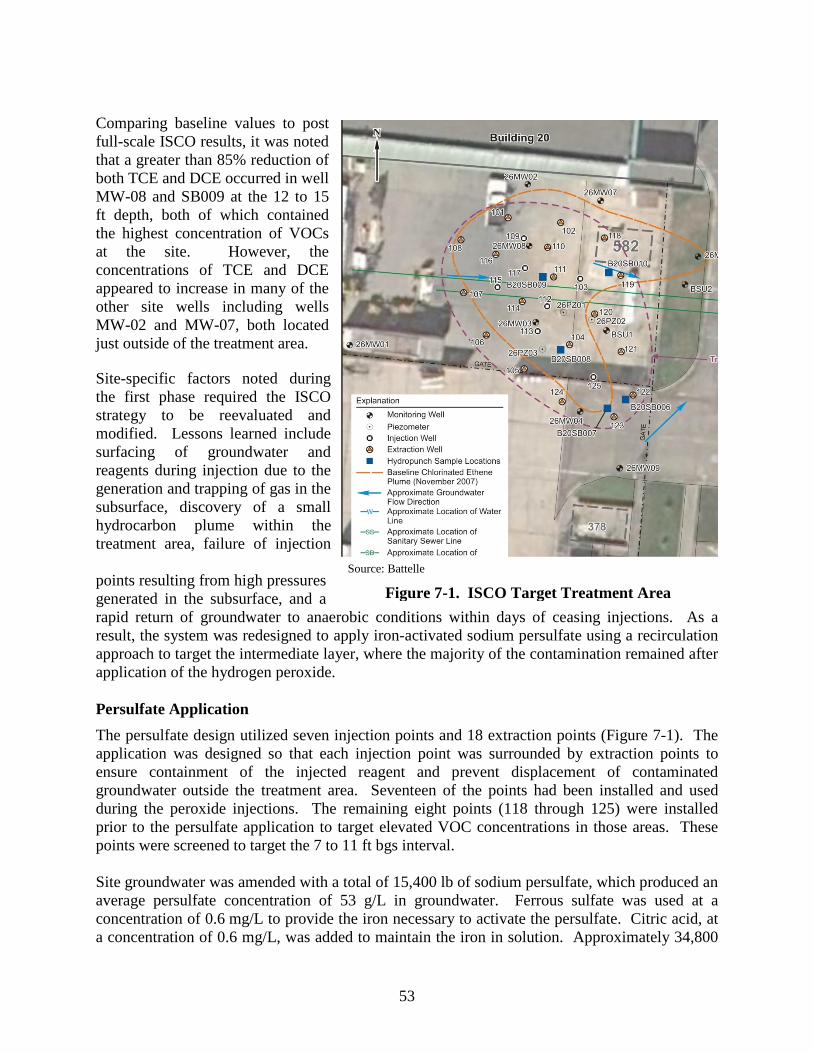
53
Comparing baseline values to post full-scale ISCO results, it was noted that a greater than 85% reduction of both TCE and DCE occurred in well MW-08 and SB009 at the 12 to 15 ft depth, both of which contained the highest concentration of VOCs at the site. However, the concentrations of TCE and DCE appeared to increase in many of the other site wells including wells MW-02 and MW-07, both located just outside of the treatment area. Site-specific factors noted during the first phase required the ISCO strategy to be reevaluated and modified. Lessons learned include surfacing of groundwater and reagents during injection due to the generation and trapping of gas in the subsurface, discovery of a small hydrocarbon plume within the treatment area, failure of injection
points resulting from high pressures generated in the subsurface, and a rapid return of groundwater to anaerobic conditions within days of ceasing injections. As a result, the system was redesigned to apply iron-activated sodium persulfate using a recirculation approach to target the intermediate layer, where the majority of the contamination remained after application of the hydrogen peroxide. Persulfate Application The persulfate design utilized seven injection points and 18 extraction points (Figure 7-1). The application was designed so that each injection point was surrounded by extraction points to ensure containment of the injected reagent and prevent displacement of contaminated groundwater outside the treatment area. Seventeen of the points had been installed and used during the peroxide injections. The remaining eight points (118 through 125) were installed prior to the persulfate application to target elevated VOC concentrations in those areas. These points were screened to target the 7 to 11 ft bgs interval. Site groundwater was amended with a total of 15,400 lb of sodium persulfate, which produced an average persulfate concentration of 53 g/L in groundwater. Ferrous sulfate was used at a concentration of 0.6 mg/L to provide the iron necessary to activate the persulfate. Citric acid, at a concentration of 0.6 mg/L, was added to maintain the iron in solution. Approximately 34,800
Source: Battelle
Figure 7-1. ISCO Target Treatment Area
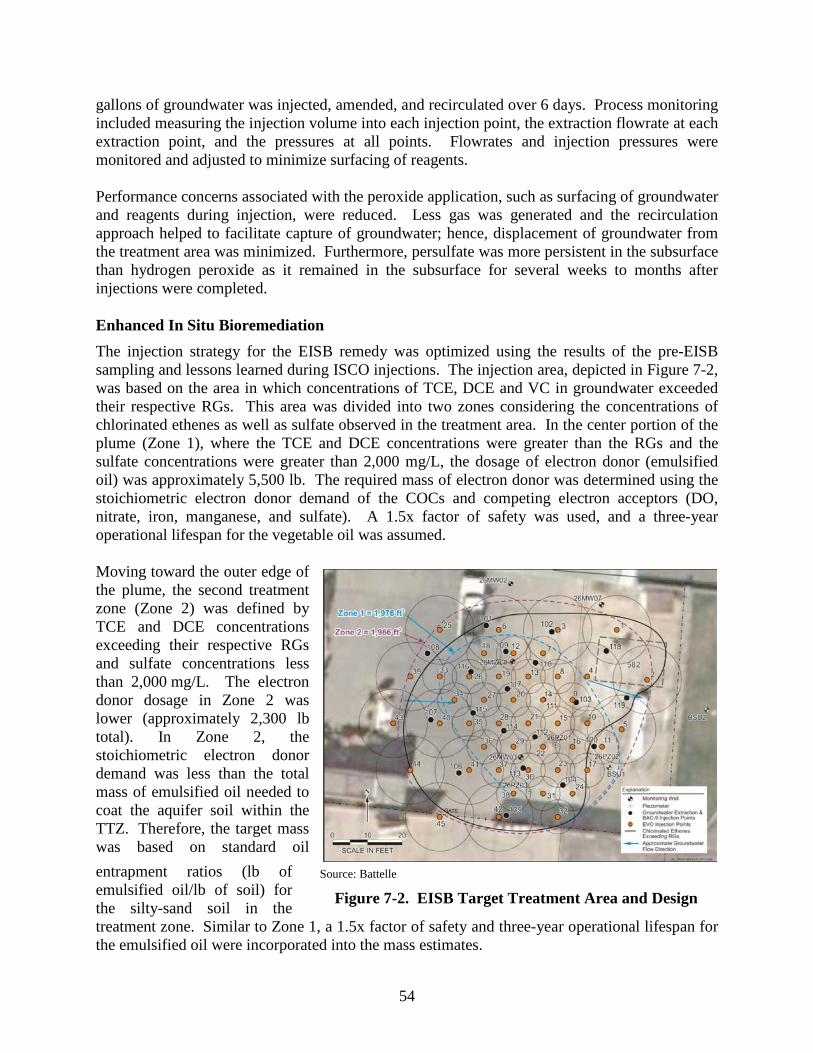
54
gallons of groundwater was injected, amended, and recirculated over 6 days. Process monitoring included measuring the injection volume into each injection point, the extraction flowrate at each extraction point, and the pressures at all points. Flowrates and injection pressures were monitored and adjusted to minimize surfacing of reagents. Performance concerns associated with the peroxide application, such as surfacing of groundwater and reagents during injection, were reduced. Less gas was generated and the recirculation approach helped to facilitate capture of groundwater; hence, displacement of groundwater from the treatment area was minimized. Furthermore, persulfate was more persistent in the subsurface than hydrogen peroxide as it remained in the subsurface for several weeks to months after injections were completed. Enhanced In Situ Bioremediation The injection strategy for the EISB remedy was optimized using the results of the pre-EISB sampling and lessons learned during ISCO injections. The injection area, depicted in Figure 7-2, was based on the area in which concentrations of TCE, DCE and VC in groundwater exceeded their respective RGs. This area was divided into two zones considering the concentrations of chlorinated ethenes as well as sulfate observed in the treatment area. In the center portion of the plume (Zone 1), where the TCE and DCE concentrations were greater than the RGs and the sulfate concentrations were greater than 2,000 mg/L, the dosage of electron donor (emulsified oil) was approximately 5,500 lb. The required mass of electron donor was determined using the stoichiometric electron donor demand of the COCs and competing electron acceptors (DO, nitrate, iron, manganese, and sulfate). A 1.5x factor of safety was used, and a three-year operational lifespan for the vegetable oil was assumed. Moving toward the outer edge of the plume, the second treatment zone (Zone 2) was defined by TCE and DCE concentrations exceeding their respective RGs and sulfate concentrations less than 2,000 mg/L. The electron donor dosage in Zone 2 was lower (approximately 2,300 lb total). In Zone 2, the stoichiometric electron donor demand was less than the total mass of emulsified oil needed to coat the aquifer soil within the TTZ. Therefore, the target mass was based on standard oil entrapment ratios (lb of emulsified oil/lb of soil) for the silty-sand soil in the treatment zone. Similar to Zone 1, a 1.5x factor of safety and three-year operational lifespan for the emulsified oil were incorporated into the mass estimates.
Source: Battelle
Figure 7-2. EISB Target Treatment Area and Design
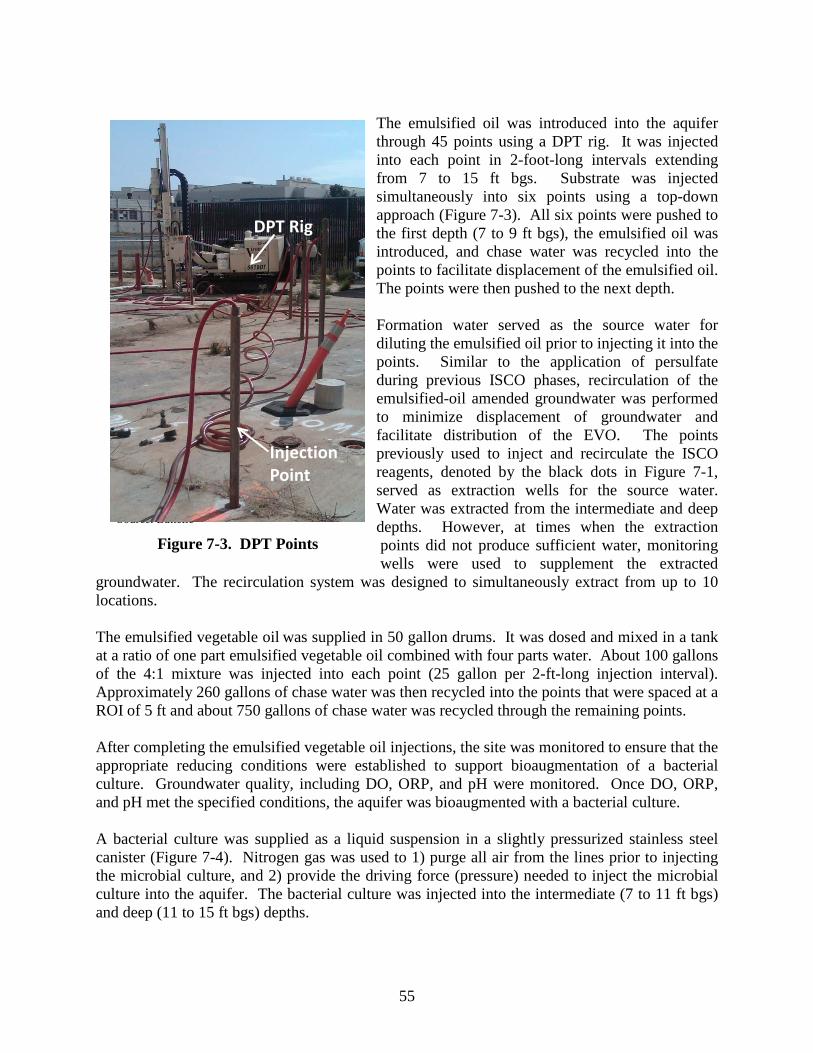
55
Nitrogen Cylinder
DPT Rig
Injection Point
Source: Battelle
Figure 7-3. DPT Points
DPT Rig
Injection Point
The emulsified oil was introduced into the aquifer through 45 points using a DPT rig. It was injected into each point in 2-foot-long intervals extending from 7 to 15 ft bgs. Substrate was injected simultaneously into six points using a top-down approach (Figure 7-3). All six points were pushed to the first depth (7 to 9 ft bgs), the emulsified oil was introduced, and chase water was recycled into the points to facilitate displacement of the emulsified oil. The points were then pushed to the next depth. Formation water served as the source water for diluting the emulsified oil prior to injecting it into the points. Similar to the application of persulfate during previous ISCO phases, recirculation of the emulsified-oil amended groundwater was performed to minimize displacement of groundwater and facilitate distribution of the EVO. The points previously used to inject and recirculate the ISCO reagents, denoted by the black dots in Figure 7-1, served as extraction wells for the source water. Water was extracted from the intermediate and deep depths. However, at times when the extraction points did not produce sufficient water, monitoring wells were used to supplement the extracted
groundwater. The recirculation system was designed to simultaneously extract from up to 10 locations. The emulsified vegetable oil was supplied in 50 gallon drums. It was dosed and mixed in a tank at a ratio of one part emulsified vegetable oil combined with four parts water. About 100 gallons of the 4:1 mixture was injected into each point (25 gallon per 2-ft-long injection interval). Approximately 260 gallons of chase water was then recycled into the points that were spaced at a ROI of 5 ft and about 750 gallons of chase water was recycled through the remaining points. After completing the emulsified vegetable oil injections, the site was monitored to ensure that the appropriate reducing conditions were established to support bioaugmentation of a bacterial culture. Groundwater quality, including DO, ORP, and pH were monitored. Once DO, ORP, and pH met the specified conditions, the aquifer was bioaugmented with a bacterial culture. A bacterial culture was supplied as a liquid suspension in a slightly pressurized stainless steel canister (Figure 7-4). Nitrogen gas was used to 1) purge all air from the lines prior to injecting the microbial culture, and 2) provide the driving force (pressure) needed to inject the microbial culture into the aquifer. The bacterial culture was injected into the intermediate (7 to 11 ft bgs) and deep (11 to 15 ft bgs) depths.
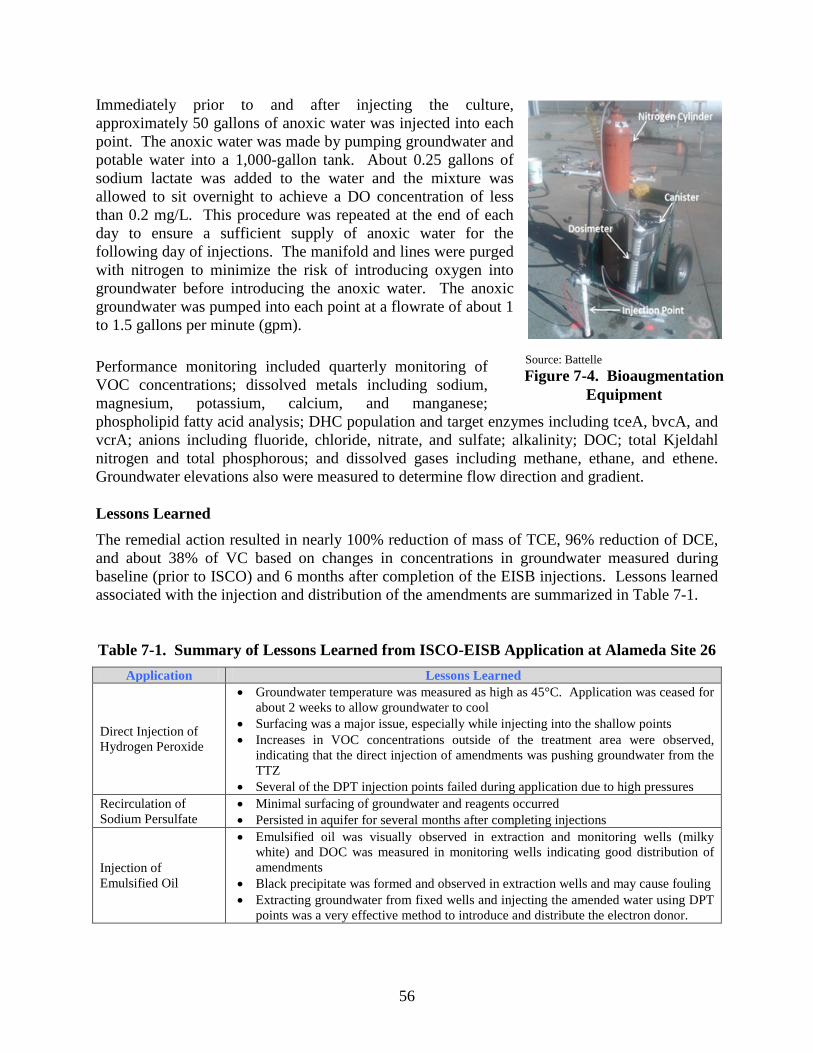
56
Source: Battelle Figure 7-4. Bioaugmentation
Equipment
Immediately prior to and after injecting the culture, approximately 50 gallons of anoxic water was injected into each point. The anoxic water was made by pumping groundwater and potable water into a 1,000-gallon tank. About 0.25 gallons of sodium lactate was added to the water and the mixture was allowed to sit overnight to achieve a DO concentration of less than 0.2 mg/L. This procedure was repeated at the end of each day to ensure a sufficient supply of anoxic water for the following day of injections. The manifold and lines were purged with nitrogen to minimize the risk of introducing oxygen into groundwater before introducing the anoxic water. The anoxic groundwater was pumped into each point at a flowrate of about 1 to 1.5 gallons per minute (gpm). Performance monitoring included quarterly monitoring of VOC concentrations; dissolved metals including sodium, magnesium, potassium, calcium, and manganese; phospholipid fatty acid analysis; DHC population and target enzymes including tceA, bvcA, and vcrA; anions including fluoride, chloride, nitrate, and sulfate; alkalinity; DOC; total Kjeldahl nitrogen and total phosphorous; and dissolved gases including methane, ethane, and ethene. Groundwater elevations also were measured to determine flow direction and gradient. Lessons Learned The remedial action resulted in nearly 100% reduction of mass of TCE, 96% reduction of DCE, and about 38% of VC based on changes in concentrations in groundwater measured during baseline (prior to ISCO) and 6 months after completion of the EISB injections. Lessons learned associated with the injection and distribution of the amendments are summarized in Table 7-1. Table 7-1. Summary of Lessons Learned from ISCO-EISB Application at Alameda Site 26
Application Lessons Learned
Direct Injection of Hydrogen Peroxide
• Groundwater temperature was measured as high as 45°C. Application was ceased for about 2 weeks to allow groundwater to cool
• Surfacing was a major issue, especially while injecting into the shallow points • Increases in VOC concentrations outside of the treatment area were observed,
indicating that the direct injection of amendments was pushing groundwater from the TTZ
• Several of the DPT injection points failed during application due to high pressures Recirculation of Sodium Persulfate
• Minimal surfacing of groundwater and reagents occurred • Persisted in aquifer for several months after completing injections
Injection of Emulsified Oil
• Emulsified oil was visually observed in extraction and monitoring wells (milky white) and DOC was measured in monitoring wells indicating good distribution of amendments
• Black precipitate was formed and observed in extraction wells and may cause fouling • Extracting groundwater from fixed wells and injecting the amended water using DPT
points was a very effective method to introduce and distribute the electron donor.
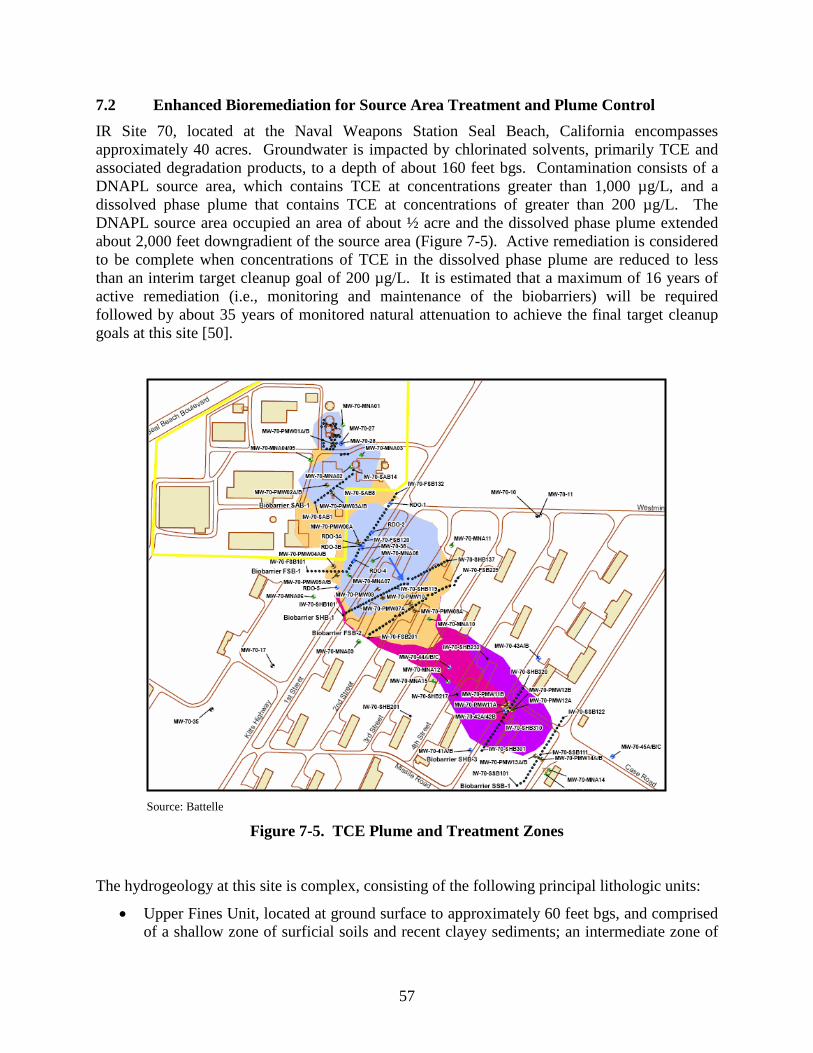
57
7.2 Enhanced Bioremediation for Source Area Treatment and Plume Control IR Site 70, located at the Naval Weapons Station Seal Beach, California encompasses approximately 40 acres. Groundwater is impacted by chlorinated solvents, primarily TCE and associated degradation products, to a depth of about 160 feet bgs. Contamination consists of a DNAPL source area, which contains TCE at concentrations greater than 1,000 µg/L, and a dissolved phase plume that contains TCE at concentrations of greater than 200 µg/L. The DNAPL source area occupied an area of about ½ acre and the dissolved phase plume extended about 2,000 feet downgradient of the source area (Figure 7-5). Active remediation is considered to be complete when concentrations of TCE in the dissolved phase plume are reduced to less than an interim target cleanup goal of 200 µg/L. It is estimated that a maximum of 16 years of active remediation (i.e., monitoring and maintenance of the biobarriers) will be required followed by about 35 years of monitored natural attenuation to achieve the final target cleanup goals at this site [50].
Source: Battelle
Figure 7-5. TCE Plume and Treatment Zones The hydrogeology at this site is complex, consisting of the following principal lithologic units:
• Upper Fines Unit, located at ground surface to approximately 60 feet bgs, and comprised of a shallow zone of surficial soils and recent clayey sediments; an intermediate zone of
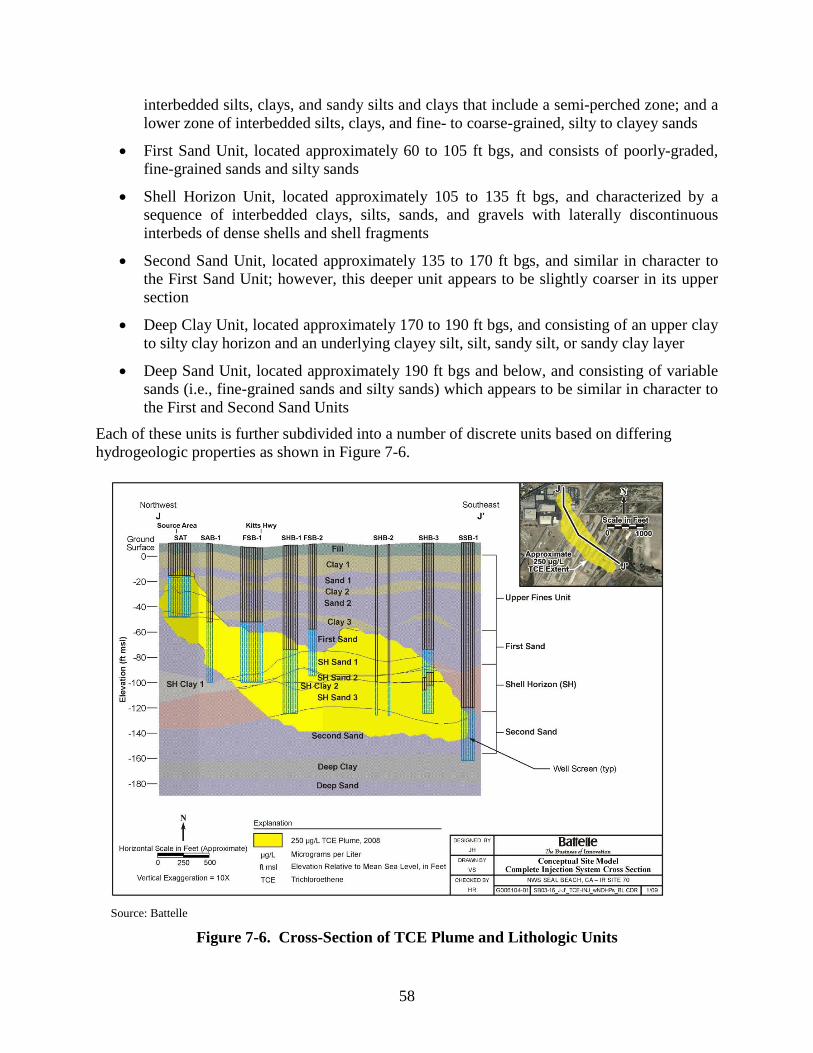
58
interbedded silts, clays, and sandy silts and clays that include a semi-perched zone; and a lower zone of interbedded silts, clays, and fine- to coarse-grained, silty to clayey sands
• First Sand Unit, located approximately 60 to 105 ft bgs, and consists of poorly-graded, fine-grained sands and silty sands
• Shell Horizon Unit, located approximately 105 to 135 ft bgs, and characterized by a sequence of interbedded clays, silts, sands, and gravels with laterally discontinuous interbeds of dense shells and shell fragments
• Second Sand Unit, located approximately 135 to 170 ft bgs, and similar in character to the First Sand Unit; however, this deeper unit appears to be slightly coarser in its upper section
• Deep Clay Unit, located approximately 170 to 190 ft bgs, and consisting of an upper clay to silty clay horizon and an underlying clayey silt, silt, sandy silt, or sandy clay layer
• Deep Sand Unit, located approximately 190 ft bgs and below, and consisting of variable sands (i.e., fine-grained sands and silty sands) which appears to be similar in character to the First and Second Sand Units
Each of these units is further subdivided into a number of discrete units based on differing hydrogeologic properties as shown in Figure 7-6.
Source: Battelle Figure 7-6. Cross-Section of TCE Plume and Lithologic Units
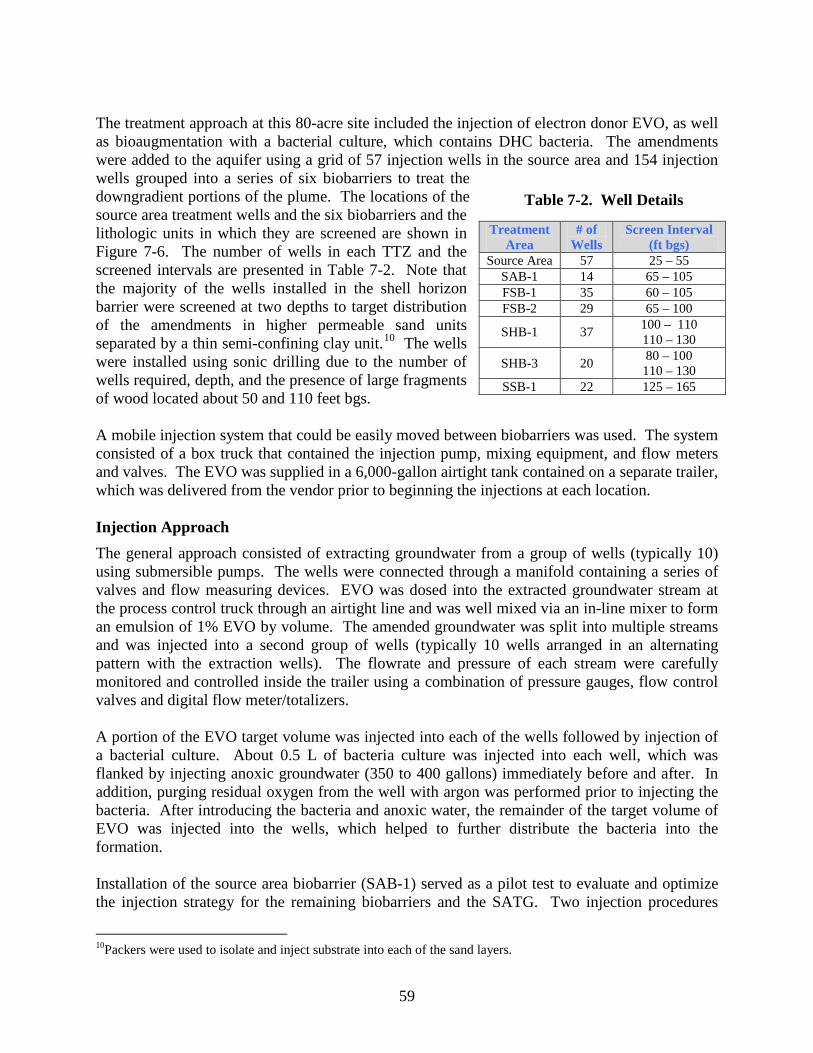
59
Table 7-2. Well Details
The treatment approach at this 80-acre site included the injection of electron donor EVO, as well as bioaugmentation with a bacterial culture, which contains DHC bacteria. The amendments were added to the aquifer using a grid of 57 injection wells in the source area and 154 injection wells grouped into a series of six biobarriers to treat the downgradient portions of the plume. The locations of the source area treatment wells and the six biobarriers and the lithologic units in which they are screened are shown in Figure 7-6. The number of wells in each TTZ and the screened intervals are presented in Table 7-2. Note that the majority of the wells installed in the shell horizon barrier were screened at two depths to target distribution of the amendments in higher permeable sand units separated by a thin semi-confining clay unit.10 The wells were installed using sonic drilling due to the number of wells required, depth, and the presence of large fragments of wood located about 50 and 110 feet bgs. A mobile injection system that could be easily moved between biobarriers was used. The system consisted of a box truck that contained the injection pump, mixing equipment, and flow meters and valves. The EVO was supplied in a 6,000-gallon airtight tank contained on a separate trailer, which was delivered from the vendor prior to beginning the injections at each location. Injection Approach The general approach consisted of extracting groundwater from a group of wells (typically 10) using submersible pumps. The wells were connected through a manifold containing a series of valves and flow measuring devices. EVO was dosed into the extracted groundwater stream at the process control truck through an airtight line and was well mixed via an in-line mixer to form an emulsion of 1% EVO by volume. The amended groundwater was split into multiple streams and was injected into a second group of wells (typically 10 wells arranged in an alternating pattern with the extraction wells). The flowrate and pressure of each stream were carefully monitored and controlled inside the trailer using a combination of pressure gauges, flow control valves and digital flow meter/totalizers. A portion of the EVO target volume was injected into each of the wells followed by injection of a bacterial culture. About 0.5 L of bacteria culture was injected into each well, which was flanked by injecting anoxic groundwater (350 to 400 gallons) immediately before and after. In addition, purging residual oxygen from the well with argon was performed prior to injecting the bacteria. After introducing the bacteria and anoxic water, the remainder of the target volume of EVO was injected into the wells, which helped to further distribute the bacteria into the formation. Installation of the source area biobarrier (SAB-1) served as a pilot test to evaluate and optimize the injection strategy for the remaining biobarriers and the SATG. Two injection procedures
10Packers were used to isolate and inject substrate into each of the sand layers.
Treatment Area
# of Wells
Screen Interval (ft bgs)
Source Area 57 25 – 55 SAB-1 14 65 – 105 FSB-1 35 60 – 105 FSB-2 29 65 – 100
SHB-1 37 100 – 110 110 – 130
SHB-3 20 80 – 100 110 – 130
SSB-1 22 125 – 165
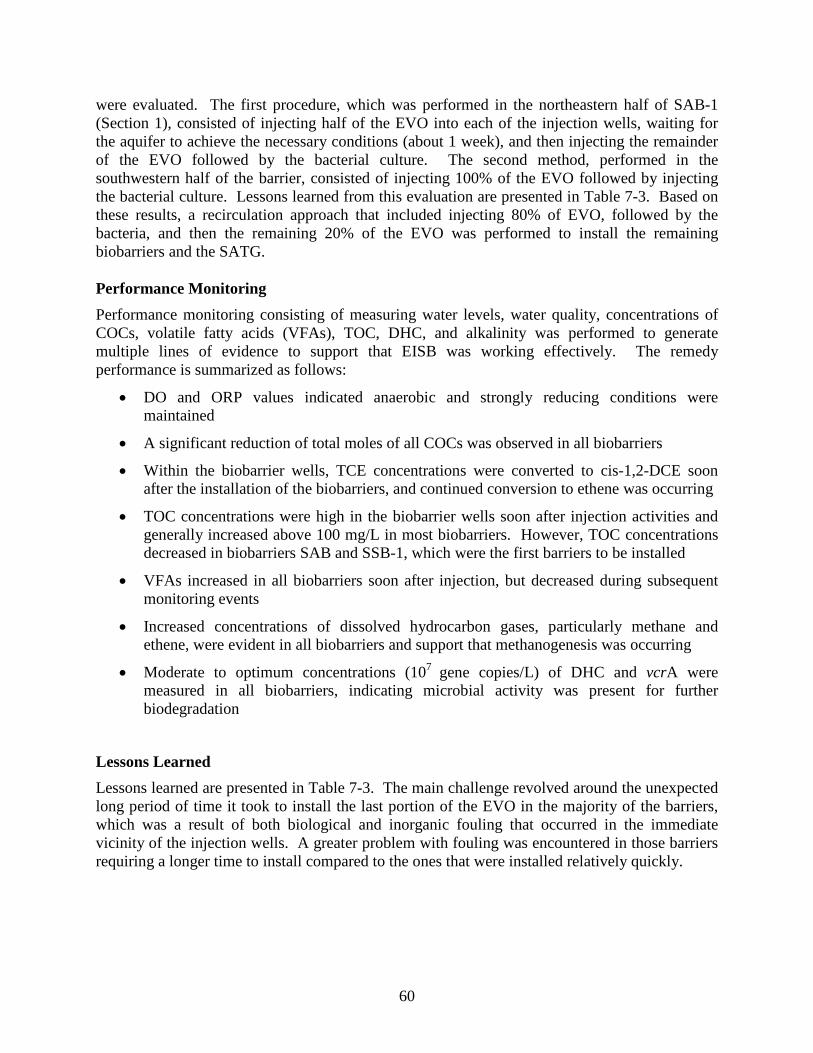
60
were evaluated. The first procedure, which was performed in the northeastern half of SAB-1 (Section 1), consisted of injecting half of the EVO into each of the injection wells, waiting for the aquifer to achieve the necessary conditions (about 1 week), and then injecting the remainder of the EVO followed by the bacterial culture. The second method, performed in the southwestern half of the barrier, consisted of injecting 100% of the EVO followed by injecting the bacterial culture. Lessons learned from this evaluation are presented in Table 7-3. Based on these results, a recirculation approach that included injecting 80% of EVO, followed by the bacteria, and then the remaining 20% of the EVO was performed to install the remaining biobarriers and the SATG. Performance Monitoring Performance monitoring consisting of measuring water levels, water quality, concentrations of COCs, volatile fatty acids (VFAs), TOC, DHC, and alkalinity was performed to generate multiple lines of evidence to support that EISB was working effectively. The remedy performance is summarized as follows:
• DO and ORP values indicated anaerobic and strongly reducing conditions were maintained
• A significant reduction of total moles of all COCs was observed in all biobarriers
• Within the biobarrier wells, TCE concentrations were converted to cis-1,2-DCE soon after the installation of the biobarriers, and continued conversion to ethene was occurring
• TOC concentrations were high in the biobarrier wells soon after injection activities and generally increased above 100 mg/L in most biobarriers. However, TOC concentrations decreased in biobarriers SAB and SSB-1, which were the first barriers to be installed
• VFAs increased in all biobarriers soon after injection, but decreased during subsequent monitoring events
• Increased concentrations of dissolved hydrocarbon gases, particularly methane and ethene, were evident in all biobarriers and support that methanogenesis was occurring
• Moderate to optimum concentrations (107 gene copies/L) of DHC and vcrA were measured in all biobarriers, indicating microbial activity was present for further biodegradation
Lessons Learned Lessons learned are presented in Table 7-3. The main challenge revolved around the unexpected long period of time it took to install the last portion of the EVO in the majority of the barriers, which was a result of both biological and inorganic fouling that occurred in the immediate vicinity of the injection wells. A greater problem with fouling was encountered in those barriers requiring a longer time to install compared to the ones that were installed relatively quickly.
61
Table 7-3. Lessons Learned from EISB Application at Naval Weapons Station Seal Beach Application Lessons Learned
Installation of SAB-1
• Regardless of the installation method employed, less than one week was sufficient to achieve the conditions necessary to inject the bacteria (DO less than 0.2 mg/L, ORP less than -100 millivolts)
• TOC functioned well as a surrogate to monitor distribution of the EVO in the subsurface immediately after injection. Both methods utilized to install the biobarriers appeared to adequately distribute the EVO in the subsurface
• Groundwater extraction flowrate in Section 1 decreased from about 7 to 10 gpm during installation of the first 50% of the EVO, to less than 1 to about 5 gpm during the installation of the remaining EVO
• The pH in both sections of the biobarrier decreased • Grey foam was noted in several wells while measuring depth to groundwater in the
biobarrier wells. The foam tends to form a crust in the monitoring wells which must be broken in order to take samples
• A black precipitate was noted in both sections, however was more predominant in Section 1, which may be a result of the high sulfide levels in that area. X-ray diffraction was performed, which showed that the precipitate consisted of a variety of iron sulfides
Installation of SHB-1 and SHB-3
• High pressures and surfacing of EVO were noted during installation of the biobarriers due to the low permeability of the formation
• Substantial time was required to install these barriers due to the low permeability in the Shell Horizon lithologic unit. As a result fouling occurred, which further slowed the rate of injection
• A modified packer system was used to simultaneously inject substrate into both the screened intervals in the SHB-1
Remaining Barriers
• Lactate in the EVO was easily degraded by microorganisms to produce hydrogen ion, which quickly reduced the pH of the aquifer. To help mitigate this problem, the EVO was reformulated to remove the lactate and sodium bicarbonate was used to buffer the chase water used to sandwich the bacteria.
• Although a significant drop in pH was observed during installation of the amendments, in most areas, the pH gradually returned to baseline conditions
7.3 Application of ZVI Using Hydraulic and Pneumatic Fracturing Hunters Point Naval Shipyard (HPNS) is a 936-acre site located in San Francisco, California, situated on a long promontory extending eastward into San Francisco Bay (Figure 7-7). The site was divided into six parcels, A through G, to facilitate environmental investigation and cleanup activities. The focus of this remedial action occurred within IR-71, located within portions of Parcels G and D-1. During baseline characterization in 2008, it was determined that chloroform exceeded its RG of 1.2 µg/L. The remedial approach consisted of performing remediation in areas where concentrations of chloroform in groundwater and soil vapor concentrations exceeded 10 times their RGs. The estimated groundwater-impacted area was over 45,000 square ft [50]. Seven PRBs were installed in a general east-west direction roughly perpendicular to groundwater flow (primarily southwest) within Parcels G and D-1 (Figure 7-8). Each PRB averaged 190 ft in length, totaling 1,335 linear feet. Each PRB was located approximately 50 ft from the next PRB (see Figure 7-8), allowing groundwater to be treated within a three-year period based on an average groundwater flow velocity of approximately 16.2 feet per year [51].
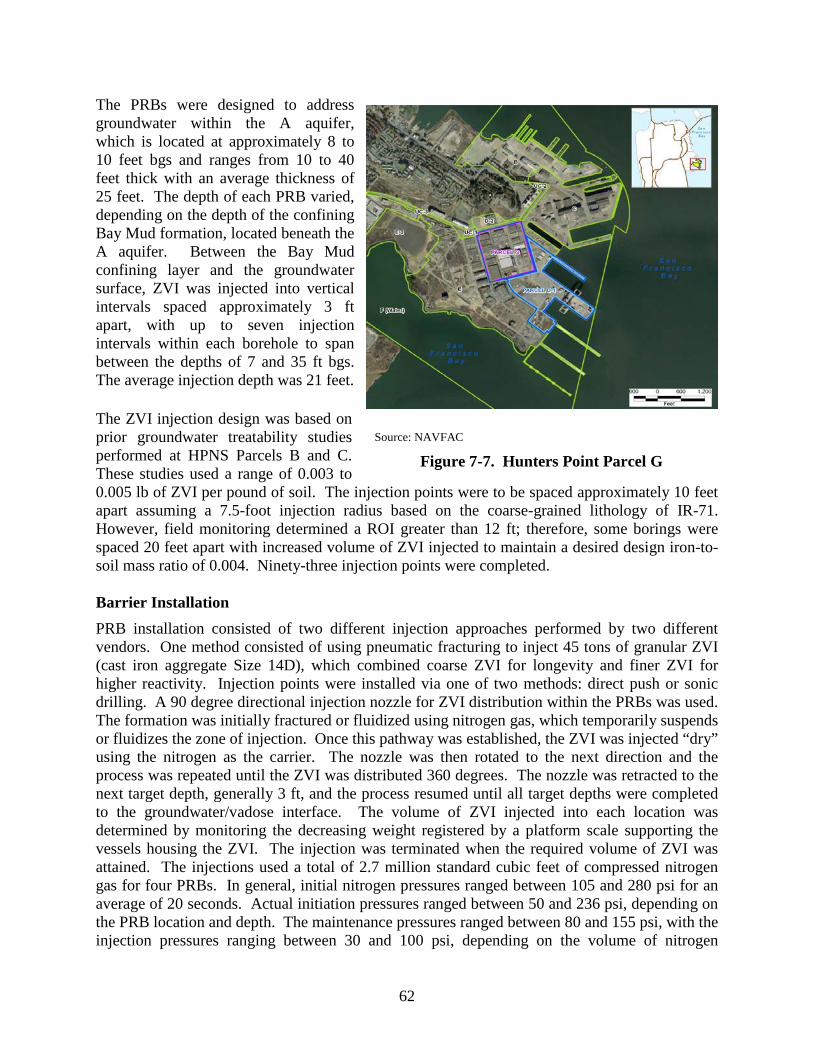
62
Source: NAVFAC
Figure 7-7. Hunters Point Parcel G
The PRBs were designed to address groundwater within the A aquifer, which is located at approximately 8 to 10 feet bgs and ranges from 10 to 40 feet thick with an average thickness of 25 feet. The depth of each PRB varied, depending on the depth of the confining Bay Mud formation, located beneath the A aquifer. Between the Bay Mud confining layer and the groundwater surface, ZVI was injected into vertical intervals spaced approximately 3 ft apart, with up to seven injection intervals within each borehole to span between the depths of 7 and 35 ft bgs. The average injection depth was 21 feet. The ZVI injection design was based on prior groundwater treatability studies performed at HPNS Parcels B and C. These studies used a range of 0.003 to 0.005 lb of ZVI per pound of soil. The injection points were to be spaced approximately 10 feet apart assuming a 7.5-foot injection radius based on the coarse-grained lithology of IR-71. However, field monitoring determined a ROI greater than 12 ft; therefore, some borings were spaced 20 feet apart with increased volume of ZVI injected to maintain a desired design iron-to-soil mass ratio of 0.004. Ninety-three injection points were completed. Barrier Installation PRB installation consisted of two different injection approaches performed by two different vendors. One method consisted of using pneumatic fracturing to inject 45 tons of granular ZVI (cast iron aggregate Size 14D), which combined coarse ZVI for longevity and finer ZVI for higher reactivity. Injection points were installed via one of two methods: direct push or sonic drilling. A 90 degree directional injection nozzle for ZVI distribution within the PRBs was used. The formation was initially fractured or fluidized using nitrogen gas, which temporarily suspends or fluidizes the zone of injection. Once this pathway was established, the ZVI was injected “dry” using the nitrogen as the carrier. The nozzle was then rotated to the next direction and the process was repeated until the ZVI was distributed 360 degrees. The nozzle was retracted to the next target depth, generally 3 ft, and the process resumed until all target depths were completed to the groundwater/vadose interface. The volume of ZVI injected into each location was determined by monitoring the decreasing weight registered by a platform scale supporting the vessels housing the ZVI. The injection was terminated when the required volume of ZVI was attained. The injections used a total of 2.7 million standard cubic feet of compressed nitrogen gas for four PRBs. In general, initial nitrogen pressures ranged between 105 and 280 psi for an average of 20 seconds. Actual initiation pressures ranged between 50 and 236 psi, depending on the PRB location and depth. The maintenance pressures ranged between 80 and 155 psi, with the injection pressures ranging between 30 and 100 psi, depending on the volume of nitrogen
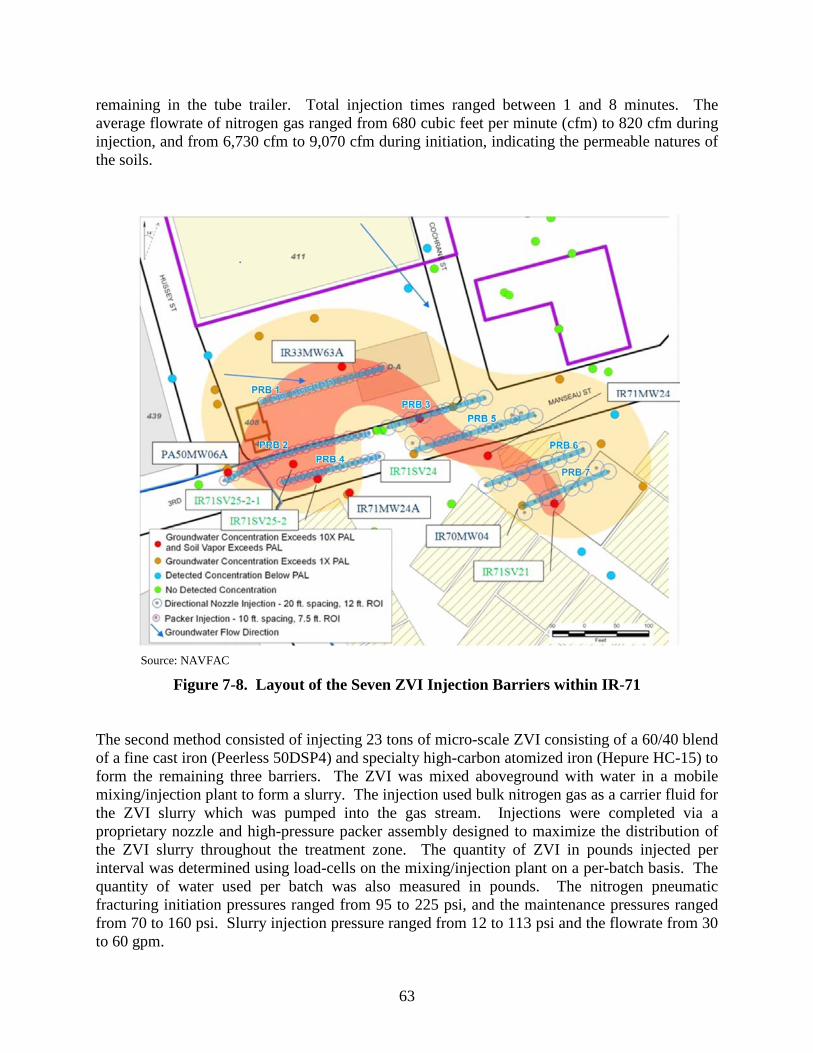
63
remaining in the tube trailer. Total injection times ranged between 1 and 8 minutes. The average flowrate of nitrogen gas ranged from 680 cubic feet per minute (cfm) to 820 cfm during injection, and from 6,730 cfm to 9,070 cfm during initiation, indicating the permeable natures of the soils.
Source: NAVFAC
Figure 7-8. Layout of the Seven ZVI Injection Barriers within IR-71 The second method consisted of injecting 23 tons of micro-scale ZVI consisting of a 60/40 blend of a fine cast iron (Peerless 50DSP4) and specialty high-carbon atomized iron (Hepure HC-15) to form the remaining three barriers. The ZVI was mixed aboveground with water in a mobile mixing/injection plant to form a slurry. The injection used bulk nitrogen gas as a carrier fluid for the ZVI slurry which was pumped into the gas stream. Injections were completed via a proprietary nozzle and high-pressure packer assembly designed to maximize the distribution of the ZVI slurry throughout the treatment zone. The quantity of ZVI in pounds injected per interval was determined using load-cells on the mixing/injection plant on a per-batch basis. The quantity of water used per batch was also measured in pounds. The nitrogen pneumatic fracturing initiation pressures ranged from 95 to 225 psi, and the maintenance pressures ranged from 70 to 160 psi. Slurry injection pressure ranged from 12 to 113 psi and the flowrate from 30 to 60 gpm.
64
Performance Monitoring Performance monitoring during pneumatic injection was conducted with two objectives: (1) confirm nitrogen influence and (2) confirm injected ZVI radius. Typically, the ROI for each is substantially different, where the gas travels farther than that of the injected media. These objectives were accomplished via:
1) Measuring pressure influence at surrounding monitoring wells, both using gauges at the surface and downhole pressure transducers
2) Conducting surface monitoring near the active injection well to record surface deflection from fracturing and injection activities, using: a. Heave rods and transits b. Biaxial tiltmeter monitoring
3) Individually evaluating each injection by developing a pressure-time history curve indicating initiation pressures, backpressure (if any), maintenance pressures, and injection pressures. All measurements pertaining to fracture initiation and maintenance pressures were collected and logged utilizing pressure transducers.
4) Evaluating nearby monitoring wells and injection points for evidence of nitrogen off-gassing or ZVI accumulation.
Sustainability A sustainability analysis was performed using SiteWise™ for the ZVI application. The carbon footprint for the installation of the PRBs at HPNS was determined to be 117 metric tons of carbon dioxide equivalents (CO2e). Production of consumables (ZVI and nitrogen) and transportation were determined to be the largest contributors to the carbon and energy footprints, which together accounted for more than 85% of the CO2e footprint and 70% of the energy consumption. Lessons Learned The challenges encountered at the site were primarily drilling related, such as presence of cobbles, boulders and even wood debris in the upper 10 to 15 ft. The fill layer was very loose in places and included voids, especially at depths of approximately 4 to 5 ft bgs. These voids likely were a result of material consolidation or settlement. The presence of the voids may have impacted the effective ROI of the ZVI placement at shallow depths due to potential short-circuiting. Additional lessons learned are provided in Table 7-4.
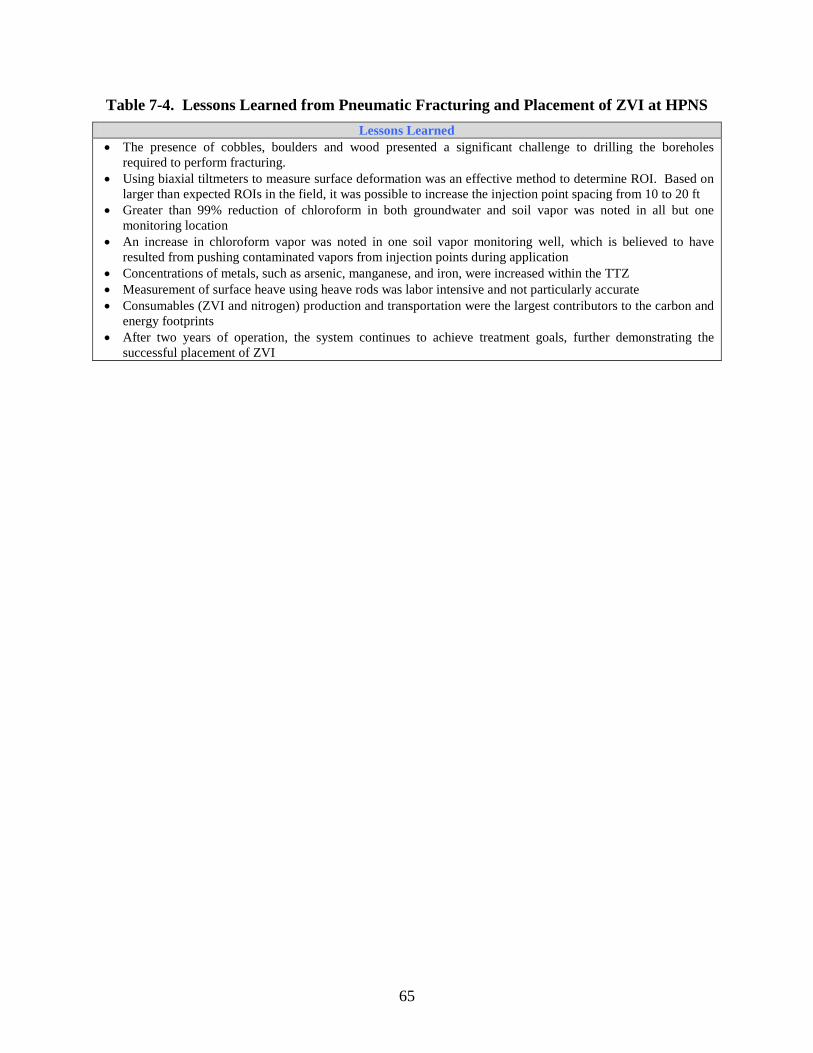
65
Table 7-4. Lessons Learned from Pneumatic Fracturing and Placement of ZVI at HPNS Lessons Learned
• The presence of cobbles, boulders and wood presented a significant challenge to drilling the boreholes required to perform fracturing.
• Using biaxial tiltmeters to measure surface deformation was an effective method to determine ROI. Based on larger than expected ROIs in the field, it was possible to increase the injection point spacing from 10 to 20 ft
• Greater than 99% reduction of chloroform in both groundwater and soil vapor was noted in all but one monitoring location
• An increase in chloroform vapor was noted in one soil vapor monitoring well, which is believed to have resulted from pushing contaminated vapors from injection points during application
• Concentrations of metals, such as arsenic, manganese, and iron, were increased within the TTZ • Measurement of surface heave using heave rods was labor intensive and not particularly accurate • Consumables (ZVI and nitrogen) production and transportation were the largest contributors to the carbon and
energy footprints • After two years of operation, the system continues to achieve treatment goals, further demonstrating the
successful placement of ZVI
66
REFERENCES
[1] Naval Facilities Engineering Command (NAVFAC). 2011. In Situ Chemical Oxidation Fact Sheet (Draft). September.
[2] Siegrest, R.L, M. Crimi, T.J. Simpkin. 2011. In Situ Chemical Oxidation for Groundwater Remediation. Sponsored by SERDP and ESTP. Springer Science and Business Media, LLC. March.
[3] Interstate Technology and Regulatory Council (ITRC). 2005. Technical and Regulatory Guidance for In Situ Chemical Oxidation of Contaminated Soil and Groundwater. second edition. January.
[4] Naval Facilities Engineering Command (NAVFAC). 2012. Fact Sheet. Using Bioremediation in Dense Non-Aqueous Phase Source Zones. (March)
[5] Interstate Technology and Regulatory Council (ITRC). 2008. Technical and Regulatory Guidance for In Situ Bioremediation of Chlorinated Ethene: DNAPL Source Zones. Prepared by the Interstate Technology and Regulatory Council Bioremediation of DNAPLs Team. June.
[6] Parsons. 2004. Principles and Practices of Enhanced Anaerobic Bioremediation of Chlorinated Solvents. Prepared for the Air Force Center for Environmental Excellence, Brooks City-Base, Texas; the Naval Facilities Engineering Service Center, Port Hueneme, California; and the Environmental Security Technology Certification Program, Arlington, Virginia. August.
[7] U.S. Air Force (USAF). 2007. Protocol for In Situ Bioremediation of Chlorinated Solvents Using Edible Oil. October.
[8] U.S. Environmental Protection Agency (U.S. EPA). 2000. Engineered Approaches to In Situ Bioremediation of Chlorinated Solvents: Fundamentals and Field Applications. EPA 542-R-00-008. July.
[9] Strategic Environmental and Research Development Program (SERDP) and Environmental Security Technology Certification Program (ESTCP). 2012. In Situ Biogeochemical Transformation of Chlorinated Solvents. Fact Sheet. ER-201124. Available at http://serdp-estcp.org/Program-Areas/Environmental-Restoration/Contaminated-Groundwater/Persistent-Contamination/ER-201124.
[10] Krug, Thomas, Suzanne O’Hara, Mark Watling, and Jacqueline Quinn. 2010. Emulsified Zero-Valent Nano-Scale Iron Treatment of Chlorinated Solvent DNAPL Source Areas. ESTCP Project ER-0431. April.
[11] Interstate Technology Regulatory Council (ITRC). 2011. Permeable Reactive Barrier Technology Update. Prepared by the ITRC PRB: Technology Update Team. June.
[12] Saltar, Alexandra J. 2010. Degradation of 1,2,3-Trichloropropane by Zero-Valent Zinc: Laboratory Assessment for Field Application. Proceedings of the 7th International Conference on Remediation of Chlorinated and Recalcitrant Compounds, 24-27 2010, Monterey, CA. May.
67
[13] NAVFAC. 2008. Observational Approach to Optimize In Situ Remediation, Planning and Decision Making Before, During, and After. Remediation Innovative Technology Seminar (RITS). Fall.
[14] Naval Facilities Engineering Command (NAVFAC). 2008. Risk Management Handbook. NAVFAC Engineering Service Center, Port Hueneme, CA.
[15] Interstate Technology and Regulatory Council (ITRC). 2003. Technical and Regulatory Guidance for the TRIAD Approach: A New Paradigm for Environmental Project Management. December.
[16] Interstate Technology Regulatory Council (ITRC). 2003. Technology Overview. An Introduction to Characterizing Sites Contaminated with DNAPLs. September.
[17] Environment, Science, and Technology Certification Program (ESTCP). 2010. In Situ Chemical Oxidation for Remediation of Contaminated Groundwater, Frequently Asked Questions. Project ER-0623. March.
[18] ASTM Method D7262-10 Standard Test Method for Estimating the Permanganate Natural Oxidant Demand of Soil and Aquifer Solids
[19] Huling, Scott G. and Bruce E. Pivetz. 2006. In Situ Chemical Oxidation. Engineering Issue. Prepared for the U.S. EPA. EPA/600/R-06/072. August.
[20] Kitanidas, Peter K. and Perry L. McCarty. 2012. Delivery and Mixing in the Subsurface: Process and Design Principals for In Situ Remediation. Sponsored by SERDP and ESTP. Springer Science and Business Media, LLC.
[21] Henry, Bruce. 2010. Loading Rates and Impacts of Substrate Delivery for Enhanced Anaerobic Bioremediation. ESTCP Project ER-0627-FR-1. February.
[22] Interstate Technology Regulatory Council (ITRC). 2005. Permeable Reactive Barriers: Lessons Learned/New Directions. February.
[23] Strategic Environmental and Research Development Program (SERDP) and Environmental Security Technology Certification Program (ESTCP). 2008. Emulsified Design Tool Kit. Version 7/1/2008 http://www.serdp.org/Tools-and-Training/Environmental-Restoration/Perchlorate/Emulsion-Design-Tool-KitJuly. June.
[24] Environmental Security Technology Certification Program (ESTCP). 2010. CDISCO Design Tool. April.
[25] Robinson, Clair, and D.A. Barry. 2009. Design Tool for Estimation of Buffer Requirements for Enhanced Reductive Dechlorination of Chlorinated Solvents in Groundwater. Environmental Modeling and Software. March.
[26] Geosyntec. 2009. Emulsified Zero Valent Iron (ZVI) Treatment of Chlorinated Solvents. Prepared for the Naval Facilities Engineering Command (NAVFAC) Remediation Innovative Technology Seminar (RITS). Spring.
[27] Gavaskar, Arun, Tater, Lauren, Condit, Wendy. 2005. Cost and Performance Report Nanoscale Zero-Valent Iron Technologies for Source Remediation. Prepared for the
68
Naval Facilities Engineering Command (NAVFAC). Contract Report CR-05-007-ENV. September.
[28] Abriola, Linda, Ramsburg, Andrea, Pennell, Kurt. 2011. Development and Optimization of Targeted Nanoscale Iron Delivery Methods for Treatment of NAPL Source Zones (Final Report). Prepared for SERDP Project ER-0427. April.
[29] Hoag, George E., John B. Collins, and Ken Huang. 2007. Treatment of Non-Aqueous Phase Liquids (NAPLS) using Surfactant-Enhanced In-Situ Oxidation. Presented at the 23rd Annual International Conference on Soils, Sediment, and Water. October.
[30] Battelle. 2009. Sequestration of a DNAPL Source with Vegetable Oil at Naval Air Station North Island. Final Report. ESTCP Project ER-0319. October.
[31] Rosansky, Stephen H, Amy Dindal, and NAVFAC Alternative Restoration Technology Team (ARTT). 2010. Cost and Performance Report for Persulfate Treatability Studies. Technical Report TR2333-ENV. June.
[32] Liles, David S. 2009. Lessons Learned: Treatment of Chlorinated Hydrocarbon Contaminated Groundwater with Injectable Nanoscale Bimetallic Particles. ESTCP ESTCP ER-0017. February.
[33] Department of Navy (DON). 2012. Policy for Optimizing Remedial and Removal Actions at All Department of Navy (DON) Environmental Restoration Program Sites. Ser-12005/EV3-KB. April.
[34] Naval Facilities Engineering Command (NAVFAC) Engineering Service Center (ESC). 2012. Department of the Navy Guidance on Green and Sustainable Remediation. User’s Guide UG 2093-ENV Rev 1. Prepared by Battelle. April.
[35] United States Environmental Protection Agency (U.S. EPA). 2000. Memorandum entitled Applicability of RCRA Section 3020 to In-Situ Treatment of Groundwater, from Elizabeth Cotsworth, Director Office of Solid Waste to RCRA Senior Policy Advisors, RCRA Enforcement Managers, and Superfund Regional Policy Managers. December 17.
[36] U.S. Air Force. 2004. Principles and Practices of Enhanced Anaerobic Bioremediation of Chlorinated Solvents. August.
[37] United States Environmental Protection Agency (U.S. EPA), Office of Water. 2001. Technical Program Overview: Underground Injection Control Regulations. EPA 816-R-02-025. Revised July.
[38] Environmental Science and Technology Certification Program (ESTCP). 2010. In Situ Chemical Oxidation for Groundwater Remediation Site-Specific Engineering and Technology Application. Public Release v1.01. ESTCP Project ER-0623. October.
[39] Heiderscheidt, Jeffery L. 2005. Chemical Oxidation Reactive Transport in 3-D (CORT3D), Computer Modeling Code. V2.01 User Documentation.
[40] American Society of Testing Materials (ASTM). 2006. Standard Guide for Selection of Drilling Methods for Environmental Site Characterization. D6286-98.
69
[41] American Society of Testing Materials (ASTM). 2010. Standard Practice for Design and Installation of Groundwater Monitoring Wells. D5092-04.
[42] United States Army Corps of Engineers (USACE). 1998. Monitoring Well Design, Installation, and Documentation at Hazardous, Toxic, and Radioactive Waste Sites. EM-1110-1-4000. November.
[43] Payne, Fred C., Joseph A. Quinan, and Scott T. Potter. 2008. Remediation Hydraulics. CRC Press.
[44] In-Situ Remediation Reagents Injection Working Group (ISRRIWG). 2009. Technical Report: Subsurface Injection of In Situ Remedial Reagents (ISRRs) within the Los Angeles Regional Water Quality Control Board Jurisdiction. September.
[45] Interstate Technology Regulatory Council (ITRC). 2006. The Use of Direct Push Well Technology for Long-Term Environmental Monitoring in Groundwater Investigations. Prepared by the Interstate Technology & Regulatory Council Sampling, Characterization and Monitoring Team. March.
[46] Hall, Richie and Bill Slack. 2012. Alternative Methods for Injecting Potassium Permanganate Granules into Contaminated Formations. Presented at the Remediation of Chlorinated and Recalcitrant Compounds Conference, Monterey. May.
[47] Environmental Security Technology Certification Program (ESTCP). 2005. A Review of Biofouling Controls for Enhanced In Situ Bioremediation of Groundwater. ER-0429-White Paper. October.
[48] Strategic Environmental and Research Development Program (SERDP) and Environmental Security Technology Certification Program (ESTCP). Optimized Enhanced Bioremediation Through Four-Dimensional Geophysical Monitoring and Autonomous Data Collection, Processing, and Analysis. ER-200717. http://www.serdp.org/Program-Areas/Environmental-Restoration/Contaminated-Groundwater/Monitoring/ER-200717/ER-200717/(language)/eng-US. Accessed May 30, 2012.
[49] Department of the Navy (DON). 2006. 2006. Final Record of Decision, Site 26, Alameda Point, Alameda, California. Alameda, California. August.
[50] Geosyntec. 2006. Final Remedial Design (RD) for IR Site 70 Enhanced In Situ Bioremediation Naval Weapons Station Seal Beach, Seal Beach, California. Prepared for the Naval Facilities Engineering Service Center. Contract 47408-04-C-7526. December.
[51] The Alliance Compliance Group Joint Venture (Alliance), 2010. Final Parcels D-1 and G, Groundwater Treatability Study, Technical Report, IR-09, IR-33, and IR-71, Hunters Point Shipyard, San Francisco, CA. March.