Embed Size (px)
Citation preview

30 June 2017
POVERTY BAY MANAGED AQUIFER RECHARGE TRIAL
Initial Injection Test
RE
PO
RT
Report Number: 1415771-7410-023-R-Rev0
Distribution:
Mark Joblin (Gisborne District Council)
Dennis Crone (Gisborne District Council)
Submitted to: Gisborne District Council
POVERTY BAY MAR INITIAL TEST
30 June 2017
Report No. 1415771-7410-023-R-Rev0 i
Table of Contents
1.0 INTRODUCTION ................................................................................................................................................. 1
2.0 BORE INSTALLATION ........................................................................................................................................ 1
2.1 Pilot Bore ................................................................................................................................................ 1
2.2 Injection Bore .......................................................................................................................................... 1
3.0 AQUIFER CHARACTERISATION ........................................................................................................................ 2
3.1 Geology .................................................................................................................................................. 2
3.2 Hydraulic Test Program ........................................................................................................................... 2
3.2.1 Air lift test on pilot bore monitoring well ............................................................................................... 2
3.2.2 Stepped rate test on injection bore ..................................................................................................... 3
3.2.3 Constant rate test on injection bore .................................................................................................... 3
3.3 Hydrogeochemistry ................................................................................................................................. 4
3.3.1 Geochemistry .................................................................................................................................... 4
3.3.2 Water quality ..................................................................................................................................... 5
3.3.3 Dissolved gas .................................................................................................................................... 5
4.0 INJECTION TESTS ............................................................................................................................................. 7
4.1 Stepped Rate Tests................................................................................................................................. 7
4.2 Constant Rate Test ................................................................................................................................. 8
4.2.1 Pressure responses ........................................................................................................................... 8
4.2.2 Water quality responses ................................................................................................................... 11
5.0 CONCLUSIONS ................................................................................................................................................ 14
6.0 LIMITATIONS .................................................................................................................................................... 15
7.0 REFERENCES .................................................................................................................................................. 15
TABLES
Table 1: Bore structure summary................................................................................................................................... 1
Table 2: Lithological sequence. ..................................................................................................................................... 2
Table 3: Pilot bore monitoring well air lift test. ................................................................................................................ 3
Table 4: Analysis results from injection bore constant rate test. ...................................................................................... 4
Table 5: Calculated aquifer gas components. ................................................................................................................ 7
Table 6: Constant rate injection test summary data. ....................................................................................................... 9
Table 7: Projected rise in injection bore water level at end of full pilot trial period. ......................................................... 10

POVERTY BAY MAR INITIAL TEST
30 June 2017
Report No. 1415771-7410-023-R-Rev0 ii
Table 8: Expected distances and travel times for injected water bubble. ....................................................................... 13
Table 9: Initial microbiological results. ......................................................................................................................... 14
Table 10: Recommendations for project decision stages. ............................................................................................. 15
FIGURES
Figure 1: XRD analysis results. ..................................................................................................................................... 5
Figure 2: Major ion characteristics for water from wells screened in the Makauri Aquifer. ................................................ 6
Figure 3: Cumulative water volume injected during constant rate test. ............................................................................ 9
Figure 4: Injection bore water level trend curves and projections under different injection rates. .................................... 10
Figure 5: Projected changes in injection bore water level at the end of 100,000 minute (77 day) trial. ............................ 11
Figure 6: Water level increases in injection bore and pilot monitoring bore. ................................................................... 12
Figure 7: Manual groundwater levels in nearby monitoring bores. ................................................................................. 12
Figure 8: Temperature breakthrough curve recorded in pilot monitoring bore. ............................................................... 13
APPENDICES
APPENDIX A Borehole Logs
APPENDIX B Pumping Test Analysis Sheets
APPENDIX C Aquifer Geochemistry Analysis Sheets.
APPENDIX D Report Limitations

POVERTY BAY MAR INITIAL TEST
30 June 2017
Report No. 1415771-7410-023-R-Rev0 1
1.0 INTRODUCTION
Gisborne District Council (GDC) is investigating water management options in the Poverty Bay region with
the aim of improving water security for all users. One option under investigation is the use of Managed
Aquifer Recharge (MAR), to replenish and sustain groundwater yields from aquifers beneath the Poverty Bay
Flats.
A MAR trial targeting the Makauri Aquifer has been initiated by GDC. The trial is based on taking water from
the Waipaoa River via the Kaiaponi Farms irrigation water supply infiltration gallery and injecting the water,
following treatment, into the Makauri Aquifer. The Kaiaponi MAR site is located on the Kaiaponi Farms
property, on Bushmere Road. So far the trial has been designed, the necessary resource consents
obtained, two bores have been drilled, headworks and delivery system has been constructed and initial
testing of the system has started. This report outlines the results from the pre-injection trial as per condition
38 of Resource Consent (DW-2016-107113-00):
38) Following the pre-injection trial of 10,000 m3 the consent holder shall provide a report to the GDC
Manager on the performance of this preliminary trial, with particular reference to the water quality and
water quantity effects that arose. Any updates to the Management Plan referred to in condition 35 that
are required based on the results of the preliminary trial shall be made and re-certified in writing by the
GDC Manager. The commencement of the main trial shall not commence until this reporting and
potential re-certification (if required) has been completed.
2.0 BORE INSTALLATION
2.1 Pilot Bore
Drilling of the pilot bore at Kaiaponi Farm was started on 20 March 2017 and was completed as a monitoring
bore on 31 March 2017. It has been assigned the GDC bore number GPE065. A copy of the drillers log for
the pilot bore is provided in Appendix A. A summary of the bore structure is provided in Table 1.
2.2 Injection Bore
The injection bore was drilled and installed between 3 April 2017 and 24 April 2017. Development of this
bore was carried out through a process of pumping and surging on 27 April 2017. The injection bore has
been assigned the GDC bore number GPE066. A copy of the drillers log for the pilot bore is provided in
Appendix A. A summary of the bore structure is provided in Table 1.
Table 1: Bore structure summary.
Parameter Pilot bore Injection bore
GDC ID GPE065 GPE066
Easting 2938345 2938328
Northing 6276377 6276389
Distance from injection bore (m) 23 -
Bore depth (m bgl) 92 73.5
Screened interval (m bgl) 69.2 – 72.6 69.5 – 72
Casing internal diameter and material 50 mm PVC 225 mm uPVC
Height of casing above ground level (m) 1.3

POVERTY BAY MAR INITIAL TEST
30 June 2017
Report No. 1415771-7410-023-R-Rev0 2
3.0 AQUIFER CHARACTERISATION
3.1 Geology
Based on the lithologies intersected during the drilling program (refer drillers logs in Appendix A and Table 2
below, it appears that the Makauri Aquifer beneath the Pilot Trial site may be split into two layers. The upper
layer is three metres thick and is at a level consistent with the general gradient and depth of the Makauri
Aquifer beneath the Poverty Bay Flats. The lower layer, although thicker at approximately six metres, is
considerably deeper than the regional aquifer trend would indicate for the position of the Makauri Aquifer. In
addition, there is an 11 m thick clay aquitard between the two layers.
The hydraulic connection between the deeper layer and the wider Makauri Aquifer that is used as a
horticultural water source is in doubt. For this reason the pilot bore monitoring well screen was installed in
the shallower layer.
An air lift test was performed in this monitoring well and a hydraulic reaction to the test was detected in the
nearest monitored well screened in the Makauri Aquifer approximately 100 m from the site (refer Section
3.2.1 and Appendix B). For this reason, the screen depth for the injection bore was targeted at the upper
Makauri Aquifer layer.
Table 2: Lithological sequence.
Top of unit (m bgl)
Base of unit (m bgl)
Description Interpretation
0 1 Topsoil Aquitard
1 26 Clay
26 31.2 Gravel Aquifer
31 69 Clay Aquitard
69 72.6 Gravel Makauri Aquifer
72.6 84.8 Clay Aquitard
84.8 91 Gravel Basal split of Makauri Aquifer?
91 92 Clay Aquitard
3.2 Hydraulic Test Program
3.2.1 Air lift test on pilot bore monitoring well
An air lift test was performed in the pilot bore monitoring well on 30 March 2017 to gain an indication of the
aquifer hydraulic characteristics prior to installation of the injection bore.
Air lifting was undertaken at an average rate of 1.8 L/s for 120 minutes. The recovery phase of the air lift test
was monitored in the pilot bore and the entire test was monitored in an unused private bore GPE010 some
190 m away.
The drawdown and recovery data was analysed to provide an indication of the aquifer parameters to support
the design process for the injection bore. The parameters and results of this preliminary test are presented
in Table 3. The analysis sheets are provided in Appendix B.

POVERTY BAY MAR INITIAL TEST
30 June 2017
Report No. 1415771-7410-023-R-Rev0 3
Table 3: Pilot bore monitoring well air lift test.
Parameter Pilot bore GPE010
Distance from Pilot Bore (m) - 190
Period of air lift (minutes) 120 -
Average rate of water abstraction (L/s) 1.8 -
Static water level (m btoc) 8.74 8.345
Maximum drawdown (m) NA(1) 0.06
Recovery period monitored (minutes) 77 75
Aquifer transmissivity (m2/day) (2) NA(1) 692 – 1,070
Aquifer hydraulic conductivity (m/day) (2) NA(1) 231 - 357
Aquifer storativity (m3/m3) (2) NA(1) 1.7 x 10⁻⁴
Note: 1) Could not be measured due to the nature of the test. 2) Initial estimate only for injection bore planning and design purposes.
3.2.2 Stepped rate test on injection bore
A stepped rate pumping test was carried out in the injection bore on 4 May 2017 at four flow rates (7 L/s,
10 L/s, 13 L/s and 16 L/s). The flow rates were checked regularly to maintain constant flow during each
step. The first three steps were pumped for 120 minutes each. The duration of the last step at 16 L/s had to
be cut back to 100 minutes due to large and increasing drawdown of the water column in the bore (refer to
drawdown chart provided in Appendix B).
Toward the end of the stepped rate test an issue was encountered with large drawdown and accurate
measurement of the flow rates. Both of these issues were due to the presence of dissolved gas (refer to
Section 3.3.3) within the aquifer water, that degassed when depressurised. The drawdown of water in the
bore during the final pumping stage resulted in depressurisation of the aquifer in the immediate vicinity of the
bore sufficient to cause degassing in the gravels surrounding the well screen. The collected gas caused
temporary clogging of the well screen, leading to reduced flow into the bore and increased drawdown in the
bore. Once initiated this process let to a rapid increase in drawdown within the injection bore, although
pressure responses in the aquifer at the Pilot Bore monitoring well did not reflect this drawdown.
Analysis of the stepped rate test results indicated that the bore would have the capacity to accepted water
injection at rates of between (between 10 L/s and 22 L/s). Gas in the existing aquifer water would not
influence the rate at which water can be injected to the aquifer.
3.2.3 Constant rate test on injection bore
A constant rate pumping test was started at 9:30 am on 5 May 2017 and recovery started on 8 May 2017 at
9:30 am. The pumping rate was controlled at 13 L/s to reduce the risk of uncontrolled drawdown in the
injection bore due to degassing, as occurred in the stepped rate test.
Under the pumping rate of 13 L/s, the water level in the injection bore dropped from 8.3 m to 13 m bgl after
three days of pumping. The maximum drawdown of 4.7 m indicated that injection rates at least equivalent to
this flow should be able to be achieved.
The drawdown and recovery curves from the constant rate test are documented in Appendix B. The
analyses of these curves to derive aquifer parameters are also presented in Appendix B. The hydraulic
parameters derived from these analyses are presented in Table 4.

POVERTY BAY MAR INITIAL TEST
30 June 2017
Report No. 1415771-7410-023-R-Rev0 4
Table 4: Analysis results from injection bore constant rate test.
Test curve analysis (1) Distance from injection bore
(m)
Transmissivity (m2/day)
Hydraulic conductivity
(m/day)
Storativity (m3/m3)
Injection bore (GPE066) drawdown (2) - 250 80 -
Injection bore (GPE066) recovery - 600 200 -
Pilot bore (GPE065) drawdown 23 770 260 3.0 x 10⁻⁴
Pilot bore(GPE065) recovery 23 600 200
GPE010 drawdown 190 780 260 1.6 x 10⁻⁵
GPE010 recovery 190 610 210
GPE030 drawdown 365 760 250 1.8 x 10⁻⁵
GPE030 recovery 365 580 190
Interpreted aquifer parameters 600 – 800 2 x 10⁻⁵ – 3.0 x 10⁻⁴.
Note: 1) Analysis results rounded to two significant figures.
2) Lower confidence in the result of this analysis.
The pumping test analyses indicate the aquifer transmissivity is between 600 m2/day and 800 m2/day and
the storativity is between 1.5 x 10⁻⁵ and 3 x 10⁻⁴. No indications of hydraulic boundary conditions were
identified during analysis of the test data. It is however recognised that the aquifer changes laterally in
thickness, which means the calculated transmissivity and storativity are likely to differ for different monitoring
wells.
The aquifer properties described above are similar to those used during the pre-feasibility assessment to
project expected water level responses in nearby bores. Two of the nearby bores gave very consistent
responses to the test and the analyses are indicating similar aquifer properties (GPE010 and GPE030). The
data from two other bores monitored during the test (GPE012 and GPF105), located close to each other
approximately 1 km southeast from the site, showed water level responses that appear to have been
affected by more local domestic pumping. This interference means that with the drawdown and recovery
data from these two bores has not been analysed.
Given the results of the constant rate pumping test, the estimated flow rates for injection of between 10 L/s
and 22 L/s were considered reasonable, in advance of any injection testing.
3.3 Hydrogeochemistry
3.3.1 Geochemistry
Samples of aquifer material obtained from both the 69 m to 72 m layer and the 85 m to 92 m deep gravel
layers intersected in the pilot bore were sent to Waikato University for analysis.
X-Ray Fluorescence analysis of the samples was undertaken to provide information on the major element
composition of the geological material. The high calcium concentrations measured in both samples are
consistent with the presence of limestone in the aquifer, which was expected based on the nature of the
catchment geology. The two samples contain trace elements at concentrations that are mostly lower than
their average crustal abundance (Appendix C). Arsenic and sulphur are only present at low concentrations.
From this data we consider it unlikely that there are significant concentrations of sulphur-bearing minerals in
the local aquifer.
XRD analysis was undertaken to determine mineral content of the rock samples (Figure 1). The XRD results
showed the sample to be quartz dominated with some calcium carbonate (from shell fragments and
limestone).

POVERTY BAY MAR INITIAL TEST
30 June 2017
Report No. 1415771-7410-023-R-Rev0 5
Figure 1: XRD analysis results.
3.3.2 Water quality
The groundwater quality data derived from sampling of the MAR pilot bore are very consistent with those
from GDP115. The data from GDP115 were used as a basis for the iron oxidation modelling undertaken in
support of the Assessment of Environmental Effects (Golder 2015).
A comparison of the major elements distribution in water samples from the pilot bore and a collection of other
bores screened in the Makauri Aquifer is presented as a Piper Diagram in Figure 2. The major ion
distributions in groundwater samples from bores within five kilometres of the injection bore are very similar to
the sample obtained from the pilot bore. The scatter in major ion distributions increases slightly in bores
further away.
3.3.3 Dissolved gas
During the pumping tests a significant volume of gas was released from the discharged water within the
stilling basin adjacent to the injection bore. Based on general knowledge of the aquifer chemistry, it was
initially assumed that the primary components of the discharged gas would be methane and carbon dioxide.
The Health and Safety procedures for this initial test program were modified as soon as the gas discharges
from the aquifer water were identified, to manage any risk resulting from methane degassing. Testing of the
gas above the basin and in the mouth of the discharge pipe did not identify a critical lack of oxygen.

POVERTY BAY MAR INITIAL TEST
30 June 2017
Report No. 1415771-7410-023-R-Rev0 6
Figure 2: Major ion characteristics for water from wells screened in the Makauri Aquifer.
Sampling and analysis of the gas from the bore was undertaken during the initial testing program for the bore
headworks and injection system. Landfill gas monitoring equipment, which can differentiate between gasses
and provide relative percentages present, was used to evaluate the gas components.
During the sampling and analysis of the discharged gas, it was identified that both methane and oxygen
were present in the sample in significant quantities. As this combination would not be chemically stable or
naturally present in the dissolved gases in the aquifer, it was assumed that some mixing of air with the
aquifer gases had occurred during the sampling and analysis. It was further assumed that 100 % of the
oxygen in the sample was derived from air leakage, with corresponding fractions of nitrogen and other gases
that naturally occur in the atmosphere. The components of each of the constituent gases derived from
leakage could then be calculated and the residue components were assumed to be derived from the aquifer
water. The calculation and the derived components of the dissolved gases in the aquifer water are
presented in Table 5.
Due to the potential presence of methane gas at the site, health and safety precautions need to be taken
when working in the area, especially when pumping out of the bore, but also following periods of operational
rests. Additional air release valves have been added to the pipework design to facilitate gas release. Gas
meters have been used on site during pipework installation.
The potential need for geochemical modelling of the dissolved gas has been assessed. It was concluded
that a clear health and safety management approach for the pumping tests and trial period is a more
worthwhile course of action than further modelling. When the site is used as an injection well it is unlikely
that aquifer gas bubbles will form within the bore or the immediately surrounding aquifer, as the aquifer
pressure is being increased rather than lowered.

POVERTY BAY MAR INITIAL TEST
30 June 2017
Report No. 1415771-7410-023-R-Rev0 7
Table 5: Calculated aquifer gas components.
Parameter Sample
(%)
Sample corrected (1)
(%)
Average air constituents
(%)
Air fraction (2)
(%)
Aquifer fraction (3)
(%)
Aquifer gas
(%)
CH4 29.7 29.1 0 0 29.1 49.5
CO2 4.7 4.6 0.03 0.01 4.6 7.8
O2 8.8 8.6 20.95 8.6 0.0 0.0
CO 2 2.0 0 0 2.0 3.3
H2S 0 0.0 0 0 0.0 0.0
Balance (4) 56.8 55.7 79.02 32.5 23.1 39.4
Sum 102 100 100 41.2 58.8 100
Note: 1) Corrected to total of 100 %.
2) Based on assumption that 100 % of O2 is derived from air leakage into sample. 3) Corrected sample components minus air components.
4) Primarily nitrogen, minor argon and trace other gases.
The low sulphate concentrations in water from almost all of the groundwater bores that were evaluated
previously suggests that reducing conditions (and dissolved methane) are present in the Makauri Aquifer
beneath much of the Poverty Bay Flats.
4.0 INJECTION TESTS
4.1 Stepped Rate Tests
A series of stepped rate injection tests were undertaken between 22 May 2017 and 7 June 2017. The
objective of these tests was to:
1) Evaluate the rate at which water could potentially be introduced through the injection bore to the
aquifer.
2) Identify factors limiting the rate at which water could be injected and, if possible, take steps to address
the factors to improve injection rates.
Analysis of the data from the tests undertaken during the above period provides a good indication of the
rates at which water can be introduced to the aquifer through the injection bore (GPE066).
Issues identified during these injection tests were primarily operational in nature. The main issues are
summarised below.
The Kaiaponi Farms water supply pump is located at the end of a pipeline approximately 570 m in
length. Changing the power input to the pump does not result in an immediate change in flow rate at
the injection bore but rather a gradual change over a period of up to 10 minutes. This issue has been
addressed through defining a clear start-up procedure in the Operation Plan. During the constant rate
injection test and for most of the Pilot Trial injection period these delays do not represent an issue.
The Kaiaponi Farms water supply pump is optimised for a flow rate of approximately 25 L/s. At
progressively lower flows the operation of the pump becomes less stable and the flows generated at
pre-defined pump settings become less consistent. This issue has been addressed by setting a
minimum operational flow for start-up purposes and operating the pump at the highest achievable flow
for the constant rate injection test.

POVERTY BAY MAR INITIAL TEST
30 June 2017
Report No. 1415771-7410-023-R-Rev0 8
Butterfly valves are used to control water flow at the off-take from the Kaiaponi water supply system and
in the injection bore headworks. Flows through these valves are very sensitive to changes in position
when the valve is almost closed. Rapid closure of some of these valves can result in unstable water
level changes in the injection bore. This issue has been addressed through developing clear start-up
procedures and incorporating these in the Operations Plan.
During the initial stepped rate tests it was identified that entrainment of air bubbles in the injected water
resulted in temporary clogging of the well screen with bubbles at flows above approximately 7.5 L/s.
This in turn led to rapid rises in water level within the injection bore. This situation could also be
triggered by sudden changes in flows at lower injection rates. This issue has been resolved through:
Modifying the inflow system at the well head through installation of a drop tube with a constriction at
the terminal end. Instability due to air entrapment was not subsequently observed during the test.
Procedures for manually operating the butterfly valves in the Kaiaponi water line off-take and the
headworks have been developed to minimise the risk of abrupt changes in flow rates to the injection
bore. These procedures have been incorporated in the Operations Plan.
A compilation of the data from the various stepped rate tests is summarised in Figure 4. Each of the
recorded datasets is presented in terms of water depth below the top of the injection bore casing, as these
projections are used for planning of a full 100,000 m3 injection test. The projections have been extended on
the log scale chart (Figure 4) for a trial period of 100,000 minutes (slightly less than 80 days). The reasons
for this time scale are presented in Section 4.2.
The stepped rate tests were performed at flows of up to 12.9 L/s. This flow was considered to be at the top
end of the flows achievable through the drop tube installed in the injection bore based on engineering
calculations of flows through a circular orifice and observations made during the testing process supported
this expectation. Based on the outcomes from the stepped rate tests presented in Figure 4, operating the
injection trial for a period of approximately 80 days at a flow rate of 12.9 L/s would result in a change in water
level in the injection bore of approximately 2.5 m (Figure 5). The static water level at the end of these tests
of 8.3 m below the top of the injection well casing, so there was adequate capacity in the bore to accept this
injection rate.
4.2 Constant Rate Test
4.2.1 Pressure responses
A constant rate injection test was started on 13 June 2017 with the objective of injecting 10,000 m3 into the
Makauri Aquifer and enable the outcomes to be documented as required under the resource consent. Due
to premature triggering of a shut-down relay, the test finished at 3:19 AM on Monday 19 June. During this
time water totalling 8,811 m3 was injected to the Makauri Aquifer (Figure 3).
Summary information on the constant rate injection test is presented in Table 6. Injection flow rates during
the test were not manually changed, however some minor changes in rate did occur (see Table 6). The
reasons for the changes were unclear, as the test generally operated at a relatively constant flow.
The water level data from the constant rate injection test is presented in Figure 4, separated into Main Test
stages 1 and 2 corresponding to the two periods of slightly different flows. The flows are higher than was
achieved during the earlier tests and the corresponding projected rise in water level in the bore over a period
of 100,000 minutes (77 days) is therefore also higher. At the highest flow rate achieved (15.5 L/s) the water
level in the injection bore is projected to be approximately 4.2 m below the top of the bore casing at the end
of the full trial. In addition there will be natural rise in the regional groundwater pressure. The projected level
is considered suitable to cover the expected rise.
At a consistent flow rate of 15.1 L/s to 15.5 L/s, the planned injection volume of 100,000 m3 could be
achieved in between 100,000 and 110,000 minutes (74 to 77 days). The logarithmic time scale in Figure 4
extends to 100,000 minutes for this reason.

POVERTY BAY MAR INITIAL TEST
30 June 2017
Report No. 1415771-7410-023-R-Rev0 9
Figure 3: Cumulative water volume injected during constant rate test.
Table 6: Constant rate injection test summary data.
Parameter Start date /
time Finish date
/ time Period
(minutes)
Average flow rate
(L/s)
Injected volume
(m3)
Resulting injection bore water level
change (m) (1)
Flow stage 1 12/6/2017
08:44 13/6/2017
00:38 954 15.5 881 2.558
Flow stage 2 13/6/2017
00:38 14/6/2017
00:29 1,430 15.1 1,299 2.685
Flow stage 3 14/6/2017
00:29 18/6/2017
14:54 6,625 15.1 5,990 2.835
Temporary shutdown
18/6/2017 14:54
18/6/2017 15:59
65 0 0 N/A
Flow stage 4 (2) 18/6/2017
15:59 19/6/2017
03:19 680 15.8 641 2.886
Overall 12/6/2017
08:44 19/6/2017
03:19
9,755
(6.97 days) 15.2 8,811 2.886
Note: 1) Estimated average at the end of the injection stage.
2) This stage was too short and the water levels too variable to provide adequate data to make 100,000 minute water level projections for the Pilot Trial.
0
1,000
2,000
3,000
4,000
5,000
6,000
7,000
8,000
9,000
10,000
0 1 2 3 4 5 6 7
Cu
mu
lati
ve v
olu
me
inje
cted
(m
3)
Time since start of test (days)
Cumulative volume Constant rate test total injected volume of 8,811 m3
achieved 6.78 days after start of test, on Monday19 June.

POVERTY BAY MAR INITIAL TEST
30 June 2017
Report No. 1415771-7410-023-R-Rev0 10
Figure 4: Injection bore water level trend curves and projections under different injection rates.
Calculated rises in water level within the injection bore by the end of the full pilot trial under a range of
injection flow rates are presented in Table 7. These projections are presented visually in Figure 5, together
with an indication of the potential effect of turbulence at the well screen on the final water level in the bore.
Table 7: Projected rise in injection bore water level at end of full pilot trial period.
Test step / stage Flow rate (L/s)
Projected injection bore water level (m btoc)
Bore water level rise after 100,000 minutes (m)
Test 3, Step 1 3.1 8.13 0.17
Test 2, Step 1 3.7 8.08 0.22
Test 3, Step 2 5.4 7.57 0.73
Test 2, Step 2 6.4 7.70 0.60
Test 4, Step 1 7.5 6.29 2.01
Test 3, Step 3 8.6 6.69 1.61
Test 4, Step 2 11 6.17 2.13
Test 4, Step 3 12.9 5.99 2.31
Main test, Stage 3 15.1 4.79 3.51
Main test, Stage 2 15.1 4.30 4.00
Main test, Stage 1 15.5 4.22 4.08
4.0
4.5
5.0
5.5
6.0
6.5
7.0
7.5
8.0
8.5
9.0
1 10 100 1,000 10,000 100,000
Wat
er le
vel d
epth
bel
ow
to
p o
f ca
sin
g (m
)
Test step elapsed time (minutes)
Inj P - Test 2, Step 1
Inj P - Test 2, Step 2
Inj P - Test 3, Step 1
Inj P - Test 3, Step 2
Inj P - Test 3, Step 3
Inj P - Test 4, Step 1
Inj P - Test 4, Step 2
Inj P - Test 4, Step 3
Main test stage 1
Main test stage 2
Main test stage 3
3.1 L/s
5.4 L/s
8.6 L/s
3.7 L/s6.4 L/s
7.5 L/s11 L/s
12.9 L/s
15.5 L/s
15.1 L/s
15.0 L/s

POVERTY BAY MAR INITIAL TEST
30 June 2017
Report No. 1415771-7410-023-R-Rev0 11
Figure 5: Projected changes in injection bore water level at the end of 100,000 minute (77 day) trial.
Water levels in the pilot monitoring bore (GPE 065) were very sensitive to changes in injection rates at the
injection bore. Following the unplanned shut-downs, the water level recovery curves recorded from the
monitoring bore were very similar to those recorded from the injection bore (Figure 6).
Water level responses in nearby bores (Figure 7) have been observed in the manual water level data. Bores
GPE010 and GOE030 both showed a rise of approximately 1.3 m during injection. This is as expected as
these bores responded rapidly to the pumping test. Small responses in other nearby bores may be present
but are not obvious in the manual records. Further information will be gained in the full trial by using
automated water level data.
4.2.2 Water quality responses
Temperature responses – Breakthrough observations
The natural groundwater temperature in the Makauri Aquifer in the area of the injection bore is approximately
14.7ºC. The temperature of the water pumped from the intake gallery during the constant rate injection test
varied on a 24 hour cycle, between 9.5ºC and 10.3ºC.
Water temperature was monitored inside the screened sections of the injection bore and the pilot monitoring
bore during the stepped rate tests and the constant rate injection test. At the start of the constant rate test
the water temperature in both bores was similar. Following the start of the test the water temperature in the
injection bore decreased almost immediately. The water temperature in the pilot monitoring bore started to
decrease approximately 328 minutes after the start of the test (Figure 8). This response indicates the
injected water took a little less than 328 minutes to radiate outward a distance of 23 m from the injection
bore. At that time about 294 m3 of water had been injected during the constant rate test.
0
1
2
3
4
5
6
7
8
9
10
0 2 4 6 8 10 12 14 16 18 20
Ch
ange
in w
ate
r le
vel f
rom
sta
tic
(m)
Injection flow (L/s)
Stepped rate tests
Anomalous test
Main test
Friction due to turbulent flow in bore / screen appears to start having a detectable effect on bore efficiency once flows exceed 14 L/s.
Bore overflow
Estimated achievableinjection
rate under current
injection line design.
Anomalous result possibly due to changing flow during test step

POVERTY BAY MAR INITIAL TEST
30 June 2017
Report No. 1415771-7410-023-R-Rev0 12
Figure 6: Water level increases in injection bore and pilot monitoring bore.
Figure 7: Manual groundwater levels in nearby monitoring bores.
0
0.5
1
1.5
2
2.5
3
3.5
4
0 1000 2000 3000 4000 5000 6000 7000 8000 9000 10000
Ch
ange
in w
ate
r le
vel (
m)
Trial elapsed time (minutes)
Injection bore
Pilot monitoring bore
Filter bank backwash events on 12 hour cycle.
Stage 15.5 L/s.
Stage 215.1 L/s.
Stage 315.1 L/s.

POVERTY BAY MAR INITIAL TEST
30 June 2017
Report No. 1415771-7410-023-R-Rev0 13
The breakthrough can be used to calculate the time it will take for the bubble of injected water to reach
various distances. The time it will take to reach GPE010 is estimated to be 16 days based on an injection
rate of 15 L/s (Table 8). Following the full trial the radius of the bubble is expected to reach 420 m.
Table 8: Expected distances and travel times for injected water bubble.
Parameter Full trial Breakthrough at GPE010 Units
Water volume 100,000 20,404 m3
Thickness 3 3 m
Porosity 0.06 0.06
Area 176,929 113,354 m2
Radius of water quality influence 420 190 m
Inflow rate 15 15 L/s
1,296 1,296 m3/day
Time required for influence to be detected
77 16 days
Figure 8: Temperature breakthrough curve recorded in pilot monitoring bore.
Water quality samples
Water samples have been taken from bores GPE066 (injection), GPE065 (monitoring) and GPE010 for full
chemical analysis. The results of these analyses will be assessed as they are received. Initial water injected
during commissioning of the trial and subsequently pumped out of the injection bore showed no unexpected
8.00
9.00
10.00
11.00
12.00
13.00
14.00
15.00
16.00
0 1,000 2,000 3,000 4,000 5,000 6,000 7,000 8,000 9,000 10,000
Wat
er t
emp
erat
ure
(OC
)
Time since start of test (minutes)
Injection bore
Monitoring bore
328 minutes First clear indication of injected water
breakthrough based on temperature change.

POVERTY BAY MAR INITIAL TEST
30 June 2017
Report No. 1415771-7410-023-R-Rev0 14
water quality changes. The injected water was resting in the aquifer/bore for approximately 11 days before
being pumped out. These analysis results are included in Appendix C.
Microbiological responses
Groundwater and injected water has been tested for microbiological content using Escherichia coli (E.coli) as
an indicator. The trial sampling procedure requires some refinement to ensure samples are representative.
Results are available for the injection bore following initial commissioning (6 June 2017) and for injection bore and monitoring bores following the pre-injection trial of 8,811 m3 (Table 9). Some increase in E.coli is
observed in these results. However, a larger number of samples is required in order to be able to draw any conclusions as to the rate of die off and transport of E.coli in the Makauri Aquifer.
Table 9: Initial microbiological results.
Site/Bore Date Escherichia coli
(cfu/100 mL)
Injection Bore GPE066 8 May 2017 <1.6
Injection Bore GPE066 6 June 2017 1.6
Monitoring Bore GPE065 23 June 2017 6.6
Monitoring Bore GPE010 23 June 2017 <1.6
Injection Bore GPE066 26 June 2017 6.5
The bubble of injected water will propagate outwards slowly and based on the observed break through at
GPE065 the projected travel time to reach GPE010 is 16 days. Therefore the bubble of water with
potentially higher E.coli levels is expected to be limited in extent. Much information can be gained during the
early stages of the trial on the rates of decay of the bacterial content in the aquifer. This information is very
important to support the planning of future trials and for the development of any larger scale groundwater
replenishment scheme for the Poverty Bay Flats. Therefore Golder recommends that the trial be continued
as proposed to gain further information on the microbiological transport characteristics of the Makauri
Aquifer.
In continuing with the trial as proposed, it is important to recognise that any risks posed by potential localised
microbiological contamination of the aquifer for aquifer users are very small. The site was specifically
chosen for the trial as it is a substantial distance from any active bores, with the water travel time to these
bores exceeding the period of the untreated stage of the trial.
5.0 CONCLUSIONS
Golder considers that the full trial (100,000 m3) can proceed based on the initial results gained from the
commissioning and initial injection of 8,811 m3 (Table 10). The pre-injection trial has shown that suitable
flow rates can be achieved through the delivery system and injected with expected water level responses in
the injection bore, and nearby bores. The travel times of the injected bubble are as expected and a small
bubble of injected water (to a radius of approximately 420 m) is expected.
Further information on the microbiological transport characteristics of the Makauri Aquifer can be gained with
further injection and appropriate testing. The bubble of injected water is only expected to reach 420 m from
the bore following 77 days of injection at a rate of 15 L/s, so is not expected to significantly impact on water
users.

POVERTY BAY MAR INITIAL TEST
30 June 2017
Report No. 1415771-7410-023-R-Rev0 15
Table 10: Recommendations for project decision stages.
Step Decision - Reasoning
Step 1
Proceed
Coarse gravel layer suitable for trial identified from 69 to 72 m bgl.
Preliminary airlift test performed on pilot bore gave indications of a high aquifer
hydraulic conductivity.
Step 2
Proceed
XRF and initial XRD analysis results raised no issues
Pumping test shows highly transmissive layer suitable for injection.
Pumping test issues due to de-gassing, which is not considered a significant
concern for injection based on expected geochemical responses.
Step 3
Proceed
Injection rates have been set at approximately 15 L/s with suitable projected long
term water levels in the injection bore.
Water level responses in surrounding bores are as expected based on available
information.
Time for the injected water to reach GPE065 was as expected based on analytical
projections.
Further information on the microbiological transport characteristics of the Makauri
Aquifer can be gained with further injection and appropriate testing.
Step 4 To be completed
6.0 LIMITATIONS
Your attention is drawn to the document, “Report Limitations”, as provided in Appendix D below. The
statements presented in that document are intended to advise you of what your realistic expectations of this
report should be, and to present you with recommendations on how to minimise the risks to which this report
relates which are associated with this project. The document is not intended to exclude or otherwise limit the
obligations necessarily imposed by law on Golder Associates (NZ) Limited, but rather to ensure that all
parties who may rely on this report are aware of the responsibilities each assumes in so doing.
7.0 REFERENCES
Golder 2015. Poverty Bay managed aquifer recharge. Pilot trial – hydrogeology and water quality. Report
produced for Gisborne District Council by Golder Associates (NZ) Limited. Golder report 1415771-7410-006.

POVERTY BAY MAR INITIAL TEST
30 June 2017
Report No. 1415771-7410-023-R-Rev0
APPENDIX A Borehole Logs

F2.7 Drillers Bore Log / Well Completion Report
CONSENT NUMBER PERMIT NUMBER E : 2938345
N : 6276377
OWNER / OCCUPIER Gisborne District Council
POSTAL ADDRESS PO Box 747, Gisborne, 4040
SITE / PROPERTY ADDRESS Kaiaponi Farms, Matawai Road, Gisborne Rapid Number / St or Rd Number
START DATE 20-03-2017 FINISH DATE 31-03-2017
DEPTH FROM SURFACE DESCRIPTION OF GROUND PASSED THROUGH SCREEN DIAGRAM TOP (M)
BOTTOM (M)
0 1 Topsoil
1 6 Brown Clay
6 25 Blue Clay
25 26 Blue Clay Shell
26 31.2 Blue Gravel
31.2 36.2 Blue Clay
36.2 36.4 Blue Clay Wood
36.4 69.2 Blue Clay
69.2 72.6 Gravel
72.6 84.8 Blue Clay
84.8 91 Gravel
91 92 Blue Clay
WELL / BORE CONSTRUCTION PUMPING TEST
BORE DEPTH (m) 92 STATIC WATER LEVEL (m) -8.74 CASING DEPTH (m) 69.2 PUMPING RATE (LPS) CASING DIAMETER (mm) 100 Steel ARTESIAN JET (“) SCREEN ASSEMBLY : DRAWDOWN (m)
DIAMETER (mm) 50 PVC DURATION OF PUMPING (hrs) TOTAL LENGTH (m) 3.4
FROM TOP 69.2m WATER QUALITY: TO BASE 73.1m OBSERVATION ON SITE
SLOT SIZE / TYPE 1mm Slot PVC ANALYSED BY OPEN HOLE
From bottom of casing to Bottom of well m
m
GENERAL COMMENTS COMPLETED AND INSPECTED BY
SEE PAGE 2

GDC Pilot Bore - Single Zone PVC Screened Well
0.5
m
Flange
Ground Level
Cement
Gravels
PVC End Cap
PVC Slotted (1mm) Screen
PVC Pipe 50mmØ
Steel Surface Casing 100mmØ
Bentonite Pellets
Pea Metal
69.2
m
72.6
m
74m
50mm PVC Tee
73.1
m
76m
80m
92m

F2.7 Drillers Bore Log / Well Completion Report
CONSENT NUMBER PERMIT NUMBER E : 2938328
N : 6276389
OWNER / OCCUPIER Gisborne District Council
POSTAL ADDRESS PO Box 747, Gisborne, 4040
SITE / PROPERTY ADDRESS Kaiaponi Farms, Matawai Road, Gisborne Rapid Number / St or Rd Number
START DATE 05-04-2017 FINISH DATE 10-05-2017
DEPTH FROM SURFACE DESCRIPTION OF GROUND PASSED THROUGH SCREEN DIAGRAM TOP (M)
BOTTOM (M)
0 1 Topsoil
1 6 Brown Clay
6 25 Blue Clay
25 26 Blue Clay Shell
26 31.2 Blue Gravel
31.2 36.2 Blue Clay
36.2 36.4 Blue Clay Wood
36.4 69.2 Blue Clay
69.2 72.6 Gravel
72.6 73.5 Blue Clay
WELL / BORE CONSTRUCTION PUMPING TEST
ALL MEASUREMENTS ARE FROM GROUND LEVEL
BORE DEPTH (m) 73.5 STATIC WATER LEVEL (m) -7.45 CASING DEPTH (m) 69.5 PUMPING RATE (LPS) * See Below
CASING DIAMETER (mm) 300 Steel with 250mm PVC Liner
ARTESIAN JET (“) ----------------
SCREEN ASSEMBLY : DRAWDOWN from SWL (m) * See Below DIAMETER (mm) 250 DURATION OF PUMPING (hrs) * See Below TOTAL LENGTH (m) 5.18 FROM TOP 68.32m WATER QUALITY: TO BASE 73.5m OBSERVATION ON SITE
SLOT SIZE / TYPE 2.5mm Slot Stainless Steel
ANALYSED BY
OPEN HOLE
From bottom of casing to Bottom of well m
m
GENERAL COMMENTS * Refer to stepped and constant rate field sheets COMPLETED AND INSPECTED BY Chris Wallace
SEE PAGE 2

GDC Injection Bore
0.3
m
0.5
m
Flanged Connection
Ground Level
Pea Metal
Stainless Steel Screen 250mmØ Slot size 2.5mm Screen Length 2.5m
PVC Liner 250mmØ
Steel Surface Casing 300mmØ
69.5
m B
ottom
of
Casin
g
73.5
m B
OW
Stainless Steel Leader and Cross Over 1.18m
Not to Scale
Mild Steel Screen Assembly / uPVC Liner Transition
Gravels
Sump 250mmØ Sump Length 1.5m
Flange
Top Seal (Rubber)
Stainless Steel Centralised Ring / Seal
69.2
m T
op o
f G
ravels
72.6
m B
ottom
of
Gra
vels
Blue Clay

POVERTY BAY MAR INITIAL TEST
30 June 2017
Report No. 1415771-7410-023-R-Rev0
APPENDIX B Pumping Test Analysis Sheets

y = 0.0693ln(x) + 0.9528
y = 0.0589ln(x) + 1.828
y = 0.2434ln(x) + 2.587
y = 8.4045ln(x) - 6.4849
0.0
5.0
10.0
15.0
20.0
25.0
30.0
35.0
1.0 10.0 100.0 1,000.0
Dra
wd
ow
n (
m)
Elapsed Time (minutes)
Step 1: 7.23 L/s
Step 2: 10.03 L/s
Step 3: 13 L/s
Step 4: 16 L/s
naB. Sinclair
C. Houlbrooke 1415771
B4
TITLE
DRAWN
CHECKED
REVIEWED
DATE
SCALE
FILE NO.
JOB NO.
DWG. NO.
FIGURE NO.
na
En
d o
f flo
w s
tep
MAR Makauri Injection BoreBushmere Road
Stepped Rate Pumping Test Drawdown, May 2017
Log - Normal Scale plot
na

0
5
10
15
20
25
30
35
40
0 50 100 150 200 250 300 350 400 450 500
Dra
wd
ow
n (
m)
Elapsed Time (minutes)
Step 1: 7 L/s Step 2: 10 L/s
Step 3: 13 L/s
Step 4: 16 L/s
naB. Sinclair
C. Houlbrooke 1415771
B3
TITLE
DRAWN
CHECKED
REVIEWED
DATE
SCALE
FILE NO.
JOB NO.
DWG. NO.
FIGURE NO.
na
Pu
mp
off
MAR Makauri Injection BoreBushmere Road
Stepped Rate Pumping Test Drawdown and Recovery,
Normal - Normal Scale Plot
na

Pumping Test Analysis Report B
Project: GDC MAR
Number:
Client:
Golder Associates (NZ) LimitedLevel 2, Nielsen Centre129 Hurstmere RoadTakapuna, Auckland 0622New Zealand
Location: Kaiaponi Pumping Test: MAR GDC Piezo airlift Pumping Well: MAR piezo
Test Conducted by: GDC and Honnors Drilling Test Date: 30/03/2017
Analysis Performed by: C Houlbrooke Theis recovery Analysis Date: 30/03/2017
Aquifer Thickness: 3.00 m Discharge: variable, average rate 1.8 [l/s]
1 10 100 1000
t/t'
0.00
0.01
0.03
0.04
0.06
0.07
Resid
ual
draw
do
wn
[m
]
Calculation using THEIS & JACOB
Observation Well Transmissivity
[m²/d]
Hydraulic Conductivity
[m/d]
Radial Distance to PW
[m]
GPE010 1.07 × 10³
3.57 × 10²
190.0

Pumping Test Analysis Report B
Project: GDC MAR
Number:
Client:
Golder Associates (NZ) LimitedLevel 2, Nielsen Centre129 Hurstmere RoadTakapuna, Auckland 0622New Zealand
Location: Kaiaponi Pumping Test: MAR GDC Piezo airlift Pumping Well: MAR piezo
Test Conducted by: GDC and Honnors Drilling Test Date: 30/03/2017
Analysis Performed by: C Houlbrooke Theis drawdown Analysis Date: 30/03/2017
Aquifer Thickness: 3.00 m Discharge: variable, average rate 1.8 [l/s]
0 4000 8000 12000 16000 20000
Time [s]
0.00
0.01
0.03
0.04
0.06
0.07
Draw
do
wn
[m
]
Calculation using Theis
Observation Well Transmissivity
[m²/d]
Hydraulic Conductivity
[m/d]
Storage coefficient Radial Distance to PW
[m]
GPE010 6.92 × 10²
2.31 × 10²
1.67 × 10⁻⁴
190.0

Pumping Test Analysis Report
Project: Makauri MAR Trial
Number: 1415771
Client: GDC
Golder Associates (NZ) LimitedLevel 2, Nielsen Centre129 Hurstmere RoadTakapuna, Auckland 0622New Zealand
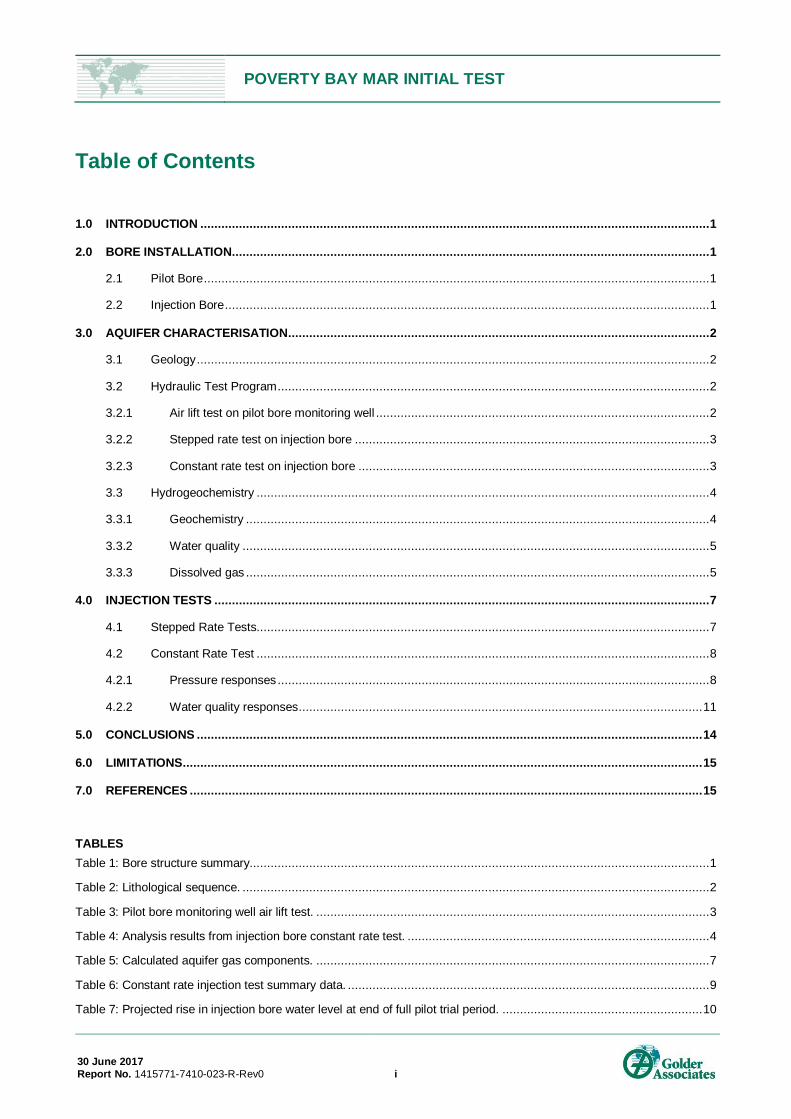
Location: Kaiaponi, Gisborne Pumping Test: Constant Rate test Pumping Well: GPE066
Test Conducted by: Honnors/GDC/Golder Test Date: 5/05/2017
Analysis Performed by: C Houlbrooke Recovery - Pupmed well Analysis Date: 17/05/2017
Aquifer Thickness: 3.00 m Discharge: variable, average rate 13 [l/s]
1 10 100 1000 10000
t/t'
resid
ual
draw
do
wn
[m
]
Calculation using THEIS & JACOB
Observation Well Transmissivity
[m²/d]
Hydraulic Conductivity
[m/d]
Radial Distance to PW
[m]
GPE066 5.99 × 10²
2.00 × 10²
0.13

Pumping Test Analysis Report
Project: Makauri MAR Trial
Number: 1415771
Client: GDC
Golder Associates (NZ) LimitedLevel 2, Nielsen Centre129 Hurstmere RoadTakapuna, Auckland 0622New Zealand
Location: Kaiaponi, Gisborne Pumping Test: Constant Rate test Pumping Well: GPE066
Test Conducted by: Honnors/GDC/Golder Test Date: 5/05/2017
Analysis Performed by: C Houlbrooke GPE065 Recovery Analysis Date: 17/05/2017
Aquifer Thickness: 3.00 m Discharge: variable, average rate 13 [l/s]
1 10 100 1000 10000
t/t'
resid
ual
draw
do
wn
[m
]
Calculation using THEIS & JACOB
Observation Well Transmissivity
[m²/d]
Hydraulic Conductivity
[m/d]
Radial Distance to PW
[m]
GPE065 5.99 × 10²
2.00 × 10²
22.0
Pumping Test Analysis Report
Project: Makauri MAR Trial
Number: 1415771
Client: GDC
Golder Associates (NZ) LimitedLevel 2, Nielsen Centre129 Hurstmere RoadTakapuna, Auckland 0622New Zealand
Location: Kaiaponi, Gisborne Pumping Test: Constant Rate test Pumping Well: GPE066
Test Conducted by: Honnors/GDC/Golder Test Date: 5/05/2017
Analysis Performed by: C Houlbrooke Recovery Analysis Date: 3/05/2017
Aquifer Thickness: 3.00 m Discharge: variable, average rate 13 [l/s]
1 10 100 1000 10000
t/t'
0.00
0.24
0.48
0.72
0.96
1.20
resid
ual
draw
do
wn
[m
]
Calculation using THEIS & JACOB
Observation Well Transmissivity
[m²/d]
Hydraulic Conductivity
[m/d]
Radial Distance to PW
[m]
GPE066
GPE010
GPE030
GPE065
Average
5.99 × 10²
2.00 × 10²
0.13
6.14 × 10²
2.05 × 10²
190.0
5.76 × 10²
1.92 × 10²
365.0
5.99 × 10²
2.00 × 10²
22.0
5.97 × 10²
1.99 × 10²

Pumping Test Analysis Report
Project: Makauri MAR Trial
Number: 1415771
Client: GDC
Golder Associates (NZ) LimitedLevel 2, Nielsen Centre129 Hurstmere RoadTakapuna, Auckland 0622New Zealand
Location: Kaiaponi, Gisborne Pumping Test: Constant Rate test Pumping Well: GPE066
Test Conducted by: Honnors/GDC/Golder Test Date: 5/05/2017
Analysis Performed by: C Houlbrooke GPE065 Drawdown Analysis Date: 17/05/2017
Aquifer Thickness: 3.00 m Discharge: variable, average rate 13 [l/s]
0.1 1 10 100 1000 10000
Time [min]
Draw
do
wn
[m
]
Calculation using Theis
Observation Well Transmissivity
[m²/d]
Hydraulic Conductivity
[m/d]
Storage coefficient Radial Distance to PW
[m]
GPE065 7.75 × 10²
2.58 × 10²
3.03 × 10⁻⁴
22.0

Pumping Test Analysis Report
Project: Makauri MAR Trial
Number: 1415771
Client: GDC
Golder Associates (NZ) LimitedLevel 2, Nielsen Centre129 Hurstmere RoadTakapuna, Auckland 0622New Zealand
Location: Kaiaponi, Gisborne Pumping Test: Constant Rate test Pumping Well: GPE066
Test Conducted by: Honnors/GDC/Golder Test Date: 5/05/2017
Analysis Performed by: C Houlbrooke Obs bores drawdown Analysis Date: 16/05/2017
Aquifer Thickness: 3.00 m Discharge: variable, average rate 13 [l/s]
0 2000 4000 6000 8000 10000
Time [min]
0.00
0.24
0.48
0.72
0.96
1.20
Draw
do
wn
[m
]
Calculation using Theis
Observation Well Transmissivity
[m²/d]
Hydraulic Conductivity
[m/d]
Storage coefficient Radial Distance to PW
[m]
GPE010
GPE030
GPE105
GPE012
Average
7.76 × 10²
2.59 × 10²
1.62 × 10⁻⁵
190.0
7.57 × 10²
2.52 × 10²
1.76 × 10⁻⁵
365.0
3.53 × 10³
1.18 × 10³
1.01 × 10⁻³
1204.0
5.12 × 10³
1.71 × 10³
9.52 × 10⁻⁴
1026.0
2.54 × 10³
8.48 × 10²
4.99 × 10⁻⁴

Pumping Test Analysis Report
Project: Makauri MAR Trial
Number: 1415771
Client: GDC
Golder Associates (NZ) LimitedLevel 2, Nielsen Centre129 Hurstmere RoadTakapuna, Auckland 0622New Zealand
Location: Kaiaponi, Gisborne Pumping Test: Constant Rate test Pumping Well: GPE066
Test Conducted by: Honnors/GDC/Golder Test Date: 5/05/2017
Analysis Performed by: Drawdown pumped bore Analysis Date: 17/05/2017
Aquifer Thickness: 3.00 m Discharge: variable, average rate 13 [l/s]
0 1400 2800 4200 5600 7000
Time [min]
0.00
1.00
2.00
3.00
4.00
5.00
Draw
do
wn
[m
]
Calculation using Theis
Observation Well Transmissivity
[m²/d]
Hydraulic Conductivity
[m/d]
Storage coefficient Radial Distance to PW
[m]
GPE066 2.45 × 10²
8.16 × 101
5.00 × 10⁻¹
0.13

POVERTY BAY MAR INITIAL TEST
30 June 2017
Report No. 1415771-7410-023-R-Rev0
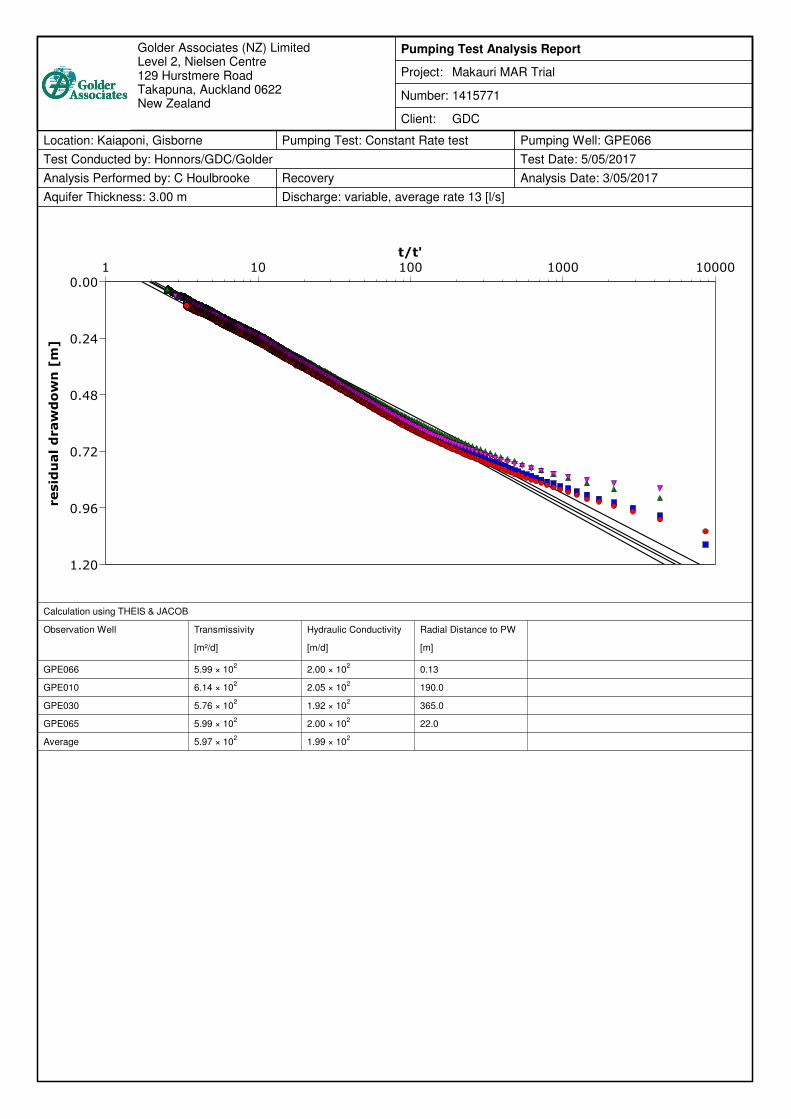
APPENDIX C Aquifer Geochemistry Analysis Sheets.

www.watercarelabs.co.nz [email protected]
52 Aintree Ave,
PO Box 107028,
Auckland Airport,
Auckland
142 Esk Street,
PO Box 747,
Invercargill, 9840
74 Glenda Drive,
PO Box 2614,
Wakatipu,
Invercargill Queenstown
(09) 539 7614
(09) 539 7601
(03) 214 4040
(03) 214 4041
(03) 409 0559Tel:
Fax:
Laboratory Reference:170509-082Certificate of Analysis
GISBORNE DISTRICT COUNCILClient:
Attention: Hilltop Sampler
Report Issue Date: 31-May-2017
228731-0Final Report:
PO Box 747, Gisborne, 4040Address: Received Date:
Sampled By:
09-May-2017
Client Reference: MAR
Purchase Order: 37/00/01/2104 5880Quote Reference :
Peter Hancock
Sample Details WATERS
Lab Sample ID:
Client Sample ID:
Sample Date/Time:
170509-082-1
20172081
08/05/2017 08:53
Description: 598 Bushmere Rd -
MAR injection bore
GPE066
Chemistry Detailed
Anions by Ion Chromatography (0.45 µm Filtered)
120mg/LChloride
0.0048mg/LNitrate (as N)
0.0060mg/LNitrite (as N)
<0.04mg/LSulphate
0.011 *mg/LTotal Oxidised Nitrogen (as N) by
Calculation
Ion Balance (Anions/Cations) by Calculation
15 *meq/LAnion Total
15 *meq/LCation Total
0.25 *meq/Lmeq/L Difference
0.85 *%Percent Difference
29 *meq/LSum of Anions + Cations
General Testing
2.0mg/LAmmoniacal Nitrogen (as N)
2.6 *mg/LAmmoniacal Nitrogen (as NH4)
690 *mg/LBicarbonate Alkalinity (as HCO3) by
Calc
680mg/LBicarbonate Alkalinity (as HCO3)
<0.6 *mg/LCarbonate Alkalinity (as CO3)
<3.3mg/LCarbonate Alkalinity (as CO3)
<3.3mg/LHydroxide Alkalinity (as CaCO3)
0.021 *mg/LNitrate (as NO3)
0.020 *mg/LNitrite (as NO2)
7.1pH unitpH (at room temp c. 20 °C)
<0.1 *mg/LSulfide
560mg/LTotal Alkalinity (as CaCO3)
0.09mg/LTotal Chlorine (as Cl2)
780mg/LTotal Dissolved Solids
2.0mg/LTotal Nitrogen (as N)
0.43mg/LTotal Phosphorus (as P)
13mg/LTotal Suspended Solids
37NTUTurbidity
Metals
Dissolved Metals by ICP-MS—Trace (Received Filtered)
0.011mg/LArsenic (Dissolved)
170mg/LCalcium (Dissolved)
5.1mg/LIron (Dissolved)
Page 1 of 4Report Number: 228731-0 Watercare Laboratory Services

Sample Details (continued) WATERS
Lab Sample ID:
Client Sample ID:
Sample Date/Time:
170509-082-1
20172081
08/05/2017 08:53
Description: 598 Bushmere Rd -
MAR injection bore
GPE066
Metals
Dissolved Metals by ICP-MS—Trace (Received Filtered)
20mg/LMagnesium (Dissolved)
0.96mg/LManganese (Dissolved)
8.4mg/LPotassium (Dissolved)
88mg/LSodium (Dissolved)
Total Metals by ICP-MS—Trace (Default Digest)
0.011mg/LArsenic (Total)
170mg/LCalcium (Total)
5.1mg/LIron (Total)
19mg/LMagnesium (Total)
0.94mg/LManganese (Total)
8.2mg/LPotassium (Total)
86mg/LSodium (Total)
520mg/LTotal Hardness (as CaCO3)
Organics
Total Organic Carbon by Non-dispersive infrared detection
5.2mg/LTotal Organic Carbon
Microbiology
Escherichia coli by Membrane Filtration
<1.6cfu/100 mLEscherichia coli
Results marked with * are not accredited to International Accreditation New Zealand
Where samples have been supplied by the client they are tested as received. A dash indicates no test performed.
The sample(s) referred to in this report were analysed by the following method(s)
Reference Methods
Analyte MDLMethod Reference Samples Location
Chemistry Detailed
Anions by Ion Chromatography (0.45 µm Filtered)
In House based on APHA (online edition)
4110 B and EPA 300.0
All0.02 mg/L AucklandChloride
In House based on APHA (online edition)
4110 B and EPA 300.0
All0.002 mg/L AucklandNitrate (as N)
In House based on APHA (online edition)
4110 B and EPA 300.0
All0.002 mg/L AucklandNitrite (as N)
In House based on APHA (online edition)
4110 B and EPA 300.0
All0.02 mg/L AucklandSulphate
In House based on APHA (online edition)
4110 B and EPA 300.0
All0.002 mg/L AucklandTotal Oxidised Nitrogen (as N) by Calculation
Ion Balance (Anions/Cations) by Calculation
APHA (online edition) 1030 E Allmeq/L AucklandAnion Total
APHA (online edition) 1030 E Allmeq/L AucklandCation Total
APHA (online edition) 1030 E Allmeq/L Aucklandmeq/L Difference
APHA (online edition) 1030 E All AucklandPercent Difference
APHA (online edition) 1030 E All AucklandSum of Anions + Cations
General Testing
HMSO (1981) ISBN 0117516139 All0.005 mg/L AucklandAmmoniacal Nitrogen (as N) by Colorimetry/Discrete
Analyser
Calculation from Ammonia (as N) All0.006 mg/L AucklandAmmoniacal Nitrogen (as NH4) by Calculation
APHA (online edition) 4500-CO2 D All1 mg/L AucklandBicarbonate Alkalinity (as HCO3) by Calculation
APHA (online edition) 2320 B All1 mg/L AucklandBicarbonate Alkalinity (as HCO3) by Titration
APHA (online edition) 2320 B All1 mg/L AucklandCarbonate Alkalinity (as CO3) by Titration
APHA (online edition) 4500-CO2 D All1 mg/L AucklandCarbonate Alkalinity (as CO3) by Calculation
APHA (online edition) 2320 B All1 mg/L AucklandHydroxide Alkalinity (as CaCO3) by Titration
Calculation All0.009 mg/L AucklandNitrate (as NO3) by Calculation
Calculation All0.007 mg/L AucklandNitrite (as NO2) by Calculation
APHA (online edition) 4500-H B All0.1 pH unit AucklandpH (at room temp c. 20 °C) by Electrode
Page 2 of 4Report Number: 228731-0 Watercare Laboratory Services
General Testing
APHA (online edition) 4500-S2 D All0.1 mg/L AucklandSulfide by Colour Comparison (Methylene Blue Method)
APHA (online edition) 2320 B All1 mg/L AucklandTotal Alkalinity (as CaCO3) by Titration
APHA (online edition) 4500-Cl G All0.02 mg/L AucklandTotal Chlorine (as Cl2) by Spectrophotometry according to
APHA (2005) 4500-Cl G
APHA (online edition) 2540 C (Modified: Dried
at 103 - 105 ºC)
All15 mg/L AucklandTotal Dissolved Solids by Gravimetry
APHA (online edition) 4500-P J (modified),
4500-NO3 I
All0.010 mg/L AucklandTotal Nitrogen (as N) by Persulphate Digestion and Flow
Analysis
APHA (online edition) 4500-P J (modified) All0.004 mg/L AucklandTotal Phosphorus (as P) by Persulphate Digestion and
Colorimetry/Discrete Analyser
APHA (online edition) 2540 D All0.2 mg/L AucklandTotal Suspended Solids by Gravimetry
APHA (online edition) 2130 B (modified) All0.05 NTU AucklandTurbidity by Nephelometry
Metals
Dissolved Metals by ICP-MS—Trace (Received Filtered)
In House based on EPA 200.8 by ICPMS All0.00010 mg/L AucklandArsenic (Dissolved)
In House based on EPA 200.8 by ICPMS All0.010 mg/L AucklandCalcium (Dissolved)
In House based on EPA 200.8 by ICPMS All0.002 mg/L AucklandIron (Dissolved)
In House based on EPA 200.8 by ICPMS All0.001 mg/L AucklandMagnesium (Dissolved)
In House based on EPA 200.8 by ICPMS All0.0005 mg/L AucklandManganese (Dissolved)
In House based on EPA 200.8 by ICPMS All0.02 mg/L AucklandPotassium (Dissolved)
In House based on EPA 200.8 by ICPMS All0.1 mg/L AucklandSodium (Dissolved)
Total Metals by ICP-MS—Trace (Default Digest)
In House based on EPA 200.8 by ICPMS All0.00010 mg/L AucklandArsenic (Total)
In House based on EPA 200.8 by ICPMS All0.010 mg/L AucklandCalcium (Total)
In House based on EPA 200.8 by ICPMS All0.002 mg/L AucklandIron (Total)
In House based on EPA 200.8 by ICPMS All0.001 mg/L AucklandMagnesium (Total)
In House based on EPA 200.8 by ICPMS All0.0005 mg/L AucklandManganese (Total)
In House based on EPA 200.8 by ICPMS All0.05 mg/L AucklandPotassium (Total)
In House based on EPA 200.8 by ICPMS All0.1 mg/L AucklandSodium (Total)
In House based on EPA 200.8 by ICPMS All0.03 mg/L AucklandTotal Hardness (as CaCO3)
Organics
Total Organic Carbon by Non-dispersive infrared detection
APHA (online edition) 5310 B All0.1 mg/L AucklandTotal Organic Carbon
Microbiology
Escherichia coli by Membrane Filtration
USEPA Method 1603 All2 cfu/100 mL AucklandEscherichia coli
Preparations
APHA (online edition) 3030 E (modified, 4:1
Nitric:Hydrochloric Acid)
All AucklandDigest for Total Metals in Liquids
APHA (online edition) 2540 C (Filtration) All AucklandGlass Fibre Filtration (1.2 µm)
APHA (online edition) 4500-P B (preliminary
filtration)
All AucklandMembrane Filtration (0.45 µm)
The method detection limit (MDL) listed is the limit attainable in a relatively clean matrix. If dilutions are required for analysis the detection limit may be
higher.
For more information please contact the Operations Manager.
Page 3 of 4Report Number: 228731-0 Watercare Laboratory Services

Samples, with suitable preservation and stability of analytes, will be held by the laboratory for a period of two weeks after results have been reported,
unless otherwise advised by the submitter.
Watercare Laboratory Services is a division of Watercare Services Limited .
This report may not be reproduced, except in full, without the written authority of the Operations Manager.
Report Signatory 31/05/2017
Anel Du Preez
KTP Signatory
Page 4 of 4Report Number: 228731-0 Watercare Laboratory Services

www.watercarelabs.co.nz [email protected]
52 Aintree Ave,
PO Box 107028,
Auckland Airport,
Auckland
142 Esk Street,
PO Box 747,
Invercargill, 9840
74 Glenda Drive,
PO Box 2614,
Wakatipu,
Invercargill Queenstown
(09) 539 7614
(09) 539 7601
(03) 214 4040
(03) 214 4041
(03) 409 0559Tel:
Fax:
Laboratory Reference:170505-086Certificate of Analysis
GISBORNE DISTRICT COUNCILClient:
Attention: Hilltop Sampler
Report Issue Date: 31-May-2017
228730-0Final Report:
PO Box 747, Gisborne, 4040Address: Received Date:
Sampled By:
05-May-2017
Client Reference: MAR
Purchase Order: 37/00/01/2104 5880Quote Reference :
Daniel Williams
No client filtered sample bottle received for sample ID 20172080 (590 Matawai rd GPF159). Logged as lab filtered dissolved metal
test instead and was subsampled from the bulk as requested by the client.
Sample Details WATERS WATERS WATERS WATERS
Lab Sample ID:
Client Sample ID:
Sample Date/Time:
170505-086-1 170505-086-2 170505-086-3 170505-086-4
20172070 20172071 20172072 20172080
04/05/2017 09:20 04/05/2017 10:05 04/05/2017 11:05 04/05/2017 13:00
Description: Mc Intyre 409 Matawai
Rd (SH2) GPD116
Patterson 54 Bolitho
Rd GPD115
Stuart 370 Bushmere
Rd
590 Matawai Rd
Chemistry Detailed
Anions by Ion Chromatography (0.45 µm Filtered)
32065mg/LChloride 27130
0.00500.0080mg/LNitrate (as N) 0.00540.0094
<0.002<0.002mg/LNitrite (as N) <0.002<0.002
<0.04<0.04mg/LSulphate 0.68<0.04
0.0050 *0.0080 *mg/LTotal Oxidised Nitrogen (as N) by
Calculation
0.0054 *0.0094 *
Ion Balance (Anions/Cations) by Calculation
22 *16 *meq/LAnion Total 8.9 *14 *
22 *16 *meq/LCation Total 8.5 *14 *
0.021 *0.78 *meq/Lmeq/L Difference 0.40 *0.25 *
0.046 *2.4 *%Percent Difference 2.3 *0.88 *
45 *32 *meq/LSum of Anions + Cations 17 *28 *
General Testing
2.01.4mg/LAmmoniacal Nitrogen (as N) 0.424.1
2.6 *2.0 *mg/LAmmoniacal Nitrogen (as NH4) 0.53 *5.5 *
810 *840 *mg/LBicarbonate Alkalinity (as HCO3) by
Calc
490 *630 *
810840mg/LBicarbonate Alkalinity (as HCO3) 500630
0.6 *0.6 *mg/LCarbonate Alkalinity (as CO3) <0.6 *<0.6 *
<3.3<3.3mg/LCarbonate Alkalinity (as CO3) <2.0<4.0
<3.3<3.3mg/LHydroxide Alkalinity (as CaCO3) <2.0<4.0
0.022 *0.035 *mg/LNitrate (as NO3) 0.024 *0.042 *
<0.007 *<0.007 *mg/LNitrite (as NO2) <0.007 *<0.007 *
7.27.2pH unitpH (at room temp c. 20 °C) 7.27.0
<0.1 *<0.1 *mg/LSulfide -<0.1 *
660690mg/LTotal Alkalinity (as CaCO3) 410520
0.090.07mg/LTotal Chlorine (as Cl2) 0.030.06
1200850mg/LTotal Dissolved Solids 530780
1.81.2mg/LTotal Nitrogen (as N) 0.423.8
0.330.31mg/LTotal Phosphorus (as P) 0.130.15
220200mg/LTotal Suspended Solids 2.030
110310NTUTurbidity 12150
Metals
Dissolved Metals by ICP-MS—Trace
--mg/LArsenic (Dissolved) 0.0020-
--mg/LCalcium (Dissolved) 100-
Page 1 of 5Report Number: 228730-0 Watercare Laboratory Services

Sample Details (continued) WATERS WATERS WATERS WATERS
Lab Sample ID:
Client Sample ID:
Sample Date/Time:
170505-086-1 170505-086-2 170505-086-3 170505-086-4
20172070 20172071 20172072 20172080
04/05/2017 09:20 04/05/2017 10:05 04/05/2017 11:05 04/05/2017 13:00
Description: Mc Intyre 409 Matawai
Rd (SH2) GPD116
Patterson 54 Bolitho
Rd GPD115
Stuart 370 Bushmere
Rd
590 Matawai Rd
Metals
Dissolved Metals by ICP-MS—Trace
--mg/LIron (Dissolved) 0.0025-
--mg/LMagnesium (Dissolved) 11-
--mg/LManganese (Dissolved) 0.31-
--mg/LPotassium (Dissolved) 5.2-
--mg/LSodium (Dissolved) 52-
Dissolved Metals by ICP-MS—Trace (Received Filtered)
0.00760.0043mg/LArsenic (Dissolved) -0.0053
220190mg/LCalcium (Dissolved) -160
4.910mg/LIron (Dissolved) -8.9
3424mg/LMagnesium (Dissolved) -19
1.41.5mg/LManganese (Dissolved) -0.70
7.66.4mg/LPotassium (Dissolved) -9.0
180100mg/LSodium (Dissolved) -89
Total Metals by ICP-MS—Trace (Default Digest)
0.00940.0051mg/LArsenic (Total) 0.00220.0051
230190mg/LCalcium (Total) 110160
1028mg/LIron (Total) 1.010
3725mg/LMagnesium (Total) 1119
1.51.6mg/LManganese (Total) 0.320.68
8.67.5mg/LPotassium (Total) 5.89.0
19098mg/LSodium (Total) 5489
730570mg/LTotal Hardness (as CaCO3) 320480
Organics
Total Organic Carbon by Non-dispersive infrared detection
4.74.1mg/LTotal Organic Carbon 2.53.3
Microbiology
Escherichia coli by Membrane Filtration
<1.6<1.6cfu/100 mLEscherichia coli <1.6<1.6
Sample Details WATERS
Lab Sample ID:
Client Sample ID:
Sample Date/Time:
170505-086-5
20172074
05/05/2017 09:45
Description: Harper Road
Chemistry Detailed
Anions by Ion Chromatography (0.45 µm Filtered)
29mg/LChloride
0.0028mg/LNitrate (as N)
0.0037mg/LNitrite (as N)
0.47mg/LSulphate
0.0065 *mg/LTotal Oxidised Nitrogen (as N) by
Calculation
Ion Balance (Anions/Cations) by Calculation
9.3 *meq/LAnion Total
9.5 *meq/LCation Total
0.25 *meq/Lmeq/L Difference
1.3 *%Percent Difference
19 *meq/LSum of Anions + Cations
General Testing
0.27mg/LAmmoniacal Nitrogen (as N)
0.35 *mg/LAmmoniacal Nitrogen (as NH4)
510 *mg/LBicarbonate Alkalinity (as HCO3) by
Calc
520mg/LBicarbonate Alkalinity (as HCO3)
Page 2 of 5Report Number: 228730-0 Watercare Laboratory Services

Sample Details (continued) WATERS
Lab Sample ID:
Client Sample ID:
Sample Date/Time:
170505-086-5
20172074
05/05/2017 09:45
Description: Harper Road
General Testing
<0.6 *mg/LCarbonate Alkalinity (as CO3)
<2.0mg/LCarbonate Alkalinity (as CO3)
<2.0mg/LHydroxide Alkalinity (as CaCO3)
0.012 *mg/LNitrate (as NO3)
0.012 *mg/LNitrite (as NO2)
7.4pH unitpH (at room temp c. 20 °C)
<0.1 *mg/LSulfide
420mg/LTotal Alkalinity (as CaCO3)
0.02mg/LTotal Chlorine (as Cl2)
520mg/LTotal Dissolved Solids
0.29mg/LTotal Nitrogen (as N)
0.12mg/LTotal Phosphorus (as P)
4.8mg/LTotal Suspended Solids
17NTUTurbidity
Metals
Dissolved Metals by ICP-MS—Trace (Received Filtered)
0.0035mg/LArsenic (Dissolved)
130mg/LCalcium (Dissolved)
1.6mg/LIron (Dissolved)
13mg/LMagnesium (Dissolved)
0.20mg/LManganese (Dissolved)
4.2mg/LPotassium (Dissolved)
47mg/LSodium (Dissolved)
Total Metals by ICP-MS—Trace (Default Digest)
0.0033mg/LArsenic (Total)
130mg/LCalcium (Total)
1.6mg/LIron (Total)
13mg/LMagnesium (Total)
0.20mg/LManganese (Total)
5.2mg/LPotassium (Total)
46mg/LSodium (Total)
360mg/LTotal Hardness (as CaCO3)
Organics
Total Organic Carbon by Non-dispersive infrared detection
5.8mg/LTotal Organic Carbon
Microbiology
Escherichia coli by Membrane Filtration
<1.6cfu/100 mLEscherichia coli
Results marked with * are not accredited to International Accreditation New Zealand
Where samples have been supplied by the client they are tested as received. A dash indicates no test performed.
The sample(s) referred to in this report were analysed by the following method(s)
Reference Methods
Analyte MDLMethod Reference Samples Location
Chemistry Detailed
Anions by Ion Chromatography (0.45 µm Filtered)
In House based on APHA (online edition)
4110 B and EPA 300.0
All0.02 mg/L AucklandChloride
In House based on APHA (online edition)
4110 B and EPA 300.0
All0.002 mg/L AucklandNitrate (as N)
In House based on APHA (online edition)
4110 B and EPA 300.0
All0.002 mg/L AucklandNitrite (as N)
In House based on APHA (online edition)
4110 B and EPA 300.0
All0.02 mg/L AucklandSulphate
In House based on APHA (online edition)
4110 B and EPA 300.0
All0.002 mg/L AucklandTotal Oxidised Nitrogen (as N) by Calculation
Ion Balance (Anions/Cations) by Calculation
APHA (online edition) 1030 E Allmeq/L AucklandAnion Total
Page 3 of 5Report Number: 228730-0 Watercare Laboratory Services

Chemistry Detailed
Ion Balance (Anions/Cations) by Calculation
APHA (online edition) 1030 E Allmeq/L AucklandCation Total
APHA (online edition) 1030 E Allmeq/L Aucklandmeq/L Difference
APHA (online edition) 1030 E All AucklandPercent Difference
APHA (online edition) 1030 E All AucklandSum of Anions + Cations
General Testing
HMSO (1981) ISBN 0117516139 All0.005 mg/L AucklandAmmoniacal Nitrogen (as N) by Colorimetry/Discrete
Analyser
Calculation from Ammonia (as N) All0.006 mg/L AucklandAmmoniacal Nitrogen (as NH4) by Calculation
APHA (online edition) 4500-CO2 D All1 mg/L AucklandBicarbonate Alkalinity (as HCO3) by Calculation
APHA (online edition) 2320 B All1 mg/L AucklandBicarbonate Alkalinity (as HCO3) by Titration
APHA (online edition) 2320 B All1 mg/L AucklandCarbonate Alkalinity (as CO3) by Titration
APHA (online edition) 4500-CO2 D All1 mg/L AucklandCarbonate Alkalinity (as CO3) by Calculation
APHA (online edition) 2320 B All1 mg/L AucklandHydroxide Alkalinity (as CaCO3) by Titration
Calculation All0.009 mg/L AucklandNitrate (as NO3) by Calculation
Calculation All0.007 mg/L AucklandNitrite (as NO2) by Calculation
APHA (online edition) 4500-H B All0.1 pH unit AucklandpH (at room temp c. 20 °C) by Electrode
APHA (online edition) 4500-S2 D 1, 2, 3, 50.1 mg/L AucklandSulfide by Colour Comparison (Methylene Blue Method)
APHA (online edition) 2320 B All1 mg/L AucklandTotal Alkalinity (as CaCO3) by Titration
APHA (online edition) 4500-Cl G All0.02 mg/L AucklandTotal Chlorine (as Cl2) by Spectrophotometry according to
APHA (2005) 4500-Cl G
APHA (online edition) 2540 C (Modified: Dried
at 103 - 105 ºC)
All15 mg/L AucklandTotal Dissolved Solids by Gravimetry
APHA (online edition) 4500-P J (modified),
4500-NO3 I
All0.010 mg/L AucklandTotal Nitrogen (as N) by Persulphate Digestion and Flow
Analysis
APHA (online edition) 4500-P J (modified) All0.004 mg/L AucklandTotal Phosphorus (as P) by Persulphate Digestion and
Colorimetry/Discrete Analyser
APHA (online edition) 2540 D All0.2 mg/L AucklandTotal Suspended Solids by Gravimetry
APHA (online edition) 2130 B (modified) All0.05 NTU AucklandTurbidity by Nephelometry
Metals
Dissolved Metals by ICP-MS—Trace
In House based on EPA 200.8 by ICPMS 40.00010 mg/L AucklandArsenic (Dissolved)
In House based on EPA 200.8 by ICPMS 40.010 mg/L AucklandCalcium (Dissolved)
In House based on EPA 200.8 by ICPMS 40.002 mg/L AucklandIron (Dissolved)
In House based on EPA 200.8 by ICPMS 40.001 mg/L AucklandMagnesium (Dissolved)
In House based on EPA 200.8 by ICPMS 40.0005 mg/L AucklandManganese (Dissolved)
In House based on EPA 200.8 by ICPMS 40.05 mg/L AucklandPotassium (Dissolved)
In House based on EPA 200.8 by ICPMS 40.1 mg/L AucklandSodium (Dissolved)
Dissolved Metals by ICP-MS—Trace (Received Filtered)
In House based on EPA 200.8 by ICPMS 1, 2, 3, 50.00010 mg/L AucklandArsenic (Dissolved)
In House based on EPA 200.8 by ICPMS 1, 2, 3, 50.010 mg/L AucklandCalcium (Dissolved)
In House based on EPA 200.8 by ICPMS 1, 2, 3, 50.002 mg/L AucklandIron (Dissolved)
In House based on EPA 200.8 by ICPMS 1, 2, 3, 50.001 mg/L AucklandMagnesium (Dissolved)
In House based on EPA 200.8 by ICPMS 1, 2, 3, 50.0005 mg/L AucklandManganese (Dissolved)
In House based on EPA 200.8 by ICPMS 1, 2, 3, 50.02 mg/L AucklandPotassium (Dissolved)
In House based on EPA 200.8 by ICPMS 1, 2, 3, 50.1 mg/L AucklandSodium (Dissolved)
Total Metals by ICP-MS—Trace (Default Digest)
In House based on EPA 200.8 by ICPMS All0.00010 mg/L AucklandArsenic (Total)
In House based on EPA 200.8 by ICPMS All0.010 mg/L AucklandCalcium (Total)
In House based on EPA 200.8 by ICPMS All0.002 mg/L AucklandIron (Total)
In House based on EPA 200.8 by ICPMS All0.001 mg/L AucklandMagnesium (Total)
In House based on EPA 200.8 by ICPMS All0.0005 mg/L AucklandManganese (Total)
In House based on EPA 200.8 by ICPMS All0.05 mg/L AucklandPotassium (Total)
In House based on EPA 200.8 by ICPMS All0.1 mg/L AucklandSodium (Total)
In House based on EPA 200.8 by ICPMS All0.03 mg/L AucklandTotal Hardness (as CaCO3)
Organics
Total Organic Carbon by Non-dispersive infrared detection
APHA (online edition) 5310 B All0.1 mg/L AucklandTotal Organic Carbon
Microbiology
Escherichia coli by Membrane Filtration
USEPA Method 1603 All2 cfu/100 mL AucklandEscherichia coli
Preparations
APHA (online edition) 3010B (modified) 4 Auckland0.45 µm Filtration for Dissolved Metals
Page 4 of 5Report Number: 228730-0 Watercare Laboratory Services
Preparations
APHA (online edition) 3030 E (modified, 4:1
Nitric:Hydrochloric Acid)
All AucklandDigest for Total Metals in Liquids
APHA (online edition) 2540 C (Filtration) All AucklandGlass Fibre Filtration (1.2 µm)
APHA (online edition) 4500-P B (preliminary
filtration)
All AucklandMembrane Filtration (0.45 µm)
The method detection limit (MDL) listed is the limit attainable in a relatively clean matrix. If dilutions are required for analysis the detection limit may be
higher.
For more information please contact the Operations Manager.
Samples, with suitable preservation and stability of analytes, will be held by the laboratory for a period of two weeks after results have been reported,
unless otherwise advised by the submitter.
Watercare Laboratory Services is a division of Watercare Services Limited .
This report may not be reproduced, except in full, without the written authority of the Operations Manager.
Report Signatory 31/05/2017
Anel Du Preez
KTP Signatory
Page 5 of 5Report Number: 228730-0 Watercare Laboratory Services

www.watercarelabs.co.nz [email protected]
52 Aintree Ave,
PO Box 107028,
Auckland Airport,
Auckland, 2150
Auckland
142 Esk Street,
PO Box 747,
Invercargill, 9840
74 Glenda Drive,
PO Box 2614,
Wakatipu,
Queenstown, 9349
Invercargill Queenstown
(09) 539 7614
(09) 539 7601
(03) 214 4040
(03) 214 4041(03) 409 0559Tel:
Fax:
Laboratory Reference:170627-092Certificate of Analysis
GISBORNE DISTRICT COUNCILClient:
Attention: Hilltop Sampler
Report Issue Date: 29-Jun-2017
232646-0Final Report:
PO Box 747, Gisborne, 4040Address: Received Date:
Sampled By:
27-Jun-2017
Client Reference: MAR (Micro)
Purchase Order: 37/00/01/2104 5880Quote Reference :
Alice Trevelyan
Sample Details WATERS
Lab Sample ID:
Client Sample ID:
Sample Date/Time:
170627-092-1
20172897
26/06/2017 09:20
Description: 598 Bushmere Rd -
MAR injection bore
GPE066
Microbiology
Escherichia coli by Membrane Filtration
6.5cfu/100 mLEscherichia coli
Results marked with * are not accredited to International Accreditation New Zealand
Where samples have been supplied by the client they are tested as received. A dash indicates no test performed.
The sample(s) referred to in this report were analysed by the following method(s)
Reference Methods
Analyte MDLMethod Reference Samples Location
Microbiology
Escherichia coli by Membrane Filtration
USEPA Method 1603 All2 cfu/100 mL AucklandEscherichia coli
The method detection limit (MDL) listed is the limit attainable in a relatively clean matrix. If dilutions are required for analysis the detection limit may be higher.
For more information please contact the Operations Manager.
Page 1 of 2Report Number: 232646-0 Watercare Laboratory Services

Samples, with suitable preservation and stability of analytes, will be held by the laboratory for a period of two weeks after results have been reported, unless
otherwise advised by the submitter.
Watercare Laboratory Services is a division of Watercare Services Limited .
This report may not be reproduced, except in full, without the written authority of the Operations Manager.
Report Signatory 29/06/2017
Marina Fisher
KTP Signatory
Page 2 of 2Report Number: 232646-0 Watercare Laboratory Services

www.watercarelabs.co.nz [email protected]
52 Aintree Ave,
PO Box 107028,
Auckland Airport,
Auckland
142 Esk Street,
PO Box 747,
Invercargill, 9840
74 Glenda Drive,
PO Box 2614,
Wakatipu,
Invercargill Queenstown
(09) 539 7614
(09) 539 7601
(03) 214 4040
(03) 214 4041
(03) 409 0559Tel:
Fax:
Laboratory Reference:170624-052Certificate of Analysis
GISBORNE DISTRICT COUNCILClient:
Attention: Hilltop Sampler
Report Issue Date: 26-Jun-2017
232100-0Final Report:
PO Box 747, Gisborne, 4040Address: Received Date:
Sampled By:
24-Jun-2017
Client Reference: MAR (Micro)
Purchase Order: 37/00/01/2104 5880Quote Reference :
Alice Trevelyan
Sample Details WATERS WATERS
Lab Sample ID:
Client Sample ID:
Sample Date/Time:
170624-052-1 170624-052-2
20172875 20172878
23/06/2017 09:42 23/06/2017 10:49
Description: 599 Bushmere Road
GPE010
598 Bushmere Road
MAR Pilot Bore GPE
065
Microbiology
Escherichia coli by Membrane Filtration
<1.6cfu/100 mLEscherichia coli 6.6
Results marked with * are not accredited to International Accreditation New Zealand
Where samples have been supplied by the client they are tested as received. A dash indicates no test performed.
The sample(s) referred to in this report were analysed by the following method(s)
Reference Methods
Analyte MDLMethod Reference Samples Location
Microbiology
Escherichia coli by Membrane Filtration
USEPA Method 1603 All2 cfu/100 mL AucklandEscherichia coli
The method detection limit (MDL) listed is the limit attainable in a relatively clean matrix. If dilutions are required for analysis the detection limit may be
higher.
For more information please contact the Operations Manager.
Page 1 of 2Report Number: 232100-0 Watercare Laboratory Services

Samples, with suitable preservation and stability of analytes, will be held by the laboratory for a period of two weeks after results have been reported,
unless otherwise advised by the submitter.
Watercare Laboratory Services is a division of Watercare Services Limited .
This report may not be reproduced, except in full, without the written authority of the Operations Manager.
Report Signatory 26/06/2017
Qi Zhu
KTP Signatory
Page 2 of 2Report Number: 232100-0 Watercare Laboratory Services

www.watercarelabs.co.nz [email protected]
52 Aintree Ave,
PO Box 107028,
Auckland Airport,
Auckland
142 Esk Street,
PO Box 747,
Invercargill, 9840
74 Glenda Drive,
PO Box 2614,
Wakatipu,
Invercargill Queenstown
(09) 539 7614
(09) 539 7601
(03) 214 4040
(03) 214 4041
(03) 409 0559Tel:
Fax:
Laboratory Reference:170607-106Certificate of Analysis
GISBORNE DISTRICT COUNCILClient:
Attention: Hilltop Sampler
Report Issue Date: 22-Jun-2017
231671-0 Replaces Report 230948-0Final Report:
PO Box 747, Gisborne, 4040Address: Received Date:
Sampled By:
07-Jun-2017
Client Reference: 598 Bushmere Road MAR Injection Bore GPE066
Purchase Order: 37/00/01/2104 5880Quote Reference :
Mark Joblin
Sample Details WATERS
Lab Sample ID:
Client Sample ID:
Sample Date/Time:
170607-106-1
20172586
06/06/2017 11:30
Description: 598 Bushmere Road
MAR Injection Bore
GPE066
Chemistry Detailed
Anions by Ion Chromatography (0.45 µm Filtered)
15mg/LChloride
0.0055mg/LNitrate (as N)
<0.002mg/LNitrite (as N)
76mg/LSulphate
0.0055 *mg/LTotal Oxidised Nitrogen (as N) by
Calculation
Ion Balance (Anions/Cations) by Calculation
6.4 *meq/LAnion Total
6.5 *meq/LCation Total
0.54e-1 *meq/Lmeq/L Difference
0.42 *%Percent Difference
13 *meq/LSum of Anions + Cations
General Testing
0.55mg/LAmmoniacal Nitrogen (as N)
0.71 *mg/LAmmoniacal Nitrogen (as NH4)
270mg/LBicarbonate Alkalinity (as HCO3)
<2.0mg/LCarbonate Alkalinity (as CO3)
60.6mS/mConductivity (at 25 °C)
<2.0mg/LHydroxide Alkalinity (as CaCO3)
7.6pH unitpH (at room temp c. 20 °C)
220mg/LTotal Alkalinity (as CaCO3)
0.04mg/LTotal Chlorine (as Cl2)
460mg/LTotal Dissolved Solids
1.1mg/LTotal Nitrogen (as N)
0.018mg/LTotal Phosphorus (as P)
3.0mg/LTotal Suspended Solids
0.65NTUTurbidity
Metals
Dissolved Metals by ICP-MS—Trace (Received Filtered)
0.0027mg/LArsenic (Dissolved)
78mg/LCalcium (Dissolved)
0.035mg/LIron (Dissolved)
8.5mg/LMagnesium (Dissolved)
0.21mg/LManganese (Dissolved)
4.9mg/LPotassium (Dissolved)
39mg/LSodium (Dissolved)
Total Metals by ICP-MS—Trace (Default Digest)
Page 1 of 3Report Number: 231671-0 Watercare Laboratory Services

Sample Details (continued) WATERS
Lab Sample ID:
Client Sample ID:
Sample Date/Time:
170607-106-1
20172586
06/06/2017 11:30
Description: 598 Bushmere Road
MAR Injection Bore
GPE066
Metals
Total Metals by ICP-MS—Trace (Default Digest)
0.0027mg/LArsenic (Total)
0.063mg/LIron (Total)
0.20mg/LManganese (Total)
4.9mg/LPotassium (Total)
35mg/LSodium (Total)
Organics
Total Organic Carbon by Non-dispersive infrared detection
3.7mg/LTotal Organic Carbon
Microbiology
Escherichia coli by Membrane Filtration
1.6cfu/100 mLEscherichia coli
Results marked with * are not accredited to International Accreditation New Zealand
Where samples have been supplied by the client they are tested as received. A dash indicates no test performed.
The sample(s) referred to in this report were analysed by the following method(s)
Reference Methods
Analyte MDLMethod Reference Samples Location
Chemistry Detailed
Anions by Ion Chromatography (0.45 µm Filtered)
In House based on APHA (online edition)
4110 B and EPA 300.0
All0.02 mg/L AucklandChloride
In House based on APHA (online edition)
4110 B and EPA 300.0
All0.002 mg/L AucklandNitrate (as N)
In House based on APHA (online edition)
4110 B and EPA 300.0
All0.002 mg/L AucklandNitrite (as N)
In House based on APHA (online edition)
4110 B and EPA 300.0
All0.02 mg/L AucklandSulphate
In House based on APHA (online edition)
4110 B and EPA 300.0
All0.002 mg/L AucklandTotal Oxidised Nitrogen (as N) by Calculation
Ion Balance (Anions/Cations) by Calculation
APHA (online edition) 1030 E Allmeq/L AucklandAnion Total
APHA (online edition) 1030 E Allmeq/L AucklandCation Total
APHA (online edition) 1030 E Allmeq/L Aucklandmeq/L Difference
APHA (online edition) 1030 E All AucklandPercent Difference
APHA (online edition) 1030 E All AucklandSum of Anions + Cations
General Testing
APHA (online edition) 4500-NH3 H All0.005 mg/L AucklandAmmoniacal Nitrogen (as N) by Flow Analysis
Calculation from Ammonia (as N) All0.006 mg/L AucklandAmmoniacal Nitrogen (as NH4) by Calculation
APHA (online edition) 2320 B All1 mg/L AucklandBicarbonate Alkalinity (as HCO3) by Titration
APHA (online edition) 2320 B All1 mg/L AucklandCarbonate Alkalinity (as CO3) by Titration
APHA (online edition) 2510 B All0.5 mS/m AucklandConductivity (at 25 °C) by Electrode
APHA (online edition) 2320 B All1 mg/L AucklandHydroxide Alkalinity (as CaCO3) by Titration
APHA (online edition) 4500-H B All0.1 pH unit AucklandpH (at room temp c. 20 °C) by Electrode
APHA (online edition) 2320 B All1 mg/L AucklandTotal Alkalinity (as CaCO3) by Titration
APHA (online edition) 4500-Cl G All0.02 mg/L AucklandTotal Chlorine (as Cl2) by Spectrophotometry according to
APHA (2005) 4500-Cl G
APHA (online edition) 2540 C (Modified: Dried
at 103 - 105 ºC)
All15 mg/L AucklandTotal Dissolved Solids by Gravimetry
APHA (online edition) 4500-P J (modified),
4500-NO3 I
All0.010 mg/L AucklandTotal Nitrogen (as N) by Persulphate Digestion and Flow
Analysis
APHA (online edition) 4500-P J (modified) All0.004 mg/L AucklandTotal Phosphorus (as P) by Persulphate Digestion and
Colorimetry/Discrete Analyser
APHA (online edition) 2540 D All0.2 mg/L AucklandTotal Suspended Solids by Gravimetry
APHA (online edition) 2130 B (modified) All0.05 NTU AucklandTurbidity by Nephelometry
Metals
Dissolved Metals by ICP-MS—Trace (Received Filtered)
Page 2 of 3Report Number: 231671-0 Watercare Laboratory Services

Metals
Dissolved Metals by ICP-MS—Trace (Received Filtered)
In House based on EPA 200.8 by ICPMS All0.00010 mg/L AucklandArsenic (Dissolved)
In House based on EPA 200.8 by ICPMS All0.010 mg/L AucklandCalcium (Dissolved)
In House based on EPA 200.8 by ICPMS All0.002 mg/L AucklandIron (Dissolved)
In House based on EPA 200.8 by ICPMS All0.001 mg/L AucklandMagnesium (Dissolved)
In House based on EPA 200.8 by ICPMS All0.0005 mg/L AucklandManganese (Dissolved)
In House based on EPA 200.8 by ICPMS All0.02 mg/L AucklandPotassium (Dissolved)
In House based on EPA 200.8 by ICPMS All0.1 mg/L AucklandSodium (Dissolved)
Total Metals by ICP-MS—Trace (Default Digest)
In House based on EPA 200.8 by ICPMS All0.00010 mg/L AucklandArsenic (Total)
In House based on EPA 200.8 by ICPMS All0.002 mg/L AucklandIron (Total)
In House based on EPA 200.8 by ICPMS All0.0005 mg/L AucklandManganese (Total)
In House based on EPA 200.8 by ICPMS All0.05 mg/L AucklandPotassium (Total)
In House based on EPA 200.8 by ICPMS All0.1 mg/L AucklandSodium (Total)
Organics
Total Organic Carbon by Non-dispersive infrared detection
APHA (online edition) 5310 B All0.1 mg/L AucklandTotal Organic Carbon
Microbiology
Escherichia coli by Membrane Filtration
USEPA Method 1603 All2 cfu/100 mL AucklandEscherichia coli
Preparations
APHA (online edition) 3030 E (modified, 4:1
Nitric:Hydrochloric Acid)
All AucklandDigest for Total Metals in Liquids
APHA (online edition) 2540 C (Filtration) All AucklandGlass Fibre Filtration (1.2 µm)
APHA (online edition) 4500-P B (preliminary
filtration)
All AucklandMembrane Filtration (0.45 µm)
The method detection limit (MDL) listed is the limit attainable in a relatively clean matrix. If dilutions are required for analysis the detection limit may be
higher.
For more information please contact the Operations Manager.
Samples, with suitable preservation and stability of analytes, will be held by the laboratory for a period of two weeks after results have been reported,
unless otherwise advised by the submitter.
Watercare Laboratory Services is a division of Watercare Services Limited .
This report may not be reproduced, except in full, without the written authority of the Operations Manager.
Report Signatory 22/06/2017
Carol Taylor
KTP Signatory
Page 3 of 3Report Number: 231671-0 Watercare Laboratory Services

www.watercarelabs.co.nz [email protected]
52 Aintree Ave,
PO Box 107028,
Auckland Airport,
Auckland
142 Esk Street,
PO Box 747,
Invercargill, 9840
74 Glenda Drive,
PO Box 2614,
Wakatipu,
Invercargill Queenstown
(09) 539 7614
(09) 539 7601
(03) 214 4040
(03) 214 4041
(03) 409 0559Tel:
Fax:
Laboratory Reference:170518-076Certificate of Analysis
GISBORNE DISTRICT COUNCILClient:
Attention: Hilltop Sampler
Report Issue Date: 04-Jun-2017
229077-0Final Report:
PO Box 747, Gisborne, 4040Address: Received Date:
Sampled By:
18-May-2017
Client Reference: MAR
Purchase Order: 37/00/01/2104 5880Quote Reference :
Peter Hancock
Sample Details WATERS WATERS
Lab Sample ID:
Client Sample ID:
Sample Date/Time:
170518-076-1 170518-076-2
20172234 20172235
17/05/2017 12:14 17/05/2017 14:02
Description: 598 Bushmere Rd
MAR Pilot Bore GPE
065
599 Bushmere Rd
GPE010
Chemistry Detailed
Anions by Ion Chromatography (0.45 µm Filtered)
120mg/LChloride 140
0.0071mg/LNitrate (as N) 0.0072
0.013mg/LNitrite (as N) 0.011
0.11mg/LSulphate <0.02
0.020 *mg/LTotal Oxidised Nitrogen (as N) by
Calculation
0.018 *
Ion Balance (Anions/Cations) by Calculation
15 *meq/LAnion Total 16 *
15 *meq/LCation Total 16 *
0.063 *meq/Lmeq/L Difference 0.38 *
0.21 *%Percent Difference 1.2 *
30 *meq/LSum of Anions + Cations 32 *
General Testing
2.0mg/LAmmoniacal Nitrogen (as N) 2.5
2.5 *mg/LAmmoniacal Nitrogen (as NH4) 3.2 *
700mg/LBicarbonate Alkalinity (as HCO3) 710
<4.0mg/LCarbonate Alkalinity (as CO3) <4.0
<4.0mg/LHydroxide Alkalinity (as CaCO3) <4.0
0.031 *mg/LNitrate (as NO3) 0.032 *
0.043 *mg/LNitrite (as NO2) 0.036 *
7.1pH unitpH (at room temp c. 20 °C) 7.2
580mg/LTotal Alkalinity (as CaCO3) 580
0.07mg/LTotal Chlorine (as Cl2) 0.04
850mg/LTotal Dissolved Solids 860
1.9mg/LTotal Nitrogen (as N) 2.3
0.39mg/LTotal Phosphorus (as P) 0.33
69mg/LTotal Suspended Solids 42
65NTUTurbidity 160
Metals
Dissolved Metals by ICP-MS—Trace (Received Filtered)
0.0080mg/LArsenic (Dissolved) 0.0068
180mg/LCalcium (Dissolved) 200
5.5mg/LIron (Dissolved) 15
20mg/LMagnesium (Dissolved) 22
0.92mg/LManganese (Dissolved) 1.0
10mg/LPotassium (Dissolved) 9.6
87mg/LSodium (Dissolved) 79
Page 1 of 4Report Number: 229077-0 Watercare Laboratory Services

Sample Details (continued) WATERS WATERS
Lab Sample ID:
Client Sample ID:
Sample Date/Time:
170518-076-1 170518-076-2
20172234 20172235
17/05/2017 12:14 17/05/2017 14:02
Description: 598 Bushmere Rd
MAR Pilot Bore GPE
065
599 Bushmere Rd
GPE010
Metals
Total Metals by ICP-MS—Trace (Default Digest)
0.0095mg/LArsenic (Total) 0.0072
180mg/LCalcium (Total) 180
8.3mg/LIron (Total) 16
22mg/LMagnesium (Total) 24
0.95mg/LManganese (Total) 1.0
9.0mg/LPotassium (Total) 8.9
90mg/LSodium (Total) 82
550mg/LTotal Hardness (as CaCO3) 560
Organics
Total Organic Carbon by Non-dispersive infrared detection
5.4mg/LTotal Organic Carbon 3.7
Microbiology
Escherichia coli by Membrane Filtration
<1.6cfu/100 mLEscherichia coli <1.6
Results marked with * are not accredited to International Accreditation New Zealand
Where samples have been supplied by the client they are tested as received. A dash indicates no test performed.
The sample(s) referred to in this report were analysed by the following method(s)
Reference Methods
Analyte MDLMethod Reference Samples Location
Chemistry Detailed
Anions by Ion Chromatography (0.45 µm Filtered)
In House based on APHA (online edition)
4110 B and EPA 300.0
All0.02 mg/L AucklandChloride
In House based on APHA (online edition)
4110 B and EPA 300.0
All0.002 mg/L AucklandNitrate (as N)
In House based on APHA (online edition)
4110 B and EPA 300.0
All0.002 mg/L AucklandNitrite (as N)
In House based on APHA (online edition)
4110 B and EPA 300.0
All0.02 mg/L AucklandSulphate
In House based on APHA (online edition)
4110 B and EPA 300.0
All0.002 mg/L AucklandTotal Oxidised Nitrogen (as N) by Calculation
Ion Balance (Anions/Cations) by Calculation
APHA (online edition) 1030 E Allmeq/L AucklandAnion Total
APHA (online edition) 1030 E Allmeq/L AucklandCation Total
APHA (online edition) 1030 E Allmeq/L Aucklandmeq/L Difference
APHA (online edition) 1030 E All AucklandPercent Difference
APHA (online edition) 1030 E All AucklandSum of Anions + Cations
General Testing
HMSO (1981) ISBN 0117516139 All0.005 mg/L AucklandAmmoniacal Nitrogen (as N) by Colorimetry/Discrete
Analyser
Calculation from Ammonia (as N) All0.006 mg/L AucklandAmmoniacal Nitrogen (as NH4) by Calculation
APHA (online edition) 2320 B All1 mg/L AucklandBicarbonate Alkalinity (as HCO3) by Titration
APHA (online edition) 2320 B All1 mg/L AucklandCarbonate Alkalinity (as CO3) by Titration
APHA (online edition) 2320 B All1 mg/L AucklandHydroxide Alkalinity (as CaCO3) by Titration
Calculation All0.009 mg/L AucklandNitrate (as NO3) by Calculation
Calculation All0.007 mg/L AucklandNitrite (as NO2) by Calculation
APHA (online edition) 4500-H B All0.1 pH unit AucklandpH (at room temp c. 20 °C) by Electrode
APHA (online edition) 2320 B All1 mg/L AucklandTotal Alkalinity (as CaCO3) by Titration
APHA (online edition) 4500-Cl G All0.02 mg/L AucklandTotal Chlorine (as Cl2) by Spectrophotometry according to
APHA (2005) 4500-Cl G
APHA (online edition) 2540 C (Modified: Dried
at 103 - 105 ºC)
All15 mg/L AucklandTotal Dissolved Solids by Gravimetry
APHA (online edition) 4500-P J (modified),
4500-NO3 I
All0.010 mg/L AucklandTotal Nitrogen (as N) by Persulphate Digestion and Flow
Analysis
Page 2 of 4Report Number: 229077-0 Watercare Laboratory Services

General TestingAPHA (online edition) 4500-P J (modified) All0.004 mg/L AucklandTotal Phosphorus (as P) by Persulphate Digestion and
Colorimetry/Discrete Analyser
APHA (online edition) 2540 D All0.2 mg/L AucklandTotal Suspended Solids by Gravimetry
APHA (online edition) 2130 B (modified) All0.05 NTU AucklandTurbidity by Nephelometry
Metals
Dissolved Metals by ICP-MS—Trace (Received Filtered)
In House based on EPA 200.8 by ICPMS All0.00010 mg/L AucklandArsenic (Dissolved)
In House based on EPA 200.8 by ICPMS All0.010 mg/L AucklandCalcium (Dissolved)
In House based on EPA 200.8 by ICPMS All0.002 mg/L AucklandIron (Dissolved)
In House based on EPA 200.8 by ICPMS All0.001 mg/L AucklandMagnesium (Dissolved)
In House based on EPA 200.8 by ICPMS All0.0005 mg/L AucklandManganese (Dissolved)
In House based on EPA 200.8 by ICPMS All0.02 mg/L AucklandPotassium (Dissolved)
In House based on EPA 200.8 by ICPMS All0.1 mg/L AucklandSodium (Dissolved)
Total Metals by ICP-MS—Trace (Default Digest)
In House based on EPA 200.8 by ICPMS All0.00010 mg/L AucklandArsenic (Total)
In House based on EPA 200.8 by ICPMS All0.010 mg/L AucklandCalcium (Total)
In House based on EPA 200.8 by ICPMS All0.002 mg/L AucklandIron (Total)
In House based on EPA 200.8 by ICPMS All0.001 mg/L AucklandMagnesium (Total)
In House based on EPA 200.8 by ICPMS All0.0005 mg/L AucklandManganese (Total)
In House based on EPA 200.8 by ICPMS All0.05 mg/L AucklandPotassium (Total)
In House based on EPA 200.8 by ICPMS All0.1 mg/L AucklandSodium (Total)
In House based on EPA 200.8 by ICPMS All0.03 mg/L AucklandTotal Hardness (as CaCO3)
Organics
Total Organic Carbon by Non-dispersive infrared detection
APHA (online edition) 5310 B All0.1 mg/L AucklandTotal Organic Carbon
Microbiology
Escherichia coli by Membrane Filtration
USEPA Method 1603 All2 cfu/100 mL AucklandEscherichia coli
Preparations
APHA (online edition) 3030 E (modified, 4:1
Nitric:Hydrochloric Acid)
All AucklandDigest for Total Metals in Liquids
APHA (online edition) 2540 C (Filtration) All AucklandGlass Fibre Filtration (1.2 µm)
APHA (online edition) 4500-P B (preliminary
filtration)
All AucklandMembrane Filtration (0.45 µm)
The method detection limit (MDL) listed is the limit attainable in a relatively clean matrix. If dilutions are required for analysis the detection limit may be
higher.
For more information please contact the Operations Manager.
Page 3 of 4Report Number: 229077-0 Watercare Laboratory Services
Samples, with suitable preservation and stability of analytes, will be held by the laboratory for a period of two weeks after results have been reported,
unless otherwise advised by the submitter.
Watercare Laboratory Services is a division of Watercare Services Limited .
This report may not be reproduced, except in full, without the written authority of the Operations Manager.
Report Signatory 04/06/2017
Carol Taylor
KTP Signatory
Page 4 of 4Report Number: 229077-0 Watercare Laboratory Services

Position [°2θ] (Copper (Cu))
10 20 30 40 50 60 70
Counts
0
5000
10000
15000
4.2
57
35
[Å
]; S
ilic
on
Oxid
e
3.3
46
04
[Å
]; S
ilic
on
Oxid
e
3.1
93
06
[Å
]
3.0
34
37
[Å
]; C
alc
ium
Ca
rbo
na
te
2.4
59
09
[Å
]; S
ilic
on
Oxid
e
2.2
84
57
[Å
]; S
ilic
on
Oxid
e;
Ca
lciu
m C
arb
on
ate
2.1
30
44
[Å
]; S
ilic
on
Oxid
e
1.8
18
59
[Å
]; S
ilic
on
Oxid
e
1.5
41
94
[Å
]; S
ilic
on
Oxid
e
1.3
75
29
[Å
]; S
ilic
on
Oxid
e 85 - 91 m
Position [°2θ] (Copper (Cu))
10 20 30 40 50 60 70
Counts
0
5000
10000
15000
4.2
57
94
[Å
]; S
ilic
on
Oxid
e
3.3
46
47
[Å
]; S
ilic
on
Oxid
e
3.1
83
88
[Å
]
3.0
35
64
[Å
]; C
alc
ium
Ca
rbo
na
te
2.4
60
40
[Å
]; S
ilic
on
Oxid
e
2.2
85
02
[Å
]; S
ilic
on
Oxid
e;
Ca
lciu
m C
arb
on
ate
2.1
30
24
[Å
]; S
ilic
on
Oxid
e2
.09
40
5 [
Å];
Ca
lciu
m C
arb
on
ate
1.8
76
48
[Å
]; C
alc
ium
Ca
rbo
na
te
1.8
20
22
[Å
]; S
ilic
on
Oxid
e
1.5
43
25
[Å
]; S
ilic
on
Oxid
e
69.2 - 72.6 m
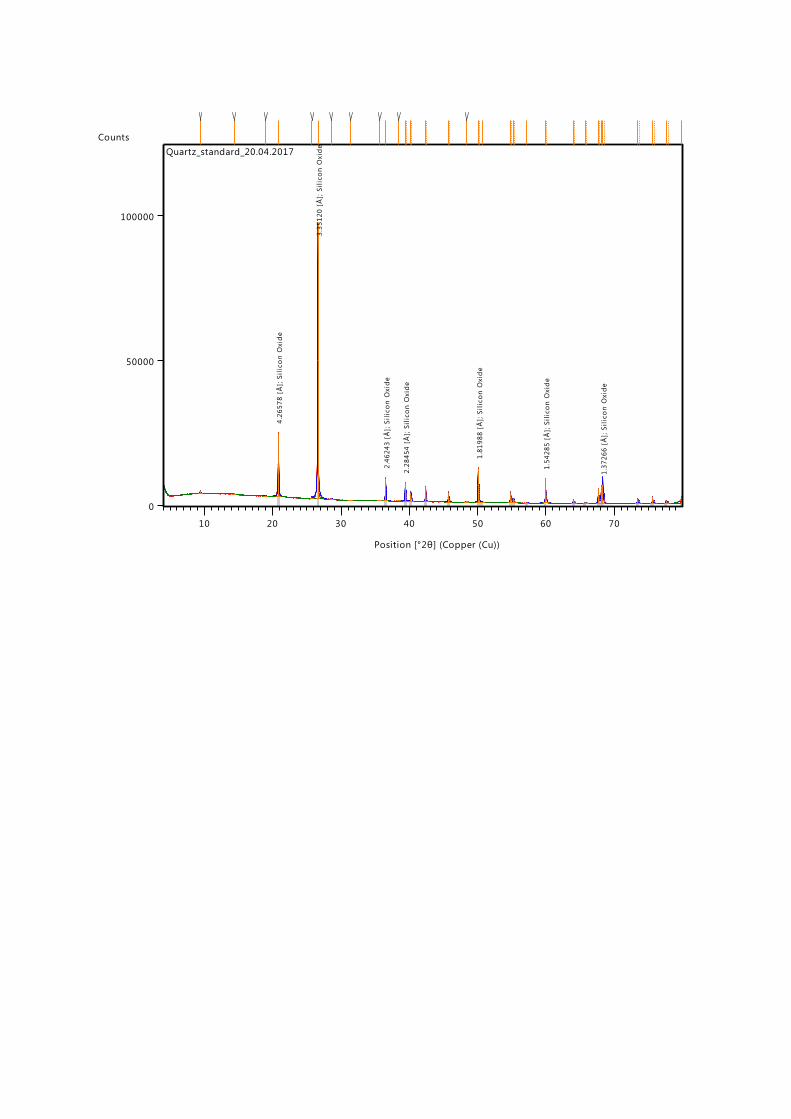
Position [°2θ] (Copper (Cu))
10 20 30 40 50 60 70
Counts
0
50000
100000
4.2
65
78
[Å
]; S
ilic
on
Oxid
e
3.3
51
20
[Å
]; S
ilic
on
Oxid
e
2.4
62
43
[Å
]; S
ilic
on
Oxid
e
2.2
84
54
[Å
]; S
ilic
on
Oxid
e
1.8
19
88
[Å
]; S
ilic
on
Oxid
e
1.5
42
85
[Å
]; S
ilic
on
Oxid
e
1.3
72
66
[Å
]; S
ilic
on
Oxid
e
Quartz_standard_20.04.2017

APPENDIX D Report Limitations
June 2017
Reference No. 1415771_7410-023 1/1
Report Limitations
This Report/Document has been provided by Golder Associates (NZ) Limited (“Golder”) subject to the
following limitations:
i) This Report/Document has been prepared for the particular purpose outlined in Golder’s proposal and
no responsibility is accepted for the use of this Report/Document, in whole or in part, in other contexts or for any other purpose.
ii) The scope and the period of Golder’s Services are as described in Golder’s proposal, and are subject to
restrictions and limitations. Golder did not perform a complete assessment of all possible conditions or
circumstances that may exist at the site referenced in the Report/Document. If a service is not
expressly indicated, do not assume it has been provided. If a matter is not addressed, do not assume that any determination has been made by Golder in regards to it.
iii) Conditions may exist which were undetectable given the limited nature of the enquiry Golder was
retained to undertake with respect to the site. Variations in conditions may occur between investigatory
locations, and there may be special conditions pertaining to the site which have not been revealed by
the investigation and which have not therefore been taken into account in the Report/Document.
Accordingly, if information in addition to that contained in this report is sought, additional studies and actions may be required.
iv) The passage of time affects the information and assessment provided in this Report/Document.
Golder’s opinions are based upon information that existed at the time of the production of the
Report/Document. The Services provided allowed Golder to form no more than an opinion of the actual
conditions of the site at the time the site was visited and cannot be used to assess the effect of any subsequent changes in the quality of the site, or its surroundings, or any laws or regulations.
v) Any assessments, designs and advice made in this Report/Document are based on the conditions
indicated from published sources and the investigation described. No warranty is included, either
express or implied, that the actual conditions will conform exactly to the assessments contained in this Report/Document.
vi) Where data supplied by the client or other external sources, including previous site investigation data,
have been used, it has been assumed that the information is correct unless otherwise stated. No responsibility is accepted by Golder for incomplete or inaccurate data supplied by others.
vii) The Client acknowledges that Golder may have retained subconsultants affiliated with Golder to provide
Services for the benefit of Golder. Golder will be fully responsible to the Client for the Services and
work done by all of its subconsultants and subcontractors. The Client agrees that it will only assert
claims against and seek to recover losses, damages or other liabilities from Golder and not Golder’s
affiliated companies. To the maximum extent allowed by law, the Client acknowledges and agrees it
will not have any legal recourse, and waives any expense, loss, claim, demand, or cause of action, against Golder’s affiliated companies, and their employees, officers and directors.
viii) This Report/Document is provided for sole use by the Client and is confidential to it. No responsibility
whatsoever for the contents of this Report/Document will be accepted to any person other than the
Client. Any use which a third party makes of this Report/Document, or any reliance on or decisions to
be made based on it, is the responsibility of such third parties. Golder accepts no responsibility for
damages, if any, suffered by any third party as a result of decisions made or actions based on this Report/Document.
i:\projects-dynamics\2014\7410\1415771_gdc_stage ii mar pilot\deliverables\023 initial injection test summary\app d - limitations\1415771_7410-023-appe limitations.docx

AfricaAsiaAustralia & NZEuropeNorth AmericaSouth America
+ 27 11 254 4800+ 86 21 6258 5522+ 61 3 8862 3500+ 356 21 42 30 20+ 1 800 275 3281+ 55 21 3095 9500
At Golder Associates we strive to be the most respected global company providing consulting, design, and construction services in earth, environment, and related areas of energy. Employee owned since our formation in 1960, our focus, unique culture and operating environment offer opportunities and the freedom to excel, which attracts the leading specialists in our fields. Golder professionals take the time to build an understanding of client needs and of the specific environments in which they operate. We continue to expand our technical capabilities and have experienced steady growth with employees who operate from offices located throughout Africa, Asia, Australasia, Europe, North America, and South America.
CHRISTCHURCH
Tel +64 3 377 5696Fax +64 3 377 9944
Level 1214 Durham StreetChristchurch 8011
PO Box 2281Christchurch 8140
DUNEDIN
Tel +64 3 479 0390 Fax +64 3 474 9642
Level 7BJohn Wickliffe House265 Princes StreetDunedin 9016
PO Box 1087Dunedin 9054
HAMILTON
Tel +64 7 859 2356 Fax +64 9 486 8072
Room 31 in the HomesteadRuakura Research Centre10 Bisley RoadHamilton 3214
PO Box 19-479Hamilton 3244
NELSON
Tel +64 3 548 1707Fax +64 3 548 1727
Level 3295 Trafalgar StreetNelson 7010
PO Box 1724Nelson 7040
WELLINGTON
Tel +64 3 377 5696
Level 193 The TerraceWellington 6011
PO Box 5234Wellington 6145
AUCKLAND
Tel +64 9 486 8068Fax +64 9 486 8072
Level 2Nielsen Centre129 Hurstmere RoadTakapunaAuckland 0622
PO Box 33-849Takapuna 0740
Document_back_May14.ai 1 18/08/2016 4:22:57 p.m.