Embed Size (px)
Citation preview
School Improvement Plan 1 October 5, 2018
Port Angeles School District
Stevens Middle School
School Improvement Plan
2018 - 2019

School Improvement Plan 2 October 5, 2018
Component One – Needs Assessment
Guiding Questions:
How does our needs assessment integrate current school year quantitative
and qualitative data?
How does your needs assessment give an accurate and thorough view of
the entire school?
What subjects, grade levels, and programs are the strongest and weakest?
How does the school focus on the academic progress of English
language learners?
To what extent are discipline issues impacting students?
What is the level of family and the community support at the school?
What does the data say about the success of students transitioning into and
out of your school? Examples: Elementary schools should look at
WAKids, middle schools at 6th grade attendance and behavior data, high
schools at 9th grade course completion.
How have you identified any areas of concern from the following within
your needs assessment: Family Engagement, Transitions Between Grades
and/or Schools; Technology; Professional Development; Schoolwide
Tiered Models of Instruction; Behavior and Discipline; Well Rounded
Education; Secondary Education Program Needs
Component Three – Activities to Ensure Mastery
Guiding Questions:
How does the plan support the most at-risk students in the school?
What strategies and programs will we use to help at-risk students remain or
get back on track?
What is the district doing to help students in danger of dropping out or fall-
ing behind on mastery of a key skill?
What is the school doing to help students’ academic and non-academic
needs?
Does the plan ensure the school meets students’ academic and non-aca-
demic needs?
Does the plan incorporate a wide range of strategies, programs and
activities, including:
o Counseling and mental health support
o College and career readiness
o Tiered behavioral support
o AP & International Baccalaureate courses
o Preschool transition support
o Professional development for staff
o Intensive academic support to students
Component Two – Schoolwide Reform Strategies
Guiding Questions:
Does the plan’s schoolwide reform:
Consider a well-rounded education ESSA Section: 8102(52). What about
literacy, science, government, engineering, the arts, and mathematics?
Improve transitions between grades and/or schools?
Enrich and accelerate curriculum?
Provide opportunities for students both ahead of and behind grade level?
Include specific ways in which the school will reach each level of reform?
Did you address staffing plans and hires, professional development strate-
gies, and schoolwide goals?
Outline the strategies that you will use to improve academics for all stu-
dents? Did you outline how you will increase the amount and quality of
learning using specific programs, activities, and courses?
If your school is continuing as a priority or focus school in 2018-19, how
do your strategies incorporate the 7 turn around principles?
Component Four – Coordination and Integration
Guiding Questions:
How will the school leverage allowable combined funds to improve the
schoolwide plan?
How will it make the most of available staff at the school and district to
maximize the positive impact of the plan?
How does the plan combine funds to connect the reform strategies
developed?
Does the plan outline how the school will combine funds, and how the
school will meet the intents and purposes of each program?
Does the plan outline how funds from Title I, Part A and other federal edu-
cation programs will be used to help the school meet the statutory
requirements of the programs?
Does the plan include the total amount of funds for each program?
If a priority/focus school:
o Does the plan include school improvement funds?
o How are schoolwide funds being leveraged to support school
improvement efforts?

School Improvement Plan 3 October 5, 2018
SBA & MSP DATA
Directions: Enter the scores on the ELA, MATH and WRITING Sections of the MSP and SBA.
Student #’s as well as percentages = #/%
Analysis Tool/
Measurement Device
SBA
2017
State
2017
SBA
2018
State
2018
Analysis Tool/
Measurement Device
SBA
2017
State
2017
SBA
2018
State
2018
Reading/ELA 7: % of students at each level
Level 1:
Level 2:
Level 3:
Level 4:
13
19 39/14
19%
Math 7: % of students at each level
Level 1:
Level 2:
Level 3:
Level 4:
20 24 55/21
#/%
22
21 52/20 20%
25 25 76/29 23%
49
39 110/42 39%
26 23 71/27 23%
5
16
22 63/24
22%
30
27
60/23 27%
Reading/ELA 7: % Meeting Standard:
% Not Meeting Standard:
65.8%
60.1% 173/65
61% Math 7: % Meeting Standard:
% Not Meeting Standard:
57.3%
49.9%
131/50 50/50
34.2%
39.9% 91/35
39%
42.7%
50.1%
133/50 50/50
Needs Assessments Implications:
65% of our students are meeting or exceeding standard on 7th grade ELA, which is 4% above the state average.
20% of our students are level 2 on the state exam. Focusing our attention on level 2 in 7th grade will dramatically im-
prove our overall performance.
50% of our students meet or exceed state standard on the 7th grade math assessment, which meets the state average.
29% of our students scored level 2 on the state math exam. Focusing our attention on level 2 students in 7th grade will
dramatically improve our overall performance.

School Improvement Plan 4 October 5, 2018
SBA & MSP DATA
Directions: Enter the scores on the SCIENCE and ELA and MATH sections of the MSP and SBA.
Student #’s as well as percentages = #/%
Analysis Tool/
Measurement Device
SBA
2017
State
2017
SBA
2018
State
2018
Analysis Tool/
Measurement Device
SBA
2017 State
2017
SBA
2018
State
2018
MSP Science 8: % of students at each level
Level 1:
Level 2:
Level 3:
Level 4:
Level 4:
4 10 49/18
24%
Reading/ELA 8: % of students at each level
Level 1:
Level 2:
Level 3:
Level 4:
Level 4:
12 18 38/14
27%
14 23 57/21 21% 20 23 59/22 22%
46 40 84/31 31% 45 39 116/43 39%
36 27 81/30 24% 23 20 57/21 22%
Science 8: % Meeting Standard:
% Not Meeting Standard:
72.8% 63.4% 165/61 55% Reading ELA 8: % Meeting Standard:
% Not Meeting Standard:
67.5% 58.5% 173/64 60%
27.2% 36.6% 64/39 45% 32.5% 41.5% 97/36 40%
Analysis Tool/
Measurement Device
SBA
2017
State
2017
SBA
2018
State
2018
Math 8: % of students at each level
Level 1:
Level 2:
Level 3:
Level 4:
Level 4:
19 28 68/25
31%
18 23 57/21 21%
24 20 49/18 19%
40 28 97/36 29%
Math 8:
% Meeting Standard:
% Not Meeting Standard:
62.0% 47.6% 146/54 48%
38% 52.4% 125/46 52%
Needs Assessments Implications:
This is the first data from the new science test. We
are 6% above the state. Two staff members have at-
tended training on the new state test. We are adjust-
ing curriculum and assessments to match the state
test. We will see significant improvement through
this alignment work.
We are above the state average in reading and in
math. We need to target our level 2 students and
move them in to meeting standard and our scores will
improve.

School Improvement Plan 5 October 5, 2018
SBA & MSP DISAGGREGATION DATA
Directions: Enter the percentage of students meeting and exceeding standard for each of the sub-groups
with n>10. If <10, enter an asterisk (*). Student #’s as well as percentages = #/%
Sub-Groups
GRADE 7 ELA GRADE 7 MATH
SBA
2016
State
2016
SBA
2017
State
2017
SBA
2018
State
2018
SBA
2016
State
2016
SBA
2017
State
2017
SBA
2018
State
2018
Male
78.4 53.6 62.2% 54.3%
73/57
40,838/5
4
66.9 50.7 62.9
% 49.7%
64/49
40,893/49
Female 80.3 66.8 70.2% 66.2% 99/73 38,714/68 56.7 51.5 50.4
% 50.1%
68/50 38,766/50
2 or more Races 13/50 6099/62 31/6
5 5639/53
7/27 6090/50
FARMA 66.9 42.8 53.5 31.9 69/54 43% 51.5 33.3 42.5 31.9 55/43 33%
Special Ed 26.7 19.7 10/10 9347/15 7.7 14.7 44/1
4 10
42/2 9367/11
Sub-Groups
GRADE 8 SCIENCE
MSP
2016
State
2016
MSP
2017
State
2017
SBA
2018
State
2018
Male 91.6 68 85 66 92/63 55%
Female 91.1 69 80 68 73/58 54%
2 or more Races 13/54
57%
FARMA 86.0 51.8 79.0 49.2 NA NA
Special Ed 36 25 35 23 11/26 15%
Sub-Groups
GRADE 8 ELA GRADE 8 MATH
SBA
2016
State
2016
SBA
2017
State
2017
SBA
2018
State
2018
SBA
2016
State
2016
SBA
201
7
State
2017 SBA
2018
State
2018
Male 62.2 54.5 62.4%% 52.1 83/57 4048138
,504/54 65 47.5 60.1
%
46.1% 77/53 40,515/46
Female 78.7 68.9 65.1% 65.1% 89/72 38,504/6
7 68.1 51.3 64.0
%
49.2% 69/55 38,499/50
2 or more races 14/58 5783/64 12/50 5753/50
FARMA 61.1 44.8 56.0 41.5 71/58 NA 58.0 31.3 48.7 29.8 62/50 NA
Special Ed 29.5 20 13 13 30/13 8783/13 9.1 11.4
2/2 8755/8
Needs Assessments Implications:
Female students outperform male students on the 7th
grade ELA exam by 12 percentage points. A gender-
based achievement gap does not exist in 7th grade math.
Our sub-groups including special education, students of
poverty, and students of 2 or more races are all signifi-
cantly underperforming in both grade levels.

School Improvement Plan 6 October 5, 2018
INTERNAL ACCOUNTABILITY SYSTEM DATA
Directions: Please enter grade-level appropriate data in the space provided.
Analysis Tool/
Measurement Device Results for 2017-18 Results for 2018-19
District Reading,
Math and Science
Winter Benchmark
(percent of students at standard)
Analytical Reading Inventory (ARI)
Reading Math Science Reading Math Science
Grade MAP
LANG MAP RDG
MAP Benchmark Grade
7 +6% +3% +3% NA 7
8 +4% +3% +3% NA 8
District Writing Benchmark
Fall, Winter, Spring
(percent of students at standard)
Analytical Reading Inventory (ARI)
Writing Writing
Grade Fall Winter
Spring
Grade Fall Winter Spring
7
78% N/A N/A 7
8 74% N/A N/A 8
Classroom-Based Assessments
(percent of students at standard)
Classroom-Based Assessment Classroom-Based Assessment
Grade Social Studies The Arts Health/Fitness Grade Social
Studies The Arts Health/Fitness
7 95% 100% 90% 7
8 98% 100% 90% 8
Common Assessments Grade ELA Math Science
7
8
INTERNAL ACCOUNTABILITY SYSTEM DATA
Needs Assessments Implications:

School Improvement Plan 7 October 5, 2018
Directions: Please enter grade-level appropriate data in the space provided.
Summary Student Internal Accountability System Demographic Data (end-of-year data)
(*Trimester Reports will provide Year-to-Date data.)
Internal Assessment Results for 2017-18 (EOY) Internal Assessment Results for 2018-19 (EOY)
Gra
de
Unexcused
Absences
Avg. Daily
Attendance
Suspensions Expulsions
Court
Petitions
Gra
de
Unexcused
Absences
Avg. Daily
Attendance
Suspensions Expulsions
Court
Petitions Short-
Term Long- Term Short-Term Long- Term
7 526 95% 21 3 4 7
8 726 94% 28 0 1 6 8
Summary of Student Support Services 2017-18 (EOY)
Gra
de
Special Education
(not speech)
Homeless EOY Number of Homeless Students
504 Student Assistance Team
(SAT)
7 44 13 8
8 47 2 13 5
Percentage on Pace for Promotion to Port Angeles High School
September February June
All 88% 90% 100%
Male 86% 88% 100%
Female 90% 92% 100%
Native 80% 84% 100%
Special Ed 75% 80% 100%

School Improvement Plan 8 October 5, 2018
Missing Assignments and Attendance Student #’s as well as percentages = #/%
Missing
Assignments
SEP #/%
OCT #/%
NOV #/%
DEC #/%
JAN #/%
FEB #/%
MAR #/%
APR #/%
MAY #/%
JUN #/%
Math
ELA
Science
Electives
Attendance SEP #/%
OCT #/%
NOV #/%
DEC #/%
JAN #/%
FEB #/%
MAR #/%
APR #/%
MAY #/%
JUN #/%
Overall
Average
Zero
Zeroes
Avg. 32
students
per day
After
School
NA

School Improvement Plan 9 October 5, 2018
STUDENT ATHLETIC AND ACTIVITY PARTICIPIATION (Suggested chart format)
STUDENT ATHLETIC AND ACTIVITY PARTICIPATION 2017-18
Activity Number of Students Athletics Number of Students
Tech Club 18 Cross Country 46
Honor Society 110 Volleyball 48
Yearbook 10 Football 80
Sources of Strength 25 Wrestling
Mine Craft 12 Track

School Improvement Plan 10 October 5, 2018
DEMOGRAPHIC SCHOOL DATA
Directions: Fill in the blanks with the data sources given below. Only use data sources relevant to your school’s grade levels and that
which will assist you in focusing your plan.
Data Source Information Provided By Data Summary
Attendance Report Percent of students present per day (2017-18). 7th 89.48 8th 91
Unexcused Absences Total number of absences not excused (2017-18).
Discipline Report Summary of discipline activity for the building
((2017-18).
Drugs/Alcohol: 7
Tobacco: 7
Weapons: 3
Fighting/Assaults: 40
Court Petitions: 20
Expulsions: 1
Short-term Suspensions:
Long-term Suspensions:
Free/Reduced Lunch
Report
Percent of students where family income is below
federally established poverty level ((2017-18).
52%
Gender Report Number of male and female students as reported by
the (2017-18) OSPI School Report Card
Males: 289
Females: 268
Ethnicity Report Percent of students by ethnic groups as reported by
the (2017-18 OSPI School Report Card
American Indian or Alaskan Native: 4.7
Asian or Pacific Islander: 1.8
Black: .04
Hispanic: 8.8
White: 74.1
Staff Report Staff demographic data as reported in the (2017-18)
OSPI School Report Card
Headcount: 549
Overall Ratio:
Average Years of Exp: 19
Percent a Master’s Degree: 81%

School Improvement Plan 11 October 5, 2018
AREAS OF STRENGTH AND CONCERN
Directions: Remember how important it is to review past trends or changes over time. In reference to the MSP/EOC, analyze
changes between Levels 1-4. Consider students who are not meeting standard; students who are at but not above standard; and stu-
dents who are exceeding standard and determine which group of students needs what type of assistance. Based on individual subtest
data or other data you have collected, determine the specific areas of strength and areas for improvement for your students.
AREAS OF STRENGTH
AREAS OF CONCERN
We continue to remain above the state average in ELA in both 7th
and 8th grade.
Out students continue to outperform the state in science. It is a brand
new test, but our teachers have worked hard to learn new standards
and to adjust curriculum and assessments to meet the new standards
Our math students continue to rival the state average in mathematics
performance.
Our staff has identified essential outcomes in math, ELA, and in
science at both grade levels. We will work toward identifying es-
sential outcomes in history for both 7th and 8th grade this year.
Our staff members continue to design common formative, grade-
level assessments in all content areas. These assessments will be
scored together in order to identify skill deficits and immediately re-
teach and re-assess our essential outcomes to provide immediate in-
tervention and extension activities for our students and to increase
participation in our after school programs.
Our extra-curricular programs continue to grow and to show case
student involvement and excellence in music and in athletics.
A learning gap exists between general education students and students
with special needs.
Our students with special needs must have increased access to general
education course work and general education classes.
A learning gap exists between students of poverty and affluent students.
A learning gap exists between students of two-or-more races and Cau-
casian students.
We need to complete more formative and summative assessments based
on our essential outcomes in order to provide support and enrichment in
a more-timely manner to all students.

School Improvement Plan 12 October 5, 2018
ACTION PLAN Strategic Plan Focus Area 1 & 2: Powerful Teaching & Learning
Goal 1: All students will graduate college, career, and life ready, with 21st century skills which include creativity, innovation,
critical thinking, problem solving, communication, collaboration, and strong informational and media literacy.
Goal 2: All staff model and teach 21st century knowledge and skills to improve rigorous student learning in a complex, ever-changing
and interconnected world.
Stevens
ELA
Smart Goal All School
7th grade students will increase the percentage of students meeting standard in ELA from
65% to 70%.
8th grade students will increase the percentage of students meeting standard in ELA from
64% to 69%
Targets Strategies Activities to Ensure
Mastery Yes Completed/Date
All School
Implementing support programs will in-
crease student achievement in ELA.
The programs that will improve student
performance by 5% include Academy /
Homework club, Rotary Tutors, and
Academy 9 / Zero Zeroes Program.
Additional adult support and time
to complete required work.
Academy teachers study
skills 30 minutes per day
After School Programs for
Tutoring and Homework
Completion
Zero Zeroes provides stu-
dents extra time during
the school day to com-
plete missing work
Data compiled
monthly.

School Improvement Plan 13 October 5, 2018
1. Stampeder Program 7th and 8th
Grade will target the students cur-
rently scoring level 2 and move 10%
from level 2 to level 3 on the state
exam.
Students who are level 2 with good
attendance and few discipline issues
will be invited to participate in the
Stampeder Accelerated Learning
Program. This program will excel
student academic skills in a family
structure that caps class size at 25
students per class.
Teachers loop with students
Increases relationships with
students and families
Smaller class sizes increases
individualized attention
Common formative assessments
designed and implemented by
the team with re-teaching op-
portunities provided based on
gathered data from these assess-
ments. Students can easily be
re-grouped based on data from
these assessments for re-teach-
ing and/or enrichment.
Teachers will utilize af-
ter school programs to
support learning
Spring
Identify and measure essential out-
comes in
ELA for 7th grade
ELA for 8th grade
All students will meet
standard in ELA on all PLC
Team Designed Essential
Outcomes
Team will collaboratively score
common assessments monthly
in order to design interventions
and enrichment activities for
student mastery of essential
skills.
Common academic sup-
port and enrichment
Students will be guided
to our after school sup-
port programs based on
skill deficits identified
by the common forma-
tive and summative as-
sessments.
Spring

School Improvement Plan 14 October 5, 2018
Students with special needs will in-
crease their passage rate of the state
exam in reading and in writing by
10%.
Increase access to general education
curriculum and coursework. When-
ever possible, students will partici-
pate in general education classes
with general education curriculum.
Improving the overall aca-
demic performance of our
students with special needs.
Students will receive sup-
port in general education
courses through a combina-
tion of specially designed
instruction delivered from
general education teachers,
para-educator support, and
team teaching between gen-
eral education teachers and
special education teachers.
Additional access to grade level
curriculum that we modify
based on IEP language. In-
creased access to grade level as-
sessments that we modify based
on IEP language.
Assessments will meas-
ure essential outcomes
Students will receive
re-teaching through
daily interventions and
after school programs
Academy time will be
used for additional sup-
port for students with
special needs
Spring

School Improvement Plan 15 October 5, 2018
The 7th Grade ELA Team will im-
plement data notebooks.
Student Data Notebooks in all 7th
grade ELA classes. All teachers are
using student data notebooks in all
7th grade ELA classes.
Increases Academic Self-
Esteem
Tracks Homework Comple-
tion and Scores
Tracks Common Assess-
ment Data
Tracks Attendance and
Missing Work
Tracks Re-Assessment
Increase Study Habits
Teachers will model and pro-
vide students with time to rec-
ord data and demonstrate to stu-
dents how improved effort leads
to improved scores in ELA per-
formance.
Spring
School Improvement Plan 16 October 5, 2018
ACTION PLAN
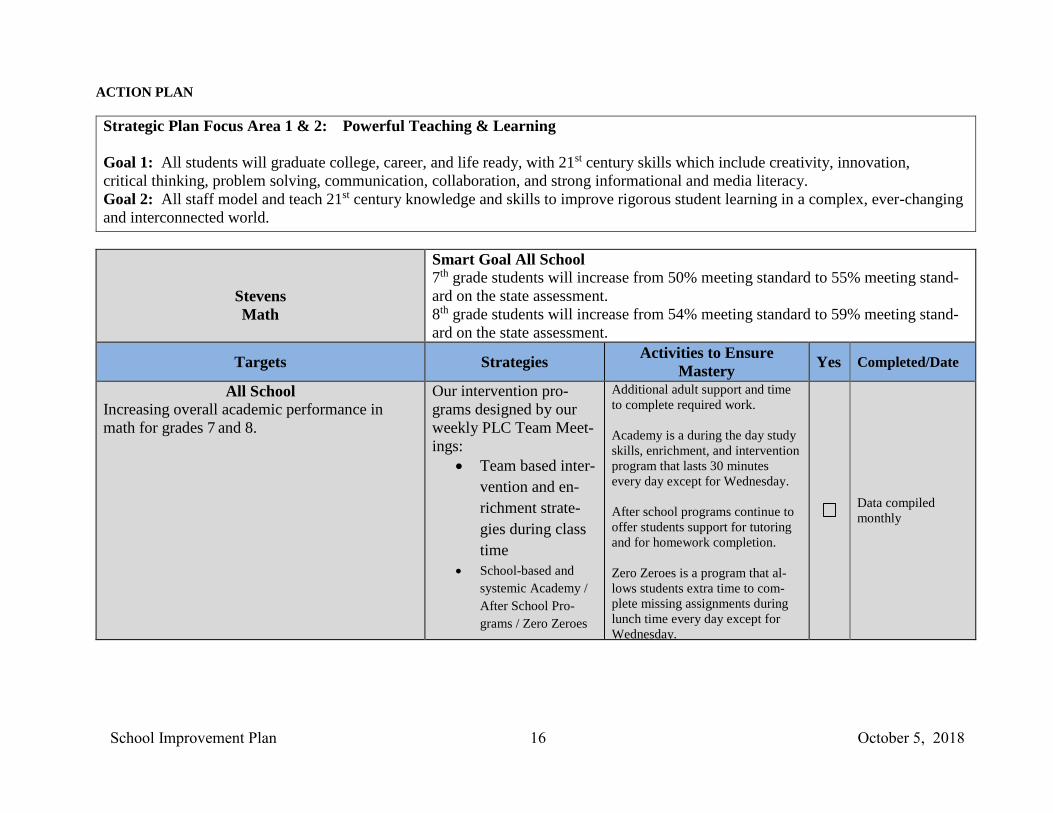
Strategic Plan Focus Area 1 & 2: Powerful Teaching & Learning
Goal 1: All students will graduate college, career, and life ready, with 21st century skills which include creativity, innovation,
critical thinking, problem solving, communication, collaboration, and strong informational and media literacy.
Goal 2: All staff model and teach 21st century knowledge and skills to improve rigorous student learning in a complex, ever-changing
and interconnected world.
Stevens
Math
Smart Goal All School
7th grade students will increase from 50% meeting standard to 55% meeting stand-
ard on the state assessment.
8th grade students will increase from 54% meeting standard to 59% meeting stand-
ard on the state assessment.
Targets Strategies Activities to Ensure
Mastery Yes Completed/Date
All School
Increasing overall academic performance in
math for grades 7 and 8.
Our intervention pro-
grams designed by our
weekly PLC Team Meet-
ings:
Team based inter-
vention and en-
richment strate-
gies during class
time
School-based and
systemic Academy /
After School Pro-
grams / Zero Zeroes
Additional adult support and time
to complete required work.
Academy is a during the day study
skills, enrichment, and intervention
program that lasts 30 minutes
every day except for Wednesday.
After school programs continue to
offer students support for tutoring
and for homework completion.
Zero Zeroes is a program that al-
lows students extra time to com-
plete missing assignments during
lunch time every day except for
Wednesday.
.
Data compiled
monthly

School Improvement Plan 17 October 5, 2018
1. Stampeder Program 7th and 8th Grade will
target the students currently scoring level 2
and move 10% from level 2 to level 3 on the
state exam in math.
Students who are level 2
with good attendance and
few discipline issues will be
invited to participate in the
Stampeder Accelerated
Learning Program. This
program will excel student
academic skills in a family
structure that caps class size
at 25 students per class.
Teachers loop with
students
Increases relation-
ships with students
and families
Smaller class sizes
increases individu-
alized attention
Common formative assessments
designed and implemented by
the team with re-teaching op-
portunities provided based on
gathered data from these assess-
ments. Students can easily be
re-grouped based on data from
these assessments for re-teach-
ing and/or enrichment.
Spring
Teams will identify essen-
tial outcomes:
Design common as-
sessments
Score Common As-
sessments
Design and imple-
ment interventions
Assign to our after
school support pro-
grams
Commonly scoring assessments
leads to common academic sup-
port and enrichment based on
student academic performance.
Students will be guided to our
after school support programs
based on skill deficits identified
by the common formative and
summative assessments.
Spring
School Improvement Plan 18 October 5, 2018
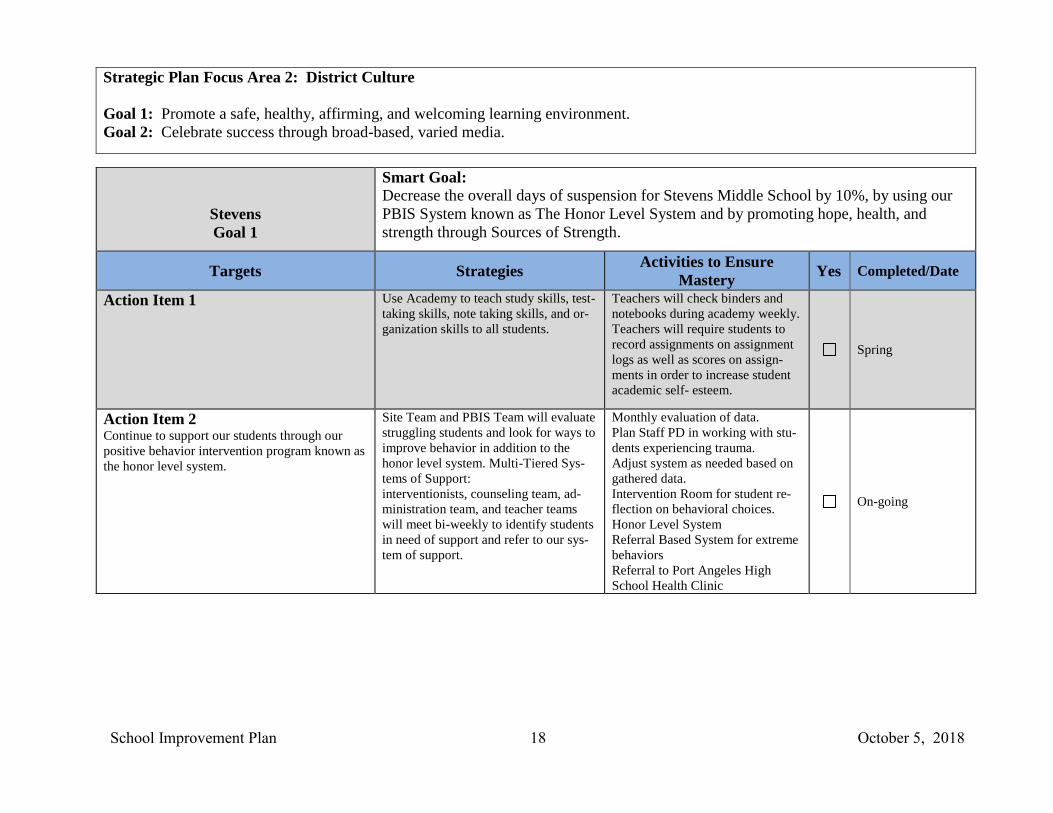
Strategic Plan Focus Area 2: District Culture
Goal 1: Promote a safe, healthy, affirming, and welcoming learning environment.
Goal 2: Celebrate success through broad-based, varied media.
Stevens
Goal 1
Smart Goal:
Decrease the overall days of suspension for Stevens Middle School by 10%, by using our
PBIS System known as The Honor Level System and by promoting hope, health, and
strength through Sources of Strength.
Targets Strategies Activities to Ensure
Mastery Yes Completed/Date
Action Item 1
Use Academy to teach study skills, test-
taking skills, note taking skills, and or-
ganization skills to all students.
Teachers will check binders and
notebooks during academy weekly.
Teachers will require students to
record assignments on assignment
logs as well as scores on assign-
ments in order to increase student
academic self- esteem.
Spring
Action Item 2 Continue to support our students through our
positive behavior intervention program known as
the honor level system.
Site Team and PBIS Team will evaluate
struggling students and look for ways to
improve behavior in addition to the
honor level system. Multi-Tiered Sys-
tems of Support:
interventionists, counseling team, ad-
ministration team, and teacher teams
will meet bi-weekly to identify students
in need of support and refer to our sys-
tem of support.
Monthly evaluation of data.
Plan Staff PD in working with stu-
dents experiencing trauma.
Adjust system as needed based on
gathered data.
Intervention Room for student re-
flection on behavioral choices.
Honor Level System
Referral Based System for extreme
behaviors
Referral to Port Angeles High
School Health Clinic
Student Assistance Team
Wrap Around Services through a
partnership with the Lower Elwha
On-going

School Improvement Plan 19 October 5, 2018
Action Item 3 *Social/Emotional Train 50 Students in the Sources of Strength Cur-
riculum to promote healthy choices and to start a
positive messaging campaign.
Requirements:
Student Training
Mentor Training
Weekly Meetings to Support
Students and to Promote Their
Efforts (during student
lunches)
Support Sources of Strength
Stampeder Pride Week
Students and Staff Will:
Identify that which brings
them strength and pro-
vides them with hope
Create and design positive
messages in the school
and in the community
Fight negativity and mean
words by replacing mean
behavior with hope,
health, and strength
Celebrate Community
through Red Ribbon
Week and Host the An-
nual Sources of Strength
Stampeder Pride Bonfire
Monthly

School Improvement Plan 20 October 5, 2018
ACTION PLAN
Strategic Plan Focus Area 3: Family & Community Engagement
Goal 1: Create and promote a system that facilitates open and accessible communication between family, staff, students,
and community.
Stevens
Goal 1
Smart Goal:
Stevens Middle School will reduce the number of students missing 20 or more days by
50%. We will measure our student attendance monthly beginning the first of October and
we will set monthly goals as a school community.
Targets Strategies Activities to Ensure
Mastery Yes Completed/Date
Attendance All 7th grade students are tracking their
individual attendance through their stu-
dent data notebooks.
We are teaching students how to
goal set and we check their attend-
ance weekly in ELA and goal set
based on the gathered data. For
many students, this is the first time
that they have to make up work
missed when absent.
Spring

School Improvement Plan 21 October 5, 2018
Communication
100% of our parents will receive vital
school communication.
Identify a positive communication tool
that works for all educational stakehold-
ers. As a school we will utilize the fol-
lowing strategies
SMS Google Calendar On-line
Daily Bulletin Published On-
line
SNN News (Live and Posted
on Website)
Monthly News Letters from
the Principal
Daily updates to all communication
formats on-line
Principal News Letters Monthly
Monthly
School Improvement Plan 22 October 5, 2018
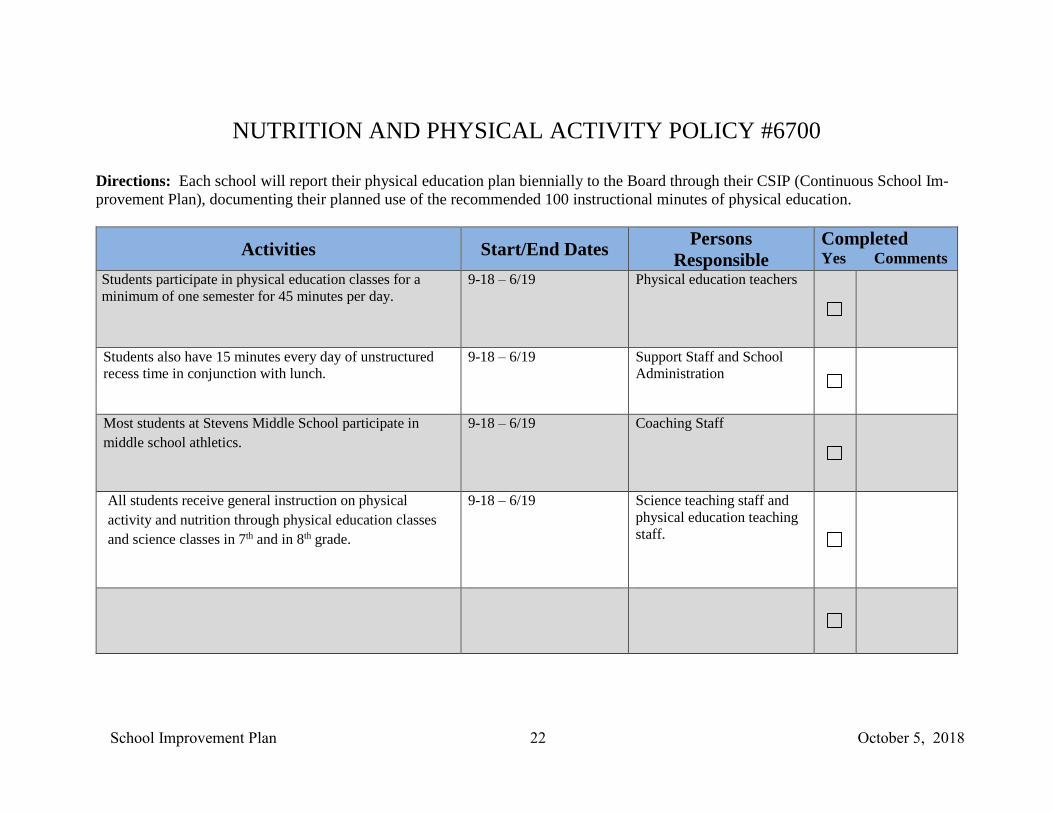
NUTRITION AND PHYSICAL ACTIVITY POLICY #6700
Directions: Each school will report their physical education plan biennially to the Board through their CSIP (Continuous School Im-
provement Plan), documenting their planned use of the recommended 100 instructional minutes of physical education.
Activities Start/End Dates Persons
Responsible
Completed Yes Comments
Students participate in physical education classes for a
minimum of one semester for 45 minutes per day.
9-18 – 6/19 Physical education teachers
Students also have 15 minutes every day of unstructured
recess time in conjunction with lunch.
9-18 – 6/19 Support Staff and School
Administration
Most students at Stevens Middle School participate in
middle school athletics.
9-18 – 6/19 Coaching Staff
All students receive general instruction on physical
activity and nutrition through physical education classes
and science classes in 7th and in 8th grade.
9-18 – 6/19 Science teaching staff and
physical education teaching
staff.

School Improvement Plan 23 October 5, 2018
CHARACTERISTICS OF HIGH PERFORMING SCHOOLS
Data Source: Center for Educational Effectiveness STAFF Survey
Directions: Under the sub-categories for the characteristics of high performing schools, locate the percentage of
staff that indicated support for the following categories:
Category
2013 2014 2015
2016 2017
Clear & Shared Focus
84% x 80% 55%
55%
Effective School Leadership
87% x
75% 50% 50%
High Standards & Expectations
77% x
75% 55% 60%
High Levels of Collaboration and Communication
82% x
75% 49% 50%
Supportive Learning Environment
91% x
85% 70% 50%
Frequent Monitoring of Teaching and Learning
72% x 65% 45%
45%
Focused Professional Development
71% x
65% 55% 55%
Curriculum, Instruction, and Assessment Aligned with Standards
77% x
75% 70% 70%
High Levels of Community & Parent Involvement
80% x
75% 45% 45%
Staff Willingness to Change
100% x
100% 100% 100%

School Improvement Plan 24 October 5, 2018
CHARACTERISTICS OF HIGH PERFORMING SCHOOLS
Data Source: Center for Educational Effectiveness PARENTS Survey
Directions: Under the sub-categories for the characteristics of high performing schools, locate the percentage of
parents that indicated support for the following categories:
Category
2013 2014 2015
2016
2017
Clear & Shared Focus
84% X
65% 65% 70%
Effective School Leadership
84% X
70% 75% 65%
Frequent Monitoring of Teaching and Learning
82% X
65% 60% 65%
High Standards & Expectations
91% X
75% 70% 70%
High Levels of Collaboration and Communication
83% X
65% 60% 65%
High Levels of Community & Parent Involvement
78% X
60% 60% 55%
Supportive Learning Environment
82% x 70% 70% 65%

School Improvement Plan 25 October 5, 2018
STUDENT TUTORIAL/ENRICHMENT STRATEGIES SUMMARY
Directions: Briefly summarize your school’s strategies for student remediation and enrichment. Remember, summer school is no longer an op-
tion for remediation. Specific strategies, numbers of students, staff responsible, and timeline for implementation and other related details should
be found in the action plans. Student remediation strategies are coherent, and action steps demonstrate responsiveness to student tutorial needs.
This summary should clearly describe a comprehensive approach embedded in strategies.
Stevens Middle School believes that we must provide during the day intervention for student academics and for student behavior. We have implemented
the following whole school support programs for students:
1. Academy
A 30-minute period of time to teach organization, study skills, and test taking skills
Teachers check binders and help students organize binders during this time
Teacher teams use this time to re-teach students that do not master our essential outcomes and they use this time to provide enrichment
for students who have already mastered essential outcomes
2. Zero Zeroes Program
Students with missing assignments are referred to Mr. Stevens and Mrs. Lunt for lunch support to complete missing assignments
Students complete assignments during lunchtime. If students do not complete assignments during this time, they are referred to one of
the after school programs to complete assignments.
3. Team Based Academic Interventions
Teams have designed common assessments to measure student progress towards achievement of our team identified essential outcomes
in all content areas.
Students who do not demonstrate mastery of our essential outcomes are retaught lessons during academy time or during reteach days in
all content areas and are reassessed to make sure that they are mastering our essential outcomes. These common assessments take place
approximately every four weeks, but teams determine the timing of these assessments based on student readiness.
Teams provide enrichment and/or celebrations based on student achievement of team designed goals.
4. Student Data Notebooks in 7th Grade ELA
Teachers provide students time to record critical success data in student data notebooks
Students refer to the notebooks to measure progress toward achievement of academic, attendance, and behavioral goals.
Student efficacy and academic self-esteem improve dramatically when students record their own formative and summative data
These notebooks are also effective tools for parent conferences and for communication with parents regarding student progress
School Improvement Plan 26 October 5, 2018
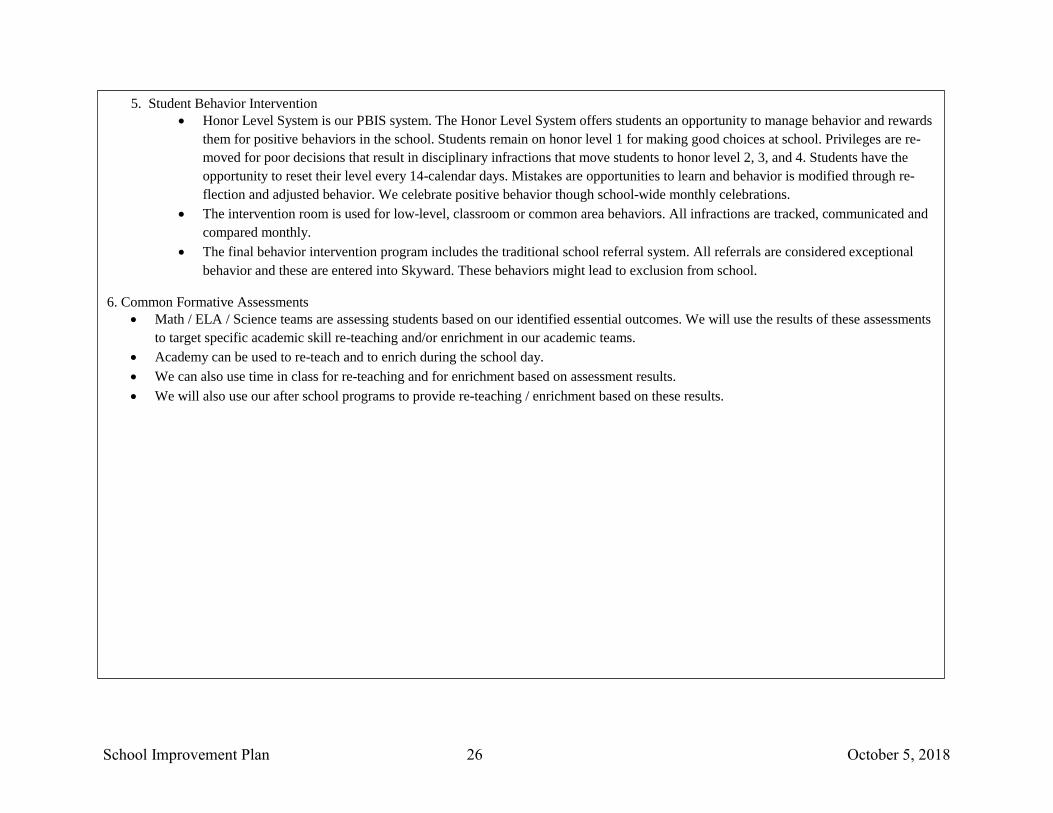
5. Student Behavior Intervention
Honor Level System is our PBIS system. The Honor Level System offers students an opportunity to manage behavior and rewards
them for positive behaviors in the school. Students remain on honor level 1 for making good choices at school. Privileges are re-
moved for poor decisions that result in disciplinary infractions that move students to honor level 2, 3, and 4. Students have the
opportunity to reset their level every 14-calendar days. Mistakes are opportunities to learn and behavior is modified through re-
flection and adjusted behavior. We celebrate positive behavior though school-wide monthly celebrations.
The intervention room is used for low-level, classroom or common area behaviors. All infractions are tracked, communicated and
compared monthly.
The final behavior intervention program includes the traditional school referral system. All referrals are considered exceptional
behavior and these are entered into Skyward. These behaviors might lead to exclusion from school.
6. Common Formative Assessments
Math / ELA / Science teams are assessing students based on our identified essential outcomes. We will use the results of these assessments
to target specific academic skill re-teaching and/or enrichment in our academic teams.
Academy can be used to re-teach and to enrich during the school day.
We can also use time in class for re-teaching and for enrichment based on assessment results.
We will also use our after school programs to provide re-teaching / enrichment based on these results.

School Improvement Plan 27 October 5, 2018
COORDINATION AND INTEGRATION
*Budget Categories: Basic Education, Title I, Title II, LAP, High Poverty Lap, Other
Budgeted Amount Professional Development Activity Description of Participating
Staff
*Budget Category
State Basic
$3,579,226
On-going PD in math, ELA, science, brain-based
learning, trauma informed practices, and professional
learning communities
All classroom teachers, assistant princi-
pal, and some para-educators State Basic
State Special
Education
$676,627
Included with above listed PD in addition t other
more focused PD around issues specific to IEP writ-
ing, instruction, and assessment.
Three special education teachers, plus
therapists, and para-educators State Special Education
Federal Special
Education
$89,471
Included with above information Three special education teachers, plus
therapists, and para-educators Federal Special Education
CTE
$144,397
Training in technology and core competencies for ca-
reer and technical education and 21st century skills
for the workforce.
One CTE teacher and para-educator sup-
port CTE
State LAP/HP
$294,760
Classroom teachers and para-educator training on collabo-
ration, using assessments, targeting resources for trauma
and poverty impacted students.
All Staff, but focused primarily on ELA
and Math Teachers State LAP/ HP
Federal Native
American
$11,482
Support Native American Interventionist Training Oppor-
tunities for working with Native American Students Native American Interventionists
Federal

School Improvement Plan 28 October 5, 2018
SIGN-OFF SHEET Directions: Ask identified stakeholders at your site to sign off on this CSIP, indicating their participation and support for the cur-
rent CSIP, their role, and their continued participation in the coordination and monitoring of the plan. Examples of roles may in-
clude, but are not limited to, parent, certificated staff, classified staff, student, principal, etc. Please print and submit this page in
hard copy.
ROLE PRINTED NAME SIGNATURE
Principal Ryan Stevens
Teacher Scott Soule
Teacher Laurel Kaufman
Teacher Melissa McBride
Teacher Rob Edwards
Teacher Leann McComb
Teacher Susan Dekreon
Para Educator Jodie Smilay
Parent Tammy Robinson
ASB Presidents
Community Member
Assistant Superintendent Chuck Lisk
Superintendent Martin Brewer
School Board President Sarah Methner Board Approved Date: ________________________