Embed Size (px)
Citation preview
Port and Container Terminal Analytics
Port and Container Terminal Analytics
www.prognoz.com 1 / 17
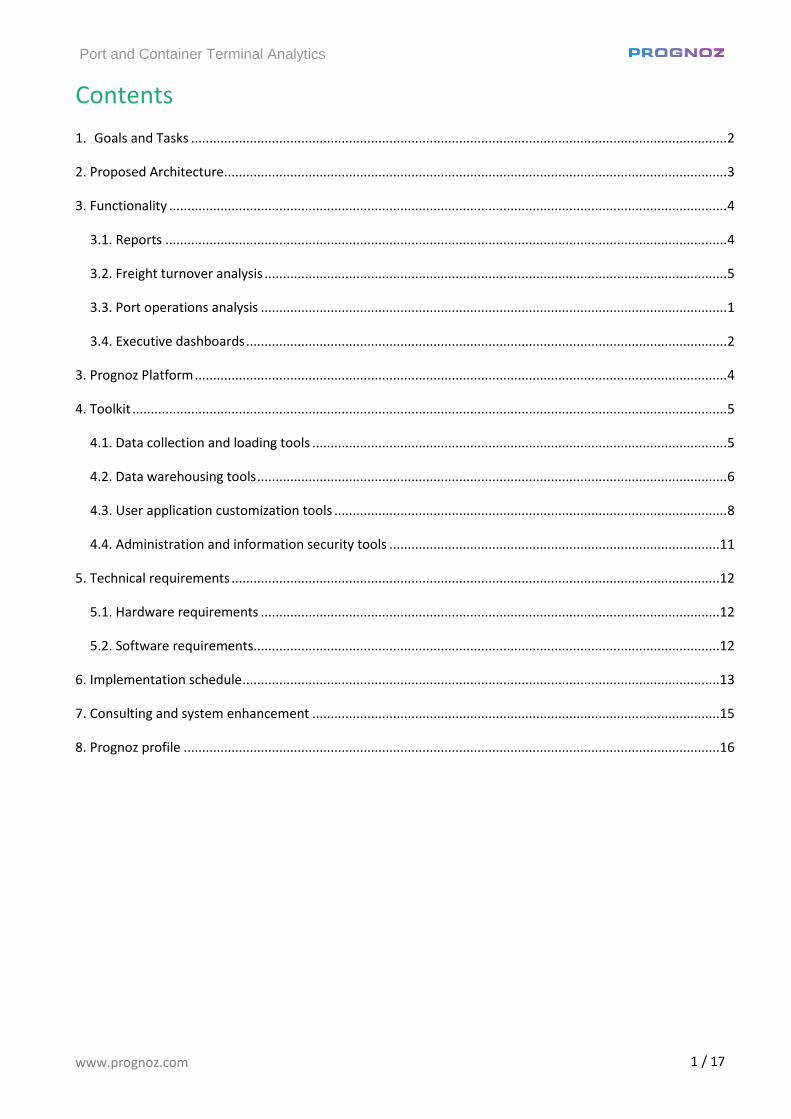
Contents
1. Goals and Tasks .................................................................................................................................................. 2
2. Proposed Architecture ......................................................................................................................................... 3
3. Functionality ........................................................................................................................................................ 4
3.1. Reports ......................................................................................................................................................... 4
3.2. Freight turnover analysis .............................................................................................................................. 5
3.3. Port operations analysis ............................................................................................................................... 1
3.4. Executive dashboards ................................................................................................................................... 2
3. Prognoz Platform ................................................................................................................................................. 4
4. Toolkit .................................................................................................................................................................. 5
4.1. Data collection and loading tools ................................................................................................................. 5
4.2. Data warehousing tools ................................................................................................................................ 6
4.3. User application customization tools ........................................................................................................... 8
4.4. Administration and information security tools .......................................................................................... 11
5. Technical requirements ..................................................................................................................................... 12
5.1. Hardware requirements ............................................................................................................................. 12
5.2. Software requirements............................................................................................................................... 12
6. Implementation schedule .................................................................................................................................. 13
7. Consulting and system enhancement ............................................................................................................... 15
8. Prognoz profile .................................................................................................................................................. 16
Port and Container Terminal Analytics
www.prognoz.com 2 / 17
1. Goals and Tasks
Prognoz is pleased to propose an integrated solution for efficient business process management Prognoz. Port
and Container Terminal Analytics.
Prognoz. Port and Container Terminal Analytics provides comprehensive support to complete vital managerial
tasks:
Monitor the ongoing operational, financial, and economic situation at a port terminal
Generate enterprise reports
Perform comprehensive analysis of operating, financial, and economic activity of a port terminal
Our solution is customized for a wide range of business users, including:
Senior managers, port operators, and clients
Managers and employees of finance and economic divisions
Experts of analytical, strategic planning, and marketing divisions
Once implemented, our solution enables you to:
Improve the efficiency of company management by online monitoring of business, financial, and
economic activities
Receive reliable information in real time on port terminal activity through Business Intelligence tools
and centralized data handling
Ensure efficient management of terminal operations due to the real-time monitoring and
multifaceted analysis of ongoing activity indicators of a port terminal
Streamline management of financial and economic activities due to the in-depth analysis of freight
turnover and trade operations
Reduce the time and effort requited to prepare analytical materials concerning key performance
indicators
Track rankings and the current global standing of the port terminal
Prognoz. Port and Container Terminal Analytics provides the following competitive advantages:
Automated data collection and regular information updating
Extensive analytical toolkit, enabling you to plan, analyze, and create scheduled and free-structured
reports
Modular system design, which greatly simplifies the task of adding or customizing functionality to
meet your precise requirements
Deep integration into existing IT infrastructure, including ERP systems, DBMS such as Oracle and MS
SQL, and dedicated systems such as Navis Express
Visually compelling data representation that is easy to view and analyze, with flexible functional
settings, and customization and downloading capabilities into various external formats, such as
Microsoft Office and PDF
Access to all required data and functionality via a single interface
Access via Internet or Intranet
Port and Container Terminal Analytics
www.prognoz.com 3 / 17
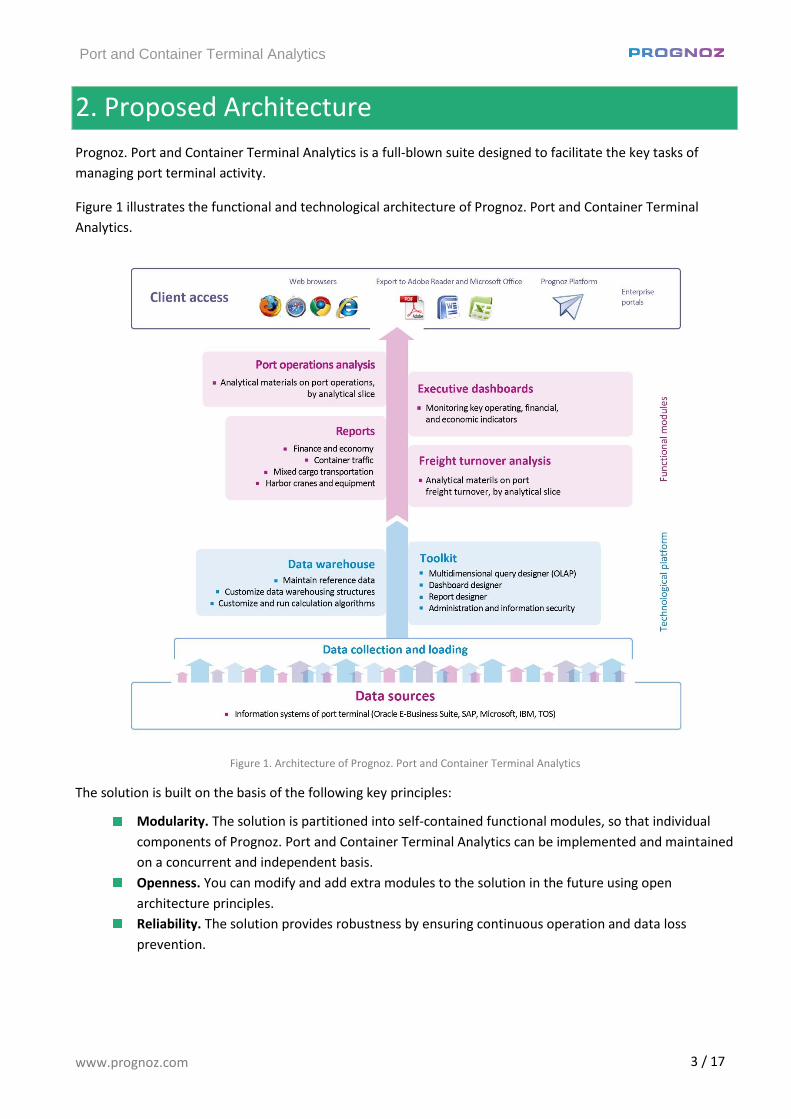
2. Proposed Architecture
Prognoz. Port and Container Terminal Analytics is a full-blown suite designed to facilitate the key tasks of
managing port terminal activity.
Figure 1 illustrates the functional and technological architecture of Prognoz. Port and Container Terminal
Analytics.
Figure 1. Architecture of Prognoz. Port and Container Terminal Analytics
The solution is built on the basis of the following key principles:
Modularity. The solution is partitioned into self-contained functional modules, so that individual
components of Prognoz. Port and Container Terminal Analytics can be implemented and maintained
on a concurrent and independent basis.
Openness. You can modify and add extra modules to the solution in the future using open
architecture principles.
Reliability. The solution provides robustness by ensuring continuous operation and data loss
prevention.
Port and Container Terminal Analytics
www.prognoz.com 4 / 17
3. Functionality
PROGNOZ. Port and Container Terminals Analytics consists of the following functional modules:
Reports
Freight Turnover Analysis
Port Operations Analysis
Executive Dashboards
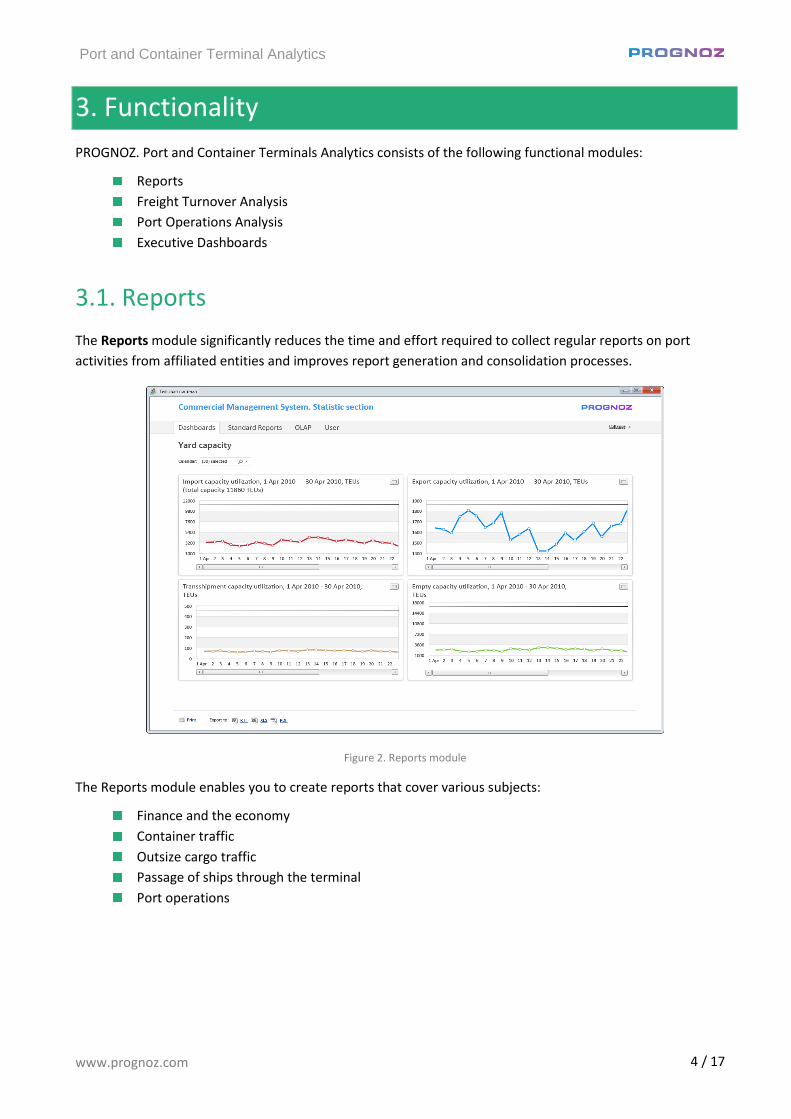
3.1. Reports
The Reports module significantly reduces the time and effort required to collect regular reports on port
activities from affiliated entities and improves report generation and consolidation processes.
Figure 2. Reports module
The Reports module enables you to create reports that cover various subjects:
Finance and the economy
Container traffic
Outsize cargo traffic
Passage of ships through the terminal
Port operations
Port and Container Terminal Analytics
www.prognoz.com 5 / 17
The module comes with the following capabilities:
Fill out relevant budget documents with the Under Development status by responsible users
Use a unified, Excel-like interface when working with reports
Display a report as per a customized template, including heading, font, fill, field format, and so on
Parameterize a report (for example, according to reporting period, activity type, currency, and so
on)
Enter and calculate formulas on a report sheet
Run data aggregation algorithms
Import data from external sources
Use additional services when working with a report, including sorting, searching, and filtering by
indicator value and dictionary element
Export to external formats, such as Microsoft Excel, PDF, and HTML
The solution is equipped with the following set of predefined regular reports:
Container turnover, by category
Container turnover, by period
Container turnover, by category, status and size
Container turnover, by vessel owner
Container turnover, by freighter
Container turnover comparison, by period
Container exports and imports, by country
Ten vessel owners with maximal container turnover over a reporting period
Ten freighters with maximal turnover over a reporting period
Summary reports on port operations with a vessel
Use of cranes, as well as by downtime type
Comparison of vessel turn-around time, by type and period
Outsize cargo turnover, by type and category
Outsize cargo turnover, by goods and category
Road transport turnover
Income, by tariff and period
Income, by company and period
Container downtime, by category, type, size, and period
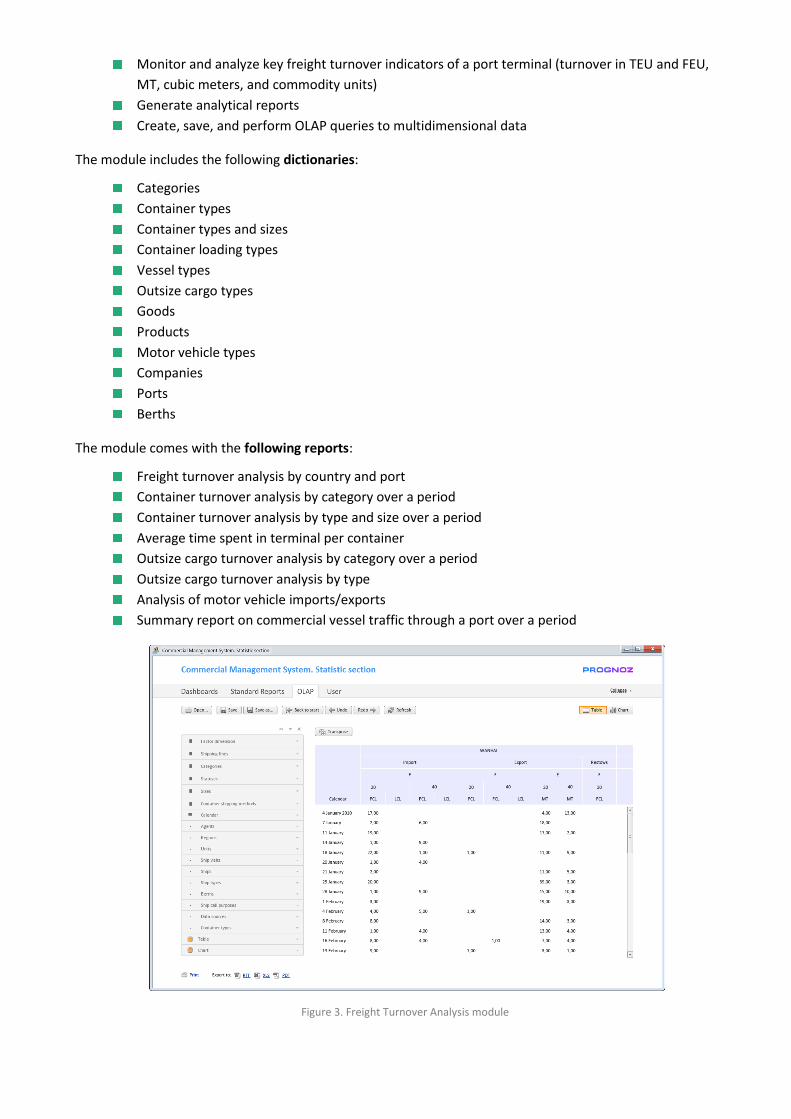
3.2. Freight turnover analysis
The Freight Turnover Analysis module ensures online monitoring and analysis of port freight turnover and
analytical reporting on container and outsize cargo turnover.
The module enables you to:
Manage a comprehensive system of key freight turnover indicators of a port terminal broken down
by such main analytical slices as:
Cargo categories
Container types
Container sizes
Country and port of origin
Country and port of destination
Vessel type
Freighter
Vessel owner
Monitor and analyze key freight turnover indicators of a port terminal (turnover in TEU and FEU,
MT, cubic meters, and commodity units)
Generate analytical reports
Create, save, and perform OLAP queries to multidimensional data
The module includes the following dictionaries:
Categories
Container types
Container types and sizes
Container loading types
Vessel types
Outsize cargo types
Goods
Products
Motor vehicle types
Companies
Ports
Berths
The module comes with the following reports:
Freight turnover analysis by country and port
Container turnover analysis by category over a period
Container turnover analysis by type and size over a period
Average time spent in terminal per container
Outsize cargo turnover analysis by category over a period
Outsize cargo turnover analysis by type
Analysis of motor vehicle imports/exports
Summary report on commercial vessel traffic through a port over a period
Figure 3. Freight Turnover Analysis module
Port and Container Terminal Analytics
www.prognoz.com 1 / 17
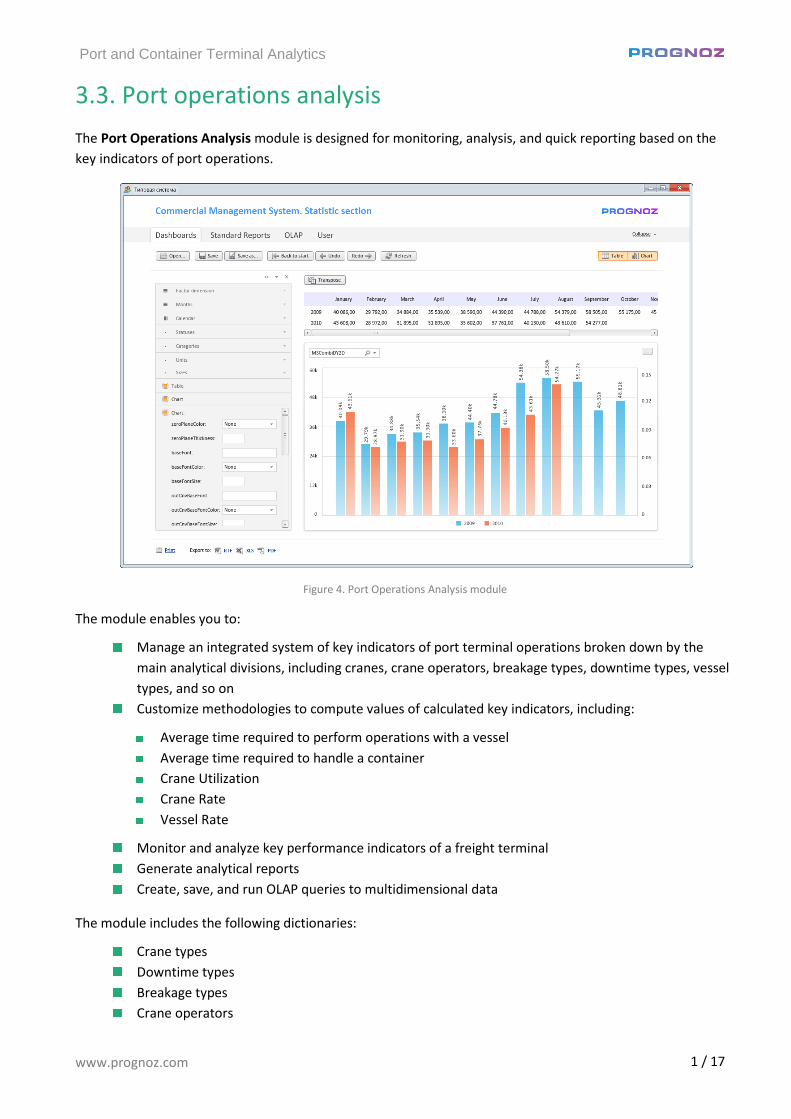
3.3. Port operations analysis
The Port Operations Analysis module is designed for monitoring, analysis, and quick reporting based on the
key indicators of port operations.
Figure 4. Port Operations Analysis module
The module enables you to:
Manage an integrated system of key indicators of port terminal operations broken down by the
main analytical divisions, including cranes, crane operators, breakage types, downtime types, vessel
types, and so on
Customize methodologies to compute values of calculated key indicators, including:
Average time required to perform operations with a vessel
Average time required to handle a container
Crane Utilization
Crane Rate
Vessel Rate
Monitor and analyze key performance indicators of a freight terminal
Generate analytical reports
Create, save, and run OLAP queries to multidimensional data
The module includes the following dictionaries:
Crane types
Downtime types
Breakage types
Crane operators
Port and Container Terminal Analytics
www.prognoz.com 2 / 17
The module displays the following indicators:
Cranage in percents
Crane operations in minutes
Crane downtime
Crane Rate
Vessel Rate
The module comes with the following reports:
Summary reports on port operations per day or over a certain period
Summary reports on crane operations over a period
Summary reports on crane operator over a period
Analysis of crane downtime types
Analysis of crane breakage types
Summary reports on port operations, performed with a vessel over a period spent at a terminal
Average time for container handling by crane
3.4. Executive dashboards
A dashboard is an interactive enterprise control panel, enabling executives to access summary data and drill
down into the data via a single, easy-to-use interface. With our preset tools, you can analyze the current
situation and identify common dependencies, critical deviations, and trends in indicator dynamics at anytime
and anywhere.
The Executive Dashboards module visualizes data on key performance indicators of an enterprise as a whole
in the form of analytical reports and interactive dashboards featured by various visual components.
The module enables you to:
Visualize key performance indicators of a port terminal for executives, including:
Total number of containers handled per day
Total weight of outsize cargo handled per day
Vessels in port
Crane workload
Average movement time per container
Average time spent in terminal per container
Current use of terminal warehouse space, and so on
Visualize key performance indicators of a port terminal for clients, as well as:
Summary report on operations performed with selected vessel
Downtime reasons and types by selected vessel
Generate OLAP-based ad hoc reports or queries of any structure
Create standardized reports
Display data in a visually compelling form, using tables, charts, digital maps, and dashboards
Modify dashboard content and type with user-friendly design tools
The system comes with the following preset dashboards:
Analysis of key port performance indicators
Port and Container Terminal Analytics
www.prognoz.com 3 / 17
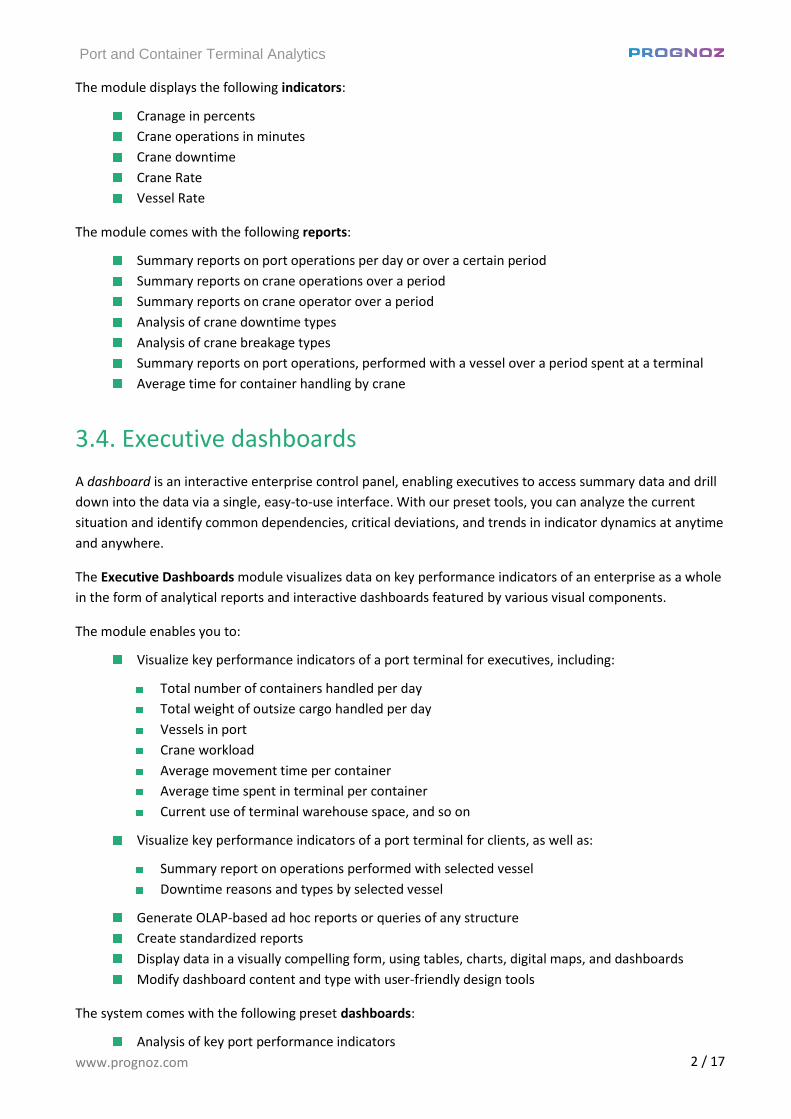
Analysis of container turnover over a period
Analysis of vessel turn-around over a period
Analysis of outsize cargo turnover over a period
Analysis of port operation indicators
Detailed analysis by selected client
Detailed analysis by selected vessel
Figure 5. Executive Dashboards
Port and Container Terminal Analytics
www.prognoz.com 4 / 17
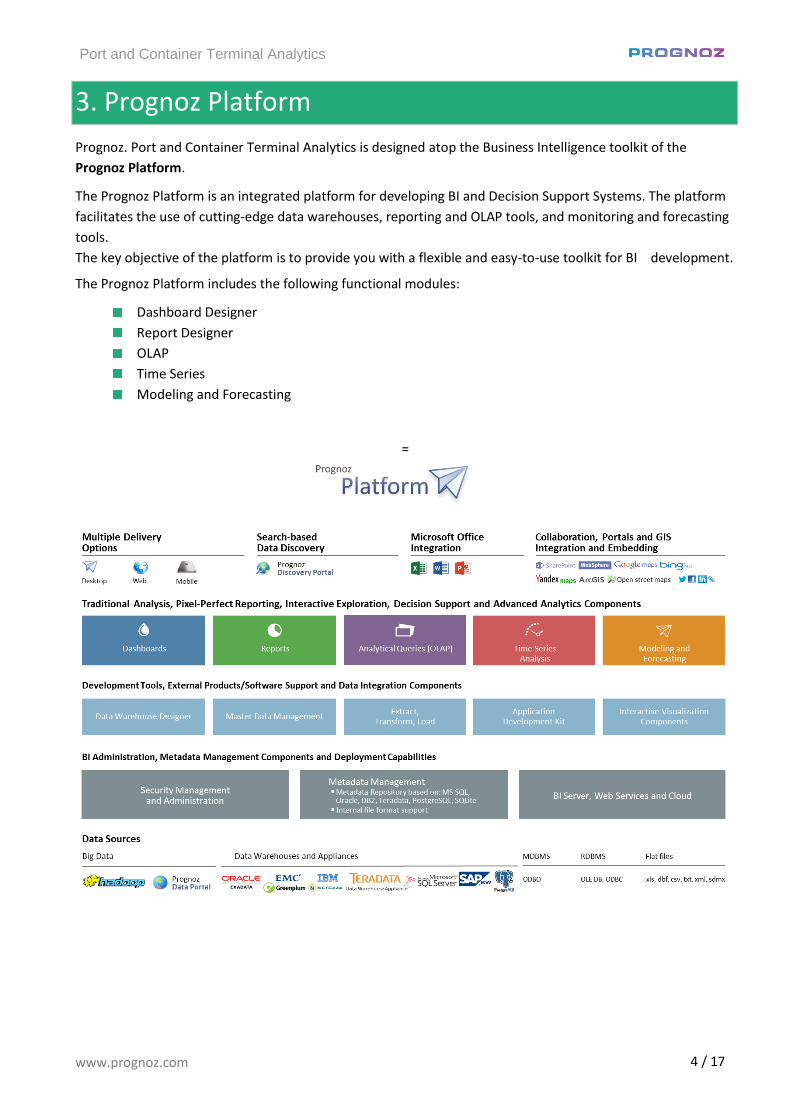
3. Prognoz Platform
Prognoz. Port and Container Terminal Analytics is designed atop the Business Intelligence toolkit of the
Prognoz Platform.
The Prognoz Platform is an integrated platform for developing BI and Decision Support Systems. The platform
facilitates the use of cutting-edge data warehouses, reporting and OLAP tools, and monitoring and forecasting
tools.
The key objective of the platform is to provide you with a flexible and easy-to-use toolkit for BI development.
The Prognoz Platform includes the following functional modules:
Dashboard Designer
Report Designer
OLAP
Time Series
Modeling and Forecasting
=
Port and Container Terminal Analytics
www.prognoz.com 5 / 17
4. Toolkit
The system tools are powered by the latest cutting-edge international technologies implemented in our
platform and application suites. Today, our portals and applications are used by more than 350 customers
around the world, including international organizations, industrial and financial corporations, and public
authorities.
Prognoz. Port and Container Terminal Analytics incorporates advanced toolsets:
Data collection and loading tools
Data warehousing tools
User application customization tools
Audit and information security tools
The tools provide the following capabilities:
The data integration tools enable you to design and populate data warehouses from various data
sources.
The modeling and forecasting tools enable you to perform in-depth data analysis and use obtained
results to deliver forecasts of a situation in the future or to select an optimal management strategy.
The application development tools enable you to extend platform capabilities and tailor them to
individual needs in a time-sensitive fashion.
You can access obtained results via Web browsers, enterprise portals, and Microsoft Office
applications.
The open architecture of the platform ensures interaction with other software products, including
those from other vendors, and facilitates the process of future platform updates.
4.1. Data collection and loading tools
The data collection and loading tools are designed to collect data via the Internet as well as to extract,
transform, and load data from external systems into a data warehouse.
Data collection, extraction, transformation, and loading tools (ETL)
The system provides access to external data sources, such as:
Industrial relational and multidimensional DBMS (Oracle, MS SQL Server, IBM DB2, other ODBC or
OLE DB-compatible DBMS, MS SQL Server Analysis Services, IBM DB2 OLAP Server, Hyperion
Essbase, SAP BW, and others)
External automated systems and applications (Navis Express, Oracle E-business Suite, SAP R/3,
Reuters, Bloomberg, and others)
Local data sources and desktop DBMS (XML, EDIFACT, DBF, TXT, Microsoft Excel, Microsoft Access,
and others)
Port and Container Terminal Analytics
www.prognoz.com 6 / 17
Logic and arithmetic data control tools
These tools are designed to customize control checks of indicator values, using data collection forms and data
from external sources, as well as to:
Set up algorithms for logic and arithmetic control of indicator values and input data validation by
indicator, using logical links between indicators within a form
Set up algorithms for the cross-form control of indicator values that ensure indicator data is saved
correctly, using logical links between indicators of different forms
Set up algorithms that enable logic and arithmetic control of external indicator values
4.2. Data warehousing tools
Tools for data warehousing structure customization
These tools are designed to build a data warehouse in order to obtain analytical reports, as well as to:
Describe indicators
Maintain coefficients to convert units of measurement
Describe analytical slices of indicators and their relations with dictionaries
Support indicators with various time spans
Aggregate and consolidate data
Prepare subject-oriented data sets, or data marts
MDM tools
The MDM or Master Data Management tools streamline the following tasks:
Create dictionaries
Support an unlimited number of dictionary attributes
Support linear and hierarchical dictionaries
Support compound dictionaries created on the basis of other dictionaries
Parameterize dictionary elements (dependence of dictionary content on parameter values)
Support configurations of unique dictionary keys
Filter, group, and search for elements by condition
Tools to customize and run calculation algorithms
These tools are designed to customize and run calculation algorithms. They enable you to perform the
following tasks:
Set up algorithms to calculate values of data warehouse indicators, including indicators presented in
regular reports and planning and budget documents
Configure indicator calculation schemes
Calculate configured schemes
Port and Container Terminal Analytics
www.prognoz.com 7 / 17
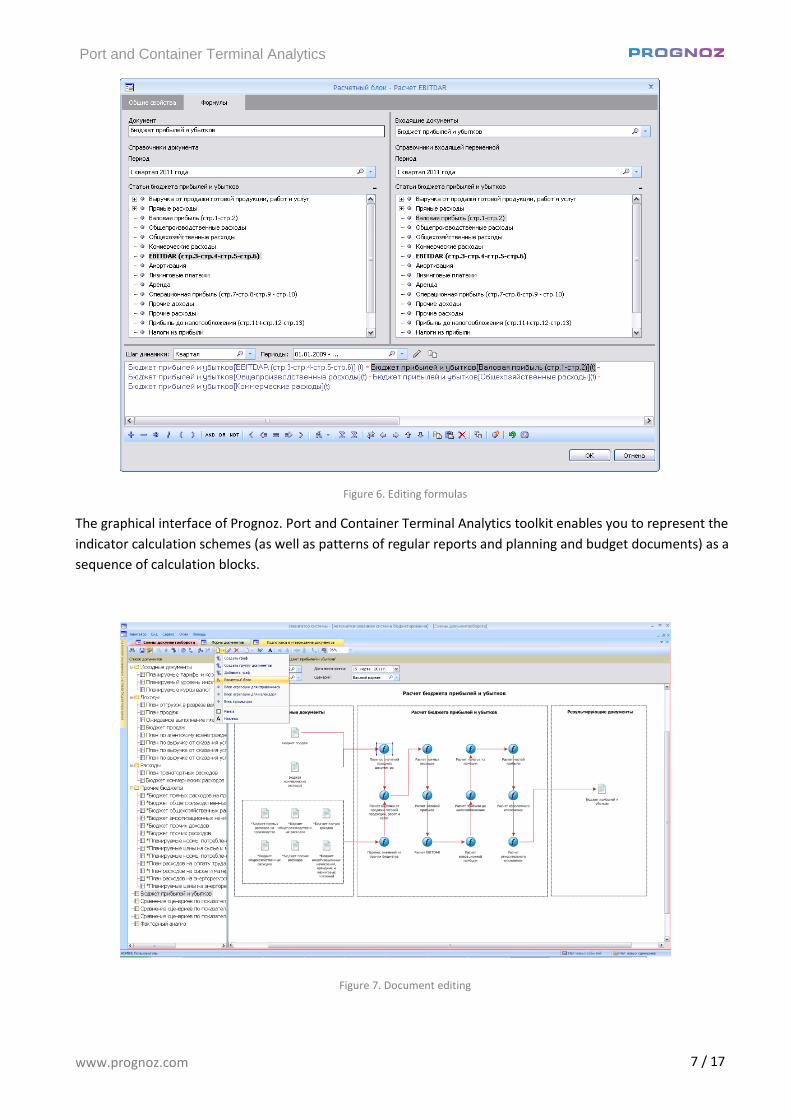
Figure 6. Editing formulas
The graphical interface of Prognoz. Port and Container Terminal Analytics toolkit enables you to represent the
indicator calculation schemes (as well as patterns of regular reports and planning and budget documents) as a
sequence of calculation blocks.
Figure 7. Document editing
Port and Container Terminal Analytics
www.prognoz.com 8 / 17
4.3. User application customization tools
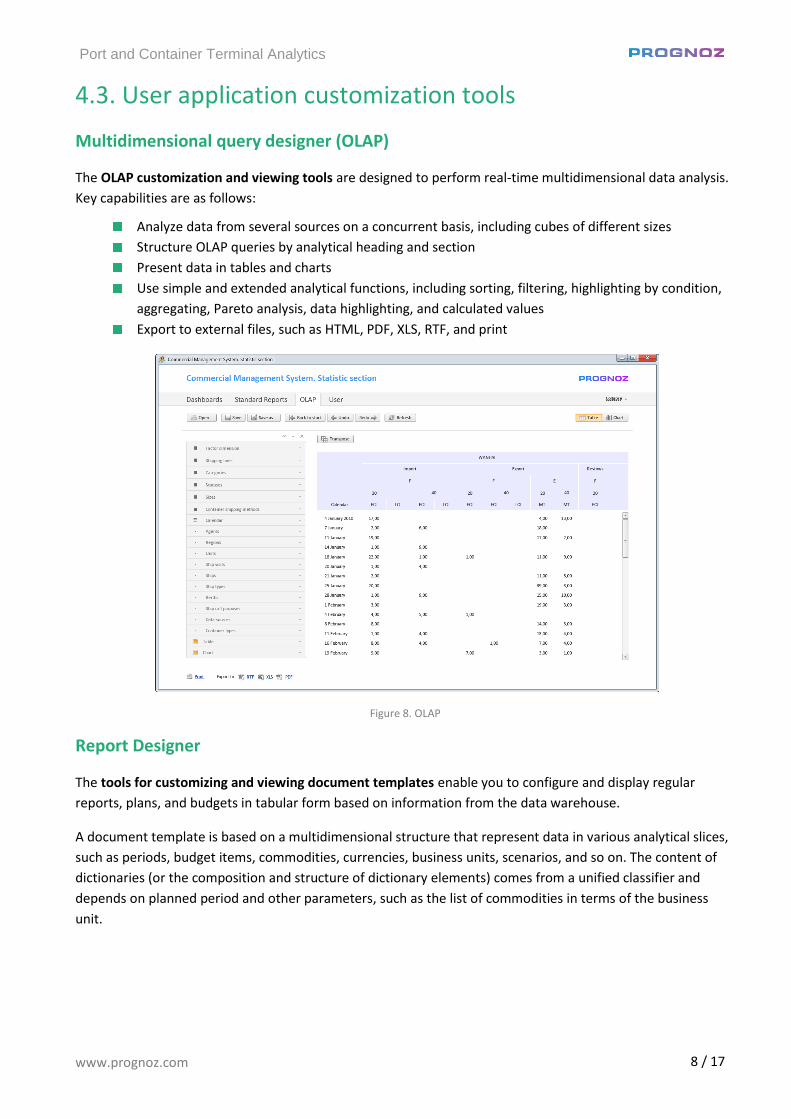
Multidimensional query designer (OLAP)
The OLAP customization and viewing tools are designed to perform real-time multidimensional data analysis.
Key capabilities are as follows:
Analyze data from several sources on a concurrent basis, including cubes of different sizes
Structure OLAP queries by analytical heading and section
Present data in tables and charts
Use simple and extended analytical functions, including sorting, filtering, highlighting by condition,
aggregating, Pareto analysis, data highlighting, and calculated values
Export to external files, such as HTML, PDF, XLS, RTF, and print
Figure 8. OLAP
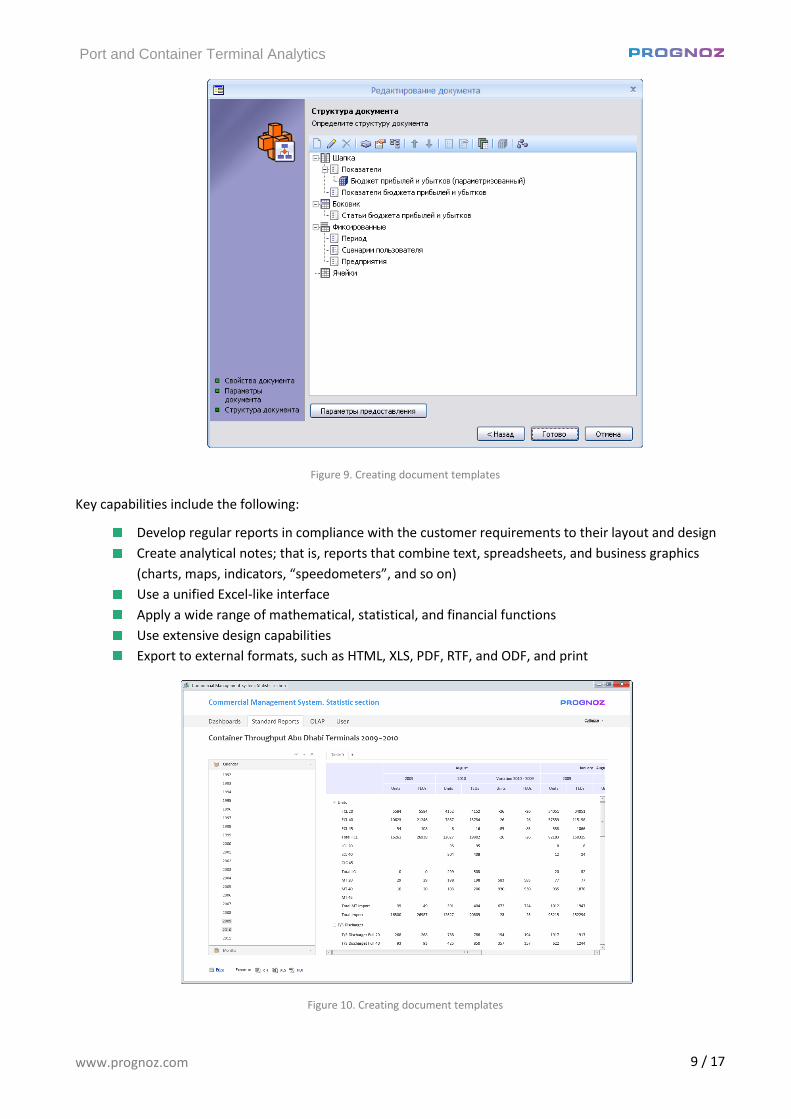
Report Designer
The tools for customizing and viewing document templates enable you to configure and display regular
reports, plans, and budgets in tabular form based on information from the data warehouse.
A document template is based on a multidimensional structure that represent data in various analytical slices,
such as periods, budget items, commodities, currencies, business units, scenarios, and so on. The content of
dictionaries (or the composition and structure of dictionary elements) comes from a unified classifier and
depends on planned period and other parameters, such as the list of commodities in terms of the business
unit.
Port and Container Terminal Analytics
www.prognoz.com 9 / 17
Figure 9. Creating document templates
Key capabilities include the following:
Develop regular reports in compliance with the customer requirements to their layout and design
Create analytical notes; that is, reports that combine text, spreadsheets, and business graphics
(charts, maps, indicators, “speedometers”, and so on)
Use a unified Excel-like interface
Apply a wide range of mathematical, statistical, and financial functions
Use extensive design capabilities
Export to external formats, such as HTML, XLS, PDF, RTF, and ODF, and print
Figure 10. Creating document templates
Port and Container Terminal Analytics
www.prognoz.com 10 / 17
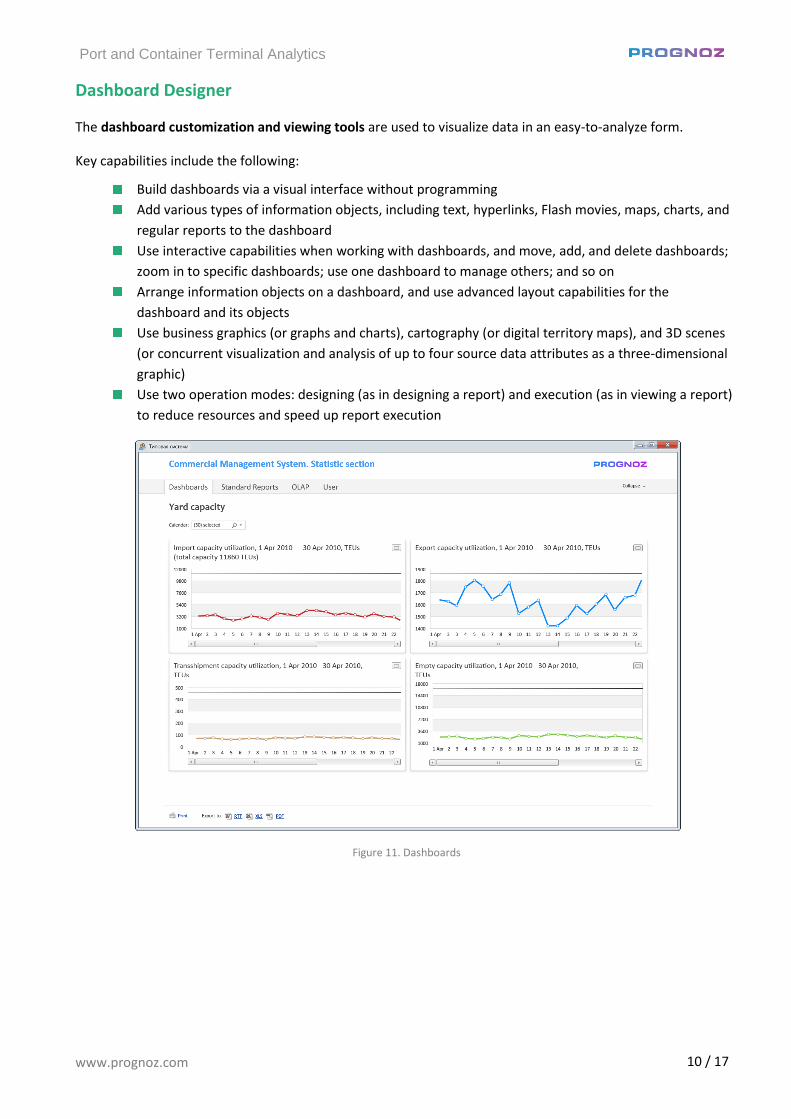
Dashboard Designer
The dashboard customization and viewing tools are used to visualize data in an easy-to-analyze form.
Key capabilities include the following:
Build dashboards via a visual interface without programming
Add various types of information objects, including text, hyperlinks, Flash movies, maps, charts, and
regular reports to the dashboard
Use interactive capabilities when working with dashboards, and move, add, and delete dashboards;
zoom in to specific dashboards; use one dashboard to manage others; and so on
Arrange information objects on a dashboard, and use advanced layout capabilities for the
dashboard and its objects
Use business graphics (or graphs and charts), cartography (or digital territory maps), and 3D scenes
(or concurrent visualization and analysis of up to four source data attributes as a three-dimensional
graphic)
Use two operation modes: designing (as in designing a report) and execution (as in viewing a report)
to reduce resources and speed up report execution
Figure 11. Dashboards
Port and Container Terminal Analytics
www.prognoz.com 11 / 17
Spreadsheet customization and viewing tools
The spreadsheet customization and viewing tools enable you to analyze spreadsheets with master data
loaded from external systems and registries.
Key capabilities include the following:
Drill down to the value of the regular report indicator located on a dashboard by a set of fields of
the data collection registry or original external source
Perform such analytical functions as grouping, filtering, and sorting
Customize a set of displayed fields in a drill-down report
Switch from one drill-down report to another
Export to external format
4.4. Administration and information security tools
These tools delimit access to the information resources and functionality of Prognoz. Port and Container
Terminal Analytics and ensure access logging.
Key capabilities include the following:
Delimit access to information resources and system functionality by:
Maintaining a list of users and user groups
Managing rights to access information resources and functionality
Controlling rights to access information resources and functionality
Log access by:
Keeping a log detailing access to information resources and functionality
Viewing the log detailing access to information resources and functionality
Port and Container Terminal Analytics
www.prognoz.com 12 / 17
5. Technical requirements
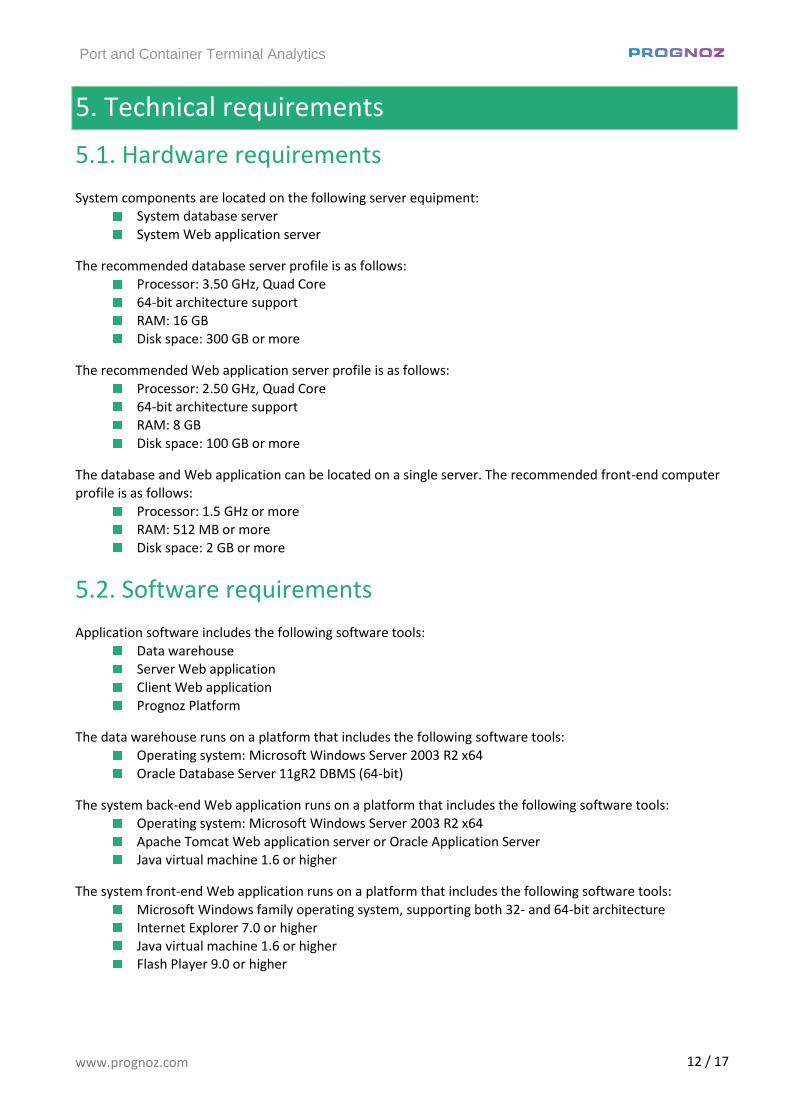
5.1. Hardware requirements
System components are located on the following server equipment: System database server System Web application server
The recommended database server profile is as follows: Processor: 3.50 GHz, Quad Core 64-bit architecture support RAM: 16 GB Disk space: 300 GB or more
The recommended Web application server profile is as follows: Processor: 2.50 GHz, Quad Core 64-bit architecture support RAM: 8 GB
Disk space: 100 GB or more
The database and Web application can be located on a single server. The recommended front-end computer profile is as follows:
Processor: 1.5 GHz or more RAM: 512 MB or more Disk space: 2 GB or more
5.2. Software requirements
Application software includes the following software tools: Data warehouse Server Web application Client Web application
Prognoz Platform
The data warehouse runs on a platform that includes the following software tools: Operating system: Microsoft Windows Server 2003 R2 x64 Oracle Database Server 11gR2 DBMS (64-bit)
The system back-end Web application runs on a platform that includes the following software tools: Operating system: Microsoft Windows Server 2003 R2 x64 Apache Tomcat Web application server or Oracle Application Server Java virtual machine 1.6 or higher
The system front-end Web application runs on a platform that includes the following software tools: Microsoft Windows family operating system, supporting both 32- and 64-bit architecture Internet Explorer 7.0 or higher Java virtual machine 1.6 or higher Flash Player 9.0 or higher
Port and Container Terminal Analytics
www.prognoz.com 13 / 17
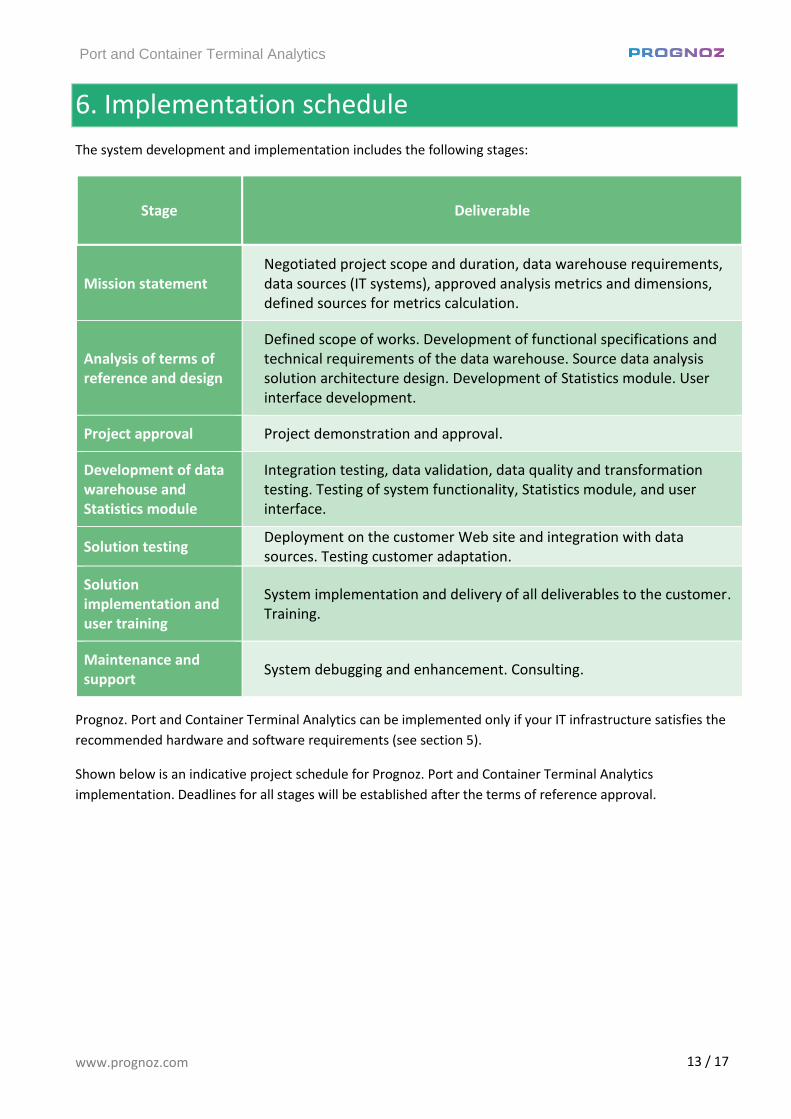
6. Implementation schedule
The system development and implementation includes the following stages:
Prognoz. Port and Container Terminal Analytics can be implemented only if your IT infrastructure satisfies the
recommended hardware and software requirements (see section 5).
Shown below is an indicative project schedule for Prognoz. Port and Container Terminal Analytics
implementation. Deadlines for all stages will be established after the terms of reference approval.
Stage Deliverable
Mission statement Negotiated project scope and duration, data warehouse requirements, data sources (IT systems), approved analysis metrics and dimensions, defined sources for metrics calculation.
Analysis of terms of reference and design
Defined scope of works. Development of functional specifications and technical requirements of the data warehouse. Source data analysis solution architecture design. Development of Statistics module. User interface development.
Project approval Project demonstration and approval.
Development of data warehouse and Statistics module
Integration testing, data validation, data quality and transformation testing. Testing of system functionality, Statistics module, and user interface.
Solution testing Deployment on the customer Web site and integration with data sources. Testing customer adaptation.
Solution implementation and user training
System implementation and delivery of all deliverables to the customer. Training.
Maintenance and support
System debugging and enhancement. Consulting.
Port and Container Terminal Analytics
www.prognoz.com 14 / 17
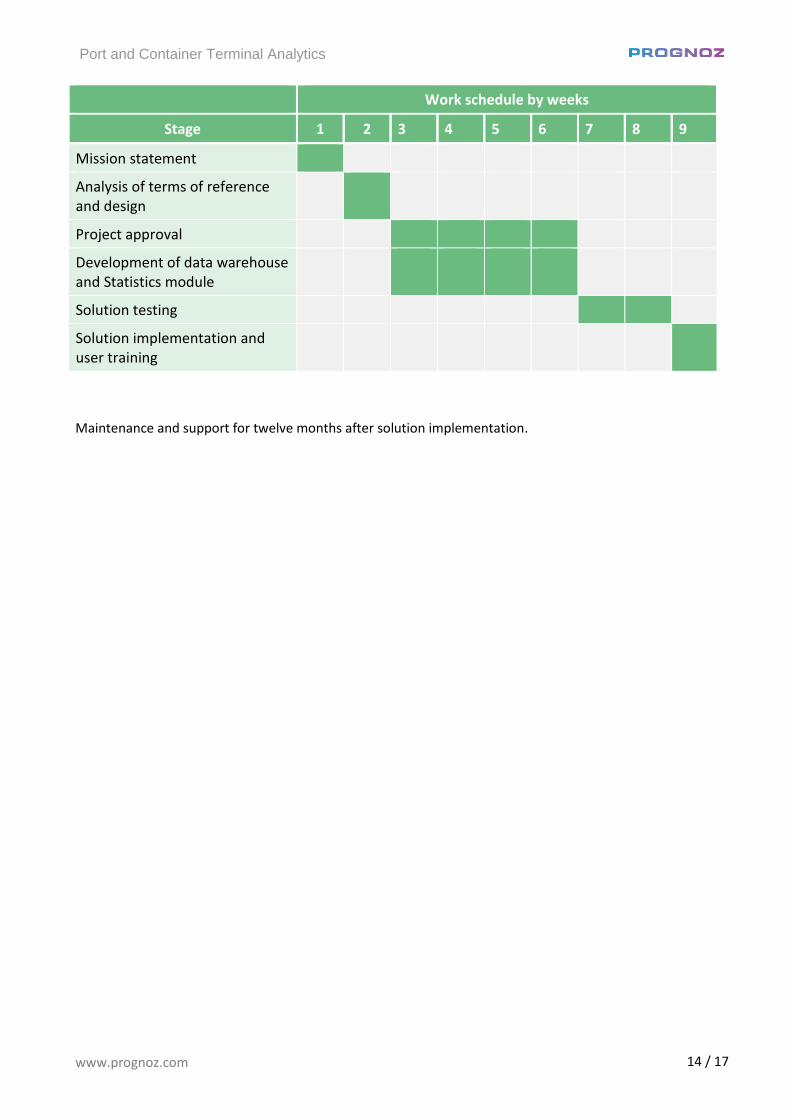
Maintenance and support for twelve months after solution implementation.
Work schedule by weeks
Stage 1 2 3 4 5 6 7 8 9
Mission statement
Analysis of terms of reference and design
Project approval
Development of data warehouse and Statistics module
Solution testing
Solution implementation and user training
Port and Container Terminal Analytics
www.prognoz.com 15 / 17
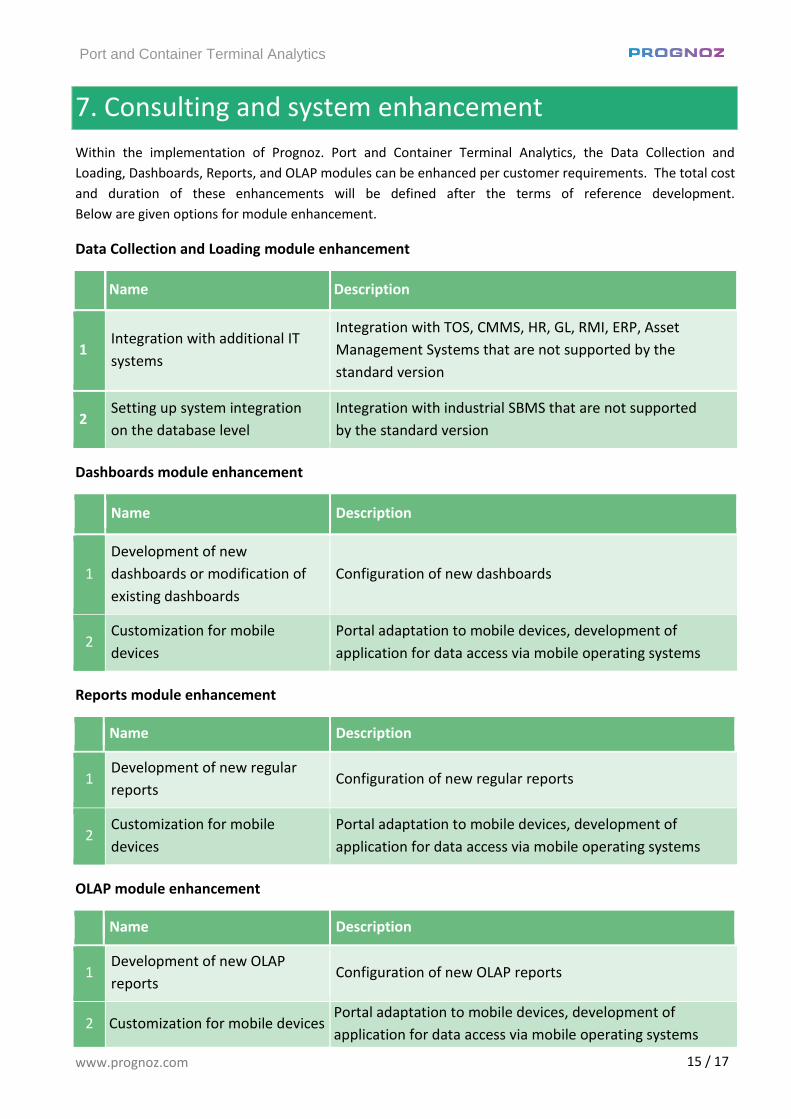
7. Consulting and system enhancement
Within the implementation of Prognoz. Port and Container Terminal Analytics, the Data Collection and
Loading, Dashboards, Reports, and OLAP modules can be enhanced per customer requirements. The total cost
and duration of these enhancements will be defined after the terms of reference development.
Below are given options for module enhancement.
Data Collection and Loading module enhancement
Name Description
1 Integration with additional IT
systems
Integration with TOS, CMMS, HR, GL, RMI, ERP, Asset
Management Systems that are not supported by the
standard version
2 Setting up system integration
on the database level
Integration with industrial SBMS that are not supported
by the standard version
Dashboards module enhancement
Name Description
1
Development of new
dashboards or modification of
existing dashboards
Configuration of new dashboards
2 Customization for mobile
devices
Portal adaptation to mobile devices, development of
application for data access via mobile operating systems
Reports module enhancement
Name Description
1 Development of new regular
reports Configuration of new regular reports
2 Customization for mobile
devices
Portal adaptation to mobile devices, development of
application for data access via mobile operating systems
OLAP module enhancement
Name Description
1 Development of new OLAP
reports Configuration of new OLAP reports
2 Customization for mobile devices Portal adaptation to mobile devices, development of
application for data access via mobile operating systems
Port and Container Terminal Analytics
www.prognoz.com 16 / 17
8. Prognoz profile
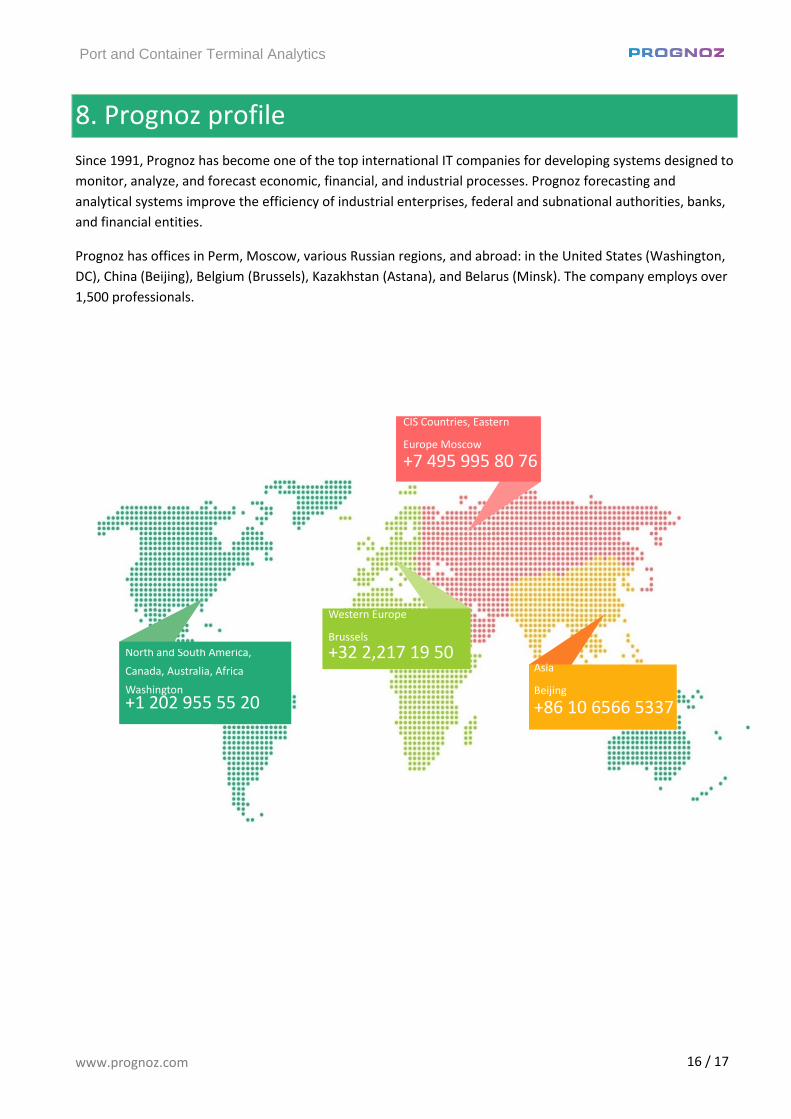
Since 1991, Prognoz has become one of the top international IT companies for developing systems designed to
monitor, analyze, and forecast economic, financial, and industrial processes. Prognoz forecasting and
analytical systems improve the efficiency of industrial enterprises, federal and subnational authorities, banks,
and financial entities.
Prognoz has offices in Perm, Moscow, various Russian regions, and abroad: in the United States (Washington,
DC), China (Beijing), Belgium (Brussels), Kazakhstan (Astana), and Belarus (Minsk). The company employs over
1,500 professionals.
CIS Countries, Eastern
Europe Moscow +7 495 995 80 76
Western Europe
Brussels +32 2,217 19 50
Asia
Beijing
+86 10 6566 5337
North and South America,
Canada, Australia, Africa
Washington +1 202 955 55 20