Embed Size (px)
Citation preview
11 Scientia Africana, Vol. 15 (No. 1), June 2016. Pp 11-32 © Faculty of Science, University of Port Harcourt, Printed in Nigeria ISSN 1118 – 1931
POROSITY PREDICTION OF I-FIELD IN THE NIGER DELTA AREA USING WELL-LOG DATA AND SEISMIC ATTRIBUTES
1 V. Makinde, 2* R. Bello, 3 M. O. Omeike and 1 D. O. Aikhuele
1Department of Physics, Federal University of Agriculture, Abeokuta, Nigeria.
2Department of Physics, University of Port Harcourt, Port Harcourt, Nigeria
3Department of Mathematics, Federal University of Agriculture, Abeokuta, Nigeria.
*Corresponding Author: e-mail: [email protected], Phone: +2348036684498.
Received: 09-02-16 Accepted:14-04-16
ABSTRACT
There are many important characteristics of formations within the subsurface that can be used to determine locations of hydrocarbon reservoirs below the earth surface. This work
used the Porosity characteristics of formation to determine the locations of hydrocarbon reservoirs of I – field. The study was aimed at interpolating data from few wells using well-
log data, geo-statistical analysis and seismic attributes to determine porosity values in order to overcome the problem of multiple well drilling. The study area, I-field, is located between
latitudes 4.7950oN and 4.8186oN, longitudes 6.9595oE and 6.9800oE. Variogram analysis and Sequential Gaussian Simulation were used as the geo-statistical techniques for
interpolation. From these techniques, multiple models were generated and the best porosity model which revealed the direction of increased porosity within I-field, as well as areas with
high and low porosity variation across the field was selected. Seismic attributes were then incorporated with this model to increase the level of certainty and reliability of the
prediction. A cross-plot analysis of the gamma ray log and porosity log showed high responses along the depth 2800 m closing contour on a fault plane with average porosity
variation of 18 - 28% at the depth 3200m located at the centre of the field. The cross-plot analysis revealed an increase in porosity at areas where sandstones are located (gamma-ray
values from 0-55). Porosity prediction showed that locations at depth 2800 m within the I-field are of high porosity of 28% and are therefore viable locations for sitting of wells and
prospecting for hydrocarbons; while locations at depth 3200m are of comparatively low porosity of 18%.
Key words: Porosity, Seismic Attributes, Lithology, Well Log, Hydrocarbon
INTRODUCTION
The Niger-delta basin is not a single large field but is made up of many different single
reservoir most of which are sandstone pockets trapped within hydrocarbon shale
strata. Hydrocarbon fields in the Niger-delta are not large but are many, with 574 fields
discovered (481 oil and 93 natural gas
fields) in this region (Wikipedia.com). The
delta formed at the site of a rift triple junction is related to the opening of the
southern Atlantic starting in the Late Jurassic and continuing into the Cretaceous
(Tuttle et al., 1999). From conventional 3-D structural
interpretation, it is possible to identify

12 Makinde V., Bello R., Omeike M. O. and Aikhuele D. O.: Porosity Prediction of I-Field in the Niger Delta Area Using…
structural traps (structural highs) particularly in the prolific hydrocarbon
province of the Niger Delta where mobile shale tectonics of the over pressured Akata
formation results in dip structures, growth faults and associated rollovers, faulted
anticlines, among others (Doust and Omatsola, 1989). From depth maps of
reservoir tops, areas of possible hydrocarbon accumulation or prospects
where wells have not been drilled can also be identified. With the aid of related seismic
attributes, it is possible to rank these prospects on the basis of lateral and vertical
variation of lithofacies, porosity, and permeability across the reservoir (Ogiesoba,
2010).
The prediction of physical properties such as porosity from empirical correlations of
multivariate linear regression between seismic attributes and well log data was
introduced by numerous authors (Schultz et al., 1994. Norkhamboot and Wongpornchai,
2012). A seismic attribute analysis can also be used to estimate physical properties such
as porosity, permeability and others in a reservoir (Leiphart and Hart, 2001; Tebo
and Hart, 2003).
In characterizing hydrocarbon reservoirs, estimating reserves, and developing models
for the best extraction of hydrocarbons, it is useful to know the lithology (for example,
relative amounts of shale and sand) and associated porosity of the rocks in the target
interval. In regions where a large number of wells have been drilled, pattern-based
recognition methods and simple empirical relationships can be used successfully to
infer rock properties from seismic data. However, in regions of limited well control,
it is difficult to make accurate lithology or porosity prediction using empirical
relationships derived from just a few wells (Alao et al., 2014).
Hydrocarbons have been located in all the
depobelts of the Niger Delta, in good quality sandstone reservoirs belonging to the main
deltaic sequences. Most of the accumulations occur in the roll-over
anticlines in the hanging wall of growth faults, where they may be trapped in either
dip or fault closures (Doust and Omatsola, 1990).The hydrocarbons are found in
multiple pay sands with relatively short columns and adjacent fault blocks which
usually have independent accumulations (Doust and Omatsola, 1990).
Rouhani et al., (1996) concluded that geo-
statistics offer a variety of spatial estimation procedures which are known as kriging.
These techniques are commonly used for interpolation of points at unsampled
locations and estimation of average block values. Kriging techniques provide a
measure of accuracy in the form of an estimation variance. Kriging and co-kriging
are geo-statistical interpolation methods {Deutsch (2002), Dubruble (1998), Kelkar
and Perez (2002)}. The general kriging formula is:
n
iiik zz
1
. (1)
where;
valuesgsurroundin n'' from valueestimated kz
i = weighting coefficient on location ’i’
iz Actual value on location ’i’(Malvic and
Prskalo, 2008).
Norkhamboot and Wongpornchai, (2012) in their study that used seismic attribute
analysis to predict porosity of reservoir

13 Scientia Africana, Vol. 15 (No. 1), June 2016. Pp 11-32 © Faculty of Science, University of Port Harcourt, Printed in Nigeria ISSN 1118 – 1931
using seismic and well log data; an interesting sand layer was identified by the
well log data. The acoustic impedance volume was created as an external attribute
for seismic attribute analysis. It was noted that to improve the ability of porosity
prediction, the best attributes of multi-attribute analysis should be computed using
multilayer feed-forward neural network technique.
Bisht et al., (2013) observed that the
identification of reservoir distribution of fluvial channels depositional environments
is a challenging task for field development planning. To accomplish this task an
integrated approach is required, where seismic attributes along with the lithology
logs and geological concept can be used to define facies away from the wells.
Alao et al (2014) combined both physical attributes and geometric attributes to predict
the spatial distribution of porosity as a result of the relationship between the seismic
reflection data and physical properties.
The aim of this work is to use the data obtained from seismic survey and well logs
incorporated with seismic attributes for development studies, and also to detect high
hydrocarbon pay-zones (sweet spots) in the field of study.
MATERIALS AND METHODS
Study Area Material used for this research was a
secondary data obtained from Chevron Nigeria Limited through the Department of
Petroleum Resources, Nigeria, of the area of study. The data was acquired in I-field in
the Nigeria Niger Delta. The following are the sets of data given by Chevron Nigeria
Limited; Seismic survey data of the area to be studied, well log data of the six (6) wells
drilled within the area of study, check shot data, directional survey data, biostrat chart,
and the well header data.
The software used in this research is the PETREL software (version 2011.2)
developed by Schlumberger. An advanced quantitative methodology integrating 3D
seismic data was adopted.
It has been said that porosity values can be determined from only well logs, although
none of these logs actually measures pore volume directly, they can detect the contrast
between the physical characteristics of water and rock-forming minerals (Doventon,
1994).
The Niger Delta is situated in southern Nigeria between latitudes 3° N and 6° N and
longitude 5° E and 8° E (Nwachukwu, and Chukwura, 1986), however, the study area,
I-field, is located between latitudes 4.7950oN and 4.8186oN, longitudes
6.9595oE and 6.9800oE. The onshore portion of the Niger Delta province is
delineated by the geology of Southern Nigeria and Southwestern Cameroon. The
northern boundary is the Benin flank; an east-northeast trending hinge line south of
the West Africa basement massif. The northeastern boundary is defined by
outcrops of the Cretaceous on the Abakaliki High and further east-south-east by the
Calabar flank; a hinge line bordering the adjacent Precambrian. The province covers
300,000 km2 and includes the geologic extent of the Tertiary Niger Delta (Akata-
Agbada) petroleum system (Tuttle et al, 1999). Figure 1 shows the geological map of
Niger Delta.
The Niger Delta is situated in the Gulf of Guinea and extends throughout the Niger
14 Makinde V., Bello R., Omeike M. O. and Aikhuele D. O.: Porosity Prediction of I-Field in the Niger Delta Area Using…
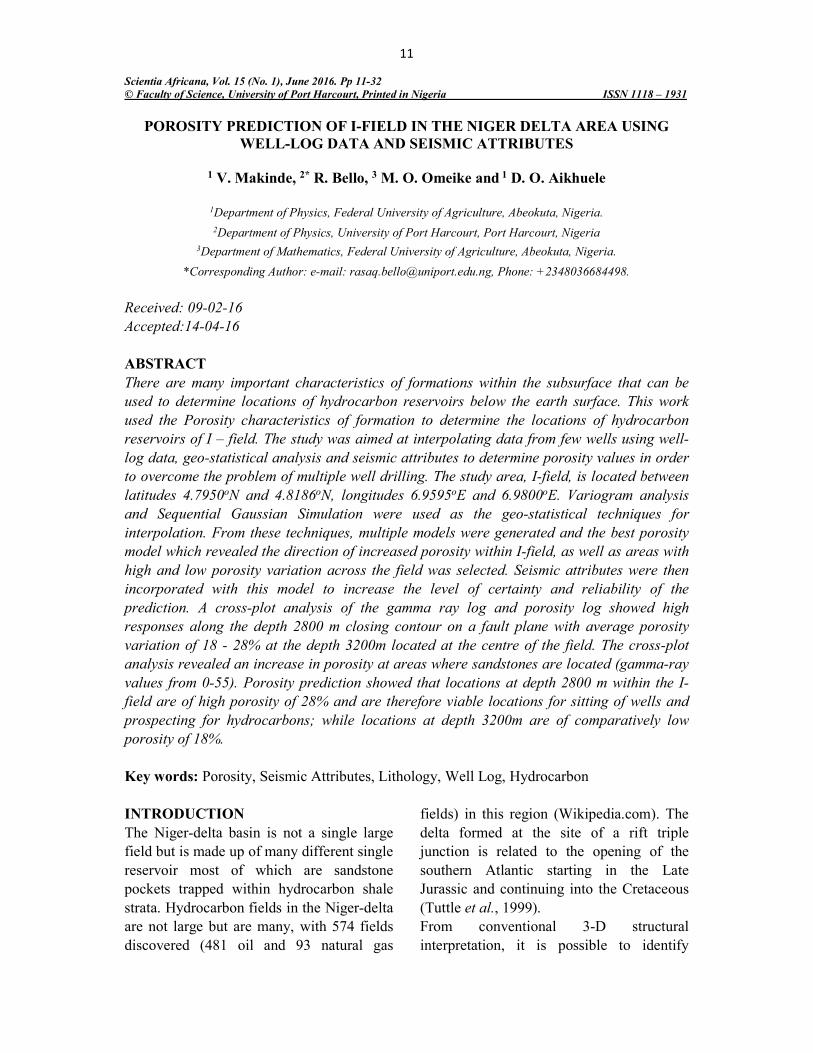
Delta province (Klett et al, 1997). From the Eocene to the present, the delta has
prograded south-west ward, forming depobelts that represent the most active
portion of the delta at each stage of its development (Doust and Omatsola, 1990).
These depobelts form one of the largest
regressive deltas in the world with an area of some 300,000km2 (Kulke, 1995), a
sediment volume of 500,000km2 (Hospers, 1965) and a sediment thickness of over 10
km in the basin depocenter (Kaplan et al., 1994).
Figure 1: Generalized geological map of Niger Delta basin (Okiwelu and Ude, 2012)
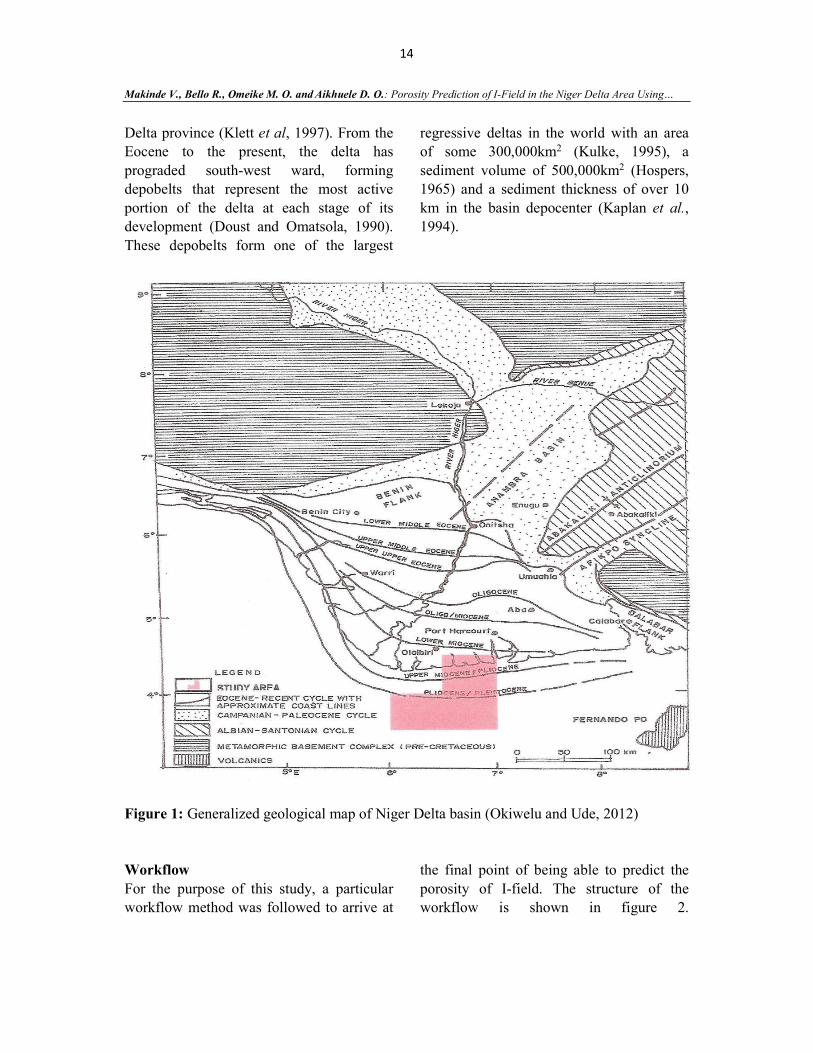
Workflow
For the purpose of this study, a particular workflow method was followed to arrive at
the final point of being able to predict the
porosity of I-field. The structure of the workflow is shown in figure 2.
15 Scientia Africana, Vol. 15 (No. 1), June 2016. Pp 11-32 © Faculty of Science, University of Port Harcourt, Printed in Nigeria ISSN 1118 – 1931
Figure 2: Workflow for data analysis
The first step will be identifying the
reservoir amidst the data available, hence the need to begin with the well data as it
gives the log motif of I-field which includes the gamma ray log, resistivity log, density-
neutron log, acoustic impedance log, among others. Seismic data is also imported which
contains the raw data derived from the seismogram attained during acquisition on
the field. Figure 3 shows well-log data that have been imported which comprises of
various petro-physical parameters such as Gamma-ray log and Resistivity log which
help measure the gamma and resistivity
values respectively. Figure 4 and figure 5 are both seismic data that have been
imported, figure 4 gives the section of the seismic trace that have been observed from
the top of the surface while figure 5 shows the section of the seismic trace that has been
observed from a deeper area within the sub-surface. It is observed in figure 5 that this
section is characterized by various faults and amplitudes of different variations below
the sub-surface.
Well log
interpretation & correlation
Generate
Structural Models
Structural Interpretation
Petro-physical analysis
Porosity prediction
Well to seismic tie
Geo-statistics, Attributes and
cross plot analysis
Well data
Seismic data

16 Makinde V., Bello R., Omeike M. O. and Aikhuele D. O.: Porosity Prediction of I-Field in the Niger Delta Area Using…
Figure 3: Well data after import (GR represent gamma-ray log, RES and LLD represents resistivity log)
Figure 4: A section of seismic trace from the surface
Figure 5: A deeper section of the seismic trace characterized by faults and high amplitude

17 Scientia Africana, Vol. 15 (No. 1), June 2016. Pp 11-32 © Faculty of Science, University of Port Harcourt, Printed in Nigeria ISSN 1118 – 1931
RESULTS Well Log Data Import and Interpretation
In processing and interpreting data for the exploration wells, well log data for each of
the wells was loaded into the well section window of the interpretation software.
Figure 6 shows a typical loaded well log data for a particular well; this time, well 4.
The different calibrations that have been extracted for that particular well is
observed, for example, the gamma ray log that describes the lithology of the area by
showing the gamma content; given that low
gamma signifies a sandstone formation while high gamma signifies a shale
formation.
Next, the density-neutron log is also observed; this helps to identify the type of
fluid content present in the formation which could be filled with either gas, oil or water.
The density log determines the amount of electron density within the formation by
quantifying the number of emitted gamma rays that collide with the electrons in the
formation and got scattered.
Figure 6: Well log data for well 4 after being loaded on the well section window of the Petrel
software
The neutron log, which is also taken, helps
to identify the amount of hydrogen concentration within the formation. In figure
6, the density-neutron log is a crossover, this is because water has a higher density
than oil and gas; it also has a higher neutron value than oil and gas. Hence, the formation
of hydrocarbon content is identified through formations that have a balloon shape
density-neutron log which indicates that
such formation has low density and low
neutron value. The resistivity log is also observed amongst
the loaded well data. This helps to separate formations that contain water from
formations that contain hydrocarbon. A peak in the resistivity log in figure 6 is
noted as hydrocarbons have a higher value of resistivity compared to water whose
resistivity value is low.
18 Makinde V., Bello R., Omeike M. O. and Aikhuele D. O.: Porosity Prediction of I-Field in the Niger Delta Area Using…
There are other logs whose measurements have been taken into account, but however,
may not be necessary for the purpose of this research. Some of these logs include depth
log, caliper log, water saturation log, sonic log, among others.
All these logs can be used to identify formations with amplitude variation below
the subsurface of the earth. They can also be used to generate acoustic impedance and in
turn a synthetic seismogram which is the true representation of the seismic traces
attained below the subsurface as opposed to the data obtained from the seismograph
during the acquisition of seismic data. The synthetic seismogram and the data obtained
from seismic acquisition will be compared in the well to seismic tie phase.
It is important to note that two lines are
visibly cutting across the well section; these are lines that map the top and base of the
reservoir formation as obtained from all the logs from which data have been extracted.
This is one of the most important reasons for uploading the well log data so as to help
in separating formations that contain hydrocarbon from those containing water,
and also to identify reservoirs in I-field that exist within the vertical formation of the sub
surface.
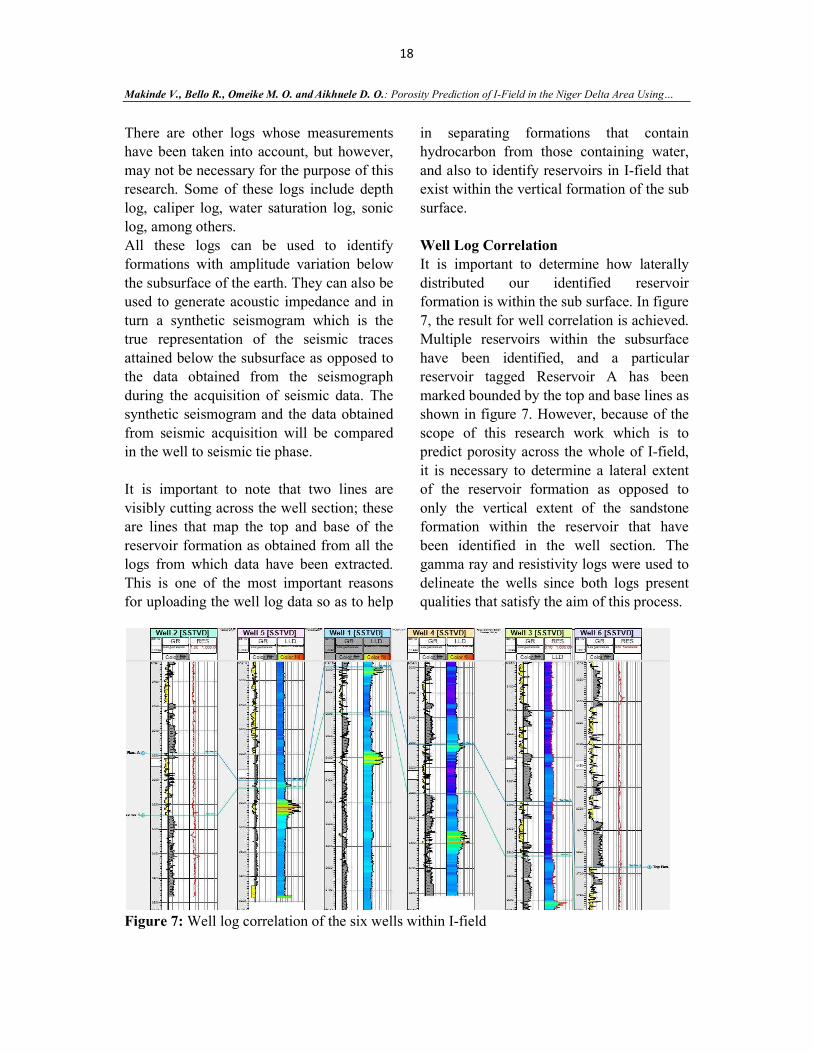
Well Log Correlation It is important to determine how laterally
distributed our identified reservoir formation is within the sub surface. In figure
7, the result for well correlation is achieved. Multiple reservoirs within the subsurface
have been identified, and a particular reservoir tagged Reservoir A has been
marked bounded by the top and base lines as shown in figure 7. However, because of the
scope of this research work which is to predict porosity across the whole of I-field,
it is necessary to determine a lateral extent of the reservoir formation as opposed to
only the vertical extent of the sandstone formation within the reservoir that have
been identified in the well section. The gamma ray and resistivity logs were used to
delineate the wells since both logs present qualities that satisfy the aim of this process.
Figure 7: Well log correlation of the six wells within I-field
19 Scientia Africana, Vol. 15 (No. 1), June 2016. Pp 11-32 © Faculty of Science, University of Port Harcourt, Printed in Nigeria ISSN 1118 – 1931
The gamma ray log was used to identify the shale/clay formation and also the sandstone
formation across all the six wells that penetrate I-field at different locations while
the resistivity log was used to identify the presence of hydrocarbon content within the
said formation.
Chrono - stratigraphy correlation that involves using the log motif of the
shale/clay formation is used to ensure that the same reservoir is observed across the six
wells because unlike sandstone formations, shale formation is laterally extensive and is
less prone to changes as a result of its non-porous nature. It is possible to observe the
same shale across all wells than to identify the same sandstone formation across the six
wells.
There is an upward and downward trend in reservoir variation across the six wells and
not necessarily side by side in terms of depth, this can be as a result of the different
faults acting below the subsurface within I-field. Some sandstone formations are of
little volume visually (well 5) compared to what was obtained in some other wells (well
2 & well 4) while the shale/clay formation look almost similar across the six wells.
This shale acts as a seal for the reservoir. The shale above the reservoir or the shale
below the reservoir can therefore be used to correlate the well log data.
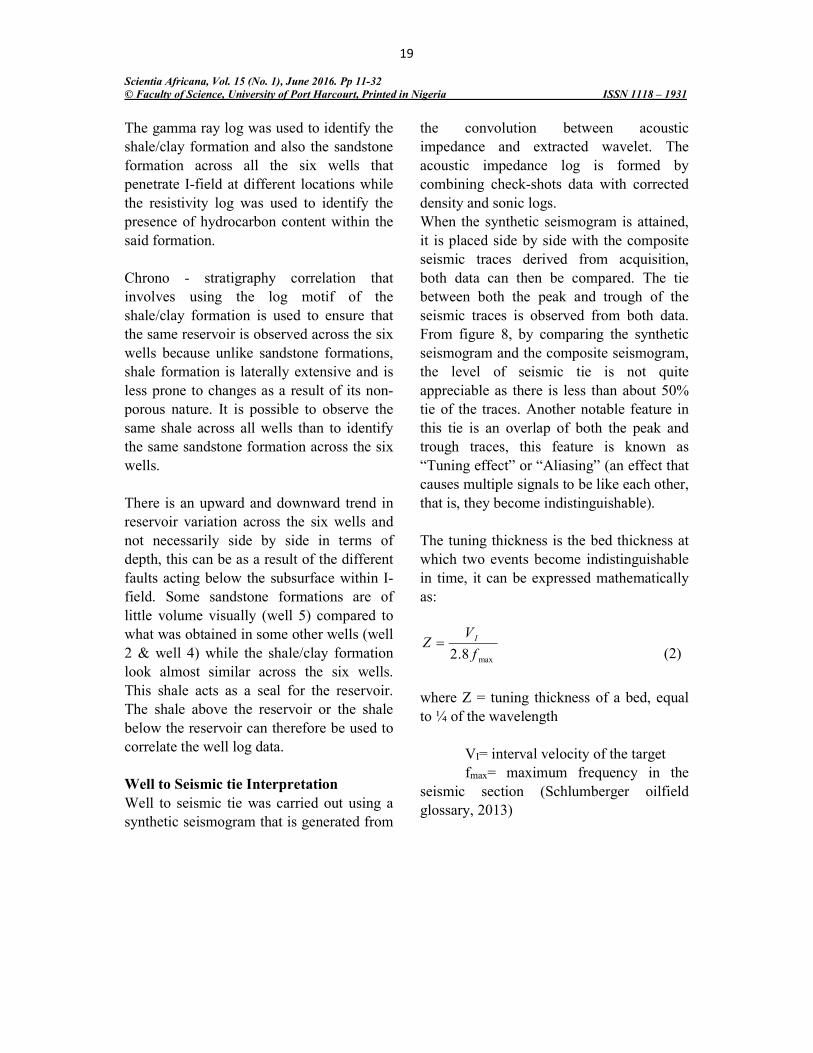
Well to Seismic tie Interpretation
Well to seismic tie was carried out using a synthetic seismogram that is generated from
the convolution between acoustic impedance and extracted wavelet. The
acoustic impedance log is formed by combining check-shots data with corrected
density and sonic logs. When the synthetic seismogram is attained,
it is placed side by side with the composite seismic traces derived from acquisition,
both data can then be compared. The tie between both the peak and trough of the
seismic traces is observed from both data. From figure 8, by comparing the synthetic
seismogram and the composite seismogram, the level of seismic tie is not quite
appreciable as there is less than about 50% tie of the traces. Another notable feature in
this tie is an overlap of both the peak and trough traces, this feature is known as
“Tuning effect” or “Aliasing” (an effect that causes multiple signals to be like each other,
that is, they become indistinguishable).
The tuning thickness is the bed thickness at which two events become indistinguishable
in time, it can be expressed mathematically as:
max8.2 f
VZ I
(2)
where Z = tuning thickness of a bed, equal
to ¼ of the wavelength
VI= interval velocity of the target fmax= maximum frequency in the
seismic section (Schlumberger oilfield glossary, 2013)
20 Makinde V., Bello R., Omeike M. O. and Aikhuele D. O.: Porosity Prediction of I-Field in the Niger Delta Area Using…
Figure 8: Well to Seismic tie in well 4 formation
Structural Interpretation
Once the reservoir to be delineated is identified from the well logs, petrophysical
analysis to determine the porosity values within the six wells could be carried out.
Figure 9 shows how each inline and cross line visually behaves when horizons and
faults associated with that particular grid have been picked; the same goes for the
whole seismic grid comprising of about 65 sections for both inline and cross line.
Figure 10 shows the result obtained from manually picking the horizon at the top of
the reservoir.
Some interesting anomalies in the interpretation window in figure 9 is
observed, such as the amplitude of seismic traces and the various types of faults that
delineate the formation below the subsurface. The categories of faults found in
this formation are both the normal faults and
the reverse faults. A fault is described as the
discontinuity in the volume of a rock, along the fractures across which there has been
significant displacement as a result of the movement of the earth.
For a normal fault and reverse fault as
characterised in our formation above, the hanging wall is noted moving downwards
relative to the footwall for the normal fault while in the reverse fault, the hanging wall
is moving upward relative to the footwall. This is what is visible in figure 9 above as
faults 2 and 4 describes the normal faults while faults 1 and 3 describes the reverse
fault. The direction of the faults was also identified.
Figure 11 shows the end result of manually picking the horizon and faults across the
survey area and developing a structural framework of how the reservoir is expected
to be viewed from the top of the reservoir.

21 Scientia Africana, Vol. 15 (No. 1), June 2016. Pp 11-32 © Faculty of Science, University of Port Harcourt, Printed in Nigeria ISSN 1118 – 1931
Figure 9: Interpretation window showing the horizon delineating the top of the reservoir and
the different faults acting below the subsurface characterising the geology of the area
Figure 10: Seismic grid of the study area showing horizon pick across the inline and cross
line following a 10 * 10 grid positioning

22 Makinde V., Bello R., Omeike M. O. and Aikhuele D. O.: Porosity Prediction of I-Field in the Niger Delta Area Using…
Figure 11: 3-D view of the reservoir model (structural framework) in time showing the
boundaries of the reservoir along the survey area.
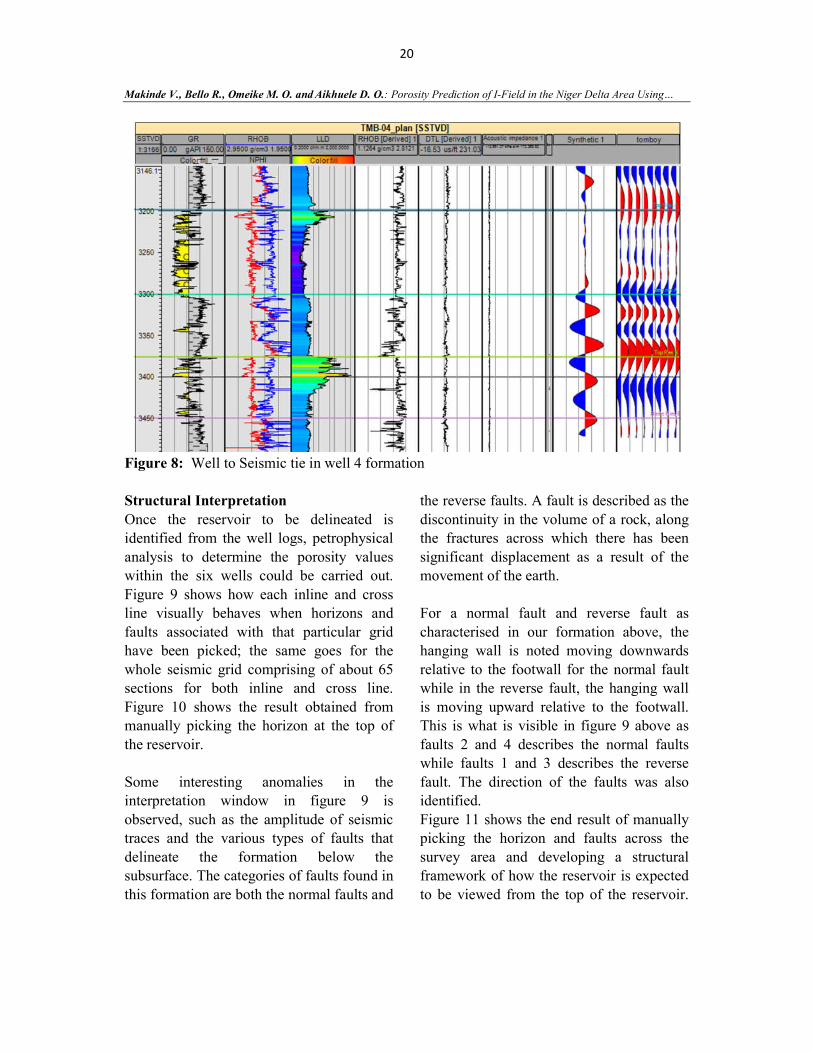
Time and Depth Map Interpretation
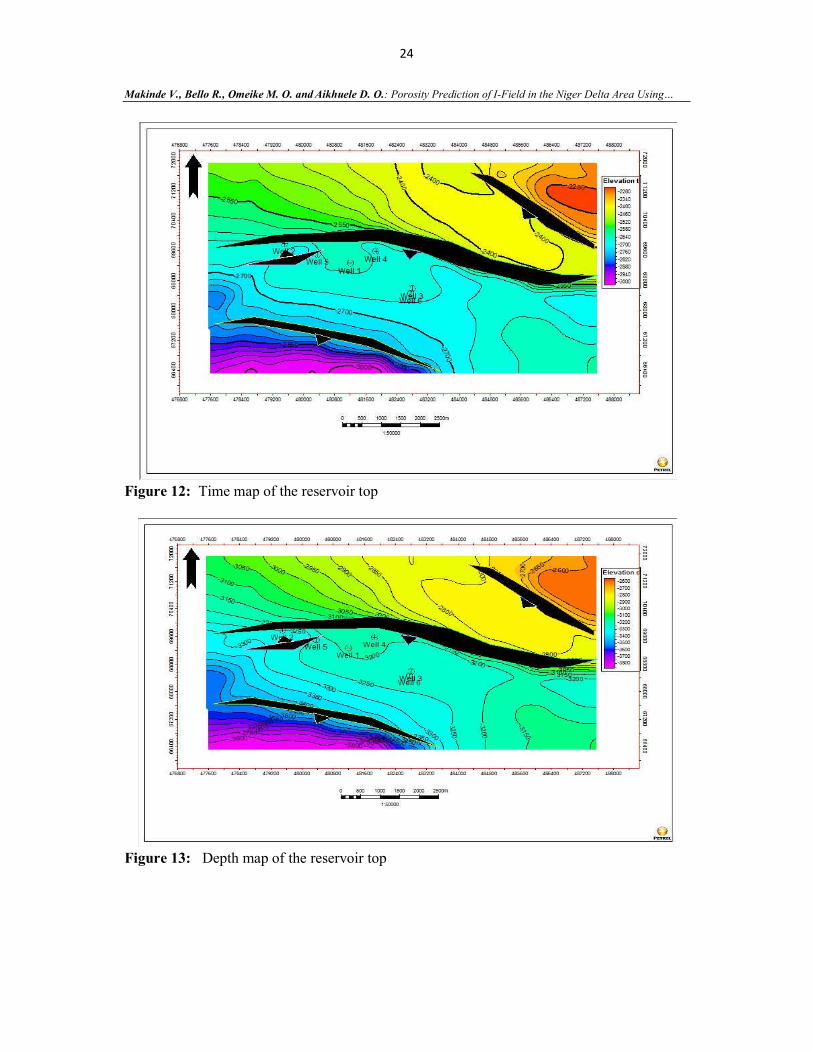
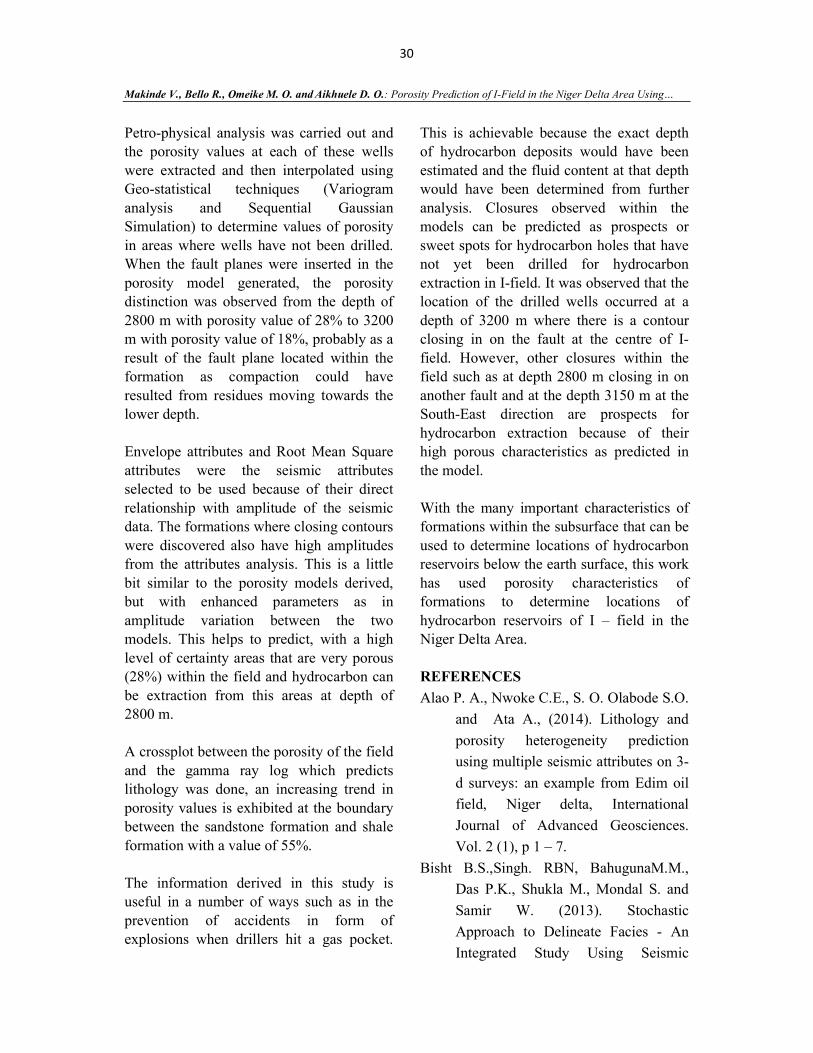
Figures 12 and 13 show the time map and depth map respectively, of the top of the
reservoir. Gradually the reservoir begins to take shape and the true structural form of
the survey area is observed below the subsurface, within the time/depth map
where contours have been formed. It is observed that close contours could represent
traps for hydrocarbon content as delineated by the petroleum system of the Niger Delta
region.
Most of the traps of the Niger Delta are fault
supported hence more interest will lie on areas where there is a contour closing on a
fault and characterized by a peak in resistivity on the resistivity log. Further tests
such as fault synch analysis, among others, can be carried out to confirm if it is a trap
for hydrocarbon deposits. For the purpose of this research work, in identifying areas of
high porosity, locations with closed contours are noted as they are likely to be
areas of high porosity values.
Figure 12: Time map of the reservoir top
23 Scientia Africana, Vol. 15 (No. 1), June 2016. Pp 11-32 © Faculty of Science, University of Port Harcourt, Printed in Nigeria ISSN 1118 – 1931
Figure 13: Depth map of the reservoir top
The direction of the fault planes was also
observed in the time and depth map of figure 12 and 13. The fault planes are
characterized by the black bold lines cutting across segments of the study area, four
distinct faults were identified (F1 delineating an elevation area of -2800 to -
3150, F2 delineating -3200 to -3400, F3 delineating a segment within the contour
values ranging between -3250 and -3300, F4 delineating -3400 to -3800). The upward
and downward throws of the fault are also included in the maps, with faults F1, F2 and
F4 having a downward direction and a dip, however, F3 has an upward throw closing
on fault F1.
To generate the depth map as in figure 13, a velocity model is developed. It makes use of
check shots data (a type of borehole seismic data designed to measure the seismic travel
time from the surface to a known depth;
Schlumberger, 2014) and converts each
individual value of time into depth. This is necessary because the drillers are interested
in depth when ready to drill in the formation during production of hydrocarbon.
However, since seismic data is recorded in time, there is a need to convert the values
extracted in time into depth. Basically, what is done is that, a time value that corresponds
with the nearest check shot value is identified and a simultaneous equation to
determine the corresponding values for the depth of that time value is achieved.
For example, to determine the depth value
of 2460s knowing the nearest check shot value in time and depth to be 2478ms ~
9518m, from our calculations, there is an equivalent of 9449m ~ 2460ms. At the end
of which gives a corresponding value in depth for the horizon (top of well) for each
of the wells as shown in figure 14.
24 Makinde V., Bello R., Omeike M. O. and Aikhuele D. O.: Porosity Prediction of I-Field in the Niger Delta Area Using…
Figure 12: Time map of the reservoir top
Figure 13: Depth map of the reservoir top

25 Scientia Africana, Vol. 15 (No. 1), June 2016. Pp 11-32 © Faculty of Science, University of Port Harcourt, Printed in Nigeria ISSN 1118 – 1931
Figure 14: Velocity model showing conversion from time to depth of horizon (column E is
depth of reservoir top from Well Logs while column F is depth of reservoir top from Seismic Sections)
Porosity Model Analysis
Once the structural framework was generated by giving a volume to the
reservoir with edges surrounding the top and base of the reservoir and faults interplaying
within the formation, the next step was to generate the porosity model using this
structural framework and geo-statistics. The structural framework is composed of small
cells called geo-cells which could be thousands or millions within the reservoir
model and these geo-cells are attributed with values. In the methodology, the wells
were up scaled where each cell within this framework that is penetrated by a well is
attributed with a discrete porosity value extracted; hence for all wells, there is a
discrete porosity value for each geo-cell that is penetrated. However, there are still no
values for areas where there are no wells
and here geo-statistical analysis is done. The
geo-statistics method that are applicable here are Variogram analysis and Sequential
Gaussian simulation. When geo-statistics is done, a model is achieved as shown in
figure 15. There are multiple realizations as shown in figure 16 since Sequential
Gaussian Simulation is probabilistic and the best realization that describes the porosity
model desired is selected.
Figure 17 shows the faults included in the porosity model, the faults supports the traps
formation as the contours close around the faults as earlier seen in figures 11 and 12.
The porosity model reveals an area of high porosity at the -2800 m contour as to the -
3200 m contour closing on the fault F2 plane.

26 Makinde V., Bello R., Omeike M. O. and Aikhuele D. O.: Porosity Prediction of I-Field in the Niger Delta Area Using…
Figure 15:2-D Porosity model for survey area showing wells penetrating the reservoir
Figure 16: Petrel model window showing multiple realizations of porosity model analysis
generated by the Sequential Gaussian Simulation
Figure 17: 3-D porosity model showing fault planes that interplay within the formation

27 Scientia Africana, Vol. 15 (No. 1), June 2016. Pp 11-32 © Faculty of Science, University of Port Harcourt, Printed in Nigeria ISSN 1118 – 1931
Envelope Attribute Analysis Areas of high amplitude can be suggested to be areas of increased porosity due to the increased reflection strength observed in such areas. It is observed in figure 15 that there exist some bright spots that depict high amplitude variation with other formations within the subsurface, however for a clearer view as to the representation of what is seen, the result is constrained with the envelope attribute because of its relationship with amplitude. It is also seen in figure 18 that areas of suspected increased porosity values reveal bright spots mostly at depth 2800 m which forms an area of interest as a result of the anomaly in this
region and also at depth 3200 m located in the central region of the survey area where some of the exploration wells have been sited close to the fault plane interplaying within the formation. If the regions where the wells are located in this model are compared with the porosity values derived from the well logs, there will be a significant similarity as it is known that porosity always mimic the kind of depositional environment within the formation. Hence, a shale strata will mimic regions of low porosity while regions of sandstones deposition will display regions of high porosity.
Figure 18: 2-D porosity model incorporated with Envelope attribute
Figure 19: 3-D porosity model incorporated with envelope amplitude attribute

28 Makinde V., Bello R., Omeike M. O. and Aikhuele D. O.: Porosity Prediction of I-Field in the Niger Delta Area Using…
Root Mean Square Amplitude Analysis Root Mean Square amplitude attribute is an
attribute that is computed over a time window independently for each trace which
unlike some other attributes based on time associated with multiple horizons, derives
its results from a single horizon. Mostly, its time window is always over 24 ms
(Pennington, 1997). Figures 20 and 21 respectively show the 2-D and 3-D Root
Mean Square (RMS) amplitude attribute guided porosity model. The horizon being
taken into consideration here is the top of
the reservoir and the results is seen in figure 20 as the variation in the amplitude becomes
clearer and the upward progression (North-East) of porosity becomes more visible.
Areas of suspected increased porosity
values reveal bright spots mostly at depth 2800 m just as in figure 19, which forms an
area of interest as a result of the anomaly in this region and also at depth 3200 m which
is located in the central region of the survey area where some exploration wells have
penetrated the formation.
Figure 20: 2-D porosity model incorporated with RMS amplitude attribute
Figure 21: 3-D porosity model incorporated with RMS amplitude attribute

29 Scientia Africana, Vol. 15 (No. 1), June 2016. Pp 11-32 © Faculty of Science, University of Port Harcourt, Printed in Nigeria ISSN 1118 – 1931
Cross-Plot Analysis Figure 22 shows the crossplot of the
porosity log with gamma ray log that describes the relationship between these two
parameters. At the distinguishing value of the gamma ray log that separates the
sandstone formation from the shale formation, there is a distinction in the
variation of porosity from both formations as was observed in the increase in porosity
for the lower gamma ray values of 0 to55 and a decrease in porosity from the upper
gamma ray values of 55 to 150. This goes to prove that in the sandstone formation, the
porosity is high as compared to the shale formation that has low porosity.
Figure 22: Crossplot of Porosity with gamma ray log
DISCUSSION
This study has developed a framework by which the porosity of formation within an
exploration field, in this case the I-field could be determined using seismic attributes
and geo-statistics methods. From this study, a lot has been achieved with this process of
incorporating well-log data and seismic attributes in predicting porosity. When the
well-log data was loaded into the PETREL software used, multiple reservoirs were
identified beneath the subsurface of I-field as a result of the peak variation in resistivity
increase. Gamma ray log helped in identifying lithology distinguishing between
sandstone formation and shale formation. The density-neutron log was used in
identifying the fluid content as hydrocarbon.
This study has been used to delineate the reservoir identified, as the well logs of the
formation were correlated using the log motif of the shale to be able to observe how
laterally extensive is the identified reservoir within the formation.
Time and depth maps of the reservoir were
generated and how the fault planes affect the formation down the depths were observed.
Four different fault planes were observed, with three of these faults (F1, F2, and F4)
having a downthrown while one (F3) has an up-throw direction. Closing contours at
depth 2800 m and 3200 m were also observed.
30 Makinde V., Bello R., Omeike M. O. and Aikhuele D. O.: Porosity Prediction of I-Field in the Niger Delta Area Using…
Petro-physical analysis was carried out and the porosity values at each of these wells
were extracted and then interpolated using Geo-statistical techniques (Variogram
analysis and Sequential Gaussian Simulation) to determine values of porosity
in areas where wells have not been drilled. When the fault planes were inserted in the
porosity model generated, the porosity distinction was observed from the depth of
2800 m with porosity value of 28% to 3200 m with porosity value of 18%, probably as a
result of the fault plane located within the formation as compaction could have
resulted from residues moving towards the lower depth.
Envelope attributes and Root Mean Square
attributes were the seismic attributes selected to be used because of their direct
relationship with amplitude of the seismic data. The formations where closing contours
were discovered also have high amplitudes from the attributes analysis. This is a little
bit similar to the porosity models derived, but with enhanced parameters as in
amplitude variation between the two models. This helps to predict, with a high
level of certainty areas that are very porous (28%) within the field and hydrocarbon can
be extraction from this areas at depth of 2800 m.
A crossplot between the porosity of the field
and the gamma ray log which predicts lithology was done, an increasing trend in
porosity values is exhibited at the boundary between the sandstone formation and shale
formation with a value of 55%.
The information derived in this study is useful in a number of ways such as in the
prevention of accidents in form of explosions when drillers hit a gas pocket.
This is achievable because the exact depth of hydrocarbon deposits would have been
estimated and the fluid content at that depth would have been determined from further
analysis. Closures observed within the models can be predicted as prospects or
sweet spots for hydrocarbon holes that have not yet been drilled for hydrocarbon
extraction in I-field. It was observed that the location of the drilled wells occurred at a
depth of 3200 m where there is a contour closing in on the fault at the centre of I-
field. However, other closures within the field such as at depth 2800 m closing in on
another fault and at the depth 3150 m at the South-East direction are prospects for
hydrocarbon extraction because of their high porous characteristics as predicted in
the model.
With the many important characteristics of formations within the subsurface that can be
used to determine locations of hydrocarbon reservoirs below the earth surface, this work
has used porosity characteristics of formations to determine locations of
hydrocarbon reservoirs of I – field in the Niger Delta Area.
REFERENCES
Alao P. A., Nwoke C.E., S. O. Olabode S.O.
and Ata A., (2014). Lithology and
porosity heterogeneity prediction
using multiple seismic attributes on 3-
d surveys: an example from Edim oil
field, Niger delta, International
Journal of Advanced Geosciences.
Vol. 2 (1), p 1 – 7.
Bisht B.S.,Singh. RBN, BahugunaM.M.,
Das P.K., Shukla M., Mondal S. and
Samir W. (2013). Stochastic
Approach to Delineate Facies - An
Integrated Study Using Seismic
31 Scientia Africana, Vol. 15 (No. 1), June 2016. Pp 11-32 © Faculty of Science, University of Port Harcourt, Printed in Nigeria ISSN 1118 – 1931
Attributes and Facies Logs on a
Clastic Oil & Gas Reservoir of
Western onland Basin of India: 10th
Biennial International Conference &
Exposition p146.
Deutsch, C.V. (2002). Geo-statistical
Reservoir Modeling, Oxford
University Press,New York, p. 376.
Doust H. and Omatsola E. (1989). Niger
Delta. American Association of
Petroleum Geologists Memoir, Vol.
48, p 201-238
Doust H. and Omatsola E. (1990). Niger
Delta AAPG Memoir 48, American
Association of Petroleum Geologists,
Tulsa. Vol. 48, p 239-248.
Doveton J.H. (1994). Geologic log analysis
using computer methods. Am. Assoc.
Petrol. Geol. Computer Applications
in Geology No 2, p 256.
Dubruble O. (1998). Geo-statistics in
Petroleum Geology. AAPG Education
Course Note, Series #38.
Hospers, J. (1965). Gravity field and
structures of the Niger delta, Nigeria,
West Africa: Geological Society of
America Bullelin, Vol. 76, p 407-422.
Kaplan A., Lusser C. U. and Norton I.O.,
(1994). Tectonic map of the World,
panel 10: Tulsa, American
Association of Petroleum Geologists,
scale 1:10.000.000.
Kelkar, M. and Perez, G. (2002). Applied
Geo-statistics for Reservoir
Characterization, Society of
Petroleum Engineers, Richardson, pg.
264.
Klett T.R., Ahlbrandt T.S., Schmoker J.W.,
and Dolton J.L., (1997). Ranking of
the world’s oil and gas provinces by
known petroleum volumes: U.S.
Geological Survey Open-file report-
97-463, CD-ROM.
Kulke, H. (1995). Regional petroleum
geology of the world. Part II: Africa,
America, Australia and Antarctica:
Berlin, GebrüderBorntraeger, 143-
172.
Leiphart, D.J., and Hart, B.S., (2001).
Comparison Of Linear Regression
And A Probabilistic Neural Network
To Predict Porosity From 3-D Seismic
Attributes In Lower Brushy Canyon
Channeled Sandstones, southeast New
Mexico, Geophysics 66, 1349-1358.
Malvic T. and Prskalo S. (2008).
Significance of the amplitude attribute
in porosity prediction, Drava
Depression Case Study. NAFTA Vol.
59 (1), p39-46.
Norkhamboot T. and Wongpornchai P.
(2012). Porosity Prediction Using
Seismic Attribute Analysis And Well
Log Data In An Area Of Gulf Of
Thailand, Department of Geological
Sciences, Faculty of Science, Chiang
Mai University, Chiang Mai, 50200,
Thailand 38th Congress on Science
and Technology of Thailand.
Nwachukwu, J.I. and Chukwurah, P.I.
(1986). Organic matter of Agbada
Formation, Niger Delta, Nigeria:
American Association of Petroleum
Geologists Bulletin, Volume 70, pp
48-55.
Ogiesoba, O. C., (2010). Porosity prediction
from seismic attributes of Ordovician
Trenton BlackRiver groups, Rochester
32 Makinde V., Bello R., Omeike M. O. and Aikhuele D. O.: Porosity Prediction of I-Field in the Niger Delta Area Using…
field, Southern Ontario. The American
Association of Petroleum Geologists.
Vol. 94(11), p 1657-1672.
Okiwelu A. A. and Ude I. A. (2016). 3D
Modelling and Basement Tectonics of
the Niger Delta Basin from
Aeromagnetic Data
www.cdn.interchopen.com/pdfs-
wm/37849.pdf
Pennington, W. D. (1997). Seismic
Petrophysics—An Applied Science
for Reservoir Geophysics. The
Leading Edge 16 (3): p 241.
Rouhani S., Srivastava R.M., Cromer M.V.,
Johnson A.I., Desbarats A.J. (1996).
“Geostatistical Estimation: Kriging”
Geostatistics For Environmental And
Geotechnical Applications, American
society for testing and materials.
Schlumberger Oilfield Glossary 2014
Schultz, P. S, Ronen, S. H. and Corbett, C.,
(1994) Seismic-Guided Estimation
ofLog Properties: Part 1: A Data-
Driven Interpretation Methodology,
the Leading Edge 13, 305-315.
Tebo, J.M. and Hart, B.S. (2003), 3-D
Seismic Attribute Study For Reservoir
Characterization of Carbonate
Buildups Using A Volume-Based
Method, CSPG/CSEGJoint
convention, June 2-6.
Tuttle, M.L.W., Charpentier, R.R., and
Brownfield, M.E. (1999), “The Niger
Delta Basin Petroleum System: Niger
Delta Province, Nigeria, Cameroon,
and Equatorial Guinea, Africa”. Open-
File Report 99-50-H. United States
Geological Survey: Washington, D.C.
44.