Embed Size (px)
Citation preview

Ps
Aa
b
c
a
ARRA
KSCCDx
1
ct(i(daoowaptsgso
O
h1
International Journal of Greenhouse Gas Control 25 (2014) 93–101
Contents lists available at ScienceDirect
International Journal of Greenhouse Gas Control
j ourna l h o mepage: www.elsev ier .com/ locate / i jggc
ore-scale observations of supercritical CO2 drainage in Bentheimerandstone by synchrotron x-ray imaging
nna L. Herringa,∗, Linnéa Anderssona, D.L. Newellb, J.W. Careyc, Dorthe Wildenschilda
School of Chemical, Biological and Environmental Engineering, Oregon State University, Corvallis, OR, USAUtah State University, Department of Geology, Logan, UT, USAEarth and Environmental Sciences Division (EES), Los Alamos National Laboratory, Los Alamos, NM, USA
r t i c l e i n f o
rticle history:eceived 6 February 2014eceived in revised form 1 April 2014ccepted 3 April 2014
eywords:upercritical CO2
a b s t r a c t
This work utilizes synchrotron-based x-ray computed microtomography (x-ray CMT) imaging to quantifythe volume and topology of supercritical carbon dioxide (scCO2) on a pore-scale basis throughout theprimary drainage process of a 6 mm diameter Bentheimer sandstone core. Experiments were performedwith brine and scCO2 at 8.3 MPa (1200 psi) and 37.5 ◦C. Capillary pressure–saturation curves for the scCO2-brine system are presented and compared to the ambient air-brine system, and are shown to overlay oneanother when pressure is normalized by interfacial tension. Results are analyzed from images with a
arbon sequestrationapillary fingeringrainage-ray microtomography
voxel resolution of 4.65 �m; image-based evidence demonstrates that scCO2 invades the pore space ina capillary fingering regime at a mobility ratio M = 0.03 and capillary number Ca = 10−8.6 to an end-of-drainage brine saturation of 9%. We provide evidence of the applicability of previous two-dimensionalmicromodel studies and ambient condition experiments in predicting flow regimes occurring duringscCO2 injection.
© 2014 Elsevier Ltd. All rights reserved.
. Introduction
Geologic carbon sequestration has been proposed as a potentiallimate change mitigation strategy to prevent emissions of CO2o the atmosphere from large fossil-fuel burning point sourcesIPCC, 2005). In geologic sequestration, supercritical CO2 (scCO2)s injected into saline groundwater hosted in a porous aquiferi.e. a brine drainage process), thus producing an immiscibleisplacement scenario where scCO2 is the non-wetting (NW) fluidnd brine is the wetting (W) fluid. Subsequently scCO2 is mobilizedr trapped by capillary forces when brine reenters the pore spacef the geologic matrix (i.e. the brine imbibition process) duringater flooding or buoyant CO2 migration. There are concerns
ssociated with the long-term stability of a mobile subsurface CO2lume, so drainage and imbibition should be carefully engineeredo facilitate favorable trapping conditions. Capillary trapping ofcCO2, wherein the CO2 is held within the pore structure of the
eologic matrix by capillary forces, is a safer form of subsurfacetorage than hydrodynamic or structural trapping, which reliesn a low permeability caprock to contain the buoyant CO2 plume;∗ Corresponding author at: 103 Gleeson Hall, Oregon State University, Corvallis,R 97331, USA. Tel.: +1 970 629 3174; fax: +1 541 737 4600.
E-mail address: [email protected] (A.L. Herring).
ttp://dx.doi.org/10.1016/j.ijggc.2014.04.003750-5836/© 2014 Elsevier Ltd. All rights reserved.
additionally, capillary trapping occurs on vastly shorter timescalesthan reactive trapping methods (i.e. dissolution trapping andmineral trapping) (IPCC, 2005; Qi et al., 2009). To understand themultiphase physics of CO2 transport and to make quantitativeestimations of potential CO2 capillary trapping in saline aquifers, itis necessary to study field, core, and pore-scale processes. Experi-ments at geological reservoir conditions at the core and pore-scalein combination with x-ray computed microtomography (x-rayCMT) allow for three-dimensional (3D) in situ visualization of fluidphases and the physical structure within a porous medium (Bluntet al., 2013; Ketcham and Carlson, 2001; Wildenschild et al., 2002)and have the potential to provide insight into the engineeredprocess of geologic CO2 sequestration to achieve high volumetrapping of CO2. An overview of recent advances in pore-scalecharacterization of structure and flow processes via x-ray CMTtechnology can be found in Wildenschild and Sheppard (2013).
A number of studies have indicated that capillary trapping ofscCO2 may be maximized via manipulation of the temperature,pressure, salinity, and flow rates of the CO2 and brine injectionssuch that the CO2-brine interactions are most conducive to cap-illary trapping (Bachu and Bennion, 2008b; Wildenschild et al.,
2011). Studies of general flow regimes in simple model systems,such as glass beads (Morrow et al., 1988; Polak et al., 2011) andtwo-dimensional (2D) micromodels (Lenormand et al., 1988; Wanget al., 2012; Zhang et al., 2011), have demonstrated the transitions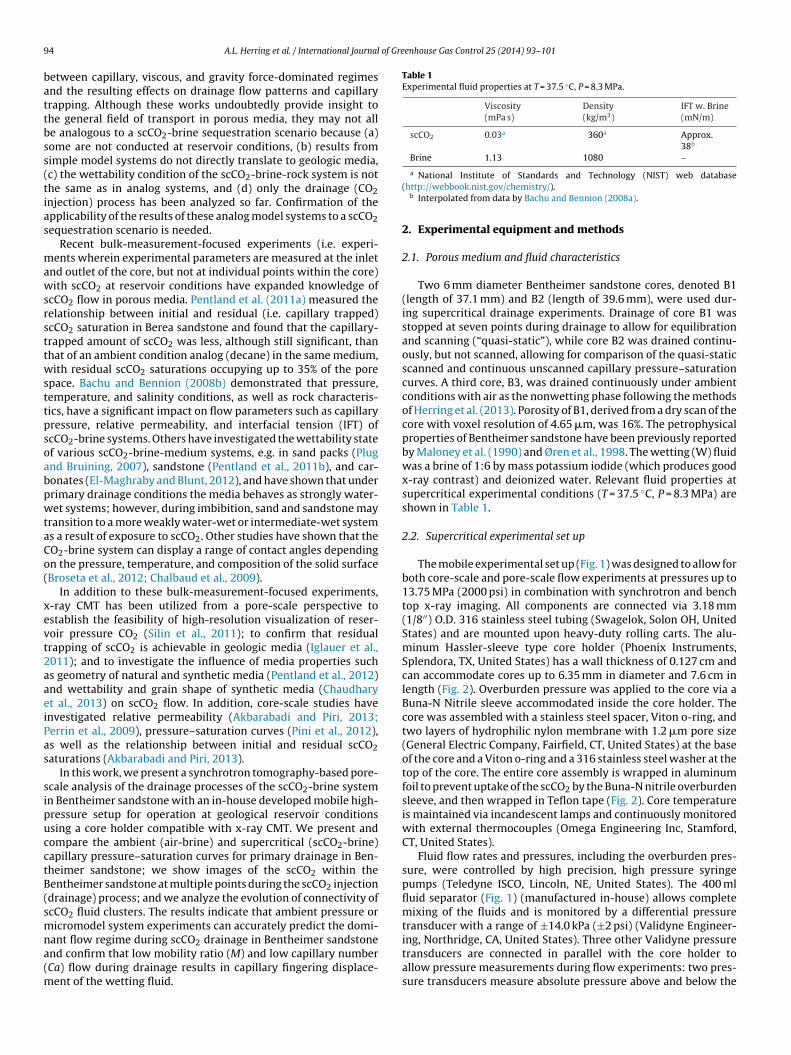
9 of Greenhouse Gas Control 25 (2014) 93–101
battbss(tias
mawsrsttwsttpsoabpwtaCo(
xevt2aaeiPas
sipucctB(smna(m
Table 1Experimental fluid properties at T = 37.5 ◦C, P = 8.3 MPa.
Viscosity(mPa s)
Density(kg/m3)
IFT w. Brine(mN/m)
scCO2 0.03a 360a Approx.38b
Brine 1.13 1080 –
4 A.L. Herring et al. / International Journal
etween capillary, viscous, and gravity force-dominated regimesnd the resulting effects on drainage flow patterns and capillaryrapping. Although these works undoubtedly provide insight tohe general field of transport in porous media, they may not alle analogous to a scCO2-brine sequestration scenario because (a)ome are not conducted at reservoir conditions, (b) results fromimple model systems do not directly translate to geologic media,c) the wettability condition of the scCO2-brine-rock system is nothe same as in analog systems, and (d) only the drainage (CO2njection) process has been analyzed so far. Confirmation of thepplicability of the results of these analog model systems to a scCO2equestration scenario is needed.
Recent bulk-measurement-focused experiments (i.e. experi-ents wherein experimental parameters are measured at the inlet
nd outlet of the core, but not at individual points within the core)ith scCO2 at reservoir conditions have expanded knowledge of
cCO2 flow in porous media. Pentland et al. (2011a) measured theelationship between initial and residual (i.e. capillary trapped)cCO2 saturation in Berea sandstone and found that the capillary-rapped amount of scCO2 was less, although still significant, thanhat of an ambient condition analog (decane) in the same medium,ith residual scCO2 saturations occupying up to 35% of the pore
pace. Bachu and Bennion (2008b) demonstrated that pressure,emperature, and salinity conditions, as well as rock characteris-ics, have a significant impact on flow parameters such as capillaryressure, relative permeability, and interfacial tension (IFT) ofcCO2-brine systems. Others have investigated the wettability statef various scCO2-brine-medium systems, e.g. in sand packs (Plugnd Bruining, 2007), sandstone (Pentland et al., 2011b), and car-onates (El-Maghraby and Blunt, 2012), and have shown that underrimary drainage conditions the media behaves as strongly water-et systems; however, during imbibition, sand and sandstone may
ransition to a more weakly water-wet or intermediate-wet systems a result of exposure to scCO2. Other studies have shown that theO2-brine system can display a range of contact angles dependingn the pressure, temperature, and composition of the solid surfaceBroseta et al., 2012; Chalbaud et al., 2009).
In addition to these bulk-measurement-focused experiments,-ray CMT has been utilized from a pore-scale perspective tostablish the feasibility of high-resolution visualization of reser-oir pressure CO2 (Silin et al., 2011); to confirm that residualrapping of scCO2 is achievable in geologic media (Iglauer et al.,011); and to investigate the influence of media properties suchs geometry of natural and synthetic media (Pentland et al., 2012)nd wettability and grain shape of synthetic media (Chaudharyt al., 2013) on scCO2 flow. In addition, core-scale studies havenvestigated relative permeability (Akbarabadi and Piri, 2013;errin et al., 2009), pressure–saturation curves (Pini et al., 2012),s well as the relationship between initial and residual scCO2aturations (Akbarabadi and Piri, 2013).
In this work, we present a synchrotron tomography-based pore-cale analysis of the drainage processes of the scCO2-brine systemn Bentheimer sandstone with an in-house developed mobile high-ressure setup for operation at geological reservoir conditionssing a core holder compatible with x-ray CMT. We present andompare the ambient (air-brine) and supercritical (scCO2-brine)apillary pressure–saturation curves for primary drainage in Ben-heimer sandstone; we show images of the scCO2 within theentheimer sandstone at multiple points during the scCO2 injectiondrainage) process; and we analyze the evolution of connectivity ofcCO2 fluid clusters. The results indicate that ambient pressure oricromodel system experiments can accurately predict the domi-
ant flow regime during scCO2 drainage in Bentheimer sandstonend confirm that low mobility ratio (M) and low capillary numberCa) flow during drainage results in capillary fingering displace-
ent of the wetting fluid.
a National Institute of Standards and Technology (NIST) web database(http://webbook.nist.gov/chemistry/).
b Interpolated from data by Bachu and Bennion (2008a).
2. Experimental equipment and methods
2.1. Porous medium and fluid characteristics
Two 6 mm diameter Bentheimer sandstone cores, denoted B1(length of 37.1 mm) and B2 (length of 39.6 mm), were used dur-ing supercritical drainage experiments. Drainage of core B1 wasstopped at seven points during drainage to allow for equilibrationand scanning (“quasi-static”), while core B2 was drained continu-ously, but not scanned, allowing for comparison of the quasi-staticscanned and continuous unscanned capillary pressure–saturationcurves. A third core, B3, was drained continuously under ambientconditions with air as the nonwetting phase following the methodsof Herring et al. (2013). Porosity of B1, derived from a dry scan of thecore with voxel resolution of 4.65 �m, was 16%. The petrophysicalproperties of Bentheimer sandstone have been previously reportedby Maloney et al. (1990) and Øren et al., 1998. The wetting (W) fluidwas a brine of 1:6 by mass potassium iodide (which produces goodx-ray contrast) and deionized water. Relevant fluid properties atsupercritical experimental conditions (T = 37.5 ◦C, P = 8.3 MPa) areshown in Table 1.
2.2. Supercritical experimental set up
The mobile experimental set up (Fig. 1) was designed to allow forboth core-scale and pore-scale flow experiments at pressures up to13.75 MPa (2000 psi) in combination with synchrotron and benchtop x-ray imaging. All components are connected via 3.18 mm(1/8′′) O.D. 316 stainless steel tubing (Swagelok, Solon OH, UnitedStates) and are mounted upon heavy-duty rolling carts. The alu-minum Hassler-sleeve type core holder (Phoenix Instruments,Splendora, TX, United States) has a wall thickness of 0.127 cm andcan accommodate cores up to 6.35 mm in diameter and 7.6 cm inlength (Fig. 2). Overburden pressure was applied to the core via aBuna-N Nitrile sleeve accommodated inside the core holder. Thecore was assembled with a stainless steel spacer, Viton o-ring, andtwo layers of hydrophilic nylon membrane with 1.2 �m pore size(General Electric Company, Fairfield, CT, United States) at the baseof the core and a Viton o-ring and a 316 stainless steel washer at thetop of the core. The entire core assembly is wrapped in aluminumfoil to prevent uptake of the scCO2 by the Buna-N nitrile overburdensleeve, and then wrapped in Teflon tape (Fig. 2). Core temperatureis maintained via incandescent lamps and continuously monitoredwith external thermocouples (Omega Engineering Inc, Stamford,CT, United States).
Fluid flow rates and pressures, including the overburden pres-sure, were controlled by high precision, high pressure syringepumps (Teledyne ISCO, Lincoln, NE, United States). The 400 mlfluid separator (Fig. 1) (manufactured in-house) allows completemixing of the fluids and is monitored by a differential pressuretransducer with a range of ±14.0 kPa (±2 psi) (Validyne Engineer-
ing, Northridge, CA, United States). Three other Validyne pressuretransducers are connected in parallel with the core holder toallow pressure measurements during flow experiments: two pres-sure transducers measure absolute pressure above and below the
A.L. Herring et al. / International Journal of Greenhouse Gas Control 25 (2014) 93–101 95
iment
ctcmtoti
2
Cawfiawa
Fig. 1. Exper
ore (pressure range: ±8.6 MPa (±1250 psi)), and one pressureransducer measures differential (i.e. capillary) pressure across theore (pressure range: ±14.0 kPa). The 450 ml brine and CO2 accu-ulators and fluid separator, the temperature sensitive pressure
ransducers, as well as all other temperature-sensitive componentsf the setup are housed in a temperature-controlled and moni-ored environment (oven and external compartment), as indicatedn Fig. 1.
.3. Supercritical experimental process
Before filling and pressurizing the high-pressure system, theO2 flow paths and fluid separator components assigned to holdnd transport CO2 were cleared of air by repeatedly flushingith gaseous CO2. The brine accumulator and the connections
or brine were filled with degassed brine and taken up to work-
ng pressure (8.3 MPa or 1200 psi). Approximately 150 ml of brinet ambient pressure was pumped into the separator; then CO2as pumped into the separator until working pressure waschieved.
al schematic.
Mixing of fluids occurs within the fluid separator which hasports that are flush with the endcaps at the top and bottom of thevessel as well as a bored-thorough port at the bottom with a linethat reaches approximately the midpoint of the vessel. Fluids arepushed back and forth using the high pressure pumps: scCO2 ispushed through the flush bottom port while a mixture of fluids isallowed to be retracted through the midpoint line, then the mix-ture of fluids is pushed back into the cylinder via the midpoint linewhile the scCO2 phase is allowed to retract from the top flush port.Pushing in the buoyant scCO2 through the bottom port allows thescCO2 to travel through the brine phase as it migrates to the top ofthe separator vessel, and pushing the mixture of fluids through themidpoint line allows brine in the mixture to cascade down throughthe scCO2 phase, facilitating complete mixing. This mixture processwas performed at least three cycles. Finally, brine phase was pulledfrom the bottom flush port then pushed through the midpoint line
multiple times, while scCO2 was allowed to flow in or out of thecylinder via the top port. This step clears the midpoint and lowerbrine lines of scCO2, replacing it with a pure phase of CO2-saturatedbrine.
96 A.L. Herring et al. / International Journal of Greenhouse Gas Control 25 (2014) 93–101
r for B
r1casflt
dfl(igo4ptCfiFwiitaafp
tacwlrioam
Fig. 2. Assembly of high-pressure core holde
Temperatures were set to 37.5 ◦C, and fluids allowed toeach chemical and thermal equilibrium, a process requiring2–16 h. Temperature was continuously monitored by thermo-ouples inside the temperature-controlled space. Equilibrium wasssumed to be reached when the CO2 pump, set to maintain con-tant pressure, maintained a constant volume, indicating no furtheruid volume changes, and the pressure across the separator main-ained a constant value.
The core assembly was attached to the system and vacuum-egassed brine was used to wet the hydrophilic membrane andush the core, with an applied overburden pressure of 1.4 MPa200 psi). Vacuum was applied at the upper outlet of the core holdern order to completely saturate the core with brine. The core wasradually brought to the working pressure (8.3 MPa), while theverburden pressure was concurrently raised to approximately.1 MPa (600 psi) in excess of the core pressure, and the core tem-erature (37.5 ◦C) was established using incandescent lamps. Oncehe core reached a stable temperature, the core was flushed withO2-saturated brine at 8.3 MPa and 37.5 ◦C until CO2 gas was con-rmed to exit at the core holder back-pressure regulator (BPR) (seeig. 1). This filling process ensured that the brine within the coreas saturated with CO2 and that the drainage process was truly
mmiscible (i.e. the scCO2 displaced the brine rather than dissolv-ng into it). At this point, scCO2 was introduced into the line abovehe core holder and the CO2 and brine phases were separated by
single valve (labeled “S1” in Fig. 1), and the core system wasllowed to equilibrate. Equilibration was established when the dif-erential pressure transducer across the core maintained a constantressure.
The brine pump was used to control flow rate from the bottom ofhe core, while the CO2 pump provides a constant pressure bound-ry at the top of the core. The brine pump was set to retract at aonstant volumetric flow rate of 0.100 ml/h, while the scCO2 pumpas set to a constant pressure setting of 8.3 MPa (1200 psi). Abso-
ute and differential pressures were continuously monitored andecorded. For both continuous and quasi-static (scanned) exper-
ments, pumping of brine continued until a differential pressuref approximately 14.0 kPa (the pressure transducer range) waschieved, indicating that the NW fluid had reached the hydrophilicembrane. For scanning, the pumps were stopped at seven pointsentheimer sandstone drainage experiments.
during the drainage process, the system was allowed to equilibratefor 45 min and a scan was acquired of the core. A scan was alsotaken of the dry core.
For the scanned experiment, scCO2 saturation was derived fromthe images. Nonwetting phase saturation for the unscanned, con-tinuous curves was calculated from the pore volume of the rock(which is estimated using the dimensions and mass of the vac-uum dried core) and the brine flow rate. The start point of drainagewithin the core (rather than the line above the core) is evident as asharp decrease in pressure and saturation is calculated as a functionof time from that start point.
2.4. Synchrotron x-ray CMT imaging and data processing
Tomographic imaging was performed at the bending magnetbeam-line at sector 13 (GSECARS) at the Advanced Photon Sourceat Argonne National Laboratory. The beam-line specifications havebeen described in detail in previous works (Rivers et al., 1999;Wildenschild et al., 2005; Wildenschild et al., 2002). All scans wereperformed at a monochromatic energy level of 37.0 keV, signifi-cantly above the K-shell photoelectric absorption edge of iodine(33.17 keV), resulting in high x-ray attenuation by the 1:6 by weightpotassium iodide-doped brine and thus allowing for separation ofthe wetting and non-wetting fluids in the reconstructed images.This higher energy was used to overcome the attenuation dueto the core holder, overburden pressure fluid, and aluminum foilsurrounding the core. Images were captured at 720 angles, witha horizontal field of view of 6.47 mm, a vertical field of view of4.83 mm, and a resulting voxel resolution of 4.65 �m, as a resultof utilizing local tomography. For each point on the drainage curve(subsequently labeled A to G, e.g. in Fig. 5), two scans were acquiredat different heights in the core with a vertical overlap of 0.5 mm.
The acquired radiographs were reconstructed into three-dimensional (3D) volumes via the programming language IDLTM
(Research Systems Inc.) and the subsequent image processing andanalysis was performed using Avizo® Fire (FEI Visualization Sci-
ences Group, Burlington Massachusetts, United States).To reduce noise and blur, the grayscale 3D datasets (Fig. 3a)were processed with an anisotropic diffusion filter applied witha diffusion threshold value of 350 and 50 iterations (Fig. 3b).

A.L. Herring et al. / International Journal of Greenhouse Gas Control 25 (2014) 93–101 97
F heimer sandstone. The raw data (a) is cropped and an anisotropic diffusion filter is applied( mum, resulting in a binary image (c) and noise is removed applying a size exclusion filter(
TmpwiaraTpsswttlTr
3
3
stpidp(lstBcnHrc
A
BCDEF
G
0.0
4.0
8.0
12.0
16.0
20.0
0.00 0.20 0.4 0 0.6 0 0.80 1. 00
Pc
(kP
a)
Brine Saturation (-)
(a)
0.00
0.10
0.20
0.30
0.40
0.50
0.00 0.2 0 0.40 0. 60 0.80 1.00
Pc/
σ
(kP
a·m
/mN
)
Brine Saturation (-)
(b)
Supercritical Quasi-static, B1
Supercritical Continuous, B2
Ambient Continuous, B3
Fig. 4. Primary drainage (a) capillary pressure–saturation (Pc-S) curves and (b)capillary pressure normalized by interfacial tension-saturation (Pc/�-S) curves for
ig. 3. Image processing steps for segmenting supercritical CO2 (scCO2) within Bentb). The filtered image is segmented according to the grayscale histogram local minid).
he anisotropic diffusion filter facilitates the histogram-based seg-entation process by separating the peaks that differentiate two
hases: the non-wetting phase scCO2 and a combination of theetting phase and solid (Fig. 3a and b). We segmented the result-
ng grayscale image by applying a universal intensity threshold toll volumes at a grayscale value of 62.5 (Fig. 3c). To remove theemaining noise, we applied a size exclusion filter that removesll NW phase-labeled clusters smaller than 250 voxels (Fig. 3d).he size of these clusters corresponds to the volume of a sphericalore with a radius of 18.2 �m; removal of clusters smaller than thisize is justified given the pore-size distribution of the Bentheimerandstone (Maloney et al., 1990). The two vertical scan sectionsere then merged to form an 8.0 mm tall volume, and all quanti-
ative measures are calculated on this final volume using analysisools available in Avizo® Fire: total number and density of NW-abeled voxels and individual volume of distinct NW voxel clusters.hese values were normalized by the corresponding values for theespective core in its dry state.
. Results and discussion
.1. Primary drainage pressure–saturation relationship
The drainage process of the scCO2-brine system in Bentheimerandstone, at geological reservoir conditions, was imaged athe pore-scale using x-ray synchrotron tomography. Capillaryressure–saturation (Pc-S) curves measured with the supercrit-
cal experimental system are shown in Fig. 4(a); a continuousrainage curve (from core B2) is overlain with the equilibriumressure–saturation points from the scanned drainage experimentcore B1) showing consistent behavior between the stepped equi-ibrium data and the continuously scanned measurements. Thecanned points from core B1 are labeled A-G, corresponding tohe data presented in Section 3.2. Note that the pressures of points
and C are estimated by comparison to the continuous drainageurve, due to inadequate equilibration during the first two scan-
ing periods. Point A was collected prior to the start of drainage.owever, temperature fluctuations within the core (temperatureanged from 36.9 to 38.8 ◦C prior to the start of data collection)aused exsolution of dissolved CO2 and the resulting data is shifted
the two scCO2-brine experiments (continuous and quasi-static) and for a contin-uous ambient air-brine drainage experiment. The quasi-static points are labeledwith their scan designation in (a). Uncertainty bars indicate the range of pressurevariation during equilibration. The hollow supercritical quasi-static points indicateestimated pressure values.

9 of Greenhouse Gas Control 25 (2014) 93–101
tA
bmFafasPcsusse
bce5aiNdustdaaitbcmwthbabdcop
3
rtiHa
�
wuitsd
A
BC
DEFG
0.00
0.25
0.50
0.75
1.00
0.00 0.20 0.40 0.60 0.80 1.00
Γsc
CO
2
Brine Saturation (-)
Drainage
Fig. 5. Connectivity of the supercritical CO2 (scCO2), quantified by the connectivity
of small clusters (clusters of approximately 0.01 mm and smaller)first increases (points A to E), then decreases (points E to G). Thesesmall clusters are present due to snap-off, which occurs whenpumping is paused during scanning. The number of small clusters
0
50
100
150
200
250
300
0.00001 0.0001 0.001 0.01
Nu
mb
er o
f sc
CO
2 C
lust
ers
scCO2 Cluster Volume (mm3)
(a)
0
5
10
15
20
25
30
0.00001 0.0001 0.001 0.01 0. 1 1 10 100Cu
mm
ula
tive
scC
O2
Volu
me
( mm
3)
scCO2 Clust er Volume (mm3)
(b)A B C D E F G
0
5
10
15
0.01 1 100
(b)
Fig. 6. Size of supercritical CO2 (scCO2) fluid clusters at each point A–G during thebrine drainage process in Bentheimer sandstone: (a) distribution of scCO2 clustersas a function of cluster volume for small clusters less than 0.01 mm3, (b) close-upview of distribution of scCO2 clusters as a function of cluster volume for clusterslarger than 0.01 mm3, and (c) cumulative scCO2 volume as a function of cluster
8 A.L. Herring et al. / International Journal
oward lower brine saturation (i.e. less than 1.0) (e.g. Fig. 4, point; and Fig. 7a).
For comparison with the scCO2-brine system, an ambient air-rine Pc-S curve was measured on a third core, B3, following theethods described in Herring et al. (2013) and is also shown in
ig. 4(a). The decrease in NW phase entry pressure between thembient air and supercritical CO2 curves is due to decreased inter-acial tension (IFT) between scCO2 and brine as compared to airnd brine (see Table 1). This result is similar to the shift betweenupercritical and ambient pressure–saturation curves reported bylug and Bruining (2007). This interpretation is confirmed by theurves shown in Fig. 4(b), wherein the capillary pressures of theystems are normalized by their respective interfacial tension val-es; as shown, primary drainage for the scCO2-brine and air-brineystems can be successfully described by a single Pc/�-S relation-hip. This finding provides support for use of analog fluids in flowxperiments to simulate primary drainage of scCO2.
The brine saturation at the end of primary drainage (“initial”rine saturation) measured here (scan G, Sw = 9%) is relatively lowompared with other scCO2 flow experiments. For example, Iglauert al. (2011) measured an initial brine saturation of approximately0% in homogenous Doddington sandstone cores of 9 mm lengthnd 4.95 mm diameter, and Akbarabadi and Piri (2013) measurednitial brine saturations ranging from 30% to 75% in Berea andugget sandstone cores of approximately 15 cm length and 3.8 cmiameter. Similarly, Krevor et al. (2012) reports initial brine sat-rations of 41–54% in a variety of 5 cm diameter, 10 cm lengthandstone and reservoir rock samples; however, Krevor et al. statehat the minimum achievable end-of-drainage brine saturation isependent on the capillary pressure achieved in the experiment,nd the authors indicate that lower brine saturations should bettainable at sufficiently high capillary pressure. The difference innitial bine saturation values between these previous studies andhe value reported here is due to our use of a hydrophilic mem-rane at one end of the core (the works mentioned above useo-current flow, and do not include a membrane in the experi-ental design). A similar effect is shown by Pentland et al. (2011a)ho achieved initial brine saturations of approximately 10% with
he use of a semi-permeable disk in their experimental set-up. Theydrophilic membrane (or semi-permeable disk) prevents scCO2reakthrough, thus approximating a semi-infinite geologic media,nd allows higher capillary pressures (and consequently, lowerrine saturations) to be achieved. As a result of this experimentalesign, we have presented a more complete pressure–saturationurve for primary drainage, derived from real-time measurementsf capillary pressure across the core coupled with x-ray tomogra-hy based saturation information.
.2. Connectivity and topology of scCO2 front during drainage
The connectivity of NW fluid after drainage plays a significantole in controlling the amount of residual trapping of the NW fluidhat is achieved after the subsequent imbibition of W fluid backnto the pore space (Herring et al., 2013; Wardlaw and Yu, 1988).ere, the connectivity of the CO2 is investigated via �scCO2 (Renardnd Allard, 2013):
scCO2 = 1
n2scCO2
∑N(XscCO2)
i=1n2
i , (1)
here ni is the number of connected scCO2 voxels of each individ-al ith scCO2 cluster (i.e. the size of each individual scCO2 cluster,
n voxels), XscCO2 is the set of all scCO2 voxels, and nscCO2 is theotal number of scCO2 voxels. The relative fraction of connectedcCO2 clusters increases as drainage proceeds and brine saturationecreases (Fig. 5). The relative fraction of connected scCO2 clusters
measure �scCO2 , as a function of brine saturation during the brine drainage processin Bentheimer sandstone.
approaches unity even at relatively high brine saturation (0.60);this indicates that the scCO2 invades the core largely as one con-nected component, rather than multiple distinct fingers emanatingfrom distinct sources.
The high connectivity of the scCO2 is confirmed by investigat-ing the distribution of the scCO2 cluster sizes (Fig. 6). Fig. 6(a)demonstrates that throughout the drainage process, the number
3
volume. Note difference of scale between (a) and (b). Although there is a relativelylarge number of small (<0.01 mm3) fluid clusters, most of the cumulative volumeof scCO2 present within the sandstone (greater than 90%) is derived from a singlelarge cluster for drainage points B-G (with a size ranging from 9.4 mm3 for scan Bto 28.7 mm3 for scan G).

A.L. Herring et al. / International Journal of Greenhouse Gas Control 25 (2014) 93–101 99
Fig. 7. Three dimensional (3D) isosurfaces, two dimensional (2D) binary X–Z oriented slices, and a closer view of the 2D binary slices overlain on the original grayscale imageo drains
fiaislBfttvds
tasonCiTtsi
f supercritical CO2 (scCO2) within Bentheimer sandstone at four points during thelices.
rst increases as more scCO2 enters the pore space, then decreasess pumping continues and scCO2 saturation increases and connectsndividual clusters via pore throats. Fig. 6(b) is a truncated plot,howing the size distribution of the medium (0.01–1 mm3) andarge (>1 mm3) clusters, which establishes that for drainage points-G, there exists precisely one large cluster that increases in volume
rom points B-G. Comparison of Fig. 6(b) with Fig. 6(c) establisheshat this one large scCO2 cluster makes up the great majority of theotal scCO2 volume within the pore space (90% of the total scCO2olume for point B, and increasing as drainage proceeds) for everyrainage point (excluding point A, which was measured before thetart of drainage).
The topology of the scCO2 can be investigated from a qualita-ive perspective as well (Fig. 7). Three dimensional (3D) isosurfacesnd two dimensional (2D) binary X-Z oriented slices of the scCO2how the extent of temperature-induced scCO2 phase separationut of the brine prior to drainage (Fig. 7, scan designation A). Weote here that such exsolution may occur in any experiment usingO2-saturated brine, which highlights the importance of maintain-
ng temperature uniformity throughout the experimental system.
he tomographic data show the increase of scCO2 saturation duringhe progression of drainage (Fig. 7, scan designations B, D, and G). Aubsection of these binary X-Z oriented slices overlain on the orig-nal grayscale data (Fig. 7) demonstrates the evolution of the scCO2age process. Core diameter is approx. 6 mm and the scale is shown for the close-up
front on the pore scale. As shown by all three image types, althoughscCO2 was injected at the top of the core, the scCO2 does not movein a uniform, stable front. Rather, it first invades the largest pores,gradually filling smaller pores as drainage proceeds, and travelingin all directions.
For a drainage process in 2D micromodels, three flow regimeshave been identified: capillary fingering is characterized by flowthrough a single interconnected flow path with a width of tens ofpore bodies; viscous fingering presents several disconnected flowpaths with widths of 1–3 pore bodies; and stable displacementoccurs when the NW fluid advances as a solid front (Lenormandet al., 1988; Zhang et al., 2011). The characteristics of these flowregimes are not as clearly defined in 3D porous media; how-ever, the quantitative measures demonstrating high connectivitydominated by a single scCO2 fluid cluster (Figs. 5 and 6) and quali-tative data illustrating the evolution of the scCO2 front (Fig. 7) wepresent here provide evidence that during this drainage experi-ment, scCO2 invades the sandstone via capillary fingering. This isexpected; given the low mobility ratio M = �CO2 /�brine = 0.03 andlow capillary number Ca = (�CO2 vCO2 )/� = 10−8.6 of this drainage
experiment (Fig. 8). The agreement between previous studies on2D systems and the supercritical 3D system investigated here pro-vides support that the flow regimes developed by examinationof 2D micromodels (Lenormand et al., 1983; Wang et al., 2012;
100 A.L. Herring et al. / International Journal of Gre
-10
-8
-6
-4
-2
0
-6 -4 -2 0 2 4
log
Ca
log M
Viscous
Fingering
Capillary
Fingering
Stable
Displ acemen t
Fig. 8. Flow regime phase diagram for drainage. The flow regimes are definedbased on the capillary number (Ca) and mobility ratio (M) of the drainage pro-cess; solid lines indicate boundaries defined by Lenormand et al. (1988) and dashedlines indicate boundaries defined by Zhang et al. (2011). Conditions of the scannedsrt
Zm
4
ScccscfpWdosmraarTtptotwpZsab
upercritical CO2 (scCO2) drainage experiment within Bentheimer sandstone areepresented by the red diamond. (For interpretation of the references to color inhis figure legend, the reader is referred to the web version of the article.)
hang et al., 2011) are relevant to 3D systems with geologic porousedia and supercritical conditions.
. Conclusions
We have presented unique capillary pressure–saturation (Pc-) curves for supercritical CO2 (scCO2) and brine at reservoironditions, i.e. 37.5 ◦C and 8.3 MPa, where the saturation data is cal-ulated from x-ray CMT images paired with bulk measurements ofapillary pressure via pressure transducers. We have compared thecCO2 Pc-S curve to an ambient Pc-S curve and normalization of theapillary pressure curves by the air-brine and scCO2-brine inter-acial tensions (�) results in a single Pc/�-S curve that describesrimary drainage for both ambient and supercritical conditions.e have shown that quasi-static equilibrium capillary pressure
ata overlap that obtained in continuous pressure experimentsf the primary drainage process of scCO2 in Bentheimer sand-tone at reservoir conditions and low flow rate. We have obtaineduch lower initial saturations of brine in our system (9%) than
eported in other studies (30–75%), which, because of our use of hydrophilic membrane at the brine outlet, better approximates semi-infinite geologic medium, and which we believe is a moreealistic characterization of CO2 storage capacity during drainage.hese experiments have highlighted the importance of tempera-ure uniformity throughout the experimental system due to theossibility of scCO2 exsolution due to temperature variation. Addi-ionally, we have investigated the connectivity of the scCO2 frontn a pore-scale basis and provided both quantitative and qualita-ive evidence demonstrating scCO2 invasion via capillary fingering,hich is consistent with mobility ratio/capillary number-basedredictions obtained at ambient pressure (Lenormand et al., 1983;
hang et al., 2011) and in homogenous (2D) high-pressure CO2ystem micromodel studies (Wang et al., 2012). Our results showvery complete drainage process of scCO2 displacing brine (to arine saturation of 9% at the end of primary drainage) in a capillary
enhouse Gas Control 25 (2014) 93–101
fingering flow regime using sandstone at reservoir conditions andindicate that 2D and ambient system experiments can be used toapproximate scCO2 flow processes during primary drainage.
Acknowledgements
We gratefully acknowledge the support of the U.S. Departmentof Energy through the LANL/LDRD Program (#20100025DR) for thiswork; as well as the Department of Energy’s Basic Energy Sciences,Geosciences Program via grant number DE-FG02-11ER16277. Useof the Advanced Photon Source, an Office of Science User Facilityoperated for the U.S. Department of Energy (DOE) Office of Scienceby Argonne National Laboratory, was supported by the U.S. DOEunder Contract No. DE-AC02-06CH11357. We acknowledge thesupport of GeoSoilEnviroCARS (Sector 13), which is supported bythe National Science Foundation – Earth Sciences (EAR-1128799),and the Department of Energy, Geosciences (DE-FG02-94ER14466).L. Andersson wishes to acknowledge funding from the Swedish Sci-ence Council under grant number 2011-7025. We are grateful to theGSECARS staff for technical support during beam-time, in particularDr. Mark Rivers.
References
Akbarabadi, M., Piri, M., 2013. Relative permeability hysteresis and capillary trapp-ing characteristics of supercritical CO2/brine systems: an experimental study atreservoir conditions. Adv. Water Resour. 52, 190–206.
Bachu, S., Bennion, B., 2008a. Interfacial tension between CO2, freshwater, and brinein the range of pressure from (2 to 27) MPa, temperature from (20 to 125) ◦C, andwater salinity from (0 to 334 000) mg L−1. J. Chem. Eng. Data 54 (3), 765–775.
Bachu, S., Bennion, B., 2008b. Effects of in-situ conditions on relative permeabilitycharacteristics of CO2-brine systems. Environ. Geol. 54 (8), 1707–1722.
Blunt, M.J., Bijeljic, B., Dong, H., Gharbi, O., Iglauer, S., Mostaghimi, P., Paluszny, A.,Pentland, C., 2013. Pore-scale imaging and modelling. Adv. Water Resour. 51,197–216.
Broseta, D., Tonnet, N., Shah, V., 2012. Are rocks still water-wet in the presence ofdense CO2 or H2S? Geofluids 12 (4), 280–294.
Chalbaud, C., Robin, M., Lombard, J.M., Martin, F., Egermann, P., Bertin, H., 2009.Interfacial tension measurements and wettability evaluation for geological CO2
storage. Adv. Water Resour. 32 (1), 98–109.Chaudhary, K., Bayani Cardenas, M., Wolfe, W.W., Maisano, J.A., Ketcham, R.A., Ben-
nett, P.C., 2013. Pore-scale trapping of supercritical CO2 and the role of grainwettability and shape. Geophys. Res. Lett. 40 (15), 3878–3882.
El-Maghraby, R.M., Blunt, M.J., 2012. Residual CO2 trapping in Indiana Limestone.Environ. Sci. Technol. 47 (1), 227–233.
Herring, A.L., Harper, E.J., Andersson, L., Sheppard, A., Bay, B.K., Wildenschild, D.,2013. Effect of fluid topology on residual nonwetting phase trapping: implica-tions for geologic CO2 sequestration. Adv. Water Resour. 62, 47–58.
http://webbook.nist.gov/chemistry/, a. f., edited.Iglauer, S., Paluszny, A., Pentland, C.H., Blunt, M.J., 2011. Residual CO2 imaged with
X-ray micro-tomography. Geophys. Res. Lett. 38 (21), L21403.IPCC, 2005. IPCC Special Report on Carbon Dioxide Capture and Storage.Ketcham, R.A., Carlson, W.D., 2001. Acquisition, optimization and interpretation of
X-ray computed tomographic imagery: applications to the geosciences. Comput.Geosci. 27 (4), 381–400.
Krevor, S.C.M., Pini, R., Zuo, L., Benson, S.M., 2012. Relative permeability and trappingof CO2 and water in sandstone rocks at reservoir conditions. Water Resour. Res.48 (2), W02532.
Lenormand, R., Zarcone, C., Sarr, A., 1983. Mechanisms of the displacement of onefluid by another in a network of capillary ducts. J. Fluid Mech. 135, 337–353.
Lenormand, R., Touboul, E., Zarcone, C., 1988. Numerical models and experimentson immiscible displacements in porous media. J. Fluid Mech. 189, 165–187.
Maloney, D.R., Honarpour, M.M., Brinkmeyer, A.D., Rep. NIPER-441; Other: ON:DE90000212 United StatesOther: ON: DE90000212Wed Feb 06 15:58:38 EST2008NTIS, PC A03/MF A01 - OSTI; GPO Dep.NETL; EDB-90-031427; NTS-90-009616; ERA-15-015946English, 29 pp. 1990. The Effects of Rock Characteristicson Relative Permeability.
Morrow, N.R., Chatzis, I., Taber, J.T., 1988. Entrapment and mobilization of residualoil in bead packs. SPE Reservoir Eng. 3 (3), 927–934.
Øren, P.-E., Bakke, S., Arntzen, O.J., 1998. Extending predictive capabilities to networkmodels. SPE J. 3 (4), 324–336.
Pentland, C.H., El-Maghraby, R., Iglauer, S., Blunt, M.J., 2011a. Measurements of thecapillary trapping of super-critical carbon dioxide in Berea sandstone. Geophys.Res. Lett. 38 (6), L06401.
Pentland, C.H., El-Maghraby, R., Georgiadis, A., Iglauer, S., Blunt, M.J., 2011b.Immiscible displacements and capillary trapping in CO2 storage. Energy Pro-cedia 4, 4969–4976.
Pentland, C.H., Iglauer, S., Gharbi, O., Okada, K., Suekane, T., 2012. The influence ofpore space geometry on the entrapment of carbon dioxide by capillary forces.

of Gre
P
P
P
P
Q
R
R
S
cosity, and flow rate. Energy Procedia 4, 4945–4952.Zhang, C., Oostrom, M., Wietsma, T.W., Grate, J.W., Warner, M.G., 2011. Influence of
viscous and capillary forces on immiscible fluid displacement: pore-scale exper-
A.L. Herring et al. / International Journal
In: Paper presented at SPE Asia Pacific Oil and Gas Conference and Exhibition,Society of Petroleum Engineers.
errin, J.-C., Krause, M., Kuo, C.-W., Miljkovic, L., Charoba, E., Benson, S.M., 2009.Core-scale experimental study of relative permeability properties of CO2 andbrine in reservoir rocks. Energy Procedia 1 (1), 3515–3522.
ini, R., Krevor, S.C.M., Benson, S.M., 2012. Capillary pressure and heterogeneity forthe CO2/water system in sandstone rocks at reservoir conditions. Adv. WaterResour. 38, 48–59.
lug, W.J., Bruining, J., 2007. Capillary pressure for the sand-CO2-water systemunder various pressure conditions. Application to CO2 sequestration. Adv. WaterResour. 30 (11), 2339–2353.
olak, S., Cinar, Y., Holt, T., Torsæter, O., 2011. An experimental investigation of thebalance between capillary, viscous, and gravitational forces during CO2 injectioninto saline aquifers. Energy Procedia 4, 4395–4402.
i, R., LaForce, T.C., Blunt, M.J., 2009. Design of carbon dioxide storage in aquifers.Int. J. Greenhouse Gas Control 3 (2), 195–205.
enard, P., Allard, D., 2013. Connectivity metrics for subsurface flow and transport.Adv. Water Res. 51, 168–196.
ivers, M.L., Sutton, S.R., Eng, P.J., 1999. Geoscience applications of X-ray com-puted microtomography. In: Paper presented at SPIE’s International Symposium
on Optical Science, Engineering, and Instrumentation, International Society forOptics and Photonics.ilin, D., Tomutsa, L., Benson, S., Patzek, T., 2011. Microtomography and pore-scale modeling of two-phase fluid distribution. Transport Porous Med. 86 (2),495–515.
enhouse Gas Control 25 (2014) 93–101 101
Wang, Y., Zhang, C., Wei, N., Oostrom, M., Wietsma, T.W., Li, X., Bonneville, A., 2012.Experimental study of crossover from capillary to viscous fingering for super-critical CO2–water displacement in a homogeneous pore network. Environ. Sci.Technol. 47 (1), 212–218.
Wardlaw, N.C., Yu, L., 1988. Fluid topology, pore size and aspect ratio during imbi-bition. Transport Porous Med. 3 (1), 17–34.
Wildenschild, D., Sheppard, A.P., 2013. X-ray imaging and analysis techniques forquantifying pore-scale structure and processes in subsurface porous mediumsystems. Adv. Water Res. 51 (0), 217–246.
Wildenschild, D., Hopmans, J., Rivers, M., Kent, A., 2005. Quantitative analysis of flowprocesses in a sand using synchrotron-based X-ray microtomography. VadoseZone J. 4 (1), 112–126.
Wildenschild, D., Vaz, C.M.P., Rivers, M.L., Rikard, D., Christensen, B.S.B., 2002. UsingX-ray computed tomography in hydrology: systems, resolutions, and limita-tions. J. Hydrol. 267 (3–4), 285–297.
Wildenschild, D., Armstrong, R.T., Herring, A.L., Young, I.M., William Carey, J., 2011.Exploring capillary trapping efficiency as a function of interfacial tension, vis-
imental study in a water-wet micromodel demonstrating viscous and capillaryfingering. Energy Fuels 25 (8), 3493–3505.