Embed Size (px)
Citation preview
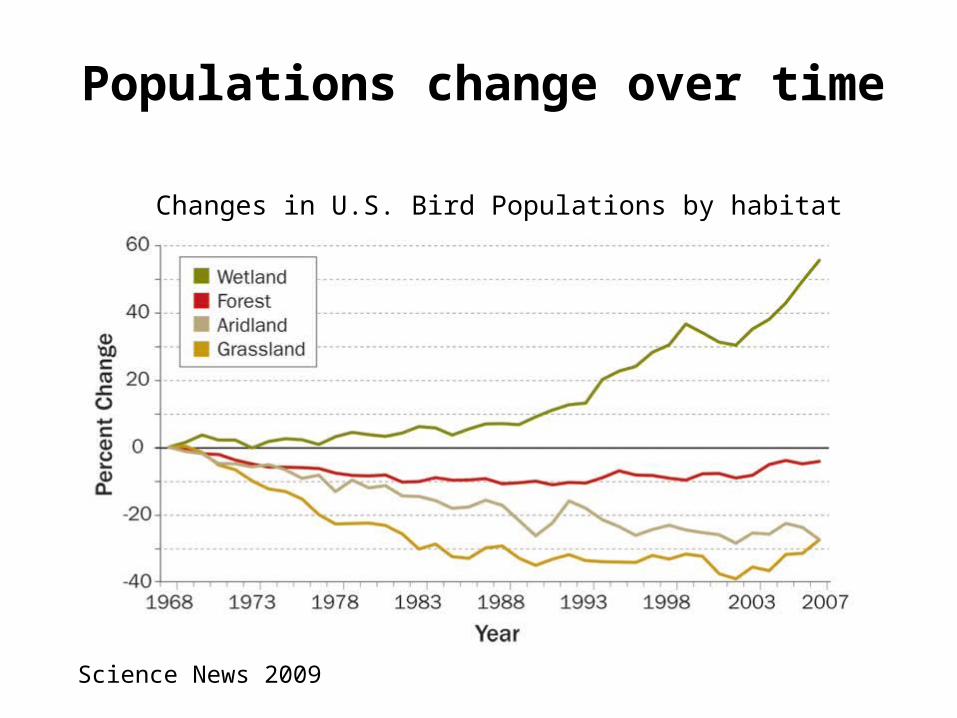
Populations change over time
Changes in U.S. Bird Populations by habitat
Science News 2009
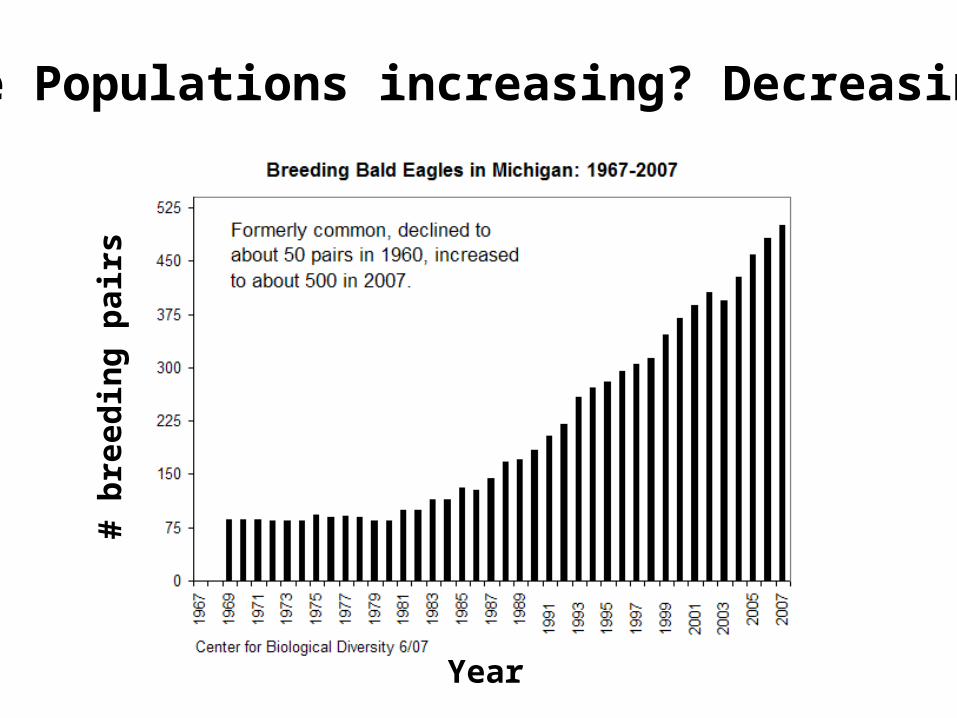
Are Populations increasing? Decreasing?#
bree
ding
pai
rs
Year
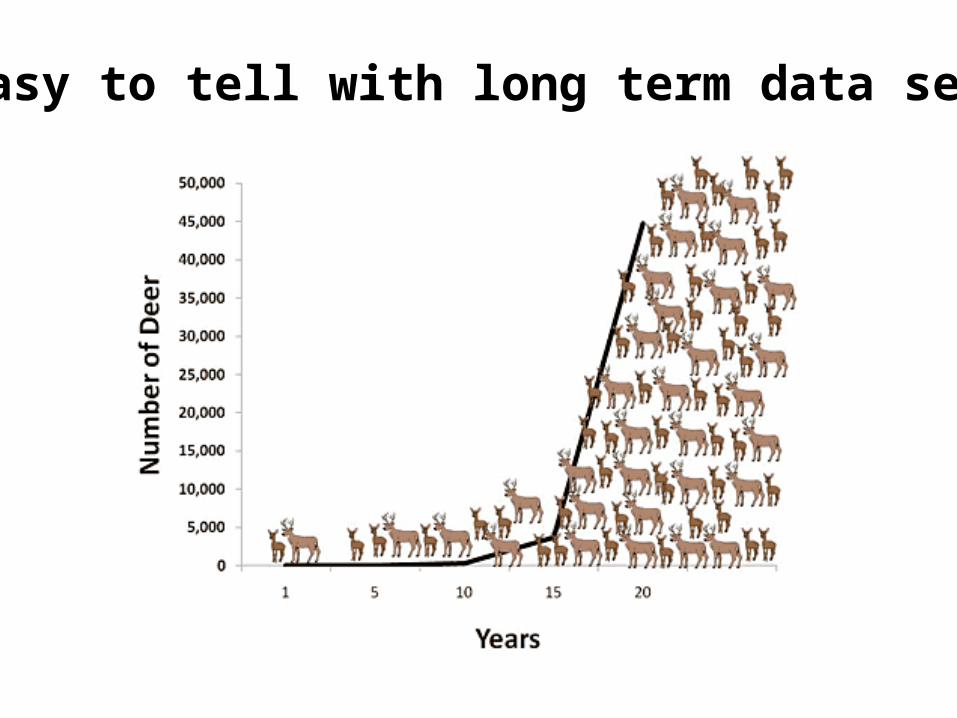
Easy to tell with long term data sets
What about short term data sets?
tt RNN 1
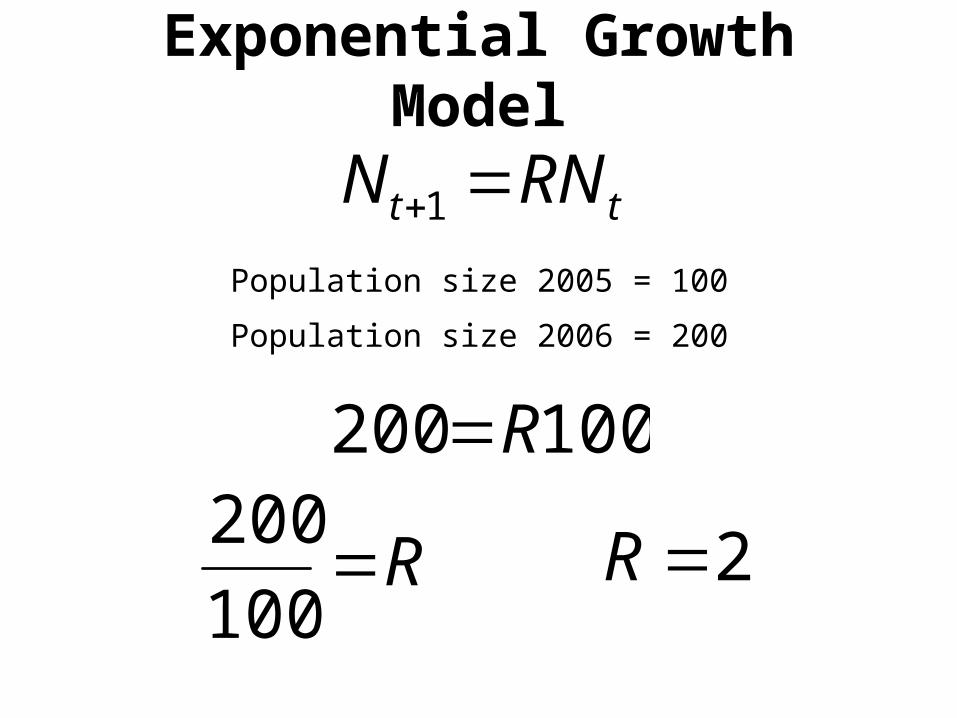
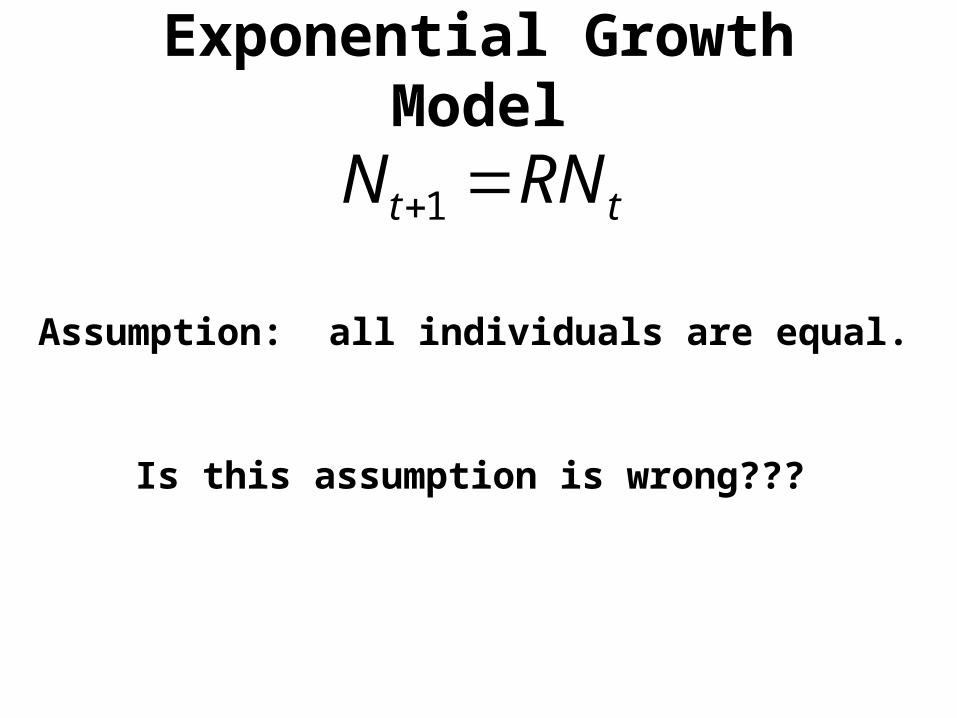
Exponential Growth Model
Population size 2005 = 100
Population size 2006 = 200
R100
200100200 R
2R
tt RNN 1
Exponential Growth Model
Assumption: all individuals are equal.
Is this assumption is wrong???
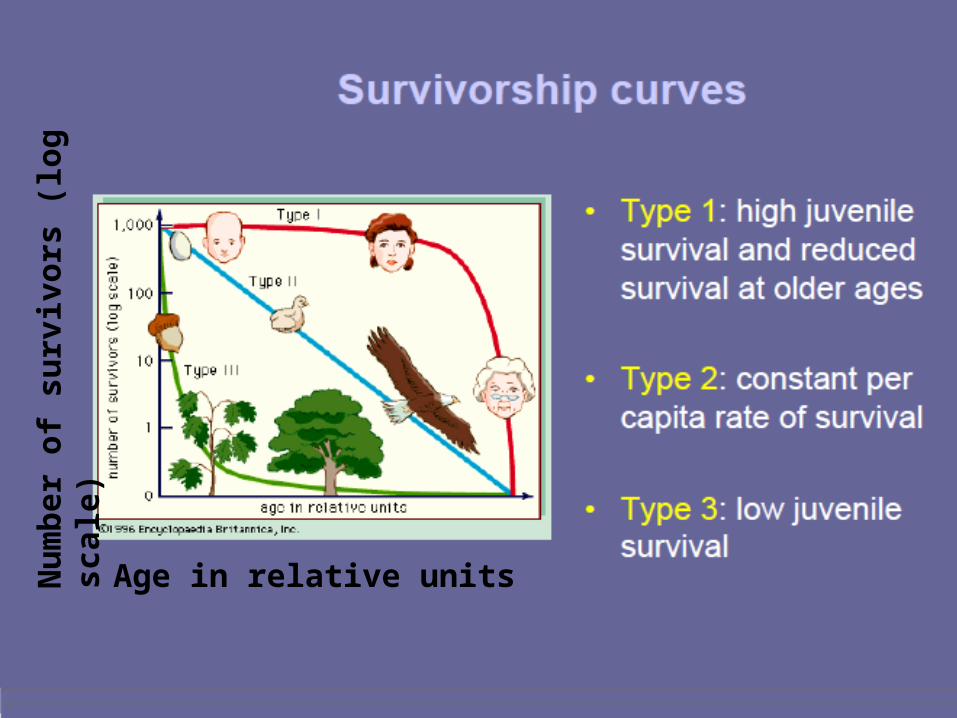
Age in relative unitsNum
ber o
f sur
vivo
rs (l
og s
cale
)
tt RNN 1
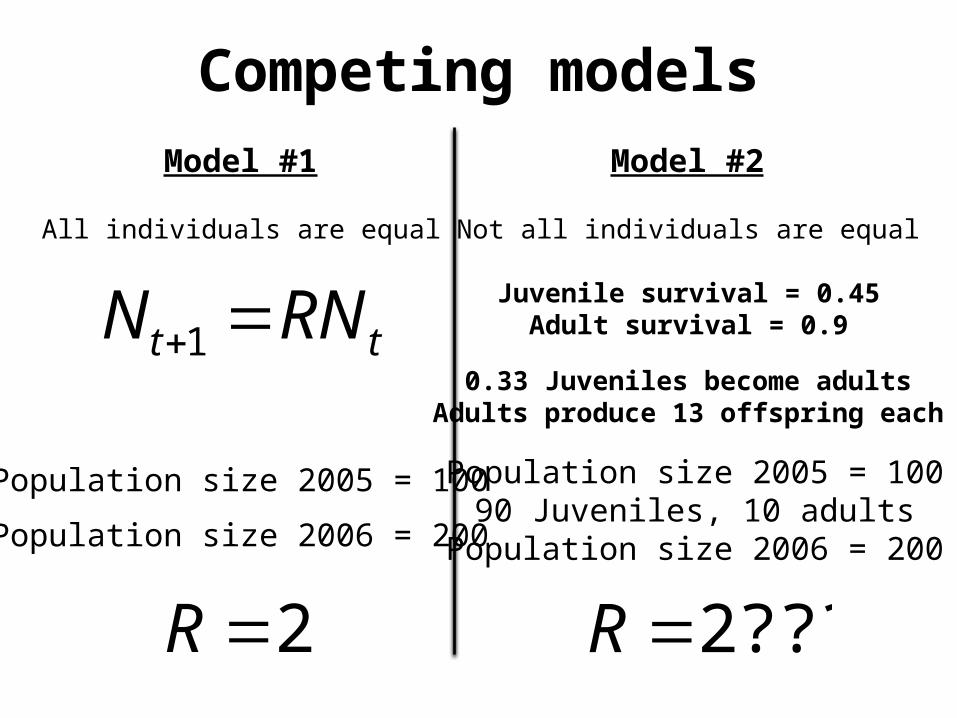
Competing models
Population size 2005 = 100
Population size 2006 = 200
2R
Model #1 Model #2
Not all individuals are equalAll individuals are equal
Juvenile survival = 0.45Adult survival = 0.9
0.33 Juveniles become adultsAdults produce 13 offspring each
Population size 2005 = 10090 Juveniles, 10 adults
Population size 2006 = 200
???2R
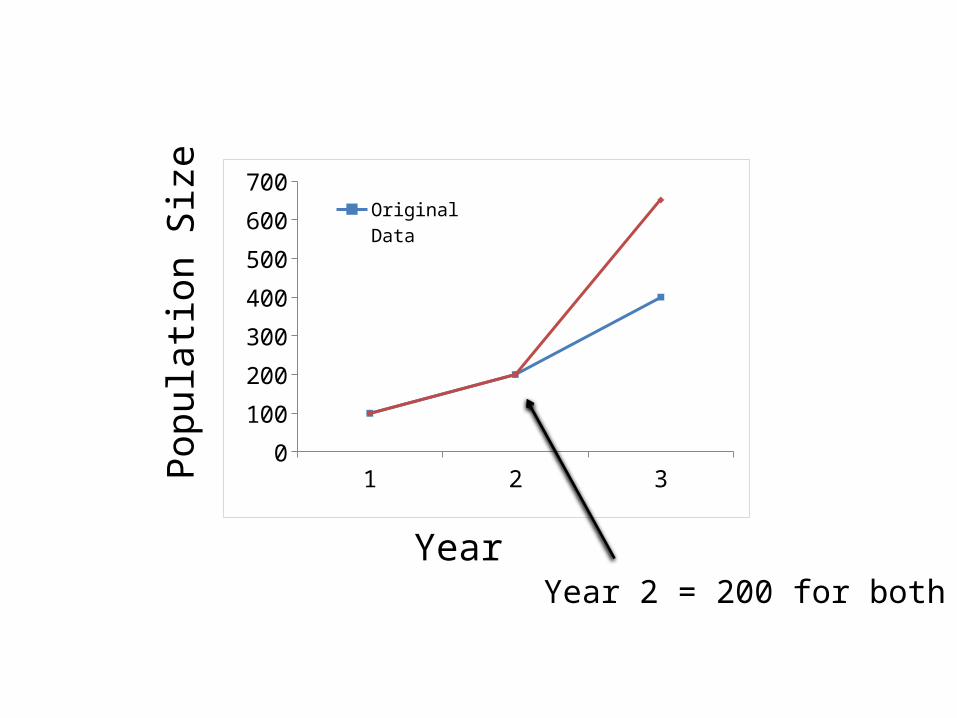
1 2 30
100
200
300
400
500
600
700Original DataNew Data
Year
Popu
latio
n Si
ze
Year 2 = 200 for both
Year
Popu
latio
n Si
ze
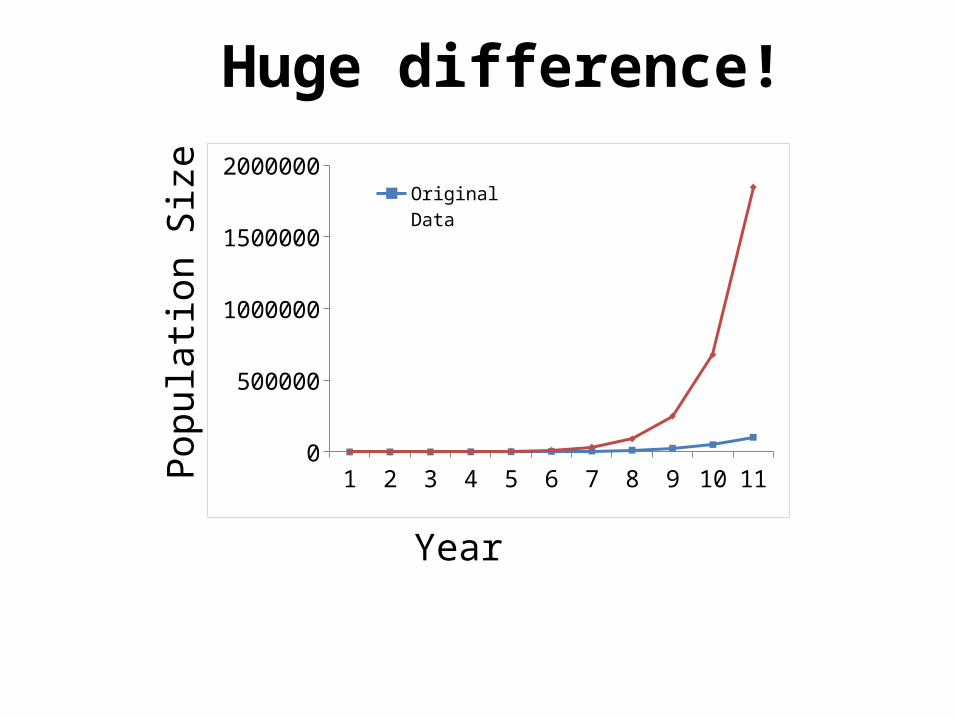
1 2 3 4 5 6 7 8 9 10 110
200000400000600000800000
100000012000001400000160000018000002000000
Original DataNew Data
Huge difference!
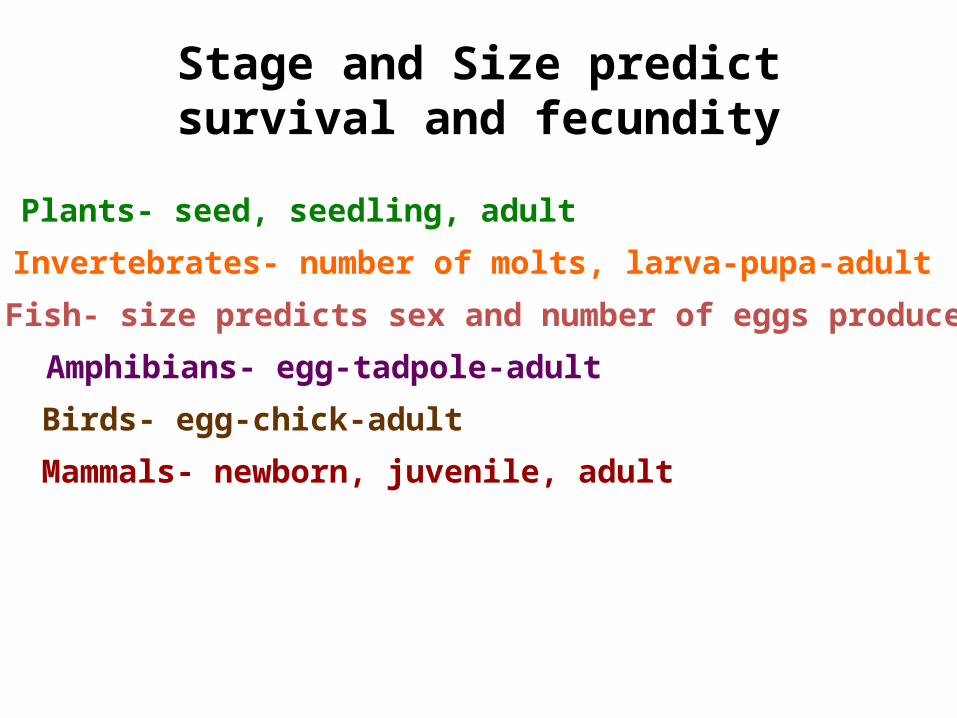
Stage and Size predict survival and fecundity
Plants- seed, seedling, adult
Invertebrates- number of molts, larva-pupa-adult
Fish- size predicts sex and number of eggs produced
Amphibians- egg-tadpole-adult
Birds- egg-chick-adult
Mammals- newborn, juvenile, adult
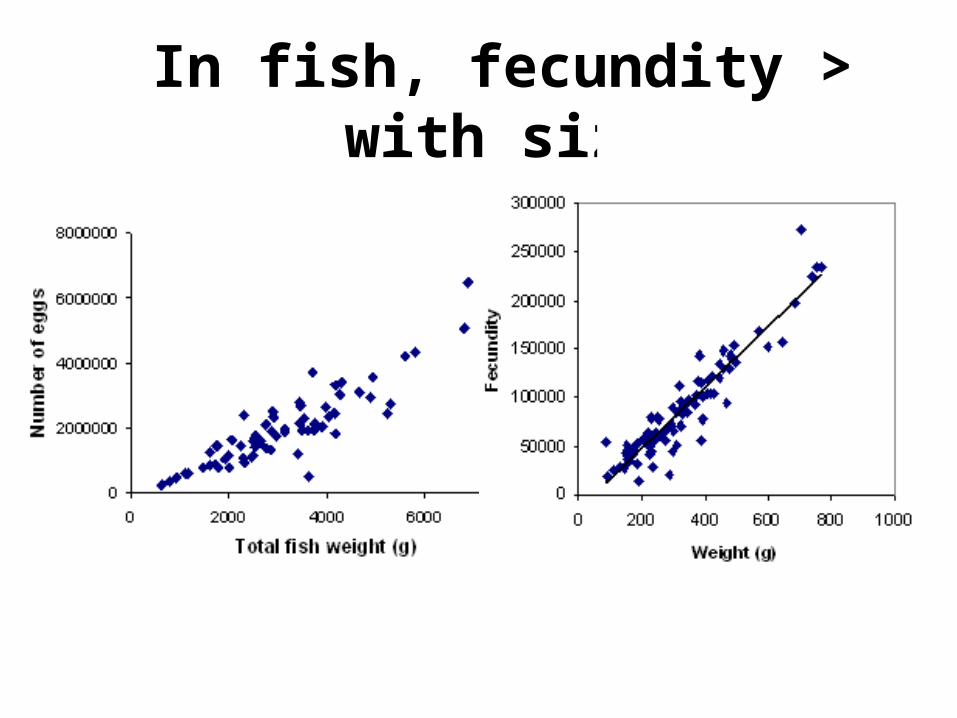
In fish, fecundity > with size
tt RNN 1
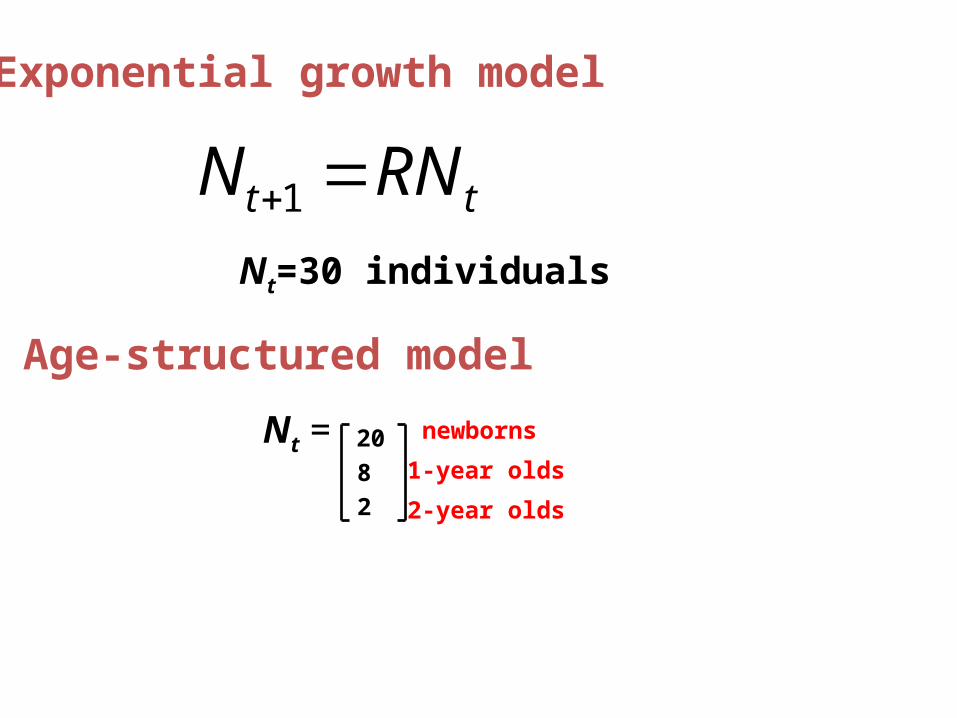
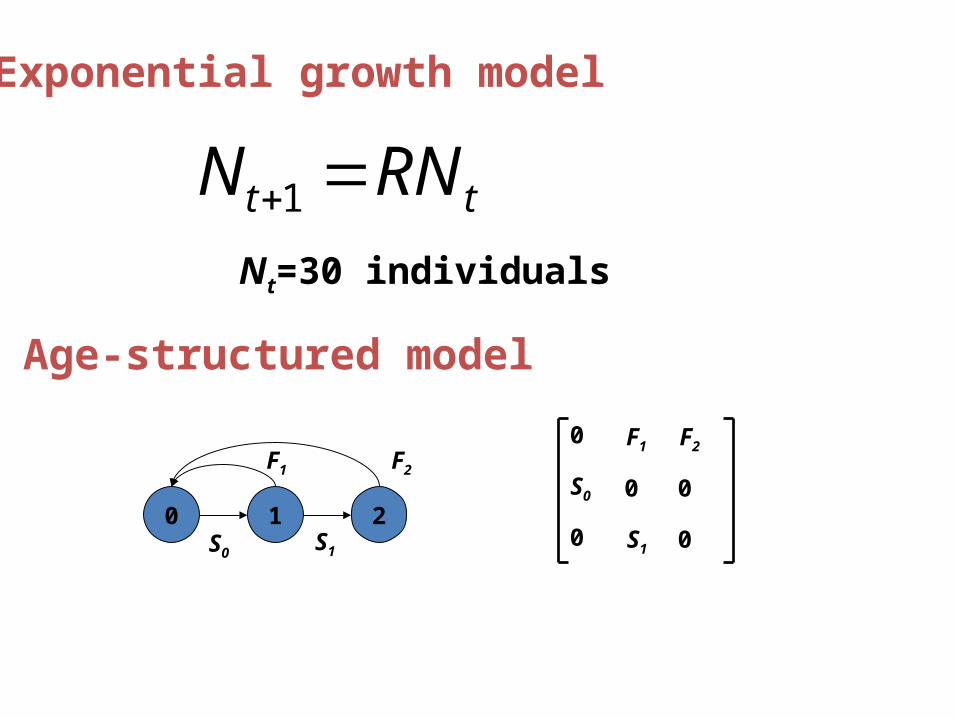
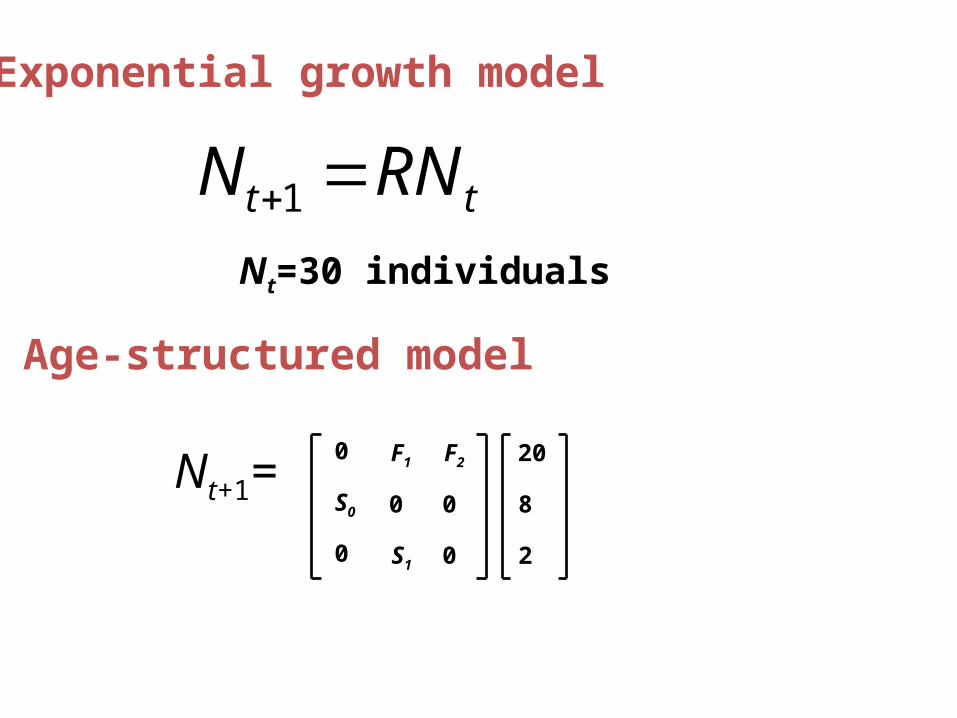
Exponential growth model
Nt=30 individuals
Age-structured model
Nt = 2082
newborns
1-year olds
2-year olds
tt RNN 1
Exponential growth model
Nt=30 individuals
Age-structured model
0
0
S0
F1
S1
0
F2
0
00 1 2
F1 F2
S0 S1
tt RNN 1
Exponential growth model
Nt=30 individuals
Age-structured model
Nt+1=0
0
S0
F1
S1
0
F2
0
0
20
8
2
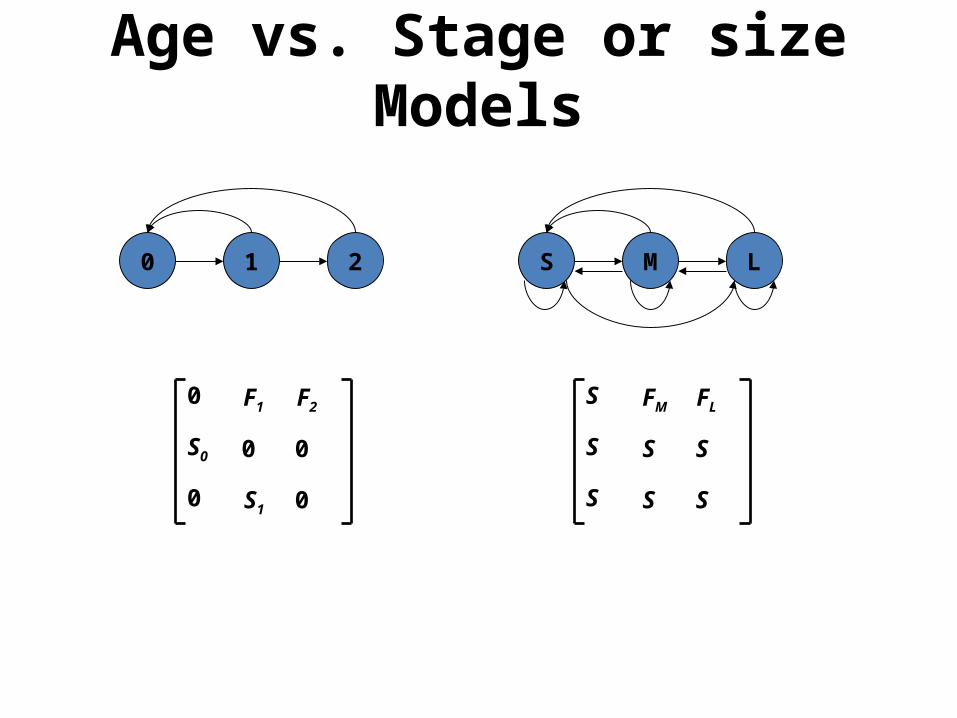
Age vs. Stage or size Models
0
0
S0
F1
S1
0
F2
0
0
0 1 2
S
S
S
FM
S
S
FL
S
S
S M L
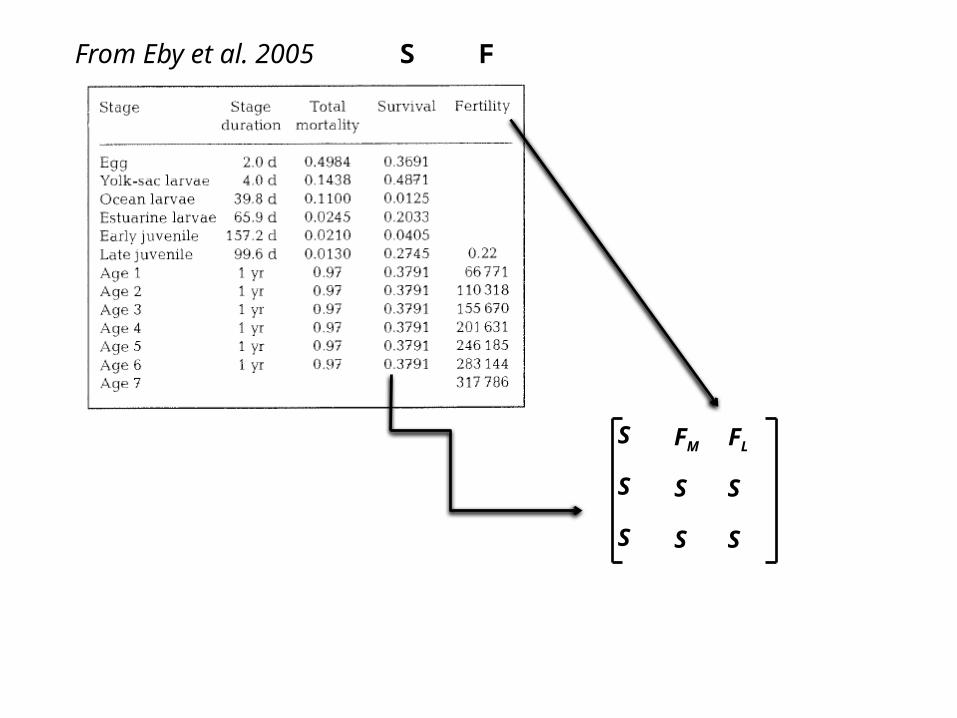
From Eby et al. 2005
S
S
S
FM
S
S
FL
S
S
S F
tt RNN 1
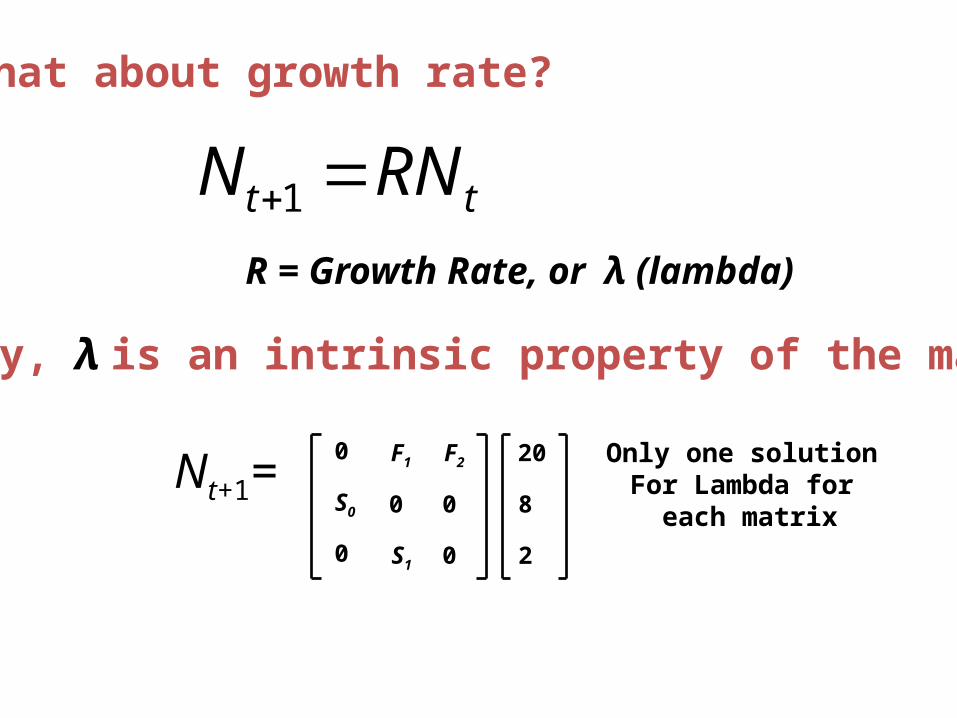
What about growth rate?
R = Growth Rate, or λ (lambda)
Luckily, λ is an intrinsic property of the matrix
Nt+1=0
0
S0
F1
S1
0
F2
0
0
20
8
2
Only one solution For Lambda for
each matrix

Natural log of lambda
Model output from paperThere are many values, because – they varied hypoxia and effects on
juvenile growth rate and calculated a lambda value for each simulation.
Hypoxia No Hypoxia