Embed Size (px)
Citation preview
7/30/2019 Population, Wealth, and Economic Growth in the Asia and Pacific Region
http://slidepdf.com/reader/full/population-wealth-and-economic-growth-in-the-asia-and-pacific-region 1/48
ADB Economics Working Paper Series
Population, Wealth, and Economic Growthin the Asia and Pacifc Region
Andrew Mason and Sang-Hyop Lee
No. 280 | October 2011

7/30/2019 Population, Wealth, and Economic Growth in the Asia and Pacific Region
http://slidepdf.com/reader/full/population-wealth-and-economic-growth-in-the-asia-and-pacific-region 2/48

7/30/2019 Population, Wealth, and Economic Growth in the Asia and Pacific Region
http://slidepdf.com/reader/full/population-wealth-and-economic-growth-in-the-asia-and-pacific-region 3/48
ADB Economics Working Paper Series No. 280
Population, Wealth, and Economic Growth
in the Asia and Paciic Region
Andrew Mason and Sang-Hyop Lee
October 2011
Andrew Mason is Senior Fellow, Population and Health, East-West Center, and Professor, Department of Economics, University of Hawaii at Manoa; Sang-Hyop Lee is Fellow, Population and Health, East-WestCenter, and Associate Professor, Department of Economics, University of Hawaii at Manoa. This paper
was prepared as a background paper for the Asian Development Outlook 2011 Update. The authors thankthe participants of the ADB Workshop on Demographic Transition and Economic Growth in Asia held19–20 May 2011 in Seoul, and the ADB Forum on Demographic Transition and Economic Growth in Asiaheld 22 J uly 2011 in Manila, for their many useful comments.

7/30/2019 Population, Wealth, and Economic Growth in the Asia and Pacific Region
http://slidepdf.com/reader/full/population-wealth-and-economic-growth-in-the-asia-and-pacific-region 4/48
Asian Development Bank6 ADB Avenue, Mandaluyong City1550 Metro Manila, Philippineswww.adb.org/economics
©2011 by Asian Development BankOctober 2011ISSN 1655-5252Publication Stock No. WPS124254
The views expressed in this paperare those of the author(s) and do notnecessarily reect the views or policiesof the Asian Development Bank.
The ADB Economics Working Paper Series is a forum for stimulating discussion and
eliciting feedback on ongoing and recently completed research and policy studies
undertaken by the Asian Development Bank (ADB) staff, consultants, or resource
persons. The series deals with key economic and development problems, particularly
those facing the Asia and Pacic region; as well as conceptual, analytical, or
methodological issues relating to project/program economic analysis, and statistical data
and measurement. The series aims to enhance the knowledge on Asia’s development
and policy challenges; strengthen analytical rigor and quality of ADB’s country partnership
strategies, and its subregional and country operations; and improve the quality and
availability of statistical data and development indicators for monitoring development
effectiveness.
The ADB Economics Working Paper Series is a quick-disseminating, informal publication
whose titles could subsequently be revised for publication as articles in professional
journals or chapters in books. The series is maintained by the Economics and Research
Department.
$ refers to United States dollars unless otherwise specied

7/30/2019 Population, Wealth, and Economic Growth in the Asia and Pacific Region
http://slidepdf.com/reader/full/population-wealth-and-economic-growth-in-the-asia-and-pacific-region 5/48
Contents
Abstract v
I. Introduction 1
II. The First Demographic Dividend 2
III. The Second Demographic Dividend 5
IV. Population, Savings, and Wealth 6
V. The Economic Life Cycle 8
VI. Support Ratio 11
VII. Life Cycle Wealth, Pensions, and Transfer Systems 15
A. Life Cycle Wealth in J apan 15 B. Life Cycle Wealth, Transfers, and Assets 18 C. Pension Assets 24
VIII. Human Capital 28
IX. Policy Implications and Conclusions 29
Appendix: Statistical Tables 31
References 38

7/30/2019 Population, Wealth, and Economic Growth in the Asia and Pacific Region
http://slidepdf.com/reader/full/population-wealth-and-economic-growth-in-the-asia-and-pacific-region 6/48

7/30/2019 Population, Wealth, and Economic Growth in the Asia and Pacific Region
http://slidepdf.com/reader/full/population-wealth-and-economic-growth-in-the-asia-and-pacific-region 7/48
Abstract
We explore how demographic changes in the Asia and Pacic region are likely
to inuence economic growth and other features of the regional economy.
While many low-income countries in the region will continue to experience ademographic dividend, over time population aging could drag on economicgrowth, especially in East Asia. A second potential problem from population agingis the strain on public transfer systems the effects of which, although smaller thanthose in Europe, J apan, or Latin America, will still be large. Countering theseproblems, however, population aging will lead to substantial capital deepening,
an effect of the second demographic dividend. Given current patterns of old-ageconsumption, production, and transfers, the total demand for pension assets willincrease very substantially over the coming decades. Under these circumstances,aging should not depress savings rates. Capital deepening and high standards of living are attainable despite signicant population aging.

7/30/2019 Population, Wealth, and Economic Growth in the Asia and Pacific Region
http://slidepdf.com/reader/full/population-wealth-and-economic-growth-in-the-asia-and-pacific-region 8/48

7/30/2019 Population, Wealth, and Economic Growth in the Asia and Pacific Region
http://slidepdf.com/reader/full/population-wealth-and-economic-growth-in-the-asia-and-pacific-region 9/48
I. Introduction
The Asia and Pacic region is extraordinarily diverse, but all of the economies are
experiencing a demographic transition with important common features related topopulation size, growth, and age structure. In many of them, demographic changefavors economic growth in both aggregate and per capita terms because working-agepopulations are growing more rapidly than dependent populations and are creating ademographic dividend. In a few economies in the region and in many more in the nearfuture, however, the obviously favorable demographics are coming to an end. Theywill experience slower growth and then declines in their working-age populations andsubstantial increases in their old-age populations. We explore how these demographicchanges are likely to inuence economic growth and other features of economies in the
Asia and Pacic region. Several key ndings emerge.
(i) Many countries including Bangladesh, India, Indonesia, Pakistan, and thePhilippines will continue to experience a demographic dividend as their working-age populations grow relative to their dependent populations. Favorable conditionsshould persist for at least the next 15 years and, in most cases, for much longer.
(ii) The magnitude of the demographic dividend depends on age patterns of laborincome and consumption. For most countries estimates of these patterns are notavailable, but based on eight economies of the region for which age proles have
been constructed, a substantial demographic dividend can be expected.
(iii) Over time, the populations of the Asia and Pacic region will become increasingly
concentrated at older ages where in all cases labor income is quite modest. Inpart this reects low levels of employment at older ages, but it also reects low
wages and productivity for older adults who are working.
(iv) Low labor income is often matched with high consumption among the elderly inhigh-income countries. This pattern is true of Asia as well although the picture is
more mixed. In middle- and low-income countries, the elderly are consuming atlevels similar to those for other adults.
(v) Population aging could serve as a drag on economic growth over the comingdecades as the effective number of workers declines relative to the effectivenumber of consumers. East Asia faces the most serious problems. In the Republicof Korea, for example, the support ratio is expected to decline by 0.8% per year

7/30/2019 Population, Wealth, and Economic Growth in the Asia and Pacific Region
http://slidepdf.com/reader/full/population-wealth-and-economic-growth-in-the-asia-and-pacific-region 10/48
over the next 40 years. In the absence of compensating changes, standards of living would thus be reduced by more than 25% between 2010 and 2050.
(vi) A second potential problem from population aging is the strain on public transfer
systems. The old-age transfer system is relatively underdeveloped in many Asiancountries so the effects would be smaller than those in J apan, Europe, or LatinAmerica, but the effects will still be large. In a “business as usual” simulation,transfer wealth (or implicit debt) would range from 90% of total labor income in thePacic island nations to 240% of total labor income in East Asia by 2050.
(vii) If countries in the region were to shift toward consumption, labor income, andtransfer patterns characteristic of rich countries, implicit debt would increaseto much higher levels. For the Asian Development Bank’s developing membercountries (DMCs), implicit debt would reach 320% of total labor income in 2030and 540% of total labor income in 2050.
(viii) Population aging will lead to substantial capital deepening. For the DMCs as awhole, given their low income proles, pension assets would rise from 1.2 times
total labor income to 2.1 times total labor income in 2030 and to 2.7 times in2050. Capital deepening should provide a boost to economic growth that easilydominates the effects of a declining support ratio.
(ix) Given current patterns of old-age consumption, production, and transfers, thetotal demand for pension assets will increase very substantially over the comingdecades, rising from $26 trillion in 2010 to $157 trillion in 2050.
(x) Under these circumstances, aging should not depress savings rates. The grosssavings rates required to meet the demand for pension assets would increasefrom 12.2% of gross domestic product (GDP) in 2010–2020 to 15.4% of GDP in2040–2050. The view that population aging will lead to lower savings rates is notborne out by the analysis presented here.
II. The First Demographic Dividend
A change in population age structure has a very direct, rst-order effect on incomeand consumption that does not depend on behavioral responses. An increase in thepopulation concentrated in the working ages, given output per worker, leads to anincrease in output or income per person. Holding the savings rate constant in additionto output per worker, an increase in the share of persons in the working ages leads tohigher consumption per person (Bloom and Williamson 1998, Mason 2001, Mason andLee 2007).
2 | ADB Economics Working Paper Series No. 280

7/30/2019 Population, Wealth, and Economic Growth in the Asia and Pacific Region
http://slidepdf.com/reader/full/population-wealth-and-economic-growth-in-the-asia-and-pacific-region 11/48
The demographic dividend follows from a simple identity:
C
NsY
L
L
N= −( ) ,1
(1)
where C/N is per capita consumption, s is the savings rate, Y/L is income per worker,and L/N is the support ratio, i.e., the number of workers per person. How changes inpopulation age structure inuence the savings rate and output per worker is an important
and complex issue. The effects of changes in population age structure through thesupport ratio, however, are direct and unambiguous. Age transitions in Asia, the Pacic,
and elsewhere are leading to swings in population concentrations in the working ages andswings in the support ratio matched by swings in per capita income and consumption.
The relationship between consumption growth and growth in the support ratio can also bereadily represented as a simple transformation of equation. Let gr [] represent the growth
rate:
gr C N gr s gr Y L gr L N[ ] [ ] [ ] [ ].= − + +1 (2)
Holding the savings rate and income per worker constant, the growth rate of income percapita and consumption are equal to the growth rate of the support ratio.1
Researchers have constructed the support ratio in different ways. One approach is touse a purely demographic measure: the population in the working ages divided by thetotal population. The approach used here is to incorporate age variation in the numeratorand denominator that reects systematic differences in labor income and consumption
over the life cycle. A similar approach was used by Cutler et al. relying on very simpleassumptions (Cutler et al. 1990). Here we exploit newly available, detailed estimates of consumption and labor income proles to construct the support ratio.
The value of labor provided by an additional individual of any age depends on agepatterns of labor force participation, hours worked, unemployment rates, and productivity.In general, the value of labor rises at young adult ages and then declines later in life,but details vary across countries inuenced by features of the labor market, investment
in education, returns on experience, skill obsolescence, disability patterns, employmentpractices, mandatory retirement policies, tax and pension systems, and so forth.
Consumption also varies systematically with age because of tastes, physiological factors,and many other issues. Age variation in consumption should not be ignored. The veryyoung do not produce, but they may not consume much. In some countries, the elderlydo not produce much, but they consume a great deal. Hence, an important renement
of the support ratio is to incorporate age variation in the value of goods and services
1 The growth rate o per capita income is equal to the sum o the second and third terms on the right-hand side.
Population, Wealth, and Economic Growth in the Asia and Pacific Region | 3

7/30/2019 Population, Wealth, and Economic Growth in the Asia and Pacific Region
http://slidepdf.com/reader/full/population-wealth-and-economic-growth-in-the-asia-and-pacific-region 12/48
produced and consumed at each age. This is accomplished by constructing a supportratio that uses weighted population:
L
N
y x P x t
c x P x t
t
t
x
x
=
∑
∑
0
0
( ) ( , )
( ) ( , ) ,
(3)
where y x0
( ) is the labor income age prole in the base year, c x0
( ) is the consumptionprole in the base year, and P x t( , ) is the population by age x.2
Two strategies have been employed in recent studies to estimate the demographicdividend. One approach is to apply a regression analysis to pooled, cross-section,time series data for national economies. This approach has been used by Bloom andWilliamson (1998), Bloom and Canning (2001), and Kelley and Schmidt (1995 and 2007).
An alternative approach is to rely on simulation models of varying complexities (Mason2001; Mason and Lee 2007; Mason, Lee et al. 2010; Romero, Patxot et al. 2010). Eitherapproach supports the view that the demographic dividend has been quantitativelyimportant, especially in East Asia.
The rate of growth of the support ratio—the rst demographic dividend—varies in its
timing and magnitude in each economy depending on the speed and magnitude of changes in population age structure. In East Asia, for example, the age transition hasbeen very rapid, and the swings in age structure have been very large. Changes inthe support ratio also depend on policies, institutions, and behavioral differences thatinuence the ages at which people enter and leave the labor force, age variation in
unemployment and hours worked, and age patterns of unemployment. Also inuencing itare factors that affect consumption at each age. Adding a child to a population will havea smaller effect than adding an elderly adult if the child consumes less than the adult(Mason 2005).
The analysis presented below builds on these concepts and exploits newly availableestimates of age patterns of labor income and consumption. New estimates of thesupport ratio and the rst demographic dividend are presented, which show benets from
an increasing support ratio, but in the future, a declining support ratio will pervade in theregion.
2 The labor income and consumption proles are both normalized by dividing them by the average labor income o
those aged 30–49. The consumption prole is scaled so that the average consumption o those aged 30–49 is 60%
o average labor income o those aged 30–49. This adjustment eliminates the eects o intercountry dierences in
savings rates on the support ratio.
4 | ADB Economics Working Paper Series No. 280

7/30/2019 Population, Wealth, and Economic Growth in the Asia and Pacific Region
http://slidepdf.com/reader/full/population-wealth-and-economic-growth-in-the-asia-and-pacific-region 13/48
III. The Second Demographic Dividend
The support ratio quanties the rst-order effect on income or consumption of changes
in the population age structure. Income per capita varies in direct proportion to changes
in the support ratio given income per worker; consumption per capita varies in directproportion to changes in the support ratio given income per worker and the savings rate.In the absence of other changes, age transition can lead to more rapid economic growth,but with population aging, the support ratio declines and economic growth is curtailed.Responses to demographic changes by individuals, families, rms, and governments may,
however, lead to very different and possibly more favorable outcomes.
In general, societies can respond to changes in population age structure in one of fourways. One possibility is to allow consumption to vary. Standards of living will rise as thesupport ratio becomes more favorable and will decline as it deteriorates. This would bethe inevitable outcome if societies relied exclusively on transfer programs to meet the
needs of dependent populations. Transfer systems can affect the distribution of incomeand consumption but not the totals; hence, per capita income and consumption will riseand fall with the support ratio.
A second possible response is to change policies or behaviors that link change inpopulation age structure to the support ratio. People can work longer by delayingretirement, and women may choose to enter the formal labor force in greater numbersin part as a result of lower fertility. As older adults enjoy longer, healthier lives, delayingretirement appears to be a natural response. Policies that prohibit and discourage olderworkers from continuing their employment can be reformed. Consumption patterns,particularly spending on health care and long-term care, are also very important.
A third possibility is to increase investment in human capital. Low fertility results inrelatively fewer workers, but increased spending on human capital can make them moreproductive. This possibility is discussed in some detail by Lee and Mason (2010), Ogawaet al. (2009), and Prettner and Prskawetz (2010).
A fourth possible response is that workers may increase their savings in order to funda longer period of retirement. They may do this through personal savings, throughpension systems funded by employers, or through publicly funded retirement programs.
This response initially leads to higher savings and lower consumption, but the additionalcapital that is generated is growth-enhancing, and eventually income per worker rises,offsetting to some extent the decline in the support ratio. Not all changes in savings andwealth are necessarily behavioral, however, and changes in the age composition of thepopulation also have an important inuence.
Population, Wealth, and Economic Growth in the Asia and Pacific Region | 5

7/30/2019 Population, Wealth, and Economic Growth in the Asia and Pacific Region
http://slidepdf.com/reader/full/population-wealth-and-economic-growth-in-the-asia-and-pacific-region 14/48
IV. Population, Savings, and Wealth
Concerns often raised about population aging are that it will lead to lower savings ratesand a decline in capital and to all of the attendant economic problems, e.g., slower
economic growth and a collapse in asset prices. Among mainstream economists,however, the most familiar idea about the relationship between population and capital isembodied in the Solow growth model. Solow showed that given a constant savings rate,slower labor force growth would lead to an increase in capital per worker and per capitaincome (Solow 1956). Thus, in the simple accounting identity—equation (2)—changes inthe growth rate of the labor force will inuence output per worker. Given the savings rate,
a decline in the support ratio due to a decline in the growth rate of the effective laborforce will lead to capital deepening and to higher income per capita. Capital deepeninginduced by slower labor force growth will to some extent offset the effect on economicgrowth of the decline in the support ratio that occurs as populations grow more slowlyand age.
To understand how changes in population age structure inuence the capital–output ratio
and labor productivity, it is essential to understand how the aggregate savings rate isinuenced by changes in population age structure. Many studies have addressed this
issue relying on the life cycle savings model. Tobin (1967) extended the neoclassicalgrowth model with endogenous life cycle savings. Cutler et al. (1990) explored the effectsof aging using a Ramsey framework and concluded that population aging would lead tohigher standards of living because a lower savings rate would be needed to maintainthe capital output ratio in an aging United States (US) economy. Mason and Lee (2007)modeled a small open economy and showed that population aging would lead to asubstantial increase in assets that would be sufcient to offset the effects on per capita
consumption of a decline in the support ratio, but only if there were strong reliance onlife cycle savings to fund old-age retirement. If countries rely primarily on either publicor private transfers to support retirement needs, population aging leads to a signicant
decline in per capita income and per capita consumption.
A similar conclusion is reached for a closed economy in equilibrium (Lee and Mason2010, Romero et al. 2010) and in economies with immigration (Mason et al. 2010). Thesestudies vary in their details but agree that population aging may lead to an increasein capital and standards of living because it will not lead to a decline in savings ratessufcient to offset the capital deepening effects of slower labor force growth. An important
point, however, is that the link between population aging, savings, and capital will dependto a signicant degree on the extent to which saving is motivated by life cycle concerns.
This, in turn, will depend on the extent to which the elderly are relying on continued work,adult children, and public transfer programs rather than on personal wealth to support old-age consumption.
6 | ADB Economics Working Paper Series No. 280

7/30/2019 Population, Wealth, and Economic Growth in the Asia and Pacific Region
http://slidepdf.com/reader/full/population-wealth-and-economic-growth-in-the-asia-and-pacific-region 15/48
Many studies have considered the effects of changes in population age structure onsavings rates. Relying on variants of the life cycle model, several have used aggregate,cross-section, time series data to estimate the effects of age structure on aggregatesavings (Mason 1981, Fry and Mason 1982, Mason 1988, Higgins and Williamson 1997,
Higgins 1998, Bosworth and Chodorow-Reich 2007) and have concluded that savingsrates will rise and then fall over the course of the demographic transition.
The strong effects on savings of population age structure are often driven by savingsrates in Asia which have experienced especially large swings during the demographictransition. Several explanations have been offered for why these patterns have beenso important in Asia including the rapid rate of economic growth, less reliance on publictransfer systems for old-age support, and the speed of the demographic transition. Usingboth historical and contemporary data, Kinugasa (2004) and Kinugasa and Mason (2007)showed that rapid increases in life expectancy led to high savings rates and increases inwealth per capita. An important feature of their result is that the nding in contemporary
economies is conned to Asia where transfer systems tend to be less important for old-age support than they are in Europe and Latin America.
The empirical evidence about savings and demography is far from settled as saving maybe very context dependent in ways that have not been fully captured by empirical models(Zhang and Zhang 2005). Another difculty is that behavioral responses to population
aging are quite complex. Increases in life expectancy and the duration of retirementmay inuence the age at retirement (Bloom et al. 2003), the extent to which the elderly
can rely on family members for support, and the magnitude of public transfer systems(Preston 1984).
Simulation analyses have often been used to consider the implications of population agestructure for life cycle savings. One value of such models is to assess whether the largeswings in savings rates observed in Asian countries, for example, can be explained bythe life cycle model. Most studies have concluded that demographic change producesswings in savings rates that are more modest than the observed changes and moremodest than those implied by empirical studies. Lee, Mason et al. (2003), for example,concluded that changes in age structure can explain US savings trends but not thesharp increases in savings in Taipei,China which can instead be explained by changes inpopulation age structure combined with a rapid shift in the old-age support system fromfamilial transfers to life cycle savings.
Population, Wealth, and Economic Growth in the Asia and Pacific Region | 7

7/30/2019 Population, Wealth, and Economic Growth in the Asia and Pacific Region
http://slidepdf.com/reader/full/population-wealth-and-economic-growth-in-the-asia-and-pacific-region 16/48
V. The Economic Lie Cycle
Changes in population age structure matter only because the human life cycle inuences
economic behavior in important, fundamental ways. During the periods of “dependency”
at the beginning and the end of life, we consume much more than we produce throughour labor. Sandwiched between is a period during which we consume much less than weproduce through our labor. This economic life cycle is central to our analysis. First, theinteraction between the economic life cycle and population age structure determines thesupport ratio and the magnitude of the demographic dividend. The economic life cycle iscritical to the timing and magnitude of the dividend and is also critical to identifying waysin which changes in behavior or policies might inuence it. Second, the economic life
cycle is the fundamental building block for life cycle savings as it determines life cycleneeds for accumulating wealth.
The National Transfer Accounts (NTA) provide comprehensive estimates of economic
ows by age in a manner consistent with national income and product accounts; researchteams in 35 countries are currently constructing them. In Asia, accounts have beenconstructed for eight economies: the People’s Republic of China (PRC); India; Indonesia;
J apan; the Republic of Korea; Philippines; Taipei,China; and Thailand (Lee et al. 2008,Mason et al. 2009, Lee and Mason 2011). Detailed information about NTA is available atwww.ntaccounts.org.
The economic life cycle is dened by age proles of labor income and consumption.
Labor income is a comprehensive measure of the value of labor production at each agereecting age variation in labor force participation, unemployment rates, hours worked,
and wages. Labor income includes the estimated value of labor of unpaid family workerswho often are young or old. Also included are benets provided by employers including
their contributions to publicly funded social security programs. Labor income does not,however, include the value of time spent in child rearing and other important forms of in-home production.
Consumption is also a comprehensive measure that is both public and private. Publiceducation and publicly funded health care, for example, are allocated to age groupsrelying on a combination of administrative records and household surveys. Nonassignablepublic consumption is allocated to age groups in proportion to the population in those agegroups. Private consumption is allocated to age groups using nationally representativehousehold surveys. Detailed methods are described in the references provided above.
NTA estimates are currently available for 23 economies. Per capita labor income andconsumption proles are charted in Figure 1 using simple averages in four different
groups. The low-income group includes the 12 economies with the lowest per capitaincomes, and the high-income group includes the 11 with higher per capita incomes.In Asia, the low-income group includes the PRC, India, Indonesia, the Philippines,
8 | ADB Economics Working Paper Series No. 280

7/30/2019 Population, Wealth, and Economic Growth in the Asia and Pacific Region
http://slidepdf.com/reader/full/population-wealth-and-economic-growth-in-the-asia-and-pacific-region 17/48
and Thailand. The high-income group includes J apan; the Republic of Korea; and Taipei,China.
Figure 1: Per Capita Consumption and Labor Income by Age in Low- and High-Income
Economies
0.0
0.2
0.4
0.6
0.8
1.0
1.2
Relative to Mean
Labor Income 30–49
Age
0 10 20 30 40 50 60 70 80 90 100
Asia Low c Asia Low yl Asia High c
Asia High yl Low Income c Low Income yl
High Income c High Income yl
c = consumption, yl = labor income.
Sources: Lee and Mason, orthcoming; NTA database, available: www.ntaccounts.org, accessed 12 May 2011.
The labor income proles for high-income economies and Asian high-income economies
are very similar except that labor income is somewhat higher in Asia than in the combined
high-income prole. Likewise, the labor income prole in the low-income economies of Asia is very similar to that in low-income economies in general though it has a somewhatdifferent prole than that in high-income economies. In low-income economies, labor
income rises at a somewhat earlier age but a bit more slowly than in high-incomeeconomies. The peaks come at similar ages. At older ages, low-income economies haverelatively high labor incomes.
The consumption prole for low-income Asian economies is not much different than that
of low-income countries in general. Consumption rises with age during childhood andthen is remarkably at across adult ages. In high-income economies, child consumption
is higher at all ages, particularly among school-age children. Human capital spending on
children is very high in high-income Asian economies, and the consumption prole is notat over the adult ages. Consumption is higher among adults in their late 50s and 60s
compared with younger adults.
Starting in the late 60s or early 70s, consumption rises steeply in non-Asian high-incomecountries but is less pronounced in Asia. The steep increase is primarily a consequence
Population, Wealth, and Economic Growth in the Asia and Pacific Region | 9

7/30/2019 Population, Wealth, and Economic Growth in the Asia and Pacific Region
http://slidepdf.com/reader/full/population-wealth-and-economic-growth-in-the-asia-and-pacific-region 18/48
of high levels of spending on health and long-term care. Asia’s high-income economiesare quite varied, however. Consumption rises steeply at older ages in J apan, less so in
Taipei,China, and actually declines in the Republic of Korea. It must be kept in mind thatthese estimates are for a year near 2000. Some important changes may have occurred
in recent years, but the key features of the proles are quite persistent based on apreliminary analysis of time series estimates.
Aggregate consumption and labor income by age vary considerably as populationage structure changes. This point is illustrated in Figure 2, which compares aggregateconsumption and production by age in India with aggregate consumption and productionby age in Japan. In India, the life cycle decit for children—the difference between their
consumption and labor income—is enormous while the life cycle decit for the elderly is
relatively small. In Japan, however, the old-age decit for the elderly is somewhat larger
than the decit for the young. Although the per capita proles for India differ from Japan’s,
population age structure is the main cause for the difference in the aggregate proles for
these two countries and for other countries that have been studied.
Figure 2: Aggregate Consumption and Labor Income by Age in Japan and India in 2004
0.0
0.5
1.0
1.5
2.0
2.5
3.0
3.5
4.0
0 10 20 30 40 50 60 70 80 90
Percent of Total
Labor Income
Age
Japan
Consumption Labor Income
0.0
0.5
1.0
1.5
2.0
2.5
3.0
3.5
0 10 20 30 40 50 60 70 80 90
Percent of Total
Labor Income
Age
India
Source: National Transer Accounts database, www.ntaccounts.org accessed 12 May 2011.
10 | ADB Economics Working Paper Series No. 280

7/30/2019 Population, Wealth, and Economic Growth in the Asia and Pacific Region
http://slidepdf.com/reader/full/population-wealth-and-economic-growth-in-the-asia-and-pacific-region 19/48
Studies of the economic implications of population age structure usually emphasize theoverall level of dependency using the support ratio, the dependency ratio, or a similarmeasure. The next section follows this approach by describing changes in the supportratio that are occurring in Asia. This is a very useful starting point for considering the
economic implications of changes in population age structure, but it is very important tokeep in mind that it is only a starting point.
VI. Support Ratio
The support ratio shown in equation (3) for the Asia and Pacic economies was
constructed using population data and the age proles of consumption and labor income
shown in Figure 1. The population data were taken from United Nations (UN) populationestimates and projections based on the medium fertility scenario. For the base year laborincome and consumption weights, the low-income Asian proles were used except for
J apan; Hong Kong, China; Malaysia; the Republic of Korea; Singapore; and Taipei,Chinawhere high-income proles were used. See Appendix Table 1 for detailed estimates.
The East Asian DMCs in the second panel of Figure 3 are distinctive because theirage transition has been so rapid. The PRC provides a useful benchmark against whichother countries can be compared. The support ratio declined between 1950 and theearly 1970s due to improved child survival then began to increase as a consequence of lower birth rates and child dependency. This increase has continued since 1972, but it iscurrently very close to its peak. In the coming decades, the support ratio will decline as
smaller cohorts begin entering the labor force and as the elderly live to older ages. By2050, the support ratio in the PRC will be only slightly greater than it was in 1950.
As in the PRC, the support ratio declined in most Asian developing countries and thenincreased in essentially all of them though the point at which it began to increase variedconsiderably. A broad perspective on the growth in the support ratios is provided inFigure 4, which plots their growth rates in each economy against the rate of growth of the effective number of producers during four periods. The effective number of producersis the population weighted by the labor income prole, i.e., the numerator of the support
ratio. From 1950 to 1975, the effective number of workers was growing between 1%and 3% per annum in all but a few countries, but in most cases, the effective number
of consumers was growing even more rapidly, and the support ratio was declining by asmuch as 1% per year.
Population, Wealth, and Economic Growth in the Asia and Pacific Region | 11

7/30/2019 Population, Wealth, and Economic Growth in the Asia and Pacific Region
http://slidepdf.com/reader/full/population-wealth-and-economic-growth-in-the-asia-and-pacific-region 20/48
Figure 3: Support Ratios in the Asia and Pacic Region, 1950–2050
0.5
0.7
0.9
1.1
1950 60 70 80 90 2000
Support Ratio
Central and West Asia
1.1
Support Ratio
East Asia
1.1
Support Ratio
SouthAsia
Afghanistan
Armenia
Kazakhstan
Pakistan
Turkmenistan
60
1950
Azerbaijan
Georgia
Kyrgyz Republic
Tajikistan
Uzbekistan
0.5
0.7
0.9
1.1
Support RatioSoutheast Asia
Brunei Darussalam
Indonesia
Myanmar
Singapore
Viet Nam
Cambodia
Malaysia
Philippines
Thailand
0.5
0.7
0.9
People's Republic of China
Republic of Korea
Taipei,China
Hong Kong, China
Mongolia
0.5
0.7
0.9
1.1
Support Ratio
The Pacic
Republic of Fiji
Papua New Guinea
Solomon Islands
Tonga
Micronesia, Fed. States of
Samoa
Timor-Leste
Vanuatu
0.5
0.7
0.9
Bangladesh
Sri Lanka
Maldives
Bhutan
India
Nepal
0.5
0.7
0.9
1.1
Support Ratio
Developed Countries
Australia
New Zealand
Japan
10 20 30 40 50 1950 60
60
60
70 80 90 2000 10 20 30 40 50
60 70 80 90 2000 10 20 30 40 50 1950 70 80 90 2000 10 20 30 40 50
1950 60 70 80 90 2000 10 20 30 40 50 1950 70 80 90 2000 10 20 30 40 50
Source: Authors’ calculations using the NTA database, available: www.ntaccounts.org, accessed 29 June 2011.
12 | ADB Economics Working Paper Series No. 280

7/30/2019 Population, Wealth, and Economic Growth in the Asia and Pacific Region
http://slidepdf.com/reader/full/population-wealth-and-economic-growth-in-the-asia-and-pacific-region 21/48
Figure 4: Support Ratio versus Efective Number o Producers, Annual Growth Rates in the
Asian and Pacic Economies, 1950–2050
–1.0
–0.50.0
0.5
1.0
1.5
–1.0
–0.5
0.0
0.5
1.0
1.5
–2 –1
–2 –1
0 1 2 3 4 5
Support Ratio,
Growth (%)
Eective Number of Producers, Growth (%)
1950–1975
Support Ratio,
Growth (%)
1975–2000
Support Ratio,
Growth (%)
2000–2025
Support Ratio,
Growth (%)
2000–2025
–1.0
–0.5
–1.0
–0.5
0.0
0.5
1.0
1.5
–2 –1
–2 –1
0 1 2 3 4 5
Eective Number of Producers, Growth (%)
Eective Number of Producers, Growth (%)
0 1 2 3 4 50.0
0.5
1.0
1.5
0 1 2 3 4 5
Eective Number of Producers, Growth (%)
Source: Authors’ calculations using the NTA database, available: www.ntaccounts.org, accessed 29 June 2011.
Between 1975 and 2000, the rate of growth of effective producers shifted toward zeroin some countries but remained very high in many others. The mass of points shiftedto a higher level as the greater majority of countries experienced a rising support ratio.
The next 50 years is marked by a steady shift toward the southwest quadrant where theeffective number of workers and the support ratio are both declining.
Two phases in the trend in the support ratio are of particular interest: the rise that markedthe rst demographic dividend and the decline that for most countries is coming in the
future. The timing and magnitude of the rst dividend are quite varied. In the Republic of
Korea, the support ratio began its steep ascent in 1966 while in Pakistan it did not beginto rise for another 20 years. The support ratio is expected to peak in the PRC in 2015after rising for more than 4 decades. A few other countries have similarly rapid transitions,e.g., Thailand and Viet Nam. For many others, the transition from trough to peak is muchslower e.g., 51 years in Bangladesh, 69 years in India, and 77 years in the Philippines
(Table 1).
Population, Wealth, and Economic Growth in the Asia and Pacific Region | 13

7/30/2019 Population, Wealth, and Economic Growth in the Asia and Pacific Region
http://slidepdf.com/reader/full/population-wealth-and-economic-growth-in-the-asia-and-pacific-region 22/48
Table 1: Growth in the Support Ratio during the First Demographic Dividend
in Selected Countries
Minimum Maximum
Span
Total Gain
(%)
Annual Gain
(%)
Support
Ratio Year
Support
Ratio Year
Bangladesh 0.69 1982 0.98 2033 51 42.1 0.69
China, People’s Rep. o 0.75 1972 1.00 2015 43 33.0 0.66
India 0.75 1973 0.97 2042 69 29.3 0.37
Indonesia 0.74 1976 0.96 2026 50 30.3 0.53
Japan 0.69 1950 0.86 1978 28 24.5 0.78
Korea, Rep. o 0.64 1966 0.93 2010 44 46.1 0.86
Pakistan 0.71 1986 0.92 2050 64 30.7 0.42
Philippines 0.68 1969 0.92 2046 77 36.2 0.40
Thailand 0.71 1971 0.99 2011 40 39.9 0.84
Viet Nam 0.67 1980 0.97 2021 41 44.8 0.90
Source: Authors’ calculations using the NTA database, available: www.ntaccounts.org, accessed 29 June 2011.
In many Asian economies, the support ratio is projected to decline substantially by 2050,but in many others, the impact of population aging will just be starting. The support ratiois expected to drop to very low levels in Hong Kong, China; the Republic of Korea; andSingapore by 2050 while elsewhere it will decline substantially after 2050. Table 2 showsvalues for the same set of countries in Table 1 after the support ratio has peaked. ThePRC, J apan, and the Republic of Korea are three countries in which the declining supportratio could be a serious drag on economic growth.
Table 2: Growth in the Support Ratio ater the First Demographic Dividend
in Selected Countries
Maximum Support
Ratio in2050 Span
Total
Loss(%)
Annual
Gain(%)
SupportRatio Year
Bangladesh 0.98 2033 0.94 17 −3.7 −0.22
China, People’s Rep. o 1.00 2015 0.87 35 −12.7 −0.39
India 0.97 2042 0.96 8 −1.0 −0.12
Indonesia 0.96 2026 0.91 24 −6.1 −0.26
Japan 0.86 1978 0.64 72 −26.2 −0.42
Korea, Rep. o 0.93 2010 0.68 40 −27.2 −0.79
Pakistan 0.92 2050 0.92 0 0.0 na
Philippines 0.92 2046 0.92 4 −0.1 −0.03
Thailand 0.99 2011 0.89 39 −10.1 −0.27
Viet Nam 0.97 2021 0.89 29 −8.2 −0.30
na = not available.
Source: Authors’ calculations using the NTA database, available: www.ntaccounts.org, accessed 29 June 2011.
The direct effect of the support ratio on per capita consumption—the rst demographic
dividend—is captured in equation (2). Given the savings rate and output per effectiveworker, an increase of 1% in the support ratio produces a 1% increase in consumptionper effective consumer. The nal two columns in Table 1 report the total gain in the
14 | ADB Economics Working Paper Series No. 280

7/30/2019 Population, Wealth, and Economic Growth in the Asia and Pacific Region
http://slidepdf.com/reader/full/population-wealth-and-economic-growth-in-the-asia-and-pacific-region 23/48
support ratio and the annual gain during the rst dividend phase. The Republic of Korea
has the largest total gain with an increase in consumption per effective consumer of 46%. Similar gains are projected for Bangladesh and Viet Nam. In contrast, the totalgains for the PRC and India are smaller at 33% and 29%, respectively. Appendix Table 1
summarizes the support ratio for all the Asia and Pacic economies for which estimatescould be constructed.
VII. Lie Cycle Wealth, Pensions, and Transer Systems
The economic life cycle is key to understanding how changes in population age structureinuence the demand for life cycle wealth. Basic concepts are illustrated based on the
experience of Japan before we look in more depth at the situation across the Asia–Pacic
region.
A. Lie Cycle Wealth in Japan
The relationship between demographics and the demand for life cycle wealth can becalculated given age proles of consumption and labor income. For any cohort of adults
aged x in year t, life cycle wealth is dened as the present value of lifetime consumption
less the present value of lifetime labor income. This follows directly from the lifetimebudget constraint and the assumption of no bequests. Life cycle wealth is the wealthnecessary to realize a particular level of consumption at each future age given laborincome at each future age. In order to construct a measure of life cycle wealth, we
made several simplifying assumptions. First, the shapes of the age proles of per capita consumption and labor income do not change over time, but they shift upwardat a constant rate of growth. Second, the population is closed to immigration. Third, thediscount rate is exogenous and constant. This removes potentially important generalequilibrium considerations or economic feedback that has been explored in other studiesdiscussed above.
Two demographic factors are considered here: changes in life expectancy that inuence
an individual’s savings and changes in age structure that arise due both to longer lifeexpectancy and to fertility declines. First, the effects of longer life expectancy on savingsare analyzed by calculating the path of life cycle wealth over the life cycle for three
different synthetic cohorts subject to the mortality conditions that prevailed in J apan in1949, 1979, and 2009. J apan’s mortality experience is quite useful for considering theeffects of longer life expectancy because in the aftermath of World War II, J apan hadthe shortest life expectancy of any industrialized country; now it has the longest. Thus,the simulated changes for J apan are the maximum one could anticipate over a 60-yearperiod.
Population, Wealth, and Economic Growth in the Asia and Pacific Region | 15

7/30/2019 Population, Wealth, and Economic Growth in the Asia and Pacific Region
http://slidepdf.com/reader/full/population-wealth-and-economic-growth-in-the-asia-and-pacific-region 24/48
The effect of gains in life expectancy on the demand for life cycle pension wealth mayseem obvious to those who are not demographers. If people live longer but do not worklonger, they must accumulate more wealth to support their old-age consumption. Gainsin life expectancy, however, add years at all ages. When life expectancy is low, the
gains tend to be concentrated at younger ages when people are both consuming andproducing. As life expectancy reaches high levels, additional gains are concentrated atold ages where the effects on the demand for life cycle wealth are clear.
Figure 5 shows the demand for life cycle pension wealth using the per capitaconsumption and labor income proles for Japan in 2004 (Ogawa et al. 2010) and age-
specic mortality rates for Japan in 1949, 1979, and 2009 (Human Mortality Database).
These values are for synthetic cohorts based on the assumption that mortality conditionsremain constant at the levels observed in a particular year. The present value iscalculated using a discount rate of 3%.
Figure 5: Simulated Per Capita Lie Cycle Pension Wealth by Age or Japan
0
2
4
6
8
10
12
14
40 50 60 70 80 90
Life Cycle Wealth /
Yl(30–49)
Age
e0=56.9 e0=76.2 e0=87.3
e0 = lie expectancy, yl = labor income.
Source: Consumption and labor income proles are NTA estimates or Japan in 2004 (Ogawa et al. 2010). Lie expectancy and age-
specic mortality rates are estimates or Japan or 1949, 1979, and 2009 (Human Mortality Database 2011, available: www.
mortality.org, accessed 12 May 2011).
Life cycle wealth for each mortality level follows the classic life cycle pattern rising asindividuals approach retirement, peaking during the early to mid-60s, and then declining.
The accumulation does not begin until around age 40 because of the costs of child
rearing that younger parents must bear. The proles are shown only to age 90 butare calculated to higher ages (110 in 2009 and 1979; 107 in 1949). Given longer lifeexpectancy, accumulation begins at a somewhat earlier age and is substantially higher atevery age once begun.
16 | ADB Economics Working Paper Series No. 280

7/30/2019 Population, Wealth, and Economic Growth in the Asia and Pacific Region
http://slidepdf.com/reader/full/population-wealth-and-economic-growth-in-the-asia-and-pacific-region 25/48
The upward shift in the age prole of life cycle wealth generated by the rise in life
expectancy is summarized in Table 3. The average of life cycle pension wealth iscalculated as a simple average of the values for ages 50–90 inclusive. Given 1949mortality conditions, the average life cycle wealth per person was about 5 times the
average annual pre-tax labor income of a prime working-age (30–49) adult. The averagerose to 6.7 times average labor income given 1979 mortality conditions and 9.2 timesannual labor income given 2009 mortality conditions.
Table 3: Lie Expectancy and Lie Cycle Pension Wealth in Japan
1949 1979 2009
Lie expectancy at birth 56.9 76.2 87.3
Lie cycle pension wealth 5.08 6.72 9.17
Partial eect 0.09 0.22
Elasticity 1.13 2.65
Note: Lie cycle wealth is the simple average o values or those aged 50–90 normalized on labor income o those aged 30–49.
Partial eect is change in wealth divided by the change in lie expectancy. Elasticity is the percentage change in wealth
divided by the percentage change in lie expectancy. Both measures are or the 30-year periods.
Source: Authors’ calculations using the NTA database, available: www.ntaccounts.org, accessed 29 June 2011.
The gain in life expectancy was much greater between 1949 and 1979 than between1979 and 2009. The partial effect of an additional year of life expectancy is greaterafter 1979. Between 1949 and 1979, a 1-year increase in life expectancy shifted theage prole of wealth upward by about 0.1 of the annual pretax labor income of a prime
working-age adult, but between 1979 and 2009, a 1-year increase shifted it upward byabout 0.2 (partial effect). A similar conclusion follows using elasticities to compare effects.A 1% increase in life expectancy led to a 1.1% increase in wealth between 1949 and
1979 and to a 2.7% increase between 1979 and 2009.
The economywide demand for life cycle pension wealth depends on age structure aswell as on changes in the age prole of life cycle wealth. The Japanese demand for life
cycle wealth peaks when cohorts are in their early 60s, hence an increased concentrationof the population near these peak wealth ages leads to greater aggregate wealth. Inthe special case of a steady-state population, the age distribution depends on the ageschedule of survival and the rate of population growth (the fertility rate). A shift from lowlife expectancy and a high rate of population growth—characteristics of countries in theearly stages of the demographic transition—yields a ratio of life cycle wealth-to-labor-income of only 1.5 (Table 4). By comparison, rates characteristic of rapidly aging societies
(a life expectancy of 87 and a population growth rate of –1% per year) yields a wealth-to-labor-income ratio of 12.3.
Population, Wealth, and Economic Growth in the Asia and Pacific Region | 17

7/30/2019 Population, Wealth, and Economic Growth in the Asia and Pacific Region
http://slidepdf.com/reader/full/population-wealth-and-economic-growth-in-the-asia-and-pacific-region 26/48
Table 4: Lie Cycle Pension Wealth Relative to Total Labor Income
Population Growth Rate
Lie Expectancy at Birth
87.3 76.2 56.9
−0.01 12.3 7.5 4.1
0.00 8.4 5.3 2.9
0.01 5.7 3.7 2.10.02 3.9 2.6 1.5
Note: Values were calculated using the age proles o lie cycle wealth rom Figure 5 and the population age distribution implied
population growth rate and lie table values (Lx) or Japan, as taken rom the Human Mortality Database (www.mortality.
org) accessed 6 April 2011.
Source: Authors’ calculations.
The values in Table 4 rely on a steady-state assumption and hence provide little insightabout the dynamics of life cycle wealth holdings. In the next section, the same conceptsare applied in a more detailed fashion to project life cycle wealth over the next 4 decadesin the Asia and Pacic region. The analysis goes beyond this calculation, however, to
assess the extent to which the demand for life cycle wealth will be met by accumulating
pension assets and by expanding transfers to support the elderly.
B. Lie Cycle Wealth, Transers, and Assets
Life cycle wealth is projected by assuming that given age patterns of consumption andlabor income persist into the future while allowing for a constant and exogenous changein labor productivity due, for example, to technological progress. The objective of theprojections is to answer the following question: In the absence of a labor response, howmuch additional wealth is required to sustain consumption levels that keep pace withchanges in productivity? In effect, two of the possible responses to population aging areruled out: sacricing consumption and increasing work effort.
The additional wealth required to meet the needs of the elderly can be obtained in twoways. One way is to establish or expand transfer programs that provide pensions andfund health care services and other needs of the elderly. The alternative is to accumulateassets that can fund these same needs. The projections presented here presentalternatives based on the experience of NTA economies in Asia that differ considerably intheir emphasis on transfers versus assets in funding old-age consumption.
Life cycle wealth is projected in the following way. Two scenarios are constructed basedon the age proles of per capita consumption and labor income for high- and low-income
Asian NTA economies as shown in Figure 1. The consumption and labor income proles
are assumed to shift at a constant rate that is exogenously given. Total consumptionand labor income at each age in a given year are calculated by combining the proles of
consumption and labor income with the projected population for each cohort. The presentvalue of consumption and labor income for each cohort is calculated using a constantdiscount rate. Life cycle wealth at each age is calculated as the difference between thepresent value of consumption and labor income at each age.
18 | ADB Economics Working Paper Series No. 280

7/30/2019 Population, Wealth, and Economic Growth in the Asia and Pacific Region
http://slidepdf.com/reader/full/population-wealth-and-economic-growth-in-the-asia-and-pacific-region 27/48
Life cycle wealth arises in part to meet the needs of children, but our interest here isthe life cycle wealth required to meet the needs of the elderly. Life cycle pension wealthis dened as life cycle wealth used to fund consumption in old age. In order to isolate
life cycle pension wealth, we assumed that adults fund their children and then fund their
retirements; hence, life cycle pension wealth is approximated by the positive portion of lifecycle wealth held by older adults as shown for J apan in Figure 5.
Transfers and asset-based reallocations as shares of consumption at each age are heldconstant.3 Note that transfers include both public and private transfers including familialtransfers. We assumed that the ratio of pension assets to pension transfer wealth is equalto the ratio for adults 65 and older. Two age proles of per capita net transfers by age
are used, one from high-income Asian economies and the other from low-income Asianeconomies. Asset-based reallocations are estimated as the balancing item drawing onthe identity that consumption must equal asset-based reallocations plus net transfers pluslabor income.
The population estimates and projections used here for 1950–2050 are from the UNPopulation Division, World Population Prospects 2008 (UN 2009).4 Longer-termprojections are required to calculate wealth because each cohort must be tracked over itsentire lifetime. Thus, long-term projections prepared by the UN Population Division havebeen used to extend the standard population projections in such a way as to minimizediscontinuities that are otherwise introduced into the calculations. Details are availablefrom the authors.
As noted, life cycle wealth can be accumulated in the form of assets or transfer wealth. These values are also projected by assuming that net transfers fund a constant share of
consumption by the elderly of a given age. Thus, the importance of net transfers to theelderly varies as the age distribution of the elderly population changes. As will be seen,the very old are more reliant on transfers than the younger elderly, hence the importanceof transfers increases as elderly populations become older.
The ratio of life cycle pension wealth to labor income is charted in Figures 6 and 7 at 10-year intervals from 1950 to 2050 for regional groups. The average values are calculatedusing GDP weights rather than as simple averages of the values for countries that aremembers of each group. Hence, the values for East Asia are dominated by the PRC,for South Asia by India, and for non-DMCs by J apan. Country values are reported inAppendix Tables 2 and 3.
3 This assumption means that the transer burden on the non elderly will increase as populations age.4 The UN does not produce population projections or Taipei,China and or some small DMCs. Population projections
rom the NTA database are used or Taipei,China.
Population, Wealth, and Economic Growth in the Asia and Pacific Region | 19
7/30/2019 Population, Wealth, and Economic Growth in the Asia and Pacific Region
http://slidepdf.com/reader/full/population-wealth-and-economic-growth-in-the-asia-and-pacific-region 28/48
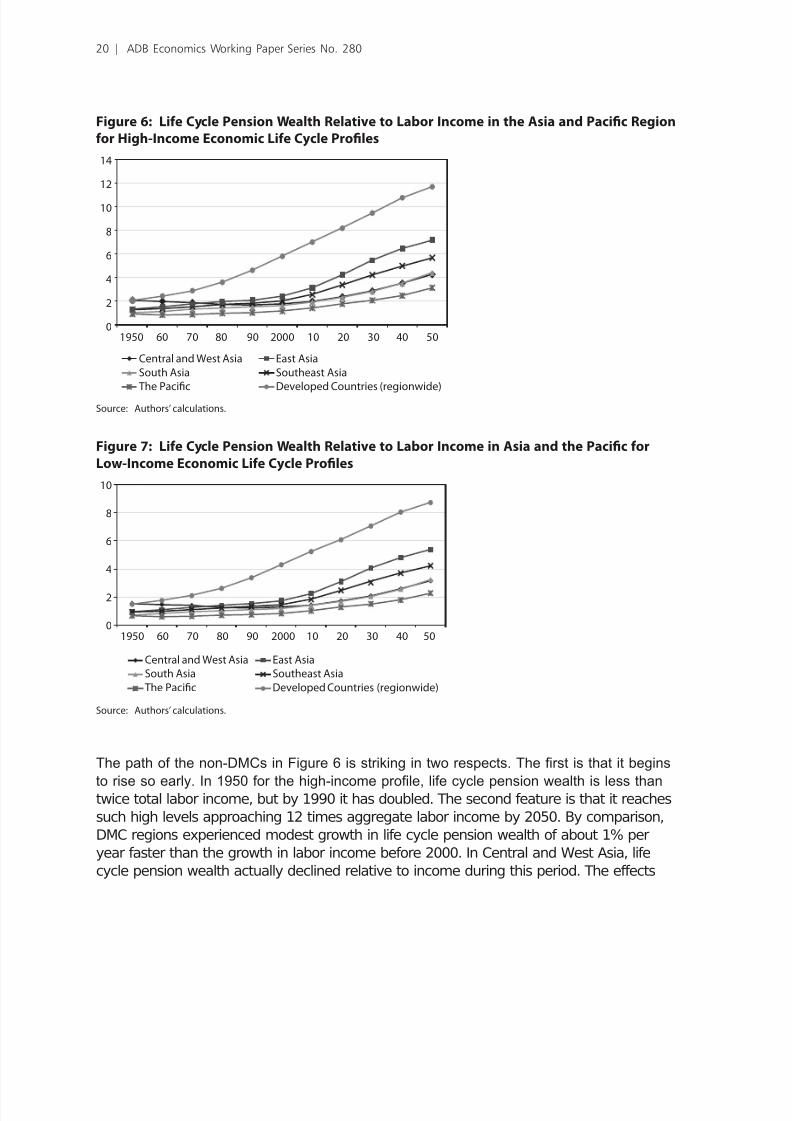
Figure 6: Lie Cycle Pension Wealth Relative to Labor Income in the Asia and Pacic Region
or High-Income Economic Lie Cycle Proles
0
2
4
6
8
10
12
14
1950 60 70 80 90 2000 10 20 30 40 50
Central and West Asia
South Asia
The Pacic
East Asia
Southeast Asia
Developed Countries (regionwide)
Source: Authors’ calculations.
Figure 7: Lie Cycle Pension Wealth Relative to Labor Income in Asia and the Pacic or
Low-Income Economic Lie Cycle Proles
0
2
4
6
8
10
1950 60 70 80 90 2000 10 20 30 40 50
Central and West Asia
South Asia
The Pacic
East Asia
Southeast Asia
Developed Countries (regionwide)
Source: Authors’ calculations.
The path of the non-DMCs in Figure 6 is striking in two respects. The rst is that it begins
to rise so early. In 1950 for the high-income prole, life cycle pension wealth is less thantwice total labor income, but by 1990 it has doubled. The second feature is that it reachessuch high levels approaching 12 times aggregate labor income by 2050. By comparison,DMC regions experienced modest growth in life cycle pension wealth of about 1% peryear faster than the growth in labor income before 2000. In Central and West Asia, lifecycle pension wealth actually declined relative to income during this period. The effects
20 | ADB Economics Working Paper Series No. 280

7/30/2019 Population, Wealth, and Economic Growth in the Asia and Pacific Region
http://slidepdf.com/reader/full/population-wealth-and-economic-growth-in-the-asia-and-pacific-region 29/48
of aging are very strong starting around 2000 particularly in East and Southeast Asia. InEast Asia, life cycle pension wealth is projected to grow by over 3% per year from 2010to 2020 compared with productivity growth. For DMCs as a whole, growth in life cyclepension wealth will slow over the next 4 decades but will remain above 1% relative to
labor income growth.
Less life cycle pension wealth is required to maintain the low-income life cycle proles
than the high-income proles. Taking the DMCs as a whole, life cycle pension wealth is
about 25% lower though the trends are otherwise very similar, and the most rapid growthin wealth is concentrated between 2010 and 2030 (Figure 7).
Table 5 shows pension transfer wealth for the Asia and Pacic region. DMCs and
regional groupings are reported for 2010, 2030, and 2050. Values for each country at10-year intervals from 1950 to 2050 are provided in Appendix Tables 4 and 5 for both thelow- and high-income proles. The low-income prole is based on both the low-income
economic life cycle and the low-income transfer prole while the high-income prole usesthe high-income life cycle and the high-income transfer prole.
Pension transfer wealth increases very sharply between 2010 and 2050. Given thelow-income proles, pension transfer wealth almost triples for Central and West Asia,
East Asia, South Asia, the Pacic island nations, and DMCs as a whole. The growth is
somewhat slower in Southeast Asia. For the non-DMCs, pension transfer wealth doesnot quite double. Given the high-income proles, the growth of pension transfer wealth is
slower. For the DMCs, the increase is roughly 150% of the 2010 value.
Table 5: Pension Transer Wealth Relative to Labor Income
Low-Income Proles High-Income Proles2010 2030 2050 2010 2030 2050
Asia and Pacic Countries 1.1 1.8 2.5 2.6 4.0 5.4
DMCs 0.8 1.4 2.0 1.9 3.2 4.5
Central and West Asia 0.5 0.8 1.3 1.4 2.0 3.0
East Asia 0.9 1.6 2.4 2.2 3.8 5.2
South Asia 0.5 0.8 1.3 1.3 1.9 3.1
Southeast Asia 0.7 1.2 1.8 1.8 2.9 4.0
Pacic Island Nations 0.3 0.5 0.9 1.0 1.4 2.2
Non-DMCs 2.3 3.4 4.3 5.1 7.0 8.7
DMC= developing member countries.
Source: Authors’ calculations using the NTA database, available: www.ntaccounts.org, accessed 29 June 2011.
Pension transfer wealth is much higher given the high-income proles. A useful place to
start would be the non-DMCs, which clearly fall into the high-income group. From 2010 to2050, the required pension transfer wealth rises from 5.1 to 8.7 times total labor income.Pension transfer wealth would be almost 6 times GDP in 2050 given this “business asusual” simulation. To maintain consumption levels growing at the rate of productivity andcurrent retirement patterns would require imposing an implicit debt on future generations
Population, Wealth, and Economic Growth in the Asia and Pacific Region | 21

7/30/2019 Population, Wealth, and Economic Growth in the Asia and Pacific Region
http://slidepdf.com/reader/full/population-wealth-and-economic-growth-in-the-asia-and-pacific-region 30/48
equal to almost 6 times GDP. This compares with total wealth in J apan of about 8 timesGDP. Other regions in which pension transfer wealth would reach very high levels givenhigh-income life cycle and transfer patterns are East Asia where it would reach 520% of total labor income in 2050 and Southeast Asia where it would reach 400% of total labor
income in 2050.
Pension transfer wealth would be lower if the low-income proles of consumption, labor
income, and net transfers were to persist during the next 40 years. Among the DMCs,East Asia would have the highest pension transfer wealth in 2050 at 240% of total laborincome. For all DMCs combined, pension transfer wealth would be 200% of total laborincome. Although these values are well below those required to follow the high-incomeprole path, they are still substantial. The unfunded obligation needed to meet the
needs of the elderly in 2050 would be approaching twice the labor income of all workerscombined.
The elderly rely more on assets than transfers in low-income countries in Asia andelsewhere. The relative importance of net transfers and asset-based reallocations—asset income less savings—relative to consumption net of labor income varies with theage structure because the older elderly depend more on transfers and less on assetscompared with the younger elderly. Conning comparisons to 2000 and later, net transfers
as a share of consumption net of labor income for those 65 and older vary from a low of 33% in the Pacic islands and 35% in South Asia to highs of 37% in East Asia and 43%
in non-DMCs. By 2050, however, the share of net transfers is projected to rise to 42% inDMCs and 49% in non-DMCs while asset-based reallocations will decline. For DMCs asa whole for example, asset-based ows fund 64% of consumption net of labor income in
2000 and 58% in 2050.
Transfers are much more important and asset-based ows are much less important in
the high-income proles. In 2000 for DMCs, net transfers accounted for almost 70% of
consumption net of labor income; asset-based ows accounted for about 30%. Again
asset-based ows will decline relative to other sources of support for the elderly as
populations age, but the changes are relatively small for the high-income proles.
Table 6 reports assets relative to labor income required to meet the life cycle needs of theelderly in the coming decades. A surprising aspect of the results is that the assets underthe high-income proles are less than the assets for the low-income proles. In short this
occurs because the high consumption and lower labor income in the high-income prole
countries is more than offset by the high net transfers received by the elderly. Hence,higher consumption net of labor income would be supported with lower levels of assetsbut with higher levels of transfer wealth.
22 | ADB Economics Working Paper Series No. 280

7/30/2019 Population, Wealth, and Economic Growth in the Asia and Pacific Region
http://slidepdf.com/reader/full/population-wealth-and-economic-growth-in-the-asia-and-pacific-region 31/48
Table 6: Pension Assets Relative to Labor Income
Low-Income Proles High-Income Proles
2010 2030 2050 2010 2030 2050
Asia and Pacic Countries 1.6 2.4 3.0 1.1 1.6 2.0
DMCs 1.2 2.1 2.7 0.8 1.4 1.8
Central and West Asia 0.9 1.3 1.9 0.6 0.9 1.3East Asia 1.4 2.4 3.0 0.9 1.6 2.0
South Asia 0.9 1.3 2.0 0.6 0.9 1.3
Southeast Asia 1.1 1.9 2.5 0.8 1.3 1.6
Pacic Island Nations 0.7 1.0 1.4 0.5 0.7 1.0
Non-DMCs 2.9 3.7 4.4 1.9 2.5 3.0
DMC= developing member countries.
Source: Authors’ calculations using the NTA database, available: www.ntaccounts.org, accessed 29 June 2011.
Two macroeconomic issues are of particular interest. One is that the growth in assetsrelative to labor income will accelerate economic growth through capital deepening to the
extent that greater demand for pension assets in the Asia and Pacic region’s economiesresults in greater investment in the region. Capital deepening in turn leads to higherlabor productivity, higher wages, and higher GDP per worker. The simplest case is theconstant-returns-to-scale, neoclassical growth model in which capital and labor determineGDP. In this case, growth in capital relative to labor income yields growth in output perworker equal to α α /1− where α is the elasticity of output with respect to capital. Usinga typical value for α of one third, a 1% increase in the ratio of capital relative to laborincome leads to a 0.5% increase in output per worker. The impact on output per workerof increased pension assets is readily assessed.
The rates of growth of pension assets are quite insensitive to whether the high- or low-
income prole is employed, hence the discussion is limited to the low-income proles(Table 7). Growth in the ratio of pension assets to labor income is particularly rapidin East Asia and Southeast Asia from 2010 to 2030 at 2.9% and 2.6% per annum,respectively. If invested in regional economies, output per worker would grow by 1.45%per annum in East Asia and 1.3% per annum in Southeast Asia.5 The capital deepeningeffects drop by almost 67% in East Asia and by 50% in Southeast Asia from 2030 to 2050compared with 2010 to 2030.
5 Note that this is a partial analysis in that the eedback rom capital deepening to growth in output per worker to
the demand or pension assets is not incorporated. General equilibrium models incorporate this eedback. The
general ndings are not reversed when this eedback is taken into consideration.
Population, Wealth, and Economic Growth in the Asia and Pacific Region | 23

7/30/2019 Population, Wealth, and Economic Growth in the Asia and Pacific Region
http://slidepdf.com/reader/full/population-wealth-and-economic-growth-in-the-asia-and-pacific-region 32/48
Table 7: Annual Growth Rate o Assets Relative to Labor Income (percent)
Low-Income Proles High-Income Proles
2010–2030 2030-2050 2010-2030 2030-2050
Asia and Pacic Countries 2.1 1.2 2.1 1.1
DMCs 2.6 1.3 2.5 1.2
Central and West Asia 1.9 1.9 1.8 1.8East Asia 2.9 1.1 2.7 1.0
South Asia 1.8 2.2 1.7 2.1
Southeast Asia 2.6 1.3 2.4 1.2
Pacic Island Nations 1.9 1.8 1.8 1.8
Non-DMCs 1.2 0.9 1.2 0.9
DMC= developing member countries.
Source: Authors’ calculations using the NTA database, available: www.ntaccounts.org, accessed 29 June 2011.
In other regions, the rates of capital deepening are similar for 2010–2030 and 2030–2050at around 2% per annum from 2010 to 2050. Again, applying our very simple rule, this
would produce growth in output per worker equal to about 1% per annum. The capitaldeepening effects dominate the effects of the declining support ratio on output per capitashown in Table 2.
C. Pension Assets
Rapid growth in the populations currently retired and near retirement will lead to rapidgrowth in pension assets depending on a variety of factors: the rate of economic growth,changes in age patterns of consumption and labor income, and changes in transfersystems. The results presented here are based on simple assumptions and are intendedonly to illustrate the connections between demographic factors and assets required to
support retirement. We have assumed that GDP growth is equal to the rate of growth of the effective labor force plus 3% per year and that labor income is 65% of GDP. InitialGDP estimates are taken from Key Indicators for Asia and the Pacic (ADB, variousyears), and for this purpose we have used purchasing power parity estimates of GDP forthe most recently available year, i.e., 2008 or 2009. Pension assets were calculated usingthe projected values of total labor income for each economy and the ratio of pensionassets to labor income summarized in Table 6 and reported in detail in Appendix Tables6 and 7. The results are summarized in Figure 8, which shows total pension assets byregion at 10-year intervals from 2010 to 2050.
24 | ADB Economics Working Paper Series No. 280

7/30/2019 Population, Wealth, and Economic Growth in the Asia and Pacific Region
http://slidepdf.com/reader/full/population-wealth-and-economic-growth-in-the-asia-and-pacific-region 33/48
Figure 8: Total Pension Assets by Region, 2010–2050
0
20
40
60
80
100
120140
160
2010 2020 2030 2040 2050
US$ PPP
(trillion)
Central and West Asia
South Asia
The Pacic
East Asia
Southeast Asia
Developed Countries (regionwide)
PPP = purchasing power parity.
Note: PPP in US dollars 2008–2009 prices (trillions). GDP growth equal to growth in eective number o consumers plus 3% per
year; labor income as a share o GDP constant at 0.65. Low-income age proles or consumption and labor income; low-
income Asian proles or net transers.
Source: Authors’ calculations.
For 2010, pension assets for the whole region are estimated at $26 trillion, increasingto $158 trillion in 2050. Pension assets are heavily concentrated in East Asia. For 2010,pension assets for East Asian DMCs and for non-DMCs are at $11 trillion and $12trillion respectively, and by 2050, pension assets for East Asian DMCs will be $69 trillioncompared with $35 trillion for non-DMCs.
Pension assets are similar for South and Southeast Asia. In 2010, total pension assetsfor both regions were between $2 and $3 trillion, but by 2050 they will reach $29 trillionin South Asia and $18 trillion in Southeast Asia. In Central and West Asia total pensionassets will grow from $0.5 trillion in 2010 to $6.3 trillion in 2050. For Pacic island
nations, the change over the 40-year period will be from $10 billion in 2010 to $149 billionin 2050.
We cannot overemphasize the illustrative nature of these results and the importance of focusing on the broad patterns, i.e., the substantial increase in pension assets and theshifting regional patterns. First, there is a great deal of uncertainty about how rapidly GDPwill grow over the next 40 years. Second, we have used age proles of consumption
and labor income from low-income countries where labor income is relatively highand consumption is relatively low in old age. There is certainly reason to believe thatconsumption at older ages will rise more rapidly than assumed here primarily because of increased spending on health care.
Population, Wealth, and Economic Growth in the Asia and Pacific Region | 25

7/30/2019 Population, Wealth, and Economic Growth in the Asia and Pacific Region
http://slidepdf.com/reader/full/population-wealth-and-economic-growth-in-the-asia-and-pacific-region 34/48
There are two other important complexities to consider. First is the likely change inlabor income at older ages. As an empirical matter, labor income at older ages is lessimportant relative to labor earned during the prime working ages in high-income countries.Moreover, relative labor income at older ages has declined very substantially over time in
the few economies for which time series estimates are available. If this trend continues,pension assets will grow more rapidly. Public policy, however, is likely to push in theopposite direction as countries raise the pensionable and mandatory retirement ages,reform pension and tax systems to increase incentives to work longer, and reduce thegenerosity of transfer systems to the elderly. These changes all have the common goalof raising labor income at older ages and may partially or completely offset the decline inlabor income that would otherwise occur.
The second important issue is the likely direction of net transfers to the elderly. Theelderly in low-income Asia rely to a relatively modest degree on net transfers includingfamilial transfers. As economies develop, public transfer systems have become more
important, and familial transfers have become less important. Apparently the increase inpublic transfers has substantially exceeded the decline in familial transfers judging fromthe importance of net transfers as a share of consumption in high-income economieslike J apan; the Republic of Korea; and Taipei,China. As DMCs develop, they will almostsurely place more emphasis on public pensions, health care systems, and other socialprotection programs, but it also seems likely, given greater awareness of aging issues,that these programs may be more modest than those in place in high-income countriesin Asia or elsewhere. Another possibility is that programs may rely more on fundedapproaches such as those that gure prominently in Singapore. If this proves to be the
case, then the pension assets required to maintain standards of living among the elderlycould be substantially greater than those shown in Figure 8.
Accumulating pension assets requires life cycle savings,6 i.e., the combined public andprivate savings necessary to support old-age consumption given current age-specic
patterns of labor income, consumption, and net public and private transfers. Table 8reports gross life cycle savings as a percentage of GDP. Life cycle savings followsdirectly from the assumptions made to calculate pension assets and will be sensitive tovariations in those assumptions. One additional assumption is that the depreciation rateis 5%. To the extent that pension assets actually exceed those shown above, life cyclesavings rates also will be higher.
6 Another possibility would be to redirect assets accumulated or some other purpose to lie cycle needs.
26 | ADB Economics Working Paper Series No. 280

7/30/2019 Population, Wealth, and Economic Growth in the Asia and Pacific Region
http://slidepdf.com/reader/full/population-wealth-and-economic-growth-in-the-asia-and-pacific-region 35/48
Table 8: Gross Lie Cycle Savings as a Percentage o Gross Domestic Product
2010–2020 2020–2030 2030–2040 2040–2050
Asia and Pacic Countries 12.2 13.6 14.7 15.4
DMCs 10.8 12.2 13.2 14.1
Central and West Asia 7.4 8.4 9.8 11.5
East Asia 12.4 14.2 14.9 15.0South Asia 7.4 8.4 10.0 12.0
Southeast Asia 10.4 11.7 12.6 13.6
Pacic Island Nations 6.0 6.7 7.4 9.1
Non-DMC 17.6 18.8 20.8 20.7
DMC= developing member countries.
Note. Assumes the ollowing: (i) real GDP growth equal to growth in the eective number o producers plus 3% per year; (ii) labor
income is 65% o GDP; (iii) age proles o consumption and labor income are proportional to low-income NTA estimates;
(iv) net transers as a share o consumption are equal to low-income NTA estimates or Asia; (v) depreciation rate is 5%.
Source: Authors’ calculations using the NTA database, available: www.ntaccounts.org, accessed 29 June 2011.
Population aging is consistently leading to higher gross life cycle savings rates. The
highest rates are found in the oldest economies and regions—Southeast Asia, East Asia,and especially the non-DMCs. In East Asia, the gross savings rate will increase from 12%to 15% of GDP over the next 4 decades; for the non-DMCs, the increase will be fromabout 18% to 21%.
A substantial part of the increase in gross savings rates occurs because the capital–output ratio increases with population aging. Consequently, depreciation as a share of GDP rises and gross savings must increase in order to maintain high capital–outputratios. The trend in net savings (not shown) is more varied. For most regions, net savingsis higher in 2040–2050 than in 2010–2020, but in East Asia the net savings rates declinesfrom 11% of labor income from 2010 to 2030 to 8.5% from 2040 to 2050. In Southeast
Asia, net savings as a share of labor income is relatively constant at slightly more than9%. Among the non-DMCs, net savings will decline modestly from 2010 to 2050, butduring the nal decade will be 10% of labor income. Simple generalizations about the
relationship between net savings and aging should, however, be made with caution.
The results do not support the view that the large swings in savings in many Asiancountries can be explained by the effects of demographic factors on life cycle savings.
The difference in gross savings rates for 2010 to 2020 varies from a low of 6% to a highof 17.6%. Much higher rates of savings are found in many East Asian economies. Theresults also do not support the view that population aging will lead to substantially lowersavings rates. As populations age, however, age-specic savings rates must increase
in order to generate the higher life cycle wealth required to fund longer periods of retirement. Changes in the age composition of the population tend to offset the effect of the higher age-specic values to some extent. Life cycle savings will eventually plateau
and decline modestly, but aggregate pension assets will rise as populations age.7
7 Related empirical literature argues that savings rates are not as low among the elderly as is widely believed. These
patterns are infuenced by both lie cycle savings and nonlie cycle savings. For example, to the extent that the
elderly continue to save in old age because they are risk averse or because they want to leave bequests, aging
may not lead to lower savings rates.
Population, Wealth, and Economic Growth in the Asia and Pacific Region | 27

7/30/2019 Population, Wealth, and Economic Growth in the Asia and Pacific Region
http://slidepdf.com/reader/full/population-wealth-and-economic-growth-in-the-asia-and-pacific-region 36/48
VIII. Human Capital
The important connection between population aging and human capital may not beimmediately apparent to those who do not understand why population aging is occurring.
As previously explained, the most important proximate cause of population aging isfertility decline. Aging is especially rapid in East Asia because fertility has declined tosuch low levels in J apan; Republic of Korea; and Taipei,China. There are certainly someindications that the PRC will follow a similar path with very low fertility already taking holdin many of the most economically advanced provinces. This point is important because of the quantity–quality tradeoff. This idea was rst introduced by Gary Becker with important
contributions by others studying the economics of fertility (Becker and Lewis 1973, Willis1973). The idea is that with economic development, parents opt for children of “higherquality.” As incomes rise, fertility declines and spending per child rises. To the extentthat the higher spending is human capital spending, couples will have fewer children,but those children will be more productive during their working years. At the aggregate
level, entering cohorts of workers will be fewer in number, but they will be healthier, moreeducated, and hence more productive.
The quantity–quality tradeoff described by Becker, Lewis, and Willis refers to privatedecision making by parents about their own children, but a similar phenomenon maycharacterize public spending on human capital. Several mechanisms could accountfor a tradeoff. One possibility is that as the number of children declines, public budgetconstraints ease and spending per child on education and health rise. Governmentsmay also choose to invest more in children as a mechanism for maintaining growth intax revenues in the face of lower fertility, possibly in anticipation of increased needs forsupport for pensions and public health care systems. This idea is consistent with thehypothesis advanced by Becker and Murphy that the increase in transfers to the elderlythrough pensions was a return on the public investment made in the education of children(Becker and Murphy 1988, Bommier et al. 2010).
Two issues are important here. The rst is the return on investment in human capital.
Only if that investment actually leads to higher productivity during the working years willspending more per child be a successful alternative to having more children. The returnson education have been studied very extensively and a broad consensus has beenreached that the rates are high. There is probably less agreement about the rates of return on investments in health. This literature is reviewed in Lee and Mason (2010).
The second issue is the strength of the tradeoff between quantity and quality. This pointhas been addressed in a number of recent studies using NTA estimates of spendingon the health and education of children. NTA provide average health and educationconsumption by single year of age through the public and private sectors. A humancapital measure has been constructed by summing the single-year-of-age estimates forhealth from age 0 to 17 and for education from age 0 to 26. Age 26 for education was
28 | ADB Economics Working Paper Series No. 280

7/30/2019 Population, Wealth, and Economic Growth in the Asia and Pacific Region
http://slidepdf.com/reader/full/population-wealth-and-economic-growth-in-the-asia-and-pacific-region 37/48
selected to include spending on college education, and age 17 was chosen for health toexclude most spending related to child bearing. The tradeoff has been estimated usingboth cross-section data and times series data (Ogawa et al. 2009, Lee and Mason 2010).
The estimated elasticity in the cross-sectional data is –0.68 for all NTA economies, –0.95
for Asian NTA economies, and elasticities greater than –1 based on time series estimatesfor J apan and Taipei,China. The decline in fertility has resulted in smaller cohorts, butthose cohorts have substantially greater human capital investment. In Asia, the total valueof human capital may have held steady or may have actually increased.
To what extent can the quantity–quality tradeoff mitigate the effects of low fertility and theassociated aging of populations? Simulations based on an elasticity of –1.0 and standardestimates of the return on human capital indicate that increased human capital canentirely offset declines in fertility (Lee and Mason 2010).
IX. Policy Implications and Conclusions
The following are some of the key points that should be considered in thinking aboutpopulation aging.
First, throughout this paper we have taken population aging as a given which in a sensereects its near inevitability. Life expectancy has been increasing with regularity in
almost all DMCs, and this phenomenon is likely to continue for the foreseeable future.Certainly improving health and reducing mortality are important development goals, andpopulation aging is, in part, a consequence of meeting those goals. Immigration can havesome inuence on population aging, but for the most part immigration policies will not
be decisive because the entire region is aging, many DMCs are enormous and are notlikely to be greatly affected by reforms in immigration policies, and many have not beenreceptive to substantial increases in their immigrant populations.
Fertility is the key demographic factor from a policy perspective because changes infertility rates have a large impact on population aging and because low-income countriesare open to pro-natalist policies. There are, however, some important issues about fertility,e.g., what kinds of policies are likely to be effective and how much should be investedby governments, nongovernment organizations, and the private sector. For the PRC, the
pressing issue is the speed with which it abandons the one-child policy.
Second, the economic effects of population aging depend on features of the economiclife cycle. The effects will be particularly pronounced if older adults continue to contributelittle to GDP through their labor. In many countries, public policies create roadblocks thatreduce the productivity of older workers or push them out of the labor force all together.
These roadblocks come in a variety of forms, e.g., mandatory retirement ages, tax codes
Population, Wealth, and Economic Growth in the Asia and Pacific Region | 29

7/30/2019 Population, Wealth, and Economic Growth in the Asia and Pacific Region
http://slidepdf.com/reader/full/population-wealth-and-economic-growth-in-the-asia-and-pacific-region 38/48
that undermine work incentives, and pension rules that do the same. Most thinking aboutproductivity at older ages focuses on retirement decisions, but often labor income islow at older ages because of low wages. A priority is to understand why wages of olderworkers are so low and whether improved employment practices could lead to a more
productive older workforce.
The economic pressures from aging also arise because of the high levels of spendingon the older elderly in many older, high-income economies. Consumption is high at oldage because of high levels of spending on health care. To a great extent, this spendingis funded by public transfer systems. A likely prospect and perhaps even a preferredoutcome is that spending on health care should rise as countries can afford to spendmore on it. While spending on health may be highly valued, there are nonetheless manyimportant issues about health care nancing and whether it leads to inefcient systems
and unnecessarily high costs.
Third, most DMCs have not established extensive public transfer systems that targetthe needs of the elderly. As standards of living rise and the administrative capacities of governments improve, they will surely wish to develop more extensive systems of socialinsurance, The DMCs are, however, in advantageous positions because they have not yetmade extensive commitments that will be unsustainable in the future as their populationsage.
The only alternative to ratcheting up transfer systems is to increase the accumulation of assets. Accumulating assets does, however, raise a whole host of issues: the respectiveroles of the private and public sectors, consumer education, nancial regulation, and the
investment environment. Success will depend on (i) individuals accumulating enough to
provide for their needs in old age whether voluntarily or through mandates; (ii) a nancialsystem that is secure and efcient; and (iii) an investment environment that will yield
adequate returns without undue risk.
The fourth major issue has to do with successful investments in human capital. Theevidence is quite strong that low fertility is leading to high human capital investment, andpast experience is promising about the returns on investments in education. An importantissue, however, is whether the very high levels of investment we see in very low fertilityeconomies will yield strong returns. It will depend on both the effective administrationof education systems and on the capacity of the economy to employ more educated
workers.
30 | ADB Economics Working Paper Series No. 280

7/30/2019 Population, Wealth, and Economic Growth in the Asia and Pacific Region
http://slidepdf.com/reader/full/population-wealth-and-economic-growth-in-the-asia-and-pacific-region 39/48
Appendix: Statistical Tables
Appendix Table 1: Support Ratios or the Asia and Pacic Region, 1950–2050
1950 1960 1970 1980 1990 2000 2010 2020 2030 2040 2050
Central and West AsiaAghanistan 0.739 0.728 0.722 0.708 0.691 0.675 0.679 0.705 0.740 0.787 0.844
Armenia 0.733 0.774 0.761 0.815 0.873 0.870 0.916 0.926 0.918 0.909 0.868
Azerbaijan 0.766 0.783 0.721 0.748 0.808 0.863 0.932 0.953 0.938 0.936 0.910
Georgia 0.821 0.869 0.864 0.885 0.901 0.904 0.938 0.939 0.910 0.886 0.849
Kazakhstan 0.787 0.800 0.784 0.812 0.855 0.882 0.935 0.942 0.935 0.940 0.922
Kyrgyz Republic 0.817 0.808 0.738 0.740 0.763 0.793 0.867 0.916 0.939 0.953 0.934
Pakistan 0.812 0.769 0.737 0.709 0.708 0.723 0.775 0.833 0.880 0.915 0.925
Tajikistan 0.796 0.782 0.693 0.675 0.694 0.712 0.762 0.838 0.893 0.942 0.956
Turkmenistan 0.811 0.786 0.706 0.693 0.731 0.788 0.875 0.939 0.966 0.971 0.944
Uzbekistan 0.832 0.786 0.693 0.686 0.723 0.770 0.864 0.941 0.963 0.961 0.933
East Asia
China, People’s Rep. o 0.844 0.795 0.752 0.777 0.858 0.941 0.990 0.988 0.941 0.903 0.870
Hong Kong, China 0.799 0.774 0.680 0.753 0.865 0.939 0.957 0.910 0.808 0.745 0.703
Mongolia 0.740 0.724 0.716 0.716 0.696 0.798 0.927 1.002 0.992 0.958 0.915Korea, Rep. o 0.653 0.649 0.638 0.697 0.810 0.898 0.928 0.902 0.817 0.733 0.675
Taipei,China 0.641 0.645 0.648 0.709 0.795 0.873 0.928 0.917 0.847 0.746 0.660
South Asia
Bangladesh 0.780 0.748 0.709 0.689 0.702 0.768 0.863 0.941 0.976 0.969 0.941
Bhutan 0.722 0.760 0.770 0.777 0.739 0.712 0.839 0.940 0.979 0.973 0.933
India 0.799 0.779 0.751 0.758 0.782 0.814 0.859 0.907 0.948 0.969 0.960
Maldives 0.851 0.789 0.723 0.703 0.651 0.701 0.861 0.994 1.012 0.977 0.914
Nepal 0.763 0.763 0.751 0.734 0.723 0.732 0.782 0.859 0.917 0.942 0.943
Sri Lanka 0.711 0.737 0.752 0.785 0.831 0.899 0.932 0.905 0.888 0.887 0.871
Southeast Asia
Brunei Darussalam 0.801 0.774 0.744 0.750 0.864 0.914 0.962 0.991 0.992 0.970 0.940
Cambodia 0.738 0.736 0.728 0.716 0.723 0.723 0.797 0.889 0.935 0.958 0.945
Indonesia 0.751 0.765 0.749 0.744 0.783 0.856 0.924 0.959 0.963 0.938 0.906
Lao People’s Dem. Rep. – – – – – – – – – – –Malaysia 0.641 0.613 0.583 0.631 0.695 0.748 0.792 0.820 0.838 0.842 0.819
Myanmar 0.838 0.803 0.737 0.722 0.759 0.848 0.926 0.956 0.954 0.937 0.914
Philippines 0.724 0.690 0.676 0.697 0.739 0.779 0.825 0.870 0.901 0.918 0.919
Singapore 0.703 0.673 0.630 0.751 0.898 0.953 0.920 0.861 0.768 0.708 0.681
Thailand 0.722 0.725 0.706 0.726 0.846 0.955 0.986 0.967 0.928 0.901 0.887
Viet Nam 0.866 0.814 0.713 0.669 0.724 0.808 0.926 0.969 0.955 0.923 0.889
Pacic Island Countries
Fiji, Rep. o 0.674 0.665 0.693 0.748 0.796 0.829 0.849 0.876 0.913 0.932 0.927
Micronesia, Fed. States o 0.748 0.707 0.670 0.633 0.673 0.727 0.743 0.803 0.885 0.944 0.954
Papua New Guinea 0.763 0.744 0.721 0.686 0.723 0.760 0.780 0.811 0.855 0.899 0.931
Samoa 0.679 0.656 0.647 0.684 0.680 0.745 0.712 0.766 0.835 0.880 0.912
Solomon Islands 0.734 0.721 0.701 0.665 0.662 0.711 0.771 0.832 0.884 0.915 0.932
Timor-Leste 0.751 0.755 0.749 0.723 0.758 0.670 0.675 0.702 0.737 0.802 0.863
Tonga 0.651 0.653 0.666 0.676 0.700 0.705 0.761 0.761 0.819 0.871 0.901Vanuatu 0.681 0.677 0.695 0.682 0.710 0.729 0.769 0.817 0.865 0.904 0.921
Developed Countries
Australia 0.829 0.779 0.748 0.770 0.818 0.847 0.836 0.805 0.769 0.749 0.737
Japan 0.693 0.746 0.828 0.863 0.852 0.847 0.807 0.768 0.727 0.673 0.637
New Zealand 0.789 0.735 0.700 0.726 0.796 0.833 0.824 0.798 0.766 0.756 0.745
– means data not available.
Source: Authors’ calculations.
Population, Wealth, and Economic Growth in the Asia and Pacific Region | 31

7/30/2019 Population, Wealth, and Economic Growth in the Asia and Pacific Region
http://slidepdf.com/reader/full/population-wealth-and-economic-growth-in-the-asia-and-pacific-region 40/48
Appendix Table 2: Lie Cycle Wealth Relative to Labor Income, High-Income Proles
1950 1960 1970 1980 1990 2000 2010 2020 2030 2040
Asia and Pacic Region 1.44 1.64 1.90 2.17 2.48 2.93 3.64 4.59 5.64 6.61
Developing Economies 1.27 1.43 1.64 1.80 1.93 2.18 2.76 3.65 4.63 5.52
Central and West Asia 2.09 1.99 1.88 1.73 1.68 1.78 1.99 2.37 2.85 3.52
Aghanistan 0.80 0.80 0.73 0.72 1.17 1.04 1.01 1.00 1.08 1.29Armenia 2.87 2.39 2.13 2.03 2.26 3.00 3.55 4.16 4.60 5.33
Azerbaijan 2.50 2.11 1.92 1.71 1.85 1.91 2.36 3.18 3.95 4.79
Georgia 2.82 2.41 2.40 2.45 2.61 3.12 3.78 4.57 5.32 6.17
Kazakhstan 2.42 2.03 1.84 1.70 1.65 1.86 2.13 2.66 3.26 4.00
Kyrgyz Republic 2.44 2.35 2.09 1.90 1.83 1.71 1.92 2.40 3.01 3.84
Pakistan 1.91 1.94 1.87 1.74 1.62 1.71 1.83 2.04 2.41 2.98
Tajikistan 1.93 2.05 1.98 1.71 1.50 1.40 1.66 1.98 2.33 3.01
Turkmenistan 1.85 1.81 1.81 1.71 1.63 1.44 1.64 2.13 2.78 3.69
Uzbekistan 2.11 2.34 2.24 1.89 1.73 1.57 1.81 2.31 2.96 3.95
East Asia 1.32 1.52 1.77 1.95 2.10 2.40 3.12 4.24 5.46 6.45
China, People’s Rep. o 1.32 1.54 1.77 1.92 2.03 2.28 2.91 3.96 5.09 6.01
Hong Kong, China 1.33 1.71 2.72 3.09 3.36 3.75 5.20 6.82 8.44 9.50
Korea, Rep. o 1.26 1.31 1.53 1.88 2.28 2.93 4.03 5.55 7.28 8.80
Mongolia 1.17 1.25 1.36 1.36 1.37 1.31 1.50 2.10 3.01 4.19 Taipei,China 1.12 1.37 1.71 2.19 2.48 2.90 3.85 5.19 6.59 7.78
South Asia 1.01 1.14 1.31 1.41 1.51 1.65 1.94 2.32 2.81 3.51
Bangladesh 1.04 1.14 1.21 1.28 1.34 1.39 1.56 1.95 2.59 3.44
Bhutan 1.00 1.01 1.13 1.19 1.42 2.07 1.88 2.08 2.72 3.81
India 0.98 1.13 1.31 1.41 1.51 1.64 1.93 2.30 2.78 3.47
Maldives 1.36 1.46 1.45 1.42 1.66 1.64 1.60 1.98 2.85 4.17
Nepal 0.81 0.98 1.12 1.25 1.43 1.56 1.67 1.86 2.21 2.77
Sri Lanka 2.10 1.62 1.68 1.84 2.02 2.47 3.25 4.20 4.88 5.48
Southeast Asia 1.29 1.36 1.55 1.71 1.82 2.04 2.56 3.38 4.22 4.99
Brunei Darussalam 1.97 1.67 1.32 1.12 1.02 1.27 1.88 2.60 3.38 4.24
Cambodia 0.94 0.91 0.88 1.23 1.24 1.37 1.55 1.73 1.98 2.66
Indonesia 1.15 1.14 1.28 1.45 1.66 1.83 2.16 2.80 3.61 4.42
Lao People’s Dem. Rep. 0.88 1.07 1.24 1.49 1.51 1.46 1.57 1.77 2.11 2.69
Malaysia 1.53 1.50 1.61 1.56 1.57 1.78 2.35 3.02 3.66 4.39Myanmar 1.17 1.46 1.78 1.89 1.80 1.68 2.05 2.67 3.47 4.28
Philippines 1.29 1.34 1.41 1.39 1.42 1.63 1.99 2.42 2.95 3.60
Singapore 1.11 1.37 1.99 2.48 2.95 3.72 5.24 7.13 8.54 9.31
Thailand 1.42 1.56 1.71 1.86 1.85 2.03 2.65 3.65 4.62 5.35
Viet Nam 1.34 1.65 1.99 2.32 2.28 2.24 2.52 3.38 4.33 5.23
Pacic Island Countries 0.90 0.83 0.88 0.97 1.02 1.15 1.42 1.77 2.07 2.47
Fiji, Rep. o 1.21 1.11 1.04 0.98 1.11 1.44 1.99 2.50 2.90 3.58
Micronesia, Fed. States o 1.49 1.52 1.57 1.73 1.37 1.29 1.74 2.01 2.05 2.69
Papua New Guinea 0.79 0.68 0.75 0.86 0.89 0.97 1.20 1.54 1.86 2.20
Samoa 0.76 0.75 0.90 1.25 1.62 1.57 2.08 2.48 2.48 2.75
Solomon Islands 1.17 1.47 1.46 1.46 1.38 1.33 1.39 1.64 2.16 2.81
Timor-Leste 0.86 0.81 0.69 0.80 0.86 1.53 1.57 1.56 1.51 1.64
Tonga 0.98 1.01 1.03 1.45 1.84 2.05 2.09 2.52 2.64 2.76
Vanuatu 1.18 1.35 1.44 1.47 1.42 1.52 1.73 2.07 2.41 2.86Developed Countries 2.06 2.44 2.89 3.60 4.62 5.80 7.01 8.19 9.47 10.77
Australia 2.57 2.88 3.29 3.75 3.90 4.44 5.31 6.22 6.87 7.21
Japan 1.94 2.34 2.80 3.57 4.78 6.12 7.40 8.64 10.07 11.58
New Zealand 2.71 2.91 3.28 3.58 3.78 4.08 4.94 5.87 6.47 6.73
Source: Authors’ calculations.
32 | ADB Economics Working Paper Series No. 280

7/30/2019 Population, Wealth, and Economic Growth in the Asia and Pacific Region
http://slidepdf.com/reader/full/population-wealth-and-economic-growth-in-the-asia-and-pacific-region 41/48
Appendix Table 3: Lie Cycle Wealth Relative to Labor Income, Low-Income Proles
1950 1960 1970 1980 1990 2000 2010 2020 2030 2040 2050
Asia and Pacic Region 1.04 1.17 1.36 1.57 1.81 2.13 2.66 3.37 4.18 4.92 5.54
Developing Economies 0.92 1.02 1.17 1.29 1.40 1.57 1.98 2.67 3.43 4.10 4.70
Central and West Asia 1.53 1.46 1.39 1.26 1.23 1.30 1.42 1.72 2.07 2.57 3.16
Aghanistan 0.57 0.57 0.53 0.51 0.83 0.74 0.73 0.71 0.77 0.91 1.16Armenia 2.14 1.77 1.58 1.45 1.69 2.22 2.58 3.14 3.42 3.95 4.61
Azerbaijan 1.87 1.58 1.45 1.21 1.36 1.41 1.65 2.34 2.91 3.53 4.30
Georgia 2.12 1.79 1.78 1.78 1.94 2.34 2.77 3.42 3.97 4.59 5.36
Kazakhstan 1.78 1.49 1.37 1.26 1.22 1.37 1.53 1.95 2.38 2.95 3.51
Kyrgyz Republic 1.80 1.75 1.56 1.38 1.37 1.27 1.37 1.75 2.19 2.80 3.60
Pakistan 1.40 1.42 1.38 1.27 1.17 1.24 1.32 1.47 1.74 2.16 2.68
Tajikistan 1.38 1.52 1.47 1.25 1.11 1.04 1.17 1.45 1.69 2.16 2.92
Turkmenistan 1.36 1.33 1.33 1.24 1.22 1.05 1.15 1.54 2.01 2.68 3.53
Uzbekistan 1.51 1.72 1.68 1.38 1.29 1.16 1.28 1.67 2.15 2.87 3.79
East Asia 0.96 1.09 1.26 1.40 1.54 1.73 2.24 3.10 4.06 4.80 5.39
China, People’s Rep. o 0.97 1.11 1.27 1.39 1.49 1.64 2.10 2.88 3.78 4.47 5.04
Hong Kong, China 0.93 1.18 1.90 2.24 2.49 2.69 3.73 5.07 6.29 7.07 7.39
Korea, Rep. o 0.91 0.93 1.09 1.33 1.65 2.12 2.91 4.10 5.45 6.58 7.36
Mongolia 0.84 0.89 0.99 1.00 1.01 0.96 1.05 1.49 2.17 3.06 3.89 Taipei,China 0.79 0.94 1.19 1.57 1.84 2.09 2.79 3.84 4.90 5.82 6.50
South Asia 0.72 0.81 0.94 1.01 1.09 1.18 1.39 1.69 2.04 2.56 3.24
Bangladesh 0.75 0.82 0.87 0.92 0.97 1.00 1.12 1.39 1.86 2.51 3.15
Bhutan 0.71 0.71 0.80 0.84 1.03 1.51 1.36 1.50 1.94 2.77 3.65
India 0.70 0.81 0.93 1.01 1.09 1.18 1.39 1.67 2.02 2.53 3.22
Maldives 0.98 1.07 1.06 1.00 1.18 1.21 1.14 1.41 2.02 3.02 4.04
Nepal 0.57 0.69 0.80 0.89 1.02 1.13 1.20 1.34 1.59 2.00 2.55
Sri Lanka 1.59 1.17 1.21 1.34 1.46 1.76 2.36 3.12 3.62 4.10 4.52
Southeast Asia 0.93 0.98 1.12 1.22 1.31 1.46 1.83 2.47 3.12 3.70 4.23
Brunei Darussalam 1.41 1.22 0.97 0.81 0.75 0.88 1.33 1.88 2.48 3.12 3.81
Cambodia 0.68 0.66 0.63 0.88 0.89 0.97 1.11 1.26 1.42 1.89 2.56
Indonesia 0.84 0.81 0.92 1.03 1.19 1.33 1.54 2.02 2.64 3.27 3.78
Lao People’s Dem. Rep. 0.62 0.76 0.89 1.07 1.11 1.06 1.13 1.28 1.52 1.93 2.53
Malaysia 1.13 1.08 1.17 1.13 1.13 1.25 1.67 2.20 2.68 3.23 3.89Myanmar 0.84 1.05 1.28 1.39 1.34 1.22 1.47 1.93 2.53 3.17 3.66
Philippines 0.94 0.96 1.02 1.01 1.02 1.16 1.42 1.75 2.14 2.64 3.22
Singapore 0.77 0.95 1.40 1.75 2.08 2.57 3.74 5.34 6.44 6.91 7.24
Thailand 1.02 1.13 1.24 1.34 1.35 1.46 1.89 2.67 3.43 3.99 4.46
Viet Nam 0.95 1.19 1.43 1.68 1.70 1.63 1.78 2.46 3.21 3.88 4.53
Pacic Island Countries 0.66 0.60 0.63 0.70 0.73 0.82 1.00 1.27 1.51 1.78 2.28
Fiji, Rep. o 0.90 0.81 0.76 0.72 0.79 1.02 1.42 1.85 2.12 2.62 3.41
Micronesia, Fed. States o 1.09 1.10 1.14 1.27 1.04 0.93 1.25 1.51 1.49 1.91 2.83
Papua New Guinea 0.59 0.48 0.53 0.61 0.63 0.69 0.84 1.10 1.35 1.58 2.00
Samoa 0.55 0.53 0.63 0.93 1.20 1.17 1.50 1.86 1.90 1.97 2.83
Solomon Islands 0.78 1.07 1.07 1.06 1.00 0.96 0.99 1.15 1.53 2.03 2.62
Timor-Leste 0.63 0.59 0.51 0.57 0.61 1.08 1.13 1.14 1.09 1.16 1.38
Tonga 0.70 0.72 0.74 1.05 1.36 1.53 1.55 1.86 1.99 2.05 2.42
Vanuatu 0.84 0.98 1.07 1.10 1.05 1.09 1.23 1.49 1.75 2.07 2.51Developed Countries 1.48 1.75 2.09 2.61 3.37 4.30 5.24 6.08 7.06 8.06 8.73
Australia 1.87 2.08 2.38 2.76 2.87 3.24 3.91 4.63 5.14 5.39 5.49
Japan 1.38 1.67 2.03 2.58 3.49 4.55 5.54 6.41 7.50 8.67 9.47
New Zealand 1.99 2.11 2.39 2.65 2.80 2.98 3.61 4.39 4.86 5.03 5.19
Source: Authors’ calculations.
Population, Wealth, and Economic Growth in the Asia and Pacific Region | 33
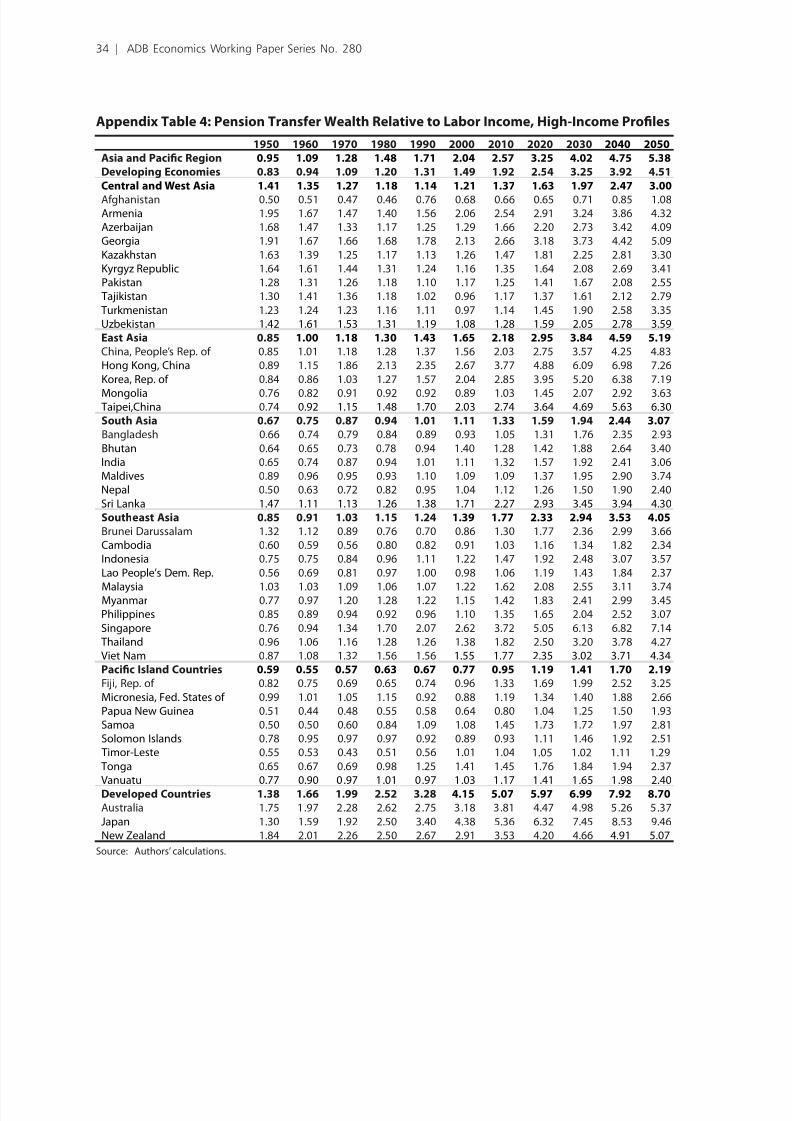
7/30/2019 Population, Wealth, and Economic Growth in the Asia and Pacific Region
http://slidepdf.com/reader/full/population-wealth-and-economic-growth-in-the-asia-and-pacific-region 42/48
Appendix Table 4: Pension Transer Wealth Relative to Labor Income, High-Income Proles
1950 1960 1970 1980 1990 2000 2010 2020 2030 2040 2050
Asia and Pacic Region 0.95 1.09 1.28 1.48 1.71 2.04 2.57 3.25 4.02 4.75 5.38
Developing Economies 0.83 0.94 1.09 1.20 1.31 1.49 1.92 2.54 3.25 3.92 4.51
Central and West Asia 1.41 1.35 1.27 1.18 1.14 1.21 1.37 1.63 1.97 2.47 3.00
Aghanistan 0.50 0.51 0.47 0.46 0.76 0.68 0.66 0.65 0.71 0.85 1.08Armenia 1.95 1.67 1.47 1.40 1.56 2.06 2.54 2.91 3.24 3.86 4.32
Azerbaijan 1.68 1.47 1.33 1.17 1.25 1.29 1.66 2.20 2.73 3.42 4.09
Georgia 1.91 1.67 1.66 1.68 1.78 2.13 2.66 3.18 3.73 4.42 5.09
Kazakhstan 1.63 1.39 1.25 1.17 1.13 1.26 1.47 1.81 2.25 2.81 3.30
Kyrgyz Republic 1.64 1.61 1.44 1.31 1.24 1.16 1.35 1.64 2.08 2.69 3.41
Pakistan 1.28 1.31 1.26 1.18 1.10 1.17 1.25 1.41 1.67 2.08 2.55
Tajikistan 1.30 1.41 1.36 1.18 1.02 0.96 1.17 1.37 1.61 2.12 2.79
Turkmenistan 1.23 1.24 1.23 1.16 1.11 0.97 1.14 1.45 1.90 2.58 3.35
Uzbekistan 1.42 1.61 1.53 1.31 1.19 1.08 1.28 1.59 2.05 2.78 3.59
East Asia 0.85 1.00 1.18 1.30 1.43 1.65 2.18 2.95 3.84 4.59 5.19
China, People’s Rep. o 0.85 1.01 1.18 1.28 1.37 1.56 2.03 2.75 3.57 4.25 4.83
Hong Kong, China 0.89 1.15 1.86 2.13 2.35 2.67 3.77 4.88 6.09 6.98 7.26
Korea, Rep. o 0.84 0.86 1.03 1.27 1.57 2.04 2.85 3.95 5.20 6.38 7.19
Mongolia 0.76 0.82 0.91 0.92 0.92 0.89 1.03 1.45 2.07 2.92 3.63 Taipei,China 0.74 0.92 1.15 1.48 1.70 2.03 2.74 3.64 4.69 5.63 6.30
South Asia 0.67 0.75 0.87 0.94 1.01 1.11 1.33 1.59 1.94 2.44 3.07
Bangladesh 0.66 0.74 0.79 0.84 0.89 0.93 1.05 1.31 1.76 2.35 2.93
Bhutan 0.64 0.65 0.73 0.78 0.94 1.40 1.28 1.42 1.88 2.64 3.40
India 0.65 0.74 0.87 0.94 1.01 1.11 1.32 1.57 1.92 2.41 3.06
Maldives 0.89 0.96 0.95 0.93 1.10 1.09 1.09 1.37 1.95 2.90 3.74
Nepal 0.50 0.63 0.72 0.82 0.95 1.04 1.12 1.26 1.50 1.90 2.40
Sri Lanka 1.47 1.11 1.13 1.26 1.38 1.71 2.27 2.93 3.45 3.94 4.30
Southeast Asia 0.85 0.91 1.03 1.15 1.24 1.39 1.77 2.33 2.94 3.53 4.05
Brunei Darussalam 1.32 1.12 0.89 0.76 0.70 0.86 1.30 1.77 2.36 2.99 3.66
Cambodia 0.60 0.59 0.56 0.80 0.82 0.91 1.03 1.16 1.34 1.82 2.34
Indonesia 0.75 0.75 0.84 0.96 1.11 1.22 1.47 1.92 2.48 3.07 3.57
Lao People’s Dem. Rep. 0.56 0.69 0.81 0.97 1.00 0.98 1.06 1.19 1.43 1.84 2.37
Malaysia 1.03 1.03 1.09 1.06 1.07 1.22 1.62 2.08 2.55 3.11 3.74Myanmar 0.77 0.97 1.20 1.28 1.22 1.15 1.42 1.83 2.41 2.99 3.45
Philippines 0.85 0.89 0.94 0.92 0.96 1.10 1.35 1.65 2.04 2.52 3.07
Singapore 0.76 0.94 1.34 1.70 2.07 2.62 3.72 5.05 6.13 6.82 7.14
Thailand 0.96 1.06 1.16 1.28 1.26 1.38 1.82 2.50 3.20 3.78 4.27
Viet Nam 0.87 1.08 1.32 1.56 1.56 1.55 1.77 2.35 3.02 3.71 4.34
Pacic Island Countries 0.59 0.55 0.57 0.63 0.67 0.77 0.95 1.19 1.41 1.70 2.19
Fiji, Rep. o 0.82 0.75 0.69 0.65 0.74 0.96 1.33 1.69 1.99 2.52 3.25
Micronesia, Fed. States o 0.99 1.01 1.05 1.15 0.92 0.88 1.19 1.34 1.40 1.88 2.66
Papua New Guinea 0.51 0.44 0.48 0.55 0.58 0.64 0.80 1.04 1.25 1.50 1.93
Samoa 0.50 0.50 0.60 0.84 1.09 1.08 1.45 1.73 1.72 1.97 2.81
Solomon Islands 0.78 0.95 0.97 0.97 0.92 0.89 0.93 1.11 1.46 1.92 2.51
Timor-Leste 0.55 0.53 0.43 0.51 0.56 1.01 1.04 1.05 1.02 1.11 1.29
Tonga 0.65 0.67 0.69 0.98 1.25 1.41 1.45 1.76 1.84 1.94 2.37
Vanuatu 0.77 0.90 0.97 1.01 0.97 1.03 1.17 1.41 1.65 1.98 2.40Developed Countries 1.38 1.66 1.99 2.52 3.28 4.15 5.07 5.97 6.99 7.92 8.70
Australia 1.75 1.97 2.28 2.62 2.75 3.18 3.81 4.47 4.98 5.26 5.37
Japan 1.30 1.59 1.92 2.50 3.40 4.38 5.36 6.32 7.45 8.53 9.46
New Zealand 1.84 2.01 2.26 2.50 2.67 2.91 3.53 4.20 4.66 4.91 5.07
Source: Authors’ calculations.
34 | ADB Economics Working Paper Series No. 280

7/30/2019 Population, Wealth, and Economic Growth in the Asia and Pacific Region
http://slidepdf.com/reader/full/population-wealth-and-economic-growth-in-the-asia-and-pacific-region 43/48
Appendix Table 5: Pension Transer Wealth Relative to Labor Income, Low-Income
Proles
1950 1960 1970 1980 1990 2000 2010 2020 2030 2040 2050
Asia and Pacic Region 0.33 0.39 0.47 0.56 0.68 0.84 1.09 1.39 1.78 2.14 2.49
Developing Economies 0.29 0.33 0.39 0.44 0.50 0.58 0.77 1.03 1.36 1.69 2.02Central and West Asia 0.53 0.52 0.49 0.46 0.44 0.46 0.54 0.64 0.79 1.02 1.27
Aghanistan 0.16 0.16 0.15 0.15 0.26 0.23 0.22 0.22 0.24 0.29 0.38
Armenia 0.76 0.68 0.59 0.55 0.63 0.83 1.09 1.26 1.38 1.73 1.90
Azerbaijan 0.64 0.60 0.54 0.44 0.48 0.49 0.66 0.89 1.10 1.48 1.82
Georgia 0.74 0.68 0.67 0.66 0.70 0.85 1.09 1.32 1.56 1.95 2.30
Kazakhstan 0.62 0.54 0.50 0.46 0.44 0.48 0.57 0.70 0.90 1.18 1.42
Kyrgyz Republic 0.63 0.65 0.58 0.52 0.49 0.45 0.53 0.64 0.82 1.12 1.46
Pakistan 0.48 0.49 0.48 0.45 0.42 0.45 0.48 0.55 0.66 0.84 1.05
Tajikistan 0.49 0.57 0.55 0.48 0.40 0.38 0.46 0.55 0.63 0.87 1.18
Turkmenistan 0.45 0.48 0.47 0.44 0.43 0.37 0.44 0.55 0.74 1.05 1.43
Uzbekistan 0.53 0.64 0.61 0.53 0.49 0.43 0.51 0.63 0.81 1.15 1.55
East Asia 0.29 0.34 0.42 0.47 0.55 0.64 0.88 1.21 1.63 2.01 2.37
China, People’s Rep. o 0.29 0.35 0.42 0.46 0.52 0.60 0.81 1.10 1.50 1.83 2.19
Hong Kong, China 0.32 0.41 0.69 0.83 0.99 1.13 1.66 2.18 2.77 3.31 3.51
Korea, Rep. o 0.29 0.30 0.37 0.47 0.61 0.82 1.19 1.72 2.31 2.92 3.39
Mongolia 0.26 0.28 0.32 0.34 0.35 0.35 0.39 0.56 0.80 1.19 1.54
Taipei,China 0.25 0.32 0.40 0.55 0.67 0.82 1.15 1.54 2.04 2.56 2.93
South Asia 0.23 0.26 0.31 0.33 0.37 0.41 0.51 0.61 0.76 0.99 1.27
Bangladesh 0.21 0.25 0.27 0.29 0.31 0.33 0.38 0.48 0.66 0.91 1.17
Bhutan 0.21 0.21 0.25 0.26 0.33 0.52 0.50 0.55 0.73 1.06 1.40
India 0.23 0.26 0.31 0.33 0.37 0.41 0.50 0.61 0.75 0.97 1.27
Maldives 0.31 0.34 0.33 0.31 0.39 0.40 0.41 0.53 0.74 1.15 1.55
Nepal 0.14 0.20 0.24 0.28 0.33 0.38 0.41 0.47 0.57 0.73 0.94
Sri Lanka 0.62 0.43 0.43 0.49 0.54 0.67 0.92 1.22 1.48 1.76 1.90
Southeast Asia 0.30 0.33 0.38 0.42 0.47 0.52 0.68 0.93 1.21 1.51 1.77
Brunei Darussalam 0.48 0.42 0.34 0.30 0.28 0.32 0.50 0.68 0.96 1.27 1.61
Cambodia 0.20 0.19 0.18 0.26 0.29 0.32 0.37 0.43 0.50 0.69 0.90
Indonesia 0.26 0.26 0.29 0.33 0.40 0.45 0.55 0.74 0.99 1.26 1.50
Lao People’s Dem. Rep. 0.18 0.23 0.27 0.34 0.36 0.36 0.39 0.44 0.54 0.70 0.94Malaysia 0.39 0.39 0.41 0.40 0.41 0.46 0.62 0.82 1.05 1.33 1.62
Myanmar 0.27 0.35 0.44 0.49 0.48 0.45 0.56 0.71 0.97 1.24 1.47
Philippines 0.30 0.32 0.34 0.33 0.35 0.40 0.50 0.63 0.81 1.03 1.29
Singapore 0.28 0.34 0.48 0.64 0.82 1.04 1.55 2.20 2.78 3.18 3.44
Thailand 0.35 0.40 0.44 0.49 0.49 0.52 0.70 0.97 1.30 1.62 1.89
Viet Nam 0.29 0.38 0.47 0.59 0.62 0.62 0.71 0.96 1.25 1.59 1.93
Pacic Island Countries 0.20 0.19 0.19 0.21 0.23 0.27 0.34 0.44 0.54 0.67 0.88
Fiji, Rep. o 0.32 0.28 0.25 0.23 0.26 0.34 0.48 0.65 0.79 1.05 1.36
Micronesia, Fed. States o 0.36 0.37 0.38 0.42 0.36 0.33 0.45 0.50 0.54 0.75 1.05
Papua New Guinea 0.17 0.15 0.15 0.17 0.19 0.22 0.28 0.37 0.47 0.58 0.76
Samoa 0.18 0.18 0.21 0.32 0.41 0.44 0.58 0.73 0.74 0.83 1.22
Solomon Islands 0.26 0.32 0.35 0.35 0.33 0.32 0.33 0.40 0.53 0.74 1.03
Timor-Leste 0.18 0.18 0.14 0.16 0.18 0.35 0.37 0.39 0.38 0.41 0.47
Tonga 0.23 0.25 0.26 0.37 0.48 0.56 0.59 0.72 0.78 0.82 0.98Vanuatu 0.26 0.32 0.36 0.40 0.38 0.39 0.43 0.53 0.64 0.80 0.99
Developed Countries 0.51 0.63 0.78 1.03 1.39 1.84 2.32 2.78 3.36 3.83 4.28
Australia 0.67 0.76 0.91 1.09 1.17 1.38 1.68 2.01 2.29 2.46 2.54
Japan 0.47 0.60 0.75 1.01 1.45 1.95 2.47 2.95 3.61 4.14 4.68
New Zealand 0.71 0.79 0.90 1.03 1.13 1.25 1.53 1.87 2.12 2.28 2.37
Source: Authors’ calculations.
Population, Wealth, and Economic Growth in the Asia and Pacific Region | 35

7/30/2019 Population, Wealth, and Economic Growth in the Asia and Pacific Region
http://slidepdf.com/reader/full/population-wealth-and-economic-growth-in-the-asia-and-pacific-region 44/48
Appendix Table 6: Assets Relative to Labor Income, High-Income Proles
1950 1960 1970 1980 1990 2000 2010 2020 2030 2040 2050
Asia and Pacic Region 0.49 0.54 0.62 0.69 0.77 0.88 1.07 1.35 1.61 1.86 2.03
Developing Economies 0.44 0.48 0.55 0.59 0.62 0.68 0.84 1.12 1.39 1.61 1.78
Central and West Asia 0.69 0.64 0.60 0.55 0.54 0.57 0.61 0.74 0.88 1.05 1.26
Aghanistan 0.30 0.29 0.27 0.26 0.41 0.36 0.35 0.34 0.37 0.44 0.55Armenia 0.92 0.72 0.66 0.62 0.71 0.93 1.01 1.24 1.36 1.47 1.79
Azerbaijan 0.82 0.64 0.59 0.54 0.60 0.62 0.70 0.98 1.22 1.37 1.64
Georgia 0.91 0.74 0.74 0.77 0.83 0.99 1.12 1.39 1.60 1.75 2.01
Kazakhstan 0.79 0.64 0.58 0.54 0.53 0.60 0.66 0.85 1.01 1.19 1.39
Kyrgyz Republic 0.80 0.73 0.66 0.59 0.59 0.55 0.57 0.77 0.94 1.14 1.43
Pakistan 0.63 0.64 0.61 0.56 0.52 0.55 0.58 0.64 0.74 0.91 1.10
Tajikistan 0.63 0.64 0.62 0.53 0.48 0.45 0.49 0.62 0.73 0.89 1.17
Turkmenistan 0.62 0.58 0.58 0.54 0.52 0.46 0.50 0.68 0.87 1.11 1.41
Uzbekistan 0.69 0.73 0.71 0.57 0.53 0.49 0.54 0.72 0.92 1.17 1.49
East Asia 0.46 0.52 0.59 0.64 0.67 0.75 0.94 1.29 1.62 1.86 1.99
China, People’s Rep. o 0.47 0.53 0.59 0.64 0.66 0.72 0.89 1.22 1.53 1.75 1.88
Hong Kong, China 0.44 0.56 0.87 0.97 1.00 1.08 1.43 1.94 2.35 2.52 2.59
Korea, Rep. o 0.43 0.45 0.51 0.60 0.71 0.89 1.18 1.60 2.08 2.43 2.64
Mongolia 0.41 0.43 0.46 0.44 0.45 0.42 0.47 0.65 0.95 1.27 1.54 Taipei,China 0.38 0.45 0.57 0.71 0.78 0.87 1.12 1.54 1.90 2.15 2.37
South Asia 0.34 0.39 0.44 0.47 0.50 0.54 0.62 0.74 0.87 1.07 1.32
Bangladesh 0.38 0.40 0.42 0.44 0.46 0.46 0.51 0.64 0.83 1.09 1.33
Bhutan 0.36 0.36 0.39 0.41 0.48 0.68 0.59 0.65 0.84 1.16 1.49
India 0.33 0.38 0.44 0.47 0.50 0.54 0.61 0.73 0.86 1.06 1.31
Maldives 0.47 0.51 0.50 0.50 0.55 0.54 0.51 0.61 0.89 1.28 1.65
Nepal 0.31 0.35 0.39 0.43 0.49 0.52 0.55 0.60 0.71 0.87 1.09
Sri Lanka 0.63 0.51 0.54 0.59 0.64 0.76 0.98 1.27 1.43 1.54 1.74
Southeast Asia 0.43 0.45 0.51 0.56 0.58 0.65 0.79 1.05 1.28 1.46 1.63
Brunei Darussalam 0.65 0.55 0.43 0.36 0.32 0.40 0.58 0.83 1.02 1.25 1.47
Cambodia 0.33 0.33 0.32 0.44 0.42 0.46 0.52 0.57 0.64 0.84 1.12
Indonesia 0.40 0.39 0.44 0.49 0.55 0.60 0.69 0.88 1.12 1.34 1.52
Lao People’s Dem. Rep. 0.32 0.38 0.44 0.51 0.51 0.48 0.51 0.58 0.68 0.85 1.07
Malaysia 0.50 0.47 0.52 0.50 0.50 0.56 0.73 0.94 1.11 1.28 1.52Myanmar 0.40 0.49 0.59 0.61 0.58 0.53 0.63 0.84 1.06 1.29 1.45
Philippines 0.44 0.45 0.48 0.46 0.46 0.53 0.64 0.77 0.91 1.09 1.30
Singapore 0.35 0.44 0.65 0.78 0.88 1.10 1.52 2.09 2.41 2.48 2.54
Thailand 0.47 0.51 0.55 0.59 0.58 0.65 0.83 1.16 1.42 1.57 1.70
Viet Nam 0.47 0.57 0.67 0.75 0.72 0.69 0.75 1.02 1.31 1.52 1.72
Pacic Island Countries 0.31 0.29 0.31 0.34 0.35 0.39 0.47 0.58 0.66 0.76 0.95
Fiji, Rep. o 0.39 0.36 0.35 0.34 0.37 0.48 0.66 0.80 0.90 1.06 1.38
Micronesia, Fed. States o 0.50 0.50 0.52 0.58 0.44 0.41 0.55 0.67 0.65 0.80 1.21
Papua New Guinea 0.28 0.24 0.27 0.31 0.31 0.33 0.40 0.51 0.60 0.69 0.85
Samoa 0.26 0.25 0.31 0.41 0.53 0.49 0.63 0.75 0.76 0.78 1.10
Solomon Islands 0.39 0.52 0.49 0.49 0.46 0.44 0.46 0.54 0.70 0.89 1.09
Timor-Leste 0.31 0.28 0.26 0.29 0.30 0.52 0.53 0.51 0.49 0.52 0.63
Tonga 0.33 0.33 0.33 0.46 0.59 0.65 0.64 0.76 0.80 0.82 0.99
Vanuatu 0.41 0.45 0.47 0.46 0.45 0.49 0.56 0.66 0.76 0.87 1.03Developed Countries 0.68 0.78 0.90 1.08 1.34 1.65 1.94 2.22 2.48 2.84 3.00
Australia 0.82 0.91 1.01 1.13 1.14 1.26 1.50 1.75 1.89 1.95 1.97
Japan 0.64 0.75 0.88 1.08 1.39 1.74 2.04 2.32 2.62 3.05 3.24
New Zealand 0.87 0.90 1.02 1.09 1.12 1.17 1.41 1.67 1.81 1.83 1.88
Source: Authors’ calculations.
36 | ADB Economics Working Paper Series No. 280

7/30/2019 Population, Wealth, and Economic Growth in the Asia and Pacific Region
http://slidepdf.com/reader/full/population-wealth-and-economic-growth-in-the-asia-and-pacific-region 45/48
Appendix Table 7: Assets Relative to Labor Income, Low-Income Proles
1950 1960 1970 1980 1990 2000 2010 2020 2030 2040 2050
Asia and Pacic Region 0.70 0.78 0.89 1.01 1.13 1.30 1.57 1.99 2.41 2.78 3.05
Developing Economies 0.63 0.69 0.78 0.85 0.91 0.99 1.22 1.64 2.07 2.40 2.68
Central and West Asia 1.01 0.94 0.90 0.81 0.79 0.83 0.89 1.08 1.29 1.55 1.89
Aghanistan 0.42 0.41 0.38 0.36 0.58 0.52 0.50 0.49 0.52 0.62 0.78Armenia 1.38 1.08 0.99 0.90 1.06 1.40 1.49 1.88 2.04 2.21 2.71
Azerbaijan 1.23 0.98 0.91 0.77 0.89 0.91 1.00 1.45 1.81 2.05 2.48
Georgia 1.37 1.12 1.12 1.12 1.24 1.49 1.67 2.09 2.41 2.64 3.06
Kazakhstan 1.16 0.95 0.88 0.80 0.78 0.88 0.96 1.25 1.49 1.77 2.09
Kyrgyz Republic 1.17 1.10 0.98 0.87 0.88 0.82 0.83 1.12 1.38 1.69 2.14
Pakistan 0.92 0.93 0.90 0.82 0.75 0.79 0.84 0.92 1.08 1.33 1.63
Tajikistan 0.90 0.95 0.92 0.77 0.71 0.66 0.71 0.90 1.06 1.29 1.74
Turkmenistan 0.91 0.85 0.86 0.79 0.78 0.68 0.71 0.99 1.27 1.63 2.11
Uzbekistan 0.99 1.08 1.06 0.85 0.80 0.73 0.77 1.05 1.34 1.71 2.24
East Asia 0.67 0.74 0.84 0.93 0.99 1.08 1.36 1.89 2.43 2.79 3.02
China, People’s Rep. o 0.68 0.76 0.85 0.92 0.97 1.04 1.29 1.78 2.29 2.63 2.85
Hong Kong, China 0.61 0.77 1.21 1.41 1.50 1.56 2.07 2.89 3.52 3.76 3.87
Korea, Rep. o 0.61 0.64 0.72 0.86 1.03 1.30 1.72 2.39 3.14 3.66 3.98
Mongolia 0.58 0.61 0.66 0.65 0.66 0.61 0.66 0.93 1.37 1.88 2.34 Taipei,China 0.54 0.63 0.79 1.02 1.17 1.27 1.64 2.30 2.87 3.26 3.58
South Asia 0.49 0.55 0.63 0.68 0.72 0.77 0.89 1.08 1.28 1.57 1.97
Bangladesh 0.54 0.57 0.60 0.63 0.66 0.66 0.74 0.91 1.20 1.61 1.99
Bhutan 0.50 0.50 0.55 0.58 0.70 0.99 0.87 0.95 1.21 1.71 2.25
India 0.48 0.55 0.63 0.68 0.72 0.77 0.89 1.07 1.26 1.56 1.95
Maldives 0.68 0.73 0.72 0.69 0.79 0.80 0.73 0.88 1.28 1.87 2.49
Nepal 0.42 0.49 0.56 0.62 0.69 0.76 0.79 0.87 1.02 1.27 1.61
Sri Lanka 0.97 0.74 0.79 0.86 0.93 1.08 1.44 1.90 2.15 2.34 2.62
Southeast Asia 0.63 0.65 0.74 0.80 0.84 0.93 1.14 1.54 1.91 2.19 2.45
Brunei Darussalam 0.93 0.80 0.63 0.52 0.48 0.56 0.83 1.20 1.51 1.85 2.20
Cambodia 0.47 0.47 0.46 0.62 0.60 0.65 0.74 0.83 0.93 1.20 1.66
Indonesia 0.58 0.56 0.63 0.70 0.79 0.88 0.99 1.28 1.66 2.02 2.28
Lao People’s Dem. Rep. 0.44 0.54 0.62 0.74 0.75 0.71 0.73 0.84 0.99 1.22 1.58
Malaysia 0.75 0.69 0.76 0.73 0.72 0.80 1.05 1.38 1.64 1.91 2.27Myanmar 0.57 0.70 0.84 0.90 0.86 0.78 0.91 1.22 1.57 1.93 2.19
Philippines 0.63 0.64 0.69 0.68 0.67 0.76 0.92 1.12 1.34 1.61 1.93
Singapore 0.49 0.61 0.92 1.11 1.26 1.53 2.19 3.14 3.67 3.72 3.81
Thailand 0.67 0.73 0.80 0.85 0.86 0.95 1.20 1.70 2.13 2.38 2.57
Viet Nam 0.66 0.81 0.96 1.09 1.08 1.02 1.07 1.50 1.96 2.29 2.60
Pacic Island Countries 0.46 0.41 0.44 0.49 0.50 0.55 0.66 0.83 0.97 1.11 1.39
Fiji, Rep. o 0.58 0.53 0.51 0.49 0.53 0.68 0.94 1.20 1.33 1.58 2.05
Micronesia, Fed. States o 0.73 0.73 0.76 0.84 0.68 0.60 0.80 1.01 0.95 1.16 1.78
Papua New Guinea 0.42 0.34 0.38 0.44 0.44 0.47 0.56 0.72 0.88 1.00 1.24
Samoa 0.38 0.36 0.42 0.61 0.79 0.73 0.91 1.13 1.17 1.14 1.60
Solomon Islands 0.52 0.75 0.72 0.71 0.67 0.64 0.66 0.76 1.00 1.29 1.60
Timor-Leste 0.46 0.41 0.37 0.41 0.42 0.73 0.76 0.76 0.72 0.75 0.91
Tonga 0.47 0.48 0.48 0.68 0.88 0.97 0.96 1.14 1.21 1.23 1.44
Vanuatu 0.58 0.65 0.71 0.70 0.67 0.70 0.80 0.96 1.11 1.28 1.52Developed Countries 0.97 1.12 1.31 1.59 1.98 2.46 2.91 3.30 3.70 4.23 4.45
Australia 1.20 1.32 1.47 1.68 1.70 1.86 2.22 2.63 2.85 2.93 2.95
Japan 0.91 1.07 1.28 1.57 2.04 2.60 3.07 3.46 3.89 4.53 4.79
New Zealand 1.29 1.32 1.49 1.63 1.67 1.73 2.08 2.52 2.75 2.75 2.82
Source: Authors’ calculations.
Population, Wealth, and Economic Growth in the Asia and Pacific Region | 37

7/30/2019 Population, Wealth, and Economic Growth in the Asia and Pacific Region
http://slidepdf.com/reader/full/population-wealth-and-economic-growth-in-the-asia-and-pacific-region 46/48
Reerences
ADB. Various years. Key Indicators for Asia and the Pacic . Asian Development Bank, Manila.Becker, G., and H. G. Lewis. 1973. “On the Interaction between the Quantity and Quality of
Children.”Journal of Political Economy 81(2):S279–88.Becker, G. S., and K. M. Murphy. 1988. “The Family and the State.” Journal of Law and
Economics XXXI(April):1–18.Bloom, D. E., and D. Canning. 2001. “Cumulative Causality, Economic Growth, and the
Demographic Transition.” In N. Birdsall, A. C. Kelley and S. W. Sinding, Population Matters:
Demographic Change, Economic Growth, and Poverty in the Developing World. Oxford:Oxford University Press.
Bloom, D. E., and J . G. Williamson. 1998. “Demographic Transitions and Economic Miracles inEmerging Asia.”World Bank Economic Review 12(3):419–56.
Bloom, D. E., D. Canning, and B. Graham. 2003. “Longevity and Life-cycle Savings.” Scandinavian
Journal of Economics 105(3):319–38.Bommier, A., R. Lee, T. Miller, and S. Zuber. 2010. “Who Wins and Who Loses? Public Transfer
Accounts for US Generations Born 1850 to 2090.”Population and Development Review
36(1):1–26.Bosworth, B., and G. Chodorow-Reich. 2007. Saving and Demographic Change: The Global
Dimension. CRR Working Paper 2007–2, Center for Retirement Research, Boston College,Massachusetts.
Cutler, D. M., J . M. Poterba, L. Sheiner, and L. Summers. 1990. “An Aging Society: Opportunity orChallenge?”Brookings Papers on Economic Activity 1990(1):1–56.
Fry, M., and A. Mason. 1982. “The Variable Rate-of-Growth Effect in the Life-cycle Saving Model.”Economic Enquiry XX:426–43.
Higgins, M. 1998. “Demography, National Savings, and International Capital Flows.” International
Economic Review 39(2):343–69.Higgins, M., and J . G. Williamson.1997. “Age Structure Dynamics in Asia and Dependence of
Foreign Capital.”Population and Development Review 23:261–93.Kelley, A. C., and R. M. Schmidt. 1995. “Aggregate Population and Economic Growth Correlations:
The Role of the Components of Demographic Change.”Demography 32(4):543–55. ———. 2007. “Evolution of Recent Economic-Demographic Modeling: A Synthesis.” In A. Mason
and M. Yamaguchi, Population Change, Labor Markets and Sustainable Growth: Towards a
New Economic Paradigm. Amsterdam: Elsevier.Kinugasa, T. 2004. Life Expectancy, Labor Force, and Saving. University of Hawaii at Manoa.
Ph.D. Dissertation.Kinugasa, T., and A. Mason. 2007. “Why Nations Become Wealthy: The Effects of Adult Longevity
on Saving.”World Development 35(1):1–23.Lee, R., and A. Mason. 2010a. “Fertility, Human Capital, and Economic Growth over the
Demographic Transition.”European Journal of Population 26(2):159–82.———. 2010b. “Some Macroeconomic Consequences of Global Population Aging.” Demography
47(Supplement):S151–72.
———. 2011. Population Aging and the Generational Economy: A Global Perspective. Cheltenham:Edward Elgar. Forthcoming.Lee, R. D., S.-H. Lee, and A. Mason. 2008. “Charting the Economic Lifecycle.” In A. Prskawetz,
D. E. Bloom, and W. Lutz, Population Aging, Human Capital Accumulation, and Productivity
Growth, a Supplement to Population and Development Review 33:208–37. PopulationCouncil, New York.
Lee, R., A. Mason, and T. Miller. 2003. Scandinavian Journal of Economics 105(3):339–57.Available: www.demog.berkeley.edu/~tmiller/papers/p2000.from.transfers.pdf.
38 | ADB Economics Working Paper Series No. 280

7/30/2019 Population, Wealth, and Economic Growth in the Asia and Pacific Region
http://slidepdf.com/reader/full/population-wealth-and-economic-growth-in-the-asia-and-pacific-region 47/48
Mason, A. 1981. An Extension of the Life-Cycle Model and Its Application to Population Growthand Aggregate Saving. East-West Population Institute Working Papers No. 4, East-WestCenter, Honolulu.
———. 1988. “Saving, Economic Growth, and Demographic Change.”Population and
Development Review 14(1):113–44.
———. 2001. Population Change and Economic Development in East Asia: Challenges Met,Opportunities Seized. Stanford: Stanford University Press.
———. 2005. “Demographic Transition and Demographic Dividends in Developed and DevelopingCountries.” Paper presented at the United Nations Expert Group Meeting on Social andEconomic Implications of Changing Population Age Structures, Mexico City.
Mason, A., and R. Lee. 2007. “Transfers, Capital, and Consumption over the Demographic Transition.” In R. Clark, A. Mason, and N. Ogawa, Population Aging, Intergenerational
Transfers and the Macroeconomy. London: Elgar Press.Mason, A., R. Lee, and S. Lee. 2010. “The Demographic Transition and Economic Growth in the
Pacic Rim.” In T. Ito and A. K. Rose, The Economic Consequences of Demographic Change
in East Asia.Mason, A., R. Lee, A-C Tung, M-S Lai, and T. Miller. 2009. “Population Aging and Intergenerational
Transfers: Introducing Age into National Accounts.” In D. Wise, Developments in the
Economics of Aging. Chicago: National Bureau of Economics Research and University of Chicago Press.
Ogawa, N., A. Mason, A. Chawla, and R. Matsukura. 2010. “J apan’s Unprecedented Agingand Changing Intergenerational Transfers.” In T. Ito and A. K. Rose, The Economic
Consequences of Demographic Change in East Asia.Ogawa, N., A. Mason, A. Chawla, R. Matsukura, and A-C Tung. 2009. “Declining Fertility and the
Rising Cost of Children: What Can National Transfer Accounts Say about Low Fertility in J apan and Other Asian Countries?” Asian Population Studies 5(3):289–307.
Preston, S. H. 1984. “Children and the Elderly: Divergent Paths for America’s Dependents.”Demography 21(4):435–57.
Prettner, K., and A. Prskawetz. 2010. Decreasing Fertility, Economic Growth and theIntergenerational Wage Gap. Working Paper 0906, Vienna Institute of Demography, Austrian
Academy of Sciences, Vienna. Available: www.oeaw.ac.at/vid/download/WP2009_06.pdf.Romero, M. S., C. Patxot, E. Rentería, and G. Souto. 2010. From Transfers to Capital: Analyzingthe Spanish Demand for Wealth using NTA. MPIDR Working Papers WP-2010–029, MaxPlanck Institute for Demographic Research, Rostock.
Solow, R. M. 1956. “A Contribution to the Theory of Economic Growth.” Quarterly Journal of
Economics 70(1):65–94. Tobin, J . 1967. “Life Cycle Saving and Balanced Economic Growth.” In W. Fellner, Ten Economic
Studies in the Tradition of Irving Fisher . New York: Wiley.UN. 2009. World Population Prospects: The 2008 Revision. Department of Economic and Social
Affairs, Population Division, United Nations, New York.Willis, R. J . 1973. “A New Approach to the Economic Theory of Fertility Behavior.”Journal of
Political Economy 81(2, Part 2):S14–64.Zhang, J ., and J . Zhang. 2005. “The Effect of Life Expectancy on Fertility, Saving, Schooling and
Economic Growth: Theory and Evidence.” Scandinavian Journal of Economics 107(1):45–66.
Population, Wealth, and Economic Growth in the Asia and Pacific Region | 39

7/30/2019 Population, Wealth, and Economic Growth in the Asia and Pacific Region
http://slidepdf.com/reader/full/population-wealth-and-economic-growth-in-the-asia-and-pacific-region 48/48
About the Paper
Andrew Mason and Sang-Hyop Lee show how changes in population age structure havebeen favorable to improved living standards throughout developing Asia during recentdecades. However, over the decades, growth in the oldest age groups could serve as aserious drag on economic growth. Given appropriate development policies, however,population aging can lead to increased capital, greater investment in education and
health, and continued economic growth.
About the Asian Development Bank
ADB’s vision is an Asia and Pacific region free of poverty. Its mission is to help itsdeveloping member countries reduce poverty and improve the quality of life of theirpeople. Despite the region’s many successes, it remains home to two-thirds of theworld’s poor: 1.8 billion people who live on less than $2 a day, with 903 millionstruggling on less than $1.25 a day. ADB is committed to reducing poverty throughinclusive economic growth, environmentally sustainable growth, and regionalintegration.
Based in Manila, ADB is owned by 67 members, including 48 from the region. Its
main instruments for helping its developing member countries are policy dialogue, loans,equity investments, guarantees, grants, and technical assistance.
Asian Development Bank 6 ADB Avenue, Mandaluyong City1550 Metro Manila, Philippineswww.adb.org/economicsISSN: 1655-5252


![Pacific Ocean...Pacific Ocean [WCPO] and Eastern Pacific), a single population in the South-West Pacific, two populations in the Atlantic (South and North), and a single population](https://img.pdfslide.us/doc/110x75/5fb4ee9965b2ae3d9f2a4f6a/pacific-ocean-pacific-ocean-wcpo-and-eastern-pacific-a-single-population.jpg)