Embed Size (px)
Citation preview
29
G.J.B.A.H.S.,Vol.5(4):29-39 (October-December,2016) ISSN: 2319 – 5584
Population Structure of the Common Hippopotamus (Hippopotamus amphibius) in the Luangwa River, Zambia
Chansa Chomba
School of Agriculture and Natural Resources, Disaster Management Training Centre,
Mulungushi University, P. O. Box 80415, Kabwe, Zambia.
Abstract Population structure of the common hippopotamus (Hippopotamus amphibius Linnaeus 1758) in the Luangwa
Valley, eastern Zambia was assessed during the period 2005-2008. Field observations and laboratory examinations were used to classify hippos in age groups. Chi-square Test of age group composition showed a significant
difference in the percent proportion of age groups in the population (2 = 57.98, DF = 6, = 0.05, P< 0.001).
Calves one year old and less were not represented. Younger groups ‘iii’ and ‘v’ comprised only 15 percent of the
population. The remaining 75 percent were older age groups vii - xix mainly comprising mature and senescent
individuals. The age structure was biased towards older age groups. Skewed age distribution in favour of older age
groups was an indication of a declining population growth rate. More research is required to investigate factors
responsible for the decline in population growth rates.
Keywords: Common hippopotamus, age structure, calves, sub adults, adults, declining
1. Introduction Animal populations vary in their proportion of young and old individuals. Age groups can be assigned to
qualitative age classes such as such as calf, juvenile, sub adult and adult (Brower and Zar, 1977). The proportions of
individuals belonging to the various age groups are collectively referred to as age structure or age distribution of the
population. Brower and Zar (1977) recognized three methods of obtaining data on population structure. The first
being the vertical approach where the researcher follows a cohort. Thus by knowing the age of cohort members, the
researcher can follow their survival until all have died. Secondly, is the horizontal approach where information on
all ages within a given population is obtained at one time, thus all cohorts in a population are examined at the same
time. In this method, one assumes a stable age structure and that birth and death rates remain constant. The third is
where the researcher knows the age at death for members of the population. In studying the hippopotamus population structure, it was assumed that hippopotamus birth rates and death
rates were constant and therefore age classes were proportionately equal. The samples collected from the culled
specimens were examined at the same time as unbiased samples from a population.
Knowledge of hippopotamus age structure is important for knowing age distribution in the population as this
affects hippopotamus population dynamics. From this knowledge of age distribution, population growth rates may
be estimated. Such knowledge would enable the researcher to know whether the population is declining, stable or
increasing. For most species, recruitment rate in any population is determined by the proportion of age groups. If
the number of calves and sub adults are more than older age groups the population would be rapidly increasing. The
number of individuals in each age class can be plotted as a horizontal histogram forming a pyramid. If there are an
almost equal proportion of age groups the population stabilizes or is stationary and when the older age groups are
more than the younger age groups the population declines. To determine age group composition in a population requires taking random samples of a population unless
the population under study is small that all individuals can be counted. Chapman and Reiss (2000) outlined ways of
determining age in animals and trees. Different methods are used ranging from field observation of live specimens
to laboratory methods. In this study, a combination of methods was used. Field observations of live specimens and
laboratory examination of skulls based on Laws (1967) obtained from culling were used. To ensure credibility of
the age groups obtained from body and skull measurements, a comparison was made with measurements made
during the 1970 - 1972 culling programme. During the period 1970 - 1972 skull measurements were taken and
animals were placed in age groups based on body size measurements, skull measurements and the teeth eruption
and wear.
The culling programme was designed in such a way that the whole hippopotamus school was removed in a
day and this prevented sampling error arising from under representation of some age groups in the sample.
G.J.B.A.H.S.
30
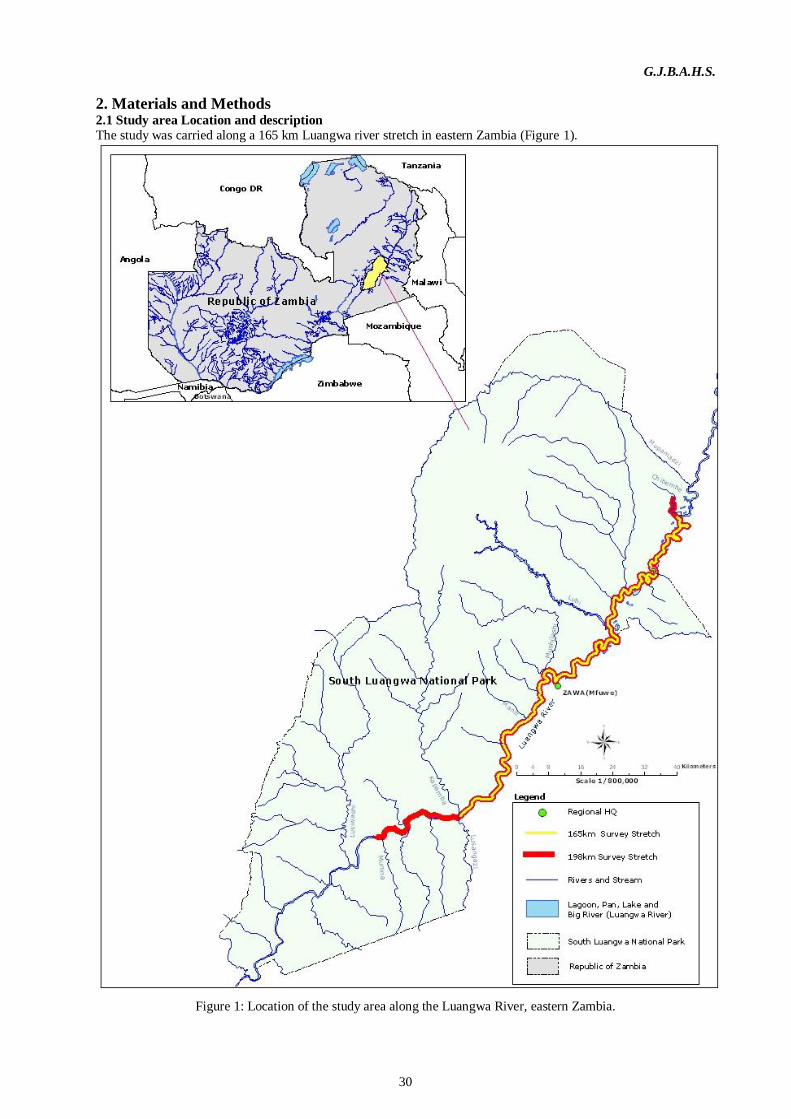
2. Materials and Methods 2.1 Study area Location and description
The study was carried along a 165 km Luangwa river stretch in eastern Zambia (Figure 1).
Figure 1: Location of the study area along the Luangwa River, eastern Zambia.
G.J.B.A.H.S.
31
2.1.1 Climate
The annual rainfall ranges from 400 - 800 mm and minimum and maximum temperatures are 10oC (June -
July) and 38o C (October) respectively. The hot rainy season is from late November to April, a cool dry season is
from May to August, and a hot dry season from September to early November.
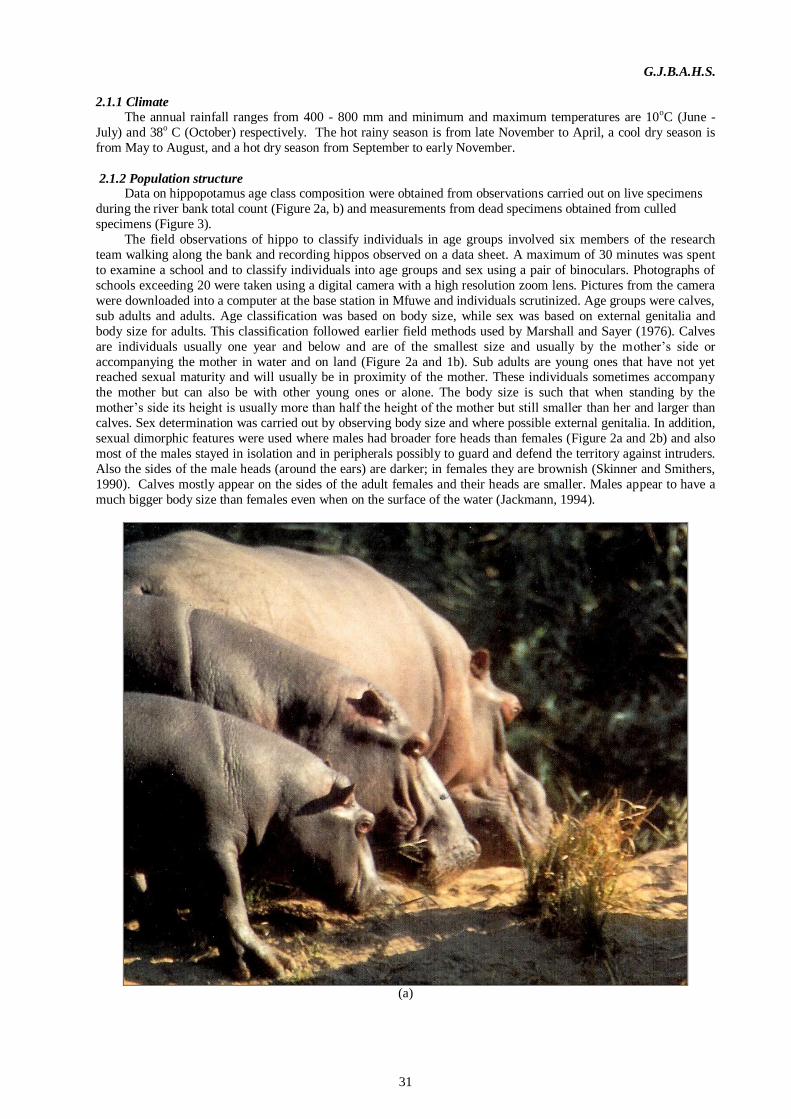
2.1.2 Population structure Data on hippopotamus age class composition were obtained from observations carried out on live specimens
during the river bank total count (Figure 2a, b) and measurements from dead specimens obtained from culled
specimens (Figure 3).
The field observations of hippo to classify individuals in age groups involved six members of the research
team walking along the bank and recording hippos observed on a data sheet. A maximum of 30 minutes was spent
to examine a school and to classify individuals into age groups and sex using a pair of binoculars. Photographs of
schools exceeding 20 were taken using a digital camera with a high resolution zoom lens. Pictures from the camera
were downloaded into a computer at the base station in Mfuwe and individuals scrutinized. Age groups were calves,
sub adults and adults. Age classification was based on body size, while sex was based on external genitalia and
body size for adults. This classification followed earlier field methods used by Marshall and Sayer (1976). Calves
are individuals usually one year and below and are of the smallest size and usually by the mother’s side or
accompanying the mother in water and on land (Figure 2a and 1b). Sub adults are young ones that have not yet reached sexual maturity and will usually be in proximity of the mother. These individuals sometimes accompany
the mother but can also be with other young ones or alone. The body size is such that when standing by the
mother’s side its height is usually more than half the height of the mother but still smaller than her and larger than
calves. Sex determination was carried out by observing body size and where possible external genitalia. In addition,
sexual dimorphic features were used where males had broader fore heads than females (Figure 2a and 2b) and also
most of the males stayed in isolation and in peripherals possibly to guard and defend the territory against intruders.
Also the sides of the male heads (around the ears) are darker; in females they are brownish (Skinner and Smithers,
1990). Calves mostly appear on the sides of the adult females and their heads are smaller. Males appear to have a
much bigger body size than females even when on the surface of the water (Jackmann, 1994).
(a)

G.J.B.A.H.S.
32
(b)
Figure 2: a)Age and sex differences based on body size when animals are standing. Calf with the small body size is
on the left, adult female in the centre and adult male which is also larger that the female is on the right. Nsefu area
of South Luangwa National Park, b) Age and sex differences based on body size when animals are lying down, calf with the small body size female is on the left, and calf is in the middle and male which is also larger that the female
is on the right. Nsefu area of South Luangwa National Park, Zambia.
Figure 3: Skull measurements being taken by field assistants. Mfuwe base camp, Luangwa Valley Zambia.
G.J.B.A.H.S.
33
The classification of individuals as calves, sub adults and adults was verified in this study by comparing body
measurements and lower jaw measurements from culled specimens. This method was also used in the 1970 - 1972
culling programme as recorded by Marshall and Sayer (1976) where body length was measured from the tip of the
snout to the base of the tail and used to place carcasses in respective age groups. Lower jaws were also measured in
centimeters from the rear end to the front end of the skull and also used to place animals into age groups (Figure 3).
The same approach was used in the 2005 - 2008 culling programme. Age determination from skulls was done by examining tooth eruption and degree of wear of molar teeth (Sensu Laws, 1967).
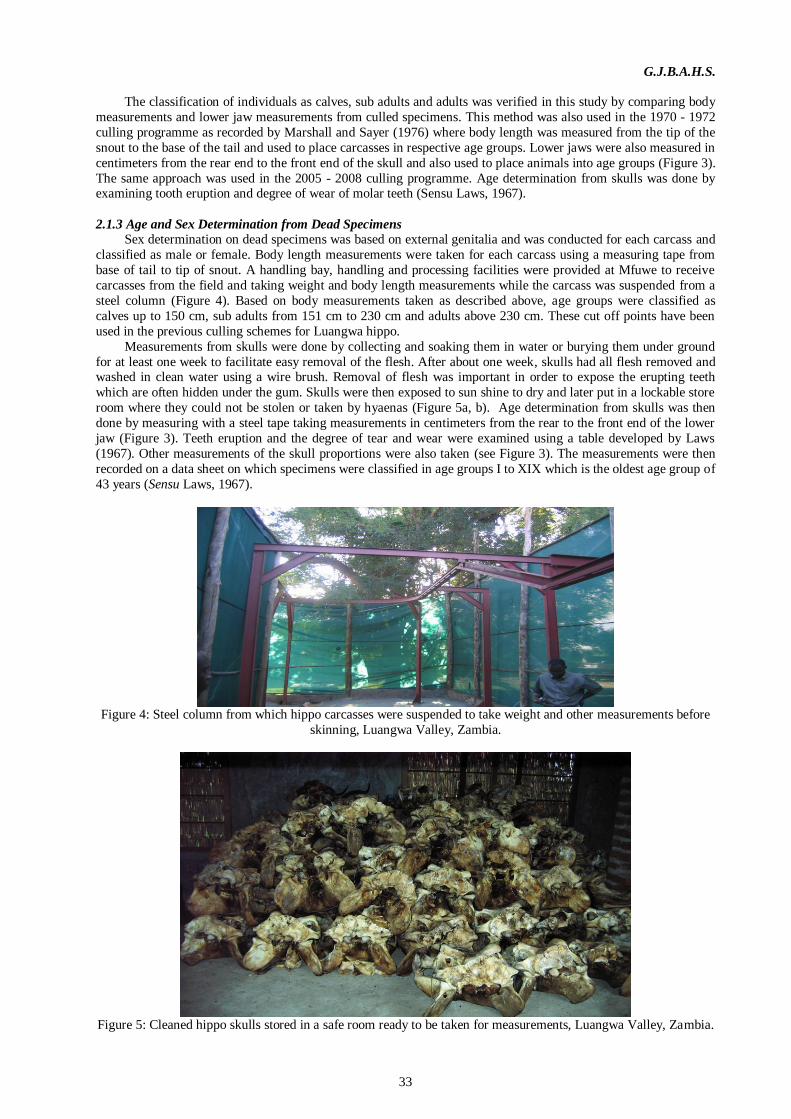
2.1.3 Age and Sex Determination from Dead Specimens
Sex determination on dead specimens was based on external genitalia and was conducted for each carcass and
classified as male or female. Body length measurements were taken for each carcass using a measuring tape from
base of tail to tip of snout. A handling bay, handling and processing facilities were provided at Mfuwe to receive
carcasses from the field and taking weight and body length measurements while the carcass was suspended from a
steel column (Figure 4). Based on body measurements taken as described above, age groups were classified as
calves up to 150 cm, sub adults from 151 cm to 230 cm and adults above 230 cm. These cut off points have been
used in the previous culling schemes for Luangwa hippo.
Measurements from skulls were done by collecting and soaking them in water or burying them under ground
for at least one week to facilitate easy removal of the flesh. After about one week, skulls had all flesh removed and washed in clean water using a wire brush. Removal of flesh was important in order to expose the erupting teeth
which are often hidden under the gum. Skulls were then exposed to sun shine to dry and later put in a lockable store
room where they could not be stolen or taken by hyaenas (Figure 5a, b). Age determination from skulls was then
done by measuring with a steel tape taking measurements in centimeters from the rear to the front end of the lower
jaw (Figure 3). Teeth eruption and the degree of tear and wear were examined using a table developed by Laws
(1967). Other measurements of the skull proportions were also taken (see Figure 3). The measurements were then
recorded on a data sheet on which specimens were classified in age groups I to XIX which is the oldest age group of
43 years (Sensu Laws, 1967).
Figure 4: Steel column from which hippo carcasses were suspended to take weight and other measurements before
skinning, Luangwa Valley, Zambia.
Figure 5: Cleaned hippo skulls stored in a safe room ready to be taken for measurements, Luangwa Valley, Zambia.

G.J.B.A.H.S.
34
3. Results 3.1 Population structure
There were seven (7) age groups recorded in this study (Table 1 and 2; Figure 6). The difference in age group
proportions in the population was significantly different (2 = 57.98, DF = 6, = 0.05, P< 0.001). Calves one year old and less were not represented in the population. Younger groups ‘iii’ and ‘v were only 15 percent of the
population (Table 1; Figure 2). Older age groups vii - xix comprising mature and senescent individuals were the
majority being 75 percent of the population. The age structure was biased towards older age groups.
Table 1: Hippopotamus age distribution based on the three culling programmes conducted so far in the Luangwa
Valley, Zambia
Age
group
Estimated
Age in years
Year Percentage (%)
composition of
population 2005 - 2008
1970 1971 2005-2008
i < 1 7 0 0
iii 1 - 2 5 4 2 2.2
v 3-5 16 16 13 13.26
vii 6 -11 67 69 31 31.63
ix 12 -17 82 34 25 25.51
xi 18 - 26 59 26 15 15.30
xv 27 - 34 125 54 9 9.18
xix 36 - 41 15 7 3 3
(Data for 1970 and 1971 from Marshall and Sayer, 1976)
Table 2: Measurements from hippopotamus specimens culled in 2005, Luangwa Valley, Zambia
Age group Jaw length
(mm)
Estimated
age in years
Age group Jaw length
(mm)
Estimated age
in years
ix 39 15 xi 41 22
ix 38 17 xi 40 21
ix 41 17 xi 41 23
ix 40 11 xi 39 20
ix 40 18 xi 43 25
ix 39 17 xi 42 20
ix 39 16 xi 43 25
ix 35 15 xi 42 25
ix 38 17 xi 39 25
ix 38 18 xi 39 25
ix 39 18 xi 43 25
ix 39 15 xi 39 20
ix 40 17 xi 38 20
ix 38 14 xi 41 20
ix 39 17 xi 36 19
ix 39 15 xi 38 20
ix 39 16 xi 40 20
ix 37 15 xi 43 26
ix 42 20 xi 34 20
ix 39 18 xi 37 18
ix 38 15 xv 40 30
ix 38 15 xv 39 30
ix 38 15 xv 39 30
ix 40 18 xv 40 30
ix 40 18 xv 39 30
ix 39 12 xv 41 32
ix 38 15 Xv 37 30
ix 40 18 xv 37 30
ix 39 18 xv 38 32
ix 39 15
ix 39 17
G.J.B.A.H.S.
35
xix 40 35 vii 36 10
xix 41 35 vii 37 11
xix 44 35 vii 35 10
vii 37 10 vii 37 11
vii 30 8 vii 36 9
vii 32 8 v 33 5
vii 30 6 v 28 5
vii 30 6 v 26 4
vii 35 8 v 25 4 vii 35 8 V 28 5
vii 35 10 v 26 5
vii 35 10 v 28 5
vii 35 8 v 29 4
vii 30 6 v 22 3
vii 35 8 v 23 4
vii 36 9 v 25 4
vii 35 8 v 32 3
vii 36 8 v 29 5
vii 34 10 v 28 5
vii 34 10 iii 15 2
vii 37 10 Iii 15 2 vii 37 10
vii 36 8
vii 36 10
vii 36 10
vii 32 8
vii 33 8
vii 33 8
vii 38 11
0
5
10
15
20
25
30
35
i iii v vii ix xi xv xix
Hippopotamus age groups
Perc
ent (%
) com
posi
tion in p
opula
tion
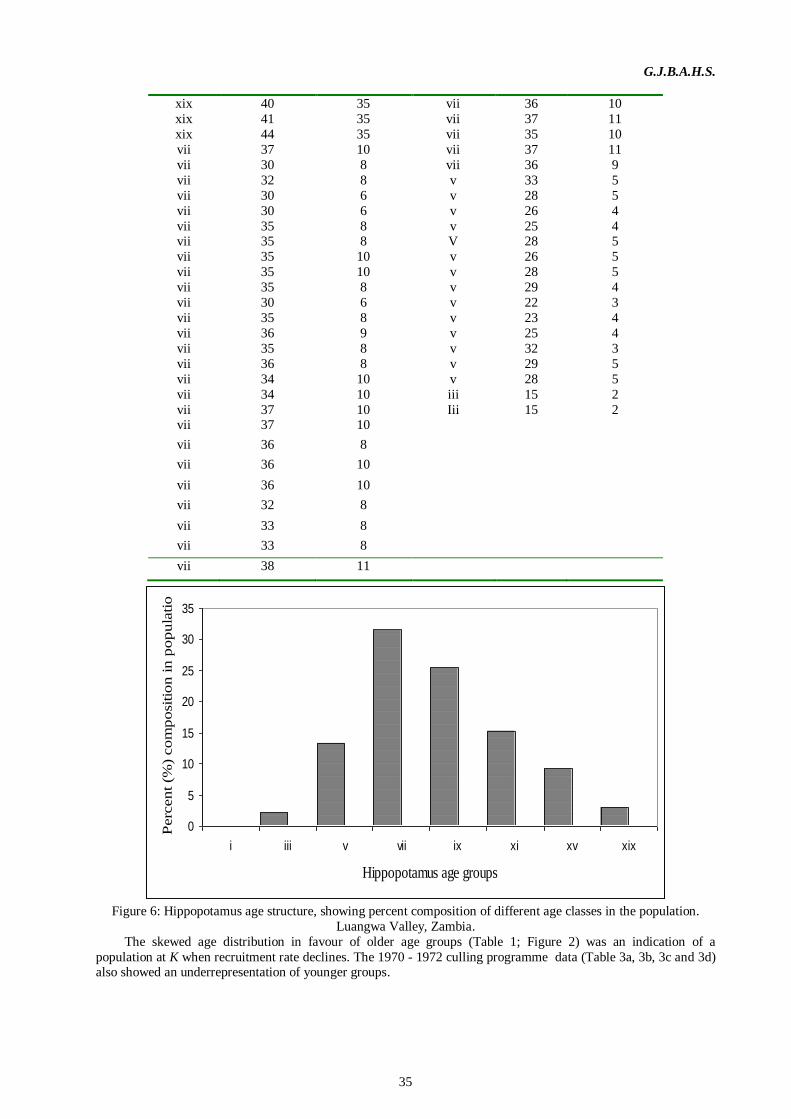
Figure 6: Hippopotamus age structure, showing percent composition of different age classes in the population.
Luangwa Valley, Zambia.
The skewed age distribution in favour of older age groups (Table 1; Figure 2) was an indication of a
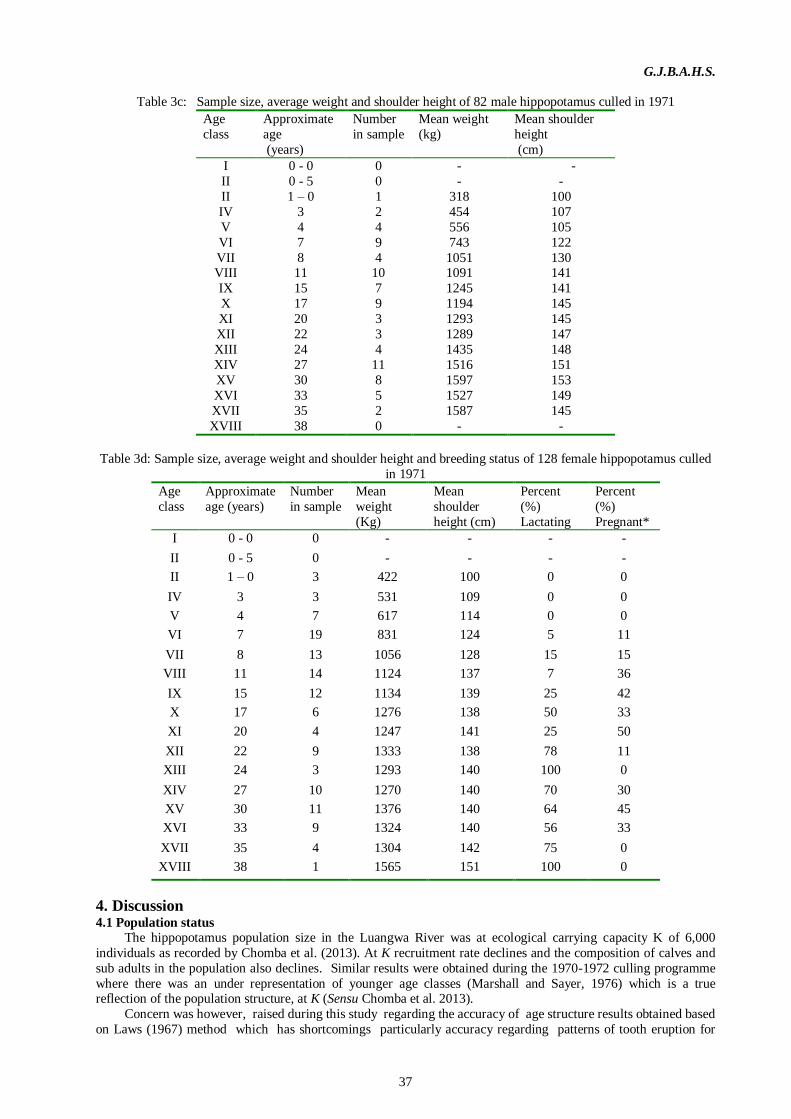
population at K when recruitment rate declines. The 1970 - 1972 culling programme data (Table 3a, 3b, 3c and 3d) also showed an underrepresentation of younger groups.
G.J.B.A.H.S.
36
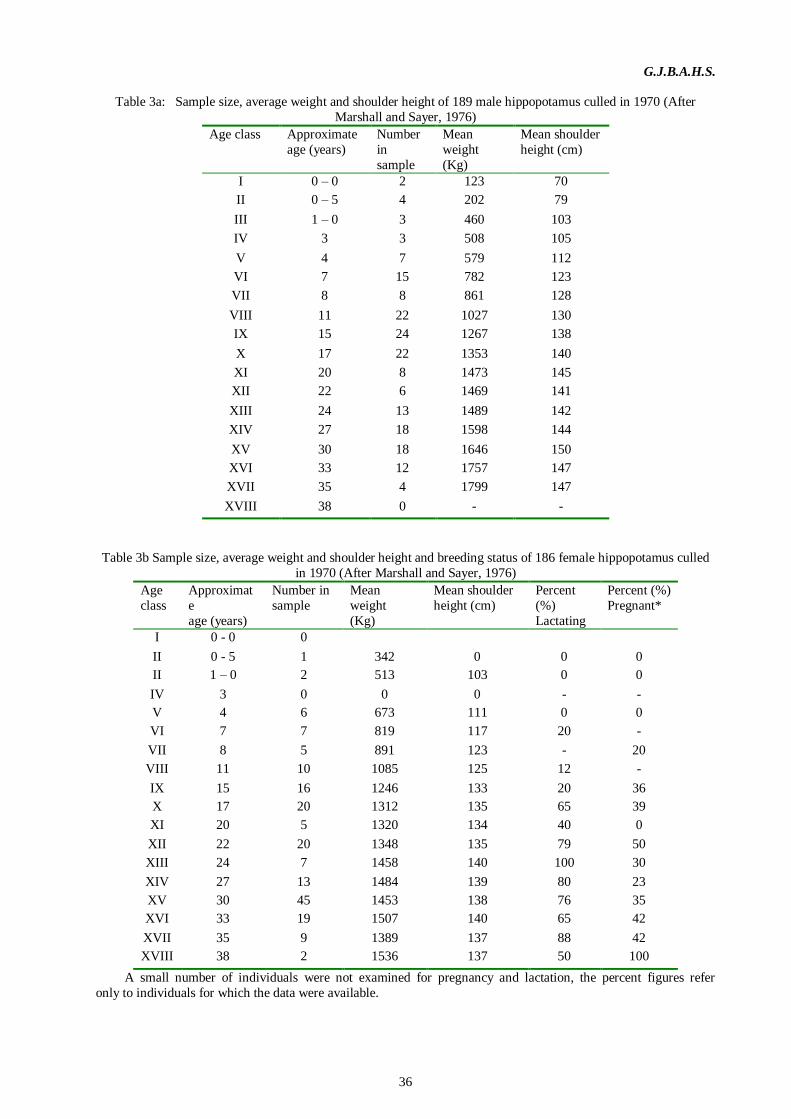
Table 3a: Sample size, average weight and shoulder height of 189 male hippopotamus culled in 1970 (After
Marshall and Sayer, 1976)
Age class Approximate
age (years)
Number
in
sample
Mean
weight
(Kg)
Mean shoulder
height (cm)
I 0 – 0 2 123 70
II 0 – 5 4 202 79
III 1 – 0 3 460 103
IV 3 3 508 105
V 4 7 579 112
VI 7 15 782 123
VII 8 8 861 128
VIII 11 22 1027 130
IX 15 24 1267 138
X 17 22 1353 140
XI 20 8 1473 145
XII 22 6 1469 141
XIII 24 13 1489 142
XIV 27 18 1598 144
XV 30 18 1646 150
XVI 33 12 1757 147
XVII 35 4 1799 147
XVIII 38 0 - -
Table 3b Sample size, average weight and shoulder height and breeding status of 186 female hippopotamus culled
in 1970 (After Marshall and Sayer, 1976)
Age
class
Approximat
e
age (years)
Number in
sample
Mean
weight
(Kg)
Mean shoulder
height (cm)
Percent
(%)
Lactating
Percent (%)
Pregnant*
I 0 - 0 0
II 0 - 5 1 342 0 0 0
II 1 – 0 2 513 103 0 0
IV 3 0 0 0 - -
V 4 6 673 111 0 0
VI 7 7 819 117 20 -
VII 8 5 891 123 - 20
VIII 11 10 1085 125 12 -
IX 15 16 1246 133 20 36
X 17 20 1312 135 65 39
XI 20 5 1320 134 40 0
XII 22 20 1348 135 79 50
XIII 24 7 1458 140 100 30
XIV 27 13 1484 139 80 23
XV 30 45 1453 138 76 35
XVI 33 19 1507 140 65 42
XVII 35 9 1389 137 88 42
XVIII 38 2 1536 137 50 100
A small number of individuals were not examined for pregnancy and lactation, the percent figures refer
only to individuals for which the data were available.
G.J.B.A.H.S.
37
Table 3c: Sample size, average weight and shoulder height of 82 male hippopotamus culled in 1971
Age
class
Approximate
age
(years)
Number
in sample
Mean weight
(kg)
Mean shoulder
height
(cm)
I 0 - 0 0 - -
II 0 - 5 0 - -
II 1 – 0 1 318 100
IV 3 2 454 107
V 4 4 556 105
VI 7 9 743 122
VII 8 4 1051 130 VIII 11 10 1091 141
IX 15 7 1245 141
X 17 9 1194 145
XI 20 3 1293 145
XII 22 3 1289 147
XIII 24 4 1435 148
XIV 27 11 1516 151
XV 30 8 1597 153
XVI 33 5 1527 149
XVII 35 2 1587 145
XVIII 38 0 - -
Table 3d: Sample size, average weight and shoulder height and breeding status of 128 female hippopotamus culled
in 1971
Age
class
Approximate
age (years)
Number
in sample
Mean
weight
(Kg)
Mean
shoulder
height (cm)
Percent
(%)
Lactating
Percent
(%)
Pregnant*
I 0 - 0 0 - - - -
II 0 - 5 0 - - - -
II 1 – 0 3 422 100 0 0
IV 3 3 531 109 0 0
V 4 7 617 114 0 0
VI 7 19 831 124 5 11
VII 8 13 1056 128 15 15
VIII 11 14 1124 137 7 36
IX 15 12 1134 139 25 42
X 17 6 1276 138 50 33
XI 20 4 1247 141 25 50
XII 22 9 1333 138 78 11
XIII 24 3 1293 140 100 0
XIV 27 10 1270 140 70 30
XV 30 11 1376 140 64 45
XVI 33 9 1324 140 56 33
XVII 35 4 1304 142 75 0
XVIII 38 1 1565 151 100 0
4. Discussion 4.1 Population status
The hippopotamus population size in the Luangwa River was at ecological carrying capacity K of 6,000
individuals as recorded by Chomba et al. (2013). At K recruitment rate declines and the composition of calves and
sub adults in the population also declines. Similar results were obtained during the 1970-1972 culling programme
where there was an under representation of younger age classes (Marshall and Sayer, 1976) which is a true reflection of the population structure, at K (Sensu Chomba et al. 2013).
Concern was however, raised during this study regarding the accuracy of age structure results obtained based
on Laws (1967) method which has shortcomings particularly accuracy regarding patterns of tooth eruption for
G.J.B.A.H.S.
38
animals after seventeen years of age. It is recorded that after 17 years of age accuracy becomes intricate mainly
arising from the degree of wear of teeth influenced by nature of grass, rainfall regime and others which in turn also
influence wear of molars and premolars as also acknowledged by Marshall and Sayer (1976). Despite the short
comings highlighted, the variations based on the age at which tooth wear becomes significant cannot alter the
results and secondly, this is so far the best method available and the results obtained are therefore reliable. Healy
and Ludwig, (1965) however, found that the rate of wear of sheep’s teeth was directly proportional to the amount of soil ingested by the sheep, this in turn was a function of soil type and vegetation. Ludwig, Healey and Cutress
(1966) found that tooth wear was related to the seasonal distribution of rainfall being greatest where there were wet
winters and dry summers, and least where rainfall was more evenly distributed. Viewed from this angle one would
contemplate that seasonal distribution of rainfall in Uganda where the method was developed is much more even
(Figure 4.7) than in Zambia and therefore tooth wear is likely to start slightly later in life than the Luangwa
hippopotamus population. It is therefore concluded that the results obtained in this study were accurate and
indicative of reduced recruitment rate in the hippopotamus population of the Luangwa valley.
References Astel, W.L., Phiri, P.S.M., Prince, S.D., (1997). A dictionary of vernacular-scientific names of plants of the mid-Luangwa Valley. Kirkia 6 (2), pp 161-203.
Astel, W.L., Webster, R., Lawrence, C.J., (1969). Land classification for management planning in the Luangwa Valley of Zambia. Journal of Applied Ecology, 6, pp143-169.
Attwell, R.I.G., (1963). Surveying Luangwa hippo. Puku. 1, pp 29 – 49.
Bell, R.H.V., (1986). Carrying capacity and offtake quotas. In: R.H.V. Bell and E. McShane - Caluzi (eds) Conservation and Wildlife Management in Africa. U.S. Peace Corps, Washington, D.C.
Bourliere, F., Verschuren, J., (1960). Introduction on the ecology of ungulates in Albert National Park. Congo Belgium, Brussels.
Chapman, J.L., and Reiss, M.J., (2000). Ecology, principles and applications. Cambridge University Press.
Chomba, C. Simpamba, T. and Nyirenda, V. (2013). Has the Luangwa (Zambia) hippopotamus (Hippopotamus amphibius)
population stabilized after reaching its asymptote? What are the management implications? Open Journal of Ecology, Vol. 3 (6): pp 395 – 406.
Darling, F.F., (1960). Wildlife in African territory. Oxford University Press, London.
Fanshawe, D.B., (1971). The vegetation of Zambia. Forest Bulletin. No. 7. Government Printer, Lusaka.
Finerty, J.P., (1980). The population ecology of cycles of small mammals. New Haven, Yale University Press.
Food and Agriculture Organisation of the United Nations, (1973). Luangwa Valley
Conservation and Development Project. Working Document No. I. (19…) Game Management and Habitat Manipulation. FO: DP/ZAM/68/510. F.A.O. Rome.
James, E., (2007). The influence of elephant ivory trade ban on population of common hippopotamus (Hippopotamus amphibius), a case study of Katavi – Rukwa – Lukwati ecosystem, Tanzania, MSc. Thesis, University of Dar es Salaam, Dar es Salaam.
Klein, D.R., (1968). The introduction, increase, and crash of reindeer on st. Mathew island. Journal Wildlife Management, 32 (2), pp 350 - 367.
Lawton, R.M., (1964). The ecology of Marquesia acuminata (Gilg.) R.E. Fr. Evergreen forests and
related Chipya vegetation types of North-eastern Rhodesia. Journal of Ecology, 66, pp 467- 479.
Lawton, R.M., (1978). A study of the dynamic ecology of Zambia vegetation. Journal of Ecology, 66, pp 175-198.
Lane Poole, E.H., (1956). The Luangwa Valley. Northern Rhodesia Journal, 3, pp 154 -163.
Lewison, R., 2007. Population responses to natural and human –mediated disturbances: assessing the vulnerability of the common hippopotamus (Hippopotamus amphibius). African Journal of Ecology 45, 407 – 415.
Marshall, P.J., Sayer, J.A., (1976). Population ecology and response of a hippopotamus population in eastern Zambia. The Journal of Applied Ecology 13, pp 391- 403.
Mduma, S.A.R., Sinclair, A.R.E., Hilborn, R., (1999). Food regulates the Serengeti Wildebeest: a 40 year record, Journal of Animal Ecology, 68, pp 1101-1122.
Mentis, M.T., Duke, R.R., (1976). Carrying Capacity of Natural veld in Natal for Large wild herbivores. South Africa Journal of Wildlife Research 7, pp 89-98.
Mentis, M.T., (1977). Stocking rates and carrying capacity for ungulates on African Rangelands. South African Journal of Wildlife Research, 9, pp 90 - 98.
Michelmore, A.P.G., (1939). Observations on tropical African grasslands. Journal of Ecology, 27, pp 282 - 312.
Phiri, P.S.M., (1994). The relevance of plant taxonomic information for the conservation of the low altitude Luangwa Valley ecosystem in Zambia. In: J.H. Seyani and A.C. Chikuni (eds) Proc. XIII Plenary Meeting , Malawi, 2, pp 903-910.
Phiri, P.S.M., (1998). The vegetation types of the South Luangwa National Park and the surrounding Game Management Areas. National Parks and Wildlife Service, Chilanga.

G.J.B.A.H.S.
39
Prince, S.D., (1971). A quantitative description of some mopane woodlands in the Luangwa Valley. Game Dept., Ministry of Lands and Natural Resources, Republic of Zambia, Lusaka.
Sayer, J.A., Rhaka, A.M., (1974). The age of puberty in the hippopotamus (Hippopotamus amphibius) in the Luangwa River in eastern Zambia. East African Wildlife Journal, 12, pp 227-232.
Sichingabula, H., (1998). Hydrology, character of channel changes on Luangwa River, their impacts and implications on
tourism, South Luangwa National Park and adjacent Game Management Areas. Report prepared for EDF/NPWS towards the development of a General Management Plan for South Luangwa National Park and adjacent Game Management Areas, Chilanga.
Sinclair, A.R.E., Grimsdell, J.J.R., (1982). Population dynamics of large mammals. African Wildlife Foundation, Nairobi.
Vesey - Fitzgerald, D.F., (1963). Central African grasslands. Journal of Ecology 51, pp 243-274.
Weger, M.J.A., Coetzee, B.J., (1978). The Sudano - Zambesian Region. In: Biogeography and Ecology of Southern Africa, by Weger M.J.A., (Ed). BV. Publishers. The Hague.
White, F., (1962). Forest Flora of Northern Rhodesia. Oxford University Press. London.
White, F., (1983). The Vegetation of Africa. UNESCO.