Embed Size (px)
Citation preview
Population structure and species description of aquatic Sphingomonadaceae
Dissertation at the Faculty of Biology
Ludwig-Maximilians-University Munich
Hong Chen

1. Reviewer: Prof. Dr. Jörg Overmann 2. Reviewer: Prof. Dr. Anton Hartmann Date of examination: 30. Jan. 2012
Publications originating from this thesis
1. Chen, H., Jogler, M., Sikorski, J., Overmann J. Evidence for incipient speciation among
sympatric subpopulations of a single phylotype of freshwater planktonic Sphingomonadaceae
ISME J., submitted
2. Chen, H., Jogler, M., Tindall, B., Rohde, M., Busse, H.-J., Overmann J. Reclassification and
amended description of Caulobacter leidyi as Sphingomonas leidyi comb. nov., and emendation
of the genus Sphingomonas. Int J Syst Evol Microbiol. submitted.
3. Chen, H., Jogler, M., Tindall, B., Rohde, M., Busse, H.-J., Overmann J. Sphingobium
limneticum sp. nov., isolated from fresh lake water Starnberger See. Int J Syst Evol Microbiol.
submitted.
4. Chen, H., Jogler, M., Tindall, B., Rohde, M., Busse, H.-J., Overmann J. Sphingomonas
oligotrophica sp. nov., isolated from fresh lake water Starnberger See. Int J Syst Evol Microbiol.
in prep.
5. Chen, H., Jogler, M., Tindall, B., Rohde, M., Busse, H.-J., Overmann J. Sphingobium boeckii
sp. nov., isolated from fresh lake water Walchensee and reclassification of Sphingomonas
suberifacien as Sphingobium suberifacien. Int J Syst Evol Microbiol. submitted.
Contribution of Hong Chen to the publications listed in this thesis
Publication 1:
Hong Chen performed the isolation and identification of all the 95 strains of
Sphingomonadaceae used in the analysis; she chose and designed the primers for the 9
housekeeping genes, tested and established the PCR protocols. She also run all the molecular
work such as PCR and gene sequencing, edited the sequence data; set up the clone library of
gyrB gene, finished all the phenotypic characterization using the BiOLOG system. Hong Chen
performed the data analysis together with Johannes Sikorski. Hong Chen together with
Johannes Sikorski and Jörg Overmann created all figures and tables and participated in the
writing of the publication.
Publications 2-5:
Hong Chen performed the all the physiological analysis, enzyme activity, biochemical analysis,
susceptibility test (medium, pH, temperature, API NE, API ZYM, API 50CH, BiOLOG,
antibiotic test). For chemotaxonomic analysis, Hong Chen prepared all the biomass for fatty acid
analysis, respiratory quinone, polar lipids and polyamines analysis. For genetic analysis, Hong
Chen performed the PCR, the 16S rRNA sequencing and prepared the biomass for genomic DNA
G+C content determination and the DNA-DNA hybridization. Hong Chen performed all the
data collection and analysis. Hong Chen created all figures and tables and together with and Jörg
Overmann and the Co-authors participated in writing of the publications.
I herby confirm the above statements
Hong Chen Prof. Dr. Jörg Overmann
Content
Chapter 1: Summary ............................................................................................................... 1
Chapter 2: Introduction........................................................................................................... 4
Microevolution of bacteria ..................................................................................................... 4
The species concept of prokaryotes........................................................................................ 5
Population genetics of prokaryotes....................................................................................... 12
Approaches to assess bacterial population structure............................................................ 14
Aims of the present study ..................................................................................................... 18
Chapter 3: Material and Methods ........................................................................................ 20
Sampling site and targeted isolation of bacterial strains ...................................................... 20
Sequencing and phylogeny of 16S rRNA genes .................................................................. 21
Multilocus sequence analysis (MLSA)................................................................................. 21
Population genetics............................................................................................................... 24
Phenotypic characterization.................................................................................................. 26
Physiological and chemotaxonomic characterization of new species .................................. 27
Chapter 4: Results .................................................................................................................. 30
Population structure of freshwater Sphingomonadaceae in the two lakes ........................... 30
Analysis of the evolutionary forces underlying the population structure............................. 35
Metabolic diversification and its role in niche invasion....................................................... 41
Polyphasic analysis of the subpopulations revealed by MLSA............................................45
Sphingomonas oligotrophica 382T ....................................................................................... 45
Reclassification of Caulobacter leidyi as Sphingomonas leidyi comb. nov......................... 53
Sphingobium limneticum 301T.............................................................................................. 58
Description of Sphingobium boeckii sp. nov., and reclassification of Sphingomonas
suberifaciens as Sphingobium suberifaciens comb.nov. ...................................................... 66
Chapter 5: Discussion ............................................................................................................ 75
Complex Population structure of freshwater Sphingomonadaceae...................................... 75
Evolutionary forces underlying the population structure ..................................................... 76

Metabolic diversification and its role in niche invasion....................................................... 78
The Application of MLSA to systematics ............................................................................ 79
Polyphasic analysis in differentiating species ...................................................................... 81
Conclusion............................................................................................................................ 91
Chapter 6: References............................................................................................................ 93
Acknowlegment .................................................................................................................... 117
Curriculum vitae .................................................................................................................. 118
Chapter 1: summary
1
Chapter 1
Summary
Prokaryotes consist of the domains of Bacteria and Archaea and exist since approximately
3.8 billion years. Prokaryotes, despite the small size of the individual cells, are regarded to
represent the 'unseen majority' among the living world as they occur numerously in all types of
habitats and contribute greatly to the biogeochemical cycle. They diversified strongly
throughout their long evolutionary history. Prokaryotes have usually a short generation time
and relatively small amount of genetic information as compared to eukaryotes, and large census
population sizes. This renders them suitable test organisms for studying their evolutionary
processes. The discipline of population genetics analyses the evolutionary change of the
genotypic and phenotypic variants at the level of species. Most of the recent bacterial
population genetic studies have focussed on pathogens.
Little is known of the population structure of freshwater bacteria. Natural freshwater
lakes harbor a considerably lower diversity of bacteria, this facilitating the study of the genetic
variability of bacteria. Sphingomonadaceae represent typical constituents of freshwater
bacterioplankton communities and therefore served as a target group for a high-resolution
multilocus sequence analysis (MLSA) of nine housekeeping genes (atpD, dnaK, fusA, tufA, gap,
groEL, gyrB, recA, rpoB) and a parallel phenotypic characterization. Among 95 strains
recovered from two trophically different freshwater lakes (Starnberger See and Walchensee),
only 19 different 16S rRNA gene sequences were found. Yet, each strain represented a unique
MLSA haplotype and the population displayed extraordinary high levels of nucleotide diversity.
A split decomposition analysis revealed eight genetically distinct subpopulations, three of
which comprised a single phylotype G1A with 52 strains. The population recombination rate ρ
was comparable to that of other bacteria but two to eight-fold lower than the population
mutation rates θS. Consequently, the impact of recombination on the population structure of
freshwater Sphingomonadaceae is markedly lower than in most other free-living aquatic
bacteria investigated to date. This was supported by a linkage disequilibrium analysis on the
Chapter 1: summary
2
allele distribution. Together with the large effective population size (estimate, ~6·108), our data
suggest that the incipient sexual isolation of subpopulations is caused by natural selection
rather than genetic drift or demographic effects. Since neutrality tests did not provide evidence
for an effect of selective forces on the housekeeping genes and no consistent physiological
differences were detected between the G1A subpopulations, alternative phenotypic traits are
supposed to provide a selective advantage for individual subpopulations of
Sphingomonadaceae. This conclusion is supported by discrete seasonal abundance patterns that
were detected based on pyrosequencing of internal transcribed spacer sequences in the natural
samples.
MLSA is a widely applied genotyping tool in studies of the evolution and population
structure of microbial organism and also represents a novel standard in microbial molecular
systematics. Population genetic analysis of Sphingomonadaceae by MLSA revealed a distinct
population substructure among individual 16S rRNA phylotypes, providing insights into the
diversity within bacterial species. A 'species' is the main taxonomic unit in the systematics of
prokaryotes, but the subject of the species concept of prokaryotes has always been
controversial. Until now there is no prokaryotic species concept that is accepted by all
scientists. But for practical reasons, bacterial strains are affiliated to different species on the
basis of DNA-DNA reassociation and diagnostic phenotypes. As DNA-DNA hybridization is
difficult to be compared between laboratories and time consuming, MLSA becomes a valuable
alternative to it. The population genetic structure revealed by MLSA is strongly associated with
the results from DNA-DNA relatedness values. When sufficient numbers of suitable loci are
selected, the concatenated sequence similarity values can in principle be used for species
delineation.
To assess the population and subpopulation structure revealed by MLSA also from a
taxonomic perspective, four Sphingomonadaceae strains belonging to four different
subpopulations were chosen for new species description. Based on morphological,
physiological and biochemical characterization, strain 247 from group G3B was affiliated to a
species formerly named 'Caulobacter leidyi' and which was now reclassified as 'Sphingomonas
leidyi'. Strain 382 from group G1A2 was proposed as type strain of a novel species

Chapter 1: summary
3
'Sphingomonas limneticum'. Strain 301 from group G2D was proposed as type strain of a novel
species 'Sphingobium oligotrophica', and a strain 469 was proposed as type strain of a novel
species 'Sphingobium boeckii', and the closely related species formerly names 'Sphingomonas
suberifaciens' was reclassified as 'Sphingobium suberifaciens'.
Chapter 2: introduction
4
Chapter 2
Introduction
Microevolution of bacteria
Evolution is the process that has produced the enormous diversity of organisms alive
today. Evolution is the change over time in one or more inherited traits present in populations
of individuals. Evolutionary changes are classified into two types, macroevolutionary and
microevolutionary changes. Macroevolution refers to any evolutionary changes at or above
the level of species, such as evolution of genera, families and phyla. Microevolution refers to
any evolutionary changes below the level of species, normally refers to the changes in allele
frequencies that occur over time within a population or a species (Hennig, 1966). Thus,
microevolution results in splitting a species into two (cladogenesis) or change a species into
another (anagenesis) (Rensch, 1959): Population genetics is the branch of biology that studies
the process of microevolution. The change of microevolution is due to four different
processes: mutation, selection, gene flow and genetic drift.
Bacteria reproduce by the asexual process of binary fission. So, the daughter cells get the
identical chromosome from their mother cell. There is no sexual process to exchange or
retrieve new genetic information within the course of replication. The genetic variation
between bacteria results then from the accumulation of mutations which may occur because of
replication errors or other external factors (Bertram, 2000; Aminetzach et al., 2005; Burrus &
Waldor, 2004). After a sufficient number of generations, the variation may be enough to
delineate them into different lineages. The diversity can also arise by horizontal gene transfer
(HGT), by which cells may obtain or lose genetic materials between different lineages. Gene
flow refers to the horizontal gene transfer between different populations. For bacterial
populations, HGT plays a major role during the evolutionary process.
The genetic variation may be neutral at the beginning. But under specific conditions like
competing for the same source of nutrient, the novel genetic variation (either by mutation or
HGT) may increase the fitness of one of the lineages, i.e., by increasing the survival or
Chapter 2: introduction
5
reproductive capability, resulting in an increase of the abundance of this lineage in their
population by periodic selection, whereas other lineages may decrease in abundance or even
get extinct (Levin, 1981). As a consequence, the frequency of alleles changes in the course of
generations. The lower the sequence diversity in a population, the higher the frequency of
gene drifts in their offspring generation (Spratt & Maiden, 1999; Boucher et al., 2003; Walsh,
2006).
Evolution at the species or population level proceeds through a differential
reproductive success of individuals. Populations and species are levels of diversity in which
evolutionary changes can be observed. One central issue in evolution is the mechanisms
maintaining genetic and phenotypic variation in natural populations. Prokaryotes like bacteria
have often short generation times but have large population sizes and are suitable to
genetic-level analysis in the controlled environments in the field of 'experimental evolution',
in which the complexity of the analysis is reduced allowing researchers to better understand
microevolutionary dynamics (Rainey et al., 2000). But prokaryotes represent one of the least
understood groups with respect to evolutionary biology because of their high diversity. To
more fully understand and better explain the forces which bring about changes in these groups,
it has been necessary to apply our knowledge of genetics to populations.
The species concept of prokaryotes
Population genetics is concerned with the allelic variation within species over
generations. Thus, the field of population genetics is ultimately linked to the field of
taxonomy. The category 'species' represents the main taxonomic unit in classification.
Speciation is the evolutionary process by which new biological species arise. Natural
speciation take place over the course of evolution. But the nature of the process of speciation
is still a subject of debate among microbiologists because of the existence of different
mechanism (Baker, 2005). The disciplines of eukaryotic populations are divided by the
species boundary, so the population genetics is summarized in Mayr's definition of biological
species: "species are groups of interbreeding natural populations that are reproductively
isolated from other groups" (Mayr, 1970; de Queiroz, 2005). For prokaryotes, the difficult
Chapter 2: introduction
6
task is to set up the limits of the populations and to define a species. The problem arises
because of their predominantly asexual reproduction and the apparent promiscuity of certain
genetic elements.
The prokaryotes vary by responding to changes in the biotic and abiotic components of
ecosystems. For eukaryotes it is well known by the fossil records that species got extinct. But
for prokaryotes, there is no direct evidence of microbial extinctions because fossil records
cannot be captured.
The prokaryotes, which constitute the domain of Archaea and Bacteria may possibly
contain millions of different species. The diversity is the product of about 3.8 billion years of
evolution, which may be the reason for the extraordinary diversity and habitat range of
prokaryotes (Torsvik et al., 2002). Numerous species have a worldwide distribution, and a
local population may contain the full range of variation that exists worldwide (O’ Rourke &
Stevens, 1993). The Global Biodiversity Assessment program suspects that there are millions
of species of prokaryotic organisms that exist in nature, but only around 9000 of them have
been described taxonomically (Straininfo http://www.straininfo.net/stats; LPSN
http://www.bacterio.cict.fr/; DSMZ http://www.dsmz.de/). The vast majority of naturally
occurring prokaryotic organisms cannot yet be cultured. So the full diversity of the
physiological and biochemical reactions, the biotechnological potential of prokaryotes and
their ecological role are still unknown. Some complex environments like soil inhabit a very
high degree of diversity of prokaryotes, genetic studies of soil estimate that 10 grams of
unpolluted soil typically have millions of different species of prokaryotes (Lengeler et al.,
1999; Gans et al., 2005).
What determining the driving force behind the speciation of prokaryotes, people found
that prokaryotic organisms have evolved sophisticated ways for acquiring and losing genetic
material (Margulis & Sagan, 2002). The three major mechanisms (transformation,
transduction and conjugation) of genetic exchange are well understood, and have been
documented to exist in nature with major ramifications for acquisition of new traits and
speciation. Natural genetic exchange is the uptake of genetic materials from the environment
or other cells. It is potentially relevant for speciation because the source of the obtained DNA
Chapter 2: introduction
7
can be from different species. Therefore, these genetic exchanges can introduce novel genes
into a microbial population ultimately leading to niche specialization and speciation (Aravind
et al., 1998; Cohan, 1994; Ochman et al., 2000; Ogunseitan, 1995). But on the other side it is
these genetic exchanges which make it difficult to delineate the species by genetic analysis,
leading a debate of whether there are any naturally entities of prokaryotic species or not.
Speciation is the result of evolution and it may ultimately lead to the generation of major
taxonomic groups. The investigation of speciation and diversity of prokaryotes are related to
the research on the origin of planetary life, and on how the physiological characteristics of
prehistoric microorganisms contributed to the emergent signature of a co-evolving life and
environment. So the investigation can also shed light on biogeochemical cycles that are
sensitive to industrial ecological problems such as energy crisis, disease epidemics, global
warming, toxic pollutants and environmental problems (Martin & Mueller, 1998; Lake et al.,
1985; Brown et al., 2001; Rasmussen, 2000). Cohan (2002) believes that “Bacterial species
exist- on this much bacteriologists can agree. Bacteriologists widely recognize that bacterial
diversity is organized into discrete phenotypic and genetic clusters, which are separated by
large phenotypic and genetic gaps, and these clusters are recognized as species”. Additionally,
the definition of species is necessary for the research of the bacterial populations, the study of
evolutionary theories and its practical application (Wald et al., 2008; Fraser et al., 2009).
There is little support for the non-existence of bacterial species, species taxon realism holds
that recognized species can be real, they are bacteria which are variously, well-defined
spatio-temporally and cohesive in their properties. Individual organisms in a species should
share one or more traits that unite them to be the same species and distinguish them from
other species (Diamond & Bishop 1999; Pigliucci, 2003; Riley and Lizotte-Waniewski,
2009).
There are a large number of criteria to be used to define the prokaryotic species
depending on the different objectives of the researches. The understanding of prokaryotic
species has traditionally relied on the criteria used to the species concept of eukaryotic
organisms. For example, the term “taxospecies” refers to phenotypic clusters of bacteria and
was proposed by Ravin (1960) who tried to apply the biological species concept (BSC) to
Chapter 2: introduction
8
bacteria. The species was defined as a group of organisms with mutually high phenotypic
similarity that forms an independent phenotypic cluster. This concept is analogous to the
morphological species concept by which organisms are classified in the same species if they
appear identical by morphological (anatomical) criteria (Eldredge & Cracraft, 1980), but in
addition to anatomical features, it includes consideration of physiological characteristics. The
“genospecies” concept was also proposed by Ravin (1963) by defining groups of bacteria that
can exchange genes, but with very little correlation between groups of organisms described as
taxospecies. This incongruence provoked further dissatisfaction among microbiologists
holding traditional species concepts.
More recent attempts to make the biological species concept applicable to prokaryotes
fall into four categorial groups: the influence of recombination, the influence of the ecology,
the application of phylogeny and nominalism (Ereshefsky, 2010). Dykhuizen and Green
(1991) proposed bacterial species to be “groups of strains that recombine with one another but
not with strains from other such groups.” The recognition of historic events of genetic
recombination was built into this definition because it had become feasible to reconstruct
phylogenetic relationships according to molecular sequence data, which presumably can be
used to delineate groups according to the genetic exchange criterion (Fraser, 2007). However,
this approach is also questionable on the basis of several observations that many bacteria are
capable of exchanging and recombining genes both within and between the groups currently
nominated as species, genera, or even domains (Xu, 2004; Gogarten & Townsend, 2005). The
exchange and recombination gene among prokaryotes is not hindered by reproductive barriers,
as it was cited by biological species concept (Doolittle & Papke, 2006).
An ecotype is defined as a bacterial population occupying the same ecological niche and
its divergence is purged recurrently by natural selection. Cohan proposed a species concept as
"A species in the bacterial world maybe understood as an evolutionary lineage bound by
ecotype-periodic selection." Most named bacterial species may contain many bacterial
ecotypes, the bacterial ecotype is equal to the eukaryotic species, and the prokaryotic species
are consistent with eukaryotic genus (Cohan, 2001; 2002). Ward (1998) also proposes a
"natural species concept" for prokaryotes based on the ecotype concept.
Chapter 2: introduction
9
Bacterial strains showing high DNA-DNA hybridization values (approximately 70% or
greater DNA-DNA relatedness, and 5 °C or less ∆Tm, both values must be considered) are
regarded to belong to the same species based on the "genomic species concept" (Wayne et al.,
1987). A further concept is the “phylogenetic species concept”, various types of genetic data
like 16S rRNA, DNA-DNA hybridization, average nucleotide identity (ANI) and the core
genes or housekeeping genes are used to reconstruct phylogenies and to thereby recognize
species (Rossello-Mora & Amann, 2001; Stackebrandt, 2006; Nesbo et al., 2006). While
different genes are used for phylogenetic analysis, the classification (clades) of the same
group of organism may change, as each gene tree reflects the phylogeny only of the specific
gene. To avoid this, it is recommended to use as the final result the multiplicity of
phylogenetic trees (Doolittle & Bapteste, 2007; Franklin, 2007). There is another species
concept called “phylophenetic species concept” which anchors the genomic species concept
within an ecological and evolutionary framework (Rossello-Mora & Amann, 2001). Species
are defined as “a monophyletic and genomically coherent cluster of individual organisms that
shows a high degree of overall similarity in many independent characteristics, and is
diagnosable by a discriminative phenotypic property.” This definition integrates
character-based concepts that emphasize the presence of an apparent organism attribute with
history-based concepts that emphasize the degree of relatedness of a new isolate to previously
characterized organisms. The phylophenetic species concept was extended by
Sicheritz-Ponten and Andersson, they developed a “phylogenomic” way to illustrate microbial
evolution, and they linked the phylogenetic information with the flow of biochemical
pathways within and among species (Ogunseitan, 2002; Sicheritz-Ponten & Andersson,
2001).
Stackebrandt suggested a rather nominalistic microbial species concept, by stating that
“The nonexistence of species as an objective category […] has been recognized by
microbiologists for over 20 years. Bacteriologists in particular follow guidelines and
recommendations to provide stability, reproducibility, and coherence in taxonomy—although
in the final analysis, species description is still subjective”. Nomenspecies are defined on the
basis of the characters of the type specimen; typological species, this is the most widely
Chapter 2: introduction
10
accepted and operational species concept (Stackebrandt et al., 2006; Hanage et al., 2005).
There are around 22 different concepts for defining the species at present, different
species concepts highlight different properties of species, such as phenotype, reproductive
isolation, phylogenetic relations, ecological role and so on (Pigliucci & Kaplan, 2006).
There is no clearly and universally accepted prokaryotic species concept until today, no
concept which can bear the heavy load of all the meanings and all the theoretical implications
can be generated. Different scientists interested in different lineages will choose the one
which is suitable to their research. But the lack of agreement on the species concept has led to
some problems such as that a single species can be identified as different species by using
different criteria.
For practice, a species definition is recommended by the ad hoc committee for the
re-evaluation of the species definition in bacteriology: Prokaryotes within a species should
have sequence similarities of 16S rRNA gene higher than 97.0% (or 98.7%). If the 16S rRNA
sequence similarity between two different bacterial strains is higher than 97% then
DNA-DNA hybridization or comparable methods (e.g. genome to genome sequence
comparison and average nucleotide identity (ANI) of the genome) should be applied in order
to test if they belong to the same or to two different species (Stackebrandt et al., 2002, 2006,
Auch et al., 2010; Richter and Rossello-Mora, 2009).
Genomic similarity determined by DNA-DNA hybridization was formerly considered as
‘gold standard’ method to determine the relatedness between bacterial species. But this
technique is very time consuming and cumbersome to perform; variation between
experiments, techniques and laboratories makes it difficult. Whole genome sequence could
solve all these problems but its cost are still high and also time consuming. As reported, the
number of genes included in the core genome which contains the genes presented in all strains
of the targeted species, appears to decrease as more genomes of strains are compared, whereas
the relative size of the flexible gene pool increases (Konstantinidis & Tiedje, 2005; Goris et
al., 2007; Kuhnert et al., 2009). So, to find the taxonomic and phylogenetic relationship of
bacteria, only the comparison of the core genome appears to be suitable. The question is
which genes should be used for defining the genome similarity. For this, using sequences of
Chapter 2: introduction
11
multiple protein-coding genes for genotypic characterization of diverse groups of prokaryotes
has been proposed (Gevers et al., 2005). Multilocus sequenc typing (MLST) is a molecular
tool for epidemiological purposes and aims at the identification of allelic mismatches at the
loci of closely related organisms (Urwin & Maiden, 2003). The main advantage is to provide
unambiguous sequence data, which is the availability and comparability from any laboratory,
avoiding the problems of lack of comparability like using DNA-DNA data. To establish
MLST, a set of housekeeping genes will be determined which have a higher level of sequence
divergence than rRNA genes to provide the resolution to distinguish closely related bacteria
lineages, but which are also conserved enough to retain genetic information. Also, these genes
should be distributed across all members of the target groups and also be present as a single
copy only within the given genome (Martens et al, 2007; Gevers et al., 2005; Thompson et al.,
2005). Expectations are that these analyses will have a positive impact on performing
taxonomic and biodiversity studies (Thompson & Swings, 2006). In MLSA, phylogenetic
analysis is based on the sequence similarity. The divergence level of the sequence influenced
by mutation or recombination which is ignored by MLST is taken into account in MLSA. So
MLSA is most suitable for species separation, but first the cut-off values for the similarities
values used to separation should be set (Gevers et al., 2005). Based on the former MLSA of
family Pasteurellaceae, they proposed that sequence comparison of the three genes recN,
rpoA and thdF could replace DNA–DNA hybridizations (Zeigler, 2003; Kuhnert & Korczak,
2006). By using conserved primers for PCR and sequencing, they deduced the genome
similarity of the family Pasteurellaceae based on the sequence of these three genes. They
suggested that strains with the deduced genome similarity value below 40% are belonging to
the different genera, and the strains with similarity above 85% linked to the same species. The
MLSA analysis results are in good agreement with past results for DNA–DNA hybridizations.
This strategy was shown to be a valuable taxonomic alternative to DNA–DNA hybridization
(Mutters et al., 1989; Christensen et al., 2005 & 2007; Kuhnert et al., 2007; Bisgaard et al.,
2007). From the MLSA analysis of genus Haeamophilus, four genes were used for MLSA
comparison, the results also supported the DNA–DNA hybridization results
(Norskov-Lauristen et al., 2005). For different taxa, the selected housekeeping genes were
Chapter 2: introduction
12
different, this value might be different.
Population genetics of prokaryotes
Population genetics is the study of evolutionary change in the genetic composition of
populations, so it focused on the mechanisms of mutation, natural selection, recombination,
migration and genetic drift that influence the evolutionary rate of change in the populations
and also the amount and nature, distribution over space and time, and the biological
significance of these changes (Whittam, 1995). The outcomes of such investigations will
illustrate the population genetic structure, knowledge of the nature of allelic variation and the
role of different modes of recombination in generating genotypic variation.
To understand genetic variation of populations, a wide range of phenomena must be
taken into account. There are three aspects to population genetics: the description of variation
within populations, an assessment of the processes that cause this variation (which may
involve both field and laboratory studies), and a body of theory that connects the cause of
variation with the effect of the variation. So that means we must know the processes that
generate new genotypes, which are mutation, rearrangements within genomes, and the
passage of genes from one individual to another; the processes that determine the fate of
genotypes: selection, migration between populations, and the laws of chance (i.e., genetic
drift). After we have sufficient informations on all these processes of particular populations,
the pattern of genetic variation can be detected by the level of genetic polymorphism, linkage
disequilibrium, spatial heterogeneity, temporal changes, and other indices from the sequence
analysis. Conversely, the observed pattern of variation can inform us about the processes that
generated it.
The most likely starting point for a population genetic event is a mutation. The progeny
of a prokaryotic cell should in principle be genetically identical to its ancestor, but mutations
and HGT tend to abolish this identity over time. Mutations increase the genetic diversity
between individuals. Point mutations accumulate with a nearly constant rate at random
positions in the sequences and we can analyze them by sequence comparison until a certain
level of divergence (Hartl & Clark, 2007).
Chapter 2: introduction
13
HGT is a process in which genetic material is transfered from one organism to the others
which are not their offspring organisms. HGT is a highly significant phenomenon amongst
prokaryotic cells, and it maybe the dominant form of genetic transfer among the single-celled
organisms. HGT between prokaryotes can take place by transformation, transduction and
conjugation and usually occurs as an asymmetrical exchange events between partners.
Transformation is the uptake of exogenous genetic material from its surrounding
environment and its heritable incorporation into the genome (Lorenz and Wackenmagel,
1994). In bacteria, DNA is taken up as a double strand across the outer and as a linear single
stranded across the inner membrane, also, uptake signal sequence have been found to favor
uptake (Maughan et al., 2010). Transduction is the process by which DNA is transferred from
one bacterium to another by transducing bacteriophages. There is high variability in the
ability of bacteriophages to cross-react with strains within the same species, between different
species of the same genus and between different genera of the same family (Fink et al., 2001).
Bacterial conjugation is the transfer of genetic material between bacterial cells by direct
cell-to-cell contact or by a bridge-like connection between two cells. It occurs between donor
cells which have an F-plasmid (F+) and recipient cells that lack it (F-). The F+ initiate the
conjugation via the F pilus, then the genetic materials can be transferred from F+ to F- cells
(Griffiths et al., 2000).
The prevalence of HGT among prokaryotes may be explained by their often single-celled
lifestyle (Lan & Reeves 2000), as a newly transferred gene sometime can give the whole
organism immediate benefit like adaptive superiority, sometimes even in the absence of
sophisticated regulation. In eukaryotes, recombination refers to the results of crossing over in
a symmetrical way between chromosomes during the zygotene stage of meiosis. This happens
between members of the same species and even with members of the same population. The
change of the genes happens frequently and normally together with reproduction. But in
prokaryotes, the genetic exchange occurs less frequently than in eukaryotes as it is
independent from reproduction. As such, HGT in bacteria may occur between different
species, genera or even domains, hence it is not limited to the species level (Nelson et al.,
1999). In bacterial HGT, parts of the genome which range in size from a few kilobases in
Chapter 2: introduction
14
natural transformation to several tens of kilobases in phage-mediated transduction and,
potentially, hundreds of kilobases in conjugation can be transferred from one cell to another
cell (Lan & Reeves, 2000).
While the level of mutation rates is rather constant in bacteria (Drake et al., 1998; Lynch
& Conery, 2003), the frequency of homologous recombination varies strongly between clonal
and panmictic populations (Cohan & Perry, 2007; Vos & Didelot, 2008). The often large
effective size of bacterial populations favours a strong influence of selection over drift (Lynch
& Conery, 2003) whereas obligately host-associated bacteria such as endosymbionts or some
pathogens display population bottlenecks and higher levels of genetic drift (Herbeck et al.,
2003; Kuo et al., 2009). Depending on the relevance of these individual forces, the resulting
evolutionary patterns vary considerably between different bacteria (Cohan & Perry, 2007;
Gevers et al., 2005).
Methods to determine the bacterial population structure
To analyses the population structure, different methods like serotyping, monoclonal
antibody typing, biotyping, bacteriophage typing, cell electrophoresis and whole protein
extract electrophoresis can be used. But to detect the population genetic structure, the
informations on the frequencies of alleles should be obtained. The unbiased method for
studying genetic variation that would be widely applied to a large number of genes in a
variety of organisms is the direct study of genes and their products. The electrophoretic
separation of protein, isozymes and nucleic acids are useful tools for differentiating taxa
(Ibrahim et al., 2003). This can be used for detecting a mutation which results in the
difference of the electrophoretic patterns of the genes or the different mobility of the protein it
encodes. The methods based on the electrophoresis are SDS-PAGE, MLEE, RFLP, RAPD,
DGGE, REP-PCR. SDS-PAGE and MLEE analyze the differences of the gene products, i.e,
the proteins. SDS-PAGE has been used extensively for identification and classification at the
strain and species level. MLEE can give us a variety of insights into the genetics, ecology and
taxonomy and identify clusters of closely related strains. RFLP, RAPD, REP-PCR and DGGE
detect the differences between strains on the level of the DNA itself. RFLP is highly sensitive
Chapter 2: introduction
15
and rapid in detecting mutations. RAPD detects the mutations randomly in the genome and
REP-PCR detects the distribution of repetitive elements. DGGE provides genetic diversity
and richness of the diversity in the microbial populations. The major problem of these
methods is that the results obtained in different laboratories are difficult to compare or limited
by targeting only at special sites (Danger et al., 2010; Selander et al., 1986; Pourzand &
Cerutti, 1993; Williams et al., 1990; de Bruijn et al., 1996). MLMT is a method targeting
microsatellite regions and using the sequence of them to detect the population and genetic
characteristics of different species (Ochsenreither et al., 2006; Meece et al., 2011). All the
above methods are trying to achieve the high levels of discrimination and giving the maximal
variation within the bacterial population, and then the population genetic structure can be
found more clearly and convincible.
MLST / MLSA As the sequence technology developed very fast and became cheap and easy
to apply, MLEE has been adapted by identifying alleles directly from the nucleotide
sequences of the internal fragments of housekeeping genes rather than comparing the
electrophoretic mobilities of the enzyme they encoded. Multilocus sequence typing (MLST)
determine the sequence of a set of housekeeping genes (normally approximate 400-500 bp of
their internal fragment), then different sequences of the same gene are assigned as alleles.
Each strain used in the analysis will get an allele profile which is also called sequence type
(ST). In MLST, the number of nucleotide differences between alleles is ignored and
sequences are given different allele numbers without taking into account whether the
difference between two sequences is at a single nucleotide site only or at many sites, e.g., as a
result of multiple mutations or even recombination events. So, the number of nucleotide
polymorphisms between alleles affected by recombination events is normally higher than by
alleles affected only by point mutations. Multilocus sequence analysis (MLSA) compares the
primary DNA sequences from multiple conserved protein-coding loci for assessing the
diversity and relationship of different isolates across related taxa, thereby using an appropriate
phylogenetic or cladistic approach to illustrate the population genetic structure (Naser et al.,
2005). The sequences of multiple (often seven) loci from many hundreds of isolates of a
bacterial species, provide data that can be used to address the population genetic structure and
Chapter 2: introduction
16
evolutionary biology of the species (Feil et al., 2001; 2003). The distribution of alleles
investigated by MLST can be used to predict if the population structure is clonal or non-clonal
(panmictic). MLST is usually applied to strains that belong to a well-defined species while
MLSA is more often used when species boundaries are not well known and MLSA data are
used to improve species description (Young et al., 2008). MLSA has been widely used in
studies of several bacterial populations, such as Lactobacillus genera (Naser et al., 2006),
Borrelia spp. (Richter et al., 2006), Mycobacteria (Mignard & Flandrois, 2008), Pseudomonads
(Young & Park, 2007), Burkholderia (Gevers et al., 2005), Bradyrhizobium (de las Rivas et al.,
2009), Haemophilus (Norskov-Lauritsen et al., 2005), Ensifer (Martens et al., 2007; Martens et al.,
2008) and Vibrionaceae (Goarant et al., 2006; Urbanczyk et al., 2007; Thompson et al., 2008;
Thompson et al., 2005).
Most of the population structures have been analyzed for pathogens. From the dataset
of MLST and MLSA analysis, most of the online dataset
(http://www.mlst.net/databases/default.asp, http://pubmlst.org/) are pathogens (Achtman,
2008; Maiden, 2006; Kilian et al., 2008; Nuebel et al., 2010; Keymer & Boehm, 2011). But
pathogenic bacteria represent only a minority of the total bacterial diversity. The evolution
mechanism of pathogenic bacterial are governed by the particular dispersal of their hosts and
immune selection pressures, which are distinctly different from those mechanism experienced
by the majority of bacteria occurring in the environment (Lange & Ferguson, 2009; Grenfell
et al., 2004). So, more attention should be drawn to the environmental prokaryotes (soil,
sediment, lake Water, marine). The often low cultivation success of the majority of
environmentally dominant bacteria has impeded the analysis of population structure of natural
bacterial populations. As a result, only few studies focussed on environmental and free-living
prokaryotes (Doroghazi & Buckley, 2010; Sikorski & Nevo, 2007; Vergin et al., 2007; Hunt et
al., 2008; Sikorski et al., 2008a; Connor et al., 2010; Melendrez et al., 2011).
The planktonic environment is especially well suited to investigate the evolutionary
basis of diversity in environmentally significant bacteria. The major environments are the
marine and freshwater environments. An aquatic environment is a small self-sustaining
ecosystem. The abundance and distribution of the plankton is dependent on the nutrients, light
Chapter 2: introduction
17
and temperature. Bacterioplankton is important for the nutrient cycles (nitrogen and
phosphorus). The composition of freshwater bacteria appears to be different from the marine.
The natural freshwater lakes harbor a considerably lower diversity of bacteria, there is a set of
"typical fresh water bacterioplankton" that were found to be globaly distributed.
Proteobacteria, Actinobacteria, Bacteroidetes, Cyanobacteria, Verrucomicrobia and
Planctomycetes are the predominant component of the typical freshwater bacterial community.
The abundance of microbial cells in the freshwater Puma Yumco was determined as 1.59 ×
105 to 3.37 × 10⁵ cells mL− 1 (Logue et al., 2008; Liu et al., 2009). Planktonic cells were
expected to be subject to lower rates of lateral gene transfer than occur in denser bacterial
communities such as biofilms. This facilitated the study of the genetic variability of bacterial
ecotypes as it is comparatively homogeneous and has a lower bacterial diversity compared to
other environments, yet still offers numerous niches for closely related strains to coexist
(Jaspers and Overmann 2004; Acinas et al. 2004). In particular, there are only few studies on
the freshwater bacterial population genetics available. The oligotrophic alpine Walchensee
and mesotrophic Starnberger See are located in southern Germany, both were selected for the
present study since a larger dataset on environmental parameters and several isolates are
already available from our previous investigations (Bruns et al., 2003; Gich et al., 2005). The
family of Sphingomonadaceae (Kosako et al., 2000; Lee et al., 2005) within the
Alphaproteobacteria exist in different environments and are abundant in freshwater
environments. Sphingomonadaceae can account for up to 22% of the cells in bacterioplankton
communities (Gloeckner et al., 2000; Zwart et al., 2002) and include physiologically diverse
bacteria such as aromatic-compounds degrading strains and aerobic anoxygenic phototrophs
(Kim et al., 2007). Therefore, the family Sphingomonadaceae has been chosen as the target
group of the current study. Closely related ribotypes of this typical freshwater
Alphaproteobacteria co-occur and many can be retrieved by cultivation (Gich & Overmann,
2006; Jaspers & Overmann, 2004). The studies of Alphaproteobacteria by Gich et al.
suggested that there were genetically and physiologically different strains of the same 16S
rRNA phylotype existing in the same oligotrophic alpine lake (Gich et al., 2005).
In the present study, the population structure of Sphingomonadaceae in two lakes of
Chapter 2: introduction
18
different trophic state was elucidated based on a high-resolution multilocus sequence analysis
of nine housekeeping genes. 95 Sphingomonadaceae strains were isolated, and some strains
could not be distinguished by 16S rRNA gene. Amongst them, a set of 52 strains was found to
have identical 16S rRNA gene sequences. However, some of these strains differed by their
growth rates, cell colors and shapes, and by their 23S rRNA gene and ITS1 sequences,
indicating some level of divergence despite identical 16S gene sequences. In order to study
the internal diversity structure amongst these strains, including potential taxonomic
implications at the level of speciation processes, MLSA was chosen as method of analysis for
this purpose. The genes atpD (F0F1 ATP synthase, beta subunit), dnaK (bacterial homolog of
70kD heat-shock protein), fusA/tufA (elongation factors G/Tu), gap
(glyceraldehyde-3-phosphate dehydrogenase), groEL (bacterial homolog of 60kD heat- shock
protein), gyrB (DNA gyrase, B subunit), recA (recombinase A), and rpoB (DNA-directed
RNA polymerase, beta subunit) were chosen for the analysis. These housekeeping genes have
been found suitable for the analysis of other Alphaproteobacteria (van Berkum et al., 2006;
Vinuesa et al., 2008). The MLSA results were combined with phenotypic, physiological
characteristics for new species description.
Aims of the present study
The goal of the project is to elucidate the role of mutation, recombination, genetic drift
and selection (such as selective sweeps) in shaping bacterial diversity. Here, bacteria from the
family Sphingomonadaceae of the Alphaproteobacteria are used as model groups. Compared
to soil and sediment, the planktonic environment is suitable for the investigation of the
bacterial evolution and diversity, because it is comparatively homogeneous and has a lower
bacterial diversity, but it still offers numerous niches for closely related strains to coexist
(Jaspers & Overmann 2004; Acinas et al. 2004). Molecular analyses of natural population
structrue and isolated strains in combination with ecophysiological tests in the laboratory
were used to the elucidate factors governing bacterial evolution and diversification in the
model groups.
The population structure and the significance of different evolutionary events was
Chapter 2: introduction
19
analyzed based on the multilocus sequence analysis of a set of housekeeping genes using a
collection of isolates of Sphingomonadaceae. Together with the results of a physiological
characterization of the strains, this approach should allow to identify the role of adaptation
and selection in the origin and divergence of closely related bacterial lineages. From the result
of the analysis, the population structure concept potentially could be extended to the
taxonomic field of bacterial species delineation.
Several distinct lineages represent the subpopulations revealed by MLSA were analysed;
phenotypic and genotypic characteristics were identified and analysed. The combination of
MLSA with phenotypic and physiological characteristics will illustrate whether MLSA is
suitable and powerful for performing species taxonomic and biodiversity studies leading to
new species description. Driving forces and the process of the speciation will also be under
discussion.
Chapter 3: material and methods
20
Chapter 3
Material and Methods
Sampling site and targeted isolation of bacterial strains
The oligotrophic alpine Walchensee (802 m above sea level; maximum water depth of 190
m) is located in southern Germany and was sampled at a distance of 30 m from the western
shore (47°35′N, 11°20′E). Mesotrophic Starnberger See (584 m above sea level; maximum
water depth 128 m) is situated 23 km north of Walchensee and was sampled from a pier located
on the eastern shore near Ammerland (47°54′11N, 11°19′54E). Water samples were collected
on December 20, 2007, at a water depth of 1 m using a bilge pump connected to isoversinic
tubing as previously described (Overmann et al., 1998). For cultivation, basic synthetic
freshwater medium buffered with 10 mM HEPES (Bartscht et al., 1999) was supplemented
with 20 amino acids, glucose, pyruvate, citrate, 2-oxoglutarate, succinate (200 µM each),
Tween 80 (0.001% v/v), a mixture of formate, acetate and propionate (200 µM each), trace
element solution SL 10 and 10-vitamin solution (Jaspers et al., 2001). Signal molecules (cAMP,
N-butyryl homoserine lactone, N-oxohexanoyl-DL-homoserine lactone, ATP) were added at
final concentrations of 10 µM each for growth stimulation (Bruns et al., 2002). Growth
medium (200 µl) was dispensed into the wells of sterile 96-well round bottom microtiter plates
and each well inoculated with aliquots of lake water containing 50 cells. After incubated for 6
weeks at 15°C, bacterial cell growth was monitored by turbidity. Positive cultures were
screened for the presence of Sphingomonadaceae using a specific PCR protocol employing
novel primer Sphingo866f (5'-CGCATTAAGTTATCCGCC-3') and primer Alf968r
(5'-GGTAAGGTTCTGCGCGTT-3') (Neef, 1997). 36-46% of the cultures obtained from both
lakes were identified as Sphingomonadaceae and were subcultivated on agar plates prepared
with washed agar, basic synthetic freshwater medium and 1:10 diluted HD (0.05% casein
peptone, 0.01% glucose, 0.025% yeast extract, w/v). Of the 95 strains recovered, 52 strains
originated from Walchensee and 43 from Starnberger See.
Chapter 3: material and methods
21
Sequencing and phylogeny of 16S rRNA genes
16S rRNA genes were amplified with primers Alf19F (5'-CTGGCTCAGARCGAACG-3')
(Manz et al., 1992) and 1492R (5'-GGTTACCTTGTTACGACTT-3') (Lane, 1991). PCR
products were purified with the QIAquick PCR purification kit (Qiagen) and sequenced by the
dideoxynucleotid method on an ABI Prism 3730 genetic analyzer (Applied Biosystems),
employing the AmpliTaq FS Big Dye terminator cycle sequencing kit. Small nucleotide
differences were confirmed by repeating the PCR reactions and sequencing. Sequences were
edited and assembled with the Vector NTI computer package (Invitrogen). Phylogenetic
analysis of 16S rRNA gene sequences was performed with the ARB software package (Ludwig
et al., 2004). Sequences were automatically aligned with the integrated Fast Aligner tool, and
the alignment corrected manually according to secondary-structure information. The resulting
alignment spanned 1231 bp. Phylogenetic trees were constructed based on the Maximum
Likelihood, Neighbor Joining and Maximum Parsimony algorithms. Bootstrap values were
calculated with 1,000 bootstrap resamplings. 16S rRNA gene sequences of the closest relatives
were identified by the NCBI BLAST online tool (http://blast.ncbi.nlm.nih.gov) and
classification was verified by the RDP classifier.
Multilocus sequence analysis (MLSA)
Sequencing of nine housekeeping genes. AtpD (F0F1 ATP synthase, beta subunit), dnaK
(bacterial homolog of 70kD heat-shock protein), fusA/tufA (elongation factors G/Tu), gap
(glyceraldehyde-3-phosphate dehydrogenase), groEL (bacterial homolog of 60kD heat- shock
protein), gyrB (DNA gyrase, B subunit), recA (recombinase A), and rpoB (DNA-directed RNA
polymerase, beta subunit) were chosen for MLSA. These housekeeping genes have been found
suitable for the analysis of other Alphaproteobacteria (van Berkum et al., 2006; Vinuesa et al.,
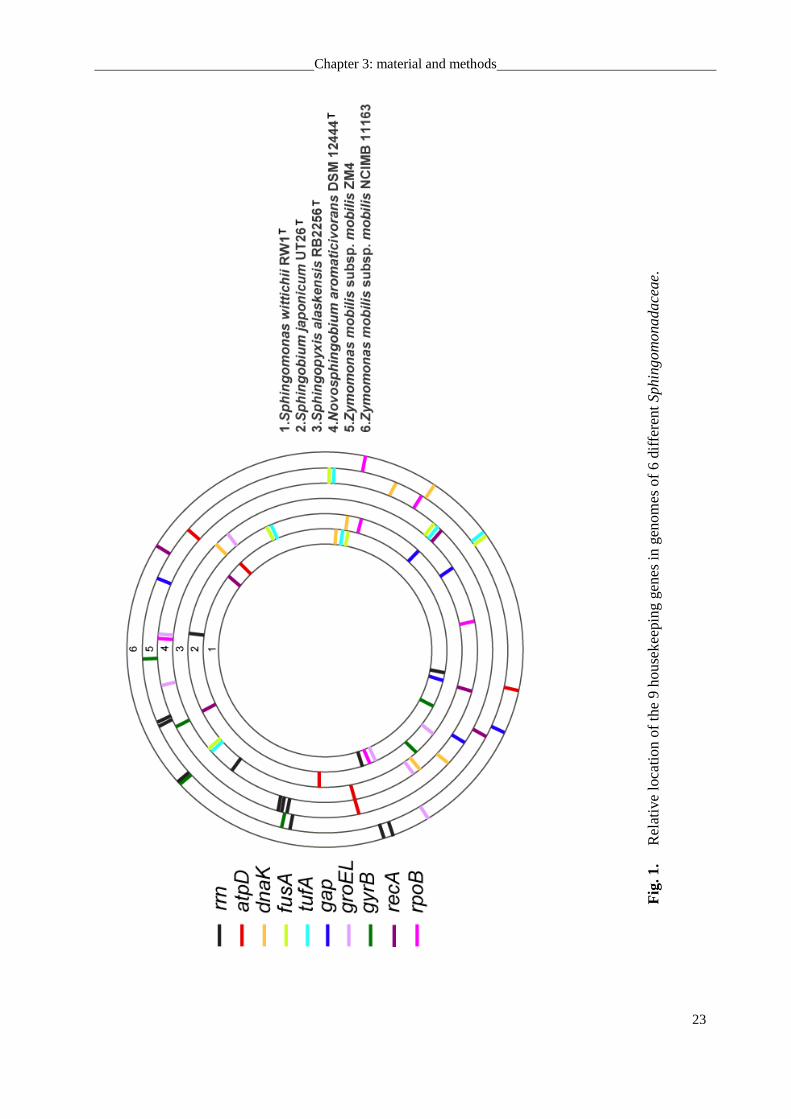
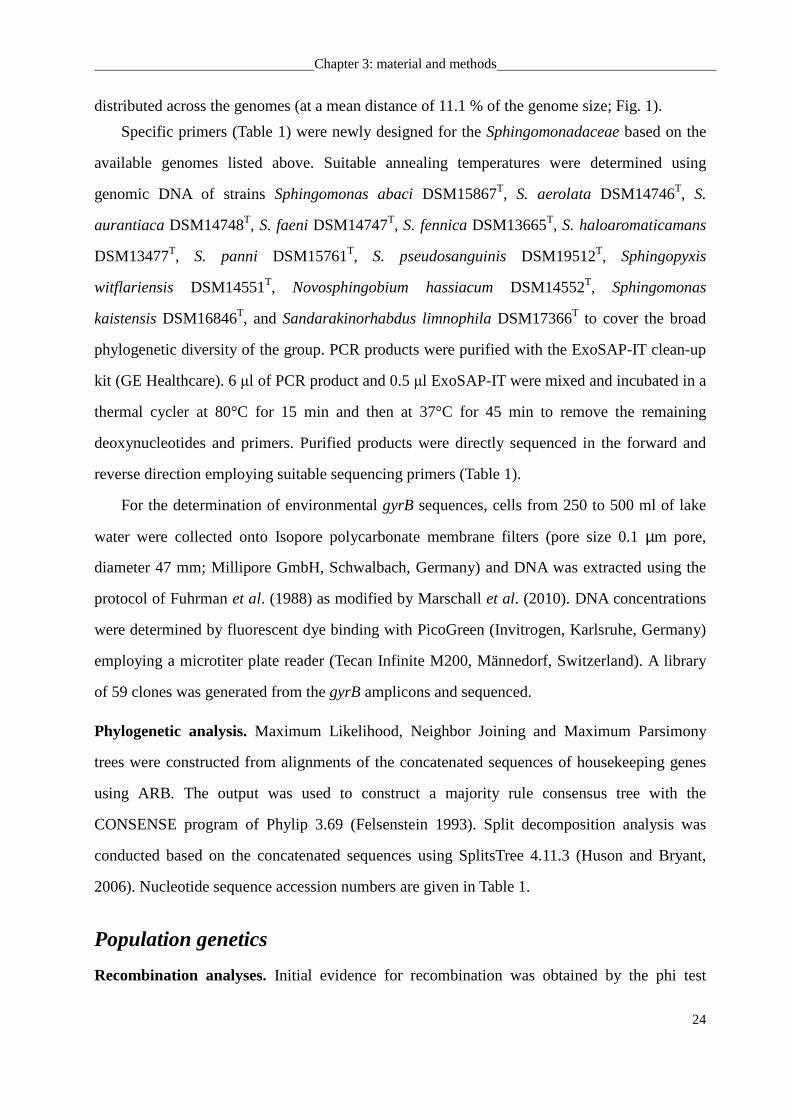
2008). In the genomes of Sphingopyxis alaskensis RB2256T (DSM 13593T), Sphingomonas
wittichii RW1T (DSM 6014T), Sphingobium japonicum UT26T, Novosphingobium
aromaticivorans DSM 12444T, Zymomonas mobilis subsp. mobilis ZM4, and Zymomonas
mobilis subsp. mobilis NCIMB 11163, the nine genes occur only in a single copy (with the
exception of groEL in DSM 12444T). Except fusA/tufA, most of the genes are rather evenly
Chapter 3: material and methods
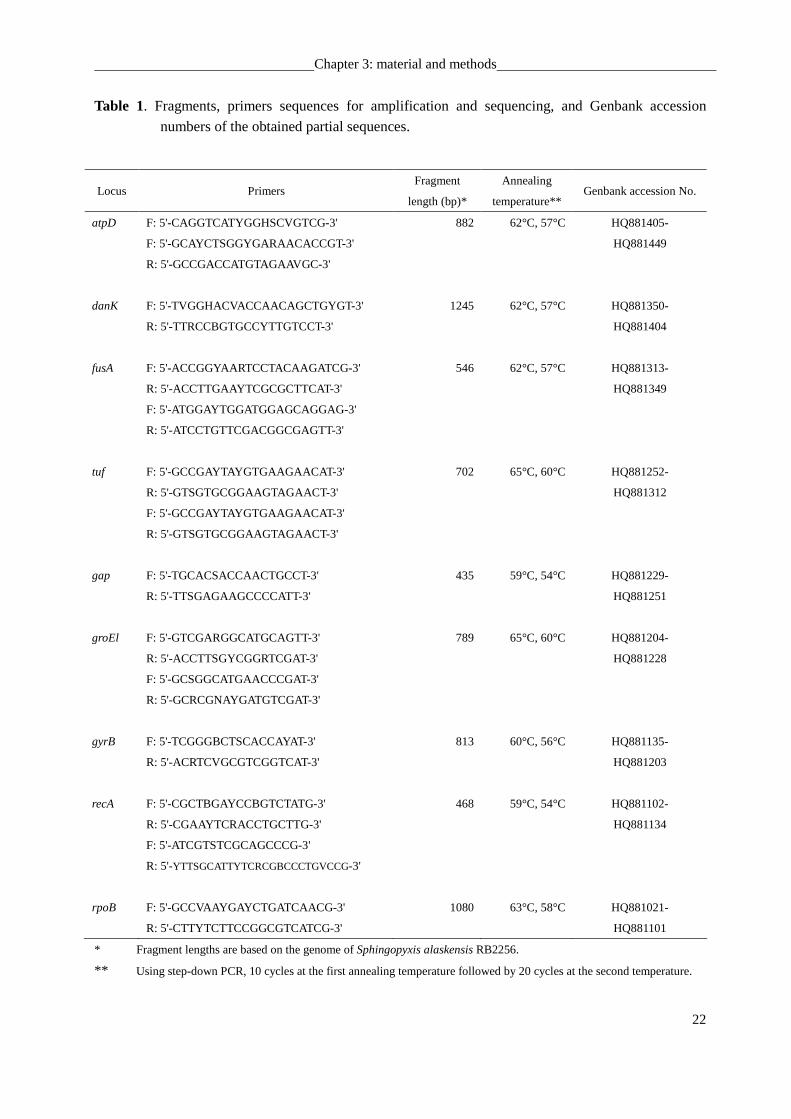
22
Table 1. Fragments, primers sequences for amplification and sequencing, and Genbank accession
numbers of the obtained partial sequences.
* Fragment lengths are based on the genome of Sphingopyxis alaskensis RB2256.
** Using step-down PCR, 10 cycles at the first annealing temperature followed by 20 cycles at the second temperature.
Locus Primers Fragment
length (bp)*
Annealing
temperature** Genbank accession No.
atpD F: 5'-CAGGTCATYGGHSCVGTCG-3' 882 62°C, 57°C HQ881405-
F: 5'-GCAYCTSGGYGARAACACCGT-3' HQ881449
R: 5'-GCCGACCATGTAGAAVGC-3'
danK F: 5'-TVGGHACVACCAACAGCTGYGT-3' 1245 62°C, 57°C HQ881350-
R: 5'-TTRCCBGTGCCYTTGTCCT-3' HQ881404
fusA F: 5'-ACCGGYAARTCCTACAAGATCG-3' 546 62°C, 57°C HQ881313-
R: 5'-ACCTTGAAYTCGCGCTTCAT-3' HQ881349
F: 5'-ATGGAYTGGATGGAGCAGGAG-3'
R: 5'-ATCCTGTTCGACGGCGAGTT-3'
tuf F: 5'-GCCGAYTAYGTGAAGAACAT-3' 702 65°C, 60°C HQ881252-
R: 5'-GTSGTGCGGAAGTAGAACT-3' HQ881312
F: 5'-GCCGAYTAYGTGAAGAACAT-3'
R: 5'-GTSGTGCGGAAGTAGAACT-3'
gap F: 5'-TGCACSACCAACTGCCT-3' 435 59°C, 54°C HQ881229-
R: 5'-TTSGAGAAGCCCCATT-3' HQ881251
groEl F: 5'-GTCGARGGCATGCAGTT-3' 789 65°C, 60°C
HQ881204-
R: 5'-ACCTTSGYCGGRTCGAT-3' HQ881228
F: 5'-GCSGGCATGAACCCGAT-3'
R: 5'-GCRCGNAYGATGTCGAT-3'
gyrB F: 5'-TCGGGBCTSCACCAYAT-3' 813 60°C, 56°C HQ881135-
R: 5'-ACRTCVGCGTCGGTCAT-3' HQ881203
recA F: 5'-CGCTBGAYCCBGTCTATG-3' 468 59°C, 54°C HQ881102-
R: 5'-CGAAYTCRACCTGCTTG-3' HQ881134
F: 5'-ATCGTSTCGCAGCCCG-3'
R: 5'-YTTSGCATTYTCRCGBCCCTGVCCG-3'
rpoB F: 5'-GCCVAAYGAYCTGATCAACG-3' 1080 63°C, 58°C HQ881021-
R: 5'-CTTYTCTTCCGGCGTCATCG-3' HQ881101
Chapter 3: material and methods
23
Fig
. 1.
Re
lativ
e lo
catio
n of
the
9 h
ouse
kee
ping
ge
nes
in g
enom
es
of 6
diff
ere
nt
Sp
hing
om
on
ad
ace
ae.
Chapter 3: material and methods
24
distributed across the genomes (at a mean distance of 11.1 % of the genome size; Fig. 1).
Specific primers (Table 1) were newly designed for the Sphingomonadaceae based on the
available genomes listed above. Suitable annealing temperatures were determined using
genomic DNA of strains Sphingomonas abaci DSM15867T, S. aerolata DSM14746T, S.
aurantiaca DSM14748T, S. faeni DSM14747T, S. fennica DSM13665T, S. haloaromaticamans
DSM13477T, S. panni DSM15761T, S. pseudosanguinis DSM19512T, Sphingopyxis
witflariensis DSM14551T, Novosphingobium hassiacum DSM14552T, Sphingomonas
kaistensis DSM16846T, and Sandarakinorhabdus limnophila DSM17366T to cover the broad
phylogenetic diversity of the group. PCR products were purified with the ExoSAP-IT clean-up
kit (GE Healthcare). 6 µl of PCR product and 0.5 µl ExoSAP-IT were mixed and incubated in a
thermal cycler at 80°C for 15 min and then at 37°C for 45 min to remove the remaining
deoxynucleotides and primers. Purified products were directly sequenced in the forward and
reverse direction employing suitable sequencing primers (Table 1).
For the determination of environmental gyrB sequences, cells from 250 to 500 ml of lake
water were collected onto Isopore polycarbonate membrane filters (pore size 0.1 µm pore,
diameter 47 mm; Millipore GmbH, Schwalbach, Germany) and DNA was extracted using the
protocol of Fuhrman et al. (1988) as modified by Marschall et al. (2010). DNA concentrations
were determined by fluorescent dye binding with PicoGreen (Invitrogen, Karlsruhe, Germany)
employing a microtiter plate reader (Tecan Infinite M200, Männedorf, Switzerland). A library
of 59 clones was generated from the gyrB amplicons and sequenced.
Phylogenetic analysis. Maximum Likelihood, Neighbor Joining and Maximum Parsimony
trees were constructed from alignments of the concatenated sequences of housekeeping genes
using ARB. The output was used to construct a majority rule consensus tree with the
CONSENSE program of Phylip 3.69 (Felsenstein 1993). Split decomposition analysis was
conducted based on the concatenated sequences using SplitsTree 4.11.3 (Huson and Bryant,
2006). Nucleotide sequence accession numbers are given in Table 1.
Population genetics
Recombination analyses. Initial evidence for recombination was obtained by the phi test
Chapter 3: material and methods
25
(Bruen et al., 2006) as implemented in Splitstree (Huson and Bryant, 2006). Maximum
Likelihood trees were reconstructed from both the concatenated and the individual gene
sequences using PhyML (version 3.0) (Guindon and Gascuel, 2003) with the general time
reversible (GTR) model of nucleotide substitution, a BioNJ tree as initial tree, and a discrete
gamma model with 4 categories and the gamma shape parameter estimated by PhyML. The
approximate likelihood-ratio test (aLRT) was used to estimate the reliability of branching
patterns in PhyML (Anisimova and Gascuel, 2006). The resulting trees were compared to
identify individual recombination events for each gene. Recombination breakpoints were
detected using seven non-parametric methods RDP, GENECONV, Bootscan, Maxchi,
Chimaera, SiScan, and 3Seq of the RDP 3.0 software package under default parameters, a
highest p value of 0.05, and Bonferroni correction for multiple comparisons (Martin et al.,
2010). The order of genes in the concatenated sequence was atpD (position 1-882), dnaK
(886-2118), fusA (2122-2667), tufA (2671-3372), gap (3376-3810), groEL (3814-4602), gyrB
(4606-5418), recA (5422-5889), and rpoB(5893-6972), with the genes separated from each
other by three N. To compare levels of recombination between the different housekeeping
genes, canonical correlation were calculated from their distance matrices using the Mantel-test
implemented in the R! package ade4 and 1,000 Monte-Carlo permutation (Chessel et al.,
2004).
The average number of nucleotide differences per site between two sequences π and the
proportion of segregating (polymorphic) sites S among all sites were calculated with DnaSP
(Librado and Rozas, 2009). The significance of recombination relative to mutation was
assessed using ClonalFrame (Didelot and Falush, 2007) based (i) on the ratio r/m of the
probability r for an individual nucleotide to be altered through recombination and the
probability m of point mutation, and (ii) on the ratio of the absolute population-scaled number
of events (ρ/θπ). In addition to ρ/θπ, the parameter r/m takes into account the average number of
nucleotide differences per site π and the average tract length of recombining sequences δ
(Jolley et al., 2005). 100,000 Monte Carlo Markov Chain steps were performed, discarding the
first half as burn-in. Another estimate of the ratio of absolute numbers of recombinations to
mutations, ρ/θS, was derived from the population-scaled recombination rate ρ and Watterson´s
Chapter 3: material and methods
26
estimator for the population mutation rate θS that were both estimated using the program
Pairwise of the LDhat package (McVean et al., 2002).
Linkage equilibrium was estimated on the level of alleles using LIAN 3.0 with a
nonparametric Monte Carlo procedure and 100,000 resamplings (Haubold and Hudson, 2000).
Neutrality tests. π and S were used to determine two different estimators of the population
mutation rate, θπ and θS that in turn served to determine Tajima´s D (Tajima, 1989a,b) value
with DnaSP. In addition, the McDonald-Kreitman (MK) test (McDonald and Kreitman, 1991)
was performed as implemented in DnaSP (Librado and Rozas, 2009).
Effective population size. The effective population size Ne is the number of individuals in an
ideal population that exhibits the same evolutionary and population genetic properties as the
real population under observation (Whitlock, 2006) and was calculated following Lynch and
Conery (2003). The average number of substitutions between silent sites (H) was determined
for the concatenated set of genes using DnaSP. The estimator η for the prokaryotic population
mutation rate Neµ was calculated according to
η = 1.5⋅ H
(3− 4 ⋅ H)
and then used to estimate Ne assuming a mutation rate µ of ~ 2.3·10-10 per base and per
generation (Drake et al., 1998; Lynch and Conery, 2003).
Ecotype simulation. The number of putative ecotypes (PE) was estimated using Ecotype
Simulation (ES) (Koeppel et al., 2008) that tests combinations of different values for mutation,
selection and drift in a coalescence simulation and using complete linkage clustering (Jain et al.,
1999; Martin, 2002). Ecotype demarcations were performed automatically using the
single-gene PhyML trees as input trees.
Phenotypic characterization
Strains were streaked on agar plates containing 1:10 diluted HD and incubated for 2-7
days to yield sufficient cell mass. The Gen III microplates (BiOLOG, Hayward, CA, USA)
were inoculated with cells resuspended in the inoculation fluid IF-A according to the
recommendations of the manufacturer, incubated in the dark at 28°C and read after 3-6 days
Chapter 3: material and methods
27
using the Omnilog-PM reader in the Single Read ID mode. After subtraction of the value of
negative control, raw data were analysed using the base installation of R! (www.r-project.org).
The distribution of the mean values from two repetitions for 94 phenotypic reactions from 48
strains (Fig. 8) suggested a reading of 100 to be an appropriate threshold value to distinguish
positive from negative (coded as 1 and 0, respectively) reactions. The resulting matrix was used
to generate a UPGMA tree with MEGA5.0 (Tamura et al., 2011) and evolutionary distances
were computed using the p-distance method. Variances of the readings for all strains and each
substrate were plotted as jittered values and as boxplots using ggplot2 (Wickham, 2009).
Physiological and chemotaxonomic characterization of new species
Cultivation and growth media For a systematic phenotypic comparison of the
environmental isolates with validly named reference strains of taxonomic value, the type
strains of species in the genera of Sphingomonas and Sphingobium, Caulobacter leidyi DSM
4733T, Sphingomonas paucimobilis DSM 1098T, Sphingomonas wittichii DSM 6014T,
Sphingomonas panni DSM 15761T, Sphingomonas echinoides DSM 1805T, Sphingomonas
alaskensis DSM 13593T, Sphingomonas aquatilis DSM 15581T, Sphingobium yanoikuyae
DSM 7462T, Sphingobium amiense DSM 16289T, Sphingobium scionense DSM 19371T,
Sphingobium vermicomposti DSM 21299T, Sphingobium japonicum DSM 16413T were chosen
from the DSMZ collection. Strains 247, 301T, 382T were isolated from mesotrophic prealpine
Lake Starnberger See, strain 469T was isolated from oligotrophic alpine Walchensee. All strains
mentioned above were routinely cultivated on DSM 830 medium (R2A agar) (containing
0.05% w/v yeast extract, 0.05% peptone, 0.05% Casamino acids, 0.05% glucose, 0.05% starch,
0.03% sodium pyruvate, 0.03% K2HPO4, 0.005% MgSO4, 1.5% agar; pH=7.2) (Reasoner &
Geldreich, 1985) at 28 °C.
Physiological analysis Growth was tested between pH values of 5 to 10 (at intervals of
1 pH). Temperature dependence of growth was assessed between 8 and 45°C (at intervals of
3°C) using temperature gradient incubator (Model TN-3, Sangyo). Cell morphology was
determined by phase-contrast microscopy using agar-coated slides (Pfennig & Wagener, 1986)
Chapter 3: material and methods
28
and transmission electron microscopy. Bacteria were fixed with 2% glutaraldehyde and 5%
formaldehyde in cacodylate buffer, treated with 1% aqueous osmium and then dehydrated with
a graded series of acetone on formvar-coated grids. For contrasting, 2% uranyl acetate in 70%
acetone was used. Samples were examined in a TEM910 transmission electron microscope
(Carl Zeiss, Oberkochen) at an acceleration voltage of 80 kV. Cell motility was evaluated using
light microscopy and soft agar (0.1% w/v yeast extract, 0.01% K2HPO4, 0.2% Agar).
The Gram-type was determined using the Bactident Amino peptidase kit and confirmed by
the KOH test. Catalase activity was determined by using 10% (v/v) H2O2 and oxidase activity
using N, N, N′, N′-tetramethyl-ρ-phenylenediamine. Physiological and biochemical
characteristics, and enzyme activities were determined by employing API 20NE, API ZYM,
API 50CH test strips (bioMérieux) and Biolog Gen III microplates (BiOLOG, Hayward, CA,
USA) according to the instructions of the manufacturer. Susceptibility to antibiotics was
determined on R2A agar plates using the discs diffusion method (NCCLS, 2007) (in µg per
disc): penicillin G (10), oxacillin (5), ampicillin (10), ticarcillin (75), cefalotin (30), mezlocillin
(30), cefazolin (30), cefotaxim (30), aztreonam (30), chloramphenicol (30), tetracyclin (30),
imipenem (10), gentamycin (10), amikacin (30), vancomycin (30), erythromycin (15),
lincomycin (15), ofloxacin (5), colistin (10), norfloxacin (10), pipemidic (20), bacitracin (10),
polymyxin B (300), nitrofurantoin (100), neomycin (30), kanamycin (30), doxycycin (30),
clindamycin (10), ceftriaxone (30), fosfomycin (50), nystatin (100), linezolid (10),
moxifloxacin (5), quinupristin/dalfopristin (15), piperacillin/tazobactam (40), and teicoplanin
(30).
Biomarker analysis Fatty acids, respiratory quinones, polar lipids, and polyamines
were extracted from cells grown on R2A medium. For fatty acid analysis, 40 mg wet weight of
fresh cells were harvested from the agar plates, and extracted according to the standard
protocol of the Microbial Identification system (Sasser, 1990). Respiratory quinones were
extracted from 200 mg freeze-dried cell material and analysed according to the method
described by Tindall and Collins (Tindall 1990a, b; Tindall, 2005; Collins, 1994). Respiratory
quinones were first separated by their structural classes (such as menaquinones, ubiquinones)
using thin later chromatography (TLC). The resulting bands were eluted and further separated

Chapter 3: material and methods
29
and identified by HPLC, using a RP18 column (Tindall, 1996). Polar lipids were extracted from
100 mg freeze-dried cell material, separated by two-dimensional chromatography and
identified by their RF values in combination with their reaction with specific staining reagents
(Tindall 1990a, b). Polyamines were extracted from 40 mg of freeze-dried cells and analyzed
using the method of Busse & Auling (1988). The detection was carried out on a Hypersil ODS
RP 18 column (25 by 4.6 cm, 5 µ particles) using a Beckman gradient liquid chromatograph
(model 332) equipped with a Waters model 420 EC fluorescence detector.
Genetic and phylogenetic analysis Genomic DNA extraction and 16S rRNA gene
sequencing were performed as described above. The primer used here were 8F
(5’-AGAGTTTGATCCTGGCTCAG-3’) and 1492R (5’-GGTTACCTTGTTACGACTT-3’)
(Lane, 1991). Additional 16S rRNA gene sequences of the type strains of all species of
Caulobacter, of all type species of relevant genera of the Sphingomonas, Sphingobium, and of
the type strains of all other dimorphic prosthecate alphaproteobacterial species (in the genera
Brevundimonas, Phenylobacterium, Asticcacaulis, Maricaulis) were retrieved from the
GenBank database (Altschul et al., 1997) and imported into the ARB program package
(Ludwig et al., 2004). Automated alignments of the Fast Aligner tool were corrected manually
according to secondary-structure information to yield an alignment of approx. 1500 bp.
Phylogenetic trees were constructed with the FastdnaML maximum likelihood algorithm as
implemented in the ARB software package. Sequence accession numbers are provided in Fig.
14,16. The mol% G+C content of DNA was determined as described by Mesbah et al. (1989).
For DNA-DNA hybridization, cells were disrupted by using a French pressure cell (Thermo
Spectronic) and the DNA in the crude lysate was purified by chromatography on
hydroxyapatite as described by Cashion et al. (1977). DNA-DNA hybridization (DDH) was
carried out as described by De Ley et al. (1970) under consideration of the modifications
described by Huss et al. (1983) using a model Cary 100 Bio UV/VIS-spectrophotometer
equipped with a Peltier-thermostatted 6*6 multicell changer and a temperature controller with
in-situ temperature probe (Varian).
Chapter 4: results
30
Chapter 4
Results
Population structure of freshwater Sphingomonadaceae in the two lakes
Of the 569 positive primary liquid cultures generated from Walchensee and Starnberger See
samples, 46 and 36%, respectively, were identified as Sphingomonadaceae using the specific
PCR screening protocol. From the Sphingomonadaceae enrichments, a total of 95 strains were
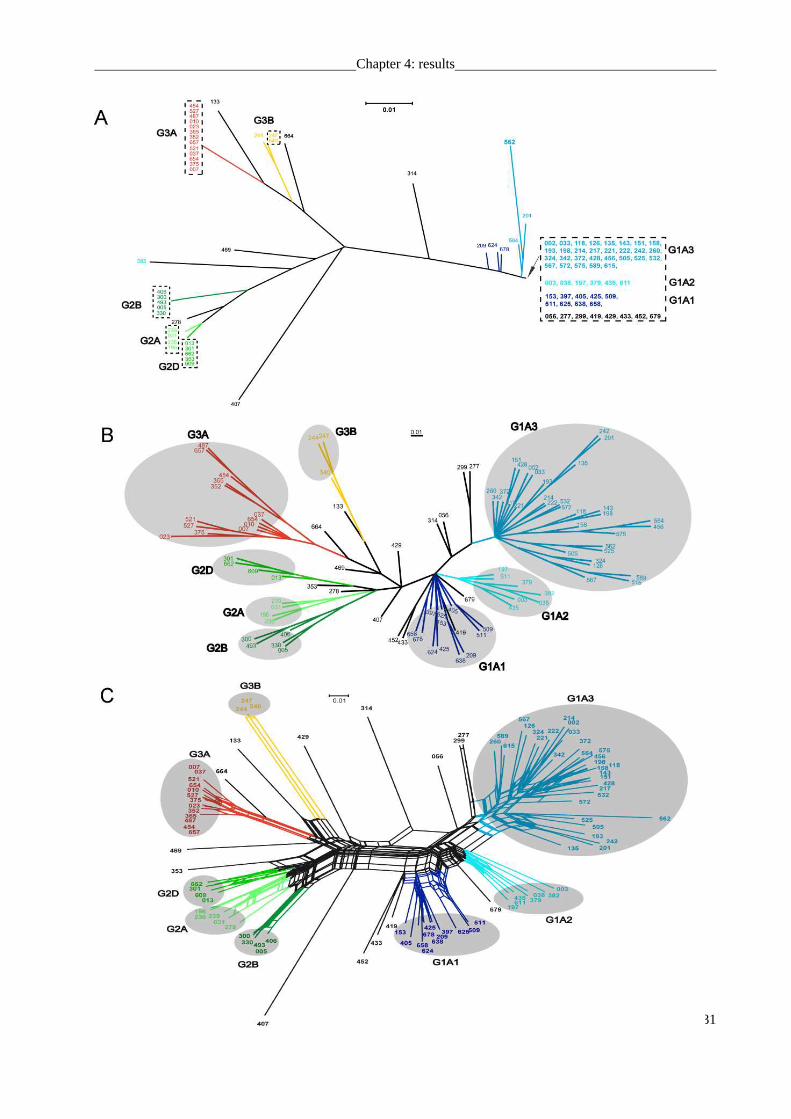
subsequently isolated in pure culture. Phylogenetic analysis revealed that 6 distinct phylotypes
(G1A, G2A, G2B, G2D, G3A, G3B) had been isolated multiple times (Fig. 2A, dashed boxes).
For each phylotype, multiple isolates were available. One phylotype (designated G1A) strongly
dominated the culture collection and was represented by 52 isolates. G1A also be the dominant
phylotype in the nature population by in situ analysis.
To assess the DNA polymorphisms, the population structure of Sphingomonadaceae was
elucidated based on the sequences of nine housekeeping genes. Compared to most previous
studies that typically employed ≤ 7 housekeeping genes (compare the PubMLST website at
http://pubmlst.org/ listing 74 MLST projects), we increased the number of loci in order to
improve the robustness of our analysis. Each of the 95 strains was found to represent a unique
haplotype, i.e., a unique combination of allelic states of genetic markers (Fig. 2B). Similarly, all
isolates were unique on the level of the deduced amino acid sequences. We determined high
levels of nucleotide diversity π of >0.1 and high proportions of polymorphic sequence sites of up
to 79% for the individual housekeeping genes (Table 2). Watterson´s estimator for the population
mutation rate θS ranged from 0.073 to 0.145 bp-1generation-1. Of the genes analyzed, gyrB
exhibited the by far highest sequence diversity whereas comparatively low nucleotide diversity
was detected for dnaK and groEL within the G1A cluster (Table 2). The pairwise divergence
values of concatenated sequences of the 52 identical phylotypes within the G1A cluster were 0.4
to 19.6 %. The genetic diversity values detected for G1A strain which sharing the same 16S gene
sequences were range from 0.016 (groEL) to 0.252 (gyrB). They are unusually high values
comparing to other studies.
The majority rule consensus tree for the concatenated housekeeping genes followed the
overall phylogenetic structure of the 16S rRNA gene tree, confirming the presence of
Chapter 4: results
31
Chapter 4: results
32
Fig. 2. Relatedness of 95 strains of Sphingomonadaceae from Walchensee and Starnberger See based on
16S rRNA gene sequences and concatenated sequences of nine housekeeping genes A. Unrooted
Maximum Likelihood reconstruction of the 16S rRNA gene sequence phylogeny. Strains with
identical 16S rRNA gene sequences are placed within dashed boxes. B. Majority rule consensus
tree calculated from Maximum Likelihood, Maximum Parsimony and Neighbor Joining
phylogenetic trees of the concatenated sequences of 9 housekeeping genes. C. Phylogenetic
network generated by SplitsTree based on the concatenated set of nine housekeeping genes.
Strains within the same grey area are inferred to be panmictic (see text). Bars denote 0.01 fixed
point mutations per nucleotide. Different colours code for different subclusters according to the
SplitsTree analysis (see C.).
phylogenetically distinct groups (Fig. 2B). There are numerous polytomies present in the
consensus tree, and the initial phi test for recombination which implemented in Splitstree
revealed statistically significant evidence for recombination for the entire dataset. A phylogenetic
network provides a better representation of the relationships between the 95 different
Sphingomonadaceae haplotypes (Fig. 2C). The split decomposition analysis revealed the
presence of eight distinct subclusters among the 95 strains. Most notably, three of the subclusters
fell into the same 16S rRNA phylotype G1A.
To address the potential influence of a selection bias during cultivation on the population
structure of Sphingomonadaceae, we tested for the presence and phylogenetic affiliation of
additional sequence types of housekeeping genes in the two lakes. The gyrB gene was chosen for
this analysis, as it displayed the by far largest sequence diversity π among all 9 housekeeping
genes (Table 2) which renders this gene most suitable to detect additional diversity. 59
unambiguous cloned sequences, representing 32 different sequence types were obtained of which
six (marked by dashed boxes in Fig. 3) corresponded to types already present in the culture
collection. Analysis of the phylogenetic position of the cloned sequences was conducted using
SplitsTree for a better comparability with the results of the MLSA. Whereas 22 of the
environmental sequences formed two additional and previously undetected sequence clusters
within the radiation of gyrB, the remaining environmental sequences clustered with sequences of
the cultivated strains (Fig. 3). There was no distinct population substructure of the freshwater
Sphingomonadaceae in Walchensee and Starnberger See.
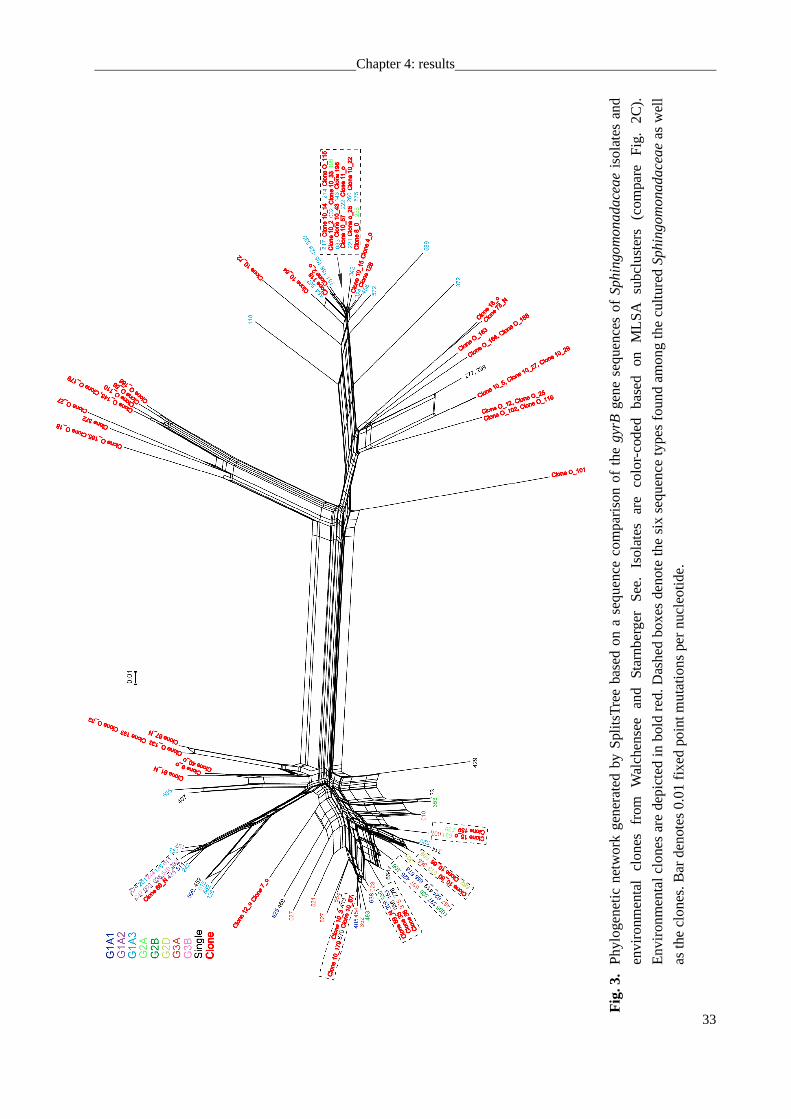
Chapter 4: results
33
Fig
. 3.
Phy
loge
netic
net
wor
k ge
nera
ted
by S
plits
Tre
e ba
sed
on
a se
quen
ce c
ompa
rison
of
the
gyr
B g
ene
sequ
ence
s of
S
phin
gom
on
ad
ace
ae
iso
late
s an
d
envi
ronm
enta
l cl
ones
fr
om
Wal
chen
see
and
Sta
rnbe
rge
r S
ee.
Isol
ates
ar
e co
lor-
code
d ba
sed
on
MLS
A
subc
lus
ters
(c
ompa
re
Fig
. 2C
).
Env
iron
men
tal c
lone
s ar
e de
pict
ed in
bol
d re
d. D
ash
ed b
oxes
den
ote
the
six
sequ
ence
typ
es f
ound
am
ong
the
cultu
red S
phi
ng
om
on
ada
cea
e a
s w
ell
as t
he c
lone
s. B
ar d
enot
es 0
.01
fixed
poi
nt m
utat
ions
per
nuc
leot
ide.
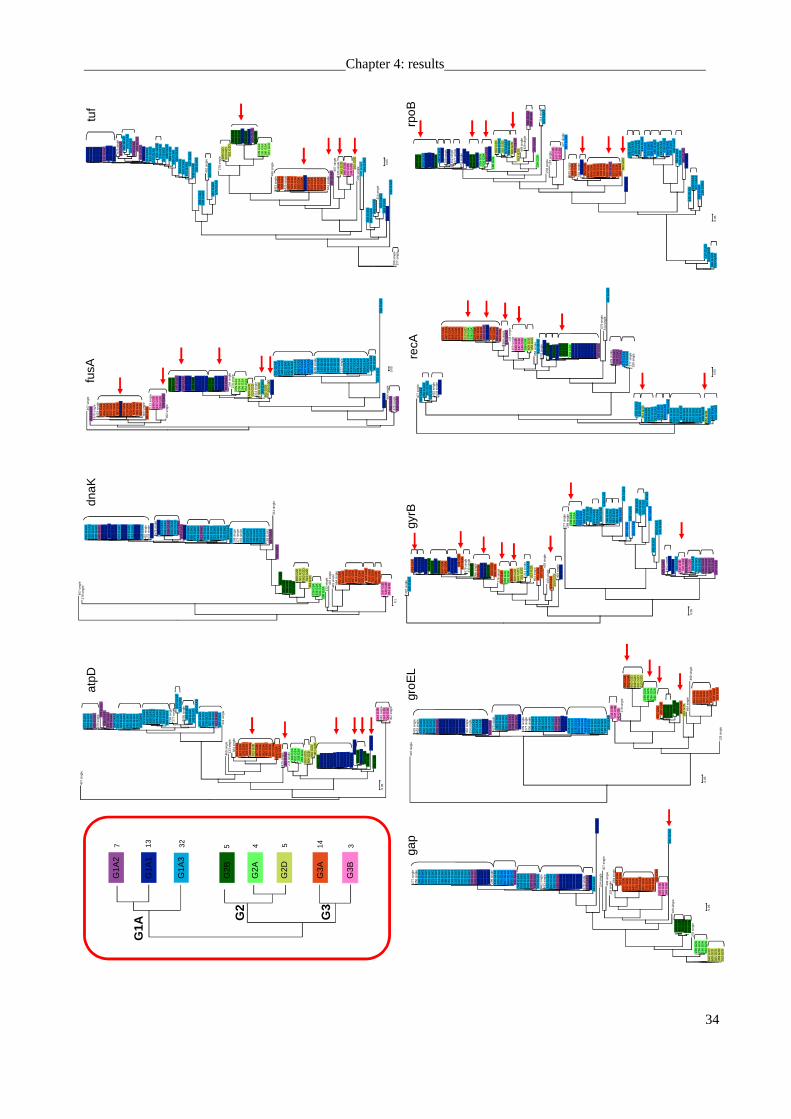
Chapter 4: results
34
244
G3B
247
G3B
54
0 G
3B
247
G3B
54
0 G
3B
244
G3B
G3B
G3A
G2D
G2A
G2B
G1A
1
G1A
2
G1A
3
G1A
G2
G3
137 32 45 5 14 3
242
G1A
3
193
G1A
3
217
G1A
3 15
1 G
1A3
428
G1A
3
372
G1A
3 03
3 G
1A3
002
G1A
3
221
G1A
3
143
G1A
3 15
8 G
1A3
118
G1A
3
198
G1A
3 21
4 G
1A3
222
G1A
3
407
sing
le27
8 si
ngle
562
G1A
3 52
5 G
1A3
505
G1A
3
658
G1A
1 62
5 G
1A1
509
G1A
1 40
5 G
1A1
624
G1A
1
425
G1A
1 51
1 G
1A1
678
G1A
1
452
sing
le43
3 si
ngle
679
sing
le
435
G1A
2
038
G1A
2
382
G1A
2 37
9 G
1A2
638
G1A
1
419
G1A
1
397
G1A
1
209
G1A
1 61
5 G
1A3
589
G1A
3
611
G1A
2
575
G1A
3 56
4 G
1A3
567
G1A
3 45
6 G
1A3
324
G1A
3
135
G1A
3 12
6 G
1A3
201
G1A
3 29
9 si
ngle
277
sing
le05
6 si
ngle
532
G1A
3
572
G1A
3
342
G1A
3
260
G1A
3
153
G1A
1 19
7 G
1A2
314
sing
le00
3 G
1A2
406
G2B
49
3 G
2B
300
G2B
00
5 G
2B
330
G2B
609
G2D
30
1 G
2D
662
G2D
01
3 G
2D
353
G2D
23
9 G
2A
236
G2A
03
1 G
2A
196
G2A
13
3 si
ngle
429
sing
le46
9 si
ngle
664
sing
le65
7 G
3A
527
G3A
52
1 G
3A
487
G3A
45
4 G
3A
352
G3A
654
G3A
375
G3A
03
7 G
3A
010
G3A
02
3 G
3A
007
G3A
36
5 G
3A
0.1
dnaK
372
G1A
3 03
3 G
1A3
002
G1A
3
221
G1A
3
118
G1A
3
428
G1A
3 21
7 G
1A3
151
G1A
3
222
G1A
3 21
4 G
1A3
158
G1A
3 19
8 G
1A3
143
G1A
3
407
sing
le
679
sing
le
242
G1A
3
135
G1A
3 12
6 G
1A3
342
G1A
3 26
0 G
1A3
572
G1A
3 53
2 G
1A3
525
G1A
3 50
5 G
1A3
201
G1A
3
562
G1A
3 29
9 si
ngle
277
sing
le
056
sing
le
193
G1A
3 61
5 G
1A3
589
G1A
3
324
G1A
3
575
G1A
3 56
7 G
1A3
456
G1A
3
564
G1A
3 31
4 si
ngle
469
sing
le13
3 si
ngle
365
G3A
487
G3A
664
sing
le65
4 G
3A
657
G3A
37
5 G
3A
010
G3A
007
G3A
02
3 G
3A
352
G3A
521
G3A
52
7 G
3A
454
G3A
03
7 G
3A
429
sing
le
435
G1A
2
379
G1A
2
038
G1A
2
197
G1A
2
003
G1A
2
611
G1A
2
382
G1A
2 27
8 si
ngle
196
G2A
03
1 G
2A
239
G2A
23
6 G
2A
353
G2D
662
G2D
013
G2D
609
G2D
301
G2D
40
6 G
2B
678
G1A
1 62
4 G
1A1
425
G1A
1
511
G1A
1 50
9 G
1A1
405
G1A
1 62
5 G
1A1
658
G1A
1
638
G1A
1
419
G1A
1 397
G1A
1
209
G1A
1
300
G2B
15
3 G
1A1
005
G2B
330
G2B
493
G2B
433
sing
le
452
sing
le
0.05
atpD
fusA
407
sing
le
679
sing
le43
3 si
ngle
469
sing
le
133
sing
le54
0 G
3B
247
G3B
24
4 G
3B
452
sing
le40
6 G
2B
300
G2B
493
G2B
330
G2B
00
5 G
2B
419
G1A
1
638
G1A
1
397
G1A
1 20
9 G
1A1
056
sing
le27
8 si
ngle
239
G2A
23
6 G
2A
196
G2A
03
1 G
2A
314
sing
le
609
G2D
01
3 G
2D
301
G2D
662
G2D
35
3 G
2D
615
G1A
3 58
9 G
1A3
324
G1A
3
575
G1A
3 56
7 G
1A3
564
G1A
3 45
6 G
1A3
299
sing
le
277
sing
le
342
G1A
3
260
G1A
3
572
G1A
3 53
2 G
1A3
201
G1A
3
126
G1A
3
242
G1A
3 13
5 G
1A3
193
G1A
3
221
G1A
3
118
G1A
3 14
3 G
1A3
158
G1A
3 19
8 G
1A3
214
G1A
3 22
2 G
1A3
428
G1A
3 21
7 G
1A3
151
G1A
3
033
G1A
3 00
2 G
1A3
372
G1A
3
525
G1A
3 50
5 G
1A3
562
G1A
3
678
G1A
1
511
G1A
1 50
9 G
1A1
625
G1A
1 62
4 G
1A1
425
G1A
1
658
G1A
1
405
G1A
1
153
G1A
1
037
G3A
45
4 G
3A
657
G3A
52
7 G
3A
521
G3A
48
7 G
3A
007
G3A
01
0 G
3A
023
G3A
37
5 G
3A
365
G3A
65
4 G
3A
352
G3A
664
sing
le
429
sing
le
003
G1A
2 379
G1A
2
197
G1A
2
038
G1A
2
611
G1A
2
382
G1A
2
435
G1A
2
0.05
tuf
679
sing
le
372
G1A
3 03
3 G
1A3
625
G1A
1 51
1 G
1A1
509
G1A
1 42
5 G
1A1
405
G1A
1
678
G1A
1 65
8 G
1A1
624
G1A
1
153
G1A
1
151
G1A
3 14
3 G
1A3
126
G1A
3 21
7 G
1A3
118
G1A
3
221
G1A
3
198
G1A
3
428
G1A
3
193
G1A
3 589
G1A
3
615
G1A
3
342
G1A
3
260
G1A
3
572
G1A
3
532
G1A
3 13
5 G
1A3
158
G1A
3 22
2 G
1A3
452
sing
le
242
G1A
3
278
sing
le
493
G2B
40
6 G
2B
300
G2B
330
G2B
005
G2B
23
9 G
2A
236
G2A
19
6 G
2A
031
G2A
46
9 si
ngle
433
sing
le
429
sing
le
454
G3A
03
7 G
3A
657
G3A
52
7 G
3A
521
G3A
36
5 G
3A
375
G3A
007
G3A
01
0 G
3A
023
G3A
35
2 G
3A
487
G3A
65
4 G
3A
664
sing
le
379
G1A
2
197
G1A
2
435
G1A
2
038
G1A
2
611
G1A
2
003
G1A
2
382
G1A
2 407
sing
le13
3 si
ngle
540
G3B
24
7 G
3B
244
G3B
609
G2D
01
3 G
2D
301
G2D
662
G2D
353
G2D
05
6 si
ngle
002
G1A
3 20
1 G
1A3
314
sing
le
562
G1A
3
505
G1A
3
525
G1A
3
567
G1A
3
575
G1A
3
564
G1A
3 45
6 G
1A3
324
G1A
3
638
G1A
1
209
G1A
1
419
G1A
1
397
G1A
1 21
4 G
1A3
299
sing
le27
7 si
ngle
0.05
493
G2B
300
G2B
33
0 G
2B
406
G2B
005
G2B
406
G2B
30
0 G
2B
493
G2B
33
0 G
2B
005
G2B
gap
277
sing
le05
6 si
ngle
299
sing
le61
5 G
1A3
589
G1A
3
324
G1A
3
575
G1A
3 56
7 G
1A3
564
G1A
3 45
6 G
1A3
428
G1A
3 22
2 G
1A3
221
G1A
3 21
7 G
1A3
214
G1A
3 19
8 G
1A3
158
G1A
3 15
1 G
1A3
143
G1A
3 11
8 G
1A3
033
G1A
3 00
2 G
1A3
372
G1A
3 45
2 si
ngle
433
sing
le
260
G1A
3
342
G1A
3
572
G1A
3 53
2 G
1A3
679
sing
le
197
G1A
2 00
3 G
1A2
611
G1A
2
382
G1A
2 03
8 G
1A2
435
G1A
2
379
G1A
2
638
G1A
1 20
9 G
1A1
419
G1A
1
397
G1A
1
242
G1A
3 20
1 G
1A3
135
G1A
3 12
6 G
1A3
193
G1A
3
658
G1A
1 62
5 G
1A1
678
G1A
1 15
3 G
1A1
511
G1A
1 50
9 G
1A1
425
G1A
1 40
5 G
1A1
624
G1A
1 31
4 si
ngle
407
sing
le46
9 si
ngle
133
sing
le 664
sing
le45
4 G
3A
037
G3A
65
7 G
3A
527
G3A
52
1 G
3A
487
G3A
37
5 G
3A
365
G3A
00
7 G
3A
010
G3A
02
3 G
3A
654
G3A
35
2 G
3A
540
G3B
24
7 G
3B
244
G3B
525
G1A
3
505
G1A
3
562
G1A
3 42
9 si
ngle
278
sing
le23
9 G
2A
236
G2A
19
6 G
2A
031
G2A
66
2 G
2D
609
G2D
30
1 G
2D
353
G2D
01
3 G
2D
0.05
groE
L40
7 si
ngle
433
sing
le42
9 si
ngle
562
G1A
3 52
5 G
1A3
505
G1A
3
452
sing
le31
4 si
ngle
679
sing
le
299
sing
le27
7 si
ngle
056
sing
le
572
G1A
3 53
2 G
1A3
342
G1A
3
260
G1A
3
435
G1A
2
611
G1A
2
382
G1A
2 03
8 G
1A2
379
G1A
2
197
G1A
2 00
3 G
1A2
419
G1A
1
638
G1A
1
397
G1A
1
209
G1A
1
658
G1A
1 62
5 G
1A1
624
G1A
1 51
1 G
1A1
509
G1A
1 42
5 G
1A1
405
G1A
1
678
G1A
1
153
G1A
1 61
5 G
1A3
589
G1A
3 57
5 G
1A3
567
G1A
3 56
4 G
1A3
456
G1A
3 32
4 G
1A3
428
G1A
3 21
7 G
1A3
151
G1A
3
372
G1A
3 03
3 G
1A3
002
G1A
3
222
G1A
3 21
4 G
1A3
198
G1A
3 15
8 G
1A3
143
G1A
3 11
8 G
1A3
221
G1A
3 24
2 G
1A3
201
G1A
3 13
5 G
1A3
126
G1A
3 19
3 G
1A3 24
4 G
3B
247
G3B
54
0 G
3B
278
sing
le 239
G2A
23
6 G
2A
196
G2A
03
1 G
2A 66
2 G
2D
609
G2D
30
1 G
2D
013
G2D
353
G2D
469
sing
le
365
G3A
35
2 G
3A
657
G3A
48
7 G
3A
454
G3A
664
sing
le
654
G3A
52
7 G
3A
521
G3A
37
5 G
3A
007
G3A
01
0 G
3A
037
G3A
02
3 G
3A
133
sing
le
0.05
gyrB
407
sing
le
679
sing
le43
3 si
ngle
056
sing
le
397
G1A
1
419
G1A
1
638
G1A
1
209
G1A
1
493
G2B
40
6 G
2B
300
G2B
005
G2B
330
G2B
278
sing
le
314
sing
le
429
sing
le13
3 si
ngle65
7 G
3A
454
G3A
487
G3A
521
G3A
52
7 G
3A
375
G3A
023
G3A
35
2 G
3A
007
G3A
365
G3A
664
sing
le65
4 G
3A
037
G3A
010
G3A
609
G2D
66
2 G
2D
301
G2D
013
G2D
353
G2D
46
9 si
ngle
277
sing
le29
9 si
ngle
239
G2A
03
1 G
2A
236
G2A
19
6 G
2A
342
G1A
3 53
2 G
1A3
572
G1A
3
260
G1A
3
221
G1A
3
222
G1A
3 21
4 G
1A3
158
G1A
3 11
8 G
1A3
198
G1A
3 14
3 G
1A3
033
G1A
3 00
2 G
1A3
372
G1A
3
428
G1A
3 15
1 G
1A3
217
G1A
3
575
G1A
3
456
G1A
3
564
G1A
3
324
G1A
3
567
G1A
3
589
G1A
3
615
G1A
3
505
G1A
3
525
G1A
3
562
G1A
3
435
G1A
2 45
2 si
ngle
405
G1A
1 67
8 G
1A1
658
G1A
1
425
G1A
1 62
4 G
1A1
153
G1A
1
625
G1A
1
509
G1A
1 51
1 G
1A1
611
G1A
2
540
G3B
24
7 G
3B
244
G3B
126
G1A
3
193
G1A
3
242
G1A
3 13
5 G
1A3
201
G1A
3 38
2 G
1A2
379
G1A
2 03
8 G
1A2
003
G1A
2 19
7 G
1A2
0.05
005
G2B
330
G2B
493
G2B
40
6 G
2B
300
G2B
406
G2B
30
0 G
2B
493
G2B
330
G2B
00
5 G
2B
540
G3B
24
7 G
3B
244
G3B
540
G3B
24
7 G
3B
244
G3B
372
G1A
3
151
G1A
3 14
3 G
1A3
198
G1A
3 15
8 G
1A3
118
G1A
3
428
G1A
3
222
G1A
3 22
1 G
1A3
217
G1A
3 21
4 G
1A3
033
G1A
3 00
2 G
1A3
recA
407
sing
le
201
G1A
3 13
5 G
1A3
452
sing
le43
3 si
ngle
521
G3A
48
7 G
3A
375
G3A
36
5 G
3A
352
G3A
02
3 G
3A
010
G3A
527
G3A
65
7 G
3A
654
G3A
007
G3A
03
7 G
3A
454
G3A
66
4 si
ngle
133
sing
le46
9 si
ngle
056
sing
le
278
sing
le
239
G2A
23
6 G
2A
196
G2A
031
G2A
658
G1A
1
625
G1A
1
153
G1A
1
405
G1A
1 42
5 G
1A1
509
G1A
1 51
1 G
1A1
624
G1A
1 67
8 G
1A1
419
G1A
1
209
G1A
1
397
G1A
1 63
8 G
1A1
679
sing
le31
4 si
ngle
242
G1A
3 42
9 si
ngle
003
G1A
2
435
G1A
2
611
G1A
2
197
G1A
2
379
G1A
2 03
8 G
1A2
382
G1A
2
277
sing
le29
9 si
ngle
126
G1A
3
615
G1A
3
589
G1A
3
260
G1A
3
572
G1A
3
532
G1A
3
342
G1A
3
193
G1A
3 50
5 G
1A3
525
G1A
3 56
2 G
1A3
013
G2D
609
G2D
35
3 G
2D
301
G2D
662
G2D
567
G1A
3
575
G1A
3
324
G1A
3
564
G1A
3
456
G1A
3
118
G1A
3
033
G1A
3
222
G1A
3 21
7 G
1A3
143
G1A
3
428
G1A
3 22
1 G
1A3
214
G1A
3
151
G1A
3 19
8 G
1A3
158
G1A
3
372
G1A
3
002
G1A
3 0.
05
rpoB
299
sing
le
452
sing
le27
7 si
ngle
679
sing
le
435
G1A
2
615
G1A
3
589
G1A
3
611
G1A
2
469
sing
le42
9 si
ngle
382
G1A
2 03
8 G
1A2
197
G1A
2
239
G2A
03
1 G
2A
196
G2A
236
G2A
31
4 si
ngle
260
G1A
3
342
G1A
3
572
G1A
3
532
G1A
3 27
8 si
ngle
133
sing
le
407
sing
le
433
sing
le
379
G1A
2
454
G3A
03
7 G
3A
664
sing
le
352
G3A
65
7 G
3A
654
G3A
37
5 G
3A
365
G3A
02
3 G
3A
010
G3A
00
7 G
3A
527
G3A
52
1 G
3A
487
G3A
662
G2D
301
G2D
609
G2D
013
G2D
353
G2D
638
G1A
1
419
G1A
1
209
G1A
1
397
G1A
1
056
sing
le
505
G1A
3
562
G1A
3 52
5 G
1A3
003
G1A
2
624
G1A
1 42
5 G
1A1
658
G1A
1
511
G1A
1
509
G1A
1
678
G1A
1
625
G1A
1
153
G1A
1
405
G1A
1
567
G1A
3
575
G1A
3
456
G1A
3
564
G1A
3
324
G1A
3
193
G1A
3
201
G1A
3
242
G1A
3
135
G1A
3
126
G1A
3
0.05
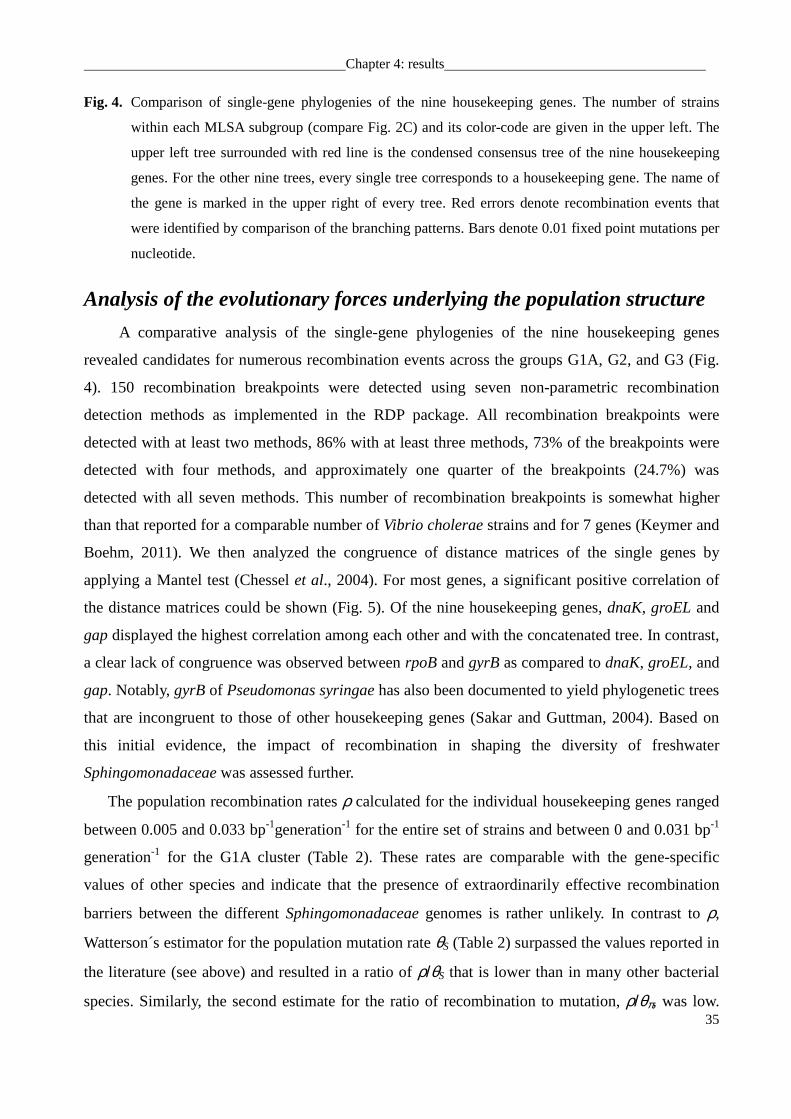
Chapter 4: results
35
Fig. 4. Comparison of single-gene phylogenies of the nine housekeeping genes. The number of strains
within each MLSA subgroup (compare Fig. 2C) and its color-code are given in the upper left. The
upper left tree surrounded with red line is the condensed consensus tree of the nine housekeeping
genes. For the other nine trees, every single tree corresponds to a housekeeping gene. The name of
the gene is marked in the upper right of every tree. Red errors denote recombination events that
were identified by comparison of the branching patterns. Bars denote 0.01 fixed point mutations per
nucleotide.
Analysis of the evolutionary forces underlying the population structure
A comparative analysis of the single-gene phylogenies of the nine housekeeping genes
revealed candidates for numerous recombination events across the groups G1A, G2, and G3 (Fig.
4). 150 recombination breakpoints were detected using seven non-parametric recombination
detection methods as implemented in the RDP package. All recombination breakpoints were
detected with at least two methods, 86% with at least three methods, 73% of the breakpoints were
detected with four methods, and approximately one quarter of the breakpoints (24.7%) was
detected with all seven methods. This number of recombination breakpoints is somewhat higher
than that reported for a comparable number of Vibrio cholerae strains and for 7 genes (Keymer and
Boehm, 2011). We then analyzed the congruence of distance matrices of the single genes by
applying a Mantel test (Chessel et al., 2004). For most genes, a significant positive correlation of
the distance matrices could be shown (Fig. 5). Of the nine housekeeping genes, dnaK, groEL and
gap displayed the highest correlation among each other and with the concatenated tree. In contrast,
a clear lack of congruence was observed between rpoB and gyrB as compared to dnaK, groEL, and
gap. Notably, gyrB of Pseudomonas syringae has also been documented to yield phylogenetic trees
that are incongruent to those of other housekeeping genes (Sakar and Guttman, 2004). Based on
this initial evidence, the impact of recombination in shaping the diversity of freshwater
Sphingomonadaceae was assessed further.
The population recombination rates ρ calculated for the individual housekeeping genes ranged
between 0.005 and 0.033 bp-1generation-1 for the entire set of strains and between 0 and 0.031 bp-1
generation-1 for the G1A cluster (Table 2). These rates are comparable with the gene-specific
values of other species and indicate that the presence of extraordinarily effective recombination
barriers between the different Sphingomonadaceae genomes is rather unlikely. In contrast to ρ,
Watterson´s estimator for the population mutation rate θS (Table 2) surpassed the values reported in
the literature (see above) and resulted in a ratio of ρ/θS that is lower than in many other bacterial
species. Similarly, the second estimate for the ratio of recombination to mutation, ρ/θπ, was low.
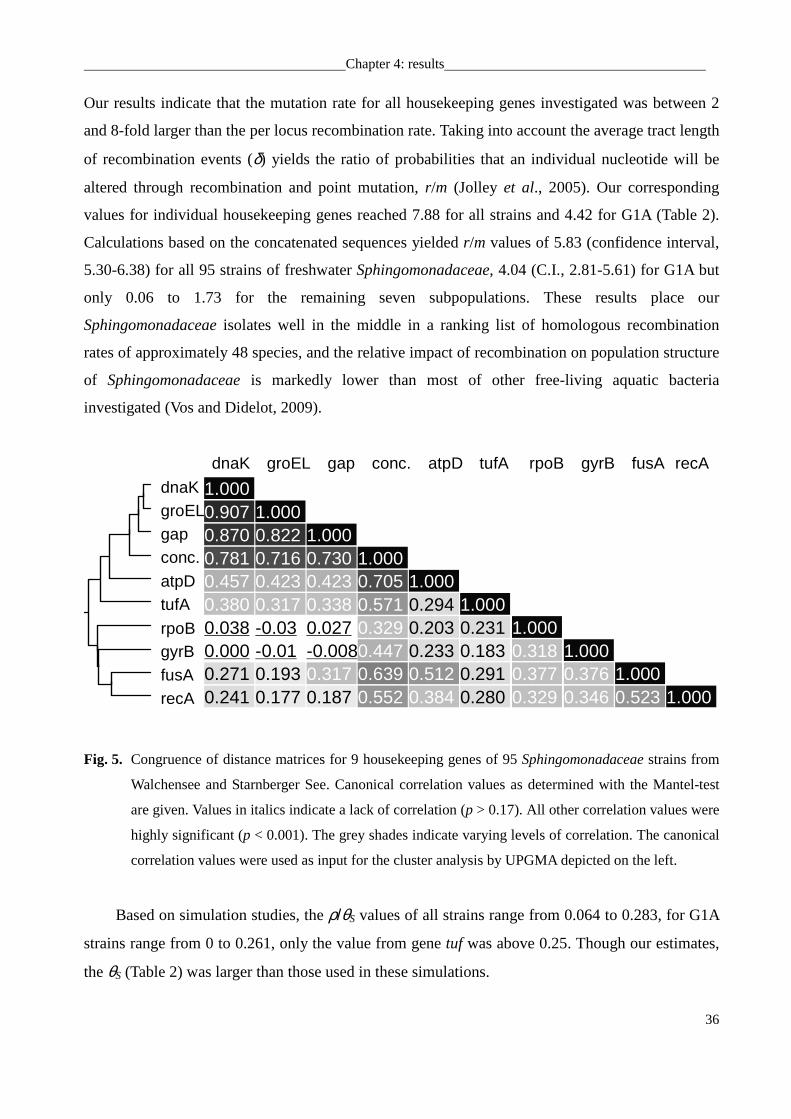
Chapter 4: results
36
Our results indicate that the mutation rate for all housekeeping genes investigated was between 2
and 8-fold larger than the per locus recombination rate. Taking into account the average tract length
of recombination events (δ) yields the ratio of probabilities that an individual nucleotide will be
altered through recombination and point mutation, r/m (Jolley et al., 2005). Our corresponding
values for individual housekeeping genes reached 7.88 for all strains and 4.42 for G1A (Table 2).
Calculations based on the concatenated sequences yielded r/m values of 5.83 (confidence interval,
5.30-6.38) for all 95 strains of freshwater Sphingomonadaceae, 4.04 (C.I., 2.81-5.61) for G1A but
only 0.06 to 1.73 for the remaining seven subpopulations. These results place our
Sphingomonadaceae isolates well in the middle in a ranking list of homologous recombination
rates of approximately 48 species, and the relative impact of recombination on population structure
of Sphingomonadaceae is markedly lower than most of other free-living aquatic bacteria
investigated (Vos and Didelot, 2009).
dnaKgroELgapconc.
atpDtufA
rpoBgyrBfusArecA
1.000 0.907 1.000 0.870 0.822 1.000 0.781 0.716 0.730 1.000 0.457 0.423 0.423 0.705 1.000 0.380 0.317 0.338 0.571 0.294 1.000 0.038 -0.03 0.027 0.329 0.203 0.231 1.000 0.000 -0.01 -0.0080.447 0.233 0.183 0.318 1.000 0.271 0.193 0.317 0.639 0.512 0.291 0.377 0.376 1.000 0.241 0.177 0.187 0.552 0.384 0.280 0.329 0.346 0.523 1.000
dnaK groEL gap conc. atpD tufA rpoB gyrB fusA recA
Fig. 5. Congruence of distance matrices for 9 housekeeping genes of 95 Sphingomonadaceae strains from
Walchensee and Starnberger See. Canonical correlation values as determined with the Mantel-test
are given. Values in italics indicate a lack of correlation (p > 0.17). All other correlation values were
highly significant (p < 0.001). The grey shades indicate varying levels of correlation. The canonical
correlation values were used as input for the cluster analysis by UPGMA depicted on the left.
Based on simulation studies, the ρ/θS values of all strains range from 0.064 to 0.283, for G1A
strains range from 0 to 0.261, only the value from gene tuf was above 0.25. Though our estimates,
the θS (Table 2) was larger than those used in these simulations.
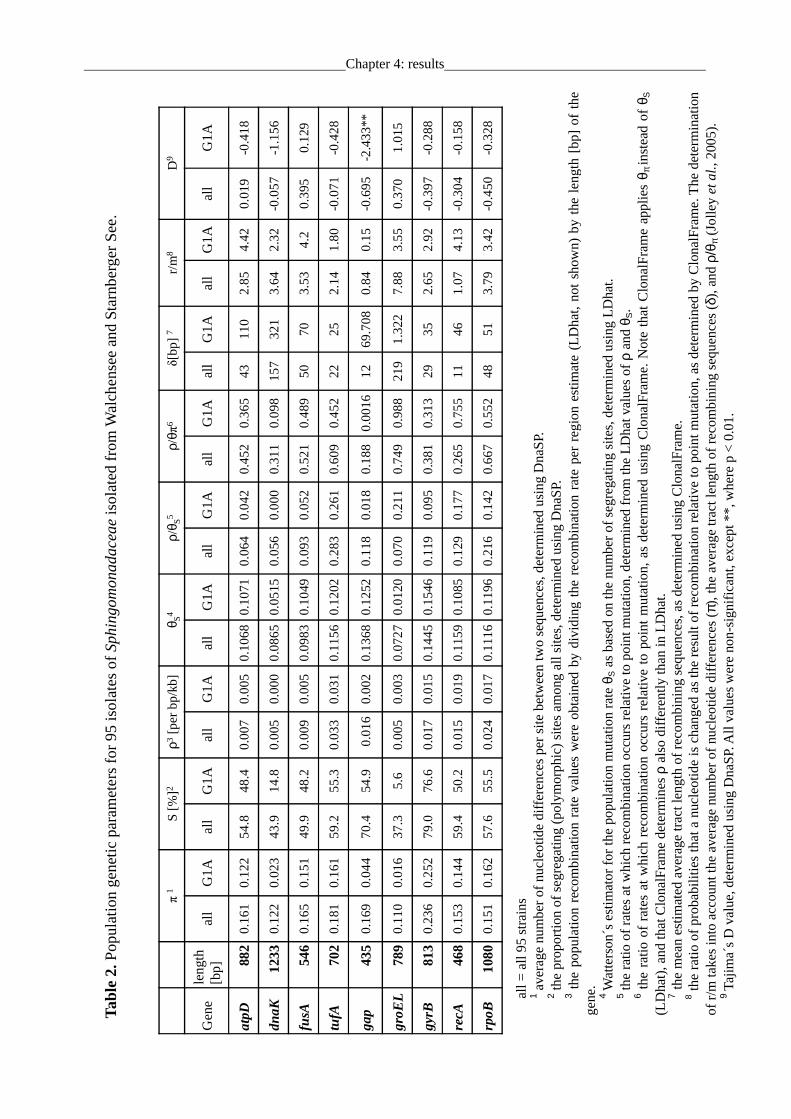
Chapter 4: results
37
π1
S [%
]2ρ3
[pe
r b
p/k
b]
θ S4
ρ/θ S
5ρ/
θπ6
δ[b
p] 7
r/m
8D
9
Gen
e
len
gth
[b
p]
all
G1
Aa
llG
1A
all
G1
Aal
lG
1Aal
lG
1Aal
lG
1A
all
G1
Aa
llG
1A
all
G1
A
atpD
882
0.1
61
0.1
22
54
.84
8.4
0.0
07
0.0
05
0.1
06
80.
10
710
.064
0.0
42
0.4
52
0.3
65
43
11
02.
85
4.4
20
.019
-0.4
18
dnaK
1233
0.1
22
0.0
23
43
.91
4.8
0.0
05
0.0
00
0.0
86
50.
05
150
.056
0.0
00
0.3
11
0.0
98
15
73
21
3.6
42
.32
-0.0
57
-1.1
56
fusA
546
0.1
65
0.1
51
49
.94
8.2
0.0
09
0.0
05
0.0
98
30.
10
490
.093
0.0
52
0.5
21
0.4
89
50
70
3.5
34
.20
.395
0.1
29
tufA
702
0.1
81
0.1
61
59
.25
5.3
0.0
33
0.0
31
0.1
15
60.
12
020
.283
0.2
61
0.6
09
0.4
52
22
25
2.1
41
.80
-0.0
71
-0.4
28
gap
435
0.1
69
0.0
44
70
.45
4.9
0.0
16
0.0
02
0.1
36
80.
12
520
.118
0.0
18
0.1
88
0.0
01
61
26
9.7
08
0.8
40
.15
-0.6
95
-2.4
33
**
groE
L78
90
.11
00.
01
63
7.3
5.6
0.0
05
0.0
03
0.0
72
70.
01
200
.070
0.2
11
0.
74
90.
98
82
19
1.3
227.
88
3.5
50
.370
1.0
15
gyrB
813
0.2
36
0.2
52
79
.07
6.6
0.0
17
0.0
15
0.1
44
50.
15
460
.119
0.0
95
0.3
81
0.3
13
29
35
2.6
52
.92
-0.3
97
-0.2
88
recA
468
0.1
53
0.1
44
59
.45
0.2
0.0
15
0.0
19
0.1
15
90.
10
850
.129
0.1
77
0.2
65
0.7
55
11
46
1.0
74
.13
-0.3
04
-0.1
58
rpoB
1080
0.1
51
0.1
62
57
.65
5.5
0.0
24
0.0
17
0.1
11
60.
11
960
.216
0.1
42
0.6
67
0.5
52
48
51
3.7
93
.42
-0.4
50
-0.3
28
all =
all
95 s
trai
ns
1 ave
rage
num
ber
of n
ucle
otid
e di
ffere
nces
per
site
be
twee
n tw
o se
quen
ces,
det
erm
ined
usi
ng D
naS
P.
2 the
prop
ortio
n of
seg
rega
ting
(pol
ymor
phic
) si
tes
amon
g al
l site
s, d
eter
min
ed u
sing
Dna
SP.
3 t
he p
opul
atio
n re
com
bina
tion
rate
val
ues
wer
e ob
tain
ed b
y di
vidin
g th
e re
com
bina
tion
rate
per
reg
ion
estim
ate
(LD
hat,
not
show
n) b
y th
e le
ngth
[bp
] of
the
gene
. 4 W
atte
rson
´s e
stim
ator
for
the
popu
latio
n m
utat
ion
rate
θ S a
s ba
sed
on th
e nu
mbe
r of
seg
rega
ting
site
s, d
eter
min
ed u
sing
LD
hat.
5 the
ratio
of r
ates
at w
hich
rec
ombi
natio
n oc
curs
rel
ativ
e to
poi
nt m
utat
ion,
det
erm
ined
from
the
LDha
t val
ues
of ρ
and
θ S.
6 t
he r
atio
of
rate
s at
whi
ch r
ecom
bina
tion
occu
rs r
elat
ive
to p
oint
mut
atio
n, a
s de
term
ined
usi
ng C
lon
alF
ram
e. N
ote
that
Clo
nalF
ram
e ap
plie
s θ π
inst
ead
of θ S
(L
Dha
t), a
nd th
at C
lona
lFra
me
dete
rmin
es
ρ al
so d
iffer
ently
than
in L
Dha
t. 7 th
e m
ean
estim
ated
ave
rage
trac
t len
gth
of r
ecom
bin
ing
sequ
ence
s, a
s de
term
ined
usi
ng C
lona
lFra
me.
8 t
he r
atio
of p
roba
bilit
ies
that
a n
ucle
otid
e is
ch
ange
d as
the
res
ult
of r
ecom
bina
tion
rela
tive
to p
oin
t m
utat
ion,
as
dete
rmin
ed b
y C
lona
lFra
me.
The
det
erm
inat
ion
of r
/m ta
kes
into
acc
ount
the
aver
age
num
ber
of n
ucle
otid
e di
ffere
nces
(π), t
he a
vera
ge tr
act l
engt
h of
rec
ombi
ning
seq
uenc
es
(δ),
and
ρ/θ π
(Jo
lley
et a
l., 2
005)
. 9 T
ajim
a´s
D v
alue
, det
erm
ined
usi
ng D
naS
P. A
ll va
lues
wer
e no
n-si
gnifi
cant
, exc
ept *
*, w
here
p <
0.0
1.
Tab
le 2
. Pop
ulat
ion
gene
tic p
aram
ete
rs fo
r 95
isol
ates
of
Sp
hin
go
mo
na
da
cea
e
isol
ated
from
Wal
che
nsee
and
Sta
rnb
erg
er S
ee.
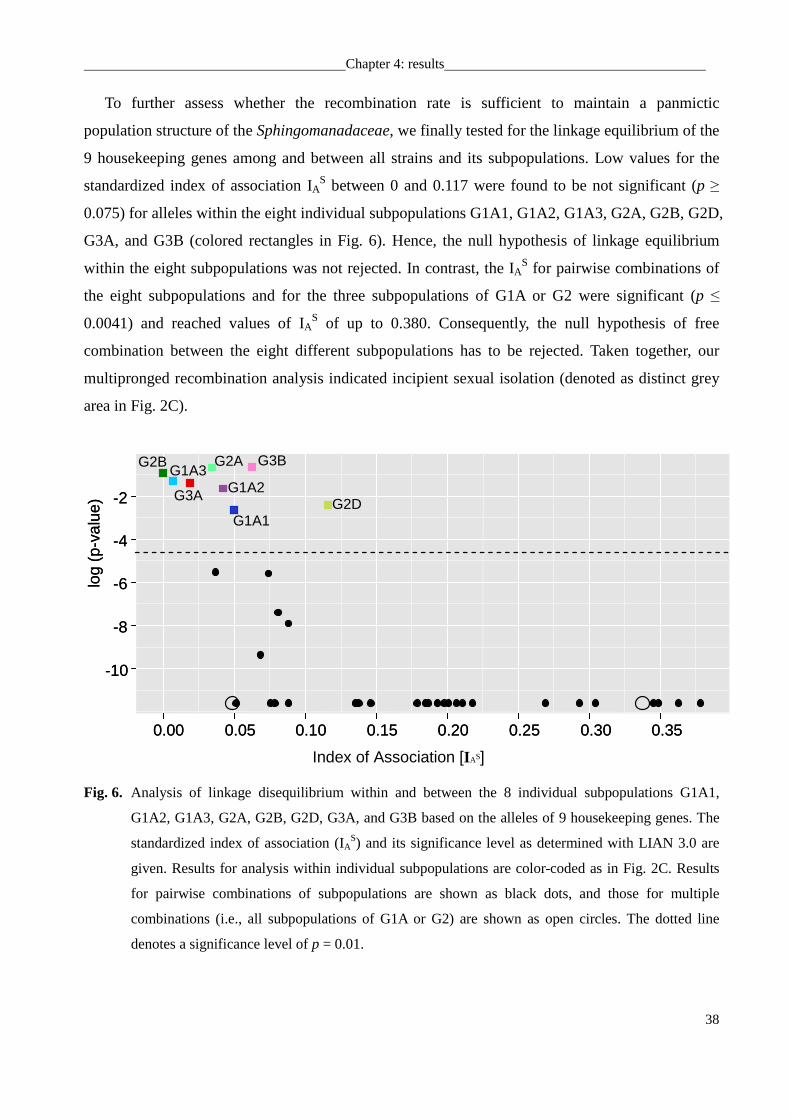
Chapter 4: results
38
To further assess whether the recombination rate is sufficient to maintain a panmictic
population structure of the Sphingomanadaceae, we finally tested for the linkage equilibrium of the
9 housekeeping genes among and between all strains and its subpopulations. Low values for the
standardized index of association IAS between 0 and 0.117 were found to be not significant (p ≥
0.075) for alleles within the eight individual subpopulations G1A1, G1A2, G1A3, G2A, G2B, G2D,
G3A, and G3B (colored rectangles in Fig. 6). Hence, the null hypothesis of linkage equilibrium
within the eight subpopulations was not rejected. In contrast, the IAS for pairwise combinations of
the eight subpopulations and for the three subpopulations of G1A or G2 were significant (p ≤
0.0041) and reached values of IAS of up to 0.380. Consequently, the null hypothesis of free
combination between the eight different subpopulations has to be rejected. Taken together, our
multipronged recombination analysis indicated incipient sexual isolation (denoted as distinct grey
area in Fig. 2C).
Index of Association [IAS]
log
(p-v
alue
)
-10
-8
-6
-4
-2
log
(p-v
alue
)
-10
-8
-6
-4
-2
0.00 0.05 0.10 0.15 0.20 0.25 0.30 0.350.00 0.05 0.10 0.15 0.20 0.25 0.30 0.35
G1A1
G1A2G1A3
G2AG2B
G2DG3A
G3B
Fig. 6. Analysis of linkage disequilibrium within and between the 8 individual subpopulations G1A1,
G1A2, G1A3, G2A, G2B, G2D, G3A, and G3B based on the alleles of 9 housekeeping genes. The
standardized index of association (IAS) and its significance level as determined with LIAN 3.0 are
given. Results for analysis within individual subpopulations are color-coded as in Fig. 2C. Results
for pairwise combinations of subpopulations are shown as black dots, and those for multiple
combinations (i.e., all subpopulations of G1A or G2) are shown as open circles. The dotted line
denotes a significance level of p = 0.01.
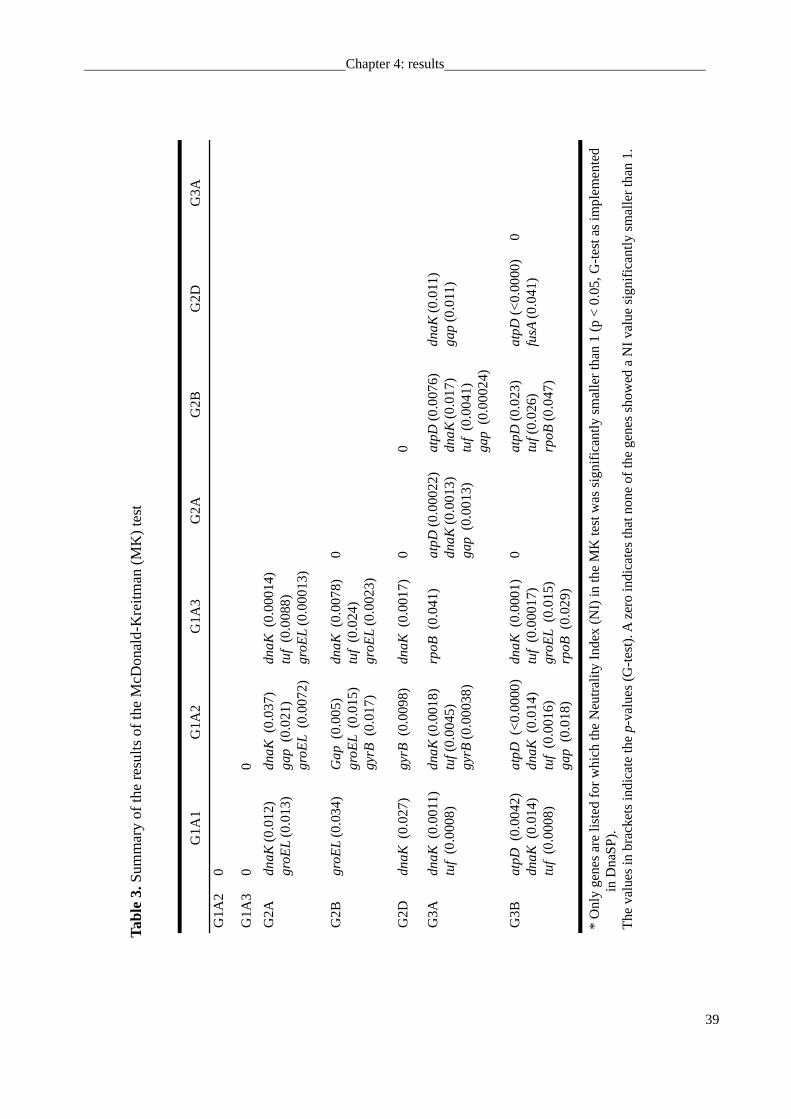
Chapter 4: results
39
* O
nly
gene
s ar
e lis
ted
for
whi
ch th
e N
eutr
ality
Index
(NI)
in th
e M
K te
st w
as s
igni
fican
tly s
mal
ler
tha
n 1
(p <
0.0
5, G
-tes
t as
impl
emen
ted
in D
naS
P).
T
he v
alue
s in
bra
cket
s in
dica
te th
e p-
valu
es (
G-t
est)
. A z
ero
indi
cate
s th
at n
one
of th
e g
enes
sho
wed
a N
I val
ue s
igni
fican
tly s
mal
ler
than
1.
G1
A1
G1A
2G
1A3
G2
AG
2BG
2D
G3A
G1A
20
G1A
30
0
G2A
dn
aK
(0.0
12)
gro
EL
(0.0
13)
dnaK
(0.0
37)
gap (
0.0
21)
gro
EL
(0.0
072)
dn
aK
(0.0
0014
)tu
f(0
.008
8)
gro
EL
(0.0
0013
)
G2B
gro
EL
(0.0
34)
Ga
p (
0.00
5)g
roE
L(0
.015
)g
yrB
(0.0
17)
dn
aK
(0.0
078)
tuf
(0.0
24)
gro
EL
(0.0
023)
0
G2D
dn
aK
(0.0
27)
gyr
B(0
.009
8)dn
aK
(0.0
017)
00
G3A
dn
aK
(0.0
011)
tuf
(0.0
008
)d
naK
(0.0
018)
tuf (
0.0
045)
gyr
B (0
.00
038
)
rpoB
(0.0
41)
atp
D(0
.000
22)
dnaK
(0.0
013
)g
ap (
0.00
13)
atp
D(0
.007
6)dna
K(0
.01
7)tu
f(0
.00
41)
gap
(0.
0002
4)
dnaK
(0.0
11)
gap (0
.011
)
G3B
atp
D(0
.00
42)
dn
aK
(0.0
14)
tuf
(0.0
008
)
atp
D(<
0.00
00)
dnaK
(0.0
14)
tuf
(0.0
016)
gap (
0.0
18)
dn
aK
(0.0
001)
tuf
(0.0
001
7)gro
EL
(0.0
15)
rpoB
(0.0
29)
0atp
D(0
.023
)tu
f(0.
026)
rpoB
(0.0
47)
atp
D(<
0.00
00)
fusA
(0.0
41)
0
Tabl
e 3.
Sum
ma
ry o
f the
re
sults
of t
he M
cDon
ald
-Kre
itma
n (M
K)
test
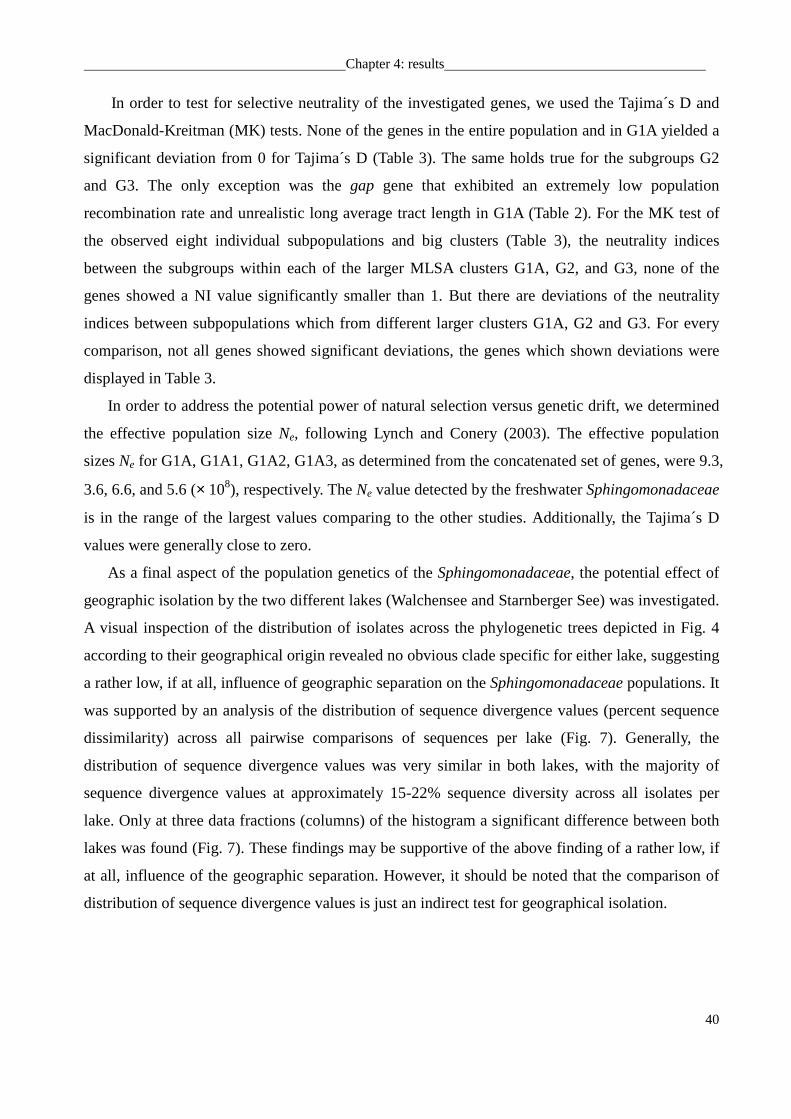
Chapter 4: results
40
In order to test for selective neutrality of the investigated genes, we used the Tajima´s D and
MacDonald-Kreitman (MK) tests. None of the genes in the entire population and in G1A yielded a
significant deviation from 0 for Tajima´s D (Table 3). The same holds true for the subgroups G2
and G3. The only exception was the gap gene that exhibited an extremely low population
recombination rate and unrealistic long average tract length in G1A (Table 2). For the MK test of
the observed eight individual subpopulations and big clusters (Table 3), the neutrality indices
between the subgroups within each of the larger MLSA clusters G1A, G2, and G3, none of the
genes showed a NI value significantly smaller than 1. But there are deviations of the neutrality
indices between subpopulations which from different larger clusters G1A, G2 and G3. For every
comparison, not all genes showed significant deviations, the genes which shown deviations were
displayed in Table 3.
In order to address the potential power of natural selection versus genetic drift, we determined
the effective population size Ne, following Lynch and Conery (2003). The effective population
sizes Ne for G1A, G1A1, G1A2, G1A3, as determined from the concatenated set of genes, were 9.3,
3.6, 6.6, and 5.6 (× 108), respectively. The Ne value detected by the freshwater Sphingomonadaceae
is in the range of the largest values comparing to the other studies. Additionally, the Tajima´s D
values were generally close to zero.
As a final aspect of the population genetics of the Sphingomonadaceae, the potential effect of
geographic isolation by the two different lakes (Walchensee and Starnberger See) was investigated.
A visual inspection of the distribution of isolates across the phylogenetic trees depicted in Fig. 4
according to their geographical origin revealed no obvious clade specific for either lake, suggesting
a rather low, if at all, influence of geographic separation on the Sphingomonadaceae populations. It
was supported by an analysis of the distribution of sequence divergence values (percent sequence
dissimilarity) across all pairwise comparisons of sequences per lake (Fig. 7). Generally, the
distribution of sequence divergence values was very similar in both lakes, with the majority of
sequence divergence values at approximately 15-22% sequence diversity across all isolates per
lake. Only at three data fractions (columns) of the histogram a significant difference between both
lakes was found (Fig. 7). These findings may be supportive of the above finding of a rather low, if
at all, influence of the geographic separation. However, it should be noted that the comparison of
distribution of sequence divergence values is just an indirect test for geographical isolation.
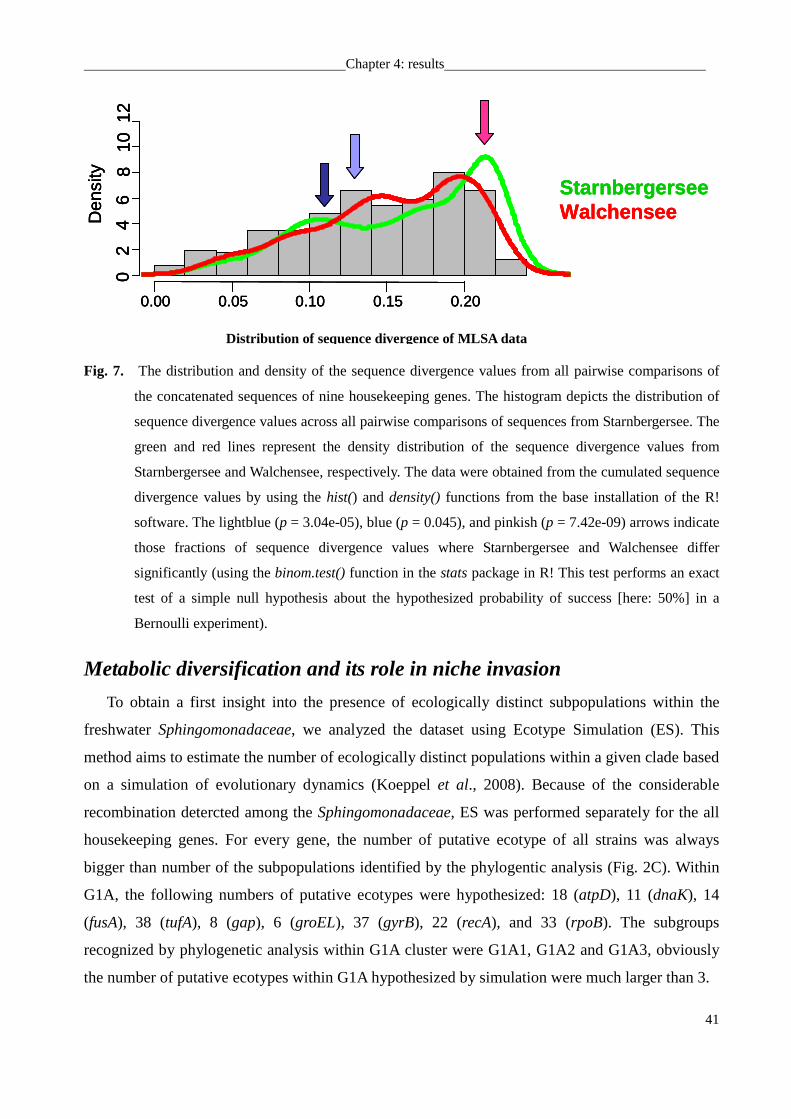
Chapter 4: results
41
Den
sity
0.00 0.05 0.10 0.15 0.20
02
46
8 1
0 1
2
StarnbergerseeWalchenseeD
ensi
ty
0.00 0.05 0.10 0.15 0.20
02
46
8 1
0 1
2
StarnbergerseeWalchenseeD
ensi
ty
0.00 0.05 0.10 0.15 0.20
02
46
8 1
0 1
2
StarnbergerseeWalchensee
Fig. 7. The distribution and density of the sequence divergence values from all pairwise comparisons of
the concatenated sequences of nine housekeeping genes. The histogram depicts the distribution of
sequence divergence values across all pairwise comparisons of sequences from Starnbergersee. The
green and red lines represent the density distribution of the sequence divergence values from
Starnbergersee and Walchensee, respectively. The data were obtained from the cumulated sequence
divergence values by using the hist() and density() functions from the base installation of the R!
software. The lightblue (p = 3.04e-05), blue (p = 0.045), and pinkish (p = 7.42e-09) arrows indicate
those fractions of sequence divergence values where Starnbergersee and Walchensee differ
significantly (using the binom.test() function in the stats package in R! This test performs an exact
test of a simple null hypothesis about the hypothesized probability of success [here: 50%] in a
Bernoulli experiment).
Metabolic diversification and its role in niche invasion
To obtain a first insight into the presence of ecologically distinct subpopulations within the
freshwater Sphingomonadaceae, we analyzed the dataset using Ecotype Simulation (ES). This
method aims to estimate the number of ecologically distinct populations within a given clade based
on a simulation of evolutionary dynamics (Koeppel et al., 2008). Because of the considerable
recombination detercted among the Sphingomonadaceae, ES was performed separately for the all
housekeeping genes. For every gene, the number of putative ecotype of all strains was always
bigger than number of the subpopulations identified by the phylogentic analysis (Fig. 2C). Within
G1A, the following numbers of putative ecotypes were hypothesized: 18 (atpD), 11 (dnaK), 14
(fusA), 38 (tufA), 8 (gap), 6 (groEL), 37 (gyrB), 22 (recA), and 33 (rpoB). The subgroups
recognized by phylogenetic analysis within G1A cluster were G1A1, G1A2 and G1A3, obviously
the number of putative ecotypes within G1A hypothesized by simulation were much larger than 3.
Distribution of sequence divergence of MLSA data
Chapter 4: results
42
The Sphingomondaceae isolates displayed different colony colors, different temperature
preferences (between 15°C to 28°C) and also different growth rates on agar plates. In order to
assess phenotypic differences at different levels of population substructure, we tested for the
utilization of 71 sole carbon sources and the effect of 23 inhibitory substances. The distribution of
frequency of the raw value of the BiOLOG phenotypic analysis showed two peaks at
approximately 0 and 200 with a minimum at approximately 100 (Fig. 8). Therefore, all values
below were regarded as a negative reaction (i.e., no cellular respiration) whereas values above 100
were regarded as a positive physiological reaction resulting in cellular respiration.
raw data value
Fre
quen
cy
0 100 200 300 400
010
020
030
040
0
raw data value
Fre
quen
cy
0 100 200 300 400
010
020
030
040
0
Fig. 8. Histogram and density curve of the BiOLOG raw data for 94 phenotypic tests on 48 strains using
the hist () and density() functions in the R! base installation. The maximum intensity value of the
color reading that can be attained is 400. Negative processed BiOLOG values may result where the
negative control raw value exceeds the raw value obtained for individual substrates.
G1A strains did not utilize several di- or polysaccharic sugars, but their monomeric consitutents
(Fig. 9). This may suggest a lack or inactivity of glycosidic enzymes or of respective disaccharide
transporters. A further major difference to G2 and G3 is the ability of G1A strains to utilize several
additional monomeric sugars (mannose, fructose), sugar alcohols and sugar acids. G2 and G3
strains were found to be resistant to a diverse set of inhibitory substances whereas G1A strains are
mainly sensitive. The G1A strains are sensitive to the inhibitory substance rifamycin SV, but G2
and G3 strain are resistant to it (Fig. 9; 10). For another inhibitory substance, vancomycin, the
resistance pattern distribution is opposite to the results with rifamycin SV. When combining
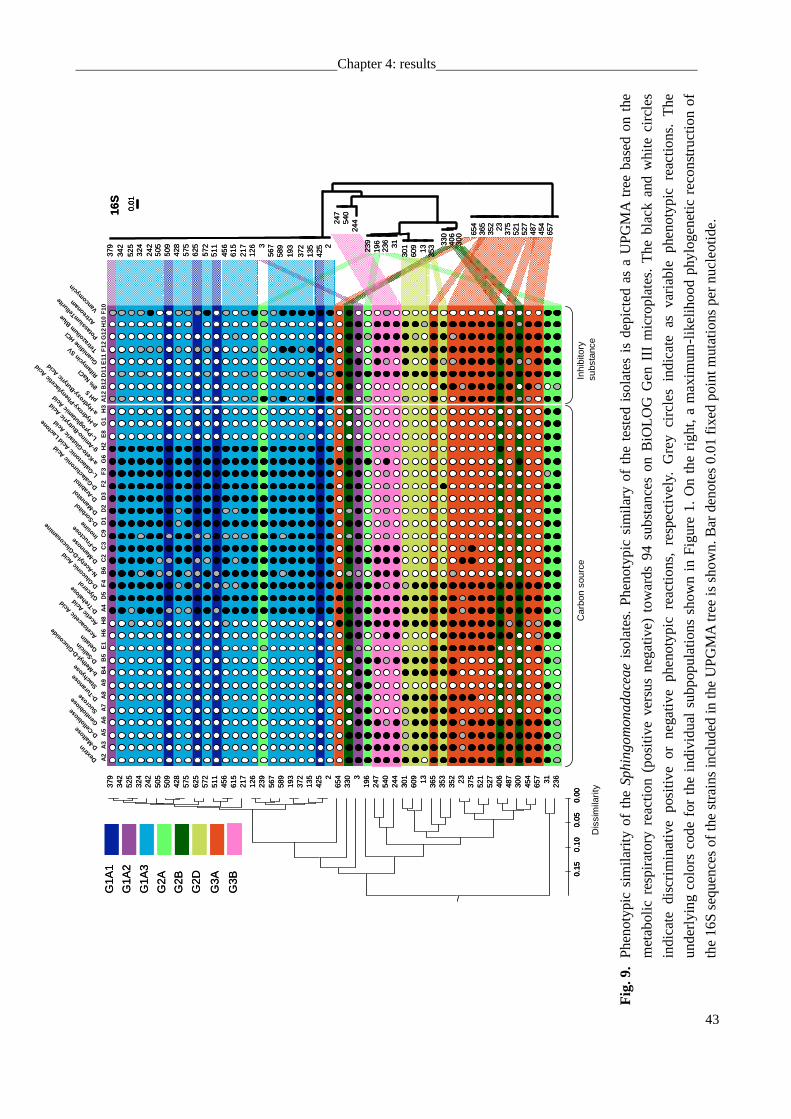
Chapter 4: results
43
Fig
. 9.
Phe
noty
pic
sim
ilarit
y of
the
Sp
hin
go
mon
ad
ace
ae
iso
late
s. P
heno
typi
c si
mila
ry o
f th
e te
sted
iso
lat
es i
s de
pict
ed a
s a
UP
GM
A t
ree
base
d on
the
met
abol
ic r
espi
rato
ry r
eact
ion
(pos
itive
ver
sus
neg
ativ
e) t
owar
ds 9
4 su
bsta
nces
on
BiO
LOG
Gen
III
mic
rop
late
s. T
he b
lack
and
whi
te c
ircle
s
indi
cate
dis
crim
inat
ive
posi
tive
or n
egat
ive
phen
otyp
ic r
eact
ions
, re
spec
tivel
y. G
rey
circ
les
indi
cate
as
vari
able
phe
noty
pic
reac
tions
. T
he
unde
rlyin
g co
lors
cod
e fo
r th
e in
divi
dual
sub
popu
latio
ns s
how
n in
Fig
ure
1. O
n th
e ri
ght,
a m
axim
um-li
kelih
ood
phyl
ogen
etic
rec
onst
ruct
ion
of
the
16S
seq
uenc
es o
f th
e st
rain
s in
clud
ed in
the
UP
GM
A t
ree
is s
how
n. B
ar d
enot
es 0
.01
fixed
poi
nt m
utat
ions
per
nuc
leot
ide.
379
342
525
324
242
505
509
428
575
625
572
511
456
615
217
126
239
567
589
193
372
135
425 2
654
330 3
196
247
540
244
301
609 13
365
353
352 23
375
521
527
406
487
300
454
657 31
236
379
342
525
324
242
505
509
428
575
625
572
511
456
615
217
126
239
567
589
193
372
135
425 2
654
330 3
196
247
540
244
301
609 13
365
353
352 23
375
521
527
406
487
300
454
657 31
236
0.0
00.
050
.10
0.15
0.0
00.
050
.10
0.15
0.0
00.
050
.10
0.15
G3B
G3A
G2D
G2A
G2B
G1A
3
G1A
2
G1A
1
G3B
G3A
G2D
G2A
G2B
G1A
3
G1A
2
G1A
1
Car
bon
sour
ceIn
hibi
tory
subs
tanc
eD
issi
mila
rity
0.0
1
16S
0.0
10.
01
16S
A2
A3
A5
A6
A7
A8
A9
B4
B5
E1
H6
H8
A4
D5
F4
B6
C2
C3
C9
D1
D2
D3
F2
F3
G6
H2
E8
G1
H3
A12
B12
D11
E11
F12
G12
H10
F10
A2
A3
A5
A6
A7
A8
A9
B4
B5
E1
H6
H8
A4
D5
F4
B6
C2
C3
C9
D1
D2
D3
F2
F3
G6
H2
E8
G1
H3
A12
B12
D11
E11
F12
G12
H10
F10
A2
A3
A5
A6
A7
A8
A9
B4
B5
E1
H6
H8
A4
D5
F4
B6
C2
C3
C9
D1
D2
D3
F2
F3
G6
H2
E8
G1
H3
A12
B12
D11
E11
F12
G12
H10
F10
572
567
525
324
126 2
372
456
428
505
575
589
625
511
242
615
193
509
425
135
217
342 3
379
540
247
244
609
301
3531323
9
236
196 31 30
040
633
0 365
352 23
375
454
657
654
487
521
527
572
567
525
324
126 2
372
456
428
505
575
589
625
511
242
615
193
509
425
135
217
342 3
379
540
247
244
609
301
3531323
9
236
196 31 30
040
633
0 365
352 23
375
454
657
654
487
521
527
Dextri
n
Aztreo
nam
D-Malt
ose D-Cell
obiose
Gentio
biose
Sucrose D-T
uranos
e
Stach
yose
b-Met
hyl-D-G
luco
side
D-Sali
cin Gelatin
Aceto
acet
icAcid
Acetic
Acid
D-Tre
halose
Glycer
ol D-Glu
coni
cAcid
N-Ace
tyl-D
-Glu
cosa
min
e
D-Man
noseD-F
ruct
ose
Inosin
e D-Sor
bitol
D-Man
nito
lD-A
rabito
lD-G
alact
uronic
Acid
L-Gala
ctonic
AcidLac
tone
a-Ket
o-Glu
taric
Acid
g-Am
ino-
Butryric
Acid
L-Pyr
ogluta
mic
Acid
p-Hyd
roxy
-Phen
ylace
ticAcid
a-Hyd
roxy
-But
yric
Acid
pH5
8% N
aCl
Rifam
ycin
SV
Guanid
ine
HCl
Tetra
zoliu
mBlu
e
Potass
ium
Tellu
rite
A2
A3
A5
A6
A7
A8
A9
B4
B5
E1
H6
H8
A4
D5
F4
B6
C2
C3
C9
D1
D2
D3
F2
F3
G6
H2
E8
G1
H3
A12
B12
D11
E11
F12
G12
H10
F10Van
com
ycin
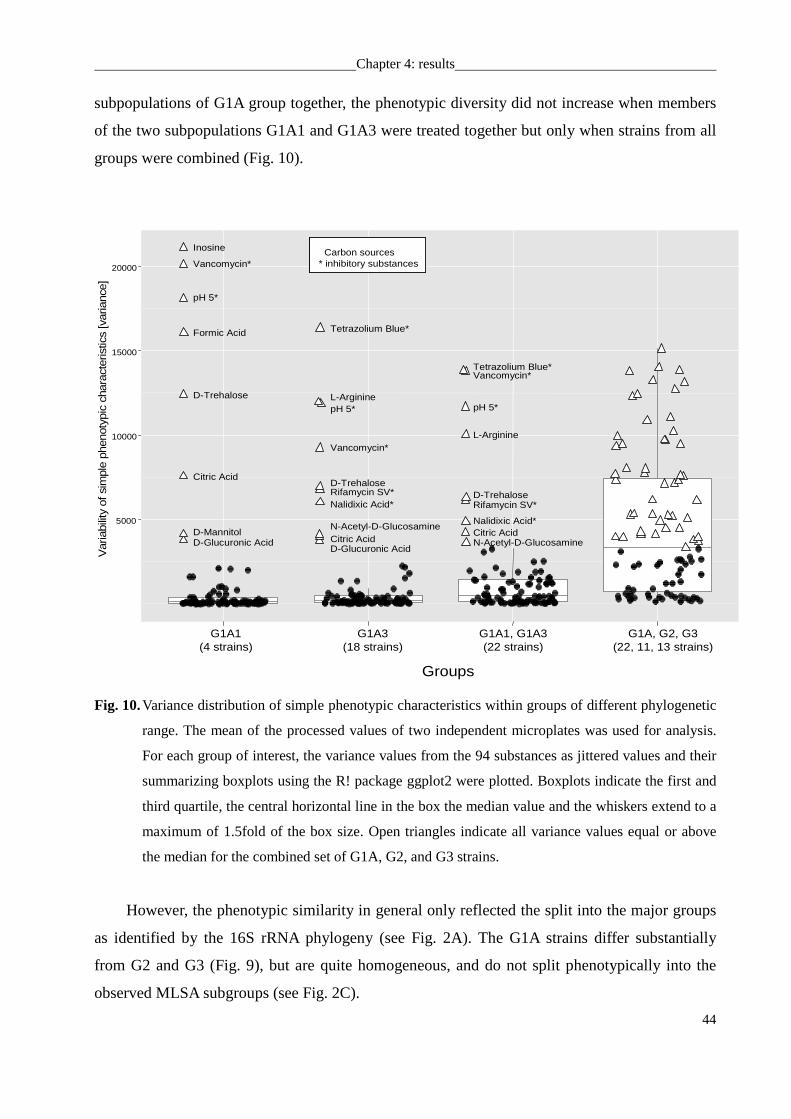
Chapter 4: results
44
subpopulations of G1A group together, the phenotypic diversity did not increase when members
of the two subpopulations G1A1 and G1A3 were treated together but only when strains from all
groups were combined (Fig. 10).
Groups
5000
10000
15000
20000
G1A1(4 strains)
G1A3(18 strains)
G1A1, G1A3(22 strains)
G1A, G2, G3(22, 11, 13 strains)
Var
iabi
lity
of s
impl
e ph
enot
ypic
cha
ract
eris
tics
[var
ianc
e]
Inosine
Vancomycin*
pH 5*
Formic Acid
D-Trehalose
Citric Acid
D-MannitolD-Glucuronic Acid
N-Acetyl-D-Glucosamine
Tetrazolium Blue*
L-Arginine pH 5*
Vancomycin*
D-TrehaloseRifamycin SV*Nalidixic Acid*
D-Glucuronic AcidCitric Acid
Tetrazolium Blue*Vancomycin*
pH 5*
Rifamycin SV*D-Trehalose
Nalidixic Acid*Citric AcidN-Acetyl-D-Glucosamine
L-Arginine
Carbon sources* inhibitory substances
Carbon sources* inhibitory substances
Fig. 10. Variance distribution of simple phenotypic characteristics within groups of different phylogenetic
range. The mean of the processed values of two independent microplates was used for analysis.
For each group of interest, the variance values from the 94 substances as jittered values and their
summarizing boxplots using the R! package ggplot2 were plotted. Boxplots indicate the first and
third quartile, the central horizontal line in the box the median value and the whiskers extend to a
maximum of 1.5fold of the box size. Open triangles indicate all variance values equal or above
the median for the combined set of G1A, G2, and G3 strains.
However, the phenotypic similarity in general only reflected the split into the major groups
as identified by the 16S rRNA phylogeny (see Fig. 2A). The G1A strains differ substantially
from G2 and G3 (Fig. 9), but are quite homogeneous, and do not split phenotypically into the
observed MLSA subgroups (see Fig. 2C).
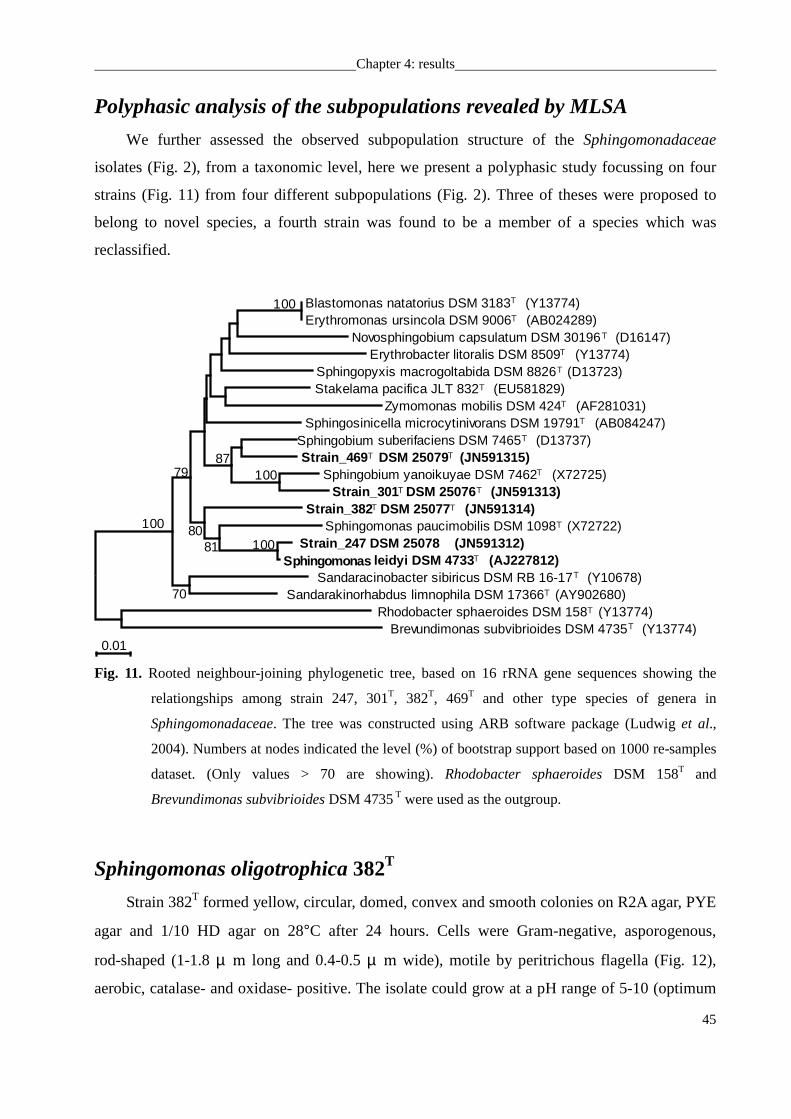
Chapter 4: results
45
Polyphasic analysis of the subpopulations revealed by MLSA
We further assessed the observed subpopulation structure of the Sphingomonadaceae
isolates (Fig. 2), from a taxonomic level, here we present a polyphasic study focussing on four
strains (Fig. 11) from four different subpopulations (Fig. 2). Three of theses were proposed to
belong to novel species, a fourth strain was found to be a member of a species which was
reclassified.
leidyi DSM 4733 (AJ227812)100
100
100
70
81
100 80
8779
0.01
Blastomonas natatorius DSM 3183 (Y13774)Erythromonas ursincola DSM 9006 (AB024289)
Novosphingobium capsulatum DSM 30196 (D16147)Erythrobacter litoralis DSM 8509 (Y13774)
Sphingopyxis macrogoltabida DSM 8826 (D13723)Stakelama pacifica JLT 832 (EU581829)
Zymomonas mobilis DSM 424 (AF281031)Sphingosinicella microcytinivorans DSM 19791 (AB084247)
suberifaciens DSM 7465 (D13737)Strain_469 DSM 25079 (JN591315)
Sphingobium yanoikuyae DSM 7462 (X72725)Strain_301 DSM 25076 (JN591313)
Strain_382 DSM 25077 (JN591314)Sphingomonas paucimobilis DSM 1098 (X72722)
Strain_247 DSM 25078 (JN591312)
Sandaracinobacter sibiricus DSM RB 16-17 (Y10678)Sandarakinorhabdus limnophila DSM 17366 (AY902680)
Rhodobacter sphaeroides DSM 158 (Y13774)Brevundimonas subvibrioides DSM 4735 (Y13774)
T
T
T
T
T
T
TT
T T
T
T
T
T
T
T
T
T
T
T
T
T
Sphingobium
Sphingomonas
Fig. 11. Rooted neighbour-joining phylogenetic tree, based on 16 rRNA gene sequences showing the
relationgships among strain 247, 301T, 382T, 469T and other type species of genera in
Sphingomonadaceae. The tree was constructed using ARB software package (Ludwig et al.,
2004). Numbers at nodes indicated the level (%) of bootstrap support based on 1000 re-samples
dataset. (Only values > 70 are showing). Rhodobacter sphaeroides DSM 158T and
Brevundimonas subvibrioides DSM 4735 T were used as the outgroup.
Sphingomonas oligotrophica 382T
Strain 382T formed yellow, circular, domed, convex and smooth colonies on R2A agar, PYE
agar and 1/10 HD agar on 28°C after 24 hours. Cells were Gram-negative, asporogenous,
rod-shaped (1-1.8 µ m long and 0.4-0.5 µ m wide), motile by peritrichous flagella (Fig. 12),
aerobic, catalase- and oxidase- positive. The isolate could grow at a pH range of 5-10 (optimum
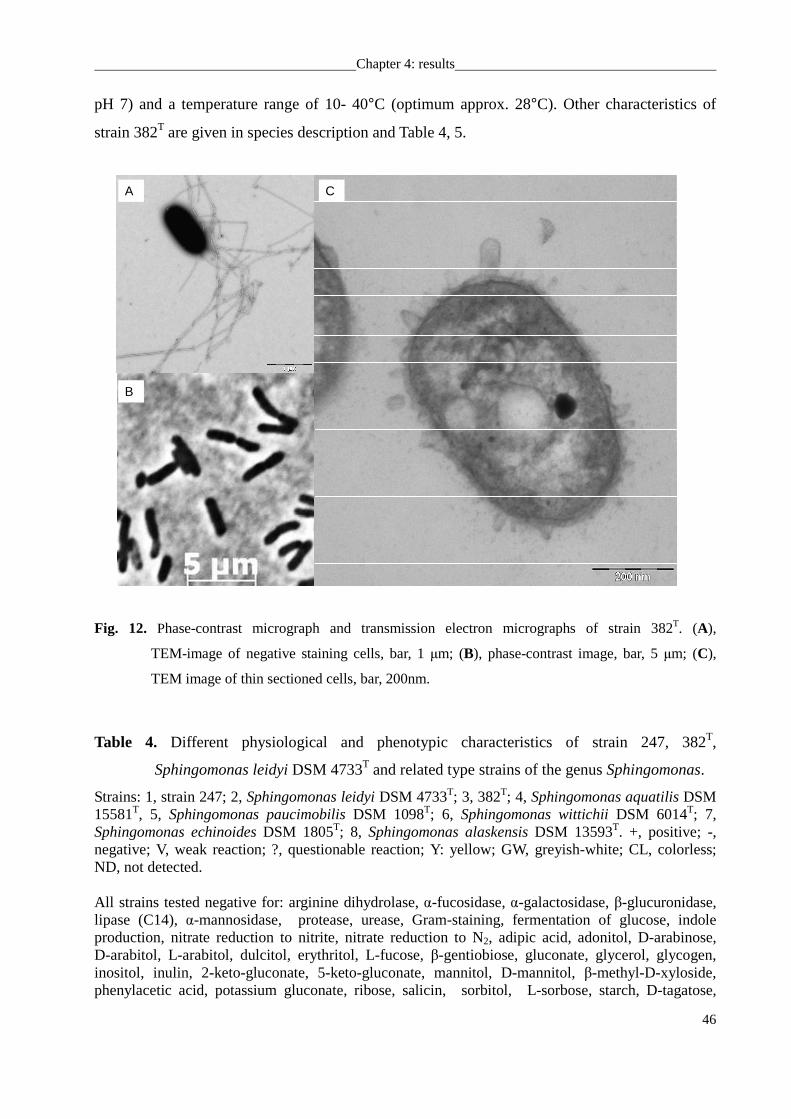
Chapter 4: results
46
pH 7) and a temperature range of 10- 40°C (optimum approx. 28°C). Other characteristics of
strain 382T are given in species description and Table 4, 5.
A C
B
Fig. 12. Phase-contrast micrograph and transmission electron micrographs of strain 382T. (A),
TEM-image of negative staining cells, bar, 1 µm; (B), phase-contrast image, bar, 5 µm; (C),
TEM image of thin sectioned cells, bar, 200nm.
Table 4. Different physiological and phenotypic characteristics of strain 247, 382T,
Sphingomonas leidyi DSM 4733T and related type strains of the genus Sphingomonas.
Strains: 1, strain 247; 2, Sphingomonas leidyi DSM 4733T; 3, 382T; 4, Sphingomonas aquatilis DSM 15581T, 5, Sphingomonas paucimobilis DSM 1098T; 6, Sphingomonas wittichii DSM 6014T; 7, Sphingomonas echinoides DSM 1805T; 8, Sphingomonas alaskensis DSM 13593T. +, positive; -, negative; V, weak reaction; ?, questionable reaction; Y: yellow; GW, greyish-white; CL, colorless; ND, not detected. All strains tested negative for: arginine dihydrolase, α-fucosidase, α-galactosidase, β-glucuronidase, lipase (C14), α-mannosidase, protease, urease, Gram-staining, fermentation of glucose, indole production, nitrate reduction to nitrite, nitrate reduction to N2, adipic acid, adonitol, D-arabinose, D-arabitol, L-arabitol, dulcitol, erythritol, L-fucose, β-gentiobiose, gluconate, glycerol, glycogen, inositol, inulin, 2-keto-gluconate, 5-keto-gluconate, mannitol, D-mannitol, β-methyl-D-xyloside, phenylacetic acid, potassium gluconate, ribose, salicin, sorbitol, L-sorbose, starch, D-tagatose,
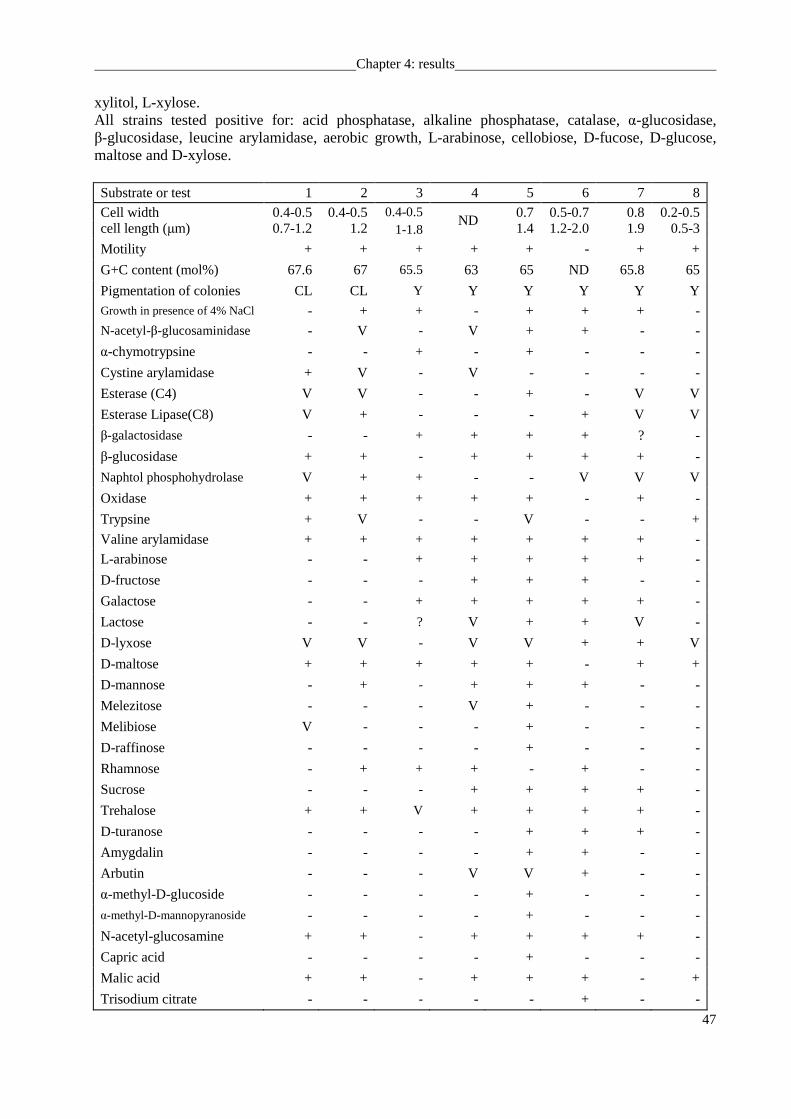
Chapter 4: results
47
xylitol, L-xylose. All strains tested positive for: acid phosphatase, alkaline phosphatase, catalase, α-glucosidase, β-glucosidase, leucine arylamidase, aerobic growth, L-arabinose, cellobiose, D-fucose, D-glucose, maltose and D-xylose. Substrate or test 1 2 3 4 5 6 7 8
0.4-0.5 Cell width cell length (µm)
0.4-0.5 0.7-1.2
0.4-0.5 1.2 1-1.8
ND 0.7 1.4
0.5-0.7 1.2-2.0
0.8 1.9
0.2-0.5 0.5-3
Motility + + + + + - + +
G+C content (mol%) 67.6 67 65.5 63 65 ND 65.8 65
Pigmentation of colonies CL CL Y Y Y Y Y Y Growth in presence of 4% NaCl - + + - + + + -
N-acetyl-β-glucosaminidase - V - V + + - -
α-chymotrypsine - - + - + - - -
Cystine arylamidase + V - V - - - -
Esterase (C4) V V - - + - V V
Esterase Lipase(C8) V + - - - + V V
β-galactosidase - - + + + + ? -
β-glucosidase + + - + + + + -
Naphtol phosphohydrolase V + + - - V V V
Oxidase + + + + + - + -
Trypsine + V - - V - - +
Valine arylamidase + + + + + + + -
L-arabinose - - + + + + + -
D-fructose - - - + + + - -
Galactose - - + + + + + -
Lactose - - ? V + + V -
D-lyxose V V - V V + + V
D-maltose + + + + + - + +
D-mannose - + - + + + - -
Melezitose - - - V + - - -
Melibiose V - - - + - - -
D-raffinose - - - - + - - -
Rhamnose - + + + - + - -
Sucrose - - - + + + + -
Trehalose + + V + + + + -
D-turanose - - - - + + + -
Amygdalin - - - - + + - -
Arbutin - - - V V + - -
α-methyl-D-glucoside - - - - + - - -
α-methyl-D-mannopyranoside - - - - + - - -
N-acetyl-glucosamine + + - + + + + -
Capric acid - - - - + - - -
Malic acid + + - + + + - +
Trisodium citrate - - - - - + - -
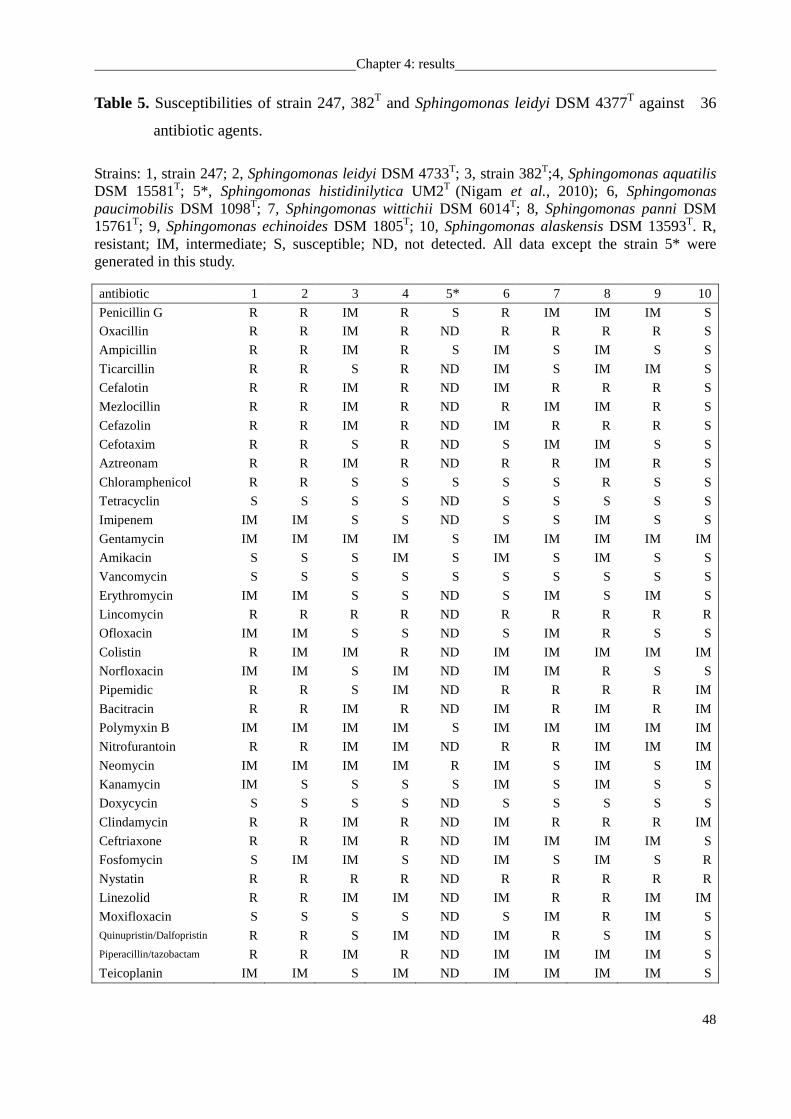
Chapter 4: results
48
Table 5. Susceptibilities of strain 247, 382T and Sphingomonas leidyi DSM 4377T against 36
antibiotic agents.
Strains: 1, strain 247; 2, Sphingomonas leidyi DSM 4733T; 3, strain 382T;4, Sphingomonas aquatilis DSM 15581T; 5*, Sphingomonas histidinilytica UM2T (Nigam et al., 2010); 6, Sphingomonas paucimobilis DSM 1098T; 7, Sphingomonas wittichii DSM 6014T; 8, Sphingomonas panni DSM 15761T; 9, Sphingomonas echinoides DSM 1805T; 10, Sphingomonas alaskensis DSM 13593T. R, resistant; IM, intermediate; S, susceptible; ND, not detected. All data except the strain 5* were generated in this study.
antibiotic 1 2 3 4 5* 6 7 8 9 10
Penicillin G R R IM R S R IM IM IM S
Oxacillin R R IM R ND R R R R S
Ampicillin R R IM R S IM S IM S S
Ticarcillin R R S R ND IM S IM IM S
Cefalotin R R IM R ND IM R R R S
Mezlocillin R R IM R ND R IM IM R S
Cefazolin R R IM R ND IM R R R S
Cefotaxim R R S R ND S IM IM S S
Aztreonam R R IM R ND R R IM R S
Chloramphenicol R R S S S S S R S S
Tetracyclin S S S S ND S S S S S
Imipenem IM IM S S ND S S IM S S
Gentamycin IM IM IM IM S IM IM IM IM IM
Amikacin S S S IM S IM S IM S S
Vancomycin S S S S S S S S S S
Erythromycin IM IM S S ND S IM S IM S
Lincomycin R R R R ND R R R R R
Ofloxacin IM IM S S ND S IM R S S
Colistin R IM IM R ND IM IM IM IM IM
Norfloxacin IM IM S IM ND IM IM R S S
Pipemidic R R S IM ND R R R R IM
Bacitracin R R IM R ND IM R IM R IM
Polymyxin B IM IM IM IM S IM IM IM IM IM
Nitrofurantoin R R IM IM ND R R IM IM IM
Neomycin IM IM IM IM R IM S IM S IM
Kanamycin IM S S S S IM S IM S S
Doxycycin S S S S ND S S S S S
Clindamycin R R IM R ND IM R R R IM
Ceftriaxone R R IM R ND IM IM IM IM S
Fosfomycin S IM IM S ND IM S IM S R
Nystatin R R R R ND R R R R R
Linezolid R R IM IM ND IM R R IM IM
Moxifloxacin S S S S ND S IM R IM S Quinupristin/Dalfopristin R R S IM ND IM R S IM S Piperacillin/tazobactam R R IM R ND IM IM IM IM S
Teicoplanin IM IM S IM ND IM IM IM IM S
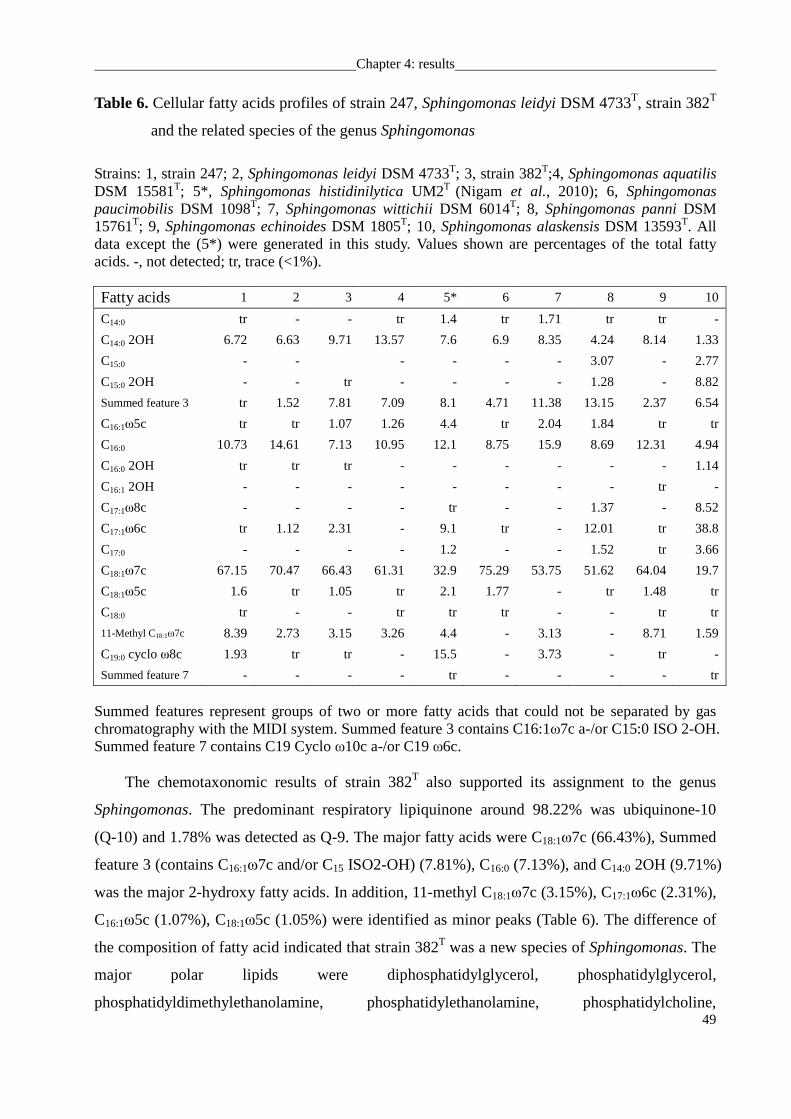
Chapter 4: results
49
Table 6. Cellular fatty acids profiles of strain 247, Sphingomonas leidyi DSM 4733T, strain 382T
and the related species of the genus Sphingomonas
Strains: 1, strain 247; 2, Sphingomonas leidyi DSM 4733T; 3, strain 382T;4, Sphingomonas aquatilis DSM 15581T; 5*, Sphingomonas histidinilytica UM2T (Nigam et al., 2010); 6, Sphingomonas paucimobilis DSM 1098T; 7, Sphingomonas wittichii DSM 6014T; 8, Sphingomonas panni DSM 15761T; 9, Sphingomonas echinoides DSM 1805T; 10, Sphingomonas alaskensis DSM 13593T. All data except the (5*) were generated in this study. Values shown are percentages of the total fatty acids. -, not detected; tr, trace (<1%).
Fatty acids 1 2 3 4 5* 6 7 8 9 10
C14:0 tr - - tr 1.4 tr 1.71 tr tr -
C14:0 2OH 6.72 6.63 9.71 13.57 7.6 6.9 8.35 4.24 8.14 1.33
C15:0 - - - - - - 3.07 - 2.77
C15:0 2OH - - tr - - - - 1.28 - 8.82
Summed feature 3 tr 1.52 7.81 7.09 8.1 4.71 11.38 13.15 2.37 6.54
C16:1ω5c tr tr 1.07 1.26 4.4 tr 2.04 1.84 tr tr
C16:0 10.73 14.61 7.13 10.95 12.1 8.75 15.9 8.69 12.31 4.94
C16:0 2OH tr tr tr - - - - - - 1.14
C16:1 2OH - - - - - - - - tr -
C17:1ω8c - - - - tr - - 1.37 - 8.52
C17:1ω6c tr 1.12 2.31 - 9.1 tr - 12.01 tr 38.8
C17:0 - - - - 1.2 - - 1.52 tr 3.66
C18:1ω7c 67.15 70.47 66.43 61.31 32.9 75.29 53.75 51.62 64.04 19.7
C18:1ω5c 1.6 tr 1.05 tr 2.1 1.77 - tr 1.48 tr
C18:0 tr - - tr tr tr - - tr tr
11-Methyl C18:1ω7c 8.39 2.73 3.15 3.26 4.4 - 3.13 - 8.71 1.59
C19:0 cyclo ω8c 1.93 tr tr - 15.5 - 3.73 - tr -
Summed feature 7 - - - - tr - - - - tr
Summed features represent groups of two or more fatty acids that could not be separated by gas chromatography with the MIDI system. Summed feature 3 contains C16:1ω7c a-/or C15:0 ISO 2-OH. Summed feature 7 contains C19 Cyclo ω10c a-/or C19 ω6c. The chemotaxonomic results of strain 382T also supported its assignment to the genus
Sphingomonas. The predominant respiratory lipiquinone around 98.22% was ubiquinone-10
(Q-10) and 1.78% was detected as Q-9. The major fatty acids were C18:1ω7c (66.43%), Summed
feature 3 (contains C16:1ω7c and/or C15 ISO2-OH) (7.81%), C16:0 (7.13%), and C14:0 2OH (9.71%)
was the major 2-hydroxy fatty acids. In addition, 11-methyl C18:1ω7c (3.15%), C17:1ω6c (2.31%),
C16:1ω5c (1.07%), C18:1ω5c (1.05%) were identified as minor peaks (Table 6). The difference of
the composition of fatty acid indicated that strain 382T was a new species of Sphingomonas. The
major polar lipids were diphosphatidylglycerol, phosphatidylglycerol,
phosphatidyldimethylethanolamine, phosphatidylethanolamine, phosphatidylcholine,
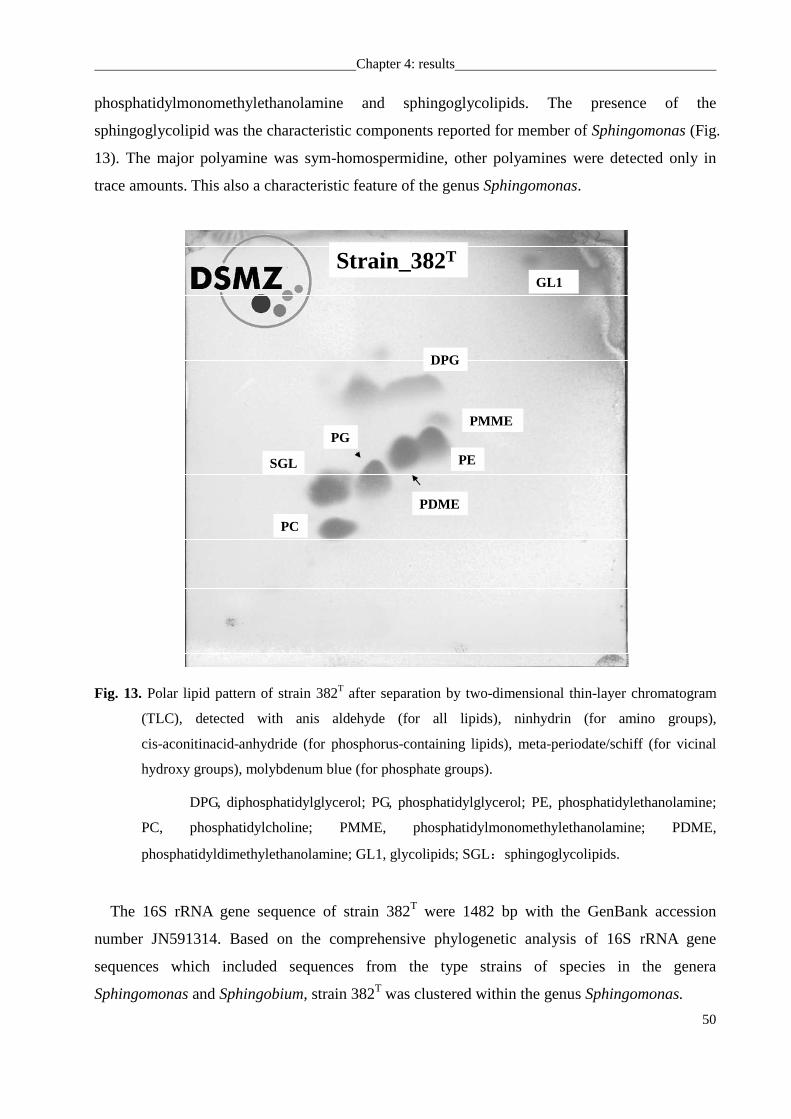
Chapter 4: results
50
phosphatidylmonomethylethanolamine and sphingoglycolipids. The presence of the
sphingoglycolipid was the characteristic components reported for member of Sphingomonas (Fig.
13). The major polyamine was sym-homospermidine, other polyamines were detected only in
trace amounts. This also a characteristic feature of the genus Sphingomonas.
Strain_382T
PG
PE
DPG
PDME
SGL
PC
GL1
PMME
Fig. 13. Polar lipid pattern of strain 382T after separation by two-dimensional thin-layer chromatogram
(TLC), detected with anis aldehyde (for all lipids), ninhydrin (for amino groups),
cis-aconitinacid-anhydride (for phosphorus-containing lipids), meta-periodate/schiff (for vicinal
hydroxy groups), molybdenum blue (for phosphate groups).
DPG, diphosphatidylglycerol; PG, phosphatidylglycerol; PE, phosphatidylethanolamine;
PC, phosphatidylcholine; PMME, phosphatidylmonomethylethanolamine; PDME,
phosphatidyldimethylethanolamine; GL1, glycolipids; SGL:sphingoglycolipids.
The 16S rRNA gene sequence of strain 382T were 1482 bp with the GenBank accession
number JN591314. Based on the comprehensive phylogenetic analysis of 16S rRNA gene
sequences which included sequences from the type strains of species in the genera
Sphingomonas and Sphingobium, strain 382T was clustered within the genus Sphingomonas.
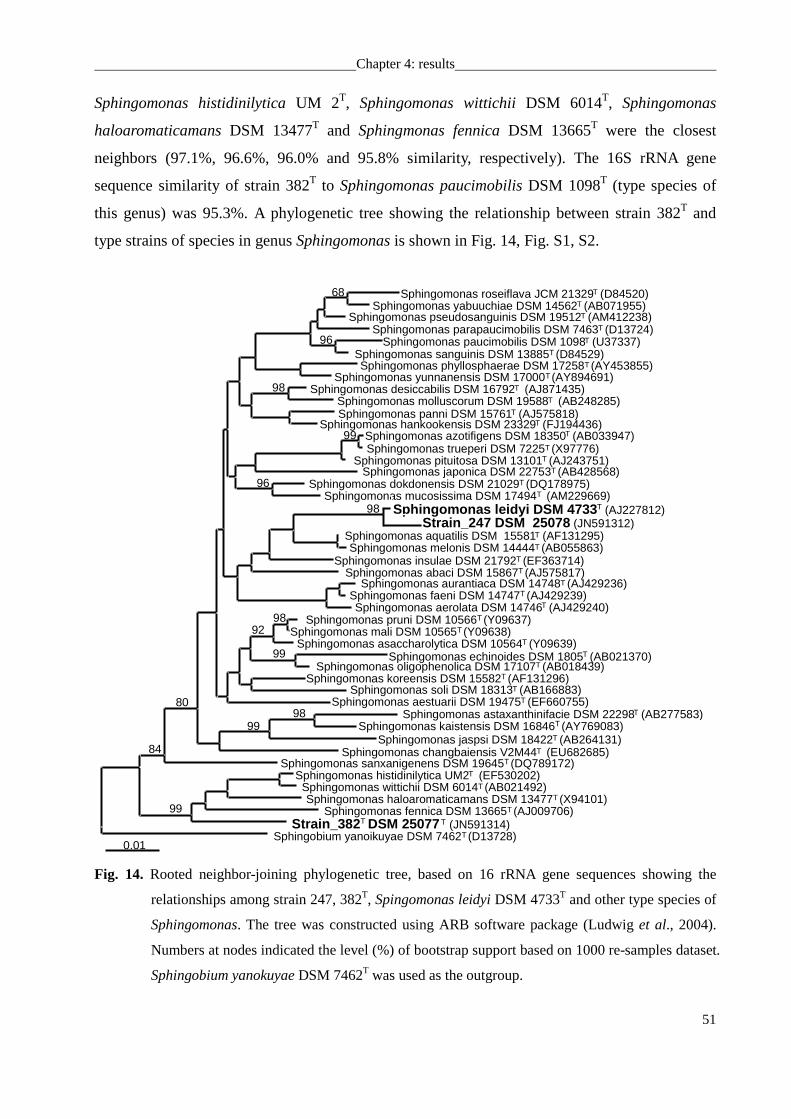
Chapter 4: results
51
Sphingomonas histidinilytica UM 2T, Sphingomonas wittichii DSM 6014T, Sphingomonas
haloaromaticamans DSM 13477T and Sphingmonas fennica DSM 13665T were the closest
neighbors (97.1%, 96.6%, 96.0% and 95.8% similarity, respectively). The 16S rRNA gene
sequence similarity of strain 382T to Sphingomonas paucimobilis DSM 1098T (type species of
this genus) was 95.3%. A phylogenetic tree showing the relationship between strain 382T and
type strains of species in genus Sphingomonas is shown in Fig. 14, Fig. S1, S2.
68
96
98
99
96
9892
99
9899
80
84
99
0.01
Sphingomonas paucimobilis DSM 1098 (U37337)Sphingomonas sanguinis DSM 13885 (D84529)
Sphingomonas pseudosanguinis DSM 19512 (AM412238)Sphingomonas parapaucimobilis DSM 7463 (D13724)
Sphingomonas roseiflava JCM 21329 (D84520)Sphingomonas yabuuchiae DSM 14562 (AB071955)
Sphingomonas phyllosphaerae DSM 17258 (AY453855)Sphingomonas yunnanensis DSM 17000 (AY894691)
Sphingomonas desiccabilis DSM 16792 (AJ871435)Sphingomonas molluscorum DSM 19588 (AB248285)Sphingomonas panni DSM 15761 (AJ575818)
Sphingomonas hankookensis DSM 23329 (FJ194436)Sphingomonas azotifigens DSM 18350 (AB033947)Sphingomonas trueperi DSM 7225 (X97776)
Sphingomonas pituitosa DSM 13101 (AJ243751)Sphingomonas japonica DSM 22753 (AB428568)
Sphingomonas dokdonensis DSM 21029 (DQ178975)Sphingomonas mucosissima DSM 17494 (AM229669)T
T
T
TT
TT
T
T
T
TT
T
T
T
T
T
T
Sphingomonas aquatilis DSM 15581 (AF131295)Sphingomonas melonis DSM 14444 (AB055863)
Sphingomonas insulae DSM 21792 (EF363714)Sphingomonas abaci DSM 15867 (AJ575817)
Sphingomonas aurantiaca DSM 14748 (AJ429236)Sphingomonas faeni DSM 14747 (AJ429239)Sphingomonas aerolata DSM 14746 (AJ429240)
Sphingomonas pruni DSM 10566 (Y09637)Sphingomonas mali DSM 10565 (Y09638)
Sphingomonas asaccharolytica DSM 10564 (Y09639)Sphingomonas echinoides DSM 1805 (AB021370)
Sphingomonas oligophenolica DSM 17107 (AB018439)Sphingomonas koreensis DSM 15582 (AF131296)
Sphingomonas soli DSM 18313 (AB166883)Sphingomonas aestuarii DSM 19475 (EF660755)
Sphingomonas astaxanthinifacie DSM 22298 (AB277583)Sphingomonas kaistensis DSM 16846 (AY769083)
Sphingomonas jaspsi DSM 18422 (AB264131)Sphingomonas changbaiensis V2M44 (EU682685)
Sphingomonas sanxanigenens DSM 19645 (DQ789172)Sphingomonas histidinilytica UM2 (EF530202)
Sphingomonas wittichii DSM 6014 (AB021492)Sphingomonas haloaromaticamans DSM 13477 (X94101)
Sphingomonas fennica DSM 13665 (AJ009706)Strain_382 DSM 25077 (JN591314)
Sphingobium yanoikuyae DSM 7462 (D13728)
TT
T
T
TT
T
T
T
T
T
T
T
T
T
T
T
T
T
T
T
T
T
T
T
T
98Strain_247 DSM 25078 (JN591312)
Sphingomonas leidyi DSM 4733 (AJ227812)T
T
Fig. 14. Rooted neighbor-joining phylogenetic tree, based on 16 rRNA gene sequences showing the
relationships among strain 247, 382T, Spingomonas leidyi DSM 4733T and other type species of
Sphingomonas. The tree was constructed using ARB software package (Ludwig et al., 2004).
Numbers at nodes indicated the level (%) of bootstrap support based on 1000 re-samples dataset.
Sphingobium yanokuyae DSM 7462T was used as the outgroup.
Chapter 4: results
52
For the comparison of strain 382T with closely related type strains, the type strain UM2T of
species Sphingomonas histidinilytica (=MTCC 9473T = CCM 7545T) could not be included.
During the course of the study, it turned out that despite the literature information (Nigam et al.,
2010), strain UM2T is not existing in the MTCC collection. Also, the characteristics of strain
UM2T obtained from the CCM collection do not match the characteristics published (Nigam et
al., 2010). Hence, the strain at CCM is probably a wrong deposit. Therefore, in this study, the
information of this strain was taken from the species description by Nigam et al. (2010). Even
the 16S rRNA gene sequence of strain 382T was 97.1% similar to S. histidinilytica UM2T, but
there were lots of differences between these two strains, the phenotypic differences like color of
the cells, oxidase reaction, resistance to different antibiotics, the fatty acids composition, polar
lipid composition suggested that strain 382T does not belong to the species S. histidinilytica but
should be proposed as a novel species. The genomic G+C content of strain 382T was 65.6 mol%.
Description of Sphingomonas oligotrophica sp. nov. Sphingomonas oligotrophica
(oligo. tro. phi. ca Gr. adj. oligos, few; Gr. adj. trophikos, nursing, tending or feeding; N.L. fem.
adj. oligotrophica, eating little, utilizing only a few growth substrates).
Colonies are yellow, circular, domed, convex on R2A agar, 1:10 diluted HD agar after 24
hours incubation. Cells are Gram-negative, asporogenous, rod-shaped,1-1.8 µ m long and 0.4-0.5
µ m wide, motile by peritrichous flagella, aerobic, catalase- and oxidase- positive. The isolate
can grow at pH values between 5 and 10 (optimum pH 7) and temperatures between 10 and 40°C
(optimum approx. 28°C). Nitrate is not reduced; produces acid phosphatase, alkaline
phosphatase, α-chymotrypsine, esculin, β-galactosidase, α-glucosidase, β- glucosidase, leucine
arylamidase, valine arylamidase are hydrolysed. Naphthol-AS-BI-phosphohydrolase, D-glucose,
and arabinose, L-arabinose, cellobiose, esculin, D-fucose, galactose, maltose, rhamnose,
trehalose, D-xylose are utilized and lactose, starch are weakly utilized. Cells are sensitive
(inhibition zones >30 mm) to ticarcillin (75 µg per disk), cefotaxim (30), chloramphenicol (30),
tetracyclin (30), imipenem (10), amikacin (30), vancomycin (30), erythromycin (15), ofloxacin
(5), norfloxacin (10), pipemidic (20), kanamycin (30), doxycycin (30), moxifloxacin (5),
quinupristin/dalfopristin (15), teicoplanin (30); resistant to lincomycin (15) and nystatin (100).
The Q-10 (98.22%) is the major respiratory quinone. The major fatty acids are C18:1ω7c
(66.43%), summed feature 3 (contains C16:1ω7c and/or C15 ISO2-OH) (7.81%), C16:0 (7.13%),
and C14:0 2OH (9.71%) is the major 2-hydroxy fatty acids. The major polar lipids are
diphosphatidylglycerol, phosphatidylglycerol, phosphatidyldimethylethanolamine,
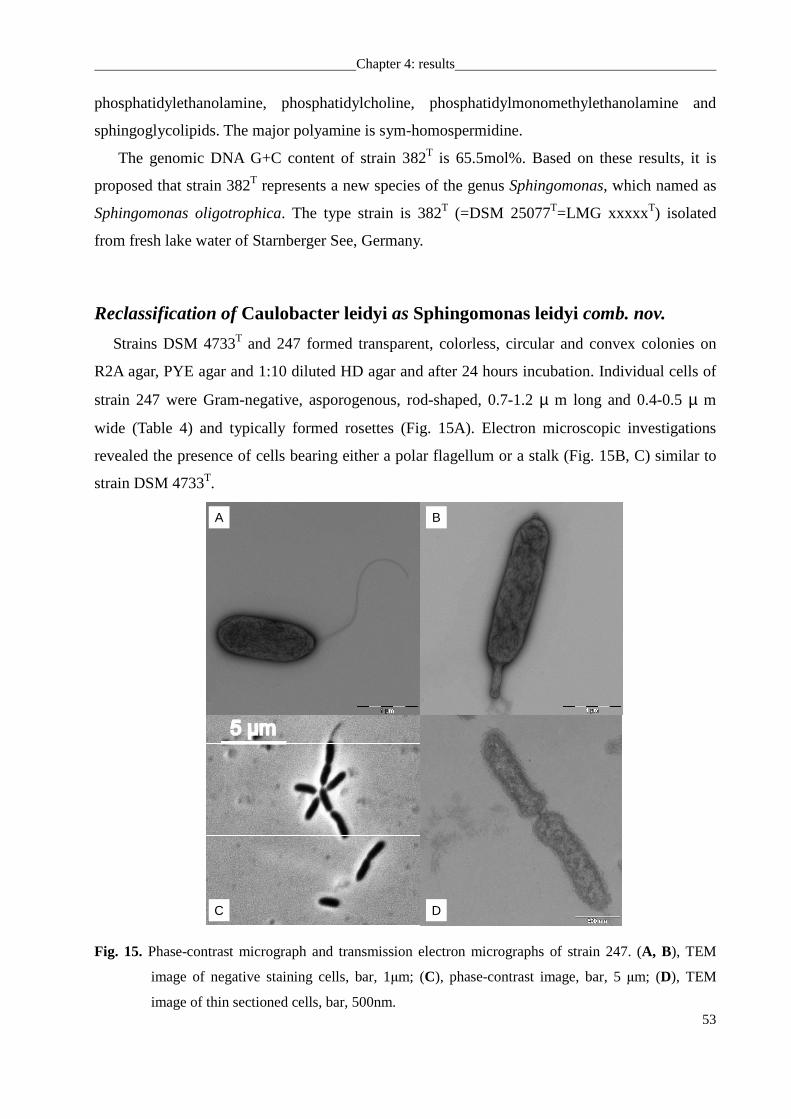
Chapter 4: results
53
phosphatidylethanolamine, phosphatidylcholine, phosphatidylmonomethylethanolamine and
sphingoglycolipids. The major polyamine is sym-homospermidine.
The genomic DNA G+C content of strain 382T is 65.5mol%. Based on these results, it is
proposed that strain 382T represents a new species of the genus Sphingomonas, which named as
Sphingomonas oligotrophica. The type strain is 382T (=DSM 25077T=LMG xxxxxT) isolated
from fresh lake water of Starnberger See, Germany.
Reclassification of Caulobacter leidyi as Sphingomonas leidyi comb. nov.
Strains DSM 4733T and 247 formed transparent, colorless, circular and convex colonies on
R2A agar, PYE agar and 1:10 diluted HD agar and after 24 hours incubation. Individual cells of
strain 247 were Gram-negative, asporogenous, rod-shaped, 0.7-1.2 µ m long and 0.4-0.5 µ m
wide (Table 4) and typically formed rosettes (Fig. 15A). Electron microscopic investigations
revealed the presence of cells bearing either a polar flagellum or a stalk (Fig. 15B, C) similar to
strain DSM 4733T.
A
C
B
D
Fig. 15. Phase-contrast micrograph and transmission electron micrographs of strain 247. (A, B), TEM
image of negative staining cells, bar, 1µm; (C), phase-contrast image, bar, 5 µm; (D), TEM
image of thin sectioned cells, bar, 500nm.
Chapter 4: results
54
Based on the nearly complete (1493 bp) 16S rRNA gene sequence of strain 247 and the
available (1443 nt long) 16S rRNA gene sequence of strain DSM 4733T, our phylogenetic
analysis of all dimorphic prosthecate Alphaproteobacteria and the type strains of
Sphingomonadaceae type species placed strains DSM 4733T and 247 unambigously within the
family Sphingomonadaceae (Yabuuchi et al., 1990) (Fig. 16); results of maximum likelihood and
maximimum parsimony analyses were very similar and hence are not shown). The sequence
similarity of the 16S rRNA genes of strains DSM 4733T and 247 was 99.6%. Within the
Sphingomonadaceae, Sphingomonas aquatilis DSM 15581T was identified as the
phylogenetically closest relative with a sequence similarity of 98.1 % to strain DSM 4733T and
97.7 % to strain 247. Sequence similarity with Sphingomonas paucimobilis DSM 1098T (type
strain of type species of genus Sphingomonas) was 94.5%. The 16S rRNA gene sequences were
distantly related to that of the species of genus Caulobacter, the largest nucleotide similarity was
87.9% (Fig. 16). Both 16S rRNA gene sequences also include all 7 signature sequences of
Sphingomonadaceae. Cells were aerobic, catalase- and oxidase-positive and motile by the single
polar flagellum. The novel isolate strain 247 grew at pH values between 5 and 10 (optimum, pH
7) and temperatures between 10 and 40°C (optimum, 28°C) (Table 4). Both strains did not
reduce nitrate but were capable of using esculin, glucose, N-acetyl-glucosamine, maltose,
L-arabinose, D-xylose, D-glucose, N-acetyl-glucosamine, cellobiose, trehalose and malic acid.
Melibiose, β-gentiobiose and D-lyxose were weakly utilized. They produced alkaline
phosphatase, leucine arylamidase, valine arylamidase, cystine arylamidase, trypsin, acid
phosphatase, naphthol-AS-BI-phosphohydrolase, α-glucosidase, β-glucosidase. Cells of strains
DSM 4733T and 247 were sensitive (inhibition zones >30 mm) to tetracyclin, amikacin,
vancomycin, doxycycin, fosfomycin, moxifloxacin and resistant to penicillin G, oxacillin,
ampicillin, ticarcillin, cefalotin, mezlocillin, cefazolin, cefotaxim, sztreonam, chloramphenicol,
lincomycin, colistin, pipemidic, bacitracin, nitrofurantoin, clindamycin, ceftriaxone, nystatin,
linezolid, quinupristin/dalfopristin, and piperacillin/tazobactam. Additional characteristics are
listed in the species description, Table 4 and Table 5.
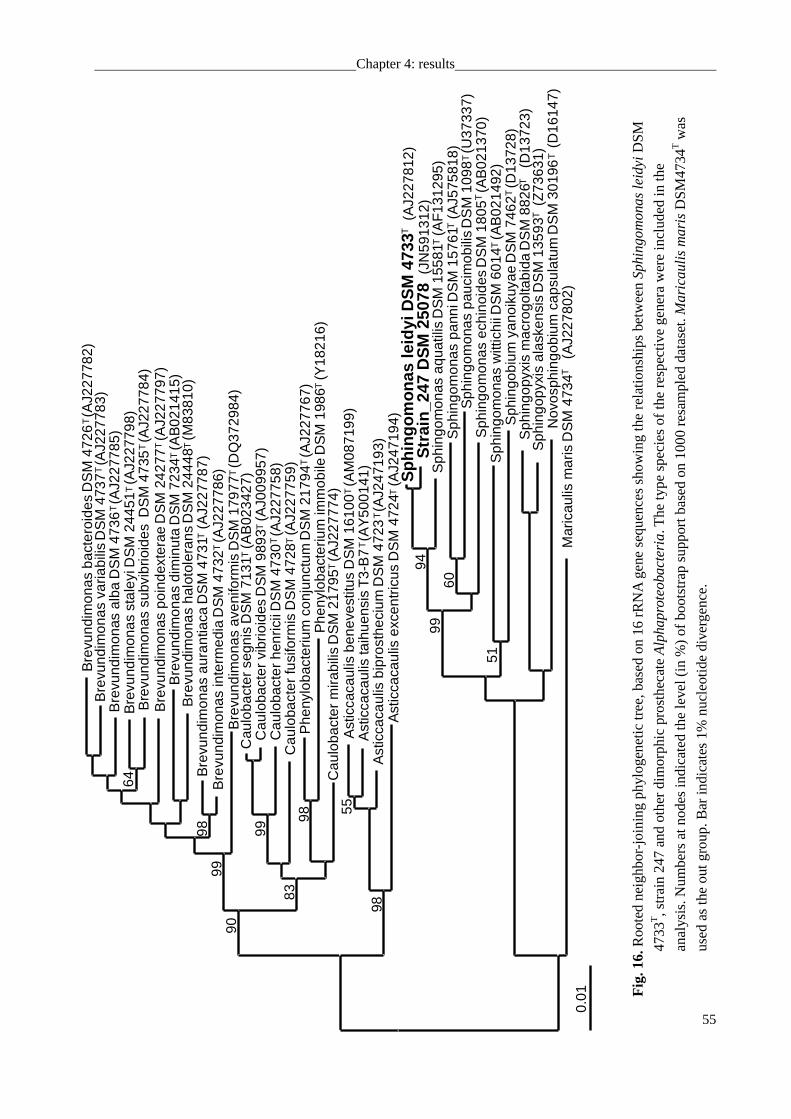
Chapter 4: results
55
98 99
98
99
83
90
98
9499
Sph
ingo
pyxi
s m
acro
golta
bida
DS
M 8
826
(D
1372
3)S
phin
gopy
xis
alas
kens
is D
SM
135
93
(Z73
631)
Nov
osph
ingo
bium
cap
sula
tum
DS
M 3
0196
(D
1614
7)M
aric
aulis
mar
is D
SM
473
4
(AJ2
2780
2)0.
01
Bre
vund
imon
as b
acte
roid
es D
SM
472
6 (
AJ2
2778
2)T
Bre
vund
imon
as a
lba
DS
M 4
736
(A
J227
785)
Bre
vund
imon
as p
oind
exte
rae
DS
M 2
4277
(A
J227
797)
Bre
vund
imon
as s
tale
yi D
SM
244
51 (
AJ2
2779
8)B
revu
ndim
onas
sub
vibr
ioid
es D
SM
473
5 (
AJ2
2778
4)
Bre
vund
imon
as v
aria
bilis
DS
M 4
737
(A
J227
783)
Bre
vund
imon
as d
imin
uta
DS
M 7
234
(A
B02
1415
)B
revu
ndim
onas
hal
otol
eran
s D
SM
244
48 (
M83
810)
TT
T
T
TT
T
Bre
vund
imon
as in
term
edia
DS
M 4
732
(A
J227
786)
Bre
vund
imon
as a
uran
tiaca
DS
M 4
731
(A
J227
787)
Bre
vund
imon
as a
veni
form
is D
SM
179
77 (
DQ
3729
84)
T
T
T
Phe
nylo
bact
eriu
m c
onju
nctu
m D
SM
217
94 (
AJ2
2776
7)T
Phe
nylo
bact
eriu
m im
mob
ile D
SM
198
6 (
Y18
216)
T
Cau
loba
cter
seg
nis
DS
M 7
131
(A
B02
3427
)C
aulo
bact
er v
ibrio
ides
DS
M 9
893
(A
J009
957)
Cau
loba
cter
hen
ricii
DS
M 4
730
(A
J227
758)
Cau
loba
cter
fusi
form
is D
SM
472
8 (
AJ2
2775
9)
Cau
loba
cter
mira
bilis
DS
M 2
1795
(A
J227
774)
Ast
icca
caul
is b
enev
estit
us D
SM
161
00 (
AM
0871
99)
Ast
icca
caul
is ta
ihue
nsis
T3-
B7
(A
Y50
0141
)A
stic
caca
ulis
bip
rost
heci
um D
SM
472
3 (
AJ2
4719
3)A
stic
caca
ulis
exc
entr
icus
DS
M 4
724
(A
J247
194)
T
T
T T
T
T
T
T
T
Str
ain
_247
DS
M 2
5078
(JN
5913
12)
Sp
hin
go
mo
nas
leid
yi
D
SM
473
3(A
J227
812)
Sph
ingo
mon
as a
quat
ilis
DS
M 1
5581
(A
F13
1295
)
Sph
ingo
mon
as p
auci
mob
ilis
DS
M 1
098
(U
3733
7)
T
T
T
Sph
ingo
mon
as w
ittic
hii D
SM
601
4 (
AB
0214
92)
TS
phin
gom
onas
ech
inoi
des
DS
M 1
805
(A
B02
1370
)T
Sph
ingo
mon
as p
anni
DS
M 1
5761
(A
J575
818)
T
Sph
ingo
bium
yan
oiku
yae
DS
M 7
462
(D
1372
8)T
TT
TT
64
55
51
60
Fig
. 16.
Roo
ted
neig
hbor
-join
ing
phyl
ogen
etic
tree
, bas
ed o
n 1
6 rR
NA
gen
e se
quen
ces
show
ing
the
rela
tions
hips
bet
wee
n Sp
hin
go
mo
nas
leid
yi DS
M
4733
T, s
trai
n 24
7 an
d ot
her
dim
orph
ic p
rost
heca
te A
lpha
pro
teo
bact
eria. T
he ty
pe s
peci
es o
f th
e re
spec
tive
gene
ra w
ere
incl
uded
in th
e
anal
ysis
. Num
bers
at
node
s in
dica
ted
the
leve
l (in
%
) of
boo
tstr
ap s
uppo
rt b
ased
on
1000
res
ampl
ed d
atas
et. M
arica
ulis
ma
ris D
SM
4734
T w
as
used
as
the
out
grou
p. B
ar in
dica
tes
1% n
ucle
otid
e di
verg
ence
.
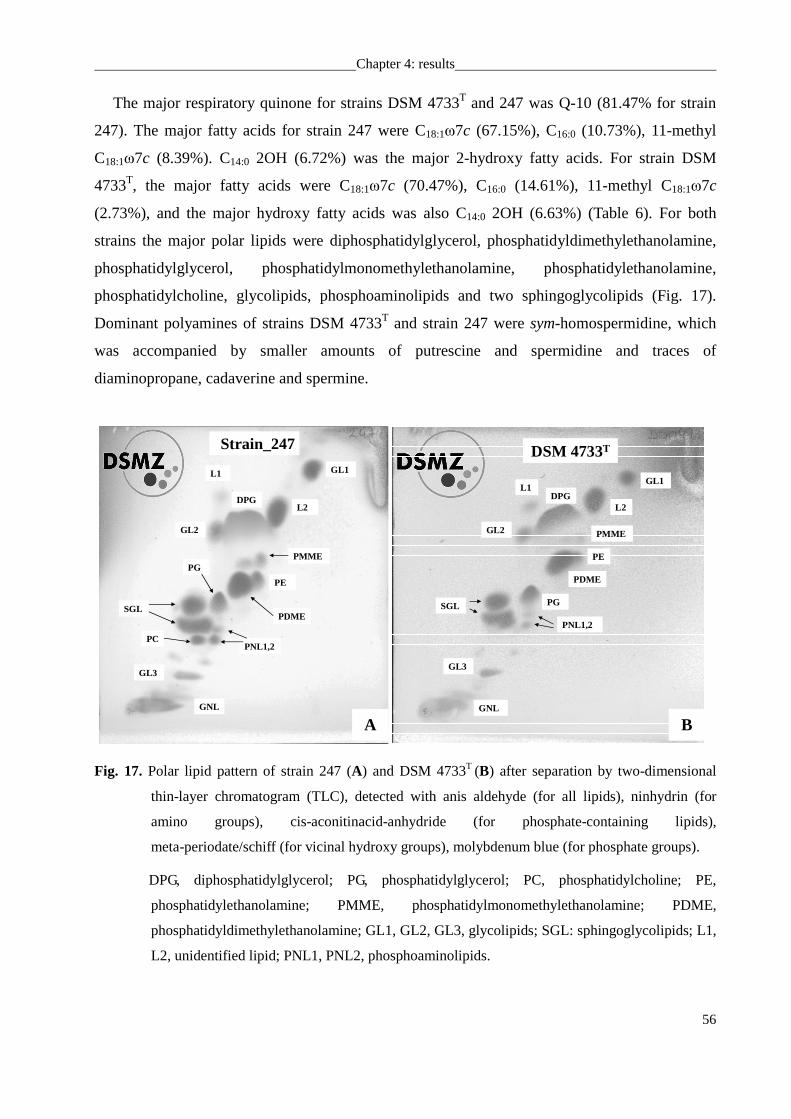
Chapter 4: results
56
The major respiratory quinone for strains DSM 4733T and 247 was Q-10 (81.47% for strain
247). The major fatty acids for strain 247 were C18:1ω7c (67.15%), C16:0 (10.73%), 11-methyl
C18:1ω7c (8.39%). C14:0 2OH (6.72%) was the major 2-hydroxy fatty acids. For strain DSM
4733T, the major fatty acids were C18:1ω7c (70.47%), C16:0 (14.61%), 11-methyl C18:1ω7c
(2.73%), and the major hydroxy fatty acids was also C14:0 2OH (6.63%) (Table 6). For both
strains the major polar lipids were diphosphatidylglycerol, phosphatidyldimethylethanolamine,
phosphatidylglycerol, phosphatidylmonomethylethanolamine, phosphatidylethanolamine,
phosphatidylcholine, glycolipids, phosphoaminolipids and two sphingoglycolipids (Fig. 17).
Dominant polyamines of strains DSM 4733T and strain 247 were sym-homospermidine, which
was accompanied by smaller amounts of putrescine and spermidine and traces of
diaminopropane, cadaverine and spermine.
Strain_247
PG
PE
DPG
PDMESGL
PNL1,2PC
GL1
GL3
L1
L2
GL2
PMME
GNL
PG
DPG
SGL
PNL1,2
GL2
GL3
L1
PMME
GNL
L2
GL1
PE
PDME
DSM 4733T
A B
Fig. 17. Polar lipid pattern of strain 247 (A) and DSM 4733T (B) after separation by two-dimensional
thin-layer chromatogram (TLC), detected with anis aldehyde (for all lipids), ninhydrin (for
amino groups), cis-aconitinacid-anhydride (for phosphate-containing lipids),
meta-periodate/schiff (for vicinal hydroxy groups), molybdenum blue (for phosphate groups).
DPG, diphosphatidylglycerol; PG, phosphatidylglycerol; PC, phosphatidylcholine; PE,
phosphatidylethanolamine; PMME, phosphatidylmonomethylethanolamine; PDME,
phosphatidyldimethylethanolamine; GL1, GL2, GL3, glycolipids; SGL: sphingoglycolipids; L1,
L2, unidentified lipid; PNL1, PNL2, phosphoaminolipids.
Chapter 4: results
57
Corroborating the close phylogenetic relationship to Sphingomonas aquatilis, the 16S rRNA
gene sequences of DSM 4733T and strain 247 include all seven signature sequences previously
determined for the genus Sphingomonas and contain sym-homospermidine as the dominant
polyamine similar to other species of this genus (Takeuchi et al., 2001). The affiliation with the
Sphingomonadaceae is also commensurate with the fatty acid patterns and polar lipid
composition of the two strains. Characteristics that distinguish strains DSM 4733T and strain 247
from most other Sphingomonadaceae include the presence of cystine arylamidase (variable in
DSMZ 4733T), absence of β-galactosidase, and the lack of L-arabinose and sucrose utilization
(Table 4; Takeuchi et al., 2011). So far, the dimorphic life cycle that involves a prosthecate and a
flagellated stage is unique among the Sphingomonadaceae.
Emended description of the genus Sphingomonas (Yabuuchi et al. 1990) emend. Yabuuchi et
al. 1999 Cells are Gram-negative, non-sporulating rods measuring 0.3-0.8 x 0.7-1.9 µ m.
Motile or non-motile, some species exhibit a dimorphic life cycle that involves a prosthecate
nonmotile and a flagellated motile cell. Colonies are yellow, off-white or colorless. Strictly
aerobic and chemo-organotrophic. Catalase-positive. Respiratory quinone is predominantly Q-10.
Major fatty acids are 18:1, saturated 16:0 and/or 17:1. Major 2-hydroxy fatty acids are 2-OH
14:0 or 2-OH 15:0. GSLs are present. Homospermidine is the major polyamine component. The
DNA G + C content is 62 - 68 mol%. Phylogenetic position is in the a-4 subclass of
Proteobacteria. Characteristic 16S rRNA signatures are found at positions 52:359 (C:G), 134 (G),
593 (G), 987:1218 (G:C) and 990:1215 (U:G). Habitat: soil, clinical specimens, insect guts and
freshwater lakes. Currently, 67 species are assigned to the emended genus Sphingomonas. Type
species: Sphingomonas paucimobilis Yabuuchi et al. 1990.
Description of Sphingomonas leidyi comb. nov. Sphingomonas leidyi (lei.dyi, N. L. gen.
masc. n. leidyi, of Leidy, named for J. Leidy, who observed tufts of (bacterial) growth of fungi in
insect guts in 1853)
The description of Sphingomonas leidyi is the same as that given for Caulobacter leidyi by
Henrici and Abraham (Henrici & Johnson, 1935, emended by Poindexter, 1964; Abraham et al.,
1999), with the following additional characteristics. Cells are predominantly short, uncurved,
slightly tapered, and sometimes nearly ovoid, with short stalks. Colonies are colorless. Isolates
known from freshwater, millipede hindgut and soil. Nitrate is not reduced; esculin, glucose,
N-acetyl-glucosamine, maltose and malic acid are hydrolysed. Cells are divided by binary
division.
Chapter 4: results
58
Produces alkaline phosphatase, leucine arylamidase, valine arylamidase, cystine arylamidase,
trypsin, acid phosphatase, naphthol-AS-BI-phosphohydrolase, α-glucosidase, β-glucosidase.
L-arabinose, D-xylose, D-glucose, N-acetyl-glucosamine, cellobiose, maltose, and trehalose are
utilized. Melibiose, β-gentiobiose and D-lyxose are weakly utilized. Cells are sensitive to
tetracyclin, amikacin, vancomycin, doxycycin, fosfomycin, moxifloxacin. Resistant to penicillin
G, oxacillin, ampicillin, ticarcillin, cefalotin, mezlocillin, cefazolin, Cefotaxim, aztreonam,
chloramphenicol, lincomycin, colistin, pipemidic, bacitracin, nitrofurantoin, clindamycin,
ceftriaxone, nystatin, linezolid, quinupristin/dalfopristin, piperacillin/tazobactam.
Q-10 is the major respiratory quinone, the major fatty acids are C18:1ω7c, C16:0, 11-Methyl
C18:1ω7c, and C14:0 2OH is the major 2-hydroxy fatty acids. The major polar lipids are
diphosphatidylglycerol, phosphatidyldimethylethanolamine, phosphatidylglycerol,
phosphatidylmonomethylethanolamine, phosphatidylethanolamine, phosphatidylcholine,
glycolipids, phosphoaminolipids and two sphingoglycolipids. The major polyamine is
sym-homospermidine.The genomic DNA G+C content of strain DSM 4733T is 67 mol%. The
type strain is DSM 4733T (=ATCC 15260T=CIP 106443T=VKM B-1368T) was isolated from
Millipede hind-gut. Another strain in this species is 247 (DSM 25078 = LMG 26658) with the
genomic DNA G+C content 67.6 mol%, isolated from a prealpine freshwater lake (Starnberger
See, Germany).
Sphingobium limneticum 301T
Strain 301T formed yellow, circular and smooth colonies on R2A agar, PYE agar and 1/10
HD agar after 24 hours incubation. Cells were Gram-negative, asporogenous, rod-shaped, 1.3-2.2
µ m long and 0.4-0.5 µ m wide (Table 7), motile by peritrichous flagella (Fig. 18).
Based on the nearly complete (1496 bp) 16S rDNA gene sequence of isolate 301T a
comprehensive phylogenetic analysis of 16S rRNA gene sequences which included sequences
from the type strains of species in the genus Sphingobium and strain 301T is shown in Fig. 19,
Fig. S3, S4. Strain 301T was clustered within the genus Sphingobium. Sphingobium amiense
DSM 16289T, Sphingobium vermicomposti DSM 21299T, Sphingobium yanoikuyae DSM 7462T
(type species of this genus) and Sphingobium scionense DSM 19371T were the closest neighbors
(98.8%, 98.0%, 97.9% and 97.4% similarity, respectively). Since DNA-DNA hybridization has
at the species level a greater resolution than 16S rRNA gene sequences (Tindall et al., 2010), the
DDH were done among the strain 301T and other type strains of the other 4 species which
showed more than 97% similarity of 16S rRNA gene sequences. DNA-DNA relatedness between
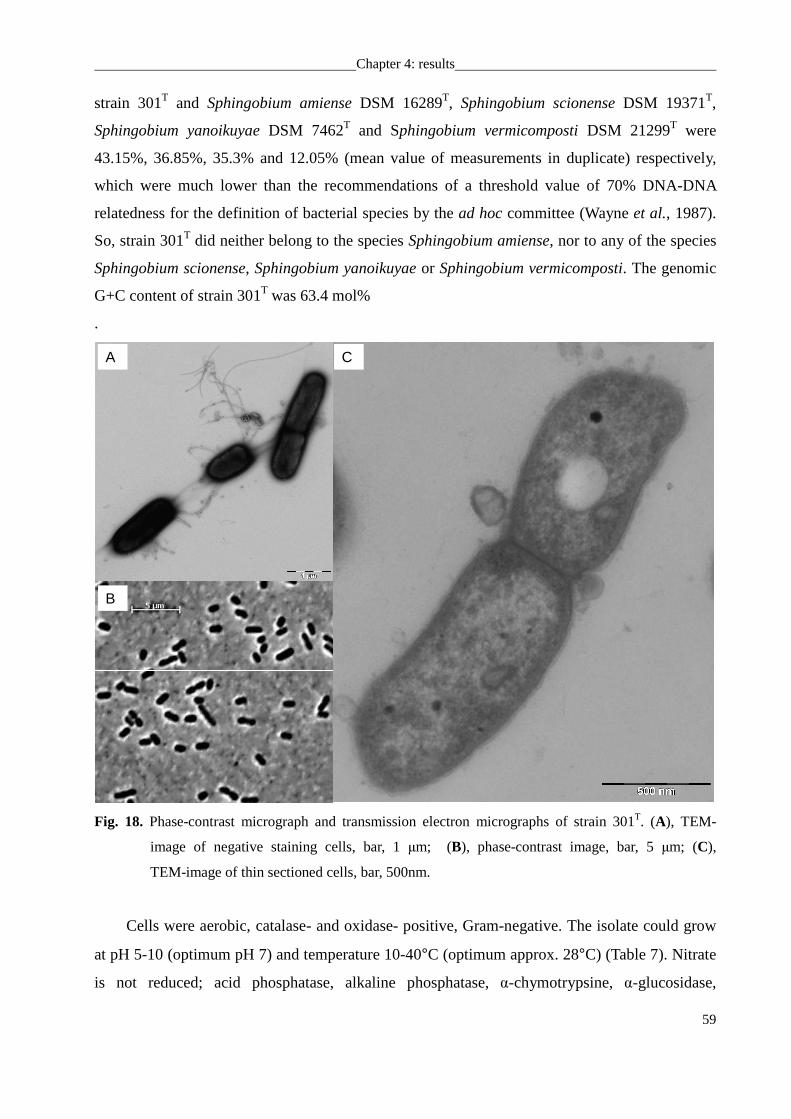
Chapter 4: results
59
strain 301T and Sphingobium amiense DSM 16289T, Sphingobium scionense DSM 19371T,
Sphingobium yanoikuyae DSM 7462T and Sphingobium vermicomposti DSM 21299T were
43.15%, 36.85%, 35.3% and 12.05% (mean value of measurements in duplicate) respectively,
which were much lower than the recommendations of a threshold value of 70% DNA-DNA
relatedness for the definition of bacterial species by the ad hoc committee (Wayne et al., 1987).
So, strain 301T did neither belong to the species Sphingobium amiense, nor to any of the species
Sphingobium scionense, Sphingobium yanoikuyae or Sphingobium vermicomposti. The genomic
G+C content of strain 301T was 63.4 mol%
.
A C
B
Fig. 18. Phase-contrast micrograph and transmission electron micrographs of strain 301T. (A), TEM-
image of negative staining cells, bar, 1 µm; (B), phase-contrast image, bar, 5 µm; (C),
TEM-image of thin sectioned cells, bar, 500nm.
Cells were aerobic, catalase- and oxidase- positive, Gram-negative. The isolate could grow
at pH 5-10 (optimum pH 7) and temperature 10-40°C (optimum approx. 28°C) (Table 7). Nitrate
is not reduced; acid phosphatase, alkaline phosphatase, α-chymotrypsine, α-glucosidase,
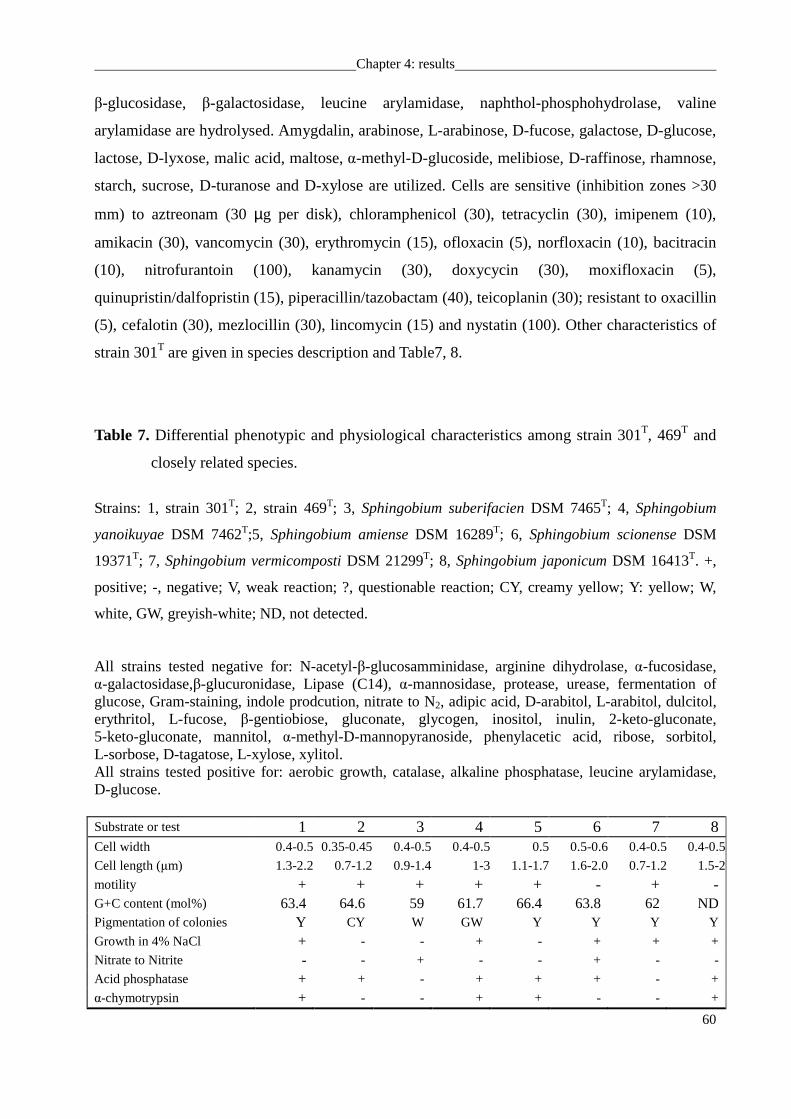
Chapter 4: results
60
β-glucosidase, β-galactosidase, leucine arylamidase, naphthol-phosphohydrolase, valine
arylamidase are hydrolysed. Amygdalin, arabinose, L-arabinose, D-fucose, galactose, D-glucose,
lactose, D-lyxose, malic acid, maltose, α-methyl-D-glucoside, melibiose, D-raffinose, rhamnose,
starch, sucrose, D-turanose and D-xylose are utilized. Cells are sensitive (inhibition zones >30
mm) to aztreonam (30 µg per disk), chloramphenicol (30), tetracyclin (30), imipenem (10),
amikacin (30), vancomycin (30), erythromycin (15), ofloxacin (5), norfloxacin (10), bacitracin
(10), nitrofurantoin (100), kanamycin (30), doxycycin (30), moxifloxacin (5),
quinupristin/dalfopristin (15), piperacillin/tazobactam (40), teicoplanin (30); resistant to oxacillin
(5), cefalotin (30), mezlocillin (30), lincomycin (15) and nystatin (100). Other characteristics of
strain 301T are given in species description and Table7, 8.
Table 7. Differential phenotypic and physiological characteristics among strain 301T, 469T and
closely related species.
Strains: 1, strain 301T; 2, strain 469T; 3, Sphingobium suberifacien DSM 7465T; 4, Sphingobium
yanoikuyae DSM 7462T;5, Sphingobium amiense DSM 16289T; 6, Sphingobium scionense DSM
19371T; 7, Sphingobium vermicomposti DSM 21299T; 8, Sphingobium japonicum DSM 16413T. +,
positive; -, negative; V, weak reaction; ?, questionable reaction; CY, creamy yellow; Y: yellow; W,
white, GW, greyish-white; ND, not detected.
All strains tested negative for: N-acetyl-β-glucosamminidase, arginine dihydrolase, α-fucosidase, α-galactosidase,β-glucuronidase, Lipase (C14), α-mannosidase, protease, urease, fermentation of glucose, Gram-staining, indole prodcution, nitrate to N2, adipic acid, D-arabitol, L-arabitol, dulcitol, erythritol, L-fucose, β-gentiobiose, gluconate, glycogen, inositol, inulin, 2-keto-gluconate, 5-keto-gluconate, mannitol, α-methyl-D-mannopyranoside, phenylacetic acid, ribose, sorbitol, L-sorbose, D-tagatose, L-xylose, xylitol. All strains tested positive for: aerobic growth, catalase, alkaline phosphatase, leucine arylamidase, D-glucose. Substrate or test 1 2 3 4 5 6 7 8 Cell width 0.4-0.5 0.35-0.45 0.4-0.5 0.4-0.5 0.5 0.5-0.6 0.4-0.5 0.4-0.5
Cell length (µm) 1.3-2.2 0.7-1.2 0.9-1.4 1-3 1.1-1.7 1.6-2.0 0.7-1.2 1.5-2
motility + + + + + - + - G+C content (mol%) 63.4 64.6 59 61.7 66.4 63.8 62 ND Pigmentation of colonies Y CY W GW Y Y Y Y
Growth in 4% NaCl + - - + - + + +
Nitrate to Nitrite - - + - - + - -
Acid phosphatase + + - + + + - +
α-chymotrypsin + - - + + - - +
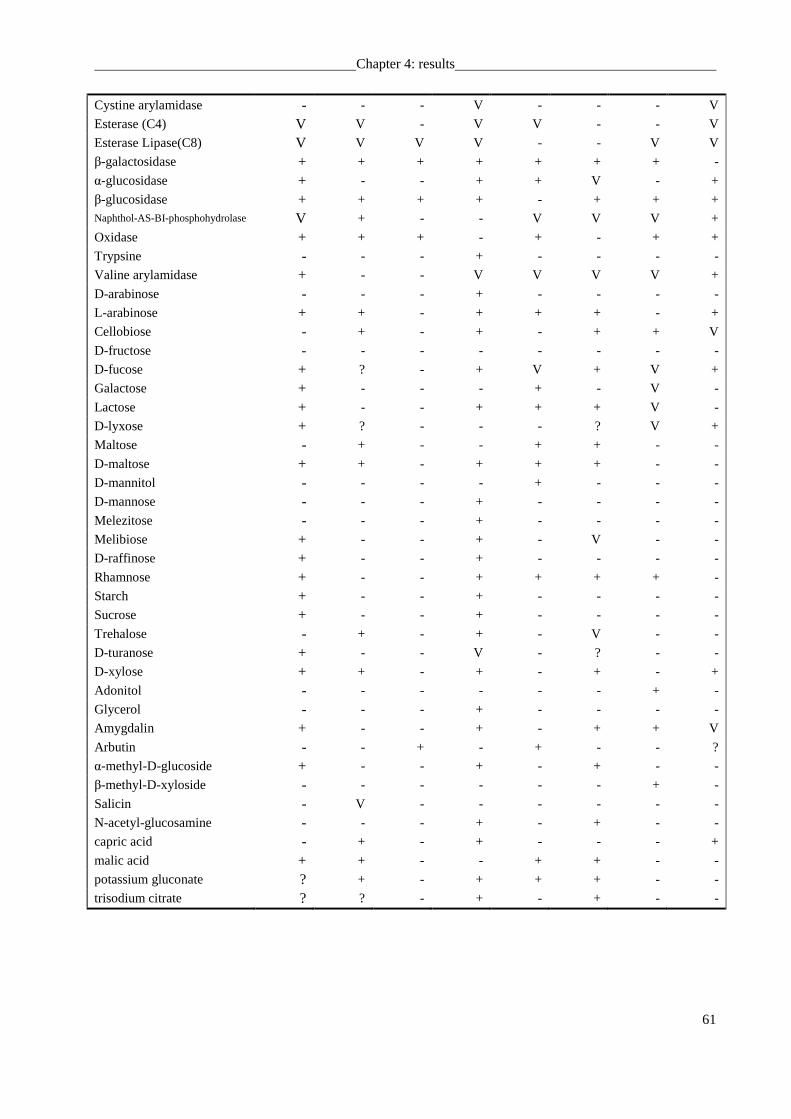
Chapter 4: results
61
Cystine arylamidase - - - V - - - V
Esterase (C4) V V - V V - - V
Esterase Lipase(C8) V V V V - - V V
β-galactosidase + + + + + + + -
α-glucosidase + - - + + V - +
β-glucosidase + + + + - + + + Naphthol-AS-BI-phosphohydrolase V + - - V V V +
Oxidase + + + - + - + +
Trypsine - - - + - - - -
Valine arylamidase + - - V V V V +
D-arabinose - - - + - - - -
L-arabinose + + - + + + - +
Cellobiose - + - + - + + V
D-fructose - - - - - - - -
D-fucose + ? - + V + V +
Galactose + - - - + - V -
Lactose + - - + + + V -
D-lyxose + ? - - - ? V +
Maltose - + - - + + - -
D-maltose + + - + + + - -
D-mannitol - - - - + - - -
D-mannose - - - + - - - -
Melezitose - - - + - - - -
Melibiose + - - + - V - -
D-raffinose + - - + - - - -
Rhamnose + - - + + + + -
Starch + - - + - - - -
Sucrose + - - + - - - -
Trehalose - + - + - V - -
D-turanose + - - V - ? - -
D-xylose + + - + - + - +
Adonitol - - - - - - + -
Glycerol - - - + - - - -
Amygdalin + - - + - + + V
Arbutin - - + - + - - ?
α-methyl-D-glucoside + - - + - + - -
β-methyl-D-xyloside - - - - - - + -
Salicin - V - - - - - -
N-acetyl-glucosamine - - - + - + - -
capric acid - + - + - - - +
malic acid + + - - + + - -
potassium gluconate ? + - + + + - -
trisodium citrate ? ? - + - + - -
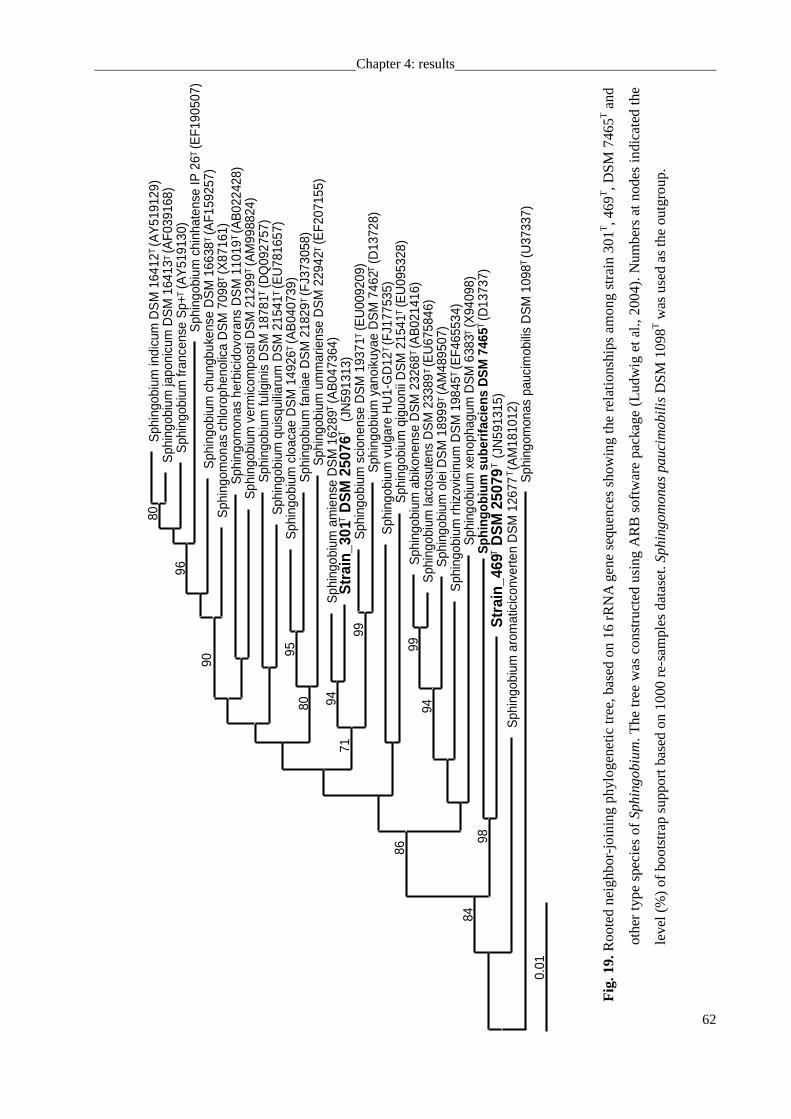
Chapter 4: results
62
Sph
ingo
bium
indi
cum
DS
M16
412
(AY
5191
29)
Sph
ingo
bium
japo
nicu
mD
SM
1641
3(A
F039
168)
Sph
ingo
bium
franc
ense
Sp+
(AY
5191
30)
80
Sph
ingo
bium
chin
hate
nse
IP26
(EF1
9050
7)S
phin
gobi
umch
ungb
uken
seD
SM
1663
8(A
F159
257)
96
Sph
ingo
mon
asch
loro
phen
olic
aD
SM
7098
(X87
161)
Sph
ingo
mon
ashe
rbic
idov
oran
sD
SM
1101
9(A
B02
2428
)S
phin
gobi
umve
rmic
ompo
stiD
SM
2129
9(A
M99
8824
)
90
Sph
ingo
bium
fulig
inis
DS
M18
781
(DQ
0927
57)
Sph
ingo
bium
quis
quili
arum
DS
M21
541
(EU
7816
57)
Sph
ingo
bium
cloa
cae
DS
M14
926
(AB
0407
39)
Sph
ingo
bium
fani
aeD
SM
2182
9(F
J373
058)
Sph
ingo
bium
umm
arie
nse
DS
M22
942
(EF2
0715
5)
9580
Sph
ingo
bium
amie
nse
DS
M16
289
(AB
0473
64)
Str
ain_
301
DS
M25
076
(JN
5913
13)
Sph
ingo
bium
scio
nens
eD
SM
1937
1(E
U00
9209
)S
phin
gobi
umya
noik
uyae
DS
M74
62(D
1372
8)
94
9971
Sph
ingo
bium
vulg
are
HU
1-G
D12
(FJ1
7753
5)S
phin
gobi
umqi
guon
iiD
SM
2154
1(E
U09
5328
)S
phin
gobi
umab
ikon
ense
DS
M23
268
(AB
0214
16)
Sph
ingo
bium
lact
osut
ens
DS
M23
389
(EU
6758
46)
Sph
ingo
bium
olei
DS
M18
999
(AM
4895
07)
99
Sph
ingo
bium
rhiz
ovic
inum
DS
M19
845
(EF4
6553
4)
94
Sph
ingo
bium
xeno
phag
umD
SM
6383
(X94
098)
Sph
ingo
bium
sube
rifa
cien
sD
SM
7465
(D13
737)
86
Sph
ingo
bium
arom
atic
icon
verte
nD
SM
1267
7(A
M18
1012
)
84
Sph
ingo
mon
aspa
ucim
obili
sD
SM
1098
(U37
337)
0.01
T
T T
T
TT
TT
T
T
T
T
TT
TT
T
T
TT
T
T
T
T
T
T
T
98S
trai
n_46
9D
SM
2507
9(J
N59
1315
)T
T
T
Fig
. 19.
Roo
ted
neig
hbor
-join
ing
phyl
ogen
etic
tre
e, b
ased
on
16 r
RN
A g
ene
sequ
ence
s sh
owin
g th
e re
latio
nshi
ps
amon
g st
rain
301T
, 469
T,
DS
M 7
465T
and
othe
r ty
pe s
peci
es o
f Sp
hing
ob
ium.
The
tre
e w
as c
onst
ruct
ed u
sing
AR
B s
oftw
are
pack
age
(Lu
dwig
et
al.,
2004
). N
umbe
rs a
t no
des
indi
cate
d th
e
leve
l (%
) of
boo
tstr
ap s
uppo
rt b
ased
on
1000
re-
sam
ples
dat
aset
. Sp
hin
go
mo
na
s pa
uci
mo
bilis
D
SM
109
8T w
as u
sed
as th
e ou
tgro
up.
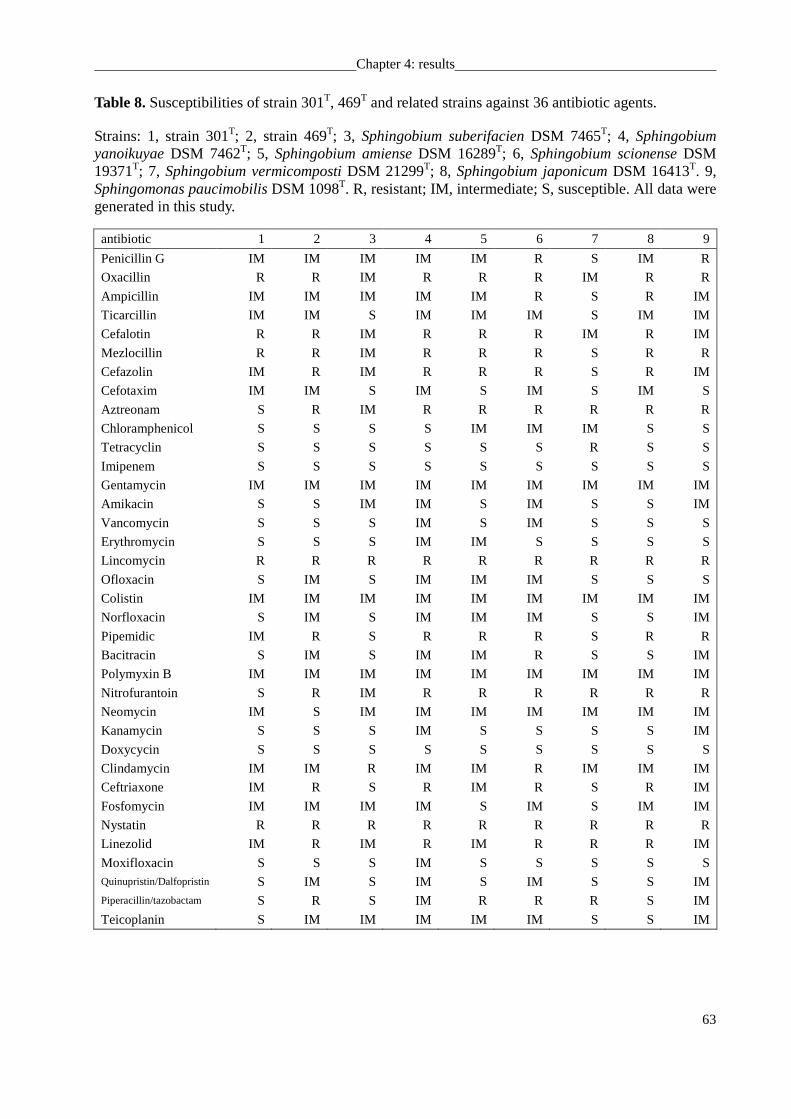
Chapter 4: results
63
Table 8. Susceptibilities of strain 301T, 469T and related strains against 36 antibiotic agents.
Strains: 1, strain 301T; 2, strain 469T; 3, Sphingobium suberifacien DSM 7465T; 4, Sphingobium yanoikuyae DSM 7462T; 5, Sphingobium amiense DSM 16289T; 6, Sphingobium scionense DSM 19371T; 7, Sphingobium vermicomposti DSM 21299T; 8, Sphingobium japonicum DSM 16413T. 9, Sphingomonas paucimobilis DSM 1098T. R, resistant; IM, intermediate; S, susceptible. All data were generated in this study.
antibiotic 1 2 3 4 5 6 7 8 9
Penicillin G IM IM IM IM IM R S IM R
Oxacillin R R IM R R R IM R R
Ampicillin IM IM IM IM IM R S R IM
Ticarcillin IM IM S IM IM IM S IM IM
Cefalotin R R IM R R R IM R IM
Mezlocillin R R IM R R R S R R
Cefazolin IM R IM R R R S R IM
Cefotaxim IM IM S IM S IM S IM S
Aztreonam S R IM R R R R R R
Chloramphenicol S S S S IM IM IM S S
Tetracyclin S S S S S S R S S
Imipenem S S S S S S S S S
Gentamycin IM IM IM IM IM IM IM IM IM
Amikacin S S IM IM S IM S S IM
Vancomycin S S S IM S IM S S S
Erythromycin S S S IM IM S S S S
Lincomycin R R R R R R R R R
Ofloxacin S IM S IM IM IM S S S
Colistin IM IM IM IM IM IM IM IM IM
Norfloxacin S IM S IM IM IM S S IM
Pipemidic IM R S R R R S R R
Bacitracin S IM S IM IM R S S IM
Polymyxin B IM IM IM IM IM IM IM IM IM
Nitrofurantoin S R IM R R R R R R
Neomycin IM S IM IM IM IM IM IM IM
Kanamycin S S S IM S S S S IM
Doxycycin S S S S S S S S S
Clindamycin IM IM R IM IM R IM IM IM
Ceftriaxone IM R S R IM R S R IM
Fosfomycin IM IM IM IM S IM S IM IM
Nystatin R R R R R R R R R
Linezolid IM R IM R IM R R R IM
Moxifloxacin S S S IM S S S S S Quinupristin/Dalfopristin S IM S IM S IM S S IM Piperacillin/tazobactam S R S IM R R R S IM
Teicoplanin S IM IM IM IM IM S S IM
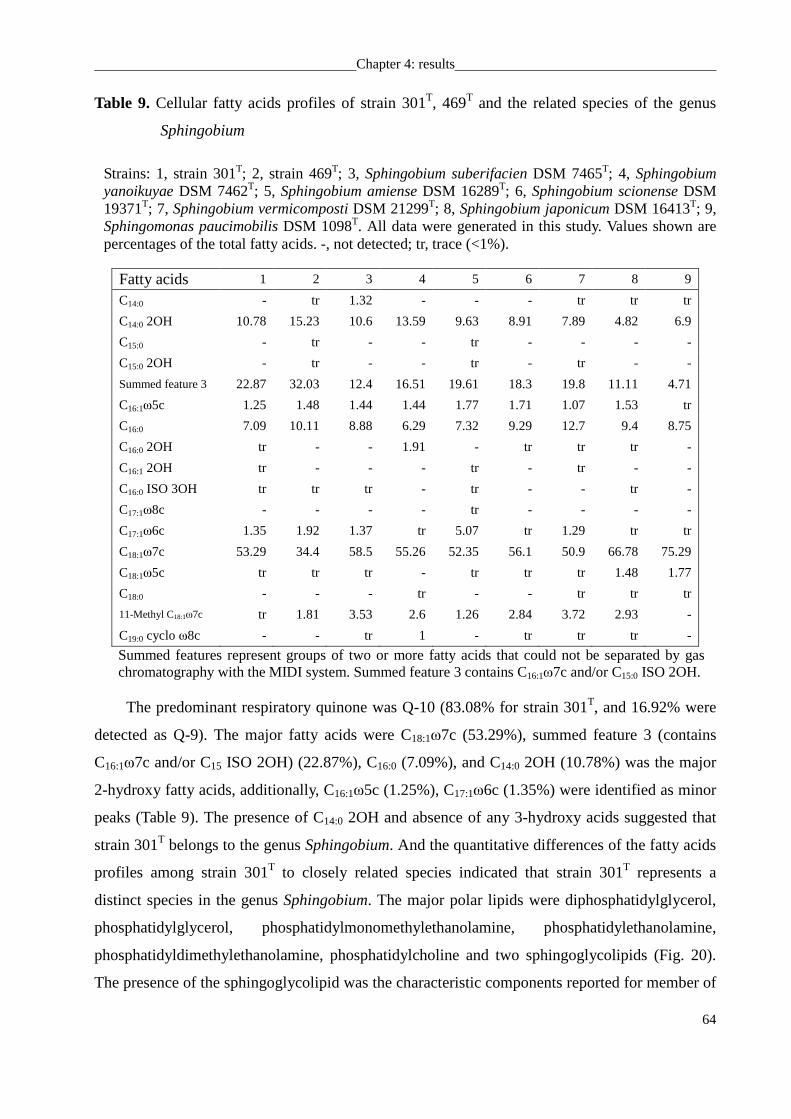
Chapter 4: results
64
Table 9. Cellular fatty acids profiles of strain 301T, 469T and the related species of the genus
Sphingobium
Strains: 1, strain 301T; 2, strain 469T; 3, Sphingobium suberifacien DSM 7465T; 4, Sphingobium yanoikuyae DSM 7462T; 5, Sphingobium amiense DSM 16289T; 6, Sphingobium scionense DSM 19371T; 7, Sphingobium vermicomposti DSM 21299T; 8, Sphingobium japonicum DSM 16413T; 9, Sphingomonas paucimobilis DSM 1098T. All data were generated in this study. Values shown are percentages of the total fatty acids. -, not detected; tr, trace (<1%).
Fatty acids 1 2 3 4 5 6 7 8 9
C14:0 - tr 1.32 - - - tr tr tr
C14:0 2OH 10.78 15.23 10.6 13.59 9.63 8.91 7.89 4.82 6.9
C15:0 - tr - - tr - - - -
C15:0 2OH - tr - - tr - tr - -
Summed feature 3 22.87 32.03 12.4 16.51 19.61 18.3 19.8 11.11 4.71
C16:1ω5c 1.25 1.48 1.44 1.44 1.77 1.71 1.07 1.53 tr
C16:0 7.09 10.11 8.88 6.29 7.32 9.29 12.7 9.4 8.75
C16:0 2OH tr - - 1.91 - tr tr tr -
C16:1 2OH tr - - - tr - tr - -
C16:0 ISO 3OH tr tr tr - tr - - tr -
C17:1ω8c - - - - tr - - - -
C17:1ω6c 1.35 1.92 1.37 tr 5.07 tr 1.29 tr tr
C18:1ω7c 53.29 34.4 58.5 55.26 52.35 56.1 50.9 66.78 75.29
C18:1ω5c tr tr tr - tr tr tr 1.48 1.77
C18:0 - - - tr - - tr tr tr
11-Methyl C18:1ω7c tr 1.81 3.53 2.6 1.26 2.84 3.72 2.93 -
C19:0 cyclo ω8c - - tr 1 - tr tr tr -
Summed features represent groups of two or more fatty acids that could not be separated by gas chromatography with the MIDI system. Summed feature 3 contains C16:1ω7c and/or C15:0 ISO 2OH.
The predominant respiratory quinone was Q-10 (83.08% for strain 301T, and 16.92% were
detected as Q-9). The major fatty acids were C18:1ω7c (53.29%), summed feature 3 (contains
C16:1ω7c and/or C15 ISO 2OH) (22.87%), C16:0 (7.09%), and C14:0 2OH (10.78%) was the major
2-hydroxy fatty acids, additionally, C16:1ω5c (1.25%), C17:1ω6c (1.35%) were identified as minor
peaks (Table 9). The presence of C14:0 2OH and absence of any 3-hydroxy acids suggested that
strain 301T belongs to the genus Sphingobium. And the quantitative differences of the fatty acids
profiles among strain 301T to closely related species indicated that strain 301T represents a
distinct species in the genus Sphingobium. The major polar lipids were diphosphatidylglycerol,
phosphatidylglycerol, phosphatidylmonomethylethanolamine, phosphatidylethanolamine,
phosphatidyldimethylethanolamine, phosphatidylcholine and two sphingoglycolipids (Fig. 20).
The presence of the sphingoglycolipid was the characteristic components reported for member of
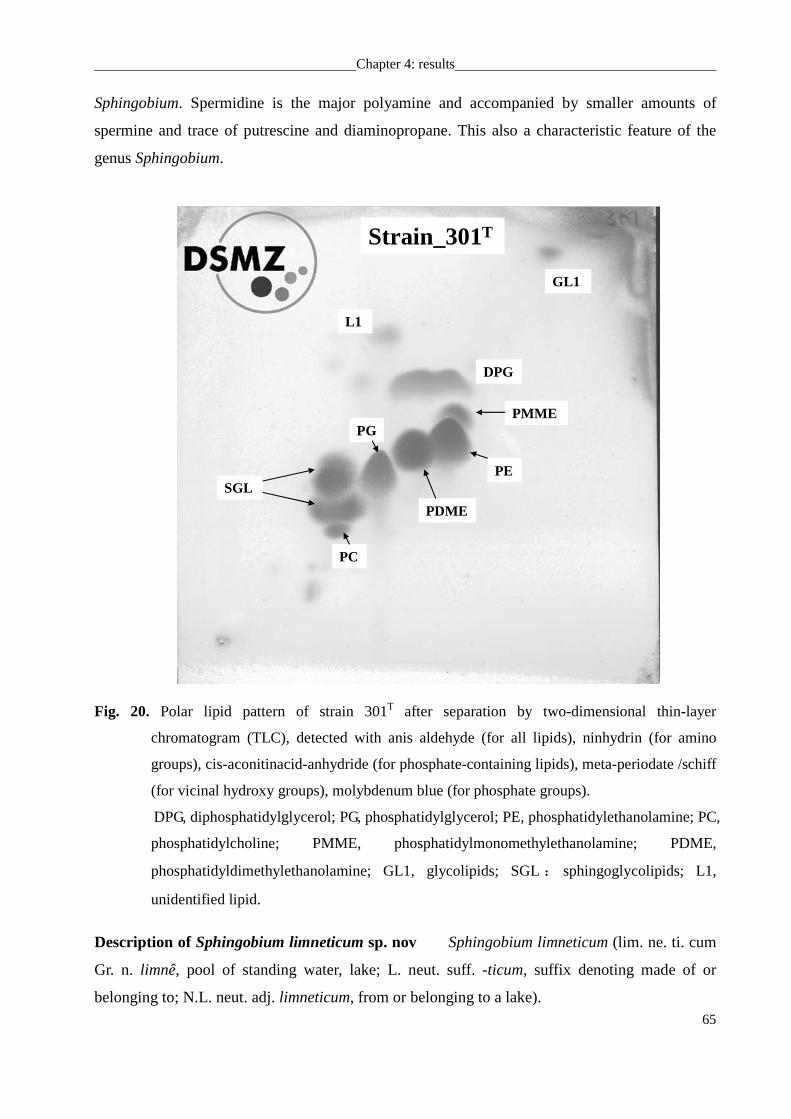
Chapter 4: results
65
Sphingobium. Spermidine is the major polyamine and accompanied by smaller amounts of
spermine and trace of putrescine and diaminopropane. This also a characteristic feature of the
genus Sphingobium.
Strain_301T
PG
DPG
PDME
PC
L1
PMME
PESGL
GL1
Fig. 20. Polar lipid pattern of strain 301T after separation by two-dimensional thin-layer
chromatogram (TLC), detected with anis aldehyde (for all lipids), ninhydrin (for amino
groups), cis-aconitinacid-anhydride (for phosphate-containing lipids), meta-periodate /schiff
(for vicinal hydroxy groups), molybdenum blue (for phosphate groups).
DPG, diphosphatidylglycerol; PG, phosphatidylglycerol; PE, phosphatidylethanolamine; PC,
phosphatidylcholine; PMME, phosphatidylmonomethylethanolamine; PDME,
phosphatidyldimethylethanolamine; GL1, glycolipids; SGL: sphingoglycolipids; L1,
unidentified lipid.
Description of Sphingobium limneticum sp. nov Sphingobium limneticum (lim. ne. ti. cum
Gr. n. limnê, pool of standing water, lake; L. neut. suff. -ticum, suffix denoting made of or
belonging to; N.L. neut. adj. limneticum, from or belonging to a lake).
Chapter 4: results
66
Colonies are yellow, circular, domed, convex on R2A agar, 1:10 diluted HD agar after 24
hours incubation. Cells are Gram-negative, asporogenous, rod-shaped (1.3-2.2 µ m long and
0.4-0.5 µ m wide), motile by peritrichous flagella, aerobic, catalase- and oxidase- positive. The
isolate can grow at pH 5-10 (optimum pH 7) and temperature 10-40°C (optimum approx. 28°C).
Cells can not reduce nitrate; acid phosphatase, alkaline phosphatase, α-chymotrypsine,
α-glucosidase, β-glucosidase, β-galactosidase, leucine arylamidase, naphthol-phosphohydrolase,
valine arylamidase are hydrolysed. Amygdalin, arabinose, L-arabinose, D-fucose, galactose,
D-glucose, lactose, D-lyxose, malic acid, maltose, α-methyl-D-glucoside, melibiose, D-raffinose,
rhamnose, starch, sucrose, D-turanose and D-xylose are utilized. Cells are sensitive (inhibition
zones >30 mm) to aztreonam (30 µg per disk), chloramphenicol (30), tetracyclin (30), imipenem
(10), amikacin (30), vancomycin (30), erythromycin (15), ofloxacin (5), norfloxacin (10),
bacitracin (10), nitrofurantoin (100), kanamycin (30), doxycycin (30), moxifloxacin (5),
quinupristin/dalfopristin (15), piperacillin/tazobactam (40), teicoplanin (30); resistant to oxacillin
(5), cefalotin (30), mezlocillin (30), lincomycin (15) and nystatin (100).
The Q-10 (83.08%) is the major respiratory quinone. The major fatty acids are C18:1ω7c
(53.29%), Summed feature 3 (contains C16:1ω7c and/or C15 ISO2-OH) (22.87%), C16:0
(7.09%), and C14:0 2OH (10.78%) is the major 2-hydroxy fatty acids. The major polar lipids are
diphosphatidylglycerol, phosphatidylglycerol, phosphatidylmonomethylethanolamine,
phosphatidylethanolamine, phosphatidyldimethylethanolamine, phosphatidylcholine and two
sphingoglycolipids. The major polyamine was spermidine. The genomic DNA G+C content of
strain 301T was 63.4 mol%. Based on these results, it is proposed that strain 301T represents a
novel species of the genus Sphingobium, which is named as Sphingobium limneticum. The type
strain is 301T (=DSM 25076T=LMG 26659T) isolated from fresh lake water of Starnberger See,
Germany.
Description of Sphingobium boeckii sp. nov., and reclassification of
Sphingomonas suberifaciens as Sphingobium suberifaciens comb.nov.
Strain 469T formed yellow, circular, domed, convex colonies on R2A agar, PYE agar and
1:10 diluted HD agar after 48 hours incubation. Cells were Gram-negative, asporogenous,
rod-shaped (0.7-1.2 µ m long and 0.35-0.45 µ m wide), motile by one or two subpolar
monotrichous flagella (Fig. 21), aerobic, catalase- and oxidase- positive. The isolate could grow
at pH 5-10 (optimum pH 7) and temperature 10-40°C (optimum approx. 28°C). Other
phenotypic characteristic of strain 469T and the closely related type strains are listed in species
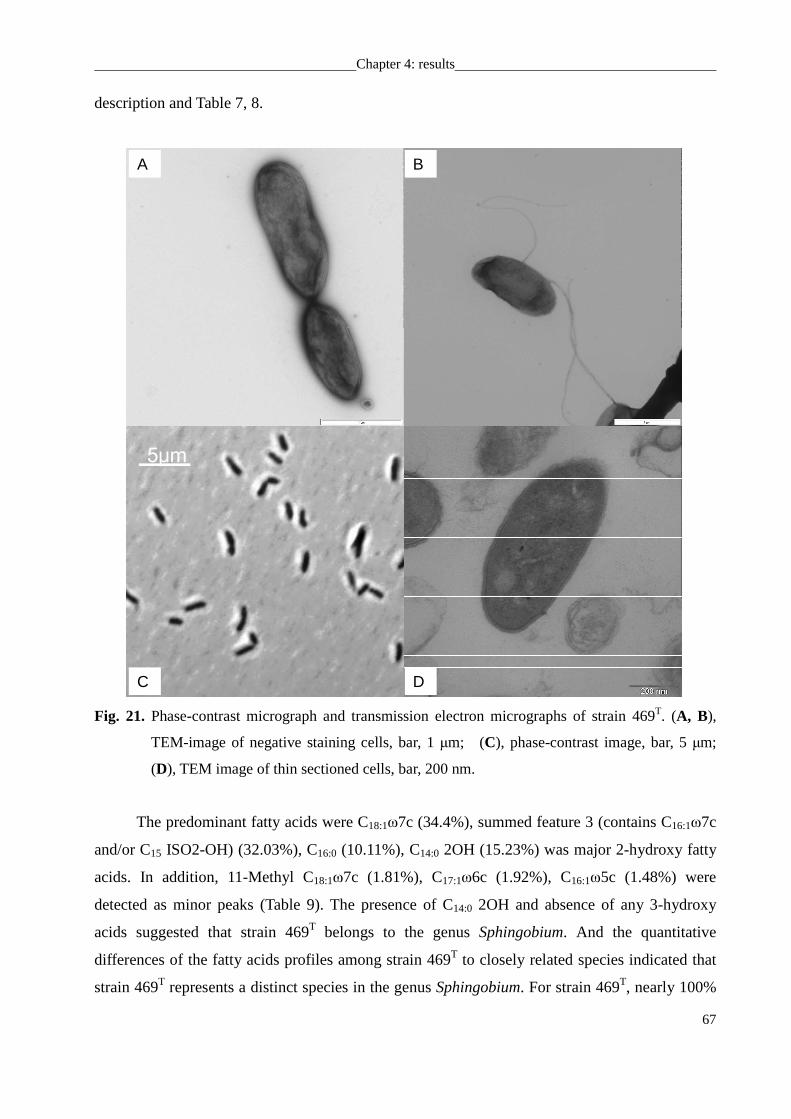
Chapter 4: results
67
description and Table 7, 8.
5μm
A
C
B
D
Fig. 21. Phase-contrast micrograph and transmission electron micrographs of strain 469T. (A, B),
TEM-image of negative staining cells, bar, 1 µm; (C), phase-contrast image, bar, 5 µm;
(D), TEM image of thin sectioned cells, bar, 200 nm.
The predominant fatty acids were C18:1ω7c (34.4%), summed feature 3 (contains C16:1ω7c
and/or C15 ISO2-OH) (32.03%), C16:0 (10.11%), C14:0 2OH (15.23%) was major 2-hydroxy fatty
acids. In addition, 11-Methyl C18:1ω7c (1.81%), C17:1ω6c (1.92%), C16:1ω5c (1.48%) were
detected as minor peaks (Table 9). The presence of C14:0 2OH and absence of any 3-hydroxy
acids suggested that strain 469T belongs to the genus Sphingobium. And the quantitative
differences of the fatty acids profiles among strain 469T to closely related species indicated that
strain 469T represents a distinct species in the genus Sphingobium. For strain 469T, nearly 100%
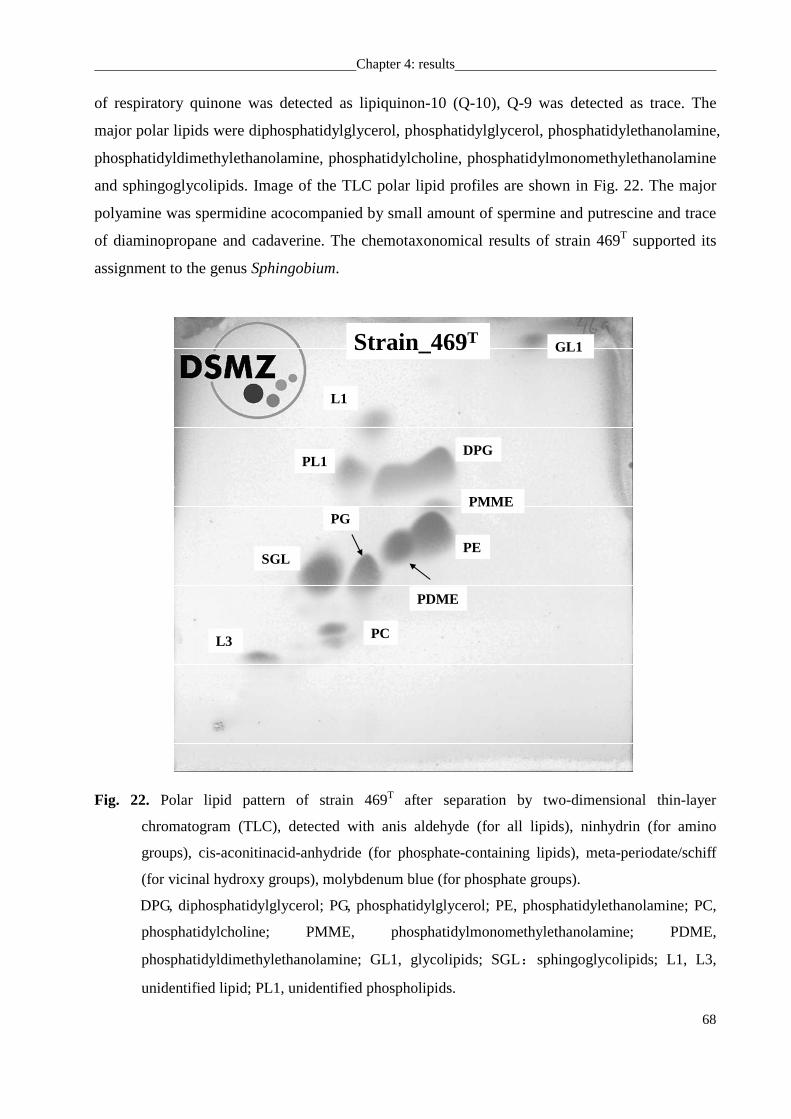
Chapter 4: results
68
of respiratory quinone was detected as lipiquinon-10 (Q-10), Q-9 was detected as trace. The
major polar lipids were diphosphatidylglycerol, phosphatidylglycerol, phosphatidylethanolamine,
phosphatidyldimethylethanolamine, phosphatidylcholine, phosphatidylmonomethylethanolamine
and sphingoglycolipids. Image of the TLC polar lipid profiles are shown in Fig. 22. The major
polyamine was spermidine acocompanied by small amount of spermine and putrescine and trace
of diaminopropane and cadaverine. The chemotaxonomical results of strain 469T supported its
assignment to the genus Sphingobium.
Strain_469T
PG
PE
DPG
PMME
PDME
SGL
PC
GL1
PL1
L1
L3
Fig. 22. Polar lipid pattern of strain 469T after separation by two-dimensional thin-layer
chromatogram (TLC), detected with anis aldehyde (for all lipids), ninhydrin (for amino
groups), cis-aconitinacid-anhydride (for phosphate-containing lipids), meta-periodate/schiff
(for vicinal hydroxy groups), molybdenum blue (for phosphate groups).
DPG, diphosphatidylglycerol; PG, phosphatidylglycerol; PE, phosphatidylethanolamine; PC,
phosphatidylcholine; PMME, phosphatidylmonomethylethanolamine; PDME,
phosphatidyldimethylethanolamine; GL1, glycolipids; SGL:sphingoglycolipids; L1, L3,
unidentified lipid; PL1, unidentified phospholipids.
Chapter 4: results
69
A nearly complete (1493 bp) 16S rDNA gene sequence of strain 469T was determined.
From the comprehensive phylogenetic analysis of 16S rRNA gene sequences which included
sequences from the type strains of species in the genera Sphingomonas and Sphingobium, strain
469T was clustered within the genus Sphingobium. Sphingomonas suberifaciens DSM 7465T and
Sphingobium scionense DSM 19371T were the closest neighbors (97.1%, 96.5% similarity,
respectively). Sphingobium yanoikuyae DSM 7462T (type species of this genus Sphingobium)
exhibited 95.9% similarity and Sphingomonas paucimobilis DSM 1098T (type species of genus
Sphingomonas) exhibited 94.1% similarity to strain 469T (Fig. 19). DNA-DNA relatedness
between strain 469T and Sphingomonas suberifaciens DSM 7465T was 17.9% (mean value of
measurements in duplicate), which was much lower than the recommendations of a threshold
value of 70% DNA-DNA relatedness for the definition of bacterial species by the ad hoc
committee (Wayne et al., 1987). So, strain 469T did not belong to the species Sphingomonas
suberifaciens, and this strain probably represents to a novel species. The DNA G+C content of
strain 469T was 64.6%.
For strain 469T, even the characteristics of the 16S rRNA signature of strain 469T were
neither the same as genus Sphingomonas or as genus Sphingobium, but nevertheless showed
higher similarity with cluster Sphingobium than Sphingomonas. Also, all of the closely related
species belonged to the genus Sphingobium. Since also typical physiological and phylogenetic
characteristics were characteristic for the genus Sphingobium, strain 469T was affiliated to the
genus Sphingobium.
The closest species to the strain 469T was Sphingomonas suberifaciens. However, according to
the phylogenetic, chemotaxonomic and physiological analysis results (Fig. 18, S3, S4; Table 7, 8,
9), Sphingomonas suberifaciens seems to be misnamed. From the newest ARB database of 16S
rRNA gene sequences, the representatives of the species Sphingomonas suberifaciens clustered
within the genus Sphingobium (Fig. 19). The characteristic 16S rRNA signature of this species
was the same as Sphingobium. Similar support came from the polyamine analysis; the major
polyamine of Sphingomonas suberfacien was spermidine but not homospermidine. All other
characteristics detected from this strain fitted to the description of genus Sphingobium, so this
species was reclassified as Sphingobium suberfaciens.
Description of Sphingobium boeckii sp. nov Sphingobium boeckii (boe. ckii N.L. gen.
masc. n. boeckii, of Böck, in honour of August Böck (born 1937), a renowned German
microbiologist, for his contributions to general microbiology and microbial biochemistry).
Chapter 4: results
70
Colonies are yellow, circular, domed, convex on R2A agar, 1:10 diluted HD agar after 48
hours incubation. Cells are Gram-negative, asporogenous, rod-shaped, 0.7-1.2 µ m long and
0.35-0.45 µ m wide, motile by one or two subpolar monotrichous flagella, aerobic, catalase- and
oxidase- positive. The isolate can grow at pH 5-10 (optimum pH 7) and in a temperature range of
10-40(C (optimum approx. 28(C). Nitrate is not reduced; produces acid phosphatase, alkaline
phosphatase, esterase lipase (C8), β-galactosidase, β-glucosidase, leucine arylamidase,
naphthol-phosphohydrolase are hydrolysed. Arabinose, capric acid, cellobiose, esculin,
N-acetyl-glucosamine, D-glucose, malic acid, maltose, potassium gluconate, trehalose, D-xylose
are utilized and L-arabinose, β-gentiobiose, D-lyxose, D-fucose and salicin are weakly utilized.
Cells are sensitive (inhibition zones >30 mm) to chloramphenicol (30 µ g per disk), tetracyclin
(30), imipenem (10), amikacin (30), vancomycin (30), erythromycin (15), neomycin (30),
kanamycin (30), doxycycin (30), moxifloxacin (5); resistant to oxacillin (5), cefalotin (30),
mezlocillin (30), cefazolin (30), aztreonam (30), lincomycin (15), pipemidic (20), nitrofurantoin
(100), ceftriaxone (30), nystatin (100), linezolid (10) and piperacillin/tazobactam (40).
The Q-10 (nearly100%) is the major respiratory quinone. The predominant fatty acids are
C18:1ω7c (34.4%), summed feature 3 (contains C16:1ω7c and/or C15 ISO2-OH) (32.03%), C16:0
(10.11%), C14:0 2OH (15.23%) is major 2-hydroxy fatty acids. The major polar lipids are
diphosphatidylglycerol, phosphatidylglycerol, phosphatidylethanolamine,
phosphatidyldimethylethanolamine, phosphatidylcholine, phosphatidylmonomethylethanolamine
and sphingoglycolipids. The major polyamine is spermidine. The genomic DNA G+C content
of strain 469T is 64.6mol%. Based on these results, strain 469T is proposed to represent a new
species of the genus Sphingobium, which named as Sphingobium boeckii. The type strain is 469T
(=DSM 25079T=LMG xxxxxT) isolated from fresh lake water of Walchensee, Germany.
Description of Sphingobium suberifaciens comb. Nov Sphingobium suberifaciens
(su.be.ri.fa’ci.ens. L. gen. n. suberis, of cork, corky; L. part. adj. faciens, making, producing;
M.L.part. adj. suberifaciens, corky making).
The description is identical to the description given for Sphingomonas Suberifacien by Van
Bruggen et al. (1990) and amended by Yabuuchi et al. (1999) and Takeuchi et al. (2001). The
type strain is strain Ca1T = EY 2404T = ATCC 49355T = CIP 105429T = DSM 7465T = ICMP
12535T = IFO (now NBRC) 15211T = JCM 8521T = LMG 17323T = NCPPB 3629T isolated from
corked lettuce roots in California.
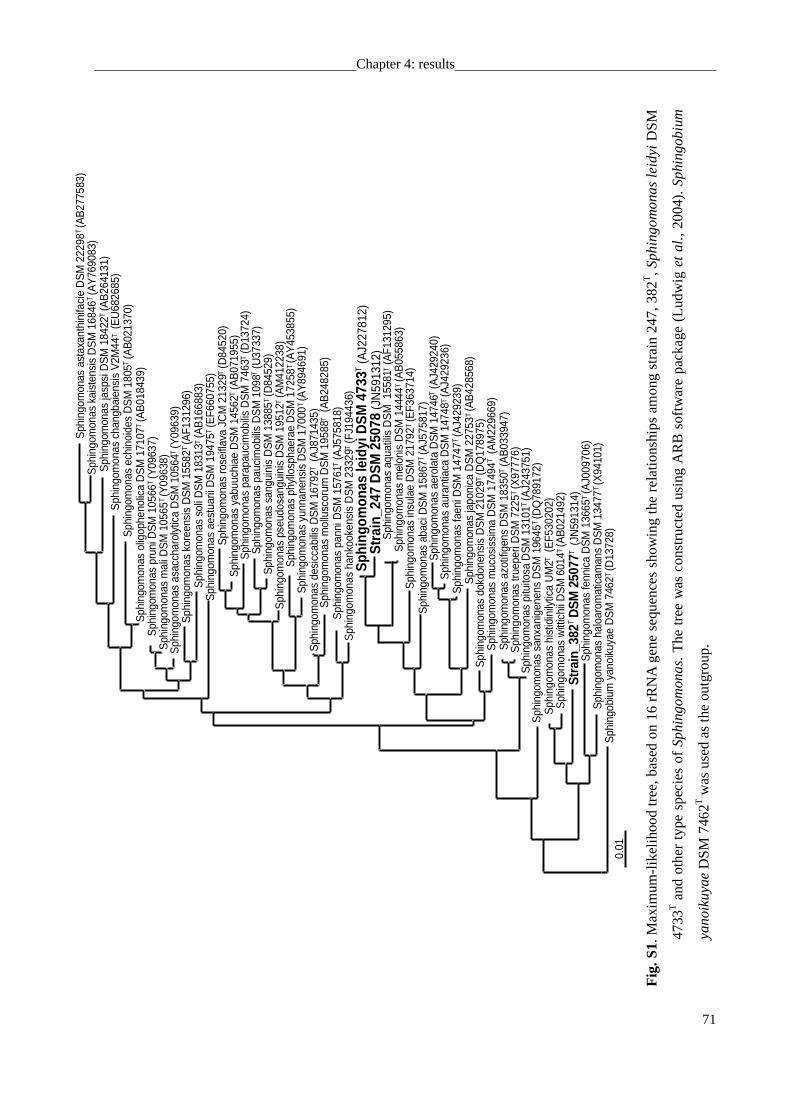
Chapter 4: results
71
0.01
Sph
ingo
mon
asaq
uatil
isD
SM
1558
1(A
F131
295)
Sph
ingo
mon
asm
elon
isD
SM
1444
4(A
B05
5863
)S
phin
gom
onas
insu
lae
DS
M21
792
(EF3
6371
4)S
phin
gom
onas
abac
iDS
M15
867
(AJ5
7581
7)
Sph
ingo
mon
asau
rant
iaca
DS
M14
748
(AJ4
2923
6)S
phin
gom
onas
faen
iDS
M14
747
(AJ4
2923
9)
Sph
ingo
mon
asae
rola
taD
SM
1474
6(A
J429
240)
Sph
ingo
mon
aspr
uniD
SM
1056
6(Y
0963
7)S
phin
gom
onas
mal
iDS
M10
565
(Y09
638)
Sph
ingo
mon
asas
acch
arol
ytic
aD
SM
1056
4(Y
0963
9)
Sph
ingo
mon
asec
hino
ides
DS
M18
05(A
B02
1370
)S
phin
gom
onas
olig
ophe
nolic
aD
SM
1710
7(A
B01
8439
)
Sph
ingo
mon
asko
reen
sis
DS
M15
582
(AF1
3129
6)S
phin
gom
onas
soli
DS
M18
313
(AB
1668
83)
Sph
ingo
mon
asae
stua
riiD
SM
1947
5(E
F660
755)
Sph
ingo
mon
asas
taxa
nthi
nifa
cie
DS
M22
298
(AB
2775
83)
Sph
ingo
mon
aska
iste
nsis
DS
M16
846
(AY
7690
83)
Sph
ingo
mon
asja
spsi
DS
M18
422
(AB
2641
31)
Sph
ingo
mon
asch
angb
aien
sis
V2M
44(E
U68
2685
)
Sph
ingo
mon
assa
nxan
igen
ens
DS
M19
645
(DQ
7891
72)
Sph
ingo
mon
ashi
stid
inily
tica
UM
2(E
F530
202)
Sph
ingo
mon
asw
ittic
hiiD
SM
6014
(AB
0214
92)
Sph
ingo
mon
asha
loar
omat
icam
ans
DS
M13
477
(X94
101)
Sph
ingo
mon
asfe
nnic
aD
SM
1366
5(A
J009
706)
Stra
in_3
82D
SM25
077
(JN
5913
14)
Sph
ingo
bium
yano
ikuy
aeD
SM
7462
(D13
728)
T
T
T
T
T
T
T
TT
T
T
T
T
T
T
T
T
T
T
T
T
T
T
T
T
T
Sph
ingo
mon
aspa
ucim
obili
sD
SM
1098
(U37
337)
Sph
ingo
mon
assa
ngui
nis
DS
M13
885
(D84
529)
Sph
ingo
mon
asps
eudo
sang
uini
sD
SM
1951
2(A
M41
2238
)
Sph
ingo
mon
aspa
rapa
ucim
obili
sD
SM
7463
(D13
724)
Sph
ingo
mon
asro
seifl
ava
JCM
2132
9(D
8452
0)S
phin
gom
onas
yabu
uchi
aeD
SM
1456
2(A
B07
1955
)
Sph
ingo
mon
asph
yllo
spha
erae
DS
M17
258
(AY
4538
55)
Sph
ingo
mon
asyu
nnan
ensi
sD
SM
1700
0(A
Y89
4691
)S
phin
gom
onas
desi
ccab
ilis
DS
M16
792
(AJ8
7143
5)S
phin
gom
onas
mol
lusc
orum
DS
M19
588
(AB
2482
85)
Sph
ingo
mon
aspa
nniD
SM
1576
1(A
J575
818)
Sph
ingo
mon
asha
nkoo
kens
isD
SM
2332
9(F
J194
436)
Sph
ingo
mon
asaz
otifi
gens
DS
M18
350
(AB
0339
47)
Sph
ingo
mon
astru
eper
iDS
M72
25(X
9777
6)S
phin
gom
onas
pitu
itosa
DS
M13
101
(AJ2
4375
1)
Sph
ingo
mon
asja
poni
caD
SM
2275
3(A
B42
8568
)S
phin
gom
onas
dokd
onen
sis
DS
M21
029
(DQ
1789
75)
Sph
ingo
mon
asm
ucos
issi
ma
DS
M17
494
(AM
2296
69)
T
T
TT
TT
T
T
T
TT
T
T
T
T
T
TT
TStr
ain_
247
DS
M25
078
(JN
5913
12)
Sph
ingo
mon
asle
idyi
DS
M47
33(A
J227
812)
T
Fig
. S1.
Max
imum
-like
lihoo
d tr
ee,
base
d on
16
rRN
A g
ene
sequ
ence
s sh
owin
g th
e re
latio
nshi
ps a
mon
g st
rain
247
, 3
82T, S
ph
ing
om
on
as le
idyi D
SM
4733
T a
nd o
ther
typ
e sp
ecie
s of
S
ph
ing
om
on
as. T
he t
ree
was
con
stru
cted
usi
ng A
RB
sof
twar
e pa
cka
ge (
Ludw
ig e
t a
l., 2
004)
. Sp
hin
gob
ium
yan
oik
uya
e DS
M 7
462T
was
use
d as
the
outg
roup
.
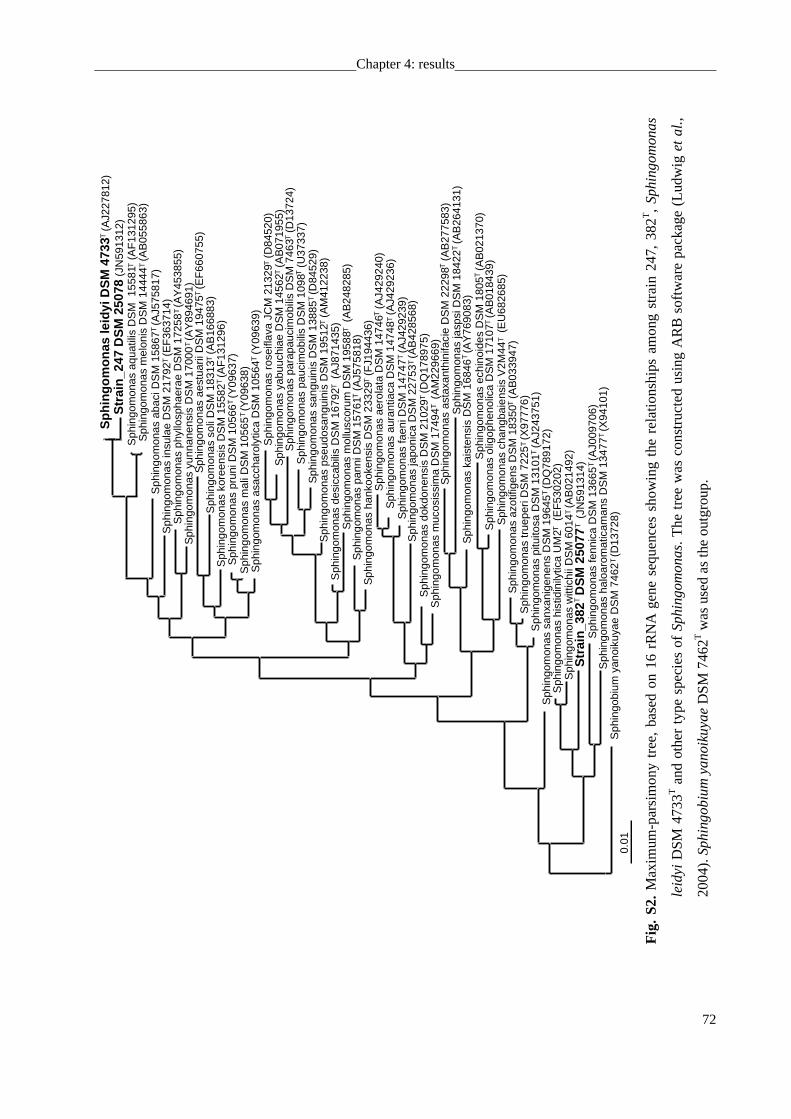
Chapter 4: results
72
0.01
Sph
ingo
mon
aspa
ucim
obili
sD
SM
1098
(U37
337)
Sph
ingo
mon
assa
ngui
nis
DS
M13
885
(D84
529)
Sph
ingo
mon
asps
eudo
sang
uini
sD
SM
1951
2(A
M41
2238
)
Sph
ingo
mon
aspa
rapa
ucim
obili
sD
SM
7463
(D13
724)
Sph
ingo
mon
asro
seifl
ava
JCM
2132
9(D
8452
0)S
phin
gom
onas
yabu
uchi
aeD
SM
1456
2(A
B07
1955
)
Sph
ingo
mon
asph
yllo
spha
erae
DS
M17
258
(AY
4538
55)
Sph
ingo
mon
asyu
nnan
ensi
sD
SM
1700
0(A
Y89
4691
)
Sph
ingo
mon
asde
sicc
abili
sD
SM
1679
2(A
J871
435)
Sph
ingo
mon
asm
ollu
scor
umD
SM
1958
8(A
B24
8285
)S
phin
gom
onas
pann
iDS
M15
761
(AJ5
7581
8)S
phin
gom
onas
hank
ooke
nsis
DS
M23
329
(FJ1
9443
6)
Sph
ingo
mon
asaz
otifi
gens
DS
M18
350
(AB
0339
47)
Sph
ingo
mon
astr
uepe
riD
SM
7225
(X97
776)
Sph
ingo
mon
aspi
tuito
saD
SM
1310
1(A
J243
751)
Sph
ingo
mon
asja
poni
caD
SM
2275
3(A
B42
8568
)S
phin
gom
onas
dokd
onen
sis
DS
M21
029
(DQ
1789
75)
Sph
ingo
mon
asm
ucos
issi
ma
DS
M17
494
(AM
2296
69)
Sph
ingo
mon
asaq
uatil
isD
SM
1558
1(A
F13
1295
)S
phin
gom
onas
mel
onis
DS
M14
444
(AB
0558
63)
Sph
ingo
mon
asin
sula
eD
SM
2179
2(E
F36
3714
)S
phin
gom
onas
abac
iDS
M15
867
(AJ5
7581
7)
Sph
ingo
mon
asau
rant
iaca
DS
M14
748
(AJ4
2923
6)S
phin
gom
onas
faen
iDS
M14
747
(AJ4
2923
9)
Sph
ingo
mon
asae
rola
taD
SM
1474
6(A
J429
240)
Sph
ingo
mon
aspr
uniD
SM
1056
6(Y
0963
7)
T
T
T
T
T
T
T
TT
T
T
T
TT
T
T
TT
T
T
T
T
T
T
T
T
Sph
ingo
mon
asm
aliD
SM
1056
5(Y
0963
8)S
phin
gom
onas
asac
char
olyt
ica
DS
M10
564
(Y09
639)
Sph
ingo
mon
asec
hino
ides
DS
M18
05(A
B02
1370
)S
phin
gom
onas
olig
ophe
nolic
aD
SM
1710
7(A
B01
8439
)
Sph
ingo
mon
asko
reen
sis
DS
M15
582
(AF
1312
96)
Sph
ingo
mon
asso
liD
SM
1831
3(A
B16
6883
)S
phin
gom
onas
aest
uarii
DS
M19
475
(EF
6607
55)
Sph
ingo
mon
asas
taxa
nthi
nifa
cie
DS
M22
298
(AB
2775
83)
Sph
ingo
mon
aska
iste
nsis
DS
M16
846
(AY
7690
83)
Sph
ingo
mon
asja
spsi
DS
M18
422
(AB
2641
31)
Sph
ingo
mon
asch
angb
aien
sis
V2M
44(E
U68
2685
)
Sph
ingo
mon
assa
nxan
igen
ens
DS
M19
645
(DQ
7891
72)
Sph
ingo
mon
ashi
stid
inily
tica
UM
2(E
F53
0202
)S
phin
gom
onas
witt
ichi
iDS
M60
14(A
B02
1492
)
Sph
ingo
mon
asha
loar
omat
icam
ans
DS
M13
477
(X94
101)
Sph
ingo
mon
asfe
nnic
aD
SM
1366
5(A
J009
706)
Str
ain
_382
DS
M25
077
(JN
5913
14)
Sph
ingo
bium
yano
ikuy
aeD
SM
7462
(D13
728)
T
T
T
T
T
T
T
T
T
T
T
T
T
T
T
T
T
T
Str
ain
_247
DS
M25
078
(JN
5913
12)
Sp
hin
go
mo
nas
leid
yiD
SM
4733
(AJ2
2781
2)T
T
Fig
. S2
. M
axim
um-p
arsi
mon
y tr
ee,
base
d on
16
rRN
A g
ene
sequ
ence
s sh
owin
g th
e re
latio
nshi
ps a
mon
g st
rain
247
, 3
82T,
Sp
hin
go
mon
as
leid
yi D
SM
473
3T a
nd o
ther
typ
e sp
ecie
s of
S
phi
ng
omo
na
s. T
he t
ree
was
con
stru
cted
usi
ng A
RB
sof
twar
e pa
cka
ge (
Ludw
ig e
t a
l.,
2004
). S
ph
ing
ob
ium
ya
noi
kuya
e DS
M 7
462T
was
use
d as
the
out
grou
p.
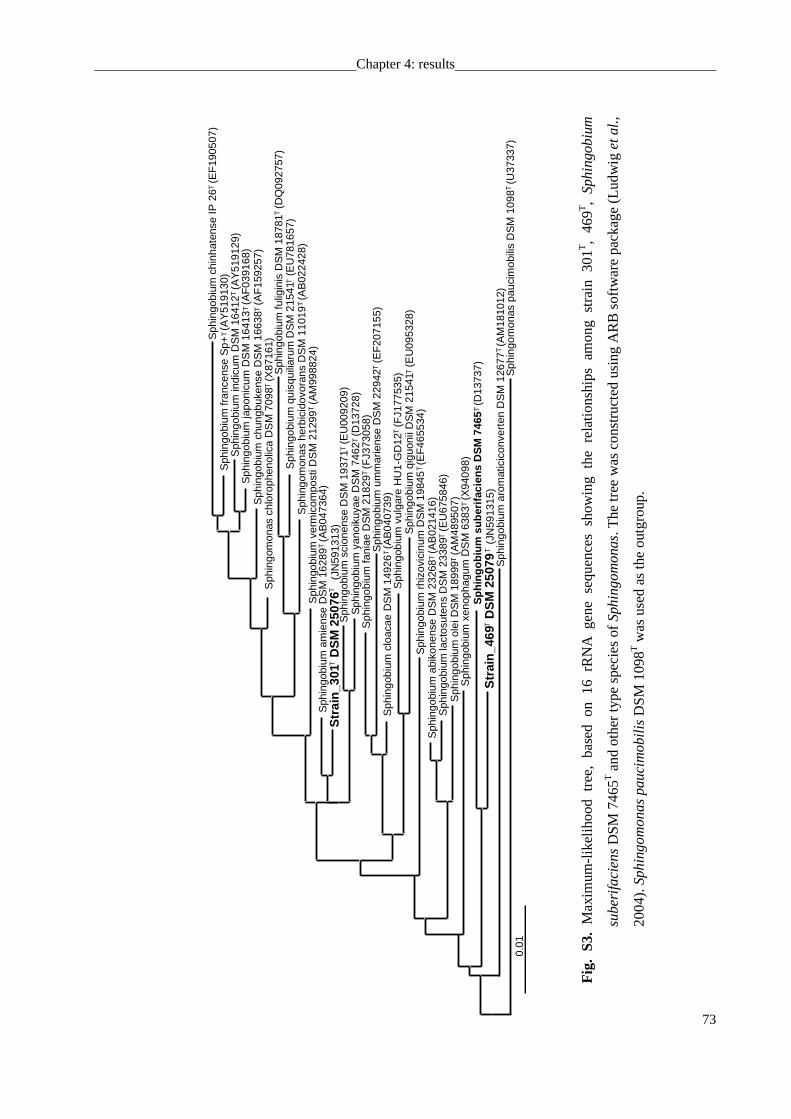
Chapter 4: results
73
0.01
Sph
ingo
bium
indi
cum
DS
M16
412
(AY
5191
29)
Sph
ingo
bium
japo
nicu
mD
SM
1641
3(A
F03
9168
)
Sph
ingo
bium
fran
cens
eS
p+(A
Y51
9130
)S
phin
gobi
umch
inha
tens
eIP
26(E
F19
0507
)
Sph
ingo
bium
chun
gbuk
ense
DS
M16
638
(AF
1592
57)
Sph
ingo
mon
asch
loro
phen
olic
aD
SM
7098
(X87
161)
Sph
ingo
mon
ashe
rbic
idov
oran
sD
SM
1101
9(A
B02
2428
)S
phin
gobi
umve
rmic
ompo
stiD
SM
2129
9(A
M99
8824
)
Sph
ingo
bium
fulig
inis
DS
M18
781
(DQ
0927
57)
Sph
ingo
bium
quis
quili
arum
DS
M21
541
(EU
7816
57)
Sph
ingo
bium
cloa
cae
DS
M14
926
(AB
0407
39)
Sph
ingo
bium
fani
aeD
SM
2182
9(F
J373
058)
Sph
ingo
bium
umm
arie
nse
DS
M22
942
(EF
2071
55)
Sph
ingo
bium
amie
nse
DS
M16
289
(AB
0473
64)
Sph
ingo
bium
scio
nens
eD
SM
1937
1(E
U00
9209
)S
phin
gobi
umya
noik
uyae
DS
M74
62(D
1372
8)
Sph
ingo
bium
vulg
are
HU
1-G
D12
(FJ1
7753
5)S
phin
gobi
umqi
guon
iiD
SM
2154
1(E
U09
5328
)
Sph
ingo
bium
abik
onen
seD
SM
2326
8(A
B02
1416
)S
phin
gobi
umla
ctos
uten
sD
SM
2338
9(E
U67
5846
)S
phin
gobi
umol
eiD
SM
1899
9(A
M48
9507
)
Sph
ingo
bium
rhiz
ovic
inum
DS
M19
845
(EF
4655
34)
Sph
ingo
bium
xeno
phag
umD
SM
6383
(X94
098)
Sp
hin
go
biu
msu
ber
ifac
ien
sD
SM
7465
(D13
737)
Sph
ingo
bium
arom
atic
icon
vert
enD
SM
1267
7(A
M18
1012
)S
phin
gom
onas
pauc
imob
ilis
DS
M10
98(U
3733
7)
T
T
T
T
T
T
T
T
T
TT
T
TT
T
TT
T
T
T
T
T
T
T
T
T
Str
ain
_301
DS
M25
076
(JN
5913
13)
TT
Str
ain
_469
DS
M25
079
(JN
5913
15)
TT
Fig
. S3
. M
axim
um-li
kelih
ood
tree
, ba
sed
on
16
rRN
A
gene
se
que
nces
sh
owin
g th
e re
latio
nshi
ps
amon
g st
rain
30
1T,
469T
, S
ph
ingo
biu
m
sub
erifa
cie
ns D
SM
746
5T a
nd o
ther
typ
e sp
ecie
s of
S
phin
go
mo
nas.
The
tree
was
con
stru
cted
usi
ng A
RB
sof
twar
e pa
cka
ge (
Ludw
ig et
al.,
2004
). S
ph
ing
om
on
as
pa
uci
mo
bili
s DS
M 1
098T
was
use
d as
the
out
grou
p.
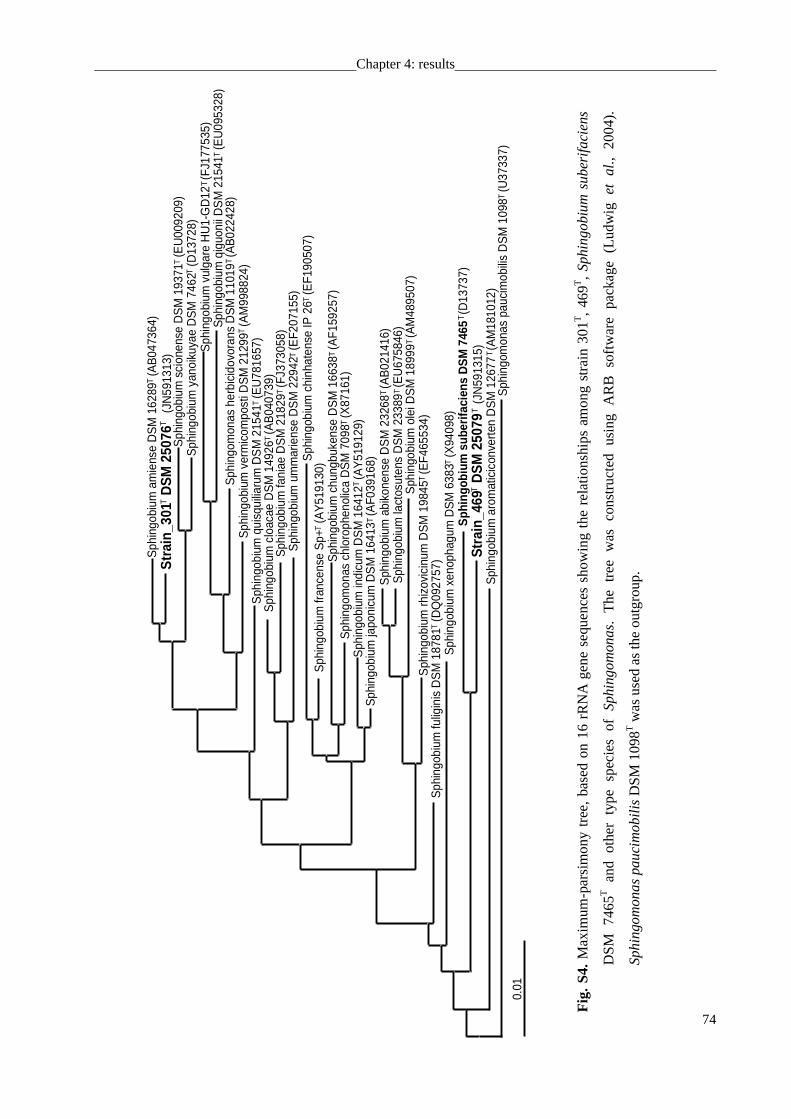
Chapter 4: results
74
0.01
Sph
ingo
bium
indi
cum
DS
M16
412
(AY
5191
29)
Sph
ingo
bium
japo
nicu
mD
SM
1641
3(A
F039
168)
Sph
ingo
bium
franc
ense
Sp+
(AY
5191
30)S
phin
gobi
umch
inha
tens
eIP
26(E
F190
507)
Sph
ingo
bium
chun
gbuk
ense
DS
M16
638
(AF1
5925
7)S
phin
gom
onas
chlo
roph
enol
ica
DS
M70
98(X
8716
1)
Sph
ingo
mon
ashe
rbic
idov
oran
sD
SM
1101
9(A
B02
2428
)S
phin
gobi
umve
rmic
ompo
stiD
SM
2129
9(A
M99
8824
)
Sph
ingo
bium
fulig
inis
DS
M18
781
(DQ
0927
57)
Sph
ingo
bium
quis
quili
arum
DS
M21
541
(EU
7816
57)
Sph
ingo
bium
cloa
cae
DS
M14
926
(AB
0407
39)
Sph
ingo
bium
fani
aeD
SM
2182
9(F
J373
058)
Sph
ingo
bium
umm
arie
nse
DS
M22
942
(EF2
0715
5)
Sph
ingo
bium
amie
nse
DS
M16
289
(AB
0473
64)
Sph
ingo
bium
scio
nens
eD
SM
1937
1(E
U00
9209
)S
phin
gobi
umya
noik
uyae
DS
M74
62(D
1372
8)S
phin
gobi
umvu
lgar
eH
U1-
GD
12(F
J177
535)
Sph
ingo
bium
qigu
onii
DS
M21
541
(EU
0953
28)
Sph
ingo
bium
abik
onen
seD
SM
2326
8(A
B02
1416
)S
phin
gobi
umla
ctos
uten
sD
SM
2338
9(E
U67
5846
)S
phin
gobi
umol
eiD
SM
1899
9(A
M48
9507
)S
phin
gobi
umrh
izov
icin
umD
SM
1984
5(E
F465
534)
Sph
ingo
bium
xeno
phag
umD
SM
6383
(X94
098)
Sph
ingo
bium
sube
rifa
cien
sD
SM
7465
(D13
737)
Sph
ingo
bium
arom
atic
icon
verte
nD
SM
1267
7(A
M18
1012
)S
phin
gom
onas
pauc
imob
ilis
DS
M10
98(U
3733
7)
T
T
TT
T
T
T
T
TT
T
T
T
T
T
T
T
TT
T
T
T
TT
TT
Stra
in_4
69D
SM
2507
9(J
N59
1315
)T
T
Str
ain_
301
DS
M25
076
(JN
5913
13)
TT
Fig
. S4
. M
axim
um-p
arsi
mon
y tr
ee,
base
d on
16
rRN
A g
ene
sequ
ence
s sh
owin
g th
e re
latio
nshi
ps a
mon
g st
rain
301
T,
469T
, S
phi
ng
obi
um
su
ber
ifaci
ens
DS
M
7465
T
and
othe
r ty
pe
spec
ies
of
Sp
hin
go
mon
as.
The
tr
ee
was
co
nstr
ucte
d us
ing
AR
B
soft
war
e pa
cka
ge
(Lud
wig
et
al.,
2004
).
Sp
hin
gom
on
as
pau
cim
ob
ilis DS
M 1
098T
was
use
d as
the
outg
roup
.
Chapter 5: discussion
75
Chapter 5
Discussion
Complex Population structure of freshwater Sphingomonadaceae
Sphingomonadaceae represent the typical constituent of freshwater bacterioplankton
communities and can be recovered by using low nutrient liquid media (Gich et al., 2005). In the
16S rRNA sequence analysis of the 95 isolates of Sphingomonadaceae, 6 phylotypes were
identified with multiple isolates. G1A was the dominant group, as was proved by a parallel study
(Jogler et al., 2011), culture independent analyses of 16S rRNA genes and 16S rRNA
demonstrated that this particular phylotype G1A in fact dominates the natural population of
Sphingomonadaceae in situ and is metabolically active throughout all seasons.
As populations of certain marine planktonic bacteria have been demonstrated to harbor
considerable DNA polymorphisms (Thompson et al., 2005; Vergin et al., 2007; Hunt et al., 2008)
the 16S rRNA can not distinguish closely related isolates. The phylogenetic analysis based on the
concatenated sequences of nine housekeeping genes from 95 strains of Sphingomonadaceae
isolated from Walchensee and Starnberger See here also reveled high DNA polymorphisms. The
genetic diversity detected for G1A strains sharing the same 16S sequence is unsually high and
significantly surpasses that of the marine oligotrophic C̀andidatus Pelagibacter ubique´
(π=0.004-0.056; Vergin et al., 2007), of Synechococcus populations in an alkaline siliceous hot
spring microbial mat (0-7.8% sequence divergence; Melendrez et al., 2011), of the soil bacterium
Bacillus simplex (π=0-0.05; Sikorski and Nevo, 2005), of the human pathogens Vibrio cholerae
(0-5.9% sequence divergence for concatenated sequences; Keymer and Boehm, 2011) and
Neisseria meningitidis (S=3.4-27.1%; Jolley et al., 2005), and of the plant pathogen
Pseudomonas syringae (π=0.042-0.100; Sarkar and Guttman, 2004, θS = 0.0032-0.0145
bp-1generation-1; Yan et al., 2008). Bacteria with identical 16S rRNA phylotypes in some cases
have been suggested to harbour ecologically distinct subgroups that differ with respect to
morphology, carbon substrates, maximum growth rate, and internal transcribed spacer (ITS)
sequence types (Jaspers and Overmann, 2004), with respect to fatty acid composition, growth
rates under temperature stress, and carbon substrates (Sikorski and Nevo, 2007; Koeppel et al.,
2008; Sikorski et al., 2008a,b), or genomic structure, metabolomes and phage susceptibility
(Peña et al., 2010). It has previously been suggested that populations that have not yet been
Chapter 5: discussion
76
purged by periodic selection or drift may hold up to 1-2% sequence divergence in concatenated
housekeeping genes (Koeppel et al., 2008). The significantly higher genetic diversity of G1A
prompted us to conduct a detailed analysis of the population substructure of the freshwater
Sphingomonadaceae, of the underlying evolutionary forces and the associated physiological
diversity.
Theoretically, the population substructure of the freshwater Sphingomonadaceae isolates
suggested by MLSA could be the result of some unknown selection bias during cultivation. The
splitstree analysis of the gyrB gene from environmental DNA was compared with the gyrB from
isolates. The results proved that the inclusion of cultivation-independent clones did not provide
evidence for a continuum of divergence and supports the conclusion of a distinct population
substructure of the freshwater Sphingomonadaceae in Walchensee and Starnberger See.
Evolutionary forces underlying the population structure
MLSA revealed the presence of distinct subgroups among individual 16S rRNA sequence
types, suggesting different selection pressure between subclusters and the existence of distinct
evolutionary units despite the identical or very similar 16S rRNA gene sequences. The high
divergence suggests these strains experienced marked evolutionary events.
The presence of numerous polytomies in the consensus tree indicated a significant effect of
recombination on the population structure. Indeed, an initial phi test for recombination (Bruen et
al., 2006) also revealed statistically significant evidence for recombination for the entire dataset.
The population recombination rates calculated from the individual genes for all strain or only
from G1A strains are comparable with the gene-specific values that are available for Bacillus
simplex (0-0.042 bp-1generation-1; Sikorski and Nevo, 2005) Pseudomonas syringae
(0.0012-0.155 bp-1generation-1; Yan et al., 2008), and Neisseria meningitidis (0.003-0.034
bp-1generation-1; Jolley et al., 2005). This result makes the presence of extraordinarily effective
recombination barriers between the different Sphingomonadaceae genomes rather unlikely. The
population mutation rate surpassed the values reported. All the data from phylogenetic analysis
place the freshwater Sphingomonadaceae isolates in the middle rank list of homologous
recombination rates determined for approximately 48 species (Vos and Didelot, 2008). Most
notably, the relative impact of recombination on population structure in the freshwater
Sphingomonadaceae isolates is markedly lower than in most of the other free-living aquatic
bacteria investigated, including `Candidatus Pelagibacter ubique´, Vibrio parahaemolyticus, V.
vulnificus and Microcystis aeruginosa for which r/m values between 18.3 and 63.1 were
Chapter 5: discussion
77
determined (Vos and Didelot, 2008). Based on the phylogenetic analysis, the ρ/θS values from
every gene of all strains and G1A strains were smaller than 0.25 except the tuf gene. Normally,
the clonal bacterial populations has this value below and sexual populations above the values of
0.25 - 2.0 (Fraser et al., 2007). Additionally, the estimate of θS and Ne are larger than those used
in these simulations. So, the low ratios ρ/θ determined for freshwater Sphingomonadaceae still
suggest that their population structure is clonal rather than sexual.
Linkage equilibrium was used to determine the sufficiency of recombination. The values of
the standardized index of association (IAS) of eight individual subpopulations were low and not
significant, suggesting that the recombination within the eight individual subpopulations is rather
free or panmictic. In contrast, all pairwise combinations of eight subpopulations yielded large
and significant IAS values, suggesting barriers for free recombination between subpopulations
(linkage equilibrium). Similar to the freshwater Sphingomonadaceae, a significant linkage
disequilibrium has been detected in Vibrio cholerae despite a considerable frequency of
recombination (IAS=0.143-0.439; Keymer and Boehm, 2011). With the null hypothesis of free
combination between the eight different subpopulations being rejected, the results of our
multipronged recombination analysis thus indicate incipient sexual isolation but not a full
inhibition of homologous recombination between the eight subpopulations identified by MLSA.
This sexual isolation may be the result of niche separation and/or genetic barriers and obviously
even exists between the three subpopulations of the identical 16S rRNA phylotype G1A.
The Tajima´s D and MacDonald-Kreitman (MK) tests were used to test selective neutrality.
Although both tests can be used to detect deviation from neutral evolution, they address different
characteristics of the sequence divergence and may therefore yield different results. The results
of Tajima´s D indicate a lack of selection pressure and also a lack of recent demographic events
such as bottlenecks or population expansion in generating the nucleotide diversity observed for
the nine housekeeping genes. The MK test, in contrast to Tajima´s D test, distinguishes between
polymorphic and fixed substitutions at both synonymous and nonsynonymous sites. When the
MK test was applied to study whether selection pressure may have been important in separating
the observed eight individual subpopulations, neutrality indices did not yield any evidence for
selection pressure acting within these clusters. And the deviations from the neutral model
detected between the larger clusters G1A, G2, and G3 and only for some of the genes, suggest
that any potential selection pressures driving the divergence of the subgroups like G1A1, G1A2,
and G1A3 do not act on the nine housekeeping genes studied here.
Natural selection is strong in large populations, whereas random genetic drift increases in
Chapter 5: discussion
78
power for small populations. The Ne values detected here for the freshwater Sphingomonadaceae
belong to the largest values determined in a comparative study for a diverse set of prokaryotes
(Lynch and Conery, 2003). Hence, the power of random genetic drift to shape the observed
population structure most likely has been low. Recent bottlenecks may create scenarios in which
Ne is temporarily reduced, allowing for a larger possibility of drift to fix differentiating
nucleotides in cladogenesis. And the Tajima´s D values were generally close to zero, which does
not allow to deduce recent bottlenecks but rather suggest a stable long-term population structure.
Finally, the Sphingomonadaceae dispersed evenly across the subpopulations indicating that at
least short-distance geographic barriers did not affect the population structure.
Metabolic diversification and its role in niche invasion
Ecotype Simulation tries to model the evolutionary dynamics of bacterial populations based
on sequences, then to thereby identify the ecotypes within the natural community. Here, an
ecotype is modeled as an ecologically distinct group, the diversity is limited by cohesion, and
genome-wide diversity is purged by periodic selection and genetic drift. Ecotype Simulation (ES)
has the advantage to be independent of the availability of environmental data associated with the
different MLSA types (Koeppel et al., 2008; Connor et al., 2010). The results of the ES
performed for all housekeeping genes suggested that the 8 clonal subpopulations identified each
consist of several putative ecotypes. The large numbers of putative ecotypes hypothesized by
Ecotype Simulation to exist within the G1A group suggests an enormous ecological diversity
within the single 16S phylotype of G1A.
Biolog Gen III microplates were chosen for the phenotypic analysis of 48 strains from all
groups. The results of the assessment of phenotypic differences in different levels of population
substructure can provide a “phenotypic fingerprint” of the bacteria which can then be used to
identify the strains at the species level. Besides addressing the ability of the cell to metabolize as
sole carbon source representatives from all major classes of biochemicals, the Gen III microplate
also contains 23 chemical sensitivity assays for the detection of the important physiological
proterties like pH, salt, lactic acid tolerance, reducing power and chemical sentitivity (Biolog,
part 00A 0XX, Rev A 08/2007). There is a difference between G1A strains to G2 and G3 strains
in the utilization of several sugars and their monomeric constituent. The inability of monomeric
constituents utilization may suggest a lack or inactivity of glycosidic enzymes or of respective
disaccharide transporters of strains from G1A group. The phylogenetically closest genomes of
Novosphingobium aromaticivorans DSM 12444T (NC_007794), Novosphingobium sp. PP1Y
Chapter 5: discussion
79
(NC_015580), Sphingobium japonicum UT26T (NC_014006, NC_014013), Sphingopyxis
alaskensis RB2256T (NC_008048), and Sphingomonas wittichii RW1T (NC_009511) revealed
multiple genes for glycosidic exoenzymes that typically clustered together, whereas suitable
transporters for the oligosaccharides substrates were not detected. Possibly, oligosaccharide
substrates are hydrolyzed outside of the cell and the monomers imported through a PTS system.
Interestingly, Sphingomonas wittichii RW1T has no genes for glycosidic exoenzymes, which
could suggest loss of these genes by deletion. In a similar manner, the absence of glycosidic
exoenzyme activity in the G1A group may be due to absence of the gene or alternatively, an
impaired sec-pathway.
The diversity of the phenotype increases only when all groups were combined, suggesting
that the phenotypic similarity in general only reflects the split into the major groups as identified
by the 16S rRNA phylogeny, but not the subpopulation within the identical 16S rRNA
phylotypes. The G1A strains differ substantially from G2 and G3, but are quite homogeneous,
and do not split phenotypically into the observed MLSA subgroups. Whereas our phylogenetic
population genetic and ecological modeling analyses are consistent and provide strong evidence
for the existence of ecologically distinct groups, the physiological testing clearly demonstrated
distinguishing traits between the major groups of Sphingomonadaceae that had different 16S
rRNA phylotypes, but selective adaptations that may be involved in the specific adaptations and
niche invasion of the G1A subpopulations were not found among standard metabolic traits. In
sum, the tested phenotypic traits apparently do not account for the split into the G1A MLSA
groups, suggesting that other selection pressures must be active.
The application of MLSA to systematics
The 'species' category is regarded to be the fundamental taxonomical unit in the microbial
world. MLSA has since long been considered to be a very powerful genotyping tools in the study
of the evolution and population structure of microbial organism and also represents a novel
standard in microbial molecular systematics. In order to differentiate bacterial strains at the level
of the 'species' category, normally at least two genotypic methods are needed. The results of
these two methods must be coherent to each other. The first method is comparing 16S rRNA
gene sequences to determine the genetic distance between isolates at the level of the 16S rRNA.
Distance values of 16S rRNA gene sequences above 3% are thought to be clearly discriminative
at the species level, above 5% at the genus level, above 10% at the family/class level (Schloss &
Handelsman, 2004; Stackebrandt et al., 2002). In this study, we found that strains of
Chapter 5: discussion
80
Sphingomonadaceae were identical in their 16S rRNA gene sequence but nevertheless comprised
distinct genotypes at the level of housekeeping genes. The MLSA results of concatenated
sequences of nine housekeeping genes was used to infer their phylogeny by means of a
distance-matrix. This approach is expected to have an increased resolving power due to the large
number of characters analyzed (6972 bp), and a lower sensitivity to the impact of conflicting
signals (i.e. phylogenetic incongruence) that result from eventual horizontal gene transfer events
(Rokas et al., 2003). Genetic distance of concatenated sequences was compared with whole
genomic DNA-DNA hybridization (WDDH). Based on our distance matrix, the similarity value
of the concatenated sequences of subpopulations below 0.75 should be different genera, and the
value above 0.94 should be the same species. So, further investigations and a broader collection
of the bacteria are needed. The MLSA similarity value of 97.9%, therefore, appears to be useful
as a cut-off to differentiate B. burgdorferi s. L. species. B. spielmani appeared to be closely
related to one other, while differing from other species by similarity values of 92.1%-94.8%
(Richter et al., 2006). For the genus Bacteroides, concatenated sequences of three housekeeping
genes (dnaJ, gyrB and hsp60) with cut-off value 97.5% similarity were reliable for species
delineation (Sakamoto et al., 2011). Studies of Alteromonas macleodii (Ivars-martinez et al.,
2008) and Agrobacterium (Aujoulat et al., 2011) demonstrate that robust phylogeny and species
differentiation can be achieved with MLSA of only several marker genes. MLSA has been used
successfully to explore clustering patterns among large number of strains assigned to very
closely-related species by current taxonomic method (Godoy et al., 2003; Hanage et al., 2005a, b,
2006; Hoshino et al., 2005; Bennett et al., 2007; Kilian et al., 2008; Bishop et al., 2009), to look
at the relationships between small numbers of strains within a genus (Martens et al., 2008), or
within a broader taxonomic grouping (Sawabe et al., 2007). If performed with a sufficient
number of appropriately selected loci, the sequences derived from MLSA could also be used to
infer the average nucleotide identity (ANI) of the genomes and also to calculate the genome-
to-genome distance (GGD), the latter two methods were suggested to substitute DDH by
bioinformatic method in species delineation (Richter and Rossello-Mora, 2009; Auch et al.,
2010). The clustering of strains obtained by MLSA is strongly associated with the clustering
from DNA-DNA relatedness values. Therefore, MLSA constitutes a valuable alternative to
laborious DNA-DNA hybridization (Richter et al., 2006).
Now, an electronic taxonomic way for bacteria using MLSA is available as eMLSA
(www.emlsa.net), it is the implementation of the MLSA approach to the assignment of strains to
species clusters via the internet (Bishop et al., 2009). eMLSA requires the generation of a large
Chapter 5: discussion
81
database and the software for concatenating the sequences and producing a tree to show the
clustering pattern of the sequences of the multiple house-keeping loci (typically about seven loci)
from multiple strains of a set of related species of interest. By comparing the assignments of the
strain within each cluster and the position of the type strain of each species, every strain can be
assigned into species clusters. To assign the query strain correctly, a sufficiently large database is
needed. At moment, there are only two databases (Viridans group streptococci and Burkholderia
spp.) available, more effort is needed.
Polyphasic analysis in differentiating species
A strain identified as ‘Caulobacter leidyi’ was used in the MLSA analysis, which revealed
that it should be affiliated to Sphingomonadaceae. A polyphasic analysis was performed with the
strain of this species. The genus Caulobacter was originally described in 1935 (Henrici &
Johnson, 1935) and later amended to comprise a variety of dimorphic prosthecate bacteria
(Poindexter, 1981b, 1989; Schmidt 1981). Prior to nucleotide sequence analysis, species of the
genus Caulobacter were distinguished based on their cell morphology, salt tolerance, carbon
substrate utilization and growth factor requirements (Poindexter, 1989). Subsequently, 16S rRNA
gene sequence comparisons revealed that bacteria exhibiting a developmental life cycle with
asymmetric binary fission are paraphyletic and form at least 6 phylogenetically distant groups,
suggesting that prosthecate morphology developed several times, or was lost repeatedly, during
the evolution of the Alphaproteobacteria. Besides members of the genus Caulobacter sensu
strictu (Caulobacter group III.; Garrity et al., 2005) that include Caulobacter crescentus, C.
fusiformis, C. henrici and C. vibrioides, dimorphic representatives are found in the related genus
Brevundimonas (B. alba, B. aurantiaca, B. bacteroides, B. intermedia, B. subvibrioides, B.
variabilis; group IV.), and in the distantly related genera Asticacaulis (A. biprosthecium, A.
excentricus; group II.) and Maricaulis (M. maris; group V.) (Abraham et al., 1997, 1999, 2001;
Garrity et al., 2005). More recently, a prosthecate representative of the genus Phenylobacterium
(P. conjunctum FWC21T) was described (Abraham et al., 2008). A sixth lineage is represented by
strain CB37T = ATCC15260T = DSM4733T that was originally described as Caulobacter leidyi
(Poindexter, 1964). 16S rRNA gene sequence analyses showed that this strain is affiliated with
the family Sphingomonadaceae (Stahl et al., 1992; Garrity et al., 2005). As a consequence, C.
leidyi was excluded from the genus Caulobacter, omitted from Bergey’s Manual of Systematic
Bacteriology and removed to limbo (Garrity et al., 2005). Although the isolation of additional
strains (strains WCP 2020S, CB 296 and an unnamed representative from Lake Baikal) has been
Chapter 5: discussion
82
reported (Garrity et al., 2005; Lapteva et al., 2007), no further information on their properties is
currently available. Due to the limited physiological and chemotaxonomic information available
for strain DSM4733T and the lack of additional strains, a taxonomic revision of this lineage is so
far missing.
The results of the phylogenetic analysis of 16S rRNA gene sequences indicate that DSM
4733T and strain 247 represent a novel species within the genus Sphingomonas and the family
Sphingomonadaceae. Both 16S rRNA gene sequences also include all 7 signature sequences of
Sphingomonadaceae but none of those determined for Caulobacteraceae or other
Alphaproteobacterial families (Yabuuchi & Kosako, 2005). Aside from 16S rRNA gene sequence
similarity, two biochemical characteristics, the fatty acids patterns and polar lipids composition
of strain DSM4733T point towards a distinct taxonomic position of this strain and support an
affiliation with the family Sphingomonadaceae. The holdfast of this strain does not bind
wheat-germ agglutinine and does not contain oligo-N-acetylglucosamine that participates in
adhesion as in most Caulobacter spp. (Garrity et al., 2005). Whereas hexadecanoic acid (C16:0)
and octadecenoic acid (C18:1ω7c/C18:1ω9t/C18:1ω12t) represent the dominant non-polar fatty acids
in members of the Caulobacteraceae and Sphingomonadaceae alike, the dominance of
hydroxymyristic acid (C14:0 2OH) is diagnostic for Sphingomonadaceae since this compound is
missing in the Caulobacteraceae (containing C12:1 3OH or, C12:0 3OH in the closely related
Brevundimonas species). Strain DSM4733T contains 2-hydroxy myristic acid (C14:0 2-OH) as a
dominant fatty acid (Abraham et al., 1999). This feature is unique among all known dimorphic
prosthecate bacteria yet characteristic for the Sphingomonadaceae where glucuronosyl ceramide
and 2-hydroxy myristic acid replace the lipopolysaccharides that are present in the cell wall of
other bacteria (Yabuuchi & Kosako, 2005). The presence of sphingoglycolipids is the key
characteristic that defines the genus Sphingomonas and the family Sphingomonadaceae, and
together with phosphatidylcholine, distinguished both investigated strains from the
Caulobacteraceae or other prosthecate Alphaproteobacteria (Abraham et al., 1999; Yabuuchi &
Kosako, 2005).
The characteristics such as the use of sym-homospermidine as the dominant polyamine, the
presence of cystine arylamidase (variable in DSMZ 4733T), the absence of β-galactosidase, and
the lack of L-arabinose and sucrose utilization (Table 4; Takeuchi et al., 2011) distinguish strain
DSM 4733T and strain 247 from most other Sphingomonadaceae. So far, the dimorphic life cycle
that involves a prosthecate and a flagellated stage is unique among the Sphingomonadaceae.
Based on a detailed comparative phylogenetic analysis of 16S rRNA gene sequences of strain
Chapter 5: discussion
83
DSM 4733T and strain 247 which shows them to be phylogenetic closely related to species
Sphingomonas aquatilis, both of them showing all seven signature sequences determined for the
genus Sphingomonas, and based on the physiological and chemotaxonomic characterization of
strain DSM4733T and strain 247, we propose to reclassify as Sphingomonas leidyi comb. nov. as
species name for this unique lineage of prosthecate dimorphic bacteria within the family
Sphingomonadaceae.
The genus Sphingomonas was named by Yabuuchi et al. (1990) because of the presence of a
specific sphingoglycolipid, and later emended by Takeuchi et al. (1993, 2001), Yabuuchi et al.
(1999, 2002) and Busse et al. (2003). Strains in this genus are strictly aerobic, chemoheterotrphic,
Gram-negative, rod-shaped and contain sphingoglycolipid. Until 2001, there were around 30
species affiliated to this genus. The phylogenetic analysis of their nearly complete 16S rRNA
gene sequences were clearly divided into four clusters and supported by high levels of bootstrap
values. The sequence similarity between different clusters were ranging from 92.6% to 96.6%
suggesting each cluster corresponds to a single genus. Simultaneously, their chemotaxonomic
and phenotypic analysis results supported this division and provided additional information to
differentiate them. Integrated the phylogenetic, chemotaxonomic and physiological differences,
genus Sphingomonas was divided into four genera: Sphingomonas sensu stricto, Sphingobium,
Sphingopyxis and Novosphingobium (Takeuchi et al., 2001). Genus Sphingomonas sensu stricto
differ with other genera by homospermidine as the major polyamine, Major 2-hydroxy fatty
acids are 2-OH 14:0 or 2-OH 15:0. Phylogenetic characteristic of 16S rRNA signatures are found
at position 52:359 (C: G), 134 (G), 593 (G), 987:1218 (G: C) and 990:1215 (U: G) (Takeuchi et
al., 2001). The type species is Sphingomonas paucimobilis (Yabuuchi et al., 1990). Genus
Sphingobium differs with other by Spermidine as the major polyamine, the major 2-hydroxy fatty
acids is 2-OH 14:0. Characteristic 16S rRNA signatures are present at positions 52:359 (U:A),
134 (G), 593 (U), 987:1218 (A:U) and 990:1215 (U:G). The type species is Sphingobium
yanoikuyae (Yabuuchi et al. 1990). At the time of writing, these four genera contain 122 species
with validly published names. Among these 122 species, 64 strains were affiliated to genus
Sphingomonas, 24 to Sphingobium, 15 to Sphingopyxis, and 19 to Novosphingobium
(Information from List of Prokaryotic names with Standing in Nomenclature (LSPN)
http://www.bacterio.cict.fr/, accessed on Aug. 31. 2011).
Based on the newest phylogenetic analysis of 16S rRNA gene sequences (Last update in
August 2011), the genera Sphingobium, Sphigopyxis and Novosphingobium were found to form
distinct clusters, however, the genus Sphingomonas appeared to be paraphylectic as there were
Chapter 5: discussion
84
some Sphingomonas species affiliated to the other 3 genera like Sphingomonas macrogoltabidus,
S. adhaesiva, S. terrae in the genus Sphingopyxis and Sphingomonas chlorophenolica, S.
suberifaciens placed in genus Sphingobium. The time of the description of these species were
checked and all of them were found be described and named before the division of genus
Sphingomonas in 2001 (Takeuchi et al., 2001). It suggests that these Sphingomonas species fall
into the genera Sphingobium, Novosphingobium and Sphingopyxis maybe merely misclassified.
In this analysis, the closest species to the strain 469T was Sphingomonas suberifaciens,
which seems to be misclassified according to the polyphasic analysis presented here.
Sphingomonas suberifaciens was first identified as Rhizomonas suberifaciens by Van Bruggen et
al. (1990). Then this species was emended as Sphingomonas by Van Bruggen et al. (1993) and
Yabuuchi et al. (1999). All this happened before the division of genus Sphingomonas to 4 genera
(Takeuchi et al., 2001). Based on the melting temperature of the of the rRNA hybrids of
Rhizomonas suberifaciens and other Sphingomonas species detected by Van Bruggen et al.,
(1993), R. suberifaciens (Later named as Sphingomonas suberifaciens) and Sphingobium
yanoikuyae belong to the same branch but not with Sphingomonas paucimobilis. This affiliation
was supported by the phylogenetic clustering pattern of 270 bp of the 16S rRNA gene sequences
analysis. In the phylogenetic analysis of the the 16S rRNA gene sequence, the species
Sphingomonas suberifaciens clustered with the genus Sphingobium instead of with the genus
Sphingomonas, and the 16S rRNA gene sequence also revealed all the seven signature
characteristics of genus Sphingobium. This result was also supported by polyamine and fatty
acids analysis, the major polyamine of Sphingomonas suberfaciens was spermidine but not
homospermidine, the 2-hydroxy fatty acids was only 2-OH 14:0 (Takeuchi et al., 2001). All
other phenotypic characteristics of this strain fitted to the description of genus Sphingobium, so
this species was reclassified as Sphingobium suberfaciens.
For the new isolate strain 469T, even the seven 16S rRNA signature characteristic of strain
469T is not the same as genus Sphingobium, but it also not the same genus Sphingomonas
(Takeuchi et al., 2001), the phylogenetic analysis showed that it clustered within genus
Sphingobium not with genus Sphingomonas. The most closely related species were
Sphingomonas suberifaciens with 97.1% similarity of the 16S rRNA gene sequence. But the
DDH analysis shown these two species to represent two different species. The polyphasic
analysis of the species Sphingomonas suberifaciens showed this species to be misclassified,
leading to its reclassification as Sphingobium suberifaciens. Typical physiological and
chemotaxonomic characteristics of strain 469T are: 2-OH 14:0 as the major 2-hydroxy fatty acids,
Chapter 5: discussion
85
spermidine as the major polyamine, and the cells could not reduce nitrate to nitrite. So,
concluding from all the characteristics of the polyphasic analysis, strain 469T was identified as a
new member of the genus Sphingobium.
Niche adaptation and speciation
Polyamines are compounds existing in all living organisms; their functions are related to the
nucleic acids and protein biosynthesis and they are also important constituent of the cell. The
distribution pattern of polyamines can also be used in the chemosystematics of some bacteria. In
this study, the major polyamines were determined from 4 strains representing 4 subpopulations
as revealed by the MLSA analysis. The pattern of polyamines is in good agreement of the
clustering patterns deduced from MLSA. Strain 247 and 382 had sym-homosperidine as the
major polyamine and were clustered into genus Sphingomonas. Strain 301 and 469 had
spermidine as the major polyamine and were clustered into genus Sphingobium. Both of these
two polyamines are triamines, homospermidine can be formed from spermidine and their
function can be exchangeable in some species. But spermidine is the so called 'common'
polyamine and homospermidine is 'uncommon', therefore, they may serve in adaptation of
bacteria to some extreme environments. Homospermidine was reported in extremely
thermophilic bacteria and nitrogen-fixing cyanobacteria. Also, homospermidine may play a role
in the nitrogen cycle (Oshima and Baba, 1981; Hamana et al., 1983; Kaiser et al., 2003). In the
comparison of the two genera Sphingomonas and Sphingobium, the difference in nitrate
reduction is correlated to their major polyamine. For the genus Sphingomonas, the major
polyamine is sym-homospermidine and there were some studies showed strains in this genus was
able to reduce nitrate which is also part of the nitrogen cycle (Takeuchi et al., 2001), so maybe
there are connections of the existence of homospermidine and the ability of nitrate reduction.
The pattern of antibiotics resistance can be vary between strains from the same species
(Baquero and Coque, 2011). In this study, the strain 247 and DSM4733T, which belong to the
same species Sphingomonas leidyi, show only small differences in the resistance to the
antibiotics colistin, kanamycin and fosfomycin. Inferring from the high diversity of the
subpopulation of bacterial species, some of them acquired the ability by adaptating to their own
special niches. Bacteria produce antibiotics to compete for nutrient sources. To survive, they
must become resistant to the antibiotics around them. The ability of antibiotic resistance comes
from mutations or acquiring new genes encoding the resistant mechanism. The different in the
ability of rifampin resistance between group G1A, G2 and G3 is mostly due to mutation. Strains
Chapter 5: discussion
86
from the G1A group are susceptible to antibiotic rifampicin but strains from other groups are
resistant to it. In several organisms, rifampicin resistance is provided by single amino acid
changes in the RifR clusters at positions 500- 600 of the RpoB polymerase protein (Kim et al.
2005). These mutations prevent the binding of the antibiotic to the RpoB polymerase. Since such
typical substitutions could not be detected in our isolates, other mechanisms such as altered
membrane permeability could acount for the resistance to rifampicin (Abadi et al., 1996) and
potentially also for the resistance to several other inhibitory substances (see Fig. 9). The resistant
to vancomycin and ampicillin belongs to the second way in which the resistant strains received
the gene from others and then changed their cell wall, the strains from G1A group differ to
strains from other groups by its resistance to vancomycin. Vancomycin has high affinity to the
dipeptide D-Ala-D-Ala C-terminus. This dipeptide is used in the formation of Uracil
diphosphate-N-acetylmuramyl-pentapeptide (precursor of peptidoglycan). Those strains are
resistant to vancomycin because of the acquiring of the new operons, which encoded the
enzymes to synthesis a lower vancomycin binding affinity peptidoglycan precursor. The
C-terminal D-Ala is replaced by the new synthesizd low affinity D-Lac or D-Ser (Courvalin,
2006). For ampicillin, strain 247 and 382T cluster in a genus which shows resistance to
ampicillin, whereas strain 301T and 469T are affiliated to a genus can not resist to it. Strain 247
differs from other three strains by the resistance to kanamycin and erythromycin. The resistance
to kanamycin is most probably due to the enzymatic inactivation of the antibiotic. The resistance
to erythromycin is probably caused by modification the antibiotic attacking or binding site
(Courvalin, 2006; Shaw et al., 1993; Pechere et al., 2001; Brown, 2008).
Antibiotic resistance is linked to the metabolism of the bacteria. Most strains that are
resistant to vancomycin also show positive reaction to substrates N-acetyl-D-glucosamine.
N-acetyl-glucosamine (GlcNAc) and N-acetyl-muramic acid (MurNAc) are the basic precursors
of peptidoglycan. Representative strains from subpopulations G3B (strain 247) and 382T are
resistant to ampicillin, this antibiotic functions similar to vancomycin by binding to
peptidoglycan precursors (Sauvage et al., 2008). Strain 301T from subpopulation G2D and strain
469T cannot resist to ampicillin, vancomycin and penicillin. This result corresponds well with the
clustering patterns. The former two strains are clustered into genus Sphingomonas, the latter two
are clustered into the genus Sphingobium. So, that may be the reason why they exhibit the
positive reaction to the substrates N-acetyl-glucosamine. It can also be connected to the
formation of sphingoglycolipid (SGL). There are five molecular species of Sphingoglycolipid,
labelled as SGL-1, SGL-1', SGL-2, SGL-3, SGL-4. For all 26 strains of Sphingomonadaceae
Chapter 5: discussion
87
used in the SGL analysis, the SGL-1, SGL-2, SGL-3, SGL-4 have been detected from
Sphingomonas but no SGL-1' (The four species Sphingomonas herbicidovorans, S. subterranea,
S. ursincola and 'S. xenophaga' which contains SGL-1' were not in the genus Sphingomonas
sensu stricto (Takeuchi et al., 2001)). S. herbicidovorans and S. xenophaga are in genus
Sphingobium, and 'S. xenophaga' now is reclassified as Sphingobium xenophagum. S.
subterranea affiliated to the genus Novosphingobium and S. ursincola is in the genus
Blastomonas). SGL-1, SGL-1' have been found in Sphingobium. The polar lipids analysis of
strain 247 shows two kinds of SGL, and it is affiliated to the genus Sphingomonas which means
they must have one kind of SGL-2, SGL-3 or SGL-4. The formation of the two kinds of SGL in
Sphingobium does not need the glucosamine as moiety, but the glucosamine is one of the
moieties in the formation of SGL-2 SGL-3 and SGL-4 (Kawahara et al., 1999, 2000; Yabuuchii
and Kosako, 2005). Strain 247 needs the moiety glucosamine for the SGL synthesis and it shows
the positive reaction to N-acetyl-glucosamine in the BiOLOG and API assay. Maybe there are
some connections between the utilization of N-acetyl-glucosamine as nutrient sources and the
synthesis of glucosamine for the cell wall and membrane, or both of them are parts of the cycle
of glucosamine, For details, more studies are needed.
Different species have different number of sphingoglycolipids and kinds of carbohydrates
(glucuronic acid, glucosamine, galactose and mannose). In Sphingomonadaceae cells, the
chemical structure, function, and distribution of SGL have been reported to replace
lipopolyaccharide (LPS) in the cell wall of Gram-negative rods. The composition of the SGL in
all strains of this family contains a 2-hydroxy acid, makes the detection of 2-hydroxy acid be a
systematic character for this family. The carbohydrate of SGL is shorter and simpler than LPS, it
makes the cells become more hydrophobic and allows more hydrophobic substrates to get into
the cell (Kawahara et al., 1999). That may be the reason for all the four tested strains cannot
resistant to the hydrophobic antibiotics erythromycin and polymyxin B. For the fatty acid
profiles, respiratory quinone and polar lipids patterns of the four representative strains, even
these results could be affected by the growth condition (temperature, light and medium), all
results determined in this study supported the phylogenetic relationships of them and fitted to
their taxa. The ability to be resistant to antibiotics is affected by different mechanism, and has
high diversity inside one species, so it is not useful in systematics but it can provide important
information about the described strains, such as the metabolic capability diversity.
The phenotypic divergence determined from the BiOLOG analysis cannot distinguish all
strain sharing the same 16S rRNA phylotype. The 33 traits depicted in Fig. 8 shows significant
Chapter 5: discussion
88
variation between the larger group G1A, G2 and G3. There are even some significant differences
within the subpopulations. Bacteria need the carbohydates as energy sources and use them as
substrates to build up their cell structures. Their ability to grow or adapt to different
environments also based on their ability to utilize different nutrients. While comparing strains
from G1A to other groups, they are not able to utilize some sugars like maltose, sucrose, gelatin
which are important for energy metabolism or are the substrates of biosynthesis of their
macromolecules. This maybe one reason for the slower growth and reproduce rate, and far more
limited growth conditions (narrow range of pH and temperatures) of strains in this group.
The strains in the G1A groups which have the same 16S rRNA gene sequence phylotypes
probably derive from the same ancestor. From the MLSA results, many putative ecotypes
co-existing in this population were deduced by ecotype simulation. Strains in the same
subpopulation or ecotype may use different substrates, they adapted to the resources and
competed for it, hence, their metabolic capabilities may give insights of their evolutionary
history. Different strain may experience different ecological niches; the supplement of the
resource is a kind of driving force of their evolution. Strains of the same species from distinct
ecological niches can evolve different metabolic strategies. Studies on the metabolic traits of
Saccharomyces cerevisiae from different original showed to express different life-history
strategies according to their ecological niches (Spor et al., 2009). The metabolic traits of a strain
can illustrate the adaptation history to different ecological niches.
Mutation and horizontal gene transfer play important role in bacterial adaptation. By the
chance of modifying their genes, bacteria can acquire the ability to adapt. For different strains in
an ecotype, initiative mutations and niche-invasion mutations drive some of the strains to explit
nutrient resources, to obtain ecological properties and finally become a new ecotype. And they
can also acquire the alleles providing higher fitness by homologous recombination or horizontal
gene transfer. Most of the changes of the capability of the utilization of different substrates are
likely due to gene loss or acquisition. For strain 247, which differs to the other strain by
resistance to penicillin, may have acquired this ability by this way. Similar resistance gain has
been reported for Streptococcus and Neisseria (Maynard Smith et al., 1991). For strains in the
same subpopulation, they may not differ in their overall ability to utilize the same set of
substrates, but they may have tiny difference in the quantitative levels. For the strain 247 and
strain DSM 4733T, both affiliated to Sphingomonas leidyi, strain 247 has a strong positive
reaction to cystine arylamidase and trypsine, but DSM 4733T has only a weak positive reaction
to these two substrates. This difference is most likely due to the mutation or modifying of the
Chapter 5: discussion
89
respective genes. Using the ecotype simulation, several putative ecotypes were deduced based on
the housekeeping genes used in MLSA. Different ecotypes most probably occupy different
ecological niches. Either by mutations or horizontal transfer of a gene, a strain may gain or
increase it ability of utilize a substrate, this mutant can exist together with its progenitor strain
but may be more adaptive to the same ecological environment (Cohan, 2004, Feldgarden et al.,
2003). For the strains of group G1A, they are slowly growing and have small size of the cells,
and they lost the ability to utilize some sugars. In this study, the result showed that they are
adapted to the oligotrophic freshwater environment, they can be more tolerant to harsher
environmental conditions (low temperature around 4°C in winter) because they are found to be
the most abundant group in our isolation and in situ natural population (Jogler et al., 2011). They
have high genetic diversity and contain lots of putative ecotypes maybe because of the strains
evolved by gradual evolution during their long existing histories, which makes them being
adapted to the same environment but still forming distinct populations.
For the subpopulations of bacteria species co-existing in the same ecological environment,
the periodic selection may play an important role in their diversity level. The periodic selection
increases the frequency of the adaptive mutant or even makes others be extinct; it only purges the
diversity inside the ecotypes, so the putative ecotypes may be able to contribute to the metabolic
and genomic diversity of the population of a species (Cohan, 2002, 2004; Feldgarden et al.,
2003). Here we connected the ecotypes simulated from the MLSA data with the metabolism
patterns of the same set of strains. They have higher correspondence between big groups than
between subpopulations inside these groups. There are several reasons for this phenomenon and
demand further studies. Kreimer et al. (2008) run the analysis of evolution of the modularity
based on the metabolic networks of more than 300 bacterial species, their results showed the
modularity is moderately congruent to the phylogenetic tree of life, the evolution of modularity
was significantly enhanced by the accommodating to different ecological niches, horizontal gene
transfer is an importance force to the metabolic modularity (Kashtan et al., 2007; Kreimer et al.,
2008). The same study has been done by comparing the metabolic and genetic diversity of three
closely related Bacillus taxa, showing that changes in the existing genes play an important role in
adaptation (Feldgarden et al., 2003). The metabolism of different nutrient resources is the result
of the adaptation, and it is also a kind of driving force of the generating of ecotypes, and finally
also for the evolution of novel species. So, the nutrient resources play an important role in
speciation, as does the antibiotic resistance. The different patterns of antibiotics can generate
different resistant and sensitive bacterial populations in a species. Strains experienced and
Chapter 5: discussion
90
adapted to different niches may get the metabolic abilities to different nutrient sources. Strain
382T which can utilize most kinds of substrates in the API tests could simply be better adapted to
the basic medium used in these tests. In the phylogenetic analysis of the 16S rRNA gene
sequence, strain 469T holds a single phylotype and located between G2 and G3 groups. After the
MLSA analysis, this strain did not move its position and represents still a singleton. The network
splitstree showed that there is little genetic similarity between this strain to others. For the
phenotypic and physiological analysis of the four described strains, this one is the slowest
growing one, and susceptible to lots of antibiotics. This strain exhibited a low probability of
genetic exchanges, thus it may have had less possibilities to acquire the adaptive traits from
others.
The complex population structure determined by MLSA is because of their long past
evolutionary heritage and their present adaptation to the current niches. Also among the strains in
G2 and G3 groups, MLSA has revealed subpopulations within them. The phenotypic analysis
and antibiotic test also showed significant variation among subpopulations. The Strains in a
subpopulation has the same 16S rRNA gene sequence, and they are more frequently be deduced
as a single ecotype (Cohan 2004; 2002). These subpopulations are equal to an ecotype. For the
four strains we chosen for representing four separated subpopulations informed from the MLSA
results, sometimes these four strains were in the same putative ecotype by ecotype simulation
based on some housekeeping genes. But each strain was affiliated to a different species after
polyphasic analysis. So, even strains in the same ecotype, they may diverse to each other by
mutations and gains or loss genes by horizontal gene transfer. For some bacteria, the amount of
the genes they obtain from other different origins can reach up to 16.6 % of its genome (Ochman
et al., 2000). These genetic changes, which allow a genotype to escape periodic selection from
its previous ecotype, form the basis of bacterial speciation (Cohan, 2004). Occasionally,
mutations also allowed a strain to step into new ecological niche. Likewise, antibiotic resistance
is because of the mutations. It was also shown by the clones from the same strain that they can
adapt to different mediums and finally evolved as different subpopulations (Spor et al., 2009). If
clones got enough divergence to differ from each other and to survive from the periodic
selections, they eventually become different ecotypes co-existing in the same ecological niches.
A typical bacterial species may have several ecotypes, but each ecotype will experience
mutations, homologous recombination, horizontal gene transfer and its own periodic selection
events, finally surviving ecotypes will form new species differing from each other and also from
their original species, So, the speciation is a complex process by integrating evolutionary events.
Chapter 5: discussion
91
Conclusion
The population substructure detected within the same 16S rRNA phylotype G1A most likely
is a result of natural selection rather than random drift. According to the niche variation
hypothesis (Bolnick et al, 2007) considerable ecological heterogeneity would therefore be
expected in the habitats of aquatic Sphingomonadaceae. Initial support comes from a parallel
study, in which the seasonal in situ dynamics of different G1A subpopulations was followed by
pyrosequencing of the internal transcribed spacer sequences (Jogler et al. 2011). The analysis of
8,576 sequences revealed strong seasonal shifts in the abundance of 15 different ITS-types
whereby most of the ITS-types exhibited a distinct temporal pattern, and hence may occupy
different ecological niches. Since the housekeeping genes investigated showed little evidence of
positive selection and no indications towards selective pressures were detected for central
metabolic pathways, alternative traits may be involved, such as the degradation of refractory
high-molecular-weight organic compounds, resistance to UV radiation, a planktonic or sessile
life style, or a different susceptibility towards bacteriophages. Possible evolutionary mechanisms
comprise the acquisition of novel traits by illegitimate recombination and subsequent niche
invasion (Perna et al., 2001) by recurrent selective sweeps (Majewski and Cohan, 1999)
separating the G1A clades. In any event, the genetic diversity that is maintained within the
sphingomonad G1A phylotype is enormous compared to other bacteria investigated so far. This
makes this population an especially suitable model system to unveil novel aspects of the
bacterial speciation process.
In this study, a population of Sphingomonadaceae isolates from two German lakes,
Walchensee and Starnberger See, were studied in detail using 16S rRNA sequences, a MLSA
analysis on nine housekeeping genes, and the determination of a large variety of phenotypic
traits. The study of the much closer related strains, i.e., members of the same 16S rRNA
phylotype, allowed for population genetic insights into the formation of subclusters by most
probably selective processes, thus giving insight into speciation processes. Given enough time,
speciation can result in the formation of distinct species or even distinct genera. Among the
strains of the population being already quite distinct to each other, thereby representing the
results from a long-term process of generating species, four strains were then consequently
chosen for a taxonomic characterisation from the perspective of systematists. Three of the strains
were found to represent novel species in the genera Sphingobium and Sphingomonas. The
taxonomic insights into the fourth strain led to the possibility to reclassify a formerly

Chapter 5: discussion
92
Caulobacter species into a Sphingomonas species. In summary, this study gave insights into
incipient speciation among Sphingomonadaceae isolates along with a taxonomical description of
long-term results of such speciation processes.
Chapter 6: references
93
Chapter 6
References
Abadi, F, Carter P, Cash P, Pennington T. (1996) Rifampin resistance in Neisseria meningitidis
due to alterations in membrane permeability. Antimicrob Agents Chemother 40: 646-651
Abraham, W. R., Meyer, H., Lindholst, S., Vancanneyt, M. & Smit, J. (1997). Phospho- and
sulfolipids as biomarkers of Caulobacter, Brevundimonas and Hyphomonas. Syst Appl
Microbiol 20, 522-539.
Abraham, W. R., Strömpl, C., Meyer, H., Lindholst, S., Moore, E. R. B., Bennasar, A., Christ, R.,
Vancanneyt, M., Tindall, B. & other authors (1999). Phylogeny and polyphasic taxonomy
of Caulobacter species. Proposal of Maricaulis gen. nov. with M. maris (Poindexter)
comb. nov. as the type species, and emended description of the genera
Brevundimonas and Caulobacter. Int J Syst Bacteriol 49, 1053–1073.
Abraham, W. R., Strömpl, C., Vancanneyt, M., Lünsdorf, H.& Moore, E. R. (2001).
Determination of the systematic position of the genus Asticcacaulis Poindexter by a
polyphasic analysis. Int J Syst Evol Microbiol 51(Pt 1), 27-34.
Abraham, W. R., Macedo, A. J., Lünsdorf, H., Fischer, R., Pawelczyk, S., Smit, J.& Vancanneyt,
M. (2008). Phylogeny by a polyphasic approach of the order Caulobacterales, proposal
of Caulobacter mirabilis sp. nov., Phenylobacterium haematophilum sp. nov. and
Phenylobacterium conjunctum sp. nov., and emendation of the genus Phenylobacterium.
Int J Syst Evol Microbiol 58(Pt 8), 1939-1949.
Achtman M. (2008). Evolution, population structure, and phylogeography of genetically
monomorphic bacterial pathogens. Ann Rev Microbiol 62:53-70.
Acinas SG, Klepac-Ceraj V, Hunt DE, Pharino C, Ceraj I, Distel DL et al. (2004). Fine-scale
phylogenetic architecture of a complex bacterial community. Nature 430:551-554.
Altschul, S. F., et al. (1997). Gapped BLAST and PSI-BLAST: a new generation of protein
database search programs. Nucleic Acids Res. 25:3389–3402.
Aminetzach, Y.T., Macpherson, J.M., Petrov, D.A. (2005) Pesticide resistance via transposition-
mediated adaptive gene truncation in Drosophila. Science 309 (5735): 764–767.
Chapter 6: references
94
Anisimova M, Gascuel O. (2006). Approximate likelihood-ratio test for branches: A fast,
accurate, and powerful alternative. Syst Biol 55:539-552.
Aravind, L., Tatusov, R.L., Wolf, Y.I., Walker, D.R., and Koonin, E.V. (1998) Evidence for
massive gene exchange between archaeal and bacterial hyperthermophiles. Trends Genet
14: 442-444.
Auch, A.F., Von Jan, M., Klenk, H.-P., Göker, M. (2010). Digital DNA-DNA hybridization for
microbial species delineation by means of genome-to-genome sequence comparison.
Standards in Genomic Sciences 2(1):117-134.
Aujoulat F, Jumas-Bilak E, Masnou A, Sallé F, Faure D, Segonds C, Marchandin H, Teyssier C.
(2011). Multilocus sequence-based analysis delineates a clonal population of
Agrobacterium (Rhizobium) radiobacter (Agrobacterium tumefaciens) of human origin. J
Bacteriol. 193(10): 2608-2618.
Baker, J.M. (2005) Adaptive speciation: The role of natural selection in mechanisms of
geographic and non-geographic speciation. Studies in History and Philosophy of
Biological and Biomedical Sciences 36 (2): 303–326.
Balkwill DL, Frederickson JK, Fromine MF. (2006). Sphingomonas and related genera.
Prokaryotes 7:605-629.
Baquero F. and Coque T. M. (2011). Multilevel population genetics in antibiotic resistance
FEMS Microbiol. Rev. 35 (5): 705–706.
Bartscht K, Cypionka H, Overmann J. (1999). Evaluation of cell activity and of methods for the
cultivation of bacteria from a natural lake community. FEMS Microbiol Ecol 28:249-259.
Bertram J. (2000) The molecular biology of cancer. Mol. Aspects Med. 21 (6): 167–223.
Bhaya D, Grossman AR, Steunou A-S, Khuri N, Cohan FM, Hamamura N et al. (2007).
Population level functional diversity in a microbial community revealed by comparative
genomic and metagenomic analyses. ISME J 1:703-713.
Biolog, (2007). Revolutionary Gen III-Biolog's 3rd generation identification technology with
breakthrough advantages. Part 00A 0XX, Rev A 08/2007.
Bishop CJ, Aanensen DM, Jordan GE, Kilian M, Hanage WP, Spratt BG. (2009). Assigning
strains to bacterial species via the internet. BMC Biol. 7:3
Bisgaard M, Christensen JP, Bojesen AM, Christensen H. (2007). Avibacterium endocarditidis sp.
Chapter 6: references
95
nov., isolated from valvular endocarditis in chickens. Int J Syst Evol Microbiol. 57:
1729–1734.
Blom JF, Pernthaler J. (2010). Antibiotic effects of three strains of chrysophytes (Ochromonas,
Poterioochromonas) on freshwater bacterial isolates. FEMS Microbiol Ecol 71:281-290.
Bolnick DI, Svanback R, Araujo MS, Persson L. (2007). Comparative support for the niche
variation hypothesis that more generalized populations also are more heterogeneous. Proc
Natl Acad Sci U S A 104:10075-10079.
Boucher, Y., Douady, C.J., Papke, R.T., Walsh, D.A., Boudreau, M.E., Nesbo, C.L., Case, R.J.,
Doolittle, W.F. (2003) Lateral gene transfer and the origins of prokaryotic groups. Annu
Rev Genet 37:283–328.
Brown, J.R., Douady, C.J., Italia, M.J., Marshall, W.E., Stanhope, M.J. (2001) Universal trees
based on large combined protein sequence data sets. Nature Genetics, 28: 281–285.
Brown, M.G., (2008), Antibiotic resistance and resistance mechanisms in bacteria isolated from
the deep terrestrial subsurface. Doctoral Thesis / Dissertation, Doctor of Philosophy. The
Florida State University.
Bruen TC, Philippe H, Bryant D. (2006). A simple and robust statistical test for detecting the
presence of recombination. Genetics 172:2665-2681.
Bruns A, Cypionka H, Overmann J. (2002). Cyclic AMP and acyl homoserine lactones increase
the cultivation efficiency of heterotrophic bacteria from the central baltic sea. Appl
Environ Microbiol 68:3978-3987.
Bruns A, Hoffelner H, Overmann J. (2003). A novel approach for high throughput cultivation
assays and the isolation of planktonic bacteria. FEMS Microbiol Ecol 45: 161–171.
Burrus, V, Waldor, M (2004) Shaping bacterial genomes with integrative and conjugative
elements. Res. Microbiol. 155 (5): 376–386.
Busse, H.-J. & G. Auling (1988) Polyamine patterns as a chemotaxonomic marker within the
Proteobacteria. Syst Appl Microbiol 11: 1-8.
Busse H.J., Denner E.B., Buczolits S., Salkinoja-Salonen M., Bennasar A. & Kämpfer P.
(2003) Sphingomonas aurantiaca sp. nov., Sphingomonas aerolata sp. nov.
and Sphingomonas faeni sp. nov., air- and dustborne and Antarctic, orange-pigmented,
psychrotolerant bacteria, and emended description of the genus Sphingomonas. Int J Syst
Chapter 6: references
96
Evol Microbiol. 53, 1253–1260.
Cashion, P., Hodler-Franklin, M. A., McCully, J. & Franklin, M. (1977). A rapid method for base
ratio determination of bacterial DNA. Anal Biochem 81, 461-466.
Charlotte, A.J. (1989) Process and Pattern in Evolution, Oxford University Press
Chessel D, Dufour AB, Thioulouse J. (2004). The ade4 package-I- One-table methods. R News
4:5-10.
Christensen H, Kuhnert P, Bisgaard M, Mutters R, Dziva F, Olsen JE. (2005). Emended
description of porcine Pasteurella aerogenes, Pasteurella mairii and Actinobacillus rossii.
Int J Syst Evol Microbiol 55: 209–223.
Christensen H, Kuhnert P, Busse HJ, Frederiksen WC, Bisgaard M. (2007). Proposed minimal
standards for the description of genera, species and subspecies of the Pasteurellaceae. Int
J Syst Evol Microbiol 57: 166–178.
Christner BC, Mosley-Thompson E, Thompson LG, Reeve JN. (2001). Isolation of bacteria and
16S rDNAs from Lake Vostok accretion ice. Environ Microbiol 3:570-577.
Cohan, F.M. (1994) Genetic exchange and evolutionary divergence in prokaryotes. Trends in
Ecol. Evol. 9:175–180.
Cohan, F.M. (2001) Bacterial species and speciation. Syst. Biol. 50:513–524
Cohan, F.M. (2002) What are bacterial species? Annu. Rev. Microbiol. 56: 457-487.
Cohan, F. M. (2004). Periodic selection and ecological diversity in bacteria. In Selective Sweep.
Edited by D. Nurminsky. Georgetown, Texas: Landes Bioscience.
Cohan FM, Perry EB. (2007). A systematics for discovering the fundamental units of bacterial
diversity. Curr Biol 17:R373-386.
Collins, M. D. (1994). Isoprenoid quinones. In Chemical Methods in Prokaryotic systematics,
Edited by Goodfellow M. &O'Donnell A. G. Chichester: John Wiley & Sons, pp.
345–401.
Connor, N., Sikorski, J., Rooney, A.P., Kopac, S., Koeppel, A.F., Burger, A., et al. (2010)
Ecology of speciation in Bacillus. Appl Environ Microbiol 76:1349-1358.
Courvalin P. (2006). Vancomycin resistance in gram-positive cocci. Clin Infect Dis. 42 Suppl
1:S25-34.
Chapter 6: references
97
Dangar, T. K., Babu, Y. K. Das, J. (2010) Population dynamics of soil microbes and diversity
of Bacillus thuringiensis in agricultural and botanic garden soils of India. African J.
Biotechnol 9: 496-501.
de Bruijn F.J., Rademaker J., Schneider M., Rossbach U., Louws, F.J.. (1996) Rep-PCR
Genomic Fingerprinting of Plant-Associated Bacteria and Computer-Assisted
Phylogenetic Analyses. In: Biology of Plant-Microbe Interaction; Proceedings of the 8th
International Congress of Molecular Plant-Microbe Interactions (G. Stacey, B. Mullin and
P. Gresshoff, Eds.) APS Press, 497-502.
De Ley, J., Cattoir, H. & Reynaerts A. (1970). The quantitative measurement of DNA
hybridization from renaturation rates. Eur J Biochem 12, 133-142.
De las Rivas B, Marcobal A, Munoz R. (2004). Allelic diversity and population structure in
Oenococcus oeni as determined from sequence analysis of housekeeping genes. Appl
Environ Microbiol 70: 7210–7219.
De Queiroz, K. (May 2005). Ernst Mayr and the modern concept of species. Proc. Natl. Acad.
Sci. U.S.A. 102 suppl 1: 6600–6607.
Diamond, J., Bishop, K.D. (1999) Ethno-ornithology of the Ketengban People, Indonesian New
Guinea. In Folkbiology (ed. DL Medin and S Atran), Bradford Books, MIT Press,
Cambridge, MA. pp. 17–45.
Doolittle, F., Bapteste, E. (2007) Pattern pluralism and the tree of life hypothesis. Proceedings of
the National Academy of Sciences 104:2043-2049.
Didelot X, Falush D. (2006). Inference of bacterial microevolution using multilocus sequence
data. Genetics 175:1251-1266.
Doolittle, W.F., Papke, R.T. (2006) Genomics and the bacterial species problem. Genome
Biology 7:1161-1167.
Doroghazi JR, Buckley DH. (2010). Widespread homologous recombination within and between
Streptomyces species. ISME J 4:1136-1143.
Drake JW, Charlesworth B, Charlesworth D, Crow JF. (1998). Rates of spontaneous mutation.
Genetics 148:1667-1686.
Dykhuizen, D.E., Green, L. (1991) Recombination in Escherichia coli and the definition of
biological species. J. Bacteriol. 173:7257–7268.
Chapter 6: references
98
Dykhuizen, D.E. (1995) Santa Rosalia revisited: Why are there so many species of bacteria? Ant.
v. Leeuwenhoek 73: 25-33
Eckburg PB, Bik EM, Bernstein CN, Purdom E, Dethlefsen L, Sargent M et al. (2005). Diversity
of the human intestinal flora. Science 308:1635-1638.
Eguchi M, Nishikawa T, MacDonald K, Cavicchioli R, Gottschal J, Kjelleberg S. (1996).
Responses to stress and nutrient availability by the marine ultrabacterium Sphingomonas
sp. strain RB2256. Appl Environ Microbiol 62:1287-1294.
Eldredge, N., Cracraft, J. (1980) Phylogenetic patterns and the evolutionary process: Method and
theory in comparative biology. New York: Columbia University Press.
Ereshefsky M., (2010). Microbiology and the species problem. Biology Philosophy. 25 (4):
553-568.
Feldgarden M, Byrd N, Cohan FM. (2003). Gradual evolution in bacteria: evidence from
Bacillus systematics. Microbiology. 149:3565–3573.
Feil, E.J., Holmes, E.C., Bessen, D.E., Chan, M.-S., Day, N.P.J., Enright, M.C., Goldstein, R.,
Hood, D.W., Kalia, A., Moore, C.E., Zhou, J. and Spratt, B.G. (2001) Recombination
within natural populations of pathogenic bacteria: short-term consequences and long-term
phylogenetic consequences. Proc. Natl. Acad. Sci. USA, 98: 182-187.
Feil, E.J., Cooper J.E., Grundmann H., Robinson D.A., Enright M.C., Berendt T., Peacock S.J.,
Smith J.M., Murphy M., Spratt B.G., Moore C.E., Day N.P. (2003) How clonal is
Staphylococcus aureus? J Bacteriol. 185:3307-3316.
Felis, G. E. & Dellaglio, F. (2007). On species descriptions based on a single strain: proposal to
introduce the status species proponenda (sp. pr.). Int J Syst Evol Microbiol 57, 2185-2187.
Felsenstein J. (1993). PHYLIP (Phylogeny Inference Package) version 3.6. Distributed by the
author. Department of Genetics, University of Washington, Seattle.
Fink, D.L., Cope, L.D., Hansen, E.J., St. Geme, J.W.III. (2001) The Haemophilus influenzae Hap
autotransporter is a chymotrypsin clan serine protease and undergoes autoproteolysis via
an intermolecular mechanism. J Biol Chem. 276:39492-39500.
Franklin, L. (2007) Bacteria, sex, and systematics. Philosophy of Science 74:69-95.
Fraser C, Hanage WP, Spratt BG. (2007). Recombination and the nature of bacterial speciation.
Science 315:476-480.
Chapter 6: references
99
Fraser, C., Alm, E.J., Polz, M.F., Spratt, B.G., Hanage, W.P. (2009) The bacterial species
challenge: Making sense of genetic and ecological diversity. Science 323: 741–746.
Fuhrman JA, Comeau DE, Hagstrom A, Chan AM. (1988). Extraction from natural planktonic
microorganisms of DNA suitable for molecular biological studies. Appl Environ
Microbiol 54:1426-1429.
Gans, J., Wolinsky M., Dunbar J. (2005) Computational improvements reveal great bacterial
diversity and high metal toxicity in soil. Science, 309: 1387-1390.
Garrity, G. M., Bell, J. A.& Lilburn T. (2005). Order V Caulobacterales Henrici and Johnson
1935b . In Garrity G. M., Brenner D. J., Krieg N. R., Staley J. R. (eds), Bergey's Manual
of Systematic Bacteriology. Second edition, Vol. 2: The proteobacteria part C, Springer –
Verlag, pp. 287-323.
Gevers D, Cohan FM, Lawrence JG, Spratt BG, Coenye T, Feil EJ et al. (2005). Re-evaluating
prokaryotic species. Nat Rev Microbiol 3:733-739.
Gich, F., Schubert, K., Bruns, A., Hoffelner, H. & Overmann, J. (2005). Specific detection,
isolation and characterization of selected, previously uncultured members of freshwater
bacterioplankton. Appl Environ Microbiol 71, 5908-5919.
Gich F, Overmann J. (2006). Sandarakinorhabdus limnophila gen. nov., sp. nov., a novel
bacteriochlorophyll a-containing, obligately aerobic bacterium isolated from freshwater
lakes. Int J Syst Evol Microbiol 56:847-854.
Gich F, Schubert K, Bruns A, Hoffelner H, Overmann J. (2005). Specific detection, isolation and
characterization of selected, previously uncultured members of freshwater
bacterioplankton. Appl Environ Microbiol 71:5908-5919.
Giovannoni S. (2004). Oceans of bacteria. Nature 430:515-516.
Glöckner FO, Zaichikov E, Belkova N, Denissova L, Pernthaler J, Pernthaler A et al. (2000).
Comparative 16S rRNA analysis of lake bacterioplankton reveals globally distributed
phylogenetic clusters including an abundant group of Actinobacteria. Appl Environ
Microbiol 66:5053-5065.
Goarant C, Reynaud Y, Ansquer D, Decker SD, Saulnier D, Roux Fl. (2006). Molecular
epidemiology of Vibrio nigripulchritudo, a pathogen of cultured penaeid shrimp
(Litopenaeus stylirostris) in New Caledonia. Syst Appl Microbiol 29: 570–580.
Chapter 6: references
100
Godoy D, Randle G, Simpson AJ, Aanensen DM, Pitt TL, Kinoshita R, Spratt BG (2003)
Multilocus sequence typing and evolutionary relationships among the causative agents of
melioidosis and glanders, Burkholderia pseudomallei and Burkholderia mallei. J Clin
Microbiol 41 (5): 2068-2079.
Gogarten, J., Townsend, J. (2005) Horizontal gene transfer, genome innovation and evolution.
Nature Reviews Microbiology 3:679-687.
Goris J, Konstantinidis KT, Klappenbach JA, Coenye T, Vandamme P, Tiedje JM. (2007).
DNA–DNA hybridization values and their relationship to whole-genome sequence
similarities. Int. J. Syst. Evol. Microbiol. 57: 81–91.
Grenfell BT, Pybus OG, Gog JR, Wood JLN, Daly JM, Mumford JA, Holmes EC. (2004).
Unifying the epidemiological and evolutionary dynamics of pathogens. Science.
303:327-332.
Griffiths A.J.F., Miller J.H., Suzuki D.T., Lewontin R.C.and Gelbart W.M. (2000). Bacterial
conjugation An Introduction to Genetic Analysis. 7th edition. New York: W. H. Freeman.
Guindon S, Gascuel O. (2003). A simple, fast, and accurate algorithm to estimate large
phylogenies by maximum likelihood. Syst Biol 52:696-704.
Hamada, T., Suzuki, M. & Harayama, S. (1998). Asticcacaulis excentricus 16S rRNA gene,
partial sequence. DDBJ/EMBL/GenBank databases, accession no. AB016610.
Hamana, K., Miyagawa, K. & Matsuzaki, S. (1983). Occurrence of sym-homospermidine as the
major polyamine in nitrogen-fixing cyanobacteria. Biochem. Biophys. Res. Commun. 112:
606-613.
Hanage, W.P., Fraser, C., Spratt, B. (2005) Fuzzy species among recombinogenic bacteria. BMC
Biology 3:6.
Hanage W.P., Kaijalainen T., Herva E., Saukkoriipi A., Syrjänen R., Spratt B.G. (2005). Using
multilocus sequence data to define the pneumococcus. J Bacteriol 187 (17): 6223-6230.
Hanage WP, Fraser C, Spratt BG (2006) Sequences, sequence clusters and bacterial species.
Philos Trans R Soc Lond B Biol Sci 361(1475): 1917-1927.
Hartl DL, Clark AG. (2007). Principles of Population Genetics, 4 ed. Sinauer Associates:
Sunderland, Massachusetts.
Haubold B, Hudson RR. (2000). LIAN 3.0: detecting linkage disequilibrium in multilocus data.
Chapter 6: references
101
Bioinformatics 16:847-849.
Hennig, W. (1966) Phylogenetic Systematics. Translated by D. D. Davis and R. Zangerl. Urbana:
University of Illinois Press.
Henrici, A. T. & Johnson, D. E. (1935). Studies on fresh water bacteria. II. Stalked bacteria, a
new order of schizomycetes. J Bacteriol 30, 61–93.
Herbeck JT, Funk DJ, Degnan PH, Wernegreen JJ. (2003). A conservative test of genetic drift in
the endosymbiotic bacterium Buchnera: slightly deleterious mutations in the chaperonin
groEL. Genetics 165:1651-1660.
Hoshino T, Fujiwara T, Kilian M (2005) Use of phylogenetic and phenotypic analyses to identify
nonhemolytic streptococci isolated from bacteremic patients. J Clin Microbiol
43(12):6073-6085.
Hörtnagl P, Pérez MT, Sommaruga R.(2011). Contrasting effects of ultraviolet radiation on the
growth efficiency of freshwater bacteria. Aquat Ecol 45:125-136.
Hunt DE, David LA, Gevers D, Preheim SP, Alm EJ, Polz MF. (2008). Resource partitioning and
sympatric differentiation among closely related bacterioplankton. Science
320:1081-1085.
Huson DH, Bryant D. (2006). Application of phylogenetic networks in evolutionary studies. Mol
Biol Evol 23:254-267.
Huss, V. A. R., Festl, H. & Schleifer, K. H. (1983). Studies on the spectrophotometric
determination of DNA hybridization from renaturation rates. Syst Appl Microbiol 4,
184-192.
Ibrahim, N.A., Abd-Elsalam, K.A., Khalil, M. S., Verreet, J. A. (2003) Comparison of
multi-locus enzyme and protein gel electrophoresis in the discrimination of
five Fusarium species isolated from Egyptian cottons. African Journal of Biotechnology
2: 206–210.
Ivars-Martinez E., D'Auria G., Rodriguez-Valera F., Sanchez-Porro C., Ventosa A., Joint I.,
Mühling M. (2008). Biogeography of the ubiquitous marine bacterium Alteromonas
macleodii determined by multilocus sequence analysis. Mol Ecol. 17(18):4092-4106.
Jain AK, Murty MN, Flynn PJ. (1999). Data clustering: a review. ACM Comput Surv 31.
Jain, R., Rivera, M.C., Moore, J.E., Lake, J.A. (2002) Horizontal gene transfer in microbial
Chapter 6: references
102
genome evolution. Theor Popul Biol. 61 (4): 489-495.
James, G. (2010). Universal Bacterial Identification by PCR and DNA Sequencing of 16S rRNA
Gene. PCR for Clinical Microbiology Part 3, 209-214.
Jaspers E, Nauhaus K, Cypionka H, Overmann J. (2001). Multitude and temporal variability of
ecological niches as indicated by the diversity of cultivated bacterioplankton. FEMS
Microbiol Ecol 36:153-164.
Jaspers E, Overmann J. (2004). Ecological significance of microdiversity: identical 16S rRNA
gene sequences can be found in bacteria with highly divergent genomes and
ecophysiologies. Appl Environ Microbiol 70:4831-4839.
Jogler M, Siemens H, Chen H, Bunk B, Sikorski J, Overmann J. (2011). Identification and
targeted cultivation of an abundant novel freshwater sphingomonad and analysis of its
population substructure. Appl Environ Microbiol 77:7355-7364.
Jolley KA, Wilson DJ, Kriz P, Mcvean G, Maiden MCJ. (2005). The influence of mutation,
recombination, population history, and selection on patterns of genetic diversity in
Neisseria meningitidis. Mol Biol Evol 22:562-569.
Kaiser, A. E., Gottwald, A. M., Wiersch, C. S., Maier, W. A., Seitz, H. M. (2003) Spermidine
metabolism in parasitic protozoa-a comparison to the situation in prokaryotes, viruses,
plants and fungi. Folia Parasitologica 50, 3-18.
Kashtan N, Noor E, Alon U (2007) Varying environments can speed up evolution. Proc Natl
Acad Sci USA 104:13711–13716.
Kawahara, K., Kuraishi, H. & Zaèhringer, U. (1999) Chemical structure and function of
glycosphingolipids of Sphingomonas spp. and their distribution among members of the
α-4subclass of Proteobacteria. J. Ind. Microbiol. Biotech. 23: 408-413.
Kawahara K., Moll H., Knirel Y. A., Seydel U., Zhringer U. (2000). Structural analysis of two
glycosphingolipids from the lipopolysaccharide-lacking bacterium Sphingomonas
capsulata. Eur J Biochem. 267(6):1837-1846.
Keymer, D.P., Boehm, A.B. (2011) Recombination shapes the structure of an environmental
Vibrio cholerae population. Appl Environ Microbiol 77:537-544.
Kilian, M., Poulsen, K., Blomqvist, T., Havarstein, L.S., Bek-Thomsen, M., Tettelin, H., et al.
(2008) Evolution of Streptococcus pneumoniae and its close commensal relatives. PLoS
Chapter 6: references
103
ONE 3:e2683.
Kim H, Kim S-H, Ying Y-H, Kim H-J, Koh Y-H, Kim C-J et al. (2005) Mechanism of natural
rifampin resistance of Streptomyces spp. Syst Appl Microbiol 28: 398-404
Kim MK, Schubert K, Im WT, Kim KH, Lee ST, Overmann J. (2007). Sphingomonas kaistensis
sp. nov., a novel alphaproteobacterium containing pufLM genes. Int J Syst Evol
Microbiol 57: 1527–1534.
Koeppel A, Perry EB, Sikorski J, Krizanc D, Warner A, Ward DM et al. (2008). Identifying the
fundamental units of bacterial diversity: a paradigm shift to incorporate ecology into
bacterial systematics. Proc Natl Acad Sci U S A 105:2504-2509.
Konstantinidis KT, Tiedje JM. (2005). Genomic insights that advance the species definition for
prokaryotes. Proceedings of the National Academy of Sciences of the United States of
America 102: 2567–2572.
Kosako Y, Yabuuchi E, Naka T, Fujiwara N, Kobayashi K. (2000). Proposal of
Sphingomonadaceae fam. Nov., consisting of Sphingomonas Yabuuchi et al. 1990,
Erythrobacter Shiba and Shimidu 1982, Erythromicrobium Yurkove et al. 1994,
Porphyrobacter Fuerst et al. 1993, Zymomonas Kluyver and van Niel 1936, and
Sandaracinobacter Yurkove et al. 1997, with the type genus Sphingomonas Yabuuchi et
al. 1990. Microbiol Immunol 44:563-575.
Kreimer A, Borenstein E, Gophna U, Ruppin E (2008) The evolution of modularity in bacterial
metabolic networks. Proc Natl Acad Sci 105: 6976-6981.
Kuhnert P, Korczak BM. (2006). Prediction of whole-genome DNA–DNA similarity,
determination of G+C content and phylogenetic analysis within the family
Pasteurellaceae by multilocus sequence analysis (MLSA). Microbiology 152: 2537–2548.
Kuhnert P, Korczak BM, Christensen H, Bisgaard M. (2007). Emended description of
Actinobacillus capsulatus Arseculeratne 1962, 38AL. Int. J. Syst. Evol. Microbiol. 57:
625–632.
Kuhnert P, Korczak BM, Stephan R, Joosten H, Iversen C. (2009). Phylogeny and prediction of
genetic similarity of Cronobacter and related taxa by multilocus sequence analysis
(MLSA). Int. J. Food Microbiol 136: 152-158.
Kriz, P., Kalmusova, J., Felsberg, J. (2002) Multilocus sequence typing of Neisseria meningitidis
Chapter 6: references
104
directly from cerebrospinal fluid. Epidemiol. Infect. 128: 157-160.
Kuo C-H, Moran NA, Ochman H. (2009). The consequences of genetic drift for bacterial
genome complexity. Genome Res 19:1450-1454.
Lake, J.A., Clark, M.W., Henderson, E., Fay, S.P., Oakes, M., Scheinman, A., et al. (1985)
Eubacteria, halobacteria, and the origin of photosynthesis: the photocytes. Proc Natl Acad
Sci USA 82: 3716-3720.
Lan, R., Reeves. P. R. (2000) Intraspecies variation in bacterial genomes: the need for a species
genome concept. Trends Microbiol. 8: 396-401.
Lane DJ. (1991). 16S/23S rRNA sequencing. In: Stackebrandt E, Goodfellow M. (eds). Nucleic
acid techniques in bacterial systematics. Wiley: Chichester, UK, pp. 115-175.
Lange A, Ferguson N.M. (2009). Antigenic diversity, transmission mechanisms, and the
evolution of pathogens. PLoS Comput Biol. 5(10):e1000536.
Lapteva NA, Bel´kova NL & Parfenova VV (2007) Spatial distribution and species composition
of prosthecate bacteria in Lake Baikal. Mikrobiologiia 76, 545-551 (in Russian)
Lee KB, Liu CT, Anzai Y, Kim H, Aono T,Oyaizu H. (2005). The hierarchical system of the
‘Alphaproteobacteria’: description of Hyphomonadaceae fam. nov., Xanthobacteraceae
fam. nov. and Erythrobacteraceae fam. nov. Int J Syst Evol Microbiol 55: 1907-1919.
Lengeler, J.W., Drews, G., Schlegel, H.G. (1999) Chapter 29, Prokaryotic diversity and
systematics, in Biology of the prokaryotes, Wiley-Blackwell; 1 edition, 674-720
Levin, B.R. (1981) Periodicselection, infectious gene exchange and the genetic structure of
Escherichia coli populations. Genetics 99: 1-23.
Librado P, Rozas J. (2009). DnaSP v5: a software for comprehensive analysis of DNA
polymorphism data. Bioinformatics 25:1451-1452.
Liu, Y.Q., Yao, T.D., Zhu, L.P., Jiao, N.Z., Liu, X.B., Zeng, Y.H., and Jiang, H.C. (2009).
Bacterial Diversity of Freshwater Alpine Lake Puma Yumco on the Tibetan Plateau.
Geomicrobiology journal. 26 (2): 131-145.
Logue J.B., Bürgmann H., Robinson C.T. (2008). Progress in the Ecological Genetics and
Biodiversity of Freshwater Bacteria. BioScience, 58 (2):103-113.
Lorenz, M.G., and Wackernagel, W. (1994) Bacterial gene transfer by natural
Chapter 6: references
105
genetictransformation in the environment. Microbiol. Rev. 58: 563-602.
Ludwig W, Strunk O, Westram R, Richter L, Meier H, Yadhukumar et al. (2004). ARB: a
software environment for sequence data. Nucleic Acids Res 32:1363-1371.
Lynch M, Conery JS. (2003). The origins of genome complexity. Science 302:1401-1404.
Maiden, M.C.J. (2006) Multilocus sequence typing of bacteria. Annu. Rev. Microbiol.
60:561-588.
Maiden, M.C.J., Bygraves, J.A., Feil, E., Morelli, G., Russell, J.E., Urwin, R., Zhang, Q., Zhou,
J., Zurth, K., Caugant, D.A., Feavers, I.M., Achtman, M., Spratt, B.G. (1998) Multilocus
sequence typing: a portable approach to the identification of clones within populations of
pathogenic microorganisms. Proc. Natl. Acad. Sci. USA 95: 3140–3145.
Majewski J, Cohan FM. (1999). Adapt globally, act locally: the effect of selective sweeps on
bacterial sequence diversity. Genetics 152:1459-1474.
Manz W, Amann R, Ludwig W, Wagner M, Schleifer K-H. (1992). Phylogenetic
oligodeoxynucleotide probes for the major subclasses of Proteobacteria: problems and
solutions. Syst Appl Microbiol 15:593 - 600.
Maiden, M.C.J., Bygraves, J.A., Feil, E., Morelli, G., Russell, J.E., Urwin, R., Zhang, Q., Zhou,
J., Zurth, K., Caugant, D.A., Feavers, I.M., Achtman, M., Spratt, B.G. (1998) Multilocus
sequence typing: a portable approach to the identification of clones within populations of
pathogenic microorganisms. Proc. Natl. Acad. Sci. USA 95: 3140–3145.
Marschall E, Jogler M, Henßge U, Overmann J. (2010). Large-scale distribution and activity
patterns of an extremely low-light-adapted population of green sulfur bacteria in the
Black Sea. Environ Microbiol 12:1348-1362.
Margulis, L., Sagan, D. (2002) Acquiring Genomes: A Theory of the Origin of Species. New
York: Basic Book
Martens M, Delaere M, Coopman R, de Vos P, Gillis M, Willems A. (2007). Multilocus sequence
analysis of Ensifer and related taxa. Int. J. Syst. Evol. Microbiol. 57: 489-503.
Martens M, Dawyndt P, Coopman R, Gillis M, De Vos P, Willems A. (2008). Advantages of
multilocus sequence analysis for taxonomic studies: a case study using 10 housekeeping
genes in the genus Ensifer (including former Sinorhizobium). Int J Syst Evol Microbiol 58:
200-214.
Chapter 6: references
106
Martin AP. (2002). Phylogenetic approaches for describing and comparing the diversity of
microbial communities. Appl Environ Microbiol 68:3673-3682.
Martin DP, Lemey P, Lott M, Moulton V, Posada D, Lefeuvre P. (2010). RDP3: a flexible and
fast computer program for analyzing recombination. Bioinformatics 26:2462-2463.
Martin, W. and Müller, M. (1998) The hydrogen hypothesis for the first
eukaryote. Nature 392:37-41.
Martinez J. L. and Rojo F. (2011). Metabolic regulation of antibiotic resistance. FEMS Microbiol
Rev. 35 (5): 768–789.
Matsunaga, I., Yamada, M., Kusunose, E., Nishiuchi, Y., Yano, I. & Ichihara K. (1996). Direct
involvement of hydrogen peroxide in bacterial alpha-hydroxylation of fatty acid. FEBS
Lett 386, 252–254.
Matsunaga, I., Yokotani, N., Gotoh, O., Kusunose, E., Yamada, M. & Ichihara, K. (1997).
Molecular cloning and expression of fatty acid alphahydroxylase from Sphingomonas
paucimobilis. J. Biol. Chem. 272, 23592–23596.Maughan, H., Wilson, L.A., Redfield,
R.J. (2010) Bacterial DNA Uptake Sequences Can Accumulate by Molecular Drive Alone.
Genetics. 186: 613-627.
Maynard Smith J, Dowson C.G., Spratt B.G.. 1991. Localized sex in bacteria. Nature
249:29–31.Mayr, E. (1970) Populations, Species, and Evolution. Harvard University
Press, Cambridge, MA.
McDonald JH, Kreitman M. (1991). Adaptive protein evolution at the Adh locus in Drosophila.
Nature 351:652-654.
McVean G, Awadalla P, Fearnhead P. (2002). A coalescent-based method for detecting and
estimating recombination from gene sequences. Genetics 160:1231-1241.
Meece, J.K., Anderson, J.L., Fisher, M.C., Henk, D.A., Sloss, B.L., Reed, K.D. (2011)
Population genetic structure of clinical and environmental isolates of Blastomyces
dermatitidis based on 27 polymorphic microsatellite markers. Appl Environ Microbiol
77:5123-5131
Melendrez, M.C., Lange, R.K., Cohan, F.M., Ward, D.M. (2011) Influence of molecular
resolution on sequence-based discovery of ecological diversity among Synechococcus
populations in an alkaline siliceous hot spring microbial mat. Appl Environ Microbiol
Chapter 6: references
107
77:1359-1367.
Mesbah, M., Premachandran, U. & Whitman, W.B. (1989). Precise measurement of the G + C
content of deoxyribonucleic acid by high-performance liquid chromatography. Int J Syst
Bacteriol 39, 159–167.
Mignard S, Flandrois JP. (2008). A seven-gene, multilocus, genus-wide approach to the
phylogeny of mycobacteria using supertrees. Int J Syst Evol Microbiol 58: 1432-1441.
Mutters R, Mannheim W, Bisgaard M. (1989). Taxonomy of the group. In Pasteurella and
Pasteurellosis, pp. 3–34. Edited by C. Adlam & J. M. Rutter. London: Academic Press..
Naser, S.M., Thompson, F.L., Hoste, B., Gevers, D., Dawyndt, P., Vancanneyt, M. & Swings, J.
(2005) Application of multilocus sequence analysis (MLSA) for rapid identification of
Enterococcus species based on rpoA and pheS genes. Microbiology 151: 2141-2150.
Naser SM, Hagen KE, Vancanneyt M, Cleenwerck I, Swings J, Tompkins TA. (2006).
Lactobacillus suntoryeus Cachat and Priest 2005 is a later synonym of Lactobacillus
helveticus (Orla-Jensen 1919) Bergey et al. 1925 (Approved Lists 1980). Int J Syst Evol
Microbiol 56:355-360.
The Clinical and Laboratory Standards Institute (CLSI, formerly NCCLS), Performance
standards for antimicrobial susceptibility testing; seventeenth informational supplement.
CLSI document M100-S17 [ISBN 1-56238-625-5]. Vayne, PA: NCCLS.
Neef A. (1997). Ph.D. thesis. Anwendung der in situ-Einzelzell-Identifizierung von Bakterien zur
Populationsanalyse in komplexen mikrobiellen Biozönosen. Technische Universität
München, Munich, Germany.
Nelson, K.E., Clayton, R.A., Gill, S.R., Gwinn, M.L., Dodson, R.J., Haft, D.H., Hickey,
E.K.,Peterson, L.D., Nelson, W.C., Ketchum, K.A., et al. (1999) Evidence for lateral
gene transfer between Archaea and Bacteria from genome sequence of Thermotoga
maritima. Nature 399: 323-329.
Nesbo, C., Dultek, M., Doolittle, F. (2006) Recombination in Thermotoga: Implications for
species concepts and biogeography. Genetics 172:759-769.
Nigam, A., Jit, S. & Lal, R. (2010). Sphingomonas histidinilytica sp. nov., isolated from a
hexachlorocyclohexane dump site. Int. J. Syst. Evol. Microbiol. 60, 1038-1043.
Nørskov-Lauritsen N, Bruun B, Kilian M. (2005). Multilocus sequence phylogenetic study of the
Chapter 6: references
108
genus Haemophilus with description of Haemophilus pittmaniae sp. nov., Int. J. Syst.
Evol. Microbiol. 55: 449–456.
Nuebel, U., Dordel, J., Kurt, K., Strommenger, B., Westh, H., Shukla, S.K., et al. (2010) A
timescale for evolution, population expansion, and spatial spread of an emerging clone of
methicillin resistant Staphylococcus aureus. PLoS Pathog 6:e1000855.
O’Rourke, M. Stevens, E. (1993) Genetic structure of Neisseria gonorrhoeae populations: a non-
clonal pathogen. J. Gen. Microbial. 139: 2603-2611
Ochman, H., Lawrence, J. G., Groisman, E. A. (2000) Lateral gene transfer and the nature of
bacterial innovation. Nature 405: 299-304.
Ochsenreither, S., Kuhls, K., Schaar, M., Presber, W., Schönian, G. (2006) Multilocus
microsatellite typing as a new tool for discrimination of Leishmania infantum MON-1
strains. J Clin Microbiol. 44(2):495-503.
Ogunseitan, O.A. (1995) Bacterial genetic exchange in nature. Science Progress, 78, 183–204.
Ogunseitan, O.A. (2001) Assessing microbial proteomes in the environment. In: Bitton, G.
(Editor) Encyclopedia of Environmental Microbiology. John Wiley & Sons, Inc., New
York.
Oshima T, Baba M (1981) Occurrence of sym-homospermidine in extremely thermophilic
bacteria. Biochem Biophys Res Commun 103:156–160.
Overmann J, Tuschak C, Froestl JM, Sass H. (1998). The ecological niche of the consortium
"Pelochromatium roseum". Arch Microbiol 169:120-128.
Pate, J. L., Porter, J. S. & Jordan, T. L. (1973). Asticcacaulis biprosthecium sp. nov. life cycle,
morphology and cultural characteristics. Antonie Leeuwenhoek J Microbiol Serol 39,
569-583.
Pechére, J. C., (2001). Macrolide resistance mechanisms in Gram-positive cocci. Int. J.
Antimicrob. Agents 18, S25–S28.
Pfennig, N. & Wagener, S. (1986). An improved method of preparing wet mounts for
photomicrographs of microorganisms. Journal of Microbiological Methods 4, 303-306.
Peña A, Teeling H, Huerta-Cepas J, Santos F, Yarza P, Brito-Echeverría J et al. (2010) Fine-scale
evolution: genomic, phenotypic and ecological differentiation in two coexisting
Salinibacter ruber strains. ISME J 4: 882-895
Chapter 6: references
109
Piccini C, Conde D, Alonso C, Sommaruga R, Pernthaler J. (2006). Blooms of single bacterial
species in a coastal lagoon of the Southwestern Atlantic Ocea. Appl Environ Microbiol
72:6560-6568.
Pigliucci, M. (2003) Species as family resemblance concepts: The (dis-)solution of the species
problem? Bioessays 25: 596–602.
Pigliucci, M., Kaplan, J. (2006) Making Sense of Evolution: the Conceptual Foundations of
Evolutionary Biology. Chicago, Chicago University Press.
Pinhassi J, Hagström Å. (2000). Seasonal succession in marine bacterioplankton. Aquat Microb
Ecol 21:245-256.
Pointdexter J. S. (1964). Biological properties and classification of the Caulobacter group.
Bacteriological Reviews 28, 231-295.
Poindexter, J. S. & Lewis, R. F. (1966). Recommendations for revision of the taxonomic
treatment of stalked bacteria. Int J Syst Bacteriol 16, 377-382
Poindexter, J. S. (1981a). Oligotrophy. Fast and famine existence, pp. 63–89. In Microbial
Ecology, vol. 5. Edited by M. Alexander. New York: Plenum Publishing Corp.
Poindexter, J. S. (1981b). The Caulobacters: ubiquitous unusual bacteria. Microbiol Rev 45,
123-179.
Poindexter, J. S. (1989). Genus Caulobacter Henrici and Johnson 1935, 83AL. In: Bergey’s
Manual of Systematic Bacteriology, Edited by Staley J. T., Bryant M. P., Pfennig N. &
Holt J. G. Baltimore: Williams & Wilkins. vol. 3, pp. 1924-1939.
Pointdexter, J. S. (2005). Genus Caulobacter Order V Caulobacterales Henrici and Johnson
1935b Garrity G. M., Bell J. A., Lilburn T. 2005. In Garrity G. M., Brenner D. J., Krieg N.
R., Staley J. R. (eds), Bergey's Manual of Systematic Bacteriology. Second edition, Vol. 2:
The proteobacteria part C, Springer – Verlag, pp. 287-323.
Pourzand, C. and Cerutti, P. (1993) Genotypic mutation analysis by RFLP/PCR. Mutat
Res. 288:113–121.
Rainey, P.B., Buckling, A., Kassen, R., Travisano, M. (2000) The emergence and maintenance of
diversity: insights from experimental bacterial populations. Trends Ecol. Evol.
15:243-247.
Rasmussen, B. (2000) Filamentous microfossils in a 3,235-millionyear-old volcanogenic massive
Chapter 6: references
110
sulphide deposit. Nature 405, 676–679.
Ravin, A.W. (1960) The origin of bacterial species: genetic recombination and factors limiting it
between bacterial populations. Bacteriol. Rev. 24:201–220.
Ravin, A.W. (1963) Experimental approaches to the study of bacterial phylogeny. Am. Nat.
97:307–311.
Reasoner, D. J. & Geldreich E. E. (1985). A new medium for the enumeration and subculture of
bacteria from potable water. Appl Env Microbiol 49, 1-7.
Rensch, B. (1959) Evolution above the species level. New York, Columbia University Press.
Richter D, Postic D, Sertour N, Livey I, Matuschka FR, Baranton G. (2006). Delineation of
Borrelia burgdorferi sensu lato species by multilocus sequence analysis and confirmation
of the delineation of Borrelia spielmanii sp. nov. Int J Syst Evol Microbiol 56: 873-881.
Richter, M., and Rossello-Mora, R. (2009) Shifting the genomic gold standard for the
prokaryotic species definition. Proceedings of the National Academy of Sciences 106:
19126-19131
Riley, M.A., Lizotte-Waniewski, M. (2009) Population genomics and the bacterial species
concept. Methods Mol Biol 532: 367–377.
Rokas, A., B. L. Williams N. King and S. B. Carroll (2003). Genome-scale approaches to
resolving incongruence in molecular phylogenies. Nature 425: 798-804.
Rosselló-Mora, R.,Amann, R. (2001) The species concept for prokaryotes. FEMS Microbiol. Rev.
25: 39-67.
Sakamoto M. and Ohkuma M. (2011). Identification and classification of the genus Bacteroides
by multilocus sequence analysis (MLSA). Microbiology [Epub ahead of print]
Sarkar SF, Guttman DS. (2004). Evolution of the core genome of Pseudomonas syringae, a
highly clonal, endemic plant pathogen. Appl Environ Microbiol 70:1999-2012.
Sasser, M. (1990). Identification of bacteria by gas chromatography of cellular fatty acids, MIDI
Technical Note 101. Newark, DE: MIDI Inc.
Sauvage E, Kerff F, Terrak M, Ayala JA, Charlier P. (2008).The penicillin-binding proteins:
structure and role in peptidoglycan biosynthesis. FEMS Microbiol Rev.32(2):234-258.
Sawabe T, Kita-Tsukamoto K, Thompson FL. (2007) Inferring the evolutionary history of vibrios
Chapter 6: references
111
by means of multilocus sequence analysis. J Bacteriol 189 (21): 7932-7936.
Schloss P. D., Handelsman J. (2004). Status of the microbial census. Microbiol Mol Biol Rev.
68:686–691.
Schmidt, J. M. (1981). The genera Caulobacter and Asticcacaulis. In The Prokaryotes, a
Handbook on the Habitats, isolation, and Identification of Bacteria, Edited by Starr M. P.,
Stolp H., Truper H. G., Balows A. & Schlegel H. G.. New York: Springer. vol. 1, pp.
466-476.
Schweitzer B, Huber I, Amann R, Ludwig W, Simon M. (2001). a- and b-Proteobacteria control
the consumption and release of amino acids on lake snow aggregates. Appl Environ
Microbiol 67:632-645.
Selander, R.K., Caugant, D.A., Ochman, H., Musser, J.M., Gilmour, M.N., Whittam, T.S., (1986)
Methods of multilocus enzyme electrophoresis for bacterial population genetics and
systematics. Appl. Environ. Microbiol. 51: 873–884.
Shaw KJ, Rather PN, Hare RS, Miller GH. (1993). Molecular genetics of aminoglycoside
resistance genes and familial relationships of the aminoglycoside-modifying enzymes.
Microbiol Rev. 57(1):138–163.
Sly, L. I., Cahill, M. M., Majeed, K. & Jones, G. (1997). Reassessment of the phylogenetic
position of Caulobacter subvibrioides. Int. J. Syst. Bacteriol. 47, 211–213.
Sly, L. I., Cox, T. L. & Beckenham, T. B. (1999). The phylogenetic relationships of Caulobacter,
Asticcacaulis, and Brevundimonas species and their taxonomic implications. Int J Syst
Bacteriol 49, 483-488.
Sicheritz-Pontén T., Andersson S.G. (2001). A phylogenomic approach to microbial
evolution.Nucleic Acids Res .29(2):545-552.
Sikorski J, Brambilla E, Kroppenstedt RM, Tindall BJ. (2008a). The temperature adaptive fatty
acid content in Bacillus simplex strains from "Evolution Canyon", Israel. Microbiology
154:2416-2426.
Sikorski J, Nevo E. (2005). Adaptation and incipient sympatric speciation of Bacillus simplex
under microclimatic contrast at "Evolution Canyons" I and II, Israel. Proc Natl Acad Sci
U S A 102:15924-15929.
Sikorski, J., Nevo, E. (2007) Patterns of thermal adaptation of Bacillus simplex to the
Chapter 6: references
112
microclimatically contrasting slopes of "Evolution Canyon" I and II, Israel. Environ
Microbiol 9:716–726.
Sikorski J, Pukall R, Stackebrandt E. (2008b). Carbon source utilization patterns of Bacillus
simplex ecotypes do not reflect their adaptation to ecologically divergent slopes in
"Evolution Canyon", Israel. FEMS Microbiology Ecology 66:38-44.
Spor, A., Nidelet, T., Simon, J., Bourgais, A., de Vienne, D. & Sicard, D. (2009) Niche-driven
evolution of metabolic and life-history strategies in natural and domesticated populations
of Saccharomyces cerevisiae. BMC Evol Biol 9: 296.
Stackebrandt, E., Ebers, J. (2006) Taxonomic parameters revisited: tarnished gold standards.
Microbiology Today 8:152-155.
Stackebrandt, E., Frederiksen, W., Garrity, G. M., Grimont, P. A., Kampfer, P., Maiden, M. C.,
Nesme, X., Rossello-Mora, R., Swings, J., Truper, H. G., Vauterin, L., Ward, A. C. &
Whitman, W. B. (2002) Report of the ad hoc committee for the re-evaluation of the
species definition in bacteriology. Int J Syst Evol Microbiol 52, 1043-1047.
Stackebrandt E, Goebel B. (1994). Taxonomic note: a place for DNA-DNA reassociation and
16S rRNA sequence analysis in the present species definition in bacteriology. Int J Syst
Bacteriol 44:846-849.
Stahl, D. A., Key, R., Flesher, B. & Smit, J. (1992). The phylogeny of marine and freschwater
Caulobacters reflects their habitat. J Bacteriol 174, 2193–2198.
Tajima F. (1989a). The effect of change in population size on DNA polymorphism. Genetics
123:597-601.
Tajima F. (1989b). Statistical method for testing the neutral mutation hypothesis by DNA
polymorphism. Genetics 123:585-595.
Takeuchi M., Kawai F., Shimada Y. & Yokota A. (1993) Taxonomic study of polyethylene
glycol-utilizing bacteria: emended description of the genus Sphingomonas and new
descriptions of Sphingomonas macrogoltabidus sp. nov., Sphingomonas sanguis sp. nov.,
and Sphingomonas terrae sp. nov. Syst Appl Microbiol 16, 227-238.
Takeuchi, M., Hamana, K. & Hiraishi, A. (2001). Proposal of the genus Sphingomonas sensu
stricto and three new genera, Sphingobium, Novosphingobium and Sphingopyxis, on the
basis of phylogenetic and chemotaxonomic analysis. Int J Syst Evol Microbiol 51,
Chapter 6: references
113
1405-1417.
Tamura K, Peterson D, Peterson N, Stecher G, Nei M, Kumar S. (2011). MEGA5: Molecular
evolutionary genetics analysis using maximum likelihood, evolutionary distance, and
maximum parsimony methods. Mol Biol Evol [Epub ahead of print].
Thompson JR, Pacocha S, Pharino C, Klepac-Ceraj V, Hunt DE, Benoit J et al. (2005).
Genotypic diversity within a natural coastal bacterioplankton population. Science
307:1311-1313.
Thompson FL, Swings J. (2006). Taxonomy of vibrios. In F.L. Thompson, B. Austin, & J.
Swings (Eds.), The Biology of Vibrios.Washington, DC: ASM Press.
Tindall, B. J. (1990a). A comparative study of the lipid composition of Halobacterium
saccharovorum from various sources. Syst Appl Microbiol 13,128–130.
Tindall, B. J. (1990b). Lipid composition of Halobacterium lacusprofundi. FEMS Microbiol
Lett 66, 199-202;
Tindall, B. J. (1996). Respiratory lipoquinones as biomarkers. In Molecular Microbial Ecology
Manual, section 4.1.5, supplement 1. Edited by A. Akkermans, F. de Bruijn & D. van
Elsas. Dordrecht: Kluwer.
Tindall, B. J. (2005). Respiratory lipoquinones as biomarkers. In Molecular Microbial Ecology
Manual, Section 4.1.5, Supplement 1, 2nd edn. Edited by A. Akkermans, F. de Bruijn &
D. van Elsas. Dordrecht, Netherlands: Kluwer Publishers.
Tindall, B. J., Rossello´-Mo´ra, R., Busse, H.-J., Ludwig, W. & Kaempfer, P. (2010). Notes on
the characterization of prokaryote strains for taxonomic purposes. Int J Syst Evol
Microbiol 60, 249–266.
Torsvik, V., Ovreas, L., Thingstad, T. F. (2002) Prokaryotic diversity – magnitude, dynamics and
controlling factors. Science 296: 1064–1066.
Uchino, M., Shida, O., Uchimura, T. & Komagata, K. (2001). Recharacterization of
Pseudomonas fulva Iizuka and Komagata 1963, and proposals of Pseudomonas parafulva
sp. nov. and Pseudomonas cremoricolorata sp. nov. J Gen Appl Microbiol 47(5),
247-261.
Urbanczyk H, Ast JC, Higgins MJ, Carson J, Dunlap PV. (2007). Reclassification of Vibrio
fischeri, Vibrio logei, Vibrio salmonicida and Vibrio wodanis as Aliivibrio fischeri gen.
Chapter 6: references
114
nov., comb. nov., Aliivibrio logei comb. nov., Aliivibrio salmonicida comb. nov. and
Aliivibrio wodanis comb. nov. Int J Syst Evol Microbiol 57: 2823-2829.
Urwin R, Maiden MCJ. (2003). Multi-locus sequence typing: a tool for global epidemiology.
Trends Microbiol. 11:479–487.
Van Bruggen, A. H. C., Jochimsen, K. N. & Brown, P. R. (1990). Rhizomonas suberifaciens gen.
nov., sp. nov., the causal agent of corky root of lettuce. Int J Syst Bacteriol 40, 175-188.
Van Bruggen, A. H. C., Jochimsen, K. N., Steinberger, E. M., Segers, P. & Gillis M. (1993).
Classification of Rhizomonas suberifaciens, an unnamed Rhizomonas species, and
Sphingomonas spp. in rRNA superfamily IV. Int J Syst Bacteriol. 43(1),1-7.
van Berkum P, Elia P, Eardly BD. (2006). Multilocus sequence typing as an approach for
population analysis of Medicago-nodulating rhizobia. J Bacteriol 188:5570-5577.
Vancanneyt M, Schut F, Snauwaert C, Goris J, Swings J, Gottschal JC. (2001). Sphingomonas
alaskensis sp. nov., a dominant bacterium from a marine oligotrophic environment. Int J
Syst Evol Microbiol 51:73-79.
Vergin KL, Tripp HJ, Wilhelm LJ, Denver DR, Rappé MS, Giovannoni SJ. (2007). High
intraspecific recombination rate in a native population of Candidatus Pelagibacter ubique
(SAR11). Environ Microbiol 9:2430-2440.
Vinuesa P, Rojas-Jimenez K, Contreras-Moreira B, Mahna SK, Prasad BN, Moe H et al. (2008).
Multilocus sequence analysis for assessment of the biogeography and evolutionary
genetics of four Bradyrhizobium species that nodulate soybeans on the asiatic continent.
Appl Environ Microbiol 74:6987-6996.
Vos M, Didelot X. (2008). A comparison of homologous recombination rates in bacteria and
archaea. ISME J 3:199-208.
Walsh, T. (2006) Combinatorial genetic evolution of multiresistance. Curr. Opin. Microbiol. 9 (5):
476–482.
Wang Q, Garrity GM, Tiedje JM, Cole JR. (2007). Naive Bayesian classifier for rapid
assignment of rRNA sequences into the new bacterial taxonomy. Appl Environ Microbiol
73:5261-5267.
Ward, D.M. (1998) A natural species concept for prokaryotes. Curr. Opin. Microbiol. 1:
271–277.
Chapter 6: references
115
Ward DM, Bateson MM, Ferris MJ, Kuhl M, Wieland A, Koeppel A et al. (2006).
Cyanobacterial ecotypes in the microbial mat community of Mushroom Spring
(Yellowstone National Park, Wyoming) as species-like units linking microbial
community composition, structure and function. Philos Trans R Soc Lond B Biol Sci
361:1997-2008.
Ward, D.M., Cohan, F.M., Bhaya, D., Heidelberg, J.F., Kuhl, M., Grossman, A. (2008) Genomics,
environmental genomics and the issue of microbial species. Heredity 100: 207–219.
Wayne, L.G., Brenner, D.J., Colwell, R.R., et al. (12 co-authors). (1987) Report of the ad hoc
committee on reconciliation of approaches to bacterial systematics. Int J Syst Bacteriol.
37:463–464.
Weidner, S., Arnold, W. & Puehler, A. (1996). Diversity of uncultured microorganisms
associated with the seagrass Halophila stipulacea estimated by restriction fragment
length polymorphism analysis of PCR-amplified 16S rRNA genes. Appl Env Microbiol
62, 766–771.
Whitlock MC. (2006). Effective Population Size. In: eLS. John Wiley & Sons Ltd, Chichester.
http://www.els.net.
Wickham H. (2009). ggplot2: elegant graphics for data analysis. Springer: New York.
Williams, J.G., Kubelik, A.R., Livak, K.J., Rafalski, J.A., Tingey, S.V. (1990) DNA
polymorphisms amplified by arbitrary primers are useful as genetic markers. Nucleic
Acids Res. 18(22):6531-6535.
Whittam, T.S. (1995) Genetic population structure and pathogenicity in enteric bacteria, p .
217–245 . In S . Baumberg, J . P . W . Young, E. M . H . Wellington, and J . R . Saunders
(ed.), Population genetics of bacteria . Cambridge University Press, Cambridge, England.
Xu, J. (2004) The prevalence and evolution of sex in microorganisms. Genome 47:775-780.
Yabuuchi, E., Yano, I., Oyaizu, H., Hashimoto, Y., Ezaki, T. & Yamamoto, H. (1990). Proposal of
Sphingomonas paucimobilis gen. nov. and comb. nov., Sphingomonas parapaucimobilis
sp. nov., Sphingomonas yanoikuyae sp. nov., Sphingomonas adhaesiva sp. nov.,
Sphingomonas capsulate comb. nov. and two genospecies of the genus Sphingomonas.
Microbiol Immunol 34, 99-119.
Yabuuchi, E., Kosako, Y., Naka, T. & Yano, I. (1999). Proposal of Sphingomonas Suberifaciens
Chapter 6: references
116
(Van Bruggen, Jochimsen and Brown 1990) comb. nov., Sphingomonas natatoria (Sly
1985) comb. nov. Sphingomonas ursincola (Yurkov et al., 1997) comb. nov., and
emendation of the genus Sphingomonas. Microbiol. Immunol. 43, 339-349.
Yabuuchi E., Kosako Y., Fujiwara N., Naka T., Matsunaga I., Ogura H. and Kobayashi K. (2002)
Emendation of the genus Sphingomonas Yabuuchi et al. 1990 and junior objective
synonymy of the species of three genera, Sphingobium, Novosphingobium and
Sphingopyxis, in conjunction with Blastomonas ursincola. Int J Syst Evol Microbiol.
52(Pt 5), 1485-1496.
Yabuuchii, E. & Kosako, Y. (2005). Order IV Sphingomonadales Yabuuchi E., Kosako Y. In
Garrity G. M., Brenner D. J., Krieg N. R., Staley J. R. (eds), Bergey's Manual of
Systematic Bacteriology. Second edition, Vol. 2: The proteobacteria part C, Springer –
Verlag, pp. 230-286.
Yan S, Liu H, Mohr TJ, Jenrette J, Chiodini R, Zaccardelli M et al. (2008). Role of
recombination in the evolution of the model plant pathogen Pseudomonas syringae pv.
tomato DC3000, a very atypical tomato strain. Appl Environ Microbiol 74:3171-3181.
Young JM, Park DC. (2007). Probable synonymy of the nitrogen-fixing genus Azotobacter and
the genus Pseudomonas. Int J Syst Evol Microbiol 57: 2894-2901.
Young, J.M., D.C. Park, H.M. Shearman, and E. Fargier, (2008) A multilocus sequence analysis
of the genus Xanthomonas. Syst Appl Microbiol, 31(5): 366-377.
Zeigler D.R. (2003). Gene sequences useful for predicting relatedness of whole genomes in
bacteria. Int J Syst Evol Microbiol 53: 1893–1900.
Zwart G, Crump BC, Kamst-Van Agterveld MP, Hagen F, Han S. (2002). Typical freshwater
bacteria: an analysis of available 16S rRNA gene sequences from plankton of lakes and
rivers. Aquat Microb Ecol 28:141-155.
Acknowledment
117
Acknowlegment
First I want to thank Prof. Dr. Joerg Overmann for giving me the chance to study in
Germany and for providing this interesting topic, and thanks for excellent care, guidance and
help during my doctoral work. This work was funded by grants of the Deutsche
Forschungsgemeinschaft to J.O. (grants no. OV20/17-1 and OV20/19-1).
Thanks the Overmann’s research group in Ludwig-Maximilians University of Munich and
DSMZ for their help not only for my lab work but also for helping me to adapt and enjoy the life
in Germany. I need to specially thank Mareike Jogler for co-working in the same project, and
also help for everyday life. Thank Dr. Boyke Bunk (DSMZ, Braunschweig) for help with
bioinformatic analyses and Johannes Müller (DSMZ, Braunschweig) and Annemarie Hütz (LMU,
München) for help during the sampling trips.
Thanks to all people in the DSMZ, especially people from microbiology department for
helping me with lots of lab works. Thanks to Dr. Johannes Sikorski and Dr. Brian Tindall for
helping me and answering lots of question and giving suggestions for solving lots of problems.
Thanks to Dr. Brian Tindall, Dr. Elke Lang, Dr. Cathrin Sproeer, Dr. Sabine Gronow, Dr. Peter
Schumann and technical assitants Anja Fruehling, Bettina Straeubler, Birgit Gruen, Gabriele
Poetter, IIjana Schroeder and Nicole Mrotzek for helping and advising for my lab work (all at
DSMZ, Braunschweig). Thanks to Dr. Manfred Rohde (HZI, Braunschweig) and Hans-Jürgen
Busse (IBMH, Vienna, Austria).
I also want to thank my Chinese friends around me, thanks for making my life more
colorful and happy.
At last I want to express my greatest thanks to my father and my sister, your support and
care for all these years to make me finally achieve my goals.
Curriculum vitae
118
Curriculum vitae
Personal information
Name: Hong Chen
Gender: Female
Date of Birth: 02. 08. 1982
Place of Birth: Hunan, P. R. China
Citizenship: P. R. China
E-mail: [email protected]
Education
March 2010 - December 2011 Department Microbial Ecology and Diversity, Leibniz Institut
DSMZ - Deutsche Sammlung von Mikroorganismen und
Zellkulturen GmbH
July 2008 - March 2010 Department Biology I, Microbiology, LMU,
Ludwig-Maximilians-University of Munich
PhD student in the group of prof. Dr. Joerg Overmann.
August 2005 - June 2008 The Third Institute of Oceanography, SOA, Xiamen, China
M.Sc. student in the group of Dr. Xinhua Chen.
September 2001 - June 2005 Central south university, Changsha, China.
Bachelor student in the group of prof. Dr. Jianshe Liu
September 1995 - June 2001 Middle school in Changsha, China
September 1989 - June 1995 Elementary school in Changsha, China
Curriculum vitae
119
Research experience
July 2008- December 2011
Graduate research assistant in the group of prof. Dr. Joerg Overmann, PhD thesis
Project name: Population structure and adaptation in aquatic Sphingomonadaceae.
August 2005-June 2008
Graduate research assistant in the group of Dr. Xinhua Chen, Master thesis
Project name: Physiological characteristic analysis among four strains of Acidithioobacillus
ferrooxidans (A.f) & the mechanism of adaptability analysis of Sulfobacillus
acidophilus (S.a).
September 2001-June 2005
Undergraduate research assistant in the group of prof. Dr. Jianshe Liu, Bachelor thesis
Project name: Electromotive characteristic analysis of the interface of sulfide ore and
bioleaching bacteria.
Teaching experience
Winter semester 2009/2010 Teaching assistant in the lab course 'Microbial diversity'
List of publications
Liu J.-S., Wang Z.-H., Chen, H., Zhang Y.-H. 2006. Interfacial electrokinetic characteristics
before and after bioleaching microorganism adhesion to pyrite Transactions of Nonferrous
Metals Society of China 16: 676—680.
Chen, H., Yang, B., Chen, X.-H. 2009. Identification and characterization of four strains of
Acidithiobacillus ferrooxidans isolated from different sites in China. Microbiological
Research, 164:613-23.
Chen, H., Chen X.-H. 2007. A comparison of physiological features among 4 strains of
Curriculum vitae
120
Acidithiobacillus ferrooxidans isolated from different geological sources Journal of
Oceanography in Taiwan Strait 26: 562-567;
Qi H.-Z., Chen, H., Ao, J.-Q., Zhou H.-B., Chen X.-H. 2009. Isolation and identification of a
strain of moderate thermophilic and acidophilic bacterium from deep sea, Acta Oceanologica
Sinica, 31: 152-158.
Chen, H., Jogler, M., Sikorski, J., Overmann J. Evidence for incipient speciation among
sympatric subpopulations of a single phylotype of freshwater planktonic Sphingomonadaceae
ISME J., submitted
Jogler, M., Siemens, H., Chen, H., Bunk, B., Sikorski, J., Overmann, J. (2011). Identification
and targeted cultivation of an abundant novel freshwater sphingomonad and analysis of its
population substructure. Appl Environ Microbiol 77(20): 7355-7364.
Chen, H., Jogler, M., Tindall, B., Rohde, M., Busse, H.-J., Overmann J. Reclassification and
amended description of Caulobacter leidyi as Sphingomonas leidyi comb. nov., and emendation of
the genus Sphingomonas, to be submitted to Int. J. Syst. Evol. Microbiol..
Chen, H., Jogler, M., Tindall, B., Rohde, M., Busse, H.-J., Overmann J. Sphingobium limneticum
sp. nov., isolated from fresh lake water Starnberger See. to be submitted to Int. J. Syst. Evol.
Microbiol..
Chen, H., Jogler, M., Tindall, B., Rohde, M., Busse, H.-J., Overmann J. Sphingomonas
oligotrophica sp. nov., isolated from fresh lake water Starnberger See. to be submitted to Int. J.
Syst. Evol. Microbiol..
Chen, H., Jogler, M., Tindall, B., Rohde, M., Busse, H.-J., Overmann J. Sphingobium boeckii sp.
nov., isolated from fresh lake water Walchensee and reclassification of Sphingomonas
suberifaciens as Sphingobium suberifaciens. to be submitted to Int. J. Syst. Evol. Microbiol..
Curriculum vitae
121
Conference presentations
Heppe, M., Siemens, H., Chen, H., Overmann, J., Mechanisms of species differentiation in
bacteria. Annual Conference of the Association of General and Applied Microbiology (VAAM),
March 8-11, 2009, Bochum, Germany (Poster).
Chen, H., Jogler, M., Overmann, J. The evolutionary basis of Alphaproteobacterial diversity. 3rd
Joint Conference of the German Society for Hygiene and Microbiology (DGHM) and the
Association for General and Applied Microbiology (VAAM), March 28-31, 2010, Hannover,
Germany (Poster).
Jogler, M., Siemens, H., Chen, H., Overmann, J., Bacterial speciation and the evolutionary basis
of bacterial diversity. 3rd Joint Conference of the German Society for Hygiene and Microbiology
(DGHM) and the Association for General and Applied Microbiology (VAAM), March 28-31,
2010, Hannover, Germany (Poster).
Chen, H., Jogler, M., Overmann, J. Analysis of the population substructure of aquatic
Sphingomonadaceae by MLSA. 13th International Society for Microbial Ecology Conference
(ISME-13), August 22-27, 2010, Seattle, USA (Poster).
Jogler, M., Siemens, H., Chen, H., Overmann, J., Bacterial speciation-aquatic
Sphingomonadaceae as a model system. 13th International Society for Microbial Ecology
Conference (ISME-13), August 22-27, 2010, Seattle, USA (Poster).
Chen, H., Overmann, J. Analysis of the population substructure of aquatic Sphingomonadaceae
by MLSA. Graduate Program in Evolution, Ecology, & Systematics (EES), LMU Munich-
Second Status Symposium in Evolutionary Biology (VW symposium) May 09-12, 2010,
Fraueninsel, Lake Chiemsee, Germany (Poster).
Chen, H., Jogler, M., Overmann, J. Population structure of aquatic Sphingomonadaceae Annual
Conference of the Association for General and Applied Microbiology (VAAM), April 03-06,
2011, Karlsruhe, Germany (Poster).

Curriculum vitae
122
Jogler, M., Siemens, H., Chen, H., Overmann, J., Bacterial speciation - aquatic
Alphaproteobacteria as a model system. Annual Conference of the Association for General and
Applied Microbiology (VAAM), April 03-06, 2011, Karlsruhe, Germany (Oral).


![3.3 Aquatic Resources - California State Water Resources ... · Section 3.3.5 [Aquatic Resources] Potential Impacts and Mitigation. 3.3.2.1 Aquatic Species Numerous aquatic species](https://img.pdfslide.us/doc/110x75/5fdf05efaeffa42ca171b579/33-aquatic-resources-california-state-water-resources-section-335-aquatic.jpg)