Embed Size (px)
Citation preview

Population & Population & Environment IEnvironment I
ES 118 Spring ES 118 Spring 20082008

Weeks1 2 3 4 5
Population (millions)
1.3
2.6
3.9
5.2
Size of US every 3.7
years
Size of Germany
every year


2020thth Century: The Population Century Century: The Population Century– 1900: 1.6 billion 1900: 1.6 billion – 2000: 6.1 billion, avg. population density 2000: 6.1 billion, avg. population density
45 people/km45 people/km22

Population and Population and environmentenvironment What are different perspectives What are different perspectives
on the importance of population on the importance of population and the environment?and the environment?
How are populations measured How are populations measured and described?and described?
What factors and policies What factors and policies influence population growth and influence population growth and environmental impact?environmental impact?
What does the future hold? What does the future hold?
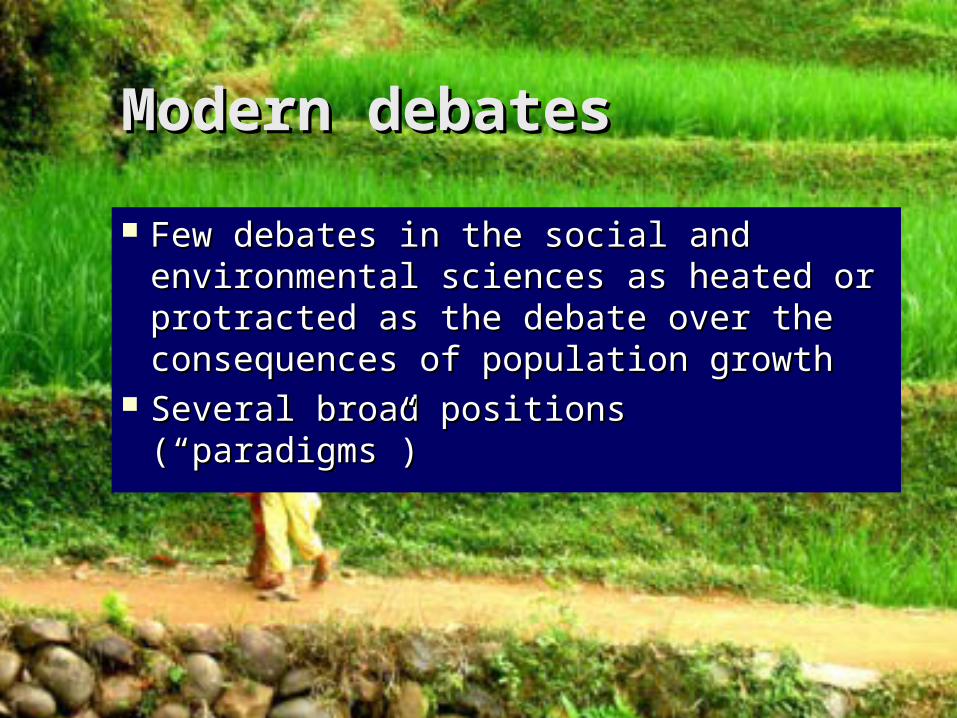
Modern debatesModern debates
Few debates in the social and Few debates in the social and environmental sciences as heated or environmental sciences as heated or protracted as the debate over the protracted as the debate over the consequences of population growthconsequences of population growth
Several broad positions Several broad positions (“paradigms”)(“paradigms”)

Historical dimensionsHistorical dimensions
Thomas MalthusThomas Malthus 1798: 1798: An Essay on An Essay on the Principle of Populationthe Principle of Population– Population tends to increase exponentially, Population tends to increase exponentially,
food production tends to increase slowly, food production tends to increase slowly, so populations will outstrip food supplyso populations will outstrip food supply
– Need “positive checks” (e.g., disease or Need “positive checks” (e.g., disease or famine) or “preventative checks” (e.g., famine) or “preventative checks” (e.g., “moral restraint”)“moral restraint”)
– Argued that poverty is an eventual Argued that poverty is an eventual consequenceconsequence of population growth of population growth

Neo-MalthusiansNeo-Malthusians
Argue that we are Argue that we are approaching or approaching or have surpassed have surpassed earth’s physical earth’s physical capacity to sustain capacity to sustain growthgrowth
Paul Ehrlich Paul Ehrlich (The (The Population Bomb):Population Bomb): “The battle to feed “The battle to feed humanity is over…”humanity is over…”
Paul R. Ehrlich, Stanford

Population growth no Population growth no problemproblem Some neoclassical economists have Some neoclassical economists have
argued population growth not a problem, argued population growth not a problem, and may be a source of progressand may be a source of progress– Ester BoserupEster Boserup– Julian SimonJulian Simon
Population growth stimulates investment Population growth stimulates investment in increased efficiency, resource in increased efficiency, resource substitution, conservation, and substitution, conservation, and innovationinnovation

Inequality argumentsInequality arguments
Population growth and environmental Population growth and environmental problems caused by social structural problems caused by social structural arrangements that produce inequalityarrangements that produce inequality
Karl Marx: Population a Karl Marx: Population a symptomsymptom, , rather than a root cause, of poverty, rather than a root cause, of poverty, resource depletion, pollution, etc.resource depletion, pollution, etc.
Neo-MarxiansNeo-Marxians– Eliminating oppression and poverty Eliminating oppression and poverty
through technological development and through technological development and social justice will solve the problemsocial justice will solve the problem
– Francis Moore LappéFrancis Moore Lappé

Population-Population-environment linksenvironment links What is the relationship between What is the relationship between
environmental impact and population?environmental impact and population? I = P x A x TI = P x A x T (“ipat”) (Ehrlich and (“ipat”) (Ehrlich and
Holdren)Holdren)– II = Environmental impact = Environmental impact – P P = Population= Population– AA = Affluence (consumption) = Affluence (consumption)– TT = Technological impact per unit of = Technological impact per unit of
consumption(+ or -)consumption(+ or -)
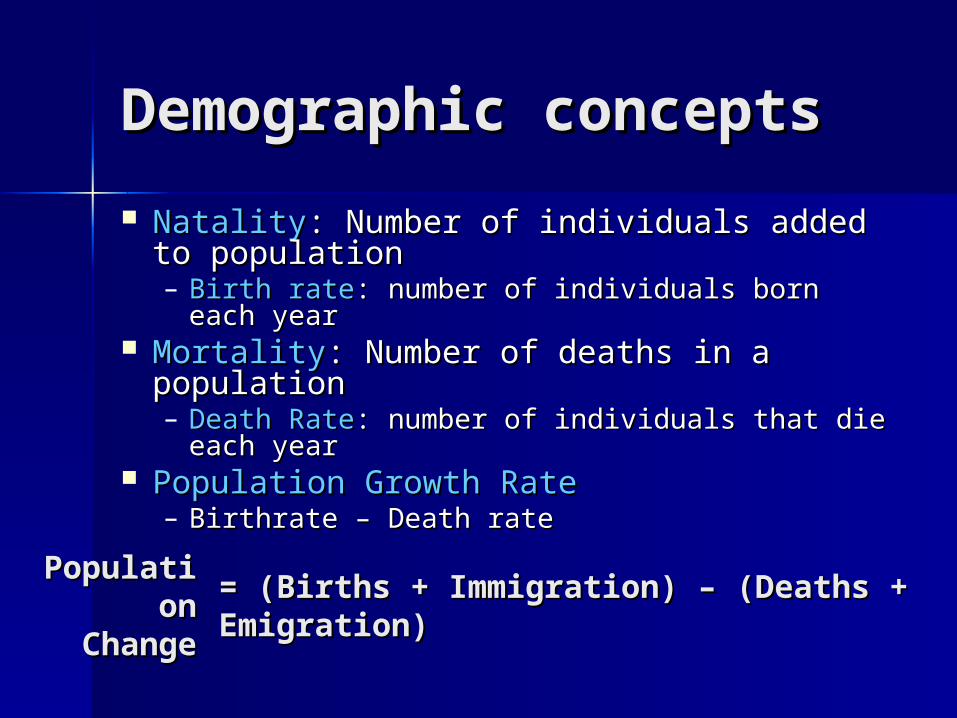
Demographic conceptsDemographic concepts
NatalityNatality: Number of individuals added to : Number of individuals added to populationpopulation– Birth rateBirth rate: number of individuals born each year: number of individuals born each year
MortalityMortality: Number of deaths in a population: Number of deaths in a population– Death RateDeath Rate: number of individuals that die each : number of individuals that die each
yearyear Population Growth RatePopulation Growth Rate
– Birthrate – Death rateBirthrate – Death rate
= (Births + Immigration) – (Deaths + = (Births + Immigration) – (Deaths + Emigration)Emigration)
PopulatiPopulation on
ChangeChange
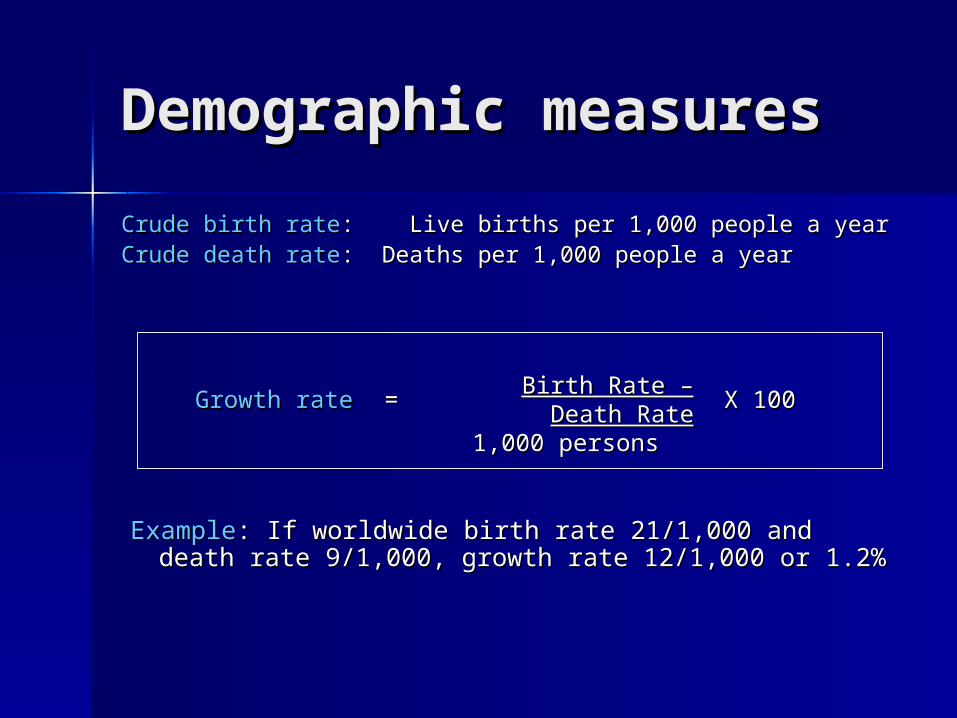
Demographic Demographic measuresmeasuresCrude birth rateCrude birth rate: Live births per 1,000 people a year: Live births per 1,000 people a yearCrude death rateCrude death rate: Deaths per 1,000 people a year: Deaths per 1,000 people a year
Growth rateGrowth rate Birth Rate – Death Birth Rate – Death RateRate
1,000 persons1,000 persons
X 100X 100==
ExampleExample: If worldwide birth rate 21/1,000 and death : If worldwide birth rate 21/1,000 and death rate 9/1,000, growth rate 12/1,000 or 1.2%rate 9/1,000, growth rate 12/1,000 or 1.2%

ExampleExample
Q: Q: What is the annual population increase in the United What is the annual population increase in the United States (excluding migration) assuming the following States (excluding migration) assuming the following birth rate and death rate? birth rate and death rate?
BR in USBR in US: 14/1,000: 14/1,000DR in USDR in US: 8/1,000: 8/1,000
Growth Growth raterate
14 – 8_____14 – 8_____1,000 persons1,000 persons
X 100X 100==
_____6__________6_____1,000 persons1,000 persons
= 0.006 X = 0.006 X 100100
==

Doubling timeDoubling timeDoubling Time (years)Doubling Time (years) = 70 / Growth Rate = 70 / Growth Rate (%)(%)
Current global GR = 1.2%; DT=58 years

Carrying capacityCarrying capacity
Populations with few or no resource Populations with few or no resource limitations tends to grow exponentiallylimitations tends to grow exponentially
The ultimate size of a population is The ultimate size of a population is constrained by the constrained by the carrying capacitycarrying capacity of of the environmentthe environment
Maximum sustainable population for Maximum sustainable population for an areaan area– Determined by limiting factorsDetermined by limiting factors– Not fixed—can change (e.g., more food)Not fixed—can change (e.g., more food)
500,000 10,000 8,000 6,000 4,000 2,000 0
1
6
5
4
3
2
7
1
6
5
4
3
2
7
Years Before Present
Bill
ion
s of
People

Time
Populationsize
Population growth - Population growth - modelsmodels
Carrying capacityCarrying capacity
K

Factors that limit Factors that limit growthgrowth ExtrinsicExtrinsic
– Regulated by factors from outsideRegulated by factors from outside– Ex: Loss of food, predators, accidentsEx: Loss of food, predators, accidents
IntrinsicIntrinsic– Regulated by factors inside populationRegulated by factors inside population– Ex: Behavioral changes with overcrowdingEx: Behavioral changes with overcrowding
Density-dependentDensity-dependent– Become more effectives as populations density Become more effectives as populations density
increasesincreases– Ex: Larger population, predation or disease more likelyEx: Larger population, predation or disease more likely
Density-independentDensity-independent– Ex: Natural catastrophes independent of population Ex: Natural catastrophes independent of population
densitydensity

Types of limiting Types of limiting factorsfactors Raw materialsRaw materials
– Nutrients, waterNutrients, water EnergyEnergy
– Plants require sunlight; animals food for Plants require sunlight; animals food for energyenergy
WasteWaste– Bacteria colonies collapse if too much Bacteria colonies collapse if too much
wastewaste Interactions with other organismsInteractions with other organisms

Total Fertility Rate Total Fertility Rate (TFR)(TFR) A major indicator of population growthA major indicator of population growth Provides estimate of how many children Provides estimate of how many children
women would have in their lifetime if women would have in their lifetime if the birth rates remained unchangedthe birth rates remained unchanged
Replacement-level fertility: Replacement-level fertility: Number of Number of children a couple must bear to replace children a couple must bear to replace themselvesthemselves– ~2.1 in developed countries~2.1 in developed countries
~2.5 in developing countries~2.5 in developing countries

Demographic divideDemographic divide
On one side, mostly poor countries On one side, mostly poor countries with relatively high birth rateswith relatively high birth rates
On the other, mostly wealthy On the other, mostly wealthy countries with birth rates so low countries with birth rates so low populations decliningpopulations declining

Global TFR trendsGlobal TFR trends
1950-2005 average number of 1950-2005 average number of children per women fell from 5.0 to children per women fell from 5.0 to 2.72.7– In developed countries fell from 2.5 to 1.6In developed countries fell from 2.5 to 1.6– In less developed countries, fell from 6.2 In less developed countries, fell from 6.2
to 3.0 to 3.0 – Sub-Saharan Africa remains above 5.0Sub-Saharan Africa remains above 5.0

Local TFR variationLocal TFR variation

Fertility and population Fertility and population growthgrowth
These countries have similar population sizes today, These countries have similar population sizes today, but will diverge dramatically because of their but will diverge dramatically because of their different levels of fertility. different levels of fertility.

Countries with high Countries with high TFRTFR Widespread povertyWidespread poverty Largely rural populationsLargely rural populations High rates of illiteracyHigh rates of illiteracy Minimal use of family planningMinimal use of family planning No “safety net” outside of the familyNo “safety net” outside of the family High rates of child mortalityHigh rates of child mortality
– Nigeria: 100 infants die out of 1,000 Nigeria: 100 infants die out of 1,000 births (vs 59/1,000 for all less developed births (vs 59/1,000 for all less developed countries and 6/1,000 for more countries and 6/1,000 for more developed countries)developed countries)

Countries with low TFRCountries with low TFR
Some countries have low or declining TFR Some countries have low or declining TFR (Italy and South Korea 1.2, Japan 1.3, (Italy and South Korea 1.2, Japan 1.3, Northern 1.7 and Western Europe 1.6 Northern 1.7 and Western Europe 1.6 children per womanchildren per woman– Rising expectations for material goods and Rising expectations for material goods and
living standardsliving standards– Uncertainty and tight housing and labor Uncertainty and tight housing and labor
marketsmarkets– Targeted policies and programs Targeted policies and programs – Women waiting longer for marriage and Women waiting longer for marriage and
childrenchildren– Cohabitation less accepted and commonCohabitation less accepted and common

Age Structure Age Structure (Distribution)(Distribution) Number of individuals in each Number of individuals in each
stage in the populationstage in the population– Influenced by growth rateInfluenced by growth rate– If most of the population is young If most of the population is young
(reproductive or pre-reproductive), (reproductive or pre-reproductive), population will growpopulation will grow
– If most of population is older (post-If most of population is older (post-reproductive), population may fallreproductive), population may fall

Population age Population age structure (distribution)structure (distribution)
Prereproductive
Reproductive
Postreproductive

Population age Population age structurestructure
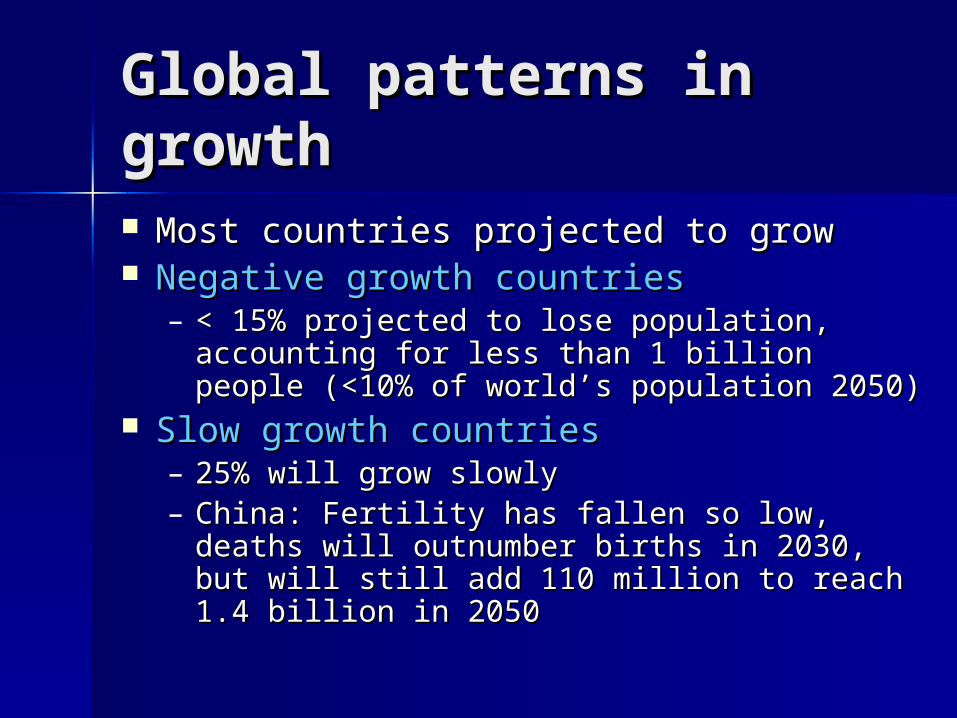
Global patterns in Global patterns in growthgrowth Most countries projected to growMost countries projected to grow Negative growth countriesNegative growth countries
– < 15% projected to lose population, < 15% projected to lose population, accounting for less than 1 billion people accounting for less than 1 billion people (<10% of world’s population 2050)(<10% of world’s population 2050)
Slow growth countriesSlow growth countries– 25% will grow slowly25% will grow slowly– China: Fertility has fallen so low, deaths will China: Fertility has fallen so low, deaths will
outnumber births in 2030, but will still add outnumber births in 2030, but will still add 110 million to reach 1.4 billion in 2050110 million to reach 1.4 billion in 2050

2005-20502005-2050
Patterns of growthPatterns of growth
Moderate growth countriesModerate growth countries– U.S. projected to increase 42% between U.S. projected to increase 42% between
2005-2050, adding > 100 million people 2005-2050, adding > 100 million people (but note: “slow growth” if just birth rate (but note: “slow growth” if just birth rate considered without immigration)considered without immigration)
– Other examples: Bangladesh, Brazil, India, Other examples: Bangladesh, Brazil, India, Indonesia, and IranIndonesia, and Iran
– These countries account for just 8% of These countries account for just 8% of world population today, but likely will world population today, but likely will account for 20% by 2050account for 20% by 2050

Demographic Demographic transitiontransition

Demographic transition in Sweden Demographic transition in Sweden and Mexicoand Mexico

Global comparisonsGlobal comparisons
How have fertility rates and death How have fertility rates and death rates changed by country and rates changed by country and region over time? region over time?