Embed Size (px)
Citation preview

Knowledge and Management of Aquatic Ecosystems (2012) 405, 09 http://www.kmae-journal.orgc© ONEMA, 2012
DOI: 10.1051/kmae/2012017
Population dynamics of the freshwater clamGalatea paradoxa from the Volta River, Ghana
D. Adjei-Boateng(1) ,�, J.G. Wilson(2)
Received February 6, 2012
Revised April 25, 2012
Accepted May 7, 2012
ABSTRACT
Key-words:recruitment,mortality,growthparameters,Volta River,Bivalvia
Population parameters such as asymptotic (L∞), growth coefficient (K),mortality rates (Z, F and M), exploitation level (E) and recruitment patternof the freshwater clam Galatea paradoxa were estimated using length-frequency data from the Volta River estuary, Ghana. The L∞ for G. para-doxa at the Volta estuary was 105.7 mm, the growth coefficient (K) andthe growth performance index (Ø) ranged between 0.14–0.18 year−1 and3.108–3.192, respectively. Total mortality (Z) was 0.65–0.82 year−1, whilenatural mortality (M) and fishing mortality (F) were 0.35–0.44 year−1 and0.21–0.47 year−1, respectively, with an exploitation level of 0.32–0.57. Therecruitment pattern suggested that G. paradoxa has year-round recruit-ment with a single pulse over an extended period (October–March) in theVolta River. The Volta River stock of G. paradoxa is overfished and requiresimmediate action to conserve it. This can be achieved by implementing aminimum landing size restriction and intensifying the culture of smallerclams which is a traditional activity at the estuary.
RÉSUMÉ
La dynamique des populations de palourdes d’eau douce Galatea paradoxa de la rivièreVolta, Ghana
Mots-clés :recrutement,mortalité,paramètresde croissance,Rivière Volta,Bivalve
Les paramètres de population tels que (L∞) asymptotique, le coefficient de crois-sance (K), les taux de mortalité (Z, F et M), le niveau d’exploitation (E) et le modèlede recrutement des palourdes d’eau douce Galatea paradoxa ont été estimés àl’aide des données de fréquences de longueur dans l’estuaire du fleuve Volta, auGhana. Le L∞ pour G. paradoxa dans l’estuaire de la Volta était de 105,7 mm, lecoefficient de croissance (K) et l’indice de performance de croissance (Ø) variaiententre 0,14 à 0,18 an−1 et de 3,108 à 3,192, respectivement. La mortalité totale (Z)était de 0,65 à 0,82 an−1, tandis que la mortalité naturelle (M) et la mortalité parpêche (F) étaient de 0,35 à 0,44 an−1 et de 0,21 à 0,47 an−1, respectivement, avecun niveau d’exploitation de 0,32 à 0,57. Le schéma de recrutement suppose queG. paradoxa a du recrutement tout au long de l’année avec un maximum sur unelongue période (octobre–mars) dans le bassin de la Volta. Le stock de G. paradoxade la rivière Volta est surexploité et exige une action immédiate pour le conserver.Ceci peut être réalisé en mettant en œuvre une restriction de taille minimale dedébarquement et en intensifiant la culture de petites palourdes qui est une activitétraditionnelle dans l’estuaire.
(1) Department of Fisheries and Watershed Management, Kwame Nkrumah University of Scienceand Technology, Kumasi, Ghana(2) Zoology Department, TCD, Dublin 2, Ireland� Corresponding author: [email protected]
Article published by EDP Sciences
D. Adjei-Boateng and J.G. Wilson : Knowl. Managt. Aquatic Ecosyst. (2012) 405, 09
INTRODUCTION
The freshwater clam Galatea paradoxa (Born, 1778) is a bivalve mollusc belonging to the su-perfamily Tellinoidea and family Donacidae (Purchon, 1963). It is endemic to the West Africansub-region with a range that extends from the Gulf of Guinea to the Congo (Moses, 1990).Galatea Paradoxa is the basis of an artisanal clam fishery at the Volta River estuary providingemployment and an affordable protein source to the riparian human communities and be-yond (Amador, 1997). Furthermore the clam shell has a number of important uses notably asa source of calcium in poultry feed and in lime manufacturing.The population dynamics of bivalves are studied with the objective of sustainable manage-ment and conservation (Urban, 1998; Nassar, 1999). Growth rate in bivalves is not constantthroughout their life-span, it is faster at the larval stage and steadily declines as the animalapproaches the asymptotic length (L∞) (Moura et al., 2009). Since individual growth is a non-linear process, the comparison of growth among different organisms or populations is difficultdue to the problem of correlation between the growth coefficient (K) and L∞. To overcome thisproblem, the overall growth performance index, phi-prime (Ø) (Pauly, 1979; Munro and Pauly,1983) is often used to compare growth between different populations of a species.Recruitment patterns in bivalve populations are either a single annual event as in most tem-perate bivalves occurring within a short period of the year when conditions are favourable;e.g., Mytilus edulis in mid July (Petraitis, 1991) or over an extended period from late summerto late winter or spring; e.g., Macomona liliana (Roper et al., 1992). In other species such asSolemya sp., recruitment is continuous year-round (Rainer and Wadley, 1991). Recruitmentpatterns are greatly influenced by climatic conditions as observed in the Wadden Sea, wherehigher recruitment of Cerastoderma edule, Mytilus edulis, Macoma balthica and Mya arenariain the summer after severe winters is a common phenomenon (Strasser et al., 2001).Mortality in bivalve populations consists of two parts, natural mortality (M) and fishing mor-tality (F). In unexploited populations total mortality (Z) is equal to natural mortality (M). Onceexploitation starts mortality due to fishing is introduced which in most instances assumes animportant role as the exploitation level increases. In order to ensure sustainability in any fish-ery, it is recommended that mortality due to fishing should not exceed 50% of total mortalityi.e. F = M (Gulland, 1965). However, it has been difficult maintaining this level of exploitationeven under regulated conditions. Exploitation has always gone beyond optimal or sustainablelevels leading to drastic reduction in numbers or in some cases extinction of species. For ex-ample in the Polymesoda solida fishery of Colombia, fishing mortality accounts for 72% oftotal mortality (Rueda and Urban, 1998). Similarly, in the Modiolus metcalfei fishery of thePhilippines, fishing mortality accounts for 73% of total mortality (Tumanda Jr. et al., 1997).Length-weight relationships usually describe a mathematical relationship between length andweight, such that one may be converted to the other. It also measures the deviation from theexpected weight for a specified length of an individual or a group of individuals as indicationof condition and gonad development (Le Cren, 1951). It has been found that the length-weightrelationship of most organisms can adequately be described by the formula: W = αLβ, whereW = weight, L = length, α is a constant and β an exponent usually lying between 2.5 and4.0 (Martin, 1949). An ideal organism maintains the same shape throughout life such thatgrowth is uniform for all body parts and β = 3. This type of growth is described as isometric,a condition only occasionally observed (Allen, 1938). In the vast majority of instances wherelength-weight relationships have been calculated, it has been found that β �= 3, in that casegrowth is referred to as allometric where certain parts of the body grow faster than others(Gaspar et al., 2002).For the sustainable management of mollusc resources, knowledge of various populationparameters and exploitation level (E) of the population is required. There are many toolsfor assessing exploitation levels and the population dynamics of a stock, however, theFAO-ICLARM stock assessment tools (FiSAT) has been most frequently used for estimat-ing population parameters of finfish and shellfish (Vakily, 1992; Mancera and Mendo, 1996;Al-Barwani et al., 2007) because it needs only length-frequency data. Despite its commercialimportance there is limited information on the population dynamics of G. paradoxa in the Volta
09p2
D. Adjei-Boateng and J.G. Wilson : Knowl. Managt. Aquatic Ecosyst. (2012) 405, 09
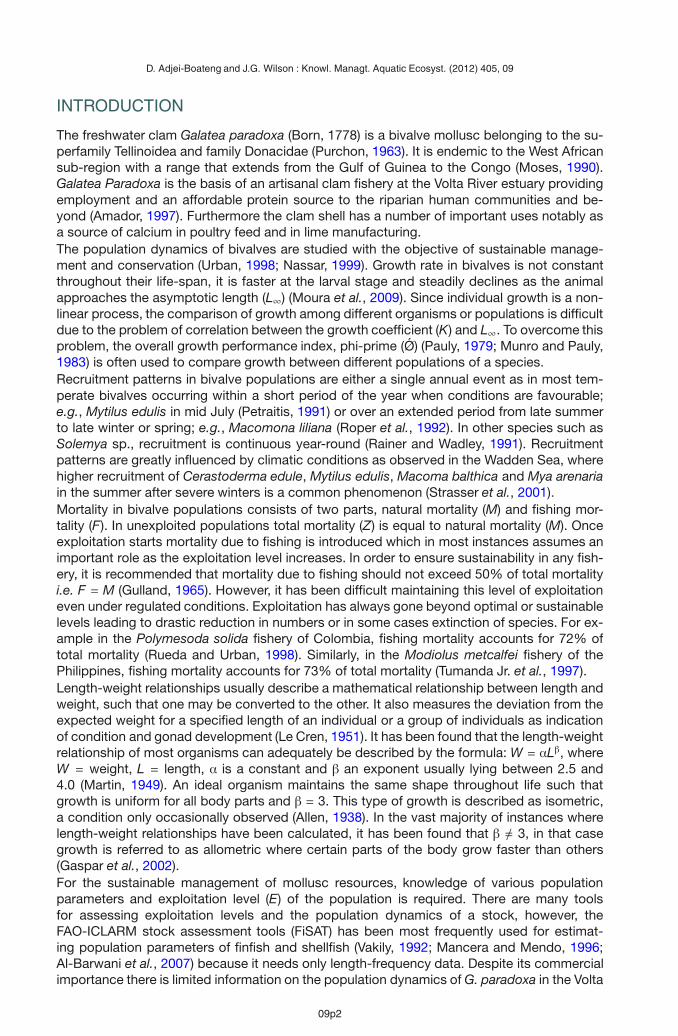
Figure 1Map showing the clam sampling locations at Ada and Aveglo at the Volta estuary, Ghana.
River. This information is crucial for estimating sustainable exploitation rates as well as thepotential of the species for aquaculture production. This study was aimed at estimating thepopulation parameters and exploitation level of G. paradoxa in the Volta River.
MATERIALS AND METHODS
> STUDY AREA
The study was conducted at the estuary of the Volta River, south-eastern Ghana (Figure 1).The Volta River estuary lies within the coastal savannah zone with an annual rainfall of750–1250 mm (Dickson and Benneh, 1977). The estuary is about 1.2 km wide at the mouth,however, due to the formation of a sandbar, the river enters the sea through a narrow opening.Two dams have been built on the Volta River at Akosombo (100 km) and further downstreamat Kpong, 75 km from the river’s mouth. These dams in addition to a sandbar at the mouthof the river influence the estuary’s seawater and freshwater dynamics. Sampling was carriedout at two sites, Ada (Latitude 05◦ 49′ 10′′ N and 0◦ 38′ 38′′ E) and Aveglo (5◦ 52′ 54′′ N,0◦ 38′ 55′′ E) (Figure 1).
> CLAM SAMPLING
Clam samples were collected monthly from March 2008 to February 2010 at Ada and Avegloat the Volta estuary from clam fishers. In order to obtain a sample covering the range of sizesin the population and eliminate any bias due to the preference of fishers for larger clams(clams less than 20 mm are not picked by fishers), 2 grab samples (grab size equivalent to0.1 m2) were collected monthly from each site. The sediments were washed over a 1 mm sieveand any clam recovered kept separately for length-frequency distribution of juvenile clams.
09p3
D. Adjei-Boateng and J.G. Wilson : Knowl. Managt. Aquatic Ecosyst. (2012) 405, 09
Samples were transported in insulated boxes with ample river water which was refreshedevery 12 h to the wet laboratory for processing within 24 h.Samples from the fishers catch in addition to the grab samples were processed for estimationof population parameters by the analysis of the length-frequency distribution of the monthlysamples. The shell length (maximum anterior-posterior dimension) of each specimen wasmeasured with a pair of digital callipers (Hangzhou United Bridge Tools, Hangzhou, Zhejiang,China) (0.01 mm), total wet weight (shell + flesh) was recorded with a Sartorius PT1200 bal-ance (DWS, Elk Groove, IL, USA) (0.1 g) after blotting the shell with absorbent paper to removeexcess water and allowing the shell to air-dry at room temperature.
> RECRUITMENT PATTERN
The recruitment pattern of the stock was determined from the length-frequency distributionof the grab samples by backward projection onto the length axis of the length-frequency dataof Ada and Aveglo as described in FiSAT. The routine reconstructs the recruitment pulse froma time series of the length-frequency data to determine the number of pulses per year andthe relative strength of each pulse. The input parameters are L∞, K and t0. Normal distributionof the recruitment pattern (%) was determined by NORMSEP (Pauly and Caddy, 1985) inFiSAT II.
> ESTIMATION OF MORTALITY RATES
Total mortality (Z) of the population was estimated from the length-frequency distribution bythe length converted catch curve method (Pauly, 1984). Natural mortality (M) was estimatedusing the empirical relationship of Pauly (1980):
log10M = −0.0066 − 0.279 log10 L∞ + 0.6543 log10 K + 0.4634 log10 T
where M is the natural mortality, L∞ the asymptotic length, K refers to the growth coefficientof the von Bertalanffy growth function (VBGF) and T is the mean annual habitat temperature,which was (28.6 ◦C) at the Volta estuary over the study period. With Z and M estimated,fishing mortality (F) was obtained from the relationship: F = Z −M, where Z is the total mor-tality, F is the fishing mortality and M is the natural mortality. The exploitation level (E) wasobtained by the relationship of Gulland (1965): E = F/Z = F/ (F + M). The growth performanceindex (Ø) (Pauly, 1984) of G. paradoxa from Ada and Aveglo was estimated using the L∞ andK estimates and the equation: Ø = 2 log10 L∞ + log10 K.
> LENGTH-WEIGHT RELATIONSHIPS
To establish the relationship between shell length and total weight, the commonly used rela-tionship: W = αLβ was applied (Ricker, 1975) where W is total weight (g), L is shell length (mm),α is the intercept and β is the slope (growth coefficient). The parameters α and β were esti-mated by least squares linear regression, using logarithmic data: log10 W = log10 α + β log10 L.The coefficient of determination (R2) was used as an indicator of the quality of the linearregression. A sample of 60 individuals were selected randomly from fisher’s catch and pro-cessed for shell-free dry weight. A sterile stainless steel knife was used to open the shell anda scalpel blade carefully used to remove the flesh of each individual. The flesh of each sam-ple was weighed on a Sartorius BP 210S micro balance (DWS, Elk Groove, IL, USA) to thenearest 0.0001 g (shell-free wet weight). The wet flesh was oven-dried to a constant weight at60 ◦C for 48 h and weighed to the nearest 0.0001 g for shell-free dry weight. The regressioncoefficients for successive monthly samples from Ada and Aveglo were generated and theshell-free dry weight cycle for a 40 mm standard animal outlined.
09p4

D. Adjei-Boateng and J.G. Wilson : Knowl. Managt. Aquatic Ecosyst. (2012) 405, 09
a
b
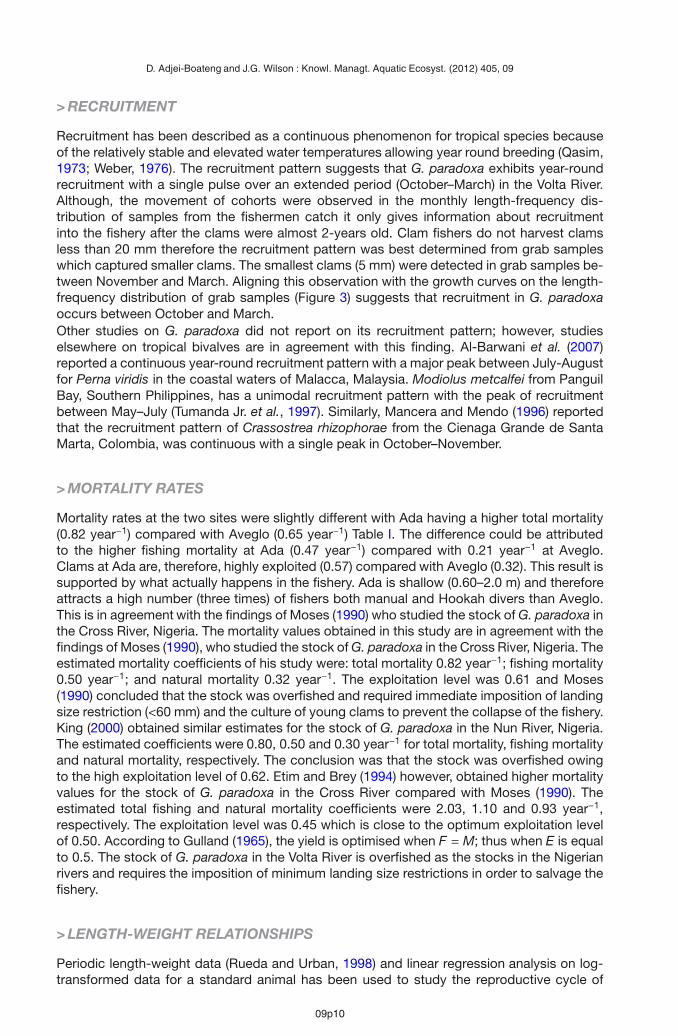
Figure 2Length-frequency distributions of G. paradoxa from two sites at the Volta estuary with growth curvessuperimposed (a) Ada and (b) Aveglo.
RESULTS
The environmental variables monitored at the estuary were similar for the two sites (Ada andAveglo) and varied within a narrow range except conductivity and to lesser extent salinitywhich was higher at high tide. Temperature was relatively constant throughout the study pe-riod and varied narrowly between 27.3 and 29.6 ◦C with a mean of 28.6 ± 0.8 ◦C (n = 24).Conductivity was fairly constant and similar at low tide with a mean of 57.9 μS·cm−1 at Adaand Aveglo. However, at high tide conductivity was higher (mean of 583.4 μS·cm−1) at Ada.The maximum conductivity recorded at Ada was 2879 μS·cm−1. Similarly, salinity was con-stant at 0.03 (psu) at low tide for the two sites during the study period. However, at high tidevalues as high as 1.5 psu were recorded at Ada. The clam beds at Ada are thus exposed todifferent conductivity and salinity regimes depending on tide.
> GROWTH PARAMETERS
The asymptotic length (L∞) and growth coefficient (K) estimate for Ada was 105.7 mm and0.14 year−1 while that for Aveglo was 84.4 mm and 0.18 year−1. From the reverse vonBertalanffy Growth Function (VBGF), t0 for Ada and and Aveglo were –0.125 and –0.119 re-spectively. Figure 2 presents the length frequency distribution by FiSAT II of G. paradoxa fromAda (Figure 2a) and Aveglo (Figure 2b) with growth curves superimposed. Because of fishingbias, individuals less than 20 mm were uncommon in the length-frequency distribution from
09p5
D. Adjei-Boateng and J.G. Wilson : Knowl. Managt. Aquatic Ecosyst. (2012) 405, 09
a
b
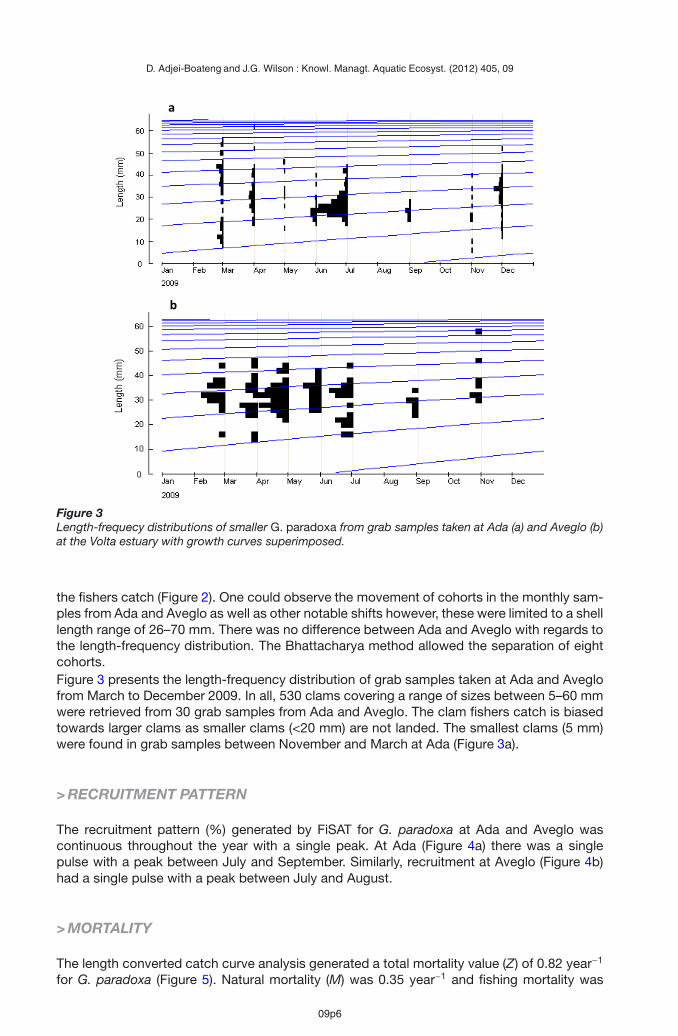
Figure 3Length-frequecy distributions of smaller G. paradoxa from grab samples taken at Ada (a) and Aveglo (b)at the Volta estuary with growth curves superimposed.
the fishers catch (Figure 2). One could observe the movement of cohorts in the monthly sam-ples from Ada and Aveglo as well as other notable shifts however, these were limited to a shelllength range of 26–70 mm. There was no difference between Ada and Aveglo with regards tothe length-frequency distribution. The Bhattacharya method allowed the separation of eightcohorts.Figure 3 presents the length-frequency distribution of grab samples taken at Ada and Aveglofrom March to December 2009. In all, 530 clams covering a range of sizes between 5–60 mmwere retrieved from 30 grab samples from Ada and Aveglo. The clam fishers catch is biasedtowards larger clams as smaller clams (<20 mm) are not landed. The smallest clams (5 mm)were found in grab samples between November and March at Ada (Figure 3a).
> RECRUITMENT PATTERN
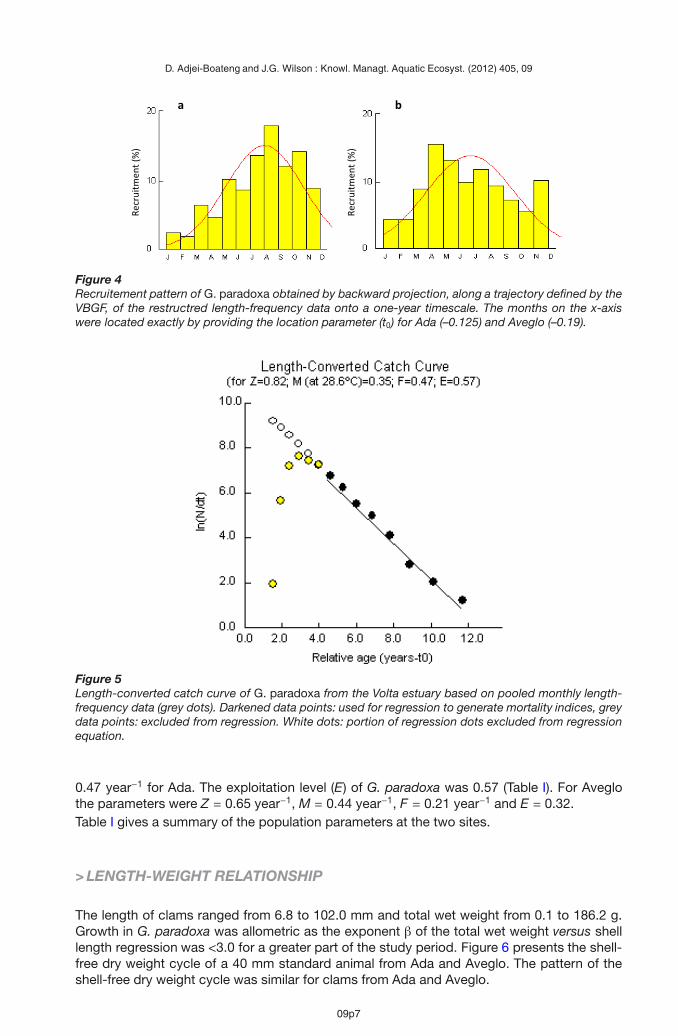
The recruitment pattern (%) generated by FiSAT for G. paradoxa at Ada and Aveglo wascontinuous throughout the year with a single peak. At Ada (Figure 4a) there was a singlepulse with a peak between July and September. Similarly, recruitment at Aveglo (Figure 4b)had a single pulse with a peak between July and August.
> MORTALITY
The length converted catch curve analysis generated a total mortality value (Z) of 0.82 year−1
for G. paradoxa (Figure 5). Natural mortality (M) was 0.35 year−1 and fishing mortality was
09p6
D. Adjei-Boateng and J.G. Wilson : Knowl. Managt. Aquatic Ecosyst. (2012) 405, 09
Recr
uitm
ent (
%)
Recr
uitm
ent (
%)
b
a
Figure 4Recruitement pattern of G. paradoxa obtained by backward projection, along a trajectory defined by theVBGF, of the restructred length-frequency data onto a one-year timescale. The months on the x-axiswere located exactly by providing the location parameter (t0) for Ada (–0.125) and Aveglo (–0.19).
Figure 5Length-converted catch curve of G. paradoxa from the Volta estuary based on pooled monthly length-frequency data (grey dots). Darkened data points: used for regression to generate mortality indices, greydata points: excluded from regression. White dots: portion of regression dots excluded from regressionequation.
0.47 year−1 for Ada. The exploitation level (E) of G. paradoxa was 0.57 (Table I). For Aveglothe parameters were Z = 0.65 year−1, M = 0.44 year−1, F = 0.21 year−1 and E = 0.32.Table I gives a summary of the population parameters at the two sites.
> LENGTH-WEIGHT RELATIONSHIP
The length of clams ranged from 6.8 to 102.0 mm and total wet weight from 0.1 to 186.2 g.Growth in G. paradoxa was allometric as the exponent β of the total wet weight versus shelllength regression was <3.0 for a greater part of the study period. Figure 6 presents the shell-free dry weight cycle of a 40 mm standard animal from Ada and Aveglo. The pattern of theshell-free dry weight cycle was similar for clams from Ada and Aveglo.
09p7
D. Adjei-Boateng and J.G. Wilson : Knowl. Managt. Aquatic Ecosyst. (2012) 405, 09
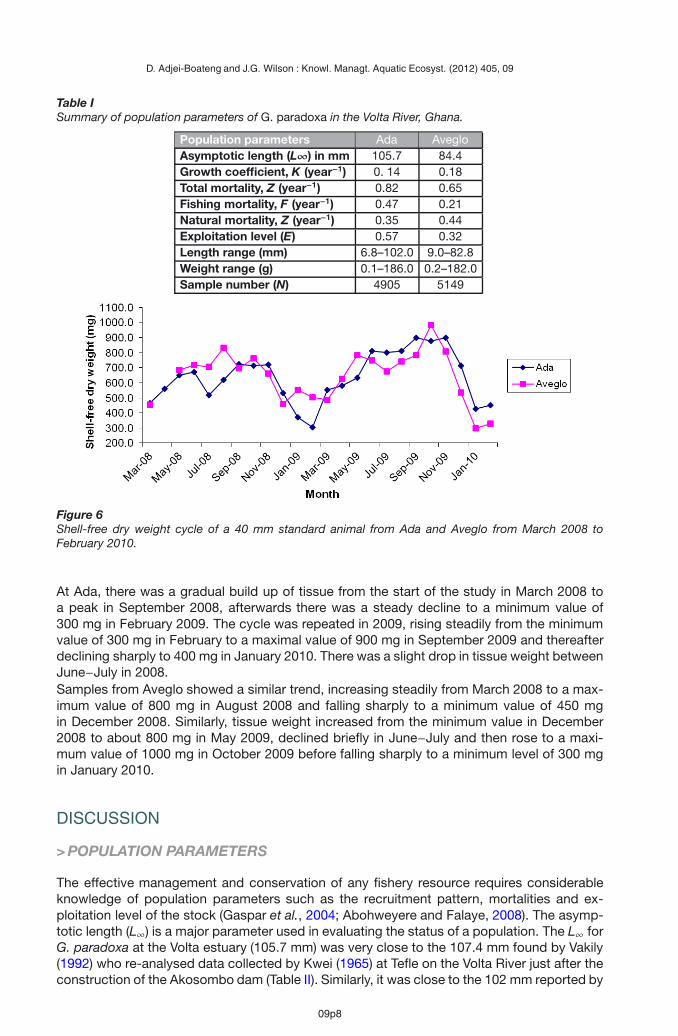
Table ISummary of population parameters of G. paradoxa in the Volta River, Ghana.
Population parameters Ada AvegloAsymptotic length (L∞) in mm 105.7 84.4Growth coefficient, K (year−1) 0. 14 0.18Total mortality, Z (year−1) 0.82 0.65Fishing mortality, F (year−1) 0.47 0.21Natural mortality, Z (year−1) 0.35 0.44Exploitation level (E) 0.57 0.32Length range (mm) 6.8–102.0 9.0–82.8Weight range (g) 0.1–186.0 0.2–182.0Sample number (N) 4905 5149
Figure 6Shell-free dry weight cycle of a 40 mm standard animal from Ada and Aveglo from March 2008 toFebruary 2010.
At Ada, there was a gradual build up of tissue from the start of the study in March 2008 toa peak in September 2008, afterwards there was a steady decline to a minimum value of300 mg in February 2009. The cycle was repeated in 2009, rising steadily from the minimumvalue of 300 mg in February to a maximal value of 900 mg in September 2009 and thereafterdeclining sharply to 400 mg in January 2010. There was a slight drop in tissue weight betweenJune−July in 2008.Samples from Aveglo showed a similar trend, increasing steadily from March 2008 to a max-imum value of 800 mg in August 2008 and falling sharply to a minimum value of 450 mgin December 2008. Similarly, tissue weight increased from the minimum value in December2008 to about 800 mg in May 2009, declined briefly in June−July and then rose to a maxi-mum value of 1000 mg in October 2009 before falling sharply to a minimum level of 300 mgin January 2010.
DISCUSSION
> POPULATION PARAMETERS
The effective management and conservation of any fishery resource requires considerableknowledge of population parameters such as the recruitment pattern, mortalities and ex-ploitation level of the stock (Gaspar et al., 2004; Abohweyere and Falaye, 2008). The asymp-totic length (L∞) is a major parameter used in evaluating the status of a population. The L∞ forG. paradoxa at the Volta estuary (105.7 mm) was very close to the 107.4 mm found by Vakily(1992) who re-analysed data collected by Kwei (1965) at Tefle on the Volta River just after theconstruction of the Akosombo dam (Table II). Similarly, it was close to the 102 mm reported by
09p8

D. Adjei-Boateng and J.G. Wilson : Knowl. Managt. Aquatic Ecosyst. (2012) 405, 09
Table IIGrowth and related parameters of the G. paradoxa stocks in West Africa.
Location L∞ K Ø SourceVolta river (Akosombo, Ghana) 145.1∗ 0.75 4.198 Vakily (1992), Kwei (1965)6◦ 16′ NVolta river (Tefle, Ghana ) 107.4∗ 0.71 3.912 Vakily (1992), Kwei (1965)5◦ 59′ NCross river (Nigeria) 5◦ 11′ N 93.0 0.36 3.493 Moses (1990)Cross river (Nigeria) 5◦ 11′ N 111.0 0.30 3.568 King et al. (1992)Cross river (Nigeria) 5◦ 11′ N 98.9 0.83 3.909 Etim and Brey (1994)Nun river (Nigeria) 102.0 0.25 3.415 King (2000)Volta estuary, Ada, Ghana 105.7 0.14 3.192 This studyVolta estuary, Aveglo, Ghana 84.4 0.18 3.108 This study
∗ These values were originally given as shell height and were converted by Etim and Brey (1994).
King (2000) on the stock of G. paradoxa in the Nun River, Nigeria. It was, however, lower thanthe 145.1 mm obtained by Vakily (1992) from the re-analysed data collected by Kwei (1965) atan upstream station (Akosombo) on the Volta River and the 111.0 mm obtained by King et al.(1992) on the Cross River stock of G. paradoxa. The L∞ estimate in this study was higher thanthat of Moses (1990) and Etim and Brey (1994) for G. paradoxa stocks in the Cross River inNigeria (Table II). The growth coefficient (K) estimate of 0.14–0.18 year−1 in this study was thelowest ever recorded in studies of the population dynamics of G. paradoxa (Table II).
The growth performance index (Ø) allows inter and intra specific comparison of growth per-formance in bivalve species of different stocks (Abohweyere and Falaye, 2008). The Ø valuesof 3.192 and 3.108 obtained for G. paradoxa at Ada and Aveglo, respectively, were the lowestrecorded for any population of G. paradoxa. They were also reduced compared to the 4.198and 3.912 obtained by Vakily (1992) who re-analysed the data of Kwei (1965) on the stockof G. paradoxa from Akosombo and Tefle on the Volta River just after the construction of theAkosombo dam. They were also lower than that reported from studies conducted (Moses,1990; King et al., 1992; Etim and Brey, 1994; King, 2000) on the stock of G. paradoxa in theNun and Cross Rivers of Nigeria (Table II).
The low growth rate and growth performance recorded in this study could be attributed to thenegative effects of habitat modification as a result of damming the Volta River. Damming hasaffected the nutrient dynamics and flow regime of the Volta River, resulting in the formationof a sand bar at the estuary and the growth of aquatic weeds on the clam beds (Attipoeand Amoah, 1989). The data of Kwei (1965) and (Vakily, 1992) were collected just after thecompletion of the dam at Akosombo with little or no effects of its impact on the physicaland chemical characteristics of the river and thus, on the clams’ habitat. According to King(2000), the reported maximum sizes and ages of G. paradoxa are highly variable attributeswithin its geographic distribution. The different populations of G. paradoxa therefore, displaydisparities in growth and longevity owing to differences in environmental factors such assubstratum type, food supply, population density and physico-chemical factors of the habitat(King, 2000).
The slight differences in L∞, K and Ø between Ada and Aveglo could be attributed tothe observed habitat characteristics of the two sites. Ada is shallow with depths between0.60–2.0 m, there are patches with dense aquatic weeds and the sediment is mainly finesand with patches of mud while Aveglo, on the other hand, is deeper with depths between4.0–6.0 m and the sediment is predominantly coarse sand to gravelly. The shallowness of Adaallows sunlight to penetrate to the bottom of the water column thus, increasing the benthicprimary productivity of the area compared to Aveglo which is deeper. These habitat differ-ences could possibly explain the better growth performance observed at Ada. Despite theseminor differences the lifespan of G. paradoxa in the Volta River (8–12 years) is within that ofits marine venerid relatives.
09p9
D. Adjei-Boateng and J.G. Wilson : Knowl. Managt. Aquatic Ecosyst. (2012) 405, 09
> RECRUITMENT
Recruitment has been described as a continuous phenomenon for tropical species becauseof the relatively stable and elevated water temperatures allowing year round breeding (Qasim,1973; Weber, 1976). The recruitment pattern suggests that G. paradoxa exhibits year-roundrecruitment with a single pulse over an extended period (October–March) in the Volta River.Although, the movement of cohorts were observed in the monthly length-frequency dis-tribution of samples from the fishermen catch it only gives information about recruitmentinto the fishery after the clams were almost 2-years old. Clam fishers do not harvest clamsless than 20 mm therefore the recruitment pattern was best determined from grab sampleswhich captured smaller clams. The smallest clams (5 mm) were detected in grab samples be-tween November and March. Aligning this observation with the growth curves on the length-frequency distribution of grab samples (Figure 3) suggests that recruitment in G. paradoxaoccurs between October and March.Other studies on G. paradoxa did not report on its recruitment pattern; however, studieselsewhere on tropical bivalves are in agreement with this finding. Al-Barwani et al. (2007)reported a continuous year-round recruitment pattern with a major peak between July-Augustfor Perna viridis in the coastal waters of Malacca, Malaysia. Modiolus metcalfei from PanguilBay, Southern Philippines, has a unimodal recruitment pattern with the peak of recruitmentbetween May–July (Tumanda Jr. et al., 1997). Similarly, Mancera and Mendo (1996) reportedthat the recruitment pattern of Crassostrea rhizophorae from the Cienaga Grande de SantaMarta, Colombia, was continuous with a single peak in October–November.
> MORTALITY RATES
Mortality rates at the two sites were slightly different with Ada having a higher total mortality(0.82 year−1) compared with Aveglo (0.65 year−1) Table I. The difference could be attributedto the higher fishing mortality at Ada (0.47 year−1) compared with 0.21 year−1 at Aveglo.Clams at Ada are, therefore, highly exploited (0.57) compared with Aveglo (0.32). This result issupported by what actually happens in the fishery. Ada is shallow (0.60–2.0 m) and thereforeattracts a high number (three times) of fishers both manual and Hookah divers than Aveglo.This is in agreement with the findings of Moses (1990) who studied the stock of G. paradoxa inthe Cross River, Nigeria. The mortality values obtained in this study are in agreement with thefindings of Moses (1990), who studied the stock of G. paradoxa in the Cross River, Nigeria. Theestimated mortality coefficients of his study were: total mortality 0.82 year−1; fishing mortality0.50 year−1; and natural mortality 0.32 year−1. The exploitation level was 0.61 and Moses(1990) concluded that the stock was overfished and required immediate imposition of landingsize restriction (<60 mm) and the culture of young clams to prevent the collapse of the fishery.King (2000) obtained similar estimates for the stock of G. paradoxa in the Nun River, Nigeria.The estimated coefficients were 0.80, 0.50 and 0.30 year−1 for total mortality, fishing mortalityand natural mortality, respectively. The conclusion was that the stock was overfished owingto the high exploitation level of 0.62. Etim and Brey (1994) however, obtained higher mortalityvalues for the stock of G. paradoxa in the Cross River compared with Moses (1990). Theestimated total fishing and natural mortality coefficients were 2.03, 1.10 and 0.93 year−1,respectively. The exploitation level was 0.45 which is close to the optimum exploitation levelof 0.50. According to Gulland (1965), the yield is optimised when F = M; thus when E is equalto 0.5. The stock of G. paradoxa in the Volta River is overfished as the stocks in the Nigerianrivers and requires the imposition of minimum landing size restrictions in order to salvage thefishery.
> LENGTH-WEIGHT RELATIONSHIPS
Periodic length-weight data (Rueda and Urban, 1998) and linear regression analysis on log-transformed data for a standard animal has been used to study the reproductive cycle of
09p10

D. Adjei-Boateng and J.G. Wilson : Knowl. Managt. Aquatic Ecosyst. (2012) 405, 09
bivalves. An abrupt decrease in weight between successive months may indicate a spawningevent while an increase over a longer period could be interpreted as the developing phasebefore the spawning season. The shell-free dry weight cycle of a 40 mm standard G. para-doxa showed a trend of building gonad tissue prior to the start of spawning activity whichoccurs between July and October in the Volta estuary. The slight drop in tissue weight duringJune-July indicates the start of spawning in the clam with August–September being the peakof spawning in G. paradoxa. Growth in G. paradoxa is allometric as the exponent of the re-gression equation was <3 (β �= 3) for almost the entire study period. This is in agreement withthe vast majority of instances where β, in the length-weight relationships has been found tobe not equal to 3 (Gaspar et al., 2002).In conclusion, the growth rate and performance appears to be declining as a result of habi-tat modification owing to the negative effects of damming the river. The Volta River stock ofG. paradoxa is overfished and requires immediate action to conserve this important and valu-able fishery. This can be achieved by implementing a minimum landing size restriction andintensifying the culture of smaller clams.
ACKNOWLEDGEMENTS
The authors are grateful to Trinity College Dublin (TCD), Ireland; the Volta Basin Researchproject (VBRP), the University of Ghana; Kwame Nkrumah University of Science and Technol-ogy, Kumasi, Ghana and the International Foundation of Science (IFS) for providing materialand financial support (A/4421-1) to conduct the research.
REFERENCES
Abohweyere P.O. and Falaye E.A., 2008. Population parameters of Macrobrachium vollenhovenii in theLagos-Lekki lagoon system, Nigeria. Journal of Fisheries International, 3, 27–33.
Al-Barwani S.M., Arshad A., Nurul Amin S.M., Japar S.B., Siraj S.S. and Yap C.K., 2007. Populationdynamics of the green mussel Perna viridis from the high spat-fall coastal water of Malacca,Peninsular Malaysia. Fish. Res., 147–152.
Allen K.R., 1938. Some observations on the biology of the trout (Salmo trutta) in Windermere. J. Anim.Ecol. 7, 333–349.
Amador M.K., 1997. A review of the Volta Clam, Egeria radiata fishery in the Lower Volta, BSc thesis,Kwame Nkrumah University of Science and Technology, Ghana.
Attipoe F.Y.K. and Amoah C., 1989. Ecological and economic problems associated with the Volta Dam:the case of the Egeria and Macrobrachium fisheries of the lower Volta, Paper presented at theGhana National Seminar on Inland Fisheries and Aquaculture, 1989, 20 p.
Dickson B.K. and Benneh G., 1977. A new geography of Ghana. Longman Group Ltd., London, 173 p.
Etim L. and Brey T., 1994. Growth, productivity, and significance for fishery of the bivalve Egeria radiata(Donacidae) in the Cross River, Nigeria. Archive of Fishery and Marine Research, 42, 63–75.
Gaspar M.B., Pereira A.M., Vasconecelos P. and Monteiro C.C., 2004. Age and growth of Chameleagallina from the Algarve coast (Southern Portugal): influence of seawater temperature and game-togenic cycle on growth rate. J. Mollus. Stud., 70, 371–377.
Gaspar M.B., Santos M.N., Vasconcelos P. and Monteiro C.C., 2002. Shell morphometric relationshipsof the most common bivalve species (Mollusca: Bivalvia) of the Algarve coast (southern Portugal).Hydrobiologia, 477, 73–80.
Gulland J.A., 1965. Estimation of mortality rates, Annex to Arctic Fisheries Working Group Report ICESC.M./1965/D:3 (Mimeo), Reprinted as: Cushing P.H. (ed.), Key Papers on Fish Populations, IRLPress, Oxford, 231–241.
King R.P., 2000. Poulation structure, growth performance and mortality rates of the freshwater clamGalatea paradoxa (Born, 1778) in Nun River, Nigeria. Archive of Fishery and Marine Research, 48,21–30.
09p11
D. Adjei-Boateng and J.G. Wilson : Knowl. Managt. Aquatic Ecosyst. (2012) 405, 09
King R.P., Egwali E.C. and Nkanta N.A., 1992. Population dynamics of the freshwater clam Galateaparadoxa (Donacidae) in the cross River, Nigeria. Fishbyte, 9, 34–36.
Kwei E.A., 1965. The spawning and growth of the Volta oyster Egeria radiata (L.). Ghana Journal ofScience, 5, 150–160.
Le Cren E.D., 1951. The length-weight relationship and seasonal cycle in gonad weight and condition inthe perch (Perca fluviatilis). J. Anim. Ecol., 20, 201–219.
Mancera E. and Mendo J., 1996. Population dynamics of the oyster Crassostrea rhizophorae from theCienaga Grande de Santa Marta, Colombia. Fish. Res., 26, 139–148.
Martin W.R., 1949. The mechanics of environmental control of body form in fishes. University TorontoStudent Biology, 58 (Publ. Ont. Fish. Res. Lab. 70), 1–91.
Moses S.B., 1990. Growth, biomass, mortality, production and potential yield of the West Africanclam, Egeria radiata( Lamarck) (Lamellibranchia, Donacidae) in the Cross River system, Nigeria.Hydrobiolobia, 196, 1–15.
Moura P., Gaspar M.B. and Monteiro C.C., 2009. Age determination and growth rate of a Callista chionepopulation from the southwestern coast of Portugal. Aquat. Biol., 5, 97–106.
Munro J.L. and Pauly D., 1983. A simple method for comparing the growth of fishes and invertebrates.Fishbyte, 1, 5–6.
Nassar A.K.V., 1999. Length-weight relationships of tuna batifish from the Lakshadweep Island, India.Naga, ICLARM Quarterly, 22, 42–44.
Pauly D., 1979. Gill size and temperature as governing factors in fish growth: a generalization of vonBertalanffy’s growth formula. Ber. Inst. Meereskd Christian-Albrechts University, Kiel, 63, 1–156.
Pauly D., 1980. On the interrelationships between natural mortality, growth parameters and mean envi-ronmental temperature in 175 fish stocks. J. Cons. Int. Explor. Mer., 39, 175–192.
Pauly D., 1984. Fish population dynamics in tropical waters: a manual for use with programmable cal-culators. ICLARM Contrib., 143, 325.
Pauly D. and Caddy J.F., 1985. A modification of Bhattacharya’s method for the analysis of mixtures ofnormal distributions, FAO Fisheries Circular, FAO, Rome, 781, 16 p.
Petraitis P.S., 1991. Recruitment of the mussel Mytilus edulis L. on sheltered and exposed shores inMaine, USA. J. Exp. Mar. Biol. Ecol., 147, 65–80.
Purchon R.D., 1963. A note on the biology of Egeria radiata Lam. (Bivalvia, Donacidae). Proceedings ofthe Malacological Society of London, 35, 251–271.
Qasim S.Z., 1973. Some implications of the problem of age and growth in Marine fishes from Indianwaters. Indian J. Fish, 20, 351–371.
Rainer S.F. and Wadley V.A., 1991. Abundance, growth and production of the bivalve Solemya sp., afood source for juvenile rock lobsters in a seagrass community in Western Australia. J. Mar. Biol.Ecol., 152, 201–233.
Ricker W.E., 1975. Computation and interpretation of biological statistics of fish populations. Bull. Fish.Res. Board Can., 191, 382.
Roper D.S., Pridmore R.D. and Thrush S.F., 1992. Recruitment to the macrobenthos of Macomona liliana(Bivalvia: Tellinidae) in Manukau Harbour, New Zealand. N. Z. J. Mar. Freshwater Res., 26, 385–392.
Rueda M. and Urban H.-J., 1998. Population dynamics and fishery of the freshwater clam Polymesodasolida (Corbiculidae) in Cienaga Poza Verde, Salamanca Island, Colombian Carribbean. Fish. Res.,39, 75–86.
Strasser M., Hertlein A. and Reise K., 2001. Differential recruitment of bivalve species in the northernWadden Sea after the severe winter of 1995/96 and of subsequent milder winters. HelgolandMarine Research, 55, 182–189.
Tumanda Jr. M.I., Yap H.T., McManus L.T., Ingles J.A. and Lopez M.G., 1997. Growth, mortality andrecruitment of the brown mussel, Modiolus metcalfei (Bivalvia: Mytilacea), in panguil Bay, SouthernPhilippines. Aquaculture, 154, 233–245.
Urban H.-J., 1998. Description and management of the clam fishery (Gari solida, Psammobiidae) fromBahia Independencia, Peru (14 ◦S). Fish. Res., 35, 199–207.
Vakily J.M., 1992. Determination and comparison of growth in bivalves, with emphasis on the tropicsand Thailand, ICLARM Technical Report, 36, 125 p.
Weber W., 1976. The influence of hydrographic factors on the spawning time of tropical fish. In: TiewsK. (ed.), Fisheries Resources and their Management in Southeast Asia, 269–281.
09p12