Embed Size (px)
Citation preview

u.s. Department of Justice
Bureau of Justice Statistics
...
Population Density in State Prisons
By Christopher A. Innes, Ph.D. BJS Statistician
The 694 State prisons in operation on June 30, 1984, provided an average of 57 square feet of living space per inmate in general and special housing and confined inmates to their housing units for an average of 11 hours per day. Other findings from the 1984 Prison Census include:
• Nationally, 34% of inmates were housed in single-cell units; 24% were double-celled; and the remaining 42% were housed in units with three or more inmates.
• Housing units with two inmates had the highest density, with an average of 34 square feet per inmate. Inmates in single celis had an average of 68 square feet, or twice as much l'oom per inmate.
• About 1 in 5 inmates resided for 10 hours or more per day in a general housing unit that provided less than 60 square feet of floor space. Nearly 1 in 5 prisons had at least 40% of their inmates residing in these conditions. Almost three-fourths of State prisons, housing 59% of all inmates, had 10% or less of their inmates residing in such
~ conditions.
• Population densities were highest in prisons in Southern and Western States, in larger institUtions, in maximum security facilities, in male-only prisons, and in the oldest prisons.
• Between 1979 and 1984, the opening of 138 new State prisons and the reno-
This Special Report examines one of the most serious problems facing our corrections system today--the sufficiency of housing resources. Based on the 1984 Prison Census, which collected detailed information on over 180,000 housing units at 694 State prisons, it examines the amount, nature, and use of housing space in our N.ation's State prisons. Other important aspects of correctional resources addressed by the prison census, such as detailed information on staffing, educational and
vation or expansion of existing prisons added nearly 5.4 milUon square feet of housing space, an inel'ease of 29%. Inmate population, however, increased 45% over the same period. As a result, the average square feet per inmate dropped 11 %.
• The number of correctional officers grew faster than the inmate population between 1979 and 1984, resulting in a decrease in the number of inmates per officer from 4.6 to 4.1.
• The total percentage of inmates housed in less than 60 square feet changed little since 1978, but a higher proportion were living in multiple occupancy housing in 1984.
• There was little evidence that population density levels were directly associated with elevated death rates, inmate-on-inmate rates of assault, or
December 1986
work programs, and support services, await further research.
Special thanks are due to the nearly 700 wardens who expended substantial time and effort to complete the highly detailed prison census. Now available through the Criminal Justice Archive at the University of Michigan, the 1984 Prison Census provides our most comprehensive source of information on prison resources in the United States.
Steven R. Schlesinger Director
the frequency of institutional disturbances. Rather, such events tended to occur more frequently 'in maximum security facilities, regardless of their population densities.
Introduction
Between 1930 and 1984 the State prison population more tqan tripled, from 115,314 to 415,796. About twothirds of this increase, however, occurred between 1975 and 1984. This recent growth has placed substantial demands on correctional resources such as housing, staff, support facilities, and programs. This report examines the first of these, focusing particularly on the amount of hou!;ing space availabl~ per inmate, the us'e of multiple occupancy, and the amount of time inmates ~ confined to housing units.
Iscc Pl'isoncrs in 19S~, DJS 13ullclin, NCJ-971l8, April 1985. .-
If you have issues viewing or accessing this file, please contact us at NCJRS.gov.
The 1984 Prison Census
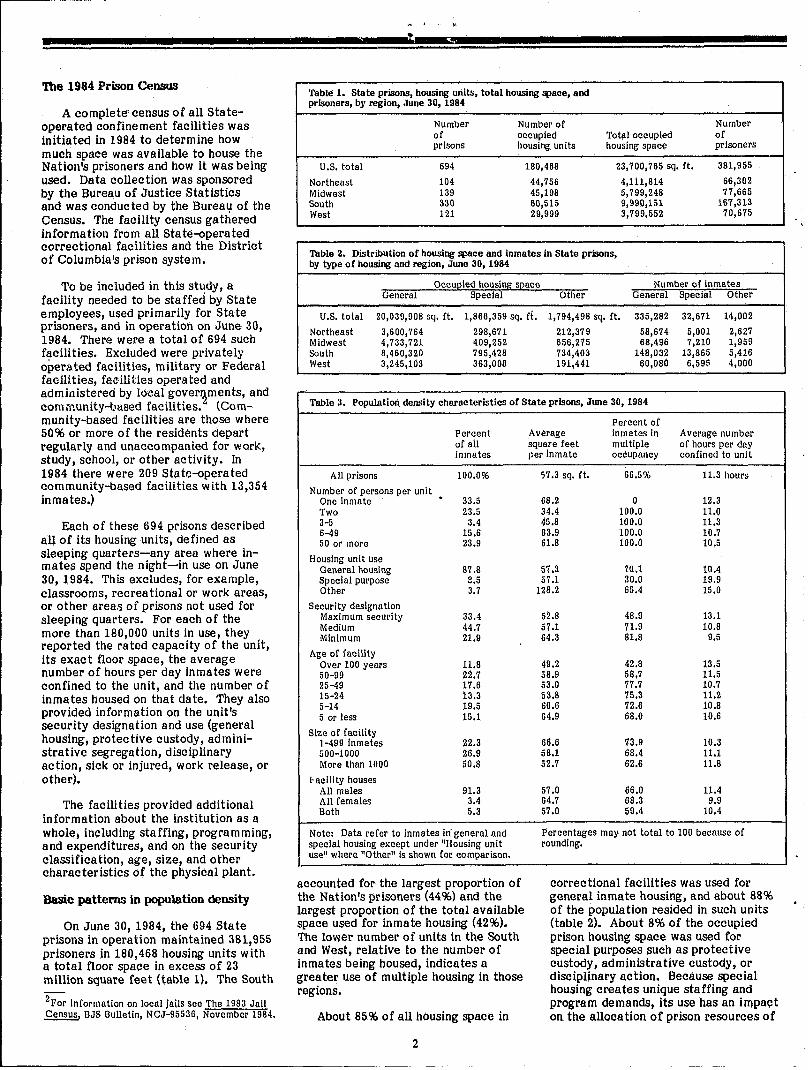
A complete" census of all Stateoperated confinement facilities was initiated in 1984 to determine how much space was available to house the Nation's prisoners and how it was being used. Data collection was sponsored by the Bureau of Justice Statistics and was conducted by the Bureal;l of the Census. The facility census gathered information from all State-operated correctional facilities and the District of Columbia's prison system.
To be included in this study, a facility needed to be staffed by State employees, used primarily for State prisoners, and in operation on June 30, 1984. There were a total of 694 such f.;tcilities. Excluded were privately operated facilities, military or Federal facilities, fSi!'ilities operated and administered by 10M I gover~ments, and community-based facilities. (Community-based facilities are those where 50% or more of the residents depart regularly and unaccompanied for work, study, school, or other activity. In 1984 there were 209 State-operated community-based facilities with 13,354 inmates.)
Each of these 694 prisons described all of its housing units, defined as sleeping quarters-any area where inmates spend the night-in use on June 30, 1984. This excludes, for example, classrooms, recreational or work areas, or other areas of prisons not used for sleeping quarters. For each of the more than 180,000 units in use, they reported the ra ted capacity of the unit, its exact floor space, the average number of hours per day inmates were confined to the unit, and the number of inmates housed on that date. They also provided information on the unit's security designation and use (general housing, protective custody, administrative segregation, disciplinary action, sick or injured, work release, or other).
The facilities provided additional information about the institution as a whole, including staffing, programming, and expenditures, and on the security classification, age, size, and other characteristics of the physical plant.
Basic patterns in population density
On June 30, 1984, the 694 State prisons in operation maintained 381,955 prisoners in 180,468 housing units with a total floor space in excess of 23 million square feet (table 1). The South
2Por information on local jails Sec The 1983 Jail Census, BJS Bulletin, NCJ-95530, Novembcr 1984.
Table 1. Sta te prisons, h ousing units, total housing space, and prisoners, by region, Jun e 30, 1984
Number Number of Number of occupied Total occupied of prisons housing units housing space prisoners
U.S. total 694 180,468 23,700,765 sq. ft. 381,955
Northeast 104 44,756 4,111,814 66,302 Midwest 139 45,198 5,799,248 77,665 South 330 60,515 9,990,151 167,313 West 121 29,999 3,799,552 70,675
Table 2. Distribution of housing space and inmates in State prisons, by type of housing and region, June 30, 1984
----------------------------------------------~ Occupied housing space Number of inmates General Special Other General Special Other
U.S. total 20,039,908 sq. ft. 1,866,359 sq. ft. 1,794,498 sq. ft. 335,282 32,671 14,002
Northeast 3,600,764 298,671 212,379 58,674 5,001 2,627 Midwest 4,733,721 409,252 656,275 68,496 7,210 1,959 South 8,460,320 795,428 734,403 148,032 13,865 5,416 West 3,245,103 363,008 191,441 60,080 6,595 4,000
Table 3. Population density characteristics of State prisons, JWle 30, 1984
Percent of Percent Average inmates in Average number of all square feet multiple of hours per day inmates per inmate occupancy confined to unit
AU prisons 100.0% 57.3 sq. ft. 66.5% 11.3 hours
Number of persons per II nit One inmate 33.5 68.2 0 12.3 Two 23.5 34.4 100.0 11.0 3-5 3.4 45.8 100.0 11.3 6-49 15.6 63.9 100.0 10.7 50 or more 23.9 61.8 100.0 10.5
Housing unit use 57.3 70.1 10.4 57.1 30.0 19.9
General housing 87.8 Special purpose 2.5 Other 3.1 128.2 65.4 15.0
Security designation Maximum secUl'ity 33.4 52.8 48.9 13.1 Medium 44.7 57.1 71.9 10.8 Minimum 21.9 64.3 81.8 9.5
Age of facility Over 100 years 11.8 49.2 42.8 13.5 50-99 22.7 58.9 58.7 11.5 25-49 17.6 53.0 77.7 10.7 15-24 13.3 53.8 75.3 11.2 5-14 19.5 60.6 72.6 10.8 5 or less 15.1 64.9 68.0 10,6
Size of facility 1-499 inmates 22.3 66.0 73.9 10.3 500-1000 26.9 58.1 68.4 11.1 More than 1000 50.8 52.7 62.6 11.8
l<acility houses AU males 91.3 57.0 66.0 11.4 All females 3.4 64.7 68.3 9.9 Both 5.3 57.0 59.4 10.4
Percentages may not total to 100 because of rounding.
Note: Data refer to inmates in general and special housing exccpt under "Housing unit use" where "Other" is shown for comparison.
--------------------------------------~ accounted for the largest proportion of the Nation's prisoners (44%) and the largest proportion of the total available space used for inmate housing (42%), The lower number of units in the South and West, relative to the number of inmates being housed, indicates a greater use of multiple housing in those regions.
About 85% of all housing space in
2
correctional facilities was used for general inmate housing, and about 88% of the population resided in such units (table 2). About 8% of the occupied prison housing space was used for special purposes such as protective custody, administrative custody, or disciplinary action. Because special housing creates unique staffing and program demands, its use has an impa~t on the allocation of prison resources of
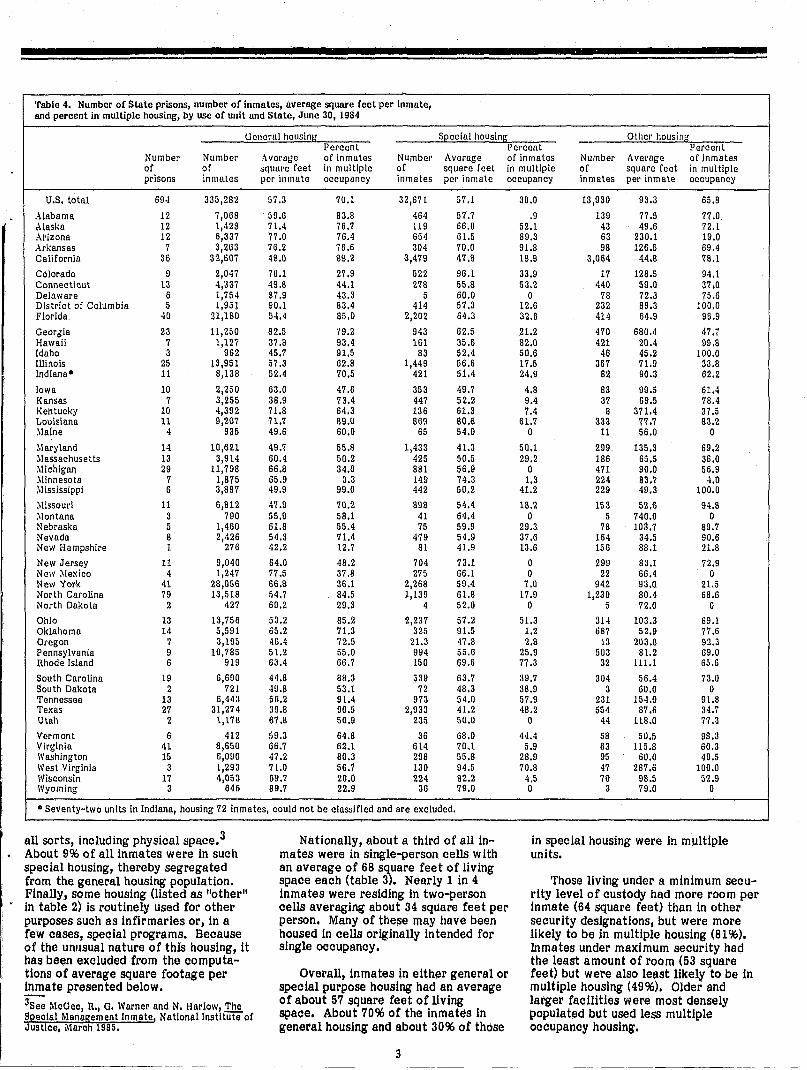
Table 4. Number of State prisons, number of inmates, average SCjllllre feet per inmate, and percent in multiple housing, by use of unit and State, Jlme 30, 1984
Ucncrul housing Sl2ccial hOUsing Other housing Percent Pcrcent Percent
Numbel' NumbCl' /lverulie of inmutes Numbel' Average of inmates Number Avel'age of Inmates of of squure feet in multiple of square feet in mUltiple of square feet in multiple prisons inmates per inl11ate occupancy inmates per inmate occupancy Inmates pel'inmate occupancy
U.S. total 694 335,282 57.3 70.1 32,671 57.1 30.0 13,930 93.3 65.8
Alabama 12 7,068 59.6 83.8 464 57.7 .9 139 77.5 77.0 Alaska 12 1,428 71.4 76.7 119 66.0 52.1 43 49.6 72.1 Arizona 12 6,337 77.0 76.4 654 61.5 89.3 63 230.1 19.0 Arkansas 7 3,263 76.2 76.6 304 70.0 91.8 98 126.5 69.4 California 36 32,607 48.0 89.2 3,479 47.8 19.9 3,064 44.8 78.1
Colorado 9 2,047 76.1 27.9 522 96.1 33.9 17 128.5 94.1 Connecticut 13 4,337 49.8 44.1 278 55.8 53.2 440 59.0 37,0 Delaware 6 1,754 87.9 43.3 5 60.0 0 78 72.3 75.6 District of Columbia 5 1,931 90.1 83.4 414 57.3 12.6 232 89.3 100.0 Florida 40 21,180 54.4 85.0 2,202 64.3 32.6 414 64.9 96.9
GeorGia 23 11,250 82.5 '/9.2 943 62.5 21.2 470 680.4 47.7 Hawaii 7 1,127 37.8 93.4 161 35.6 82.0 421 20.4 99.S Idaho 3 962 45.7 91.5 83 52.4 50.6 46 45.2 100.0 lllinois 25 13,951 57.3 62.8 1,449 56.6 17.5 367 71.9 33.8 indiana· 11 8,138 52.4 70.5 421 51.4 24.9 82 90.3 62.2
Iowa 10 2,250 63.0 47.6 353 49.7 4.8 83 99.5 61.4 Kansas 7 3,255 38.9 73.4 447 52.2 9.4 37 69.5 78.4 Kentucky 10 4,392 71.8 64.3 136 61.3 7.4 8 371.4 37.5 Louisiana 11 9,207 71.7 89.0 869 SO.6 61.7 333 77.7 S3.2 ~laine 4 935 49.6 60.0 65 54.0 0 11 56.0 0
),1 ary land 14 10,621 49.7 55.8 1,433 4.1.3 50.1 299 135.3 69.2 ~lassachusetts 13 3,914 60.4 50.2 425 50.5 29.2 186 65.5 36.0 ~lichigan 29 11,798 66.8 34.0 881 56.9 0 471 90.0 56.9 ~linnesota 7 1,875 65.9 3.3 149 74.3 1.3 224 83.7 4.0 ~I1ssissippi 6 3,887 49.9 99.0 442 50.2 41.2 229 49.3 100.0
~llssouri 11 6,812 47.9 70.2 898 54.4 18.2 153 52.6 94.8 ~lontana 3 790 55.9 58.1 41 64.4 0 5 740.0 0 Nebraska 5 1,460 61.8 55.4 75 59.9 29.3 78 103.7 89.7 Nevada 8 2,426 54.3 71.4 479 54.9 37.6 164 34.5 90.6 New Hampshire 1 276 42.2 12.7 81 41.9 13.6 156 88.1 21.8
New Jersey 11 9,040 64.0 48.2 704 73.1 0 299 83.1 72.9 New ~lexico 4 1,247 77.5 37.8 275 66.1 0 22 66.4 0 New York 41 28,056 66.8 36.1 2,268 59.4 7.0 94~ 93.0 21,5 North Carolina 79 13,518 54.7 84.5 1,139 61.8 17.9 1,230 80.4 68.6 North Dakota 2 427 69.2 29.3 4 52.0 0 5 72.0 0
Ohio 13 13,756 53.2 85.2 2,237 57.2 51.3 314 103.3 69.1 Oklahoma 14 5,591 65.2 71.3 325 91.5 1.2 li87 52.9 77.6 Oregon 7 3,195 46.4 72.5 21.3 47.8 2.S 13 203.8 92.3 Pennsylvania 9 10,785 51.2 55.0 994 55.6 25.9 503 81.2 69.0 Rhode Island 6 919 63.4 66.7 150 69.6 77.3 32 111.1 65.6
South Carolina 19 6,690 44.8 88.3 539 63.7 39.7 304 56.4 73.0 South Dakota 2 721 49.8 53.1 72 48.3 38.9 3 60.0 0 Tennessee 13 6,443 56.2 91.4 973 54.0 57.9 231 154.9 91.8 Texas 27 31,274 39.8 90.5 2,933 41.2 48.2 554 87.6 34.7 Utah 2 t,178 67.8 50.9 235 50.0 0 44 118.0 77.3
Vermont 6 412 59.3 64.S 36 68.0 44.4 58 50.5 9B.3 Virginia 41 8,650 66.7 62.1 614 70.1 5.9 63 115.8 60.3 Washington 15 6,090 47.2 80.3 298 55.8 28.9 95 60.0 49.5 West Virginia 3 1,293 71.0 56.7 130 94.5 70.8 47 287.6 100.0 Wisconsin 17 4,053 69.7 26.0 224 82.2 4.5 70 98.5 52.9 Wyoming 3 646 89.7 22.9 36 79.0 0 3 79.0 0
.. Seventy-two units in Indiana, housing 72 inmates, could not be classified and are excluded.
all sorts, including physical space.3 About 9% of all inmates were in such special housing, thereby segregated from the general housing population. Finally, some housing (listed as \lother\l
• in table 2) is routinely used for other purposes such as infirmaries or, in a few cases, special programs. Because of the unusual nature of this housing, it has been excluded from the computations of average square footage per inmate presented below.
3See McGee, R., G. Warner and N. Harlow,.!l!£. Special Management Inmate. National Institute of Justice, Mareh 1985.
Nationally, about a third of all inmates were in single-person cells with an average of 68 square feet of living space each (table 3). Nearly 1 in 4 inmates were residing in two-person cells averaging about 34 square feet per person. Many of these may have been housed in cells originally intended for single occupancy.
Overall, inmates in either general or special purpose housing had an average of about 57 square feet of living space. About 7096 of the Inmates in general housing and about 3096 of those
3
in special housing were in multiple units.
Those living under a minimum security level of custody had more room per inmate (64 square feet) than in other security designations, but were more likely to be in multiple housing (81%). Inmates under maximum security had the least amount of room (53 square feet) but were also least likely to be in multiple housing (4996). Older and larger facilities were most densely populated but used less multiple occupancy housing.

There were also substantial differences among the States. In five States-Hawaii, Idaho, Mississippi, Tennessee, and Texlls-90% or more of the inmates in general housing shared their confinement quarters with other inmates (table 4). Average square footage per inmate ranged from 37.8 to 51.2. By contrast, in six StatesColorado, Minnesota, New Hampshirr:, North Dakota, Wisconsin, and Wyoming-30% or less of the general housing inmates were residing in multiple occupancy units. Among these States, average square footage ranged from 42.2 to 89.7. •
Twelve Sta tes reported tha tat least 50% of the inmates in special housing were being held in multiple occupancy quarters. This may reflect problems in the alloca tion of available space in those States, since segregated quarters by definition are normally singleoccupant housing.
Nationwide, inmates housed in less than 40 square feet made up 28% of the regularly housed population (table 5). Less than a fifth of all immates in regular housing had 80 square feet or more per person.
The actual square footage of floor space per inmate varied considerably by (·egion. In the South and West about half the inmates lived in units providing less than 50 square feet of floor space' . ' nearly a third had less than 40 square feet of floor space. The Northeast had the lowest percentage of inmates in less than 40 square feet.
As noted above, cells housing two inmates provided the least amount of space per person, with 3 out of 4 inmates in double cells receiving less than 40 square feet of floor space. By comparison, only 2% of those housed in single cells had less than 40 square feet of floor space.
Trends in population density, 1919-84
Since 1979, the opening of 138 new State prisons and the renovation or ex-
T able 5. Cumulative distribution of inmates in State prisons, June 30, 1984
Total Pel'cent of inmates in housing units with: number of Less than Less than Less than Less than inmates· 40 sq. ft. 50 sq. ft. 60 sq. ft SO sq. ft.
U.S. total 367,953 27.8% 44.5% 62.0% 83.8%
Northeast 63,675 16.8% 30.4% 51.3% 78.9% Midwest 75,706 25.4 41.2 58.7 87.3 S outh 161,897 31.6 49.6 65.1 83.9 Vest \ 66,675 32.2 50.8 68.4 84.0
Uni t size One inmate 123,215 2.0% 18.1% 44.4% 79.2% -Two 86,564 76.0 92.4 94.9 98.3 3 -5 12,530 51.2 65.6 76.5 87.8 6 -49 57,580 18.5 37.4 59.6 76.5 5 0+ 88,064 19.5 37.1 53.5 80.1
Uni t use General housing 335,282 28.8% 45.0% 61.8% 83.6% S pecial 32,671 17.9 42.2 64.4 86.0 Other 14,002 27.0 42.1 52.0 71.4
*R efers to inmates in general and special housing except und er "Unit use" whp.re "Other" is shown for comparison.
pansion of existing prisons added nearly 5.4 million square feet of housing space (table 6). The total increase in space, 29%, was exceeded, however, by a 45% growth in the number of inmates. For all housing types (including infirmaries and other residential space), prisons in 1979 provided an average of 69.5 square feet of floor space per inmate. In 1984, average space per inmate in State prisons was 7.6 square feet less (61.9 square feet).
Per-inmate reductions in space since 1979 were greatest in Southern States, from 74.9 to 59.7 square feet. In 1984, however, Western States averaged the lowest per capita space (53.8 square feet). Only in the Midwest did capacity expansion exceed the increase in prisoner population.
A similar 1978 survey of prisons found that 65% of the Nation's inmates were foused in less than 60 square feet. The June 30, 1984, prison census indicates that 62% of inmates at that time were similarly housed (table 7). The proportion of prisoners in multiple occupancy units, however, increased from 59% to 67%, and the proportion in
4See Amel'iclln Prisons nnd Jails, Vol. Ill: Conditions and Costs of Confincment, National Institute of Justicc, October 1980.
multiple occupancy units with less than 60 square feet per inmate rose from 43% to 47%.
Combining average space and confinement time
A fuller picture of population density in State prisons emerges when the space available per inmate is combined with the amount of time each day an inmate is confined to his living unit. Standards established by the American Correctional Association call for 60 square feet per single cell provided that inmates spend no more than 10 hours per day there and at least 80 square feet '1fen more than 10 hours are spent there. Advisory guidelines issued by the U.S. Department of Justice in 1980 proposed a standard of at least 60 square feet for no more than 10 hours per day or at least ~o square feet for more than 10 hours.
Other factors contributing to the totality of conditions within facilities must be considered to evaluate fully issues of prison population density, but
S;;;;nual of Standards for Adult Correctional InstitUtions, American Correctional Association, August 1977.
6 Federal Standards for Corrections, Department of Justice, 1980.
Table 6. Comparison oC housing space and number oC inmates in State prisons, June 30, 1979, and June 30, 1984
U. S. total
Northeast Midwest South'" West
Number of erisons
1979 1984
568
85 101 292
90
694
104 139 330 121
Note: All data refer to general, special, and other housing. * The South showed an Increase of more than
Total square feet of occupied housi ng seace Number of mmates
1979 1984 1.979 1984
18,329,37 6 23,700,765 263,553 381,955
2,680,296 4,111,814 40,700 66,302 3,865,478 5,799,248 59,399 77,665 9,118,294 9,990,151 121,708 167,313 2,665,308 3,799,552 41,746 70,695
2 million square feet In new facilities 'Jullt since 1979. However, there was a recluction of space at facilities existing in 1979 due to
4
Average sq. ft. eer inmate 1979 1984
69.5
65.9 65.1 74.9 63.8
61.9
61.1 74.7 59.7 53.8
Percent change, 1979-84, in: Square feet Number of occupied of housing space inma tes
29.0
51.1 50.0 9.6
42.6
44.9
62.9 30.8 37.5 69.3
closings of facilities, conversions of prisons to other uses, and conversion of some prison housing space to other prison purposes.
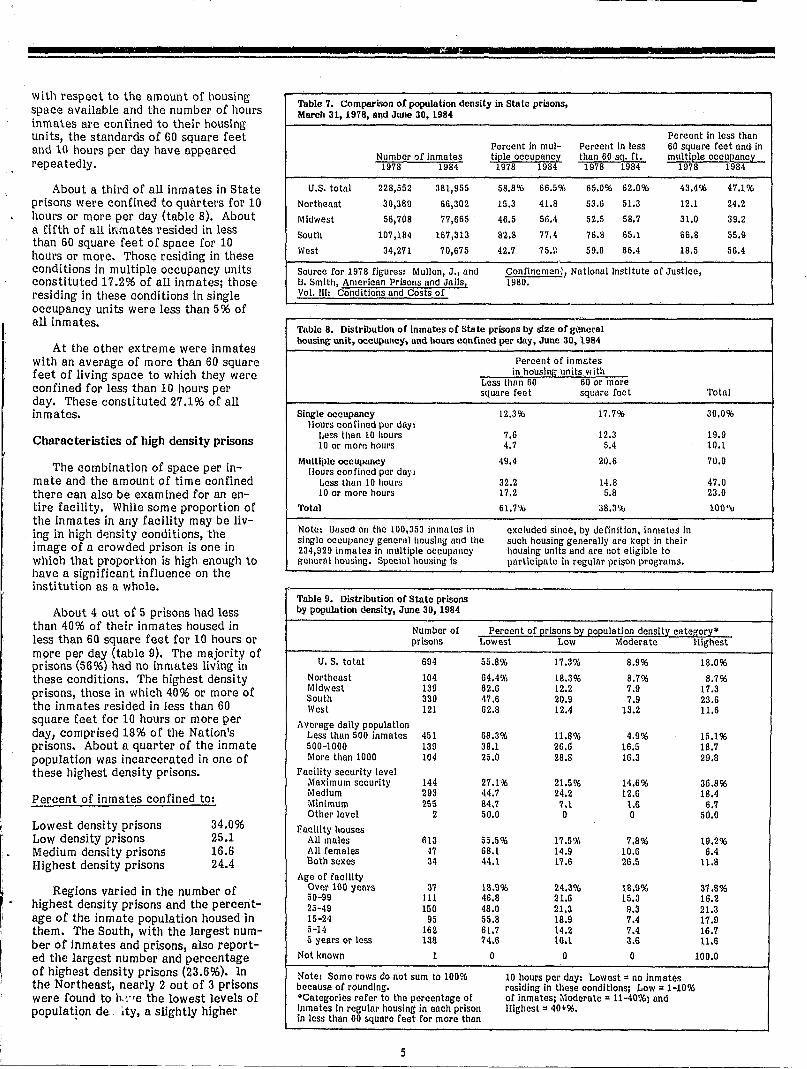
with respect to the amount of housing space available and the number of hours inmates are confined to their housing units, the standards of 60 square feet and 10 hours per day have appeared repeatedly.
About a third of all inmates in State prisons were confined to quartet·s for 10 hours or more per day (table 8). About a fifth of all ir<mo.tes resided in less than 60 square feet of space for 10 hours or mOl'e. Those residing in these conditions in multiple occupancy units constituted 17.2% of all inmates; those I'esiding in these conditions in single occupancy units were less than 5% of all inmates.
At the other extreme were inmates with an average of more than 60 square feet of living space to which they were confined for less than 10 houl's per day. These constituted 27.1 % of all inmates.
Characteristics of high density prisons
The combination of space per inmate and the amount of time confined there can also be examined for an entire facility. While some proportion of the inmates in any facility may be living in high dp.nsity conditions, the image of a crowded prison is one in which that proportion is high enough to have a significant influence on the institution as a whole.
About 4 out of 5 prisons had less than 40% of their inmates housed in less than 60 square feet for 10 hours or more per day (table 9). The majority of prisons (56%) had no inmates living in these conditions. The highest density prisons, those in which 40% or more of the inmates resided in less than 60 square feet for 10 hours or more per day, comprised 18% of the Nation's prisons. About a quarter of the inmate population was incarcerated in one of these highest density prisons.
Percent of inmates confined to:
Lowest density prisons LoW density prisons Medium density prisons Highest density prisons
34.096 25.1 16.6 24.4
Regions varied in the number of highest density prisons and the percentage of the inmate population housed in them. The South, with the largest number of inmates and prisons, also reported the largest number and percentage of highest density prisons (23.6%). In the Northeast, nearly 2 out of 3 prisons were found to h.,"'e the lowest levels of populat!on de .ty, a slightly higher
Table 7. Comparison of population density in state prisons, March 31, 1978, lind June 30, 1984
Percent In less than Percent in mul- Percent in less 60 square feet and In
Number of inmates tiele occueanc:i than 60 s9. ft. multiele occueanc:i 1978 1984 1978 1984 1978 1984 1978 1984
U.S. total 228,552 381,955 58.8% 66.5% 65.0% 62.0% 43.4% 47.1%
Northeast 30,389 66,302 15.3 41.S 53.6 51.3 12.1 24.2
Midwest 56,70S 77,665 46.5 511.4 52.5 5S.7 31.0 39.2
South 107,184 167,313 82.8 77,4 76.8 65.1 66.S 55.9
West 34,271 70,675 42.7 75.\\ 59.0 66.4 18.5 56.4
Source for 1978 figures: Mullen, J' j and Confinemen,\, National Institute of Justice, B. Smith, American Prisons and Jails: 1980.
1 Vol. III: Conditions and Costs of
Table 8. Distribution oC Inmates oC state prisons by size of g\~neral housing unit, occupancy, and hours confined per day, June 3D, 1984
Percent of inm6\tes in housi!:!!l: units with
l,ess than 60 60 or more square feet square feet Total
Single occupancy 12.3% 17.7% 30.0% Hours confined per dllYI
Lees than 10 hours 7.6 12.3 19.9 10 or more hours 4.7 5.4 to.t
Multiple occupuncy 49.4 20.6 70.0 1I0urs confincd per day:
Less than 10 hours 32.2 14.8 47.0 10 or more hours 17.2 5.8 23.0
Total 61.7% 38.3% lOOt\)
Note: Based on the 100,353 ill mates in cxcluded since, by definition, inmates in singlc occupancy general housing and the such housing generally are kept in their 234,929 inmates in mUltiple occupnncy hOUsing units and are not eligible to genorlll housing. Speoiul hou~ing is porticipa to in regUlar prison programs.
Table 9. Distribution of State prisons by population density, June 30, 1984
Number of Percent of ~rlsons b:i 202ulation density categor:i$ prisons Lowest Low Moderate Highest
U. S. total 694 55.8% 17.3% 8.9% IS.0%
Northeast 104 64.4% 18.3% S.7% 8.7% Midwest 139 62.6 12.2 7.9 17.3 South 330 47.6 20.9 7.9 23.6 West 121 62.S 12.4 13.2 11.6
Average dally population Less thun 500 inmates 451 68.3% 11.8% 4.9% 15.1% 500~1000 139 38.1 26.6 16.5 18.7 More than 1000 104 25.0 28.8 16.3 29.S
Facility security level Maximum security 144 27.1% 21.5% 14.6% 36.8% Medium 293 44.7 24.2 12.6 18.4 Minimum 255 84.7 7.1 1.6 6.7 Other level 2 50.0 0 0 50.0
Facillty houslls All males 613 55.5% 17.596 7.S96 19.296 All females 47 68.1 14.9 10.6 6.4 Both sllxes 34 44.1 17.6 26.5 n.s
Age of facility Ovot 100 years 37 18.9% 24.396 18.996 31.S% 50-99 111 46.8 21.6 15.3 16.2 25-49 150 48.0 21.3 9.3 21.3 15-24 95 55.8 IS.9 7.4 11.9 5-1~ 162 61.7 14.2 7.4 16.7 5 years or lcss 136 74.6 10.1 3.6 11.6
Not known 1 0 0 0 100.0
Note: Some rows do not sum to 10096 10 hours per day: Lowest = no inmates because of rounding. residing in these conditions; Low = 1-10% ·Categories refer to thc percentage of of inmates; Moderate = 11-4096; and inmates in regular hOUsing in each prison in less than 60 square feet Cor more than
Highest = 40+%.
5
proportion than prisons in the Midwest and the West.
Large prisons, those with an averag'e daily population of more than 1,000 prisoners, made up 15% of the Nation!s prison facilities but housed more than half its inmates. These institutions were more likely to be facilities wit.h the highest population density. Among large prisons, 3 out of 10 were in the highest density categories compared to about 1 in 7 of the smaller prisons (less than 500 inmates). FUrther, large prisons tended to be significantly older, with an average age of 52 years, compared to 25 years for smaller prisons. This kind of housing was most common in the Northeast and Midwest, where over half of the inmates were housed in facilities more than 60 years old.
Population density also varied by the custody level of the facility, the sex of inmates housed, and the age of the facility. Nearly 37% of the maximum security prisons in the Nation were classified as having the highest population density compared to about 6% of minimum security institutions. The percentage of male-only prisons with the highest density housing was also much greater than the percentage of female-only prisons. Three out of four prisons built between 1980 and 1984 reported the lowest density conditions. By contrast, the oldest prisons (built more than a century ago) were most likely to be institutions with the highest density.
Effects of population density
A number of previous studies have examined the relationship between increased population density or occupancy in prison and observed changes in the physical or emotional conditions of inmates. While some studies conclude that the effects are generally negative, others conclude that such effects do not vary consistently "rith increased population densities.
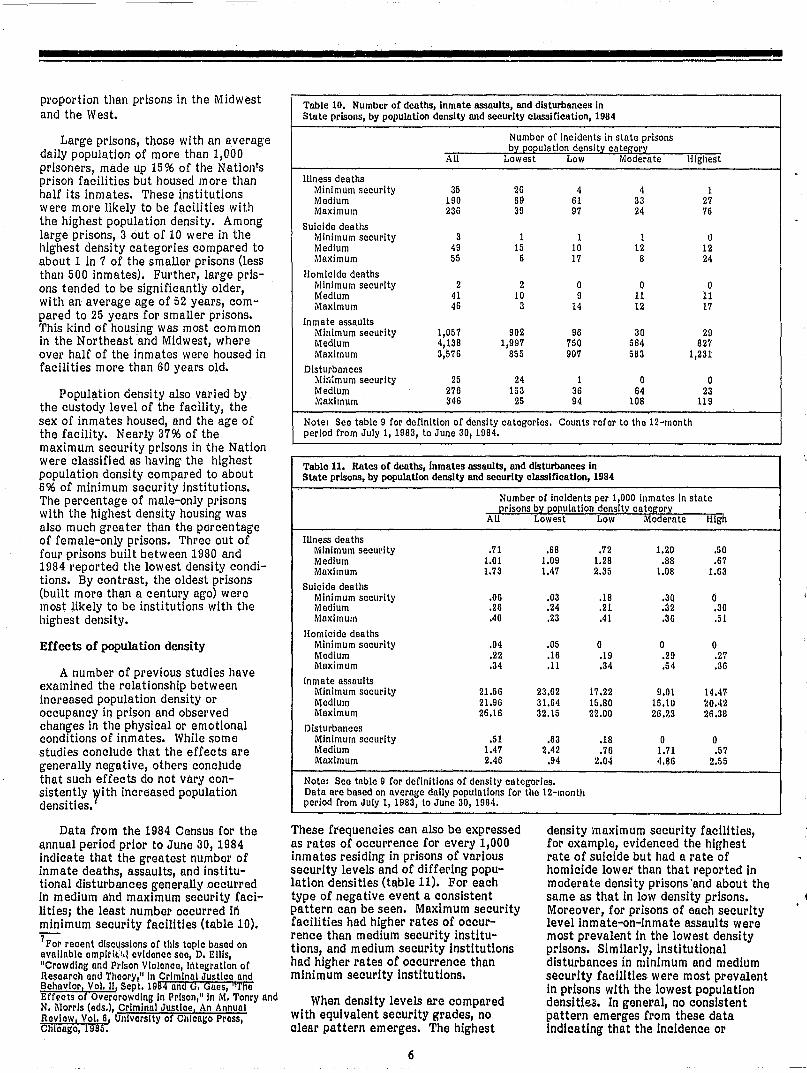
Data from the 1984 Census for the annual period prior to June 30, 1984 indicate that the greatest number of inmate deaths, assaults, and institutional disturbances generally occurred in medium and maximum security facilities; the least number occurred iri minimum security facilities (table 10).
7 For recent discUssions oC this topic based on available cmplr\l\<i.1 evidence sao, D. Ellis, "Crowding and Prison Violence, Integration oC Research and Theory," In Criminal Justlae and Behavior, Vol. II, Sept. 1984 and O. Gaes, liThe Eff(1cts of Overcrowding In Prison," In M. Tonry and N. Morris (eds.), Criminal Justice, An Annual Review, Vol. 6, University of Chicago Press, Chlaago, 1985.
Table 10. Number oC deaths, inmate assaults, and disturbances in State prisons, by population density and security classification, 1984
Number of incidents in state prisons b:i 202ulation densit:i categol':i
All Lowest Low Moderate Highest
Illness deaths Minimum security 35 26 4 4 1 Medium 190 69 61 33 27 ~laximum 236 39 97 24 76
Suicide deaths Minimum security 3 1 1 1 0 Medium 49 15 10 12 12 ~laxlmum 55 6 17 8 24
Homicide deaths Minimum security 2 2 0 0 0 Medium 41 10 9 11 11 Maximum 46 3 14 12 17
Inmate assaults Minimum security 1,057 902 96 30 29 Medium 4,138 1,997 750 564 827 Maximum 3,576 855 907 583 1,231
Disturbances ~I1r;:mum security 25 24 1 0 0 Medium 276 153 36 64 23 Maximum 346 25 94 108 119
Note: See table 9 for definition oC density categories, Counts reCer to the 12-month period Crom July I, 1983, to June 30, 1984.
Table 11. Rates oC deaths, inmates assaults, and disturbances in State prisons, by population density and security classification, 1984
Number oC Incidents per 1,000 inmates in state 2risons b:i 12012ulatlon density categor:z:
High All Lowest Low Moderate
Illness deaths Minimum security .71 .68 .72 1.20 .50 Medium 1.01 1.09 1.28 .88 .67 Maximum 1.73 1.47 2.35 1.08 1.63
Suicide deaths Minimum security .06 .03 .18 .30 0 Medium .26 .24 .21 .32 .30 Maximum .40 .23 .41 .36 .51
Homicide deaths Minimum security ,04 .05 0 0 0 Medium .22 .16 .19 .29 .27 Maximum .34 .11 .34 .54 .36
Inmate assaults Minimum security 21.56 23.62 17.22 9.01 14.47 MediUm 21.96 31.64 15.80 15.10 iO.42 Maximum 26.16 32.15 22.00 26.7.3 26.38
Disturbances Minimum security .51 .63 .18 0 0 Medium 1.47 2.42 .76 1.71 .57 Maximum 2.46 .94 2.04 01.86 2.55
Note: See table 9 Cor definitions oC density categories. Data are based on avernge dally popUlations Cor the 12-month period Crom July 1, 1983, to June 30, 1984.
These frequencies can also be expressed as rates of occurrence for every 1,000 inmates residing in prisons of various security levels and of differing population densi ties (table 11). For each type of negative event a consistent pattern can be seen. Maximum security facilities had higher rates of occurrence than medium security institutions, and medium security institutions had higher rates of occurrence than minimum security institutions.
When density levels are compared with equivalent security grades, no clear pattern emerges. The highest
6
density maximum security facilities, for example, evidenced the highest rate of suicide but had a rate of homicide lower than that reported in moderate density prisons 'and about the same as that in low density prisons. Moreover, for prisons of each security level inmate-on-inmate assaults were most prevalent in the lowest density prisons. Similarly, institutional disturbances in minimum and medium security facilities were most prevalent in prisons with the lowest population densitiea. In general, no consistent pattern emerges from these data indicating that the incidence or
•
prevalence of these negative events increases with greater population densities.
The kinds of inmates housed in facilities of different security grades, then, may be a more important factor than population density for understanding variation in the rates at which inmate deaths, assaults, and disturbances occur. In addition, it remains to be determined whether rates for certain events, such as illness, deaths, or suicides, are more likely to occur in prison than they occur outside prison for comparable race, age, and sex groups.
Finally, there is some evidence that correctional systems may respond to pressures of population growth by increasing the level of supervision over inmates. The 527 prisons that were included in both the 1979 and 1984 Censuses experienced a 34% increase in their inmate populations and a 29% expansion in their housing space, but a 43% increase in their number of correctional officers. These prisons reported more suicides in 1984 than in 1979 but fewer homicides. Total staff increases nationally in state prisons between 1979 and 1984 were identical to the increase in the number of inmates (45%); however, since most of the personnel increase over the period was among correctional officers, the number of inmates per oJficer actually dropped from 4.6 to 4.1. 'l'hus, though inmates in State prisons may have had less space available per person in 1984 than in 1979, the improvement in staffing may have helped to control the prevalence of some negative events.
Methodology
This report is based on information supplied by each of the State prisons in operation on June 3D, 1984. Each prison reported the size, occupancy,
i and use of each type of housing unit. For example, a facility might report having 30 cells, each 65 square feet, housing 24 inmates. In this case, six of the cells are assumed to be empty and each inmate therefore has 65 square
, feet. If the facility reported that 36 inmates were housed in the units, the
• occupancy of the cells was distributed ; on the assumption of minimum densi
ty. Thus 22 of the cells were assumed to have one inmate each with 65 square
.. feet and 8 of the cells were assumed to
. have two inmates ("doubled bunked")
8[n 1979 there wel'e a total of 93,570 full-time stoff working in correctional institutions, of which 57,799 were classified as correctional officers. On June 30, 1984, Stllte prison employees numbered 135,471, of which 92,153 were correcUonal oC!icers.
!'>U.S. 0,1'.0. 1987- 181-478,40023
with each inmate having 32.5 square feet.
Data for the District of Columbia differ from prisoner counts published in Prisoners in 1984, which reported 4,834 inmates at yearend, because this report only deals with the 2,597 inmates under the District of Columbials jurisdiction and housed in on~ of its prison facilities at midyear 1984. This report, therefore, does not reflect changes in the way the District of Columbia is housing both jail and prison inmates since June 30, 1984.
Death rates and assault rates were computed using reports of incidents from July I, 1983, to June 3D, 1984. Disturbances included incidents described by prison officials as riots, food fasts, or strikes (by inmates). No prison reported more than five suicides or more than six homicides in the 12-month period. The rates reported are based upon the average daily popula tion during the same time period. Although the actual population at risk will be higher because of movement in and out of an institution, the average daily population, as reported by the prison, was the best available estimate.
913JS Bulletin, NCJ-97118, Apl'1I1985.
Bureau of Justice Statistics Special Reports are prepared principally by BJS staff under the direction of Josepll M. Bessette, deputy director for data analysis. The report was written by Christopher A. Innes with the guidance and assistance of Lawrence A. Greenfeld, corrections unit chief. It was edited by Frank D. Balog. Marianne Zawitz provided assistance in data presentation. Marilyn Mal'brook, publications unit chief, administered report production, assisted by Millie J. Baldea and Jeanne !-lards. Data collection and processing wel'e conducted by Richard Meyer, Regina Yates, and Pauline Fain of the U.S. BU1'eau of the Census.
December 1986, NCJ-I03204
New releases from BJS
7
• Data quality policies and procedures: Proceedings of a BJS/SEARCH conference, 82 pp., NCJ-101849, 12/86 • ill2 directory of automated criminal justice information systems, NCJ-102260, 1,000 pp., 12/86 • Capital punishment, 1985 (BJS bUlletin), NCJ-I02742, 11/86 • Tracking offenders: White-collar crime (BJS special report), NCJ-102867, 11/86 .
ll.S. UtpllrlmtAI or Ju~lI(,t Bureau or Jut;lI~c Slnttt;tl~'
Crime and Justice Facts, 1985
Crime The volume 01 crime 1 Crime trends 2 Victims of crime 4 The location of crime 6 The economic cost of crime 7 The relatronshlp between vlotlm
and offender 8 Crime profiles 9
Rape 9 Household burglary 10 Bank robbery 11 Automated teller machine
loss or theft 12
The crlmlnnljustlce response Reporting crime 13 Criminal Justice processing 14 Indigent detense 16 Pretrial release 17 Appeals 18 The cost of criminal Justice 19
SentenCing and corroctions SentenCing practices 20 Sentencing outcomes 22 Time seNed In prison 24 Correctional populations 25 Prison crowding 26 Capital punishment 27 RecidiVism 28 Prisoners, drugs, and alcohol 29
Sources 30
Crime and JUstice Facts, 1985 summarizes much of what BJS has learned about crime and justice in the United States since December 31, 1985. It is intended to bridge the gap between the first and second editions of the Report to the Nation on Crime and Justice, a comprehensive statistical portrait of crime and justice in the United States, first published in October 1983.
Crime and Justice Facts, 1985 may be ordered (NCJ-I00757) from the Justice Statistics Clearinghouse, NCJRS, P.O. Box: 6000, Rockville, MD 20850, toll-free 800-732-3277 (local number 301-251-5500). Postage and handling are charged for bulk orders.
.J

To be added to any BJS mailing list, copy or cut out this page, fill it in and mail it to:
National Criminal Justice Reference Service User Services Dept. 2 Box 6000 Rockville, MD 20850
o If the name and address on the mailing label attached are correct, check here and don't fill them in again. If your address does not show your organizational affiliation (or criminal justice interest) please add it below. If your name and address are different from the label, please fill them in:
Name: Title:
Organization: Street or box:
City, State, Zip: Telephone:
Interest in criminal justice:
Please add me to the following list(s):
o Justice expenditure and employment reports Annual spending and staffing by Federal, State, and local governments and by function (police, courts, corrections, etc.)
o Computer crime reports
o
o
o
Electronic fund transfer system crimes
Privacy and security of criminal history information and information policy New legislation; maintaining and releasing intelligence and investigative recOl'ds
Federal statistics Data describing Federal case processing, from investigation through prosecution, adjudica tion, and corrections
BJS Bulletins and Special Reports Timely reports of the most current justice data
o
o
o
o
o
Courts reports State court caseload surveys, model annual State reports, State court organization surveys
Corrections reports Results of sample surveys and censuses of jails, prisons, parole, probation, and other data
National Crime Survey reports The only regular national survey of crime victims
Sourcebook of Criminal Justice Statistics Annual data from 153 sources in an easy-touse, comprehensive format (400+ tables, sources, index)
Send me a registration form for NIJ Reports (issued 6 times a year), which abstracts both private and government documents published in criminal justice.
You will be asked each year if you wish to stay on the mailing list. If you do not reply, we are required by law to remove your name.
U.S. Department of Justice Bureau of Justice Statistics
Washing/on, D, C. 20531
§pecial Report
Official Business Penalty for Private Use $300 BULK RATE
POSTAGE & FEES PAID DOJlBJS
Pemltl No. (1·-91
, .,