Embed Size (px)
Citation preview
Population Population
Chapter 2 Chapter 2
Humans are not evenly distributed Humans are not evenly distributed across the Earth. across the Earth.
To Understand Population To Understand Population distribution distribution – ConcentrationConcentration– DensityDensity
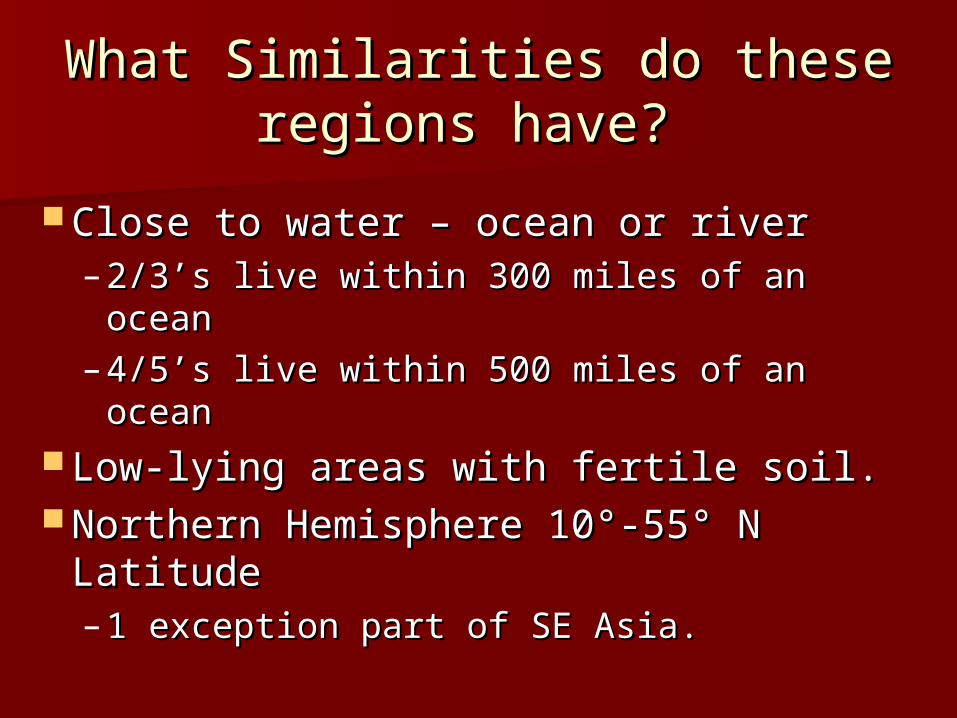
What Similarities do theseWhat Similarities do theseregions have? regions have?
Close to water – ocean or river Close to water – ocean or river – 2/3’s live within 300 miles of an ocean2/3’s live within 300 miles of an ocean– 4/5’s live within 500 miles of an ocean4/5’s live within 500 miles of an ocean
Low-lying areas with fertile soil. Low-lying areas with fertile soil. Northern Hemisphere 10Northern Hemisphere 10°°-55-55° N ° N
Latitude Latitude – 1 exception part of SE Asia.1 exception part of SE Asia.
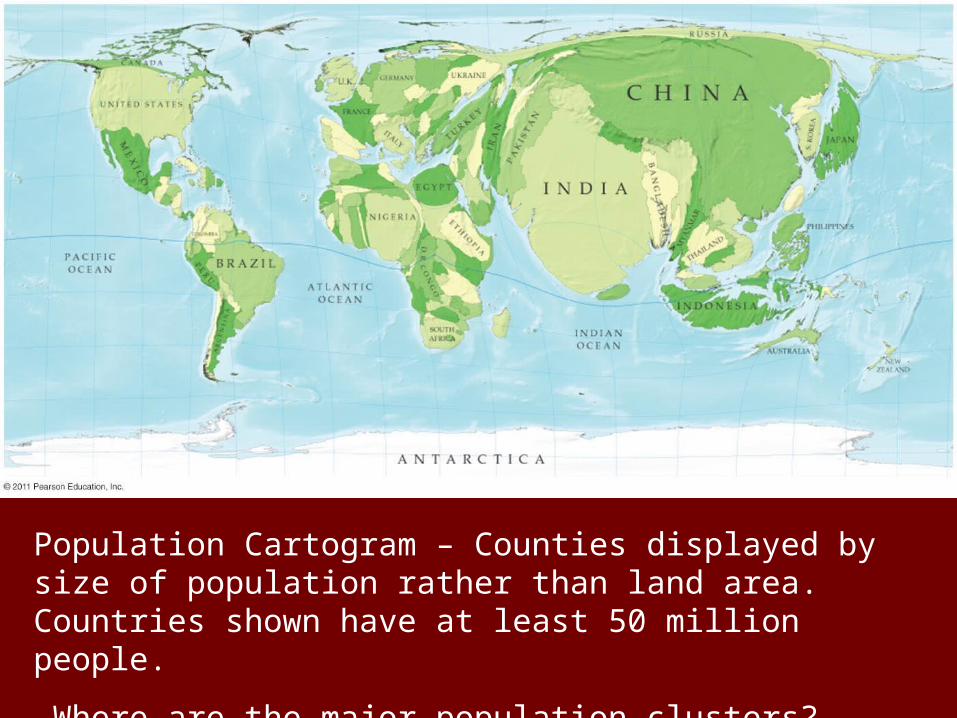
Population Cartogram – Counties displayed by size of population rather than land area. Countries shown have at least 50 million people.
Where are the major population clusters?
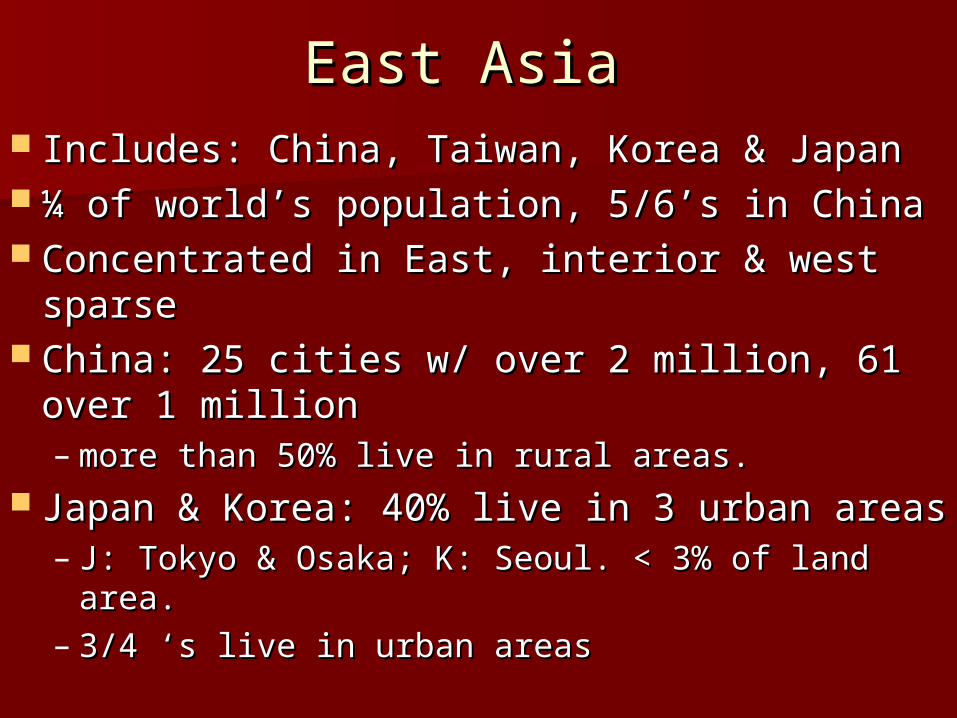
East Asia East Asia Includes: China, Taiwan, Korea & JapanIncludes: China, Taiwan, Korea & Japan ¼ of world’s population, 5/6’s in China¼ of world’s population, 5/6’s in China Concentrated in East, interior & west sparseConcentrated in East, interior & west sparse China: 25 cities w/ over 2 million, 61 over 1 China: 25 cities w/ over 2 million, 61 over 1
million million – more than 50% live in rural areas. more than 50% live in rural areas.
Japan & Korea: 40% live in 3 urban areasJapan & Korea: 40% live in 3 urban areas– J: Tokyo & Osaka; K: Seoul. < 3% of land area.J: Tokyo & Osaka; K: Seoul. < 3% of land area.– 3/4 ‘s live in urban areas 3/4 ‘s live in urban areas
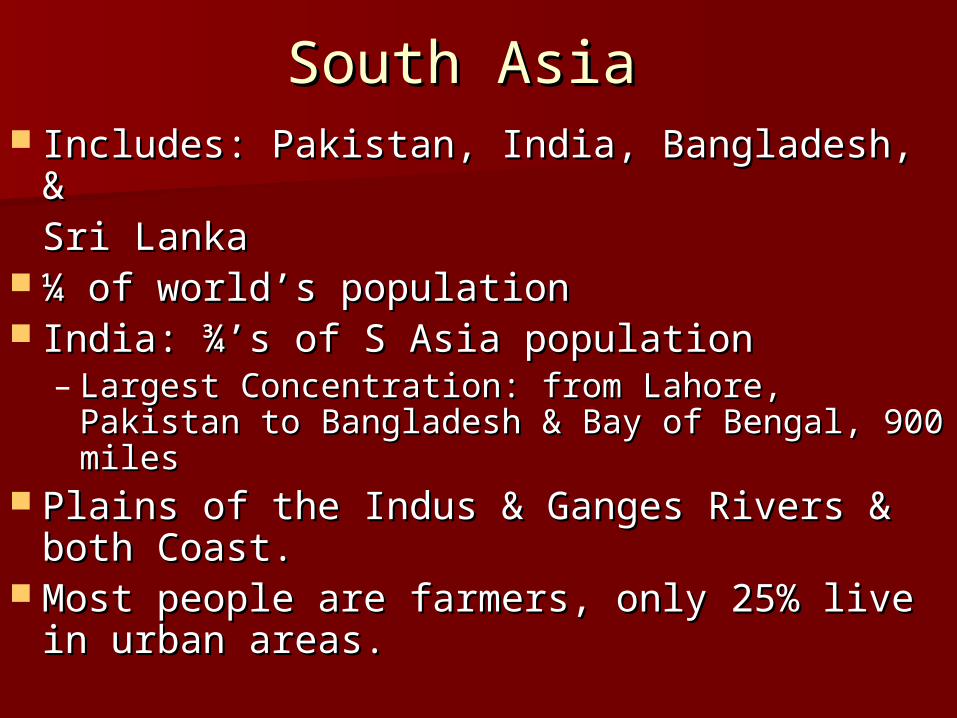
South Asia South Asia Includes: Pakistan, India, Bangladesh, & Includes: Pakistan, India, Bangladesh, &
Sri Lanka Sri Lanka ¼ of world’s population ¼ of world’s population India: ¾’s of S Asia population India: ¾’s of S Asia population
– Largest Concentration: from Lahore, Pakistan Largest Concentration: from Lahore, Pakistan to Bangladesh & Bay of Bengal, 900 milesto Bangladesh & Bay of Bengal, 900 miles
Plains of the Indus & Ganges Rivers & Plains of the Indus & Ganges Rivers & both Coast.both Coast.
Most people are farmers, only 25% live in Most people are farmers, only 25% live in urban areas.urban areas.
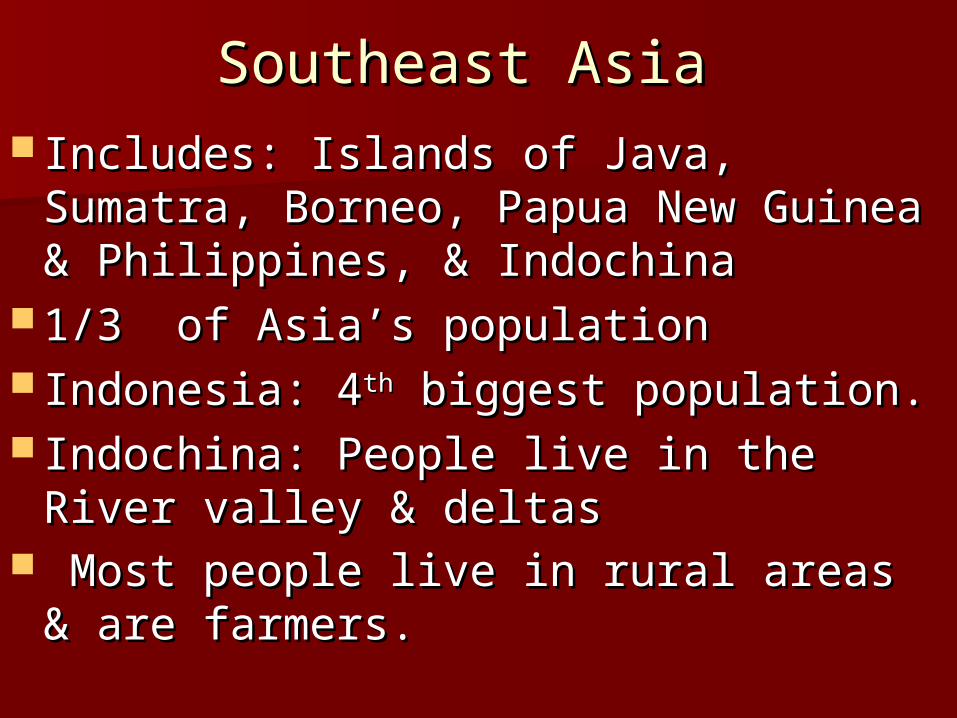
Southeast Asia Southeast Asia Includes: Islands of Java, Sumatra, Includes: Islands of Java, Sumatra,
Borneo, Papua New Guinea & Borneo, Papua New Guinea & Philippines, & IndochinaPhilippines, & Indochina
1/3 of Asia’s population 1/3 of Asia’s population Indonesia: 4Indonesia: 4thth biggest population. biggest population. Indochina: People live in the River Indochina: People live in the River
valley & deltasvalley & deltas Most people live in rural areas & are Most people live in rural areas & are
farmers.farmers.
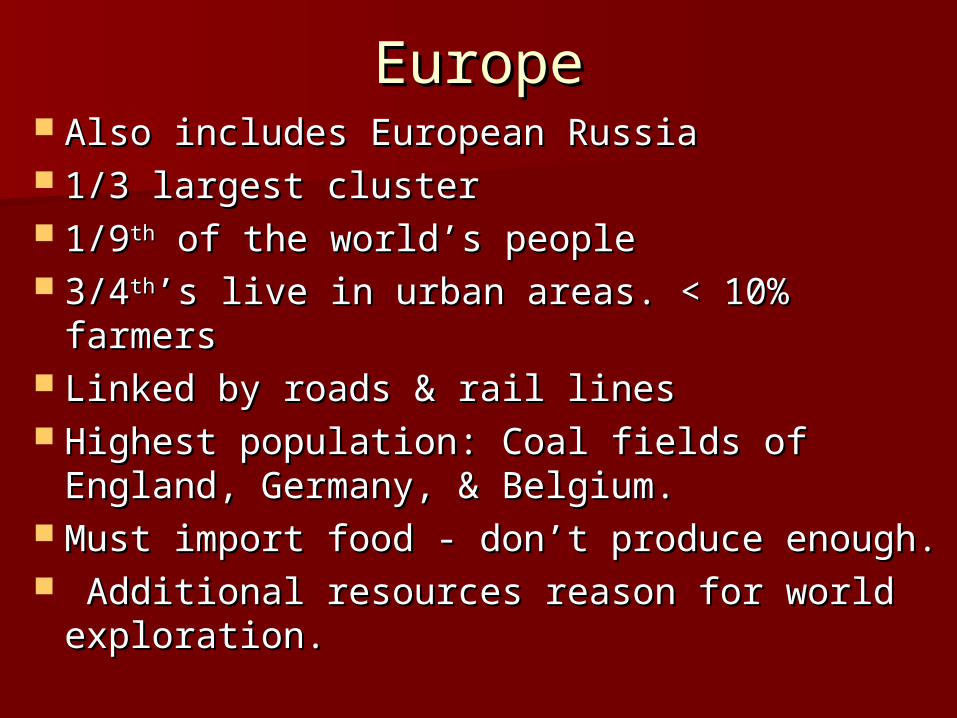
EuropeEurope Also includes European Russia Also includes European Russia 1/3 largest cluster 1/3 largest cluster 1/91/9thth of the world’s people of the world’s people 3/43/4thth’s live in urban areas. < 10% farmers ’s live in urban areas. < 10% farmers Linked by roads & rail linesLinked by roads & rail lines Highest population: Coal fields of Highest population: Coal fields of
England, Germany, & Belgium. England, Germany, & Belgium. Must import food - don’t produce enough.Must import food - don’t produce enough. Additional resources reason for world Additional resources reason for world
exploration. exploration.
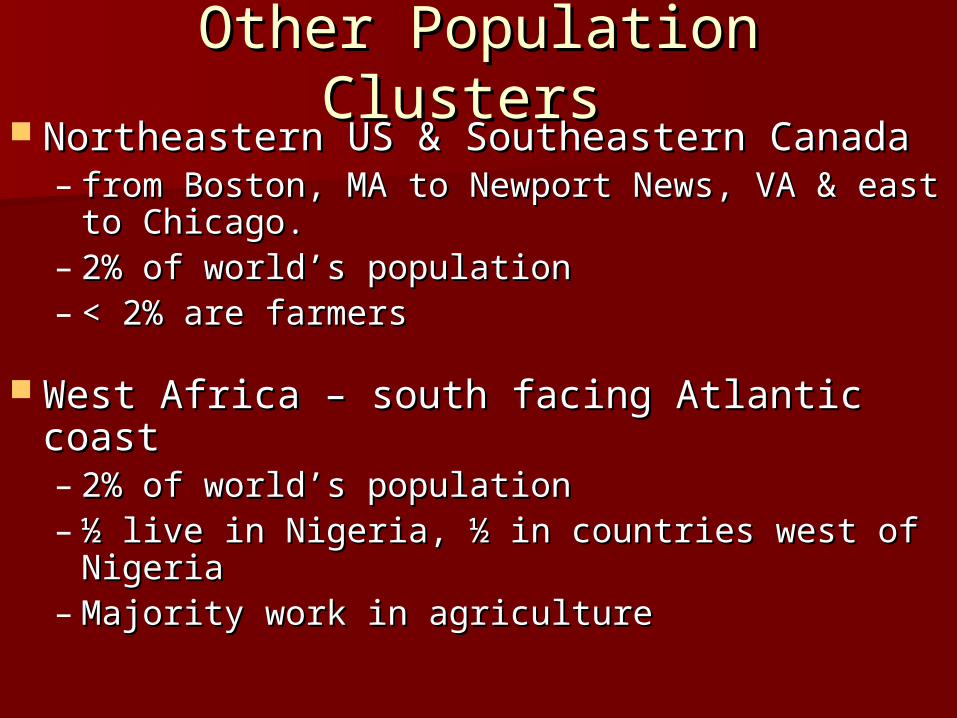
Other Population Clusters Other Population Clusters Northeastern US & Southeastern CanadaNortheastern US & Southeastern Canada
– from Boston, MA to Newport News, VA & east from Boston, MA to Newport News, VA & east to Chicago.to Chicago.
– 2% of world’s population 2% of world’s population – < 2% are farmers < 2% are farmers
West Africa – south facing Atlantic coastWest Africa – south facing Atlantic coast– 2% of world’s population 2% of world’s population – ½ live in Nigeria, ½ in countries west of ½ live in Nigeria, ½ in countries west of
Nigeria Nigeria – Majority work in agriculture Majority work in agriculture
Sparsely Populated RegionsSparsely Populated Regions
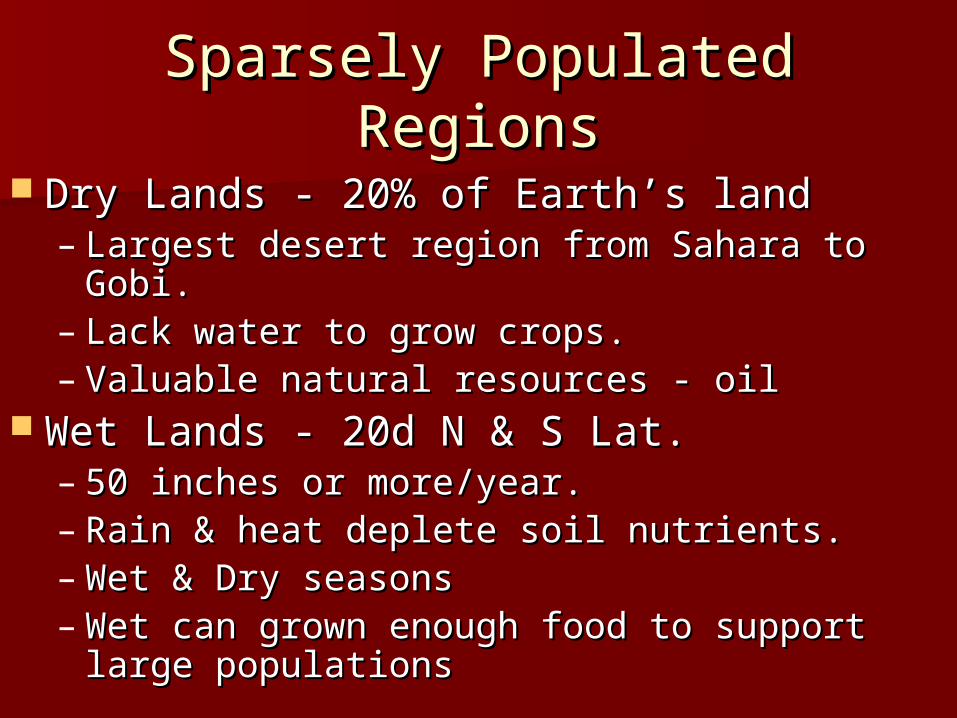
Dry Lands - 20% of Earth’s landDry Lands - 20% of Earth’s land– Largest desert region from Sahara to Gobi.Largest desert region from Sahara to Gobi.– Lack water to grow crops. Lack water to grow crops. – Valuable natural resources - oilValuable natural resources - oil
Wet Lands - 20d N & S Lat. Wet Lands - 20d N & S Lat. – 50 inches or more/year. 50 inches or more/year. – Rain & heat deplete soil nutrients. Rain & heat deplete soil nutrients. – Wet & Dry seasons Wet & Dry seasons – Wet can grown enough food to support large Wet can grown enough food to support large
populationspopulations
Sparsely Populated Regions Sparsely Populated Regions cont.cont.
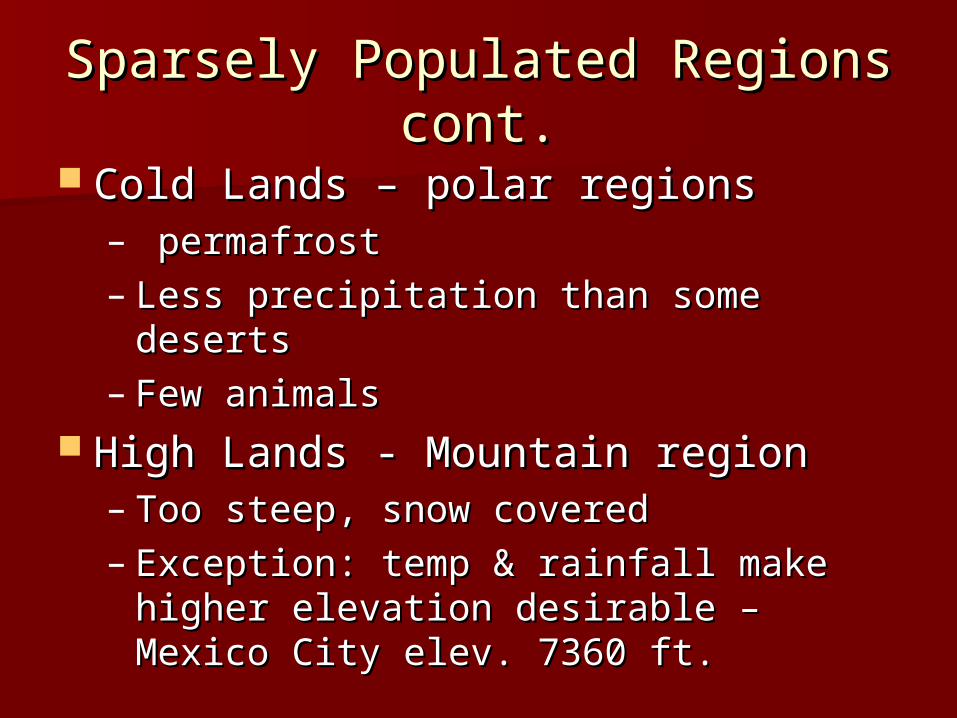
Cold Lands – polar regionsCold Lands – polar regions– permafrost permafrost – Less precipitation than some desertsLess precipitation than some deserts– Few animals Few animals
High Lands - Mountain region High Lands - Mountain region – Too steep, snow coveredToo steep, snow covered– Exception: temp & rainfall make higher Exception: temp & rainfall make higher
elevation desirable – Mexico City elev. elevation desirable – Mexico City elev. 7360 ft. 7360 ft.
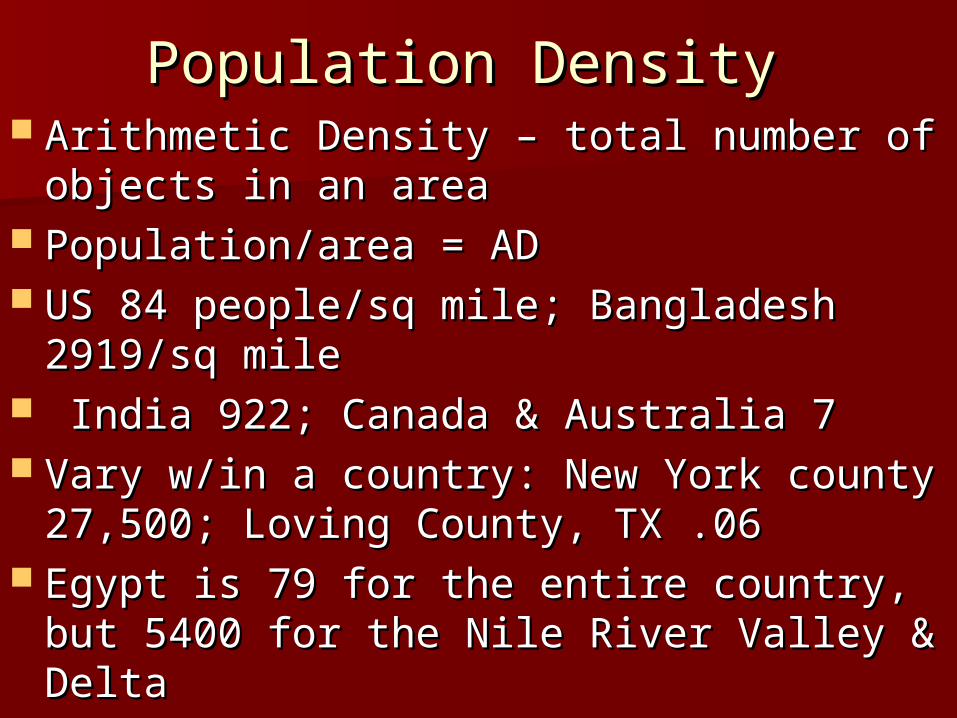
Population Density Population Density Arithmetic Density – total number of Arithmetic Density – total number of
objects in an areaobjects in an area Population/area = ADPopulation/area = AD US 84 people/sq mile; Bangladesh US 84 people/sq mile; Bangladesh
2919/sq mile2919/sq mile India 922; Canada & Australia 7India 922; Canada & Australia 7 Vary w/in a country: New York county Vary w/in a country: New York county
27,500; Loving County, TX .0627,500; Loving County, TX .06 Egypt is 79 for the entire country, but Egypt is 79 for the entire country, but
5400 for the Nile River Valley & Delta5400 for the Nile River Valley & Delta
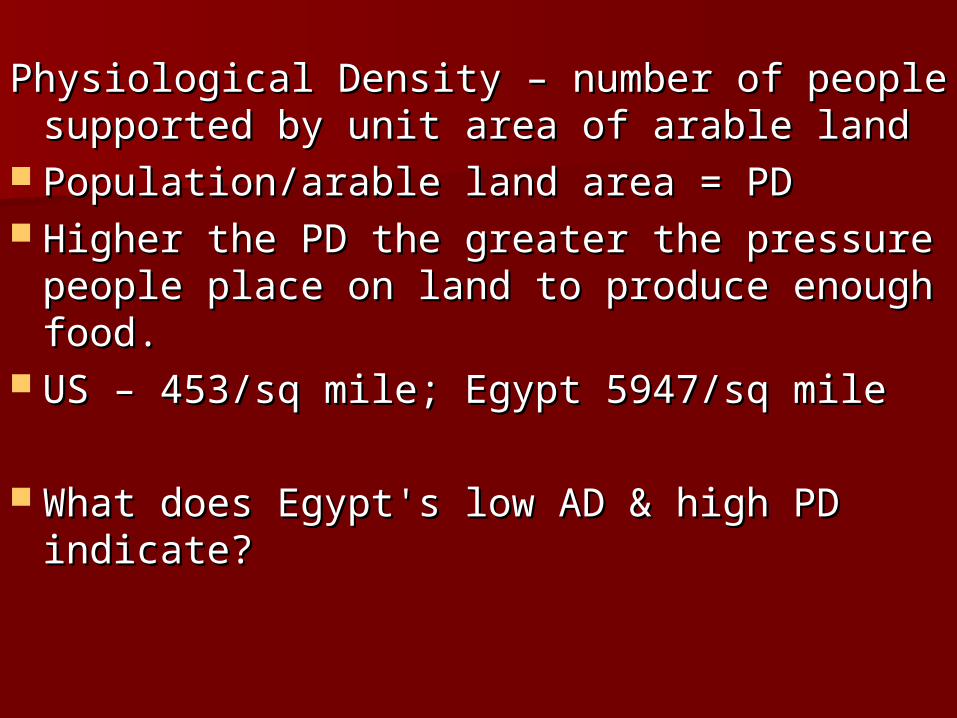
Physiological Density – number of people Physiological Density – number of people supported by unit area of arable land supported by unit area of arable land
Population/arable land area = PDPopulation/arable land area = PD Higher the PD the greater the pressure Higher the PD the greater the pressure
people place on land to produce enough people place on land to produce enough food. food.
US – 453/sq mile; Egypt 5947/sq mileUS – 453/sq mile; Egypt 5947/sq mile
What does Egypt's low AD & high PD What does Egypt's low AD & high PD indicate? indicate?
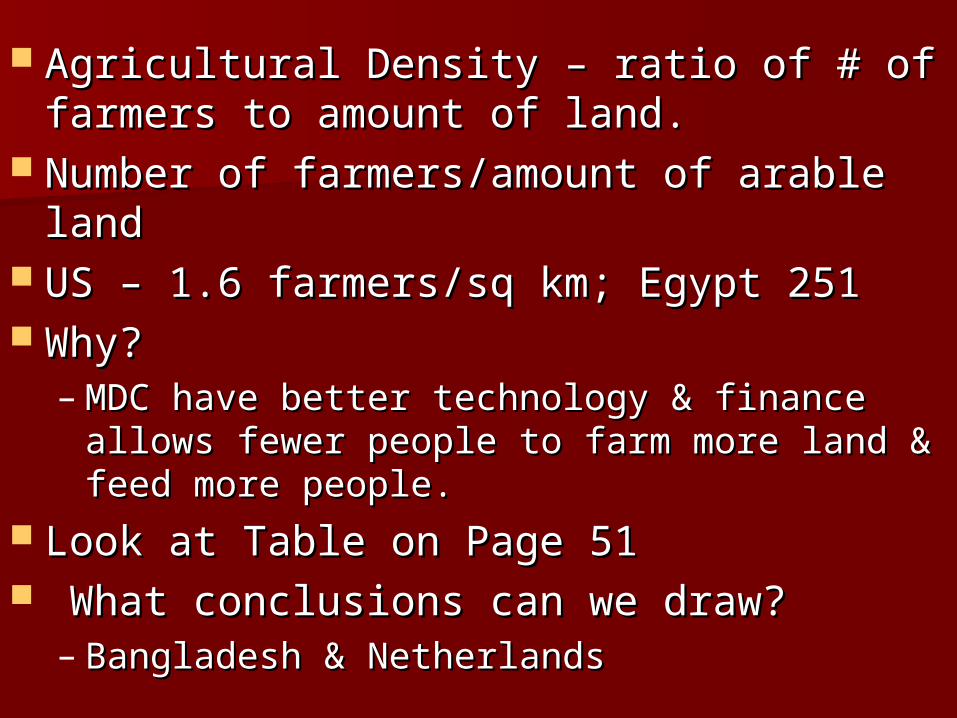
Agricultural Density – ratio of # of Agricultural Density – ratio of # of farmers to amount of land.farmers to amount of land.
Number of farmers/amount of arable landNumber of farmers/amount of arable land US – 1.6 farmers/sq km; Egypt 251US – 1.6 farmers/sq km; Egypt 251 Why?Why?
– MDC have better technology & finance allows MDC have better technology & finance allows fewer people to farm more land & feed more fewer people to farm more land & feed more people.people.
Look at Table on Page 51Look at Table on Page 51 What conclusions can we draw?What conclusions can we draw?
– Bangladesh & Netherlands Bangladesh & Netherlands
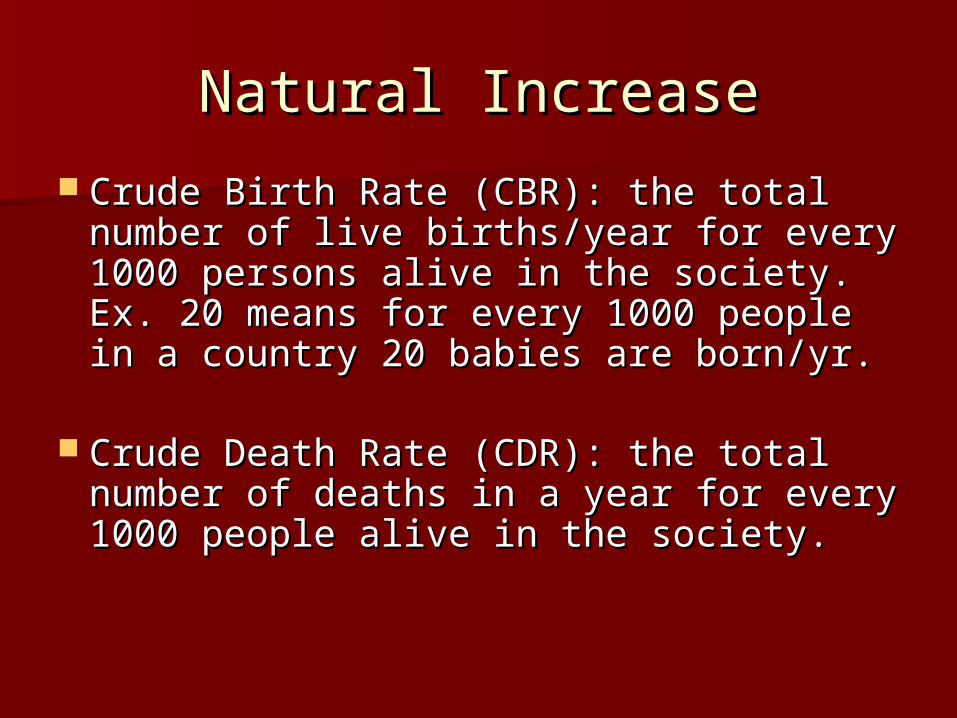
Natural IncreaseNatural Increase
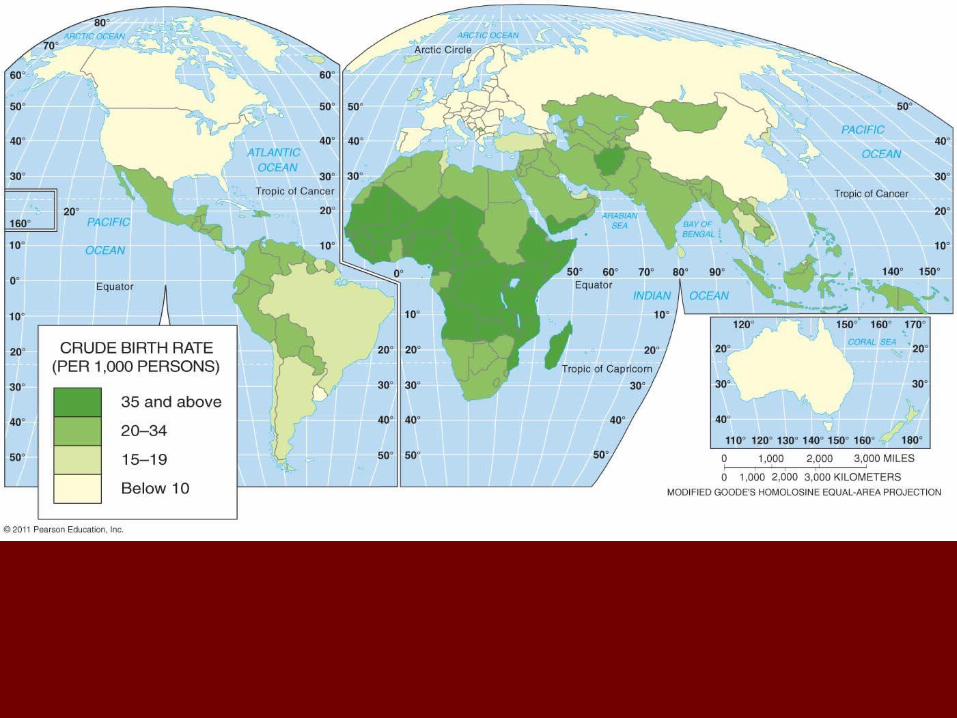
Crude Birth Rate (CBR): the total Crude Birth Rate (CBR): the total number of live births/year for every number of live births/year for every 1000 persons alive in the society. Ex. 1000 persons alive in the society. Ex. 20 means for every 1000 people in a 20 means for every 1000 people in a country 20 babies are born/yr.country 20 babies are born/yr.
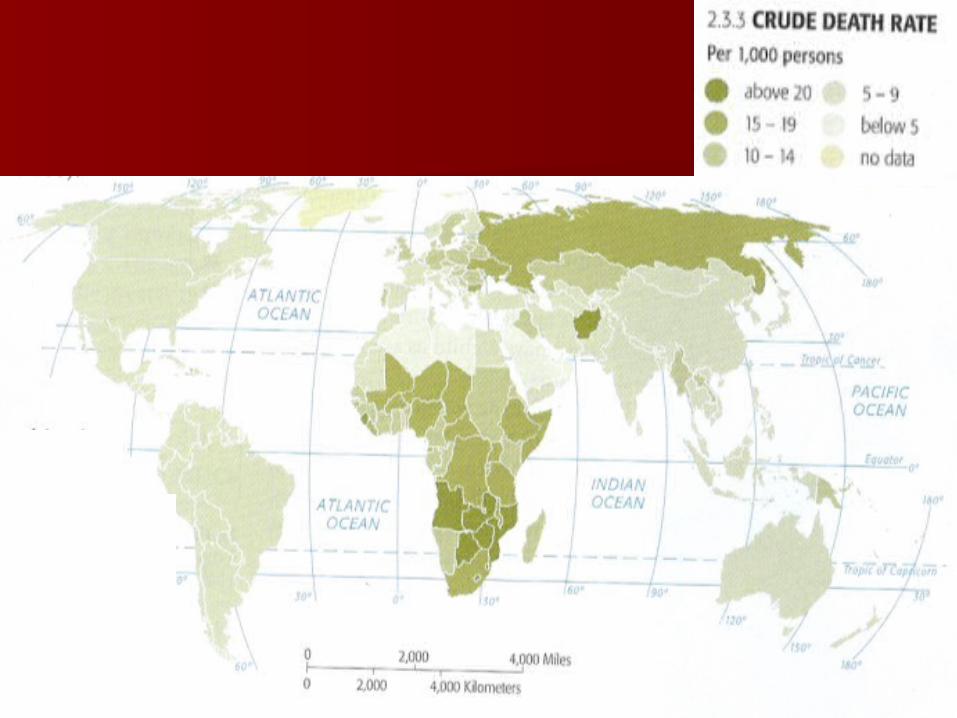
Crude Death Rate (CDR): the total Crude Death Rate (CDR): the total number of deaths in a year for every number of deaths in a year for every 1000 people alive in the society. 1000 people alive in the society.
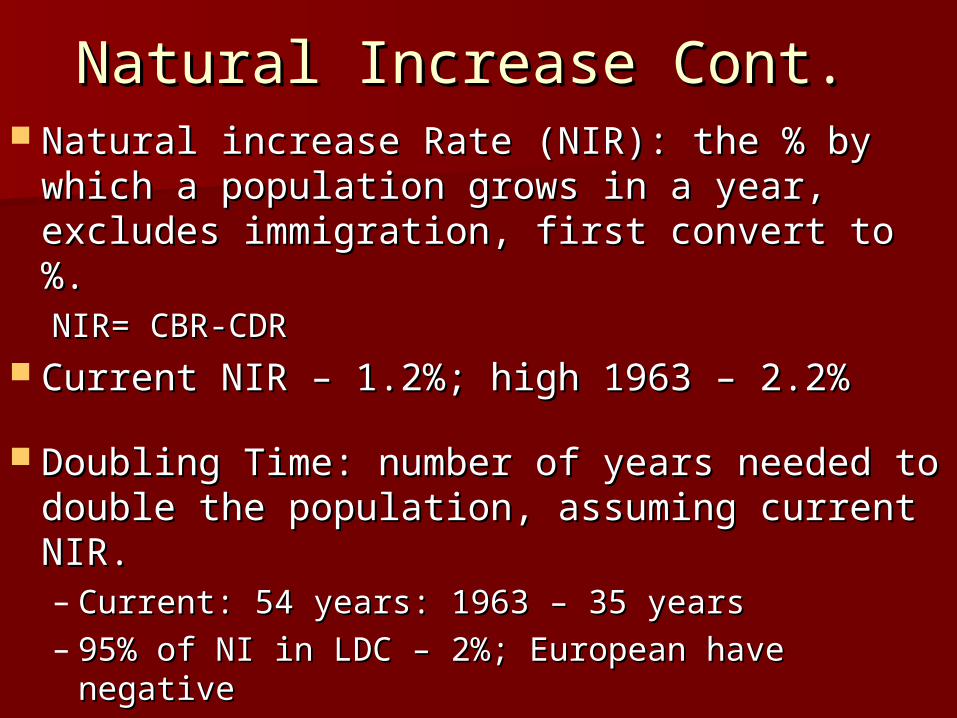
Natural Increase Cont. Natural Increase Cont. Natural increase Rate (NIR): the % by Natural increase Rate (NIR): the % by
which a population grows in a year, which a population grows in a year, excludes immigration, first convert to %. excludes immigration, first convert to %. NIR= CBR-CDR NIR= CBR-CDR
Current NIR – 1.2%; high 1963 – 2.2%Current NIR – 1.2%; high 1963 – 2.2%
Doubling Time: number of years needed Doubling Time: number of years needed to double the population, assuming to double the population, assuming current NIR.current NIR.– Current: 54 years: 1963 – 35 yearsCurrent: 54 years: 1963 – 35 years– 95% of NI in LDC – 2%; European have 95% of NI in LDC – 2%; European have
negativenegative
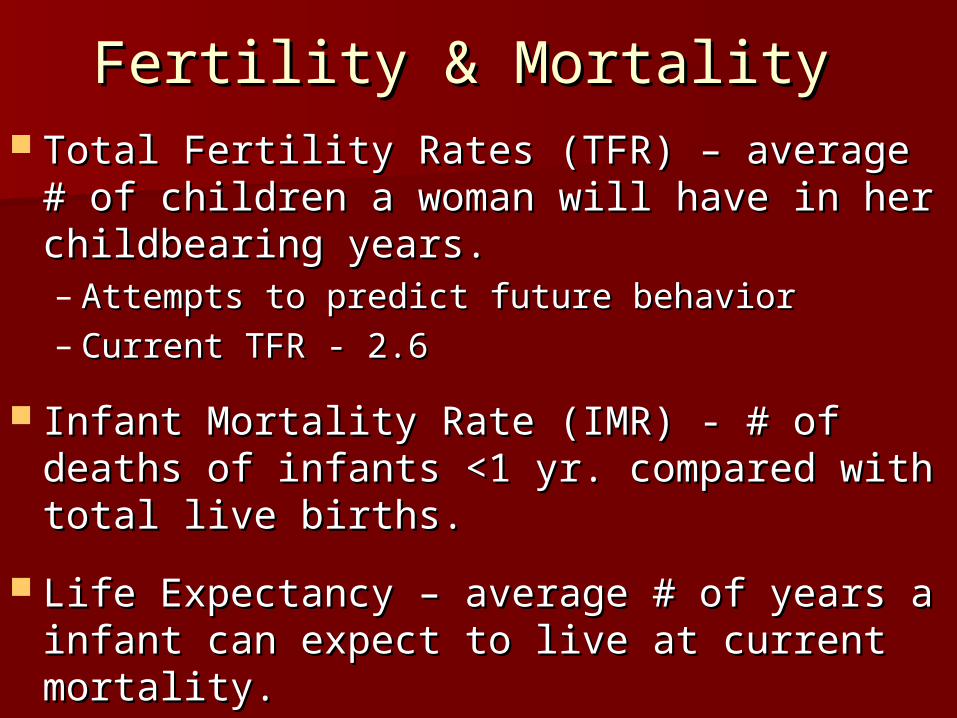
Fertility & Mortality Fertility & Mortality Total Fertility Rates (TFR) – average # of Total Fertility Rates (TFR) – average # of
children a woman will have in her children a woman will have in her childbearing years. childbearing years. – Attempts to predict future behavior Attempts to predict future behavior – Current TFR - 2.6Current TFR - 2.6
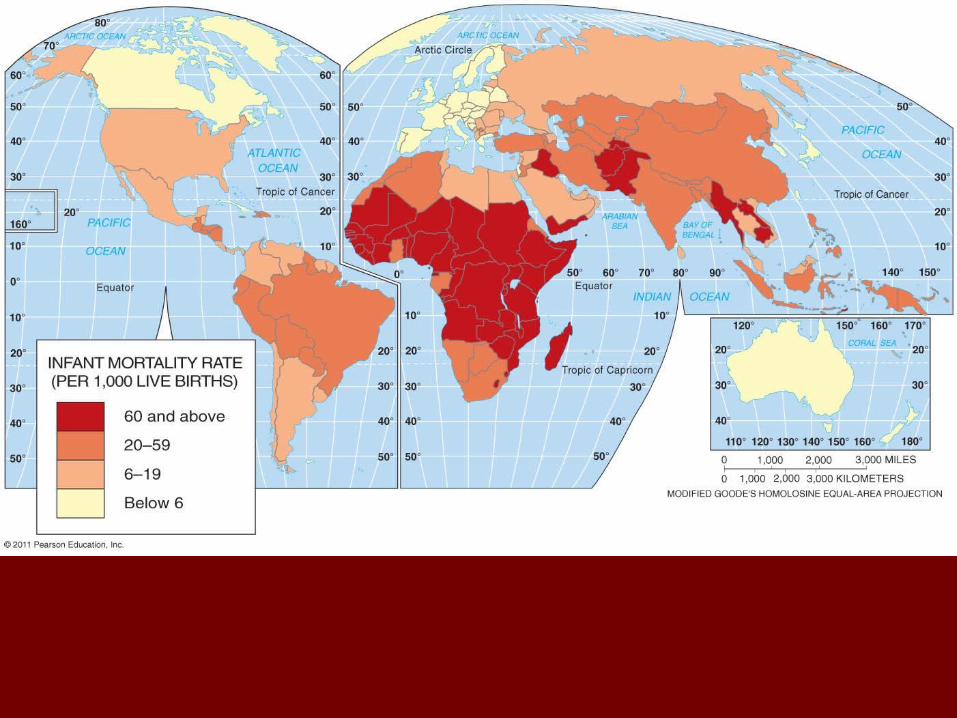
Infant Mortality Rate (IMR) - # of deaths of Infant Mortality Rate (IMR) - # of deaths of infants <1 yr. compared with total live infants <1 yr. compared with total live births. births.
Life Expectancy – average # of years a Life Expectancy – average # of years a infant can expect to live at current infant can expect to live at current mortality.mortality.
Wrap up Wrap up
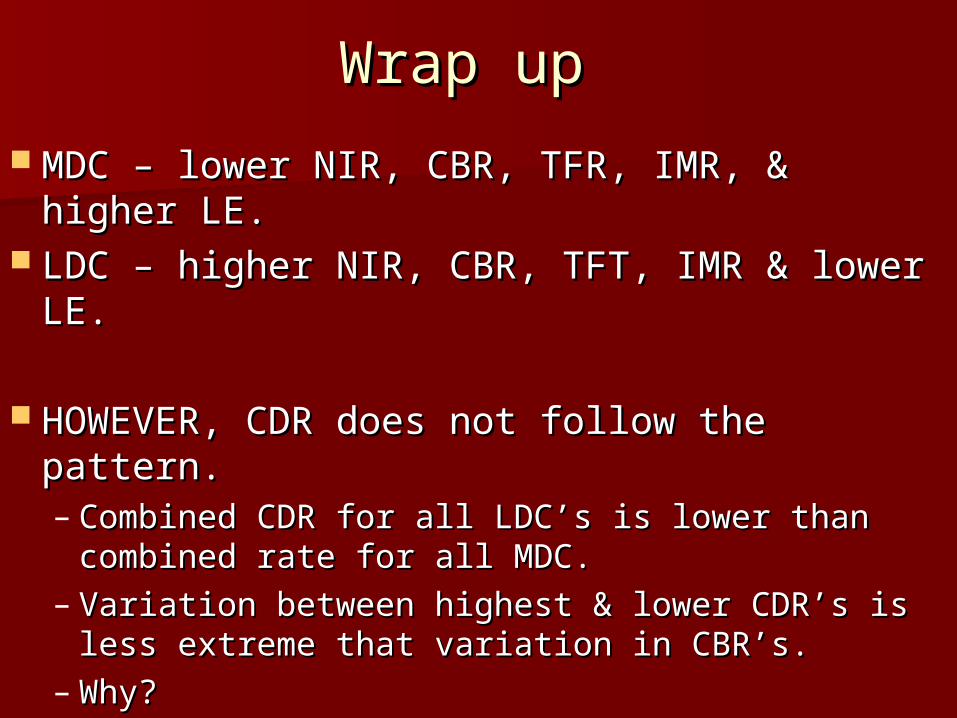
MDC – lower NIR, CBR, TFR, IMR, & higher MDC – lower NIR, CBR, TFR, IMR, & higher LE.LE.
LDC – higher NIR, CBR, TFT, IMR & lower LE. LDC – higher NIR, CBR, TFT, IMR & lower LE.
HOWEVER, CDR does not follow the pattern.HOWEVER, CDR does not follow the pattern.– Combined CDR for all LDC’s is lower than Combined CDR for all LDC’s is lower than
combined rate for all MDC.combined rate for all MDC.– Variation between highest & lower CDR’s is less Variation between highest & lower CDR’s is less
extreme that variation in CBR’s. extreme that variation in CBR’s. – Why? Why?
Demographic Transition Demographic Transition ModelModel
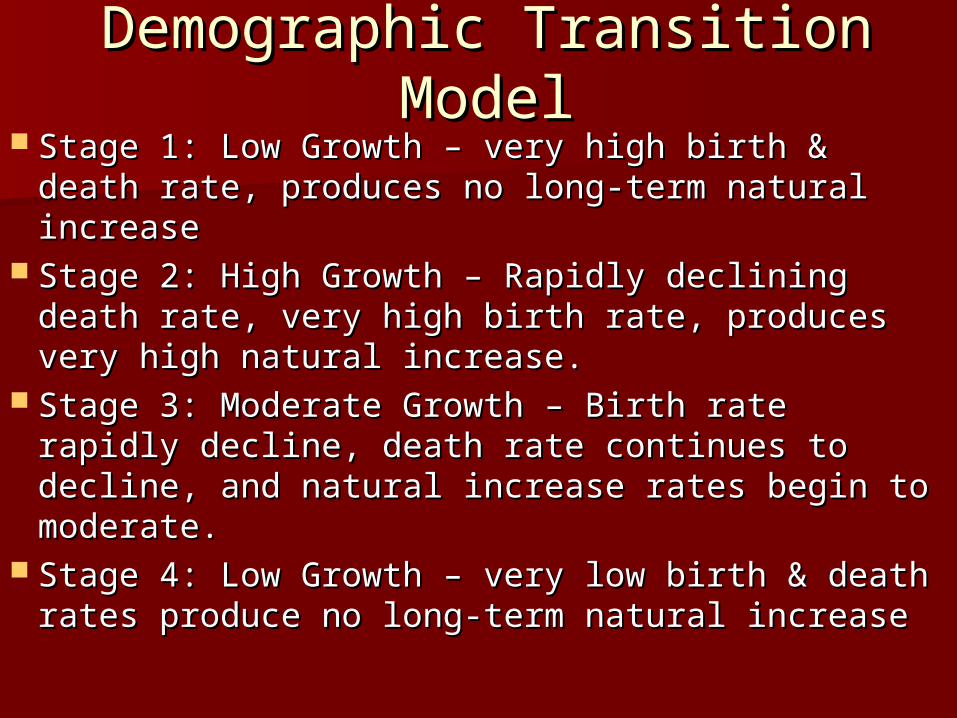
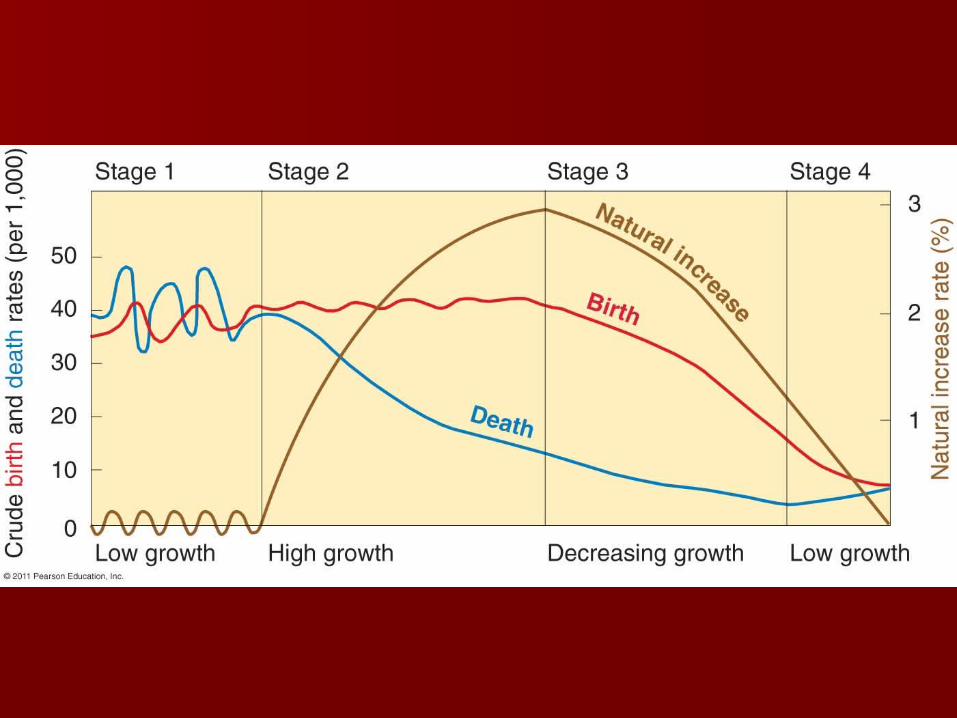
Stage 1: Low Growth – very high birth & Stage 1: Low Growth – very high birth & death rate, produces no long-term natural death rate, produces no long-term natural increaseincrease
Stage 2: High Growth – Rapidly declining Stage 2: High Growth – Rapidly declining death rate, very high birth rate, produces death rate, very high birth rate, produces very high natural increase.very high natural increase.
Stage 3: Moderate Growth – Birth rate rapidly Stage 3: Moderate Growth – Birth rate rapidly decline, death rate continues to decline, and decline, death rate continues to decline, and natural increase rates begin to moderate. natural increase rates begin to moderate.
Stage 4: Low Growth – very low birth & death Stage 4: Low Growth – very low birth & death rates produce no long-term natural increase rates produce no long-term natural increase

Population Population
Chapter 2 Chapter 2
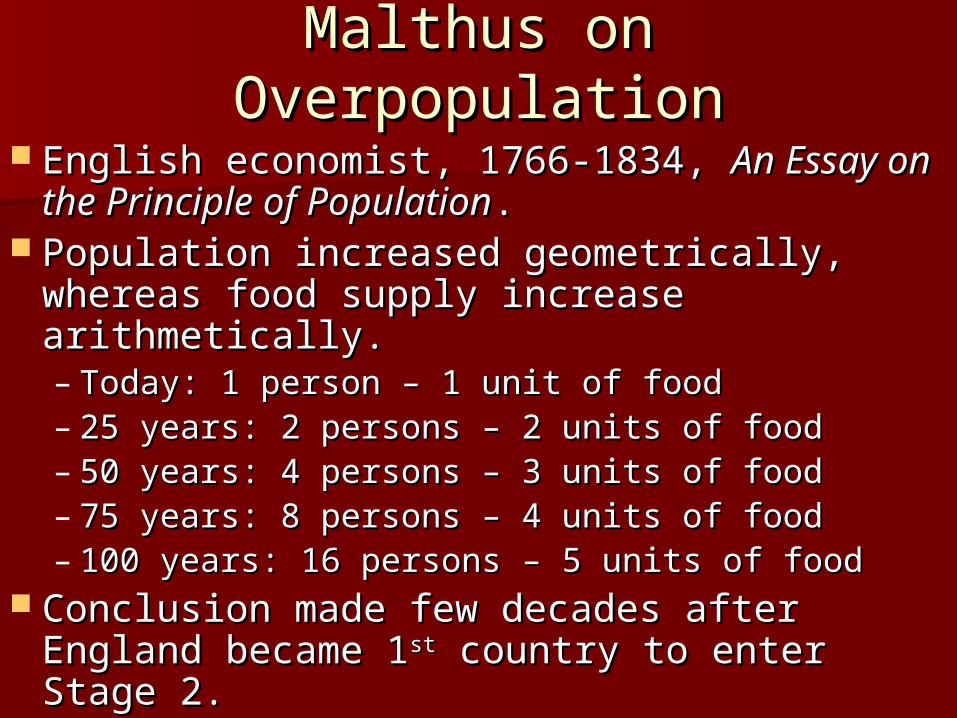
Malthus on OverpopulationMalthus on Overpopulation English economist, 1766-1834, English economist, 1766-1834, An Essay on An Essay on
the Principle of Populationthe Principle of Population. . Population increased geometrically, Population increased geometrically,
whereas food supply increase whereas food supply increase arithmetically.arithmetically.– Today: 1 person – 1 unit of food Today: 1 person – 1 unit of food – 25 years: 2 persons – 2 units of food25 years: 2 persons – 2 units of food– 50 years: 4 persons – 3 units of food 50 years: 4 persons – 3 units of food – 75 years: 8 persons – 4 units of food75 years: 8 persons – 4 units of food– 100 years: 16 persons – 5 units of food 100 years: 16 persons – 5 units of food
Conclusion made few decades after England Conclusion made few decades after England became 1became 1stst country to enter Stage 2. country to enter Stage 2.
Contemporary Neo-Contemporary Neo-MalthusiansMalthusians
1. LDCs have most rapid pop. growth 1. LDCs have most rapid pop. growth because of transfer of medical because of transfer of medical technology, but not wealth from MDCs. technology, but not wealth from MDCs. Wider gap between pop. & resources. Wider gap between pop. & resources.
2. Population growth is outstripping a 2. Population growth is outstripping a wide variety of resources. wide variety of resources.
Malthus’s CriticsMalthus’s Critics The belief that world’s supply of resources is The belief that world’s supply of resources is
fixed. Possibilism & Technology can expand fixed. Possibilism & Technology can expand it.it.
Boserup & Kuznets – Cornucopian Theory –Boserup & Kuznets – Cornucopian Theory –human ingenuity will result in innovations that human ingenuity will result in innovations that make it possible to expand the food supply make it possible to expand the food supply
Simon – Larger populations stimulate Simon – Larger populations stimulate economic growth.economic growth.
Marxist – no cause-&-effect between Marxist – no cause-&-effect between population growth & economic development.population growth & economic development.
LDCs can rapidly accepted modern ideas.LDCs can rapidly accepted modern ideas.
Example of AcceptanceExample of Acceptance
Use of Family Planning MethodsUse of Family Planning Methods Sub-Saharan Africa, low use of Sub-Saharan Africa, low use of
contraceptives, < ¼, could have strong contraceptives, < ¼, could have strong impact. impact.
In Asia & Latin America 2/3’s use them.In Asia & Latin America 2/3’s use them. Reasons - varies among countries:Reasons - varies among countries:
– Economics, religion, education. Economics, religion, education. – Low status of women.Low status of women.– Children represent higher status & sign of Children represent higher status & sign of
virility virility
Epidemiologic TransitionEpidemiologic Transition Stages 1 – “natural checks”Stages 1 – “natural checks” Black Plague – 1347 spread from coast to Black Plague – 1347 spread from coast to
inland towns to rural areas. 1348 Western inland towns to rural areas. 1348 Western Europe, 1349 Northern Europe.Europe, 1349 Northern Europe.– 25 million Europeans died 1347-135025 million Europeans died 1347-1350
5 more epidemics.5 more epidemics.– 13 million in China died, left farms with no 13 million in China died, left farms with no
workers, ships adrift, estates with no heirsworkers, ships adrift, estates with no heirs
Epidemiologic TransitionEpidemiologic Transition
Stage 2 – Stage of receding pandemicsStage 2 – Stage of receding pandemics Improved sanitation, nutrition, medicine Improved sanitation, nutrition, medicine
during Industrial Revolution reduced during Industrial Revolution reduced spread of diseases. spread of diseases.
Cholera – ½ mill. NYC 1832; Cholera – ½ mill. NYC 1832; ⅛⅛ of Cairo of Cairo 18311831
Dr. John Snow showed distribution Dr. John Snow showed distribution pattern with water sources. Victims from pattern with water sources. Victims from 1 H1 H²²O pump. O pump.
Epidemiologic TransitionEpidemiologic Transition
Stage 3 – Stage of Degenerative & Stage 3 – Stage of Degenerative & Human Created diseases Human Created diseases
Decrease infectious diseases, increase Decrease infectious diseases, increase chronic disorders.chronic disorders.– Cardiovascular diseases & cancerCardiovascular diseases & cancer
Vaccines lead to decrease: Polio, Vaccines lead to decrease: Polio, measles, tetanus, diphtheria & pertussis. measles, tetanus, diphtheria & pertussis.
LDC moved from Stage 2 to 3 LDC moved from Stage 2 to 3
Epidemiologic TransitionEpidemiologic Transition
Stage 4 – Stage of Delayed degenerative Stage 4 – Stage of Delayed degenerative diseasesdiseases
Causes of death heart disease & cancer Causes of death heart disease & cancer linger but life expectancy is extended b/c linger but life expectancy is extended b/c medical advances. medical advances.
Better diet & more exercise, reduced use Better diet & more exercise, reduced use of tobacco & alcohol.of tobacco & alcohol.
Epidemiologic TransitionEpidemiologic Transition
Possible Stage 5 – reemergence of Possible Stage 5 – reemergence of infectious & parasitic diseases infectious & parasitic diseases
3 Reasons possible 3 Reasons possible – Evolution: Drug resistant diseases & insects Evolution: Drug resistant diseases & insects – Poverty: over crowded conditions, cost of Poverty: over crowded conditions, cost of
treatment, availability of treatment treatment, availability of treatment – Improved travel: allow diseases to move Improved travel: allow diseases to move
quickly between areas. EX: H1N1, SARS quickly between areas. EX: H1N1, SARS
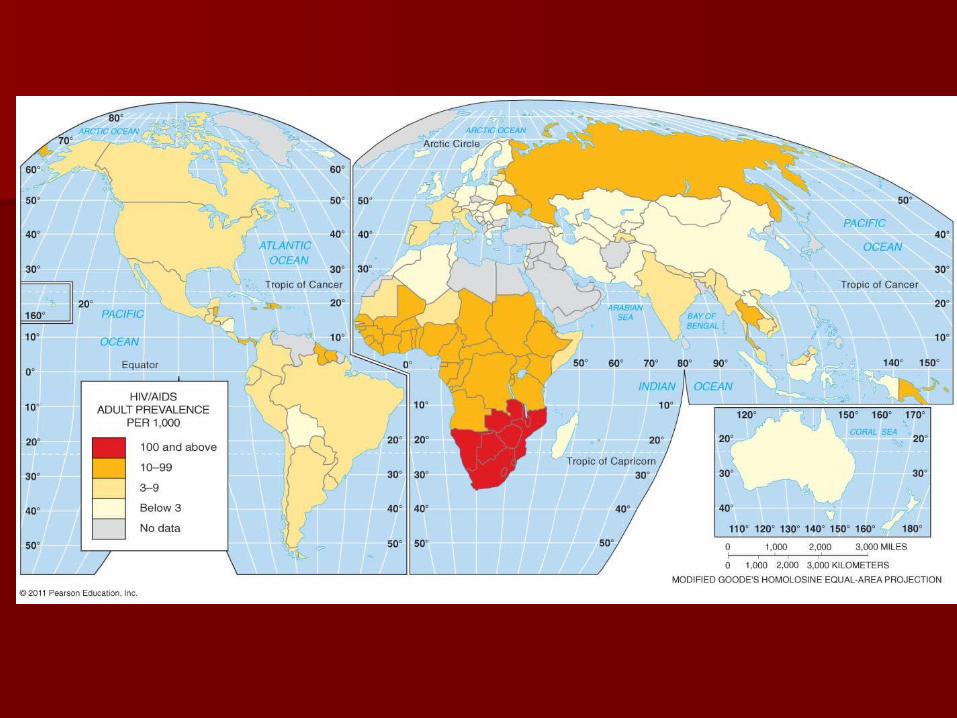
AIDS AIDS
Most lethal epidemic in recent years Most lethal epidemic in recent years 25 million worldwide have died25 million worldwide have died 90% people with AIDS in LDCs90% people with AIDS in LDCs
– 22 million infected in sub-Saharan Africa, 5 22 million infected in sub-Saharan Africa, 5 million in Asia, 2 million E. Europe & Latin million in Asia, 2 million E. Europe & Latin America, & 1 million each N. America & W. America, & 1 million each N. America & W. EuropeEurope
Life expectancy – Declined in Southern Life expectancy – Declined in Southern Africa from 50s in 1980s to 40s now. Africa from 50s in 1980s to 40s now.