Embed Size (px)
Citation preview

Population Challenges
Chapter 12Pages 244-266

12.1: Students will describe patterns in the distribution of Canada's population.
Pages 252-255

12.1.1 Define the term population distribution• The pattern of population in an area

12.1.2 Distinguish between the terms dispersed and concentrated.
DispersedPopulation is ina large region
ConcentratedPopulation is in a small region

12.1.3 Define the term population density. Refers to the number of people divided by the land area in which they livePopulation Density = Total population
Land area (km)

12.1.3 continued…
Densely PopulatedLarge number of people per land mass (>100)Moderately PopulatedMedium number of people per land mass (10-100)Sparsely PopulatedSmall number of people per land mass (<10)

12.1.4 Given a population dot map for each of two areas, determine Which area represented
has the more evenly distributed population
Which area has the more dispersed population distribution
Which area has the higher population density

12.1.5 Given a table showing the population and area for each province and territory Calculate the population density for each province;Rank the provinces by population density (highest
to lowest).
Worksheets 1:Population PatternsWorksheet 2: World Population Distribution

12.1.6 Given a population distribution map of Canada, state your agreement or disagreement with the following statement. Explain.
Canadians live in "islands" of population strung along the southern border.
http://geodepot.statcan.ca/Diss/Maps/ThematicMaps/population/National/pop_dens_colour_e.pdfWorksheet 3: Canadian Population Distribution

12.2 Students will examine factors which influence the distribution of Canada's population.
Pages 253-255

12.2.1 Examine a landforms map of Canada. Select an area (e.g., Rocky Mountain region) and describe how landforms contribute to an uneven distribution of population.

12.2.1 Ctd.
• Pacific Coast: Large populations centers (Vancouver)• Rocky Mountains: Scattered populations living among
the mountains.• The Great Plains: Moderately populated, with some
dense clusters• Canadian Shield: Low population density, mostly
empty• Great Lakes: High population density• Atlantic Provinces: Population scattered along the
coast with some inland centers
12.2.1 Ctd.

12.2.2 Select a densely populated area (e.g., Niagara Peninsula) and a sparsely populated area (e.g., North West Territories). Examine a climate map and explain how climate affects the distribution of population.

12.2.2 Select a densely populated area (e.g., Niagara Peninsula) and a sparsely populated area (e.g., North West Territories). Examine a climate map and explain how climate affects the distribution of population.
•Generally as you go north the climate gets colder•Because of the cold climate less people live there•Why?•Less food•Fewer trees•Need more energy…

12.2.3 Describe an example to support each of the following statements:Coastal water formsinfluence the distributionof population.
Inland water forms helpdetermine whereCanadians live.
12.2.2 CTD
• Nova Scotia:• You can see that the
majority of towns in Nova Scotia are located along the coast
• Along the Great Lakes- St. Lawrence region the population is dense along the shore

12.2.4 Describe the impact of resource centers on the distribution of population in Canada.
Montreal developed because of location during the fur trade
Toronto started as a trading post and developed because
of location
Calgary developed first as post for RCMP but grew because of the
railway. Became center for cattle industry and since developed
because of oil
Vancouver rapidly developed with railway. Initial British but quickly populated by Chinese
and other Asian groups

12.2.5 Examine a table showing the provincial share of population employed in manufacturing
and table showing the population by provinceDescribe the relationship between manufacturing andpopulation size. (Example: Ontario)

12.2.5 continued…

12.3: Students will describe patterns in
the growth of Canada's population.
http://gedepot.statcan.ca/Diss/Highlights/Page2/Page2_e.cfm

12.3.1 Given a population line graph (10-year intervals), describe the change in Canada's population.

12.3.1. CTD.
• Canada’s Growth:• Over the past 100 years
Canada has experienced a steady growth.
• Canada’s Growth Rate:• Over the past 100 years
Canada’s growth rate has been fluctuating. There have been periods of rapid growth mixed with slow growth.

12.3.2 Examine a multiple line graph showing the population growth rate for each province. • Identify the
province which has experienced the highest growth rate.
• Describe the social and economic conditions which help explain this trend.

12.3.3 Define the terms birth rate, death rate and growth rateBirth RateThe number of births per 1000 population
Death RateThe number of deaths per 1000 population
Growth RateThe change in population over a period of time

12.3.4 Define the term natural increase.
Difference between the birth rate and death rate
C…Calculate

12.3.5 Examine a table showing the birth rate and death rate (5-year intervals) for the past 75 years.
Calculate the rate of natural increase for each 5-year interval and present in table form. Describe what is happening to Canada's rate of natural increase over the 75-year period. Briefly describe some of the social conditions help explain the pattern in the rate of natural increase.

12.3.5 continued…
Worksheet 4: Natural Change in Population

12.3.6 Given a table showing the number of families and average number of children per family (for the period 1941 to present)
• Describe what is happening to family size; and
• Compare this trend with population growth

12.3.7 List reasons which help explain why Canada's rate of natural increase is shrinkingBirth Rate (decreased) Birth Control Children survival rates Work is top priority Working parents…high
levels of stress Declining religious beliefs
and practices
Death Rate (decreased) Improvements in medical
care Improvements in nutrition Improvements in education
and physical activity Less work related stressEarlier retirements

12.4: Students will examine the composition of Canada's population.
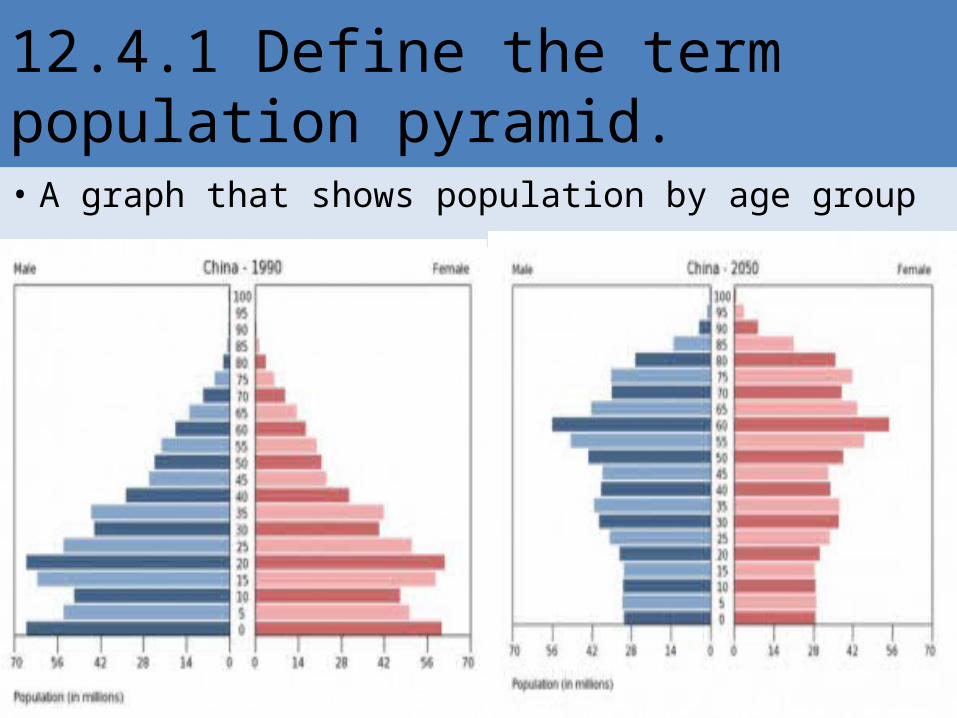
12.4.1 Define the term population pyramid. • A graph that shows population by age group
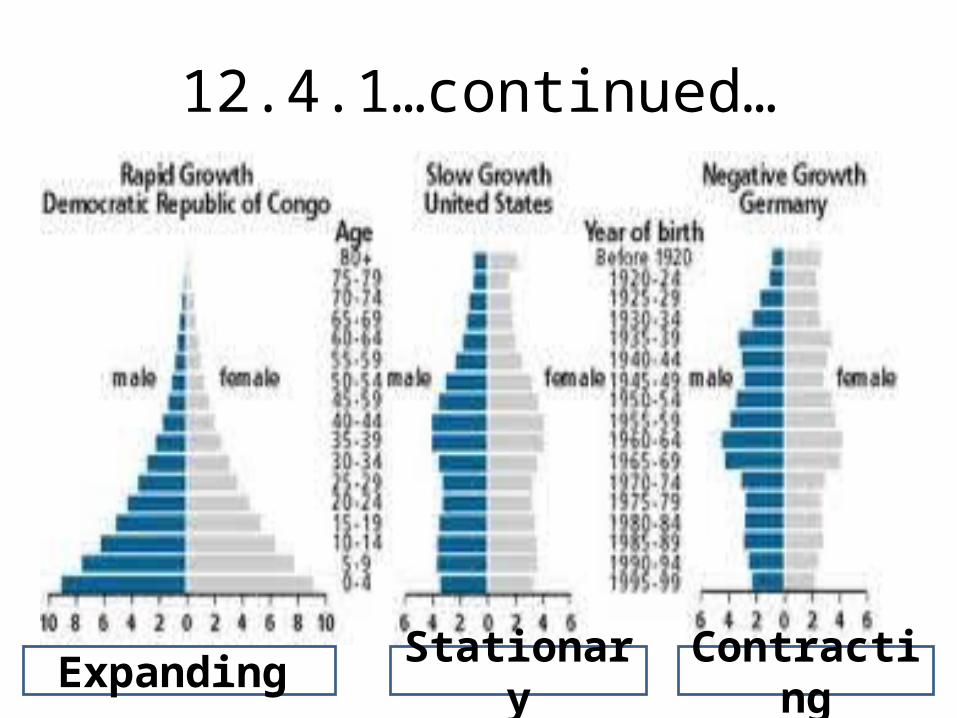
12.4.1…continued…
Expanding ContractingStationary

12.4.2 Given a population pyramid for Canada• http://www12.statcan.ca/english/census01/produc
ts/analytic/companion/age/canada.cfm• http://www.footwork.com/pyramids.asp
• Worksheet 5: Population Pyramid of Canada

12.4.2 continued…
Compare percentage of females to that of males

12.4.2 continued…Compare the total percentage of females
over age 65 to that of males over age 65
More females over the age of 65 than males

12.4.2 continued…Explain why the base of the population pyramid is
relatively narrow.
Possible reasons: Health care Birth control Economic development Social conditions Cultural traditions

12.4.3 Define the term dependency load (ratio). • The portion of the people under sixteen and over
the age of sixty-five years

12.4.4 From the table calculate the dependency load. (2001)
Worksheet #6 Dependency Ratio

12.4.5 Describe the potential impact of a high dependency load on such conditions as• Housing• Tax levels for the working population• Job opportunities.

12.4.6 Given a pie chart showing the composition of Canada's population by major ethnic group, describe the pattern shown. • See page 257 table 12.15 and question 19

12.4.7 Examine a population pyramid for native people in Canada and the population pyramid for CanadaHow does the percentage of First Nations people compare to Canadian Population?
First Nations1.More children under age of 15 years2.Less seniors over age of 65 years3.Expanding population

12.4.8. Determine whether the following statements are valid and explain why. • Native people in Canada have a higher birth rate
than the general population.• Compared to the general population, a higher
percentage of the native population lives to reach age 70 and older.

12.5: Students will evaluate the effects of migration on the
distribution and size of Canada's population.

12.5.1 Define the term migration.
Movement of people from one place to another
Leave one place and settle in another

12.5.2 Distinguish between the terms immigration and emigrationImmigration
Movement of a person into a foreign country as a permanent resident
EmigrationWhen person leaves a country to live elsewhere

12.5.3 Define the term actual change.
Net change in population due to:1. Births and immigration on the one hand 2. Deaths and emigration on the other hand
Formula Actual = (Births + Immigration) – (Deaths + Emigration)Change
AC = (B + I) – (D + E)

12.5.4 Given a table showing Canada's migration totals (1985 to the present) Calculate the net migration figure for each year;
andCalculate the total number of immigrants and
emigrants within this period.
Worksheet 7: Components of Population Growth

12.5.5 Given the number of deaths, births, emigrants, and immigrants for a given year,calculate the actual change in population.
Worksheet 7 Components of Population Growth

• 12.5.6 Given a bar graph showing trends in immigration to Canada from 1867 to the present and a socio-economic descriptor for given periods (e.g., the Depression), explain how the number of immigrants is affected by social and economic conditions in Canada.
See figure 12.21 and question 24

12.5.7 Examine a table showing net inter-provincial migration in Canada. • Identify the provinces
with a net outflow of people.
• Identify the provinces with a net inflow of people.
• List factors which account for the migration of people from one province to another.
Alberta
BC; Ont; SK; NL, Mb

12.5.8 Assume the role of the premier of a province which is the destination for large numbers of migrants from other provinces. • Adopt a position which either supports or does not
support this trend.• Develop strategies which would help promote this
position.

12.5.9 Assume that you are to move to another province. • Determine which province you would choose.• Explain why.• List possible obstacles to this move.