Embed Size (px)
Citation preview
Urologic Oncology: Seminars and Original Investigations ] (2014) ∎∎∎–∎∎∎
http://dx.doi.org/10.1016/j1078-1439/r 2014 Elsev
1
This work is supportePhysician Training AwarThis study used the linkeand reporting of these dat
* Corresponding authorE-mail address: jimhum
Original article
Population-based assessment of prostate-specific antigen testing forprostate cancer in the elderly1
Jim C. Hu, M.D., M.P.H.a,*, Stephen B. Williams, M.D.b, Stacey C. Carter, M.D.a,Scott E. Eggener, M.D.c, Sandip Prasad, M.D.d, Karim Chamie, M.D.a, Quoc-Dien Trinh, M.D.e,
Maxine Sun, M.D.f, Paul L. Nguyen, M.D.g, Stuart R. Lipsitz, Ph.D.h
a Department of Urology, David Geffen School of Medicine at UCLA, Los Angeles, CAb Department of Urology, The University of Texas MD Anderson Cancer Center, Houston, TX
c Section of Urology, University of Chicago, Chicago, ILd Department of Urology, Medical University of South Carolina, Charleston, SC
e Department of Urology, Brigham and Women's Hospital, Boston, MAf Cancer Prognostics and Health Outcomes Unit, Centre Hospitalier de l'Université de Montréal, Montreal, Canada
g Department of Radiation Oncology, Brigham and Women's Hospital, Boston, MAh Center for Surgery and Public Health, Brigham and Women's Hospital, Boston, MA
Received 9 May 2014; received in revised form 3 June 2014; accepted 5 June 2014
Abstract
Objectives: To perform a population-based analysis to characterize the effect of prostate-specific antigen (PSA) testing on oncologicoutcomes in men diagnosed with prostate cancer.Materials and methods: We used the Surveillance, Epidemiology, and End Results–Medicare–linked data to identify 98,883 men
diagnosed with prostate cancer from 1996 to 2007. We stratified frequency of PSA testing as none, 1 to 2, 3 to 5, and Z6 tests in the 5 yearsbefore prostate cancer diagnosis. We used propensity scoring methods to assess the effect of frequency of PSA testing on likelihood of (1)metastases at diagnosis and (2) overall mortality and prostate cancer–specific mortality.Results: In adjusted analyses, the likelihood of being diagnosed with metastatic prostate cancer decreased with greater frequency of PSA
testing (none, 10.6; 1–2, 8.3; 3–5, 3.7; and Z6, 2.5 events per 100 person years, P o 0.001). Additionally, greater frequency of PSA testingwas associated with improved overall survival and prostate cancer–specific survival (P o 0.001 for both).Conclusions: Greater frequency of PSA testing in men 70 years of age or older in the 5 years before prostate cancer diagnosis is
associated with lower likelihood of being diagnosed with metastatic prostate cancer and improved overall and prostate cancer–specificsurvival. r 2014 Elsevier Inc. All rights reserved.
Keywords: Prostate-specific antigen; PSA; Elderly; Survival; Mortality
1. Introduction
Prostate cancer remains the most commonly diagnosedsolid organ tumor among U.S. men, with an estimated
.urolonc.2014.06.003ier Inc. All rights reserved.
d by a Department of Defense Prostate Cancerd (W81XWH-08-1-0283) presented to Dr. Hu.d SEER-Medicare database. The interpretationa are the sole responsibility of the authors.
. Tel.: þ[email protected] (J.C. Hu).
241,740 new cases and 28,170 deaths in 2012 [1]. Prostatecancer has been singled out as a litmus test for health carereform, with a lack of consensus regarding optimal screen-ing or treatment strategies [2]. Prostate-specific antigen(PSA) screening has led to a significant increase indetection of clinically localized T1c prostate cancer withconcomitant stage migration [3]. It is widely believed thatPSA screening adds net costs to the health care systemwithout overwhelming support from randomized controlledtrials demonstrating improved survival. The randomizedcontrolled trials of PSA screening vs. no screening have
J.C. Hu et al. / Urologic Oncology: Seminars and Original Investigations ] (2014) 1–62
yielded conflicting results. Although the European Random-ized Study of Screening for Prostate Cancer demonstratedthat PSA screening in a largely PSA-naïve populationreduced prostate cancer–specific mortality by 20% [4], theU.S. Prostate, Lung, Colorectal, and Ovarian CancerScreening Trial did not demonstrate a survival benefit ofannual PSA screening compared with a control arm inwhich 52% of subjects had undergone PSA testing beforerandomization or outside of the trial or both [5]. After asystematic review of the evidence largely weighted by thesestudies, the U.S. Preventative Services Task Force recom-mended against PSA screening owing to moderate to highcertainty the service has no net benefit and the harmsoutweigh the benefits [6].
Although clinical trials overcome concerns of internalvalidity, there are often concerns regarding external validityand generalizability—clinical trial enrollees tend to beyounger and healthier than most patients with cancer andoften times represent highly selected patient subgroups [7–9].Therefore, the purpose of our population-based study was todetermine whether use and frequency of PSA testing in the 5years before prostate cancer diagnosis affects prostate cancerstage and overall and prostate cancer–specific mortality in acontemporary cohort of elderly Americans.
2. Materials and methods
2.1. Data
Our study was approved by the University of California,Los Angeles institutional review board; patient data weredeidentified, and the requirement for consent was waived.We used the Surveillance, Epidemiology, and End Results(SEER)–Medicare–linked data for analyses, comprising thelinkage of population-based cancer registry data from 16SEER regions covering approximately 26% of the U.S.population with Medicare administrative data. The Medi-care program provides benefits to 97% of Americansaged Z65 years [10].
2.2. Study cohort
We identified 267,052 men from the SEER-Medicare–linked data diagnosed with prostate cancer between 1996and 2007 with follow-up of Medicare services through2009. As we evaluated PSA testing in the 5 years beforediagnosis, 182,190 men aged Z70 years at the time ofprostate cancer diagnosis were identified. We excluded73,134 men who also had health maintenance organizationcoverage and were not enrolled to Medicare throughout thestudy period, as medical services for these men may beincompletely captured. Moreover, we excluded 5,345 menowing to missing tumor stage at diagnosis and 4,828 menbecause of missing demographic or comorbidity character-istics, resulting in a final cohort of 98,883 men.
We identified PSA tests before prostate cancer diagnosisusing Healthcare Common Procedure Coding System codes84153, 84154, and G0103. Against the backdrop of the U.S.Preventative Services Task Force's recent recommendationagainst any PSA screening and the inherent differences inpatient characteristics of men who never receive any PSAtesting from those who obtained at least one PSA test in the5 years before prostate cancer diagnosis, we categorizedmen who did not have any PSA testing separate from thosewho had at least 1 PSA test. These men were categorizedinto groups according to 1 to 2, 3 to 5, and Z6 PSA tests inthe 5 years before prostate cancer diagnosis. However, insensitivity analyses, we also combined men with 0 and 1 to2 PSA tests, and results were similar.
2.3. Control variables
Age was obtained from the Medicare file; tumor charac-teristics, race, census tract measures of median householdincome and high school education, region, population density(urban vs. rural), and marital status were obtained fromSEER registries. Comorbidity was assessed using the Kla-bunde modification of the Charlson index during the yearbefore surgery [11]. Use of other preventive procedurescovered by Medicare for men was identified using corre-sponding Healthcare Common Procedure Coding Systemcodes: (1) influenza vaccination 90732, 90724, 90659,90658, 90669, and G0008; (2) cholesterol testing 82465,83718, 83721, 83719, and 80061; and (3) colorectal cancertesting 82270, 82272, 82274, 82270, G0328, and G0107.
2.4. Statistical analysis
Because men with varying use of PSA testing differed interms of demographic characteristics and use of otherpreventative tests covered by Medicare, we used weightedpropensity score methods to adjust for these differences[12,13]. Propensity score methods permit control for observedconfounding factors that may influence both group assign-ment and outcome using a single composite measure, andthey attempt to balance patient characteristics between groups.To conduct the propensity score adjustment, we used alogistic regression model to calculate the propensity (proba-bility) of being in 1 of the 4 PSA testing frequency groupsbased on all aforementioned covariates and then weightedeach subject's data based on the inverse propensity of being in1 of the 4 PSA screening frequency groups [14]. To compareunadjusted proportions across PSA testing groups, we usedPearson chi-squared test, and to compare propensity-adjustedproportions across PSA testing groups, we used a Rao-Scottchi-squared test [14], which accounts for the propensityweighting. To compare unadjusted rates, we fit a Poissonlog-linear regression model [15] with PSA testing groups asthe only covariate. To compare propensity-adjusted rates, wefit a Poisson log-linear regression model [16], with PSAtesting groups as the only covariate, but also weighting each
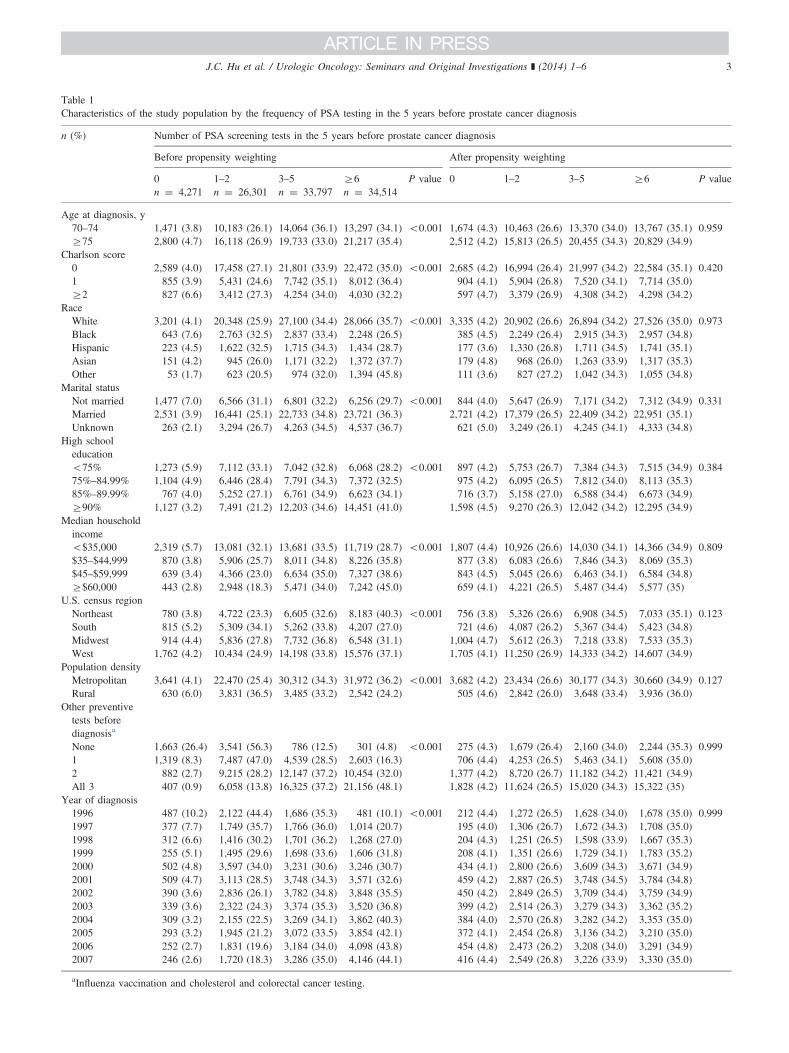
Table 1Characteristics of the study population by the frequency of PSA testing in the 5 years before prostate cancer diagnosis
n (%) Number of PSA screening tests in the 5 years before prostate cancer diagnosis
Before propensity weighting After propensity weighting
0 1–2 3–5 Z6 P value 0 1–2 3–5 Z6 P valuen ¼ 4,271 n ¼ 26,301 n ¼ 33,797 n ¼ 34,514
Age at diagnosis, y70–74 1,471 (3.8) 10,183 (26.1) 14,064 (36.1) 13,297 (34.1) o0.001 1,674 (4.3) 10,463 (26.6) 13,370 (34.0) 13,767 (35.1) 0.959Z75 2,800 (4.7) 16,118 (26.9) 19,733 (33.0) 21,217 (35.4) 2,512 (4.2) 15,813 (26.5) 20,455 (34.3) 20,829 (34.9)
Charlson score0 2,589 (4.0) 17,458 (27.1) 21,801 (33.9) 22,472 (35.0) o0.001 2,685 (4.2) 16,994 (26.4) 21,997 (34.2) 22,584 (35.1) 0.4201 855 (3.9) 5,431 (24.6) 7,742 (35.1) 8,012 (36.4) 904 (4.1) 5,904 (26.8) 7,520 (34.1) 7,714 (35.0)Z2 827 (6.6) 3,412 (27.3) 4,254 (34.0) 4,030 (32.2) 597 (4.7) 3,379 (26.9) 4,308 (34.2) 4,298 (34.2)
RaceWhite 3,201 (4.1) 20,348 (25.9) 27,100 (34.4) 28,066 (35.7) o0.001 3,335 (4.2) 20,902 (26.6) 26,894 (34.2) 27,526 (35.0) 0.973Black 643 (7.6) 2,763 (32.5) 2,837 (33.4) 2,248 (26.5) 385 (4.5) 2,249 (26.4) 2,915 (34.3) 2,957 (34.8)Hispanic 223 (4.5) 1,622 (32.5) 1,715 (34.3) 1,434 (28.7) 177 (3.6) 1,330 (26.8) 1,711 (34.5) 1,741 (35.1)Asian 151 (4.2) 945 (26.0) 1,171 (32.2) 1,372 (37.7) 179 (4.8) 968 (26.0) 1,263 (33.9) 1,317 (35.3)Other 53 (1.7) 623 (20.5) 974 (32.0) 1,394 (45.8) 111 (3.6) 827 (27.2) 1,042 (34.3) 1,055 (34.8)
Marital statusNot married 1,477 (7.0) 6,566 (31.1) 6,801 (32.2) 6,256 (29.7) o0.001 844 (4.0) 5,647 (26.9) 7,171 (34.2) 7,312 (34.9) 0.331Married 2,531 (3.9) 16,441 (25.1) 22,733 (34.8) 23,721 (36.3) 2,721 (4.2) 17,379 (26.5) 22,409 (34.2) 22,951 (35.1)Unknown 263 (2.1) 3,294 (26.7) 4,263 (34.5) 4,537 (36.7) 621 (5.0) 3,249 (26.1) 4,245 (34.1) 4,333 (34.8)
High schooleducationo75% 1,273 (5.9) 7,112 (33.1) 7,042 (32.8) 6,068 (28.2) o0.001 897 (4.2) 5,753 (26.7) 7,384 (34.3) 7,515 (34.9) 0.38475%–84.99% 1,104 (4.9) 6,446 (28.4) 7,791 (34.3) 7,372 (32.5) 975 (4.2) 6,095 (26.5) 7,812 (34.0) 8,113 (35.3)85%–89.99% 767 (4.0) 5,252 (27.1) 6,761 (34.9) 6,623 (34.1) 716 (3.7) 5,158 (27.0) 6,588 (34.4) 6,673 (34.9)Z90% 1,127 (3.2) 7,491 (21.2) 12,203 (34.6) 14,451 (41.0) 1,598 (4.5) 9,270 (26.3) 12,042 (34.2) 12,295 (34.9)
Median householdincomeo$35,000 2,319 (5.7) 13,081 (32.1) 13,681 (33.5) 11,719 (28.7) o0.001 1,807 (4.4) 10,926 (26.6) 14,030 (34.1) 14,366 (34.9) 0.809$35–$44,999 870 (3.8) 5,906 (25.7) 8,011 (34.8) 8,226 (35.8) 877 (3.8) 6,083 (26.6) 7,846 (34.3) 8,069 (35.3)$45–$59,999 639 (3.4) 4,366 (23.0) 6,634 (35.0) 7,327 (38.6) 843 (4.5) 5,045 (26.6) 6,463 (34.1) 6,584 (34.8)Z$60,000 443 (2.8) 2,948 (18.3) 5,471 (34.0) 7,242 (45.0) 659 (4.1) 4,221 (26.5) 5,487 (34.4) 5,577 (35)
U.S. census regionNortheast 780 (3.8) 4,722 (23.3) 6,605 (32.6) 8,183 (40.3) o0.001 756 (3.8) 5,326 (26.6) 6,908 (34.5) 7,033 (35.1) 0.123South 815 (5.2) 5,309 (34.1) 5,262 (33.8) 4,207 (27.0) 721 (4.6) 4,087 (26.2) 5,367 (34.4) 5,423 (34.8)Midwest 914 (4.4) 5,836 (27.8) 7,732 (36.8) 6,548 (31.1) 1,004 (4.7) 5,612 (26.3) 7,218 (33.8) 7,533 (35.3)West 1,762 (4.2) 10,434 (24.9) 14,198 (33.8) 15,576 (37.1) 1,705 (4.1) 11,250 (26.9) 14,333 (34.2) 14,607 (34.9)
Population densityMetropolitan 3,641 (4.1) 22,470 (25.4) 30,312 (34.3) 31,972 (36.2) o0.001 3,682 (4.2) 23,434 (26.6) 30,177 (34.3) 30,660 (34.9) 0.127Rural 630 (6.0) 3,831 (36.5) 3,485 (33.2) 2,542 (24.2) 505 (4.6) 2,842 (26.0) 3,648 (33.4) 3,936 (36.0)
Other preventivetests beforediagnosisa
None 1,663 (26.4) 3,541 (56.3) 786 (12.5) 301 (4.8) o0.001 275 (4.3) 1,679 (26.4) 2,160 (34.0) 2,244 (35.3) 0.9991 1,319 (8.3) 7,487 (47.0) 4,539 (28.5) 2,603 (16.3) 706 (4.4) 4,253 (26.5) 5,463 (34.1) 5,608 (35.0)2 882 (2.7) 9,215 (28.2) 12,147 (37.2) 10,454 (32.0) 1,377 (4.2) 8,720 (26.7) 11,182 (34.2) 11,421 (34.9)All 3 407 (0.9) 6,058 (13.8) 16,325 (37.2) 21,156 (48.1) 1,828 (4.2) 11,624 (26.5) 15,020 (34.3) 15,322 (35)
Year of diagnosis1996 487 (10.2) 2,122 (44.4) 1,686 (35.3) 481 (10.1) o0.001 212 (4.4) 1,272 (26.5) 1,628 (34.0) 1,678 (35.0) 0.9991997 377 (7.7) 1,749 (35.7) 1,766 (36.0) 1,014 (20.7) 195 (4.0) 1,306 (26.7) 1,672 (34.3) 1,708 (35.0)1998 312 (6.6) 1,416 (30.2) 1,701 (36.2) 1,268 (27.0) 204 (4.3) 1,251 (26.5) 1,598 (33.9) 1,667 (35.3)1999 255 (5.1) 1,495 (29.6) 1,698 (33.6) 1,606 (31.8) 208 (4.1) 1,351 (26.6) 1,729 (34.1) 1,783 (35.2)2000 502 (4.8) 3,597 (34.0) 3,231 (30.6) 3,246 (30.7) 434 (4.1) 2,800 (26.6) 3,609 (34.3) 3,671 (34.9)2001 509 (4.7) 3,113 (28.5) 3,748 (34.3) 3,571 (32.6) 459 (4.2) 2,887 (26.5) 3,748 (34.5) 3,784 (34.8)2002 390 (3.6) 2,836 (26.1) 3,782 (34.8) 3,848 (35.5) 450 (4.2) 2,849 (26.5) 3,709 (34.4) 3,759 (34.9)2003 339 (3.6) 2,322 (24.3) 3,374 (35.3) 3,520 (36.8) 399 (4.2) 2,514 (26.3) 3,279 (34.3) 3,362 (35.2)2004 309 (3.2) 2,155 (22.5) 3,269 (34.1) 3,862 (40.3) 384 (4.0) 2,570 (26.8) 3,282 (34.2) 3,353 (35.0)2005 293 (3.2) 1,945 (21.2) 3,072 (33.5) 3,854 (42.1) 372 (4.1) 2,454 (26.8) 3,136 (34.2) 3,210 (35.0)2006 252 (2.7) 1,831 (19.6) 3,184 (34.0) 4,098 (43.8) 454 (4.8) 2,473 (26.2) 3,208 (34.0) 3,291 (34.9)2007 246 (2.6) 1,720 (18.3) 3,286 (35.0) 4,146 (44.1) 416 (4.4) 2,549 (26.8) 3,226 (33.9) 3,330 (35.0)
aInfluenza vaccination and cholesterol and colorectal cancer testing.
J.C. Hu et al. / Urologic Oncology: Seminars and Original Investigations ] (2014) 1–6 3
J.C. Hu et al. / Urologic Oncology: Seminars and Original Investigations ] (2014) 1–64
subject by the inverse propensity score and using a robuststandard error to account for the weighting [17]. We correctedfor lead-time bias using the approach of Duffy et al. [18].Covariate balance was checked after adjustment (Table 1).For the purpose of illustration, the method of Kaplan andMeier was used to estimate prostate cancer–specific andoverall mortality according to number of PSA tests beforeprostate cancer diagnosis. All tests were considered statisti-cally significant at α ¼ 0.05. All analyses were performedwith SAS version 9.2 (SAS Institute, Cary, NC).
3. Results
The characteristics of the study population are shown inTable 1, and mean follow-up was 5.4 years following prostatecancer diagnosis. The incidence of foregoing PSA screeningwas less common among those who are older and havesignificant comorbidities, Black race, unmarried, lower socio-economic status, live in rural or in the South, and do notundergo other preventative screenings. After propensity scorematching, there was no significant difference of the frequencyof PSA testing in terms of the aforementioned variables.
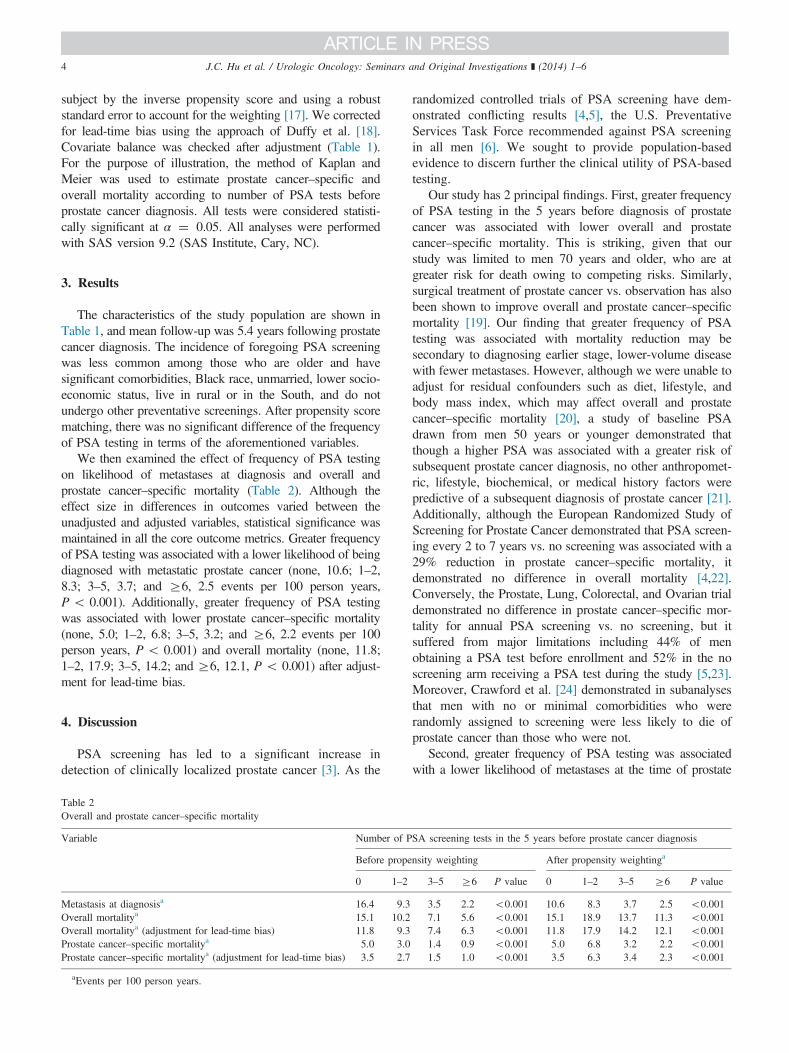
We then examined the effect of frequency of PSA testingon likelihood of metastases at diagnosis and overall andprostate cancer–specific mortality (Table 2). Although theeffect size in differences in outcomes varied between theunadjusted and adjusted variables, statistical significance wasmaintained in all the core outcome metrics. Greater frequencyof PSA testing was associated with a lower likelihood of beingdiagnosed with metastatic prostate cancer (none, 10.6; 1–2,8.3; 3–5, 3.7; and Z6, 2.5 events per 100 person years,P o 0.001). Additionally, greater frequency of PSA testingwas associated with lower prostate cancer–specific mortality(none, 5.0; 1–2, 6.8; 3–5, 3.2; and Z6, 2.2 events per 100person years, P o 0.001) and overall mortality (none, 11.8;1–2, 17.9; 3–5, 14.2; and Z6, 12.1, P o 0.001) after adjust-ment for lead-time bias.
4. Discussion
PSA screening has led to a significant increase indetection of clinically localized prostate cancer [3]. As the
Table 2Overall and prostate cancer–specific mortality
Variable Number of P
Before prope
0 1–2
Metastasis at diagnosisa 16.4 9.3Overall mortalitya 15.1 10.2Overall mortalitya (adjustment for lead-time bias) 11.8 9.3Prostate cancer–specific mortalitya 5.0 3.0Prostate cancer–specific mortalitya (adjustment for lead-time bias) 3.5 2.7
aEvents per 100 person years.
randomized controlled trials of PSA screening have dem-onstrated conflicting results [4,5], the U.S. PreventativeServices Task Force recommended against PSA screeningin all men [6]. We sought to provide population-basedevidence to discern further the clinical utility of PSA-basedtesting.
Our study has 2 principal findings. First, greater frequencyof PSA testing in the 5 years before diagnosis of prostatecancer was associated with lower overall and prostatecancer–specific mortality. This is striking, given that ourstudy was limited to men 70 years and older, who are atgreater risk for death owing to competing risks. Similarly,surgical treatment of prostate cancer vs. observation has alsobeen shown to improve overall and prostate cancer–specificmortality [19]. Our finding that greater frequency of PSAtesting was associated with mortality reduction may besecondary to diagnosing earlier stage, lower-volume diseasewith fewer metastases. However, although we were unable toadjust for residual confounders such as diet, lifestyle, andbody mass index, which may affect overall and prostatecancer–specific mortality [20], a study of baseline PSAdrawn from men 50 years or younger demonstrated thatthough a higher PSA was associated with a greater risk ofsubsequent prostate cancer diagnosis, no other anthropomet-ric, lifestyle, biochemical, or medical history factors werepredictive of a subsequent diagnosis of prostate cancer [21].Additionally, although the European Randomized Study ofScreening for Prostate Cancer demonstrated that PSA screen-ing every 2 to 7 years vs. no screening was associated with a29% reduction in prostate cancer–specific mortality, itdemonstrated no difference in overall mortality [4,22].Conversely, the Prostate, Lung, Colorectal, and Ovarian trialdemonstrated no difference in prostate cancer–specific mor-tality for annual PSA screening vs. no screening, but itsuffered from major limitations including 44% of menobtaining a PSA test before enrollment and 52% in the noscreening arm receiving a PSA test during the study [5,23].Moreover, Crawford et al. [24] demonstrated in subanalysesthat men with no or minimal comorbidities who wererandomly assigned to screening were less likely to die ofprostate cancer than those who were not.
Second, greater frequency of PSA testing was associatedwith a lower likelihood of metastases at the time of prostate
SA screening tests in the 5 years before prostate cancer diagnosis
nsity weighting After propensity weightinga
3–5 Z6 P value 0 1–2 3–5 Z6 P value
3.5 2.2 o0.001 10.6 8.3 3.7 2.5 o0.0017.1 5.6 o0.001 15.1 18.9 13.7 11.3 o0.0017.4 6.3 o0.001 11.8 17.9 14.2 12.1 o0.0011.4 0.9 o0.001 5.0 6.8 3.2 2.2 o0.0011.5 1.0 o0.001 3.5 6.3 3.4 2.3 o0.001
J.C. Hu et al. / Urologic Oncology: Seminars and Original Investigations ] (2014) 1–6 5
cancer diagnosis. These findings corroborate the expectedstage migration observed with widespread PSA screening [25].The percentage of men with newly diagnosed metastaticprostate cancer has declined from 25% in 1980 to 4% in2002 [25] with resultant decrease in prostate cancer–specificmortality by 4.1% annually between 1994 and 2006 [26]. Ithas been previously demonstrated that when compared withyounger patients (o75 y old), older patients are more likely topresent with metastatic disease and prostate cancer–specificmortality despite increased comorbidities [27]. Our results lendsupport to investigate screening methods that will identify andtreat clinically significant prostate cancers before metastases.
Although our findings are policy relevant, they must beinterpreted in the context of the study design. First, SEER-Medicare is limited to men aged 65 years or older, and ourresults may not be generalizable to younger men undergoingPSA-based screening. Second, our follow-up was relativelymodest, considering prior studies have demonstrated longerfollow-up is needed to see a survival benefit [22,28]. In termsof treatment benefit, the Scandinavian Prostate Cancer Studyhas shown with 15 years of follow-up that prostate cancer–specific mortality and all-cause mortality are lower in mentreated surgically compared with watchful waiting [19]. Theseresults were more pronounced in men younger than 65 years.Thus, our results may underestimate the actual survival benefitsassociated with PSA testing before diagnosis and treatment forprostate cancer. Lastly, although we attempted to control forknown predictors for prostate cancer–specific mortality, thefindings are hypothesis generating, and it is expected that therewill be greater clarification regarding the role of PSA screeningwith longer follow-up from the current randomized controlledtrials. Finally, observational studies reflect practice patterns,and when compared with results from well-conducted random-ized controlled trials, they do not appear to overestimatetreatment effects nor differ qualitatively [29].
5. Conclusions
In conclusion, the intensity of PSA-based testing in men70 years or older before a diagnosis of prostate cancer wasassociated with lower likelihood of being diagnosed withmetastatic prostate cancer and improved overall and pros-tate cancer–specific survival. These findings must be bal-anced when considering health care reform initiatives toimprove quality of care.
Acknowledgment
The authors acknowledge the efforts of the AppliedResearch Program, NCI; the Office of Research, Develop-ment and Information, CMS; Information ManagementServices (IMS), Inc.; and the Surveillance, Epidemiology,and End Results (SEER) Program tumor registries in thecreation of the SEER-Medicare database.
References
[1] Siegel R, Naishadham D, Jemal A. Cancer statistics, 2012. CACancer J Clin 2012;62:10–29.
[2] Leonhardt D. In health reform, a cancer offer an acid test. New YorkTimes: 2009.
[3] Potosky AL, Miller BA, Albertsen PC, Kramer BS. The role ofincreasing detection in the rising incidence of prostate cancer. J AmMed Assoc 1995;273:548–52.
[4] Schroder FH, Hugosson J, Roobol MJ, et al. Prostate-cancer mortalityat 11 years of follow-up. N Engl J Med 2012;366:981–90.
[5] Andriole GL, Crawford ED, Grubb RL 3rd, et al. Mortality resultsfrom a randomized prostate-cancer screening trial. N Engl J Med2009;360:1310–9.
[6] Chou R, LeFevre ML. Prostate cancer screening—the evidence, therecommendations, and the clinical implications. J Am Med Assoc2011;306:2721–2.
[7] Lewis JH, Kilgore ML, Goldman DP, et al. Participation of patients65 years of age or older in cancer clinical trials. J Clin Oncol2003;21:1383–9.
[8] Murthy VH, Krumholz HM, Gross CP. Participation in cancer clinicaltrials: race-, sex-, and age-based disparities. J Am Med Assoc2004;291:2720–6.
[9] Gross CP, Mallory R, Heiat A, Krumholz HM. Reporting therecruitment process in clinical trials: who are these patients andhow did they get there? Ann Intern Med 2002;137:10–6.
[10] Warren JL, Klabunde CN, Schrag D, Bach PB, Riley GF. Overviewof the SEER-Medicare data: content, research applications, andgeneralizability to the United States elderly population. Med Care2002;40(Suppl. 8):IV-3–IV-18.
[11] Klabunde CN, Potosky AL, Legler JM, Warren JL. Development of acomorbidity index using physician claims data. J Clin Epidemiol2000;53:1258–67.
[12] Rosenbaum PR, Rubin DB. Reducing bias in observational studies usingsubclassification on the propensity score. J Am Stat Assoc 1984;79:516–524.
[13] Rubin DB. Estimating causal effects from large data sets usingpropensity scores. Ann Intern Med 1997;127(8 Pt 2):757–63.
[14] Robins JM, Hernan MA, Brumback B. Marginal structural models andcausal inference in epidemiology. Epidemiology 2000;11:550–60.
[15] Rao JN, Scott AJ. The analysis of categorical data from complexsurveys: chi-squared tests for goodness of fit and independence intwo-way tables. J Am Stat Assoc 1981;76:221–30.
[16] Laird NM, Olivier D. Covariance analysis of censored survival datausing log-linear analysis techniques. J Am Stat Assoc 1981;76:231–240.
[17] Binder DA. On the variances of asymptotically normal estimatorsfrom complex surveys. Surv Methodol 1981;7:157–70.
[18] Duffy SW, Nagtegaal ID, Wallis M, et al. Correcting for lead timeand length bias in estimating the effect of screen detection on cancersurvival. Am J Epidemiol 2008;168:98–104.
[19] Bill-Axelson A, Holmberg L, Ruutu M, et al. Radical prostatectomyversus watchful waiting in early prostate cancer. N Engl J Med2011;364:1708–17.
[20] Brawley OW. Prostate cancer epidemiology in the United States.World J Urol 2012;30:195–200.
[21] Lilja H, Ulmert D, Bjork T, et al. Long-term prediction of prostatecancer up to 25 years before diagnosis of prostate cancer using prostatekallikreins measured at age 44 to 50 years. J Clin Oncol 2007;25:431–6.
[22] Schroder FH, Hugosson J, Roobol MJ, et al. Screening and prostate-cancer mortality in a randomized European study. N Engl J Med2009;360:1320–8.
[23] Andriole GL, Crawford ED, Grubb RL 3rd, et al. Prostate cancerscreening in the randomized Prostate, Lung, Colorectal, and OvarianCancer Screening Trial: mortality results after 13 years of follow-up.J Natl Cancer Inst 2012;104:125–32.

J.C. Hu et al. / Urologic Oncology: Seminars and Original Investigations ] (2014) 1–66
[24] Crawford ED, Grubb R 3rd, Black A, et al. Comorbidity andmortality results from a randomized prostate cancer screening trial.J Clin Oncol 2010;29:355–61.
[25] Etzioni R, Gulati R, Falcon S, Penson DF. Impact of PSA screening onthe incidence of advanced stage prostate cancer in the United States:a surveillance modeling approach. Med Decis Making 2008;28:323–31.
[26] Jemal A, Siegel R, Xu J, Ward E. Cancer statistics, 2010. CA CancerJ Clin 2010;60:277–300.
[27] Scosyrev E, Messing EM, Mohile S, Golijanin D, Wu G. Prostatecancer in the elderly: frequency of advanced disease at presentationand disease-specific mortality. Cancer 2012;118:3062–70.
[28] Hugosson J, Carlsson S, Aus G, et al. Mortality results from theGoteborg randomised population-based prostate-cancer screeningtrial. Lancet Oncol 2010;11:725–32.
[29] Benson K, Hartz AJ. A comparison of observational studies andrandomized, controlled trials. N Engl J Med 2000;342:1878–86.


![Extended use of Prostate Health Index and …...336 Extended use of Prostate Health Index and percentage of [-2]pro-prostate-specific antigen in Chinese men with prostate specific](https://img.pdfslide.us/doc/110x75/5e9ab4b7a3f0f80d994e4c8a/extended-use-of-prostate-health-index-and-336-extended-use-of-prostate-health.jpg)