Embed Size (px)
Citation preview

Population ageing and health care expenditure:
a school of ‘red herrings’?
Stefan Felder University of Magdeburg, ISMHE
LTC-conference Mannheim October 20-21, 2005

ISMHEUniversität Magdeburg
Mannheim 2
Overview
1. Introduction
2. Part I: Replication of previous work with extended data
3. Part II: Decomposition of total HCE
4. Discussion and summary /1
5. Part III: Prognosis of future health care expenditure
6. Discussion and summary /2

ISMHEUniversität Magdeburg
Mannheim 3
Introduction /1
• Average HCE rises with age– Age or– Time to death (TTD) main driver of health care costs?
• Difficult to separate age effect from proximity to death – Strong positive relationship between both– Econometric problems with Heckit-approach– In particular when analyzing HCE towards the end of life

ISMHEUniversität Magdeburg
Mannheim 4
Introduction /2
Previous work by Zweifel, Felder & Co. – Red herring paper (HE, 1999): small sample of deceased
persons, Analysis of HCE towards the end of life.– Geneva Papers on Risk and Insurance: Issues and Practice,
2004: Analysis of HCE of deceased and survivors in a given year (1999)Maximum value of TTD of 42 months (3.5 years)
– Result: TTD is main driver of HCE but not age

ISMHEUniversität Magdeburg
Mannheim 5
Introduction /3
This paper• Part I
– Analysis of total HCE of deceased and survivors in a given year (1999)
– Maximum value of time to death of 60 months• Part II
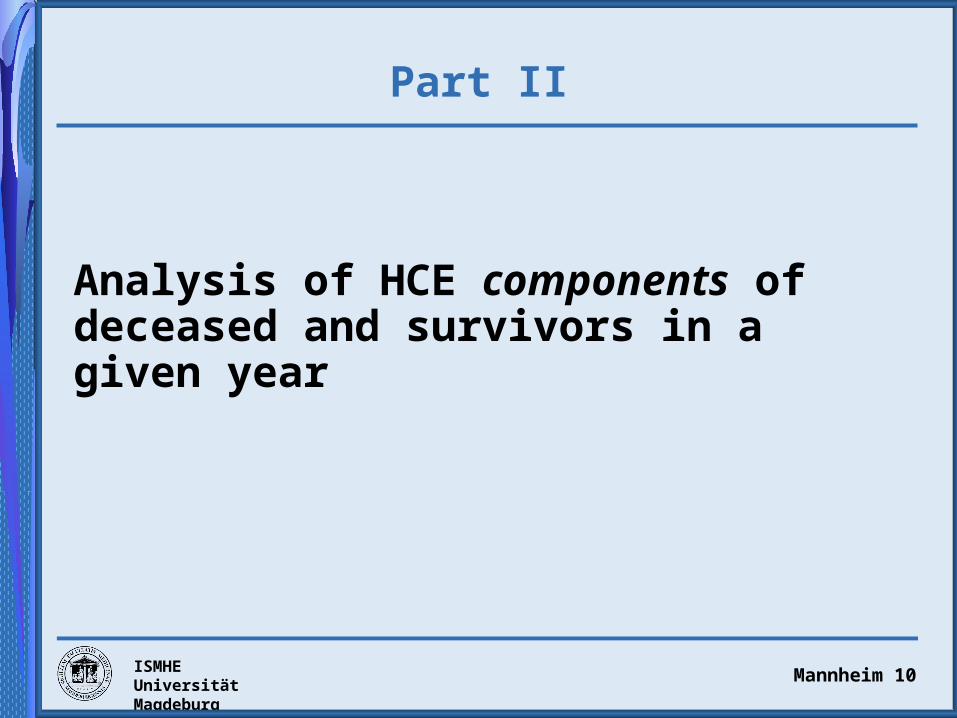
– Analysis of HCE components of deceased and survivors in a given year
– Maximum value of TTD of 60 months– Is there ‘a school of red herrings’?
• Part III– Prognosis of future HCE with model from part I

ISMHEUniversität Magdeburg
Mannheim 6
Part I
Replication of previous work but with– more observation for the deceased– and slightly different specification

ISMHEUniversität Magdeburg
Mannheim 7
Part I / Data
0.490.400.490.41Share of men (SEXM)
SEMeanSEMeanVariable
0>601729TTD in months14.3954.0913.2375.78Age
5,2772,79514,07111,567Total HCE in 1999 (CHF)
57,0855,075Observations
SurvivorsDeceased
2000-2004
Descriptive statistics

ISMHEUniversität Magdeburg
Mannheim 8
Part I / Model
2-stage model: 1. Probit for Pr (HCE>0)
2. OLS estimation for HCE | HCE > 0
• same regressors for the first and second stage• r.h.s variables: TTD, Age, Age^2, Age^3, SEXM, SEXM*Age,
Death, Death * Age plusvariables describing region, choice of deductibleand suppl. insurance

ISMHEUniversität Magdeburg
Mannheim 9
Part I / Results
0
2000
4000
6000
8000
10000
12000
30 35 40 45 50 55 60 65 70 75 80 85 90 95Age
E(HCE) deceased E(HCE) survivors E(HCE) naïve
Exp. HCE of surviving and deceased men as a function of age
•No age effect for deceased men
•Pos. age effect for survived men only between 55 and 70
•Results confirmed by bootstrap
•strong TTD effect
ISMHEUniversität Magdeburg
Mannheim 10
Part II
Analysis of HCE components of deceased and survivors in a given year

ISMHEUniversität Magdeburg
Mannheim 11
Part II / Data
1,426
6603,2401,750Prescription drugs (Drugs)
SEMeanSEMean
Variable
2,9115448,3163,261Hospital inpatient care (HIP)427242,299460Home care (HC)
1,326908,0343,291Nursing home care (NHC)
SurvivorsDeceased
Descriptive statistics/1
Ambulatory care (AC) 1,395 2,725 1,416918
1,5072824,170871Hospital outpatient care (HOP)
279539 Other services (OS) 7381,272
Components of HCE (in CHF)
ISMHEUniversität Magdeburg
Mannheim 12
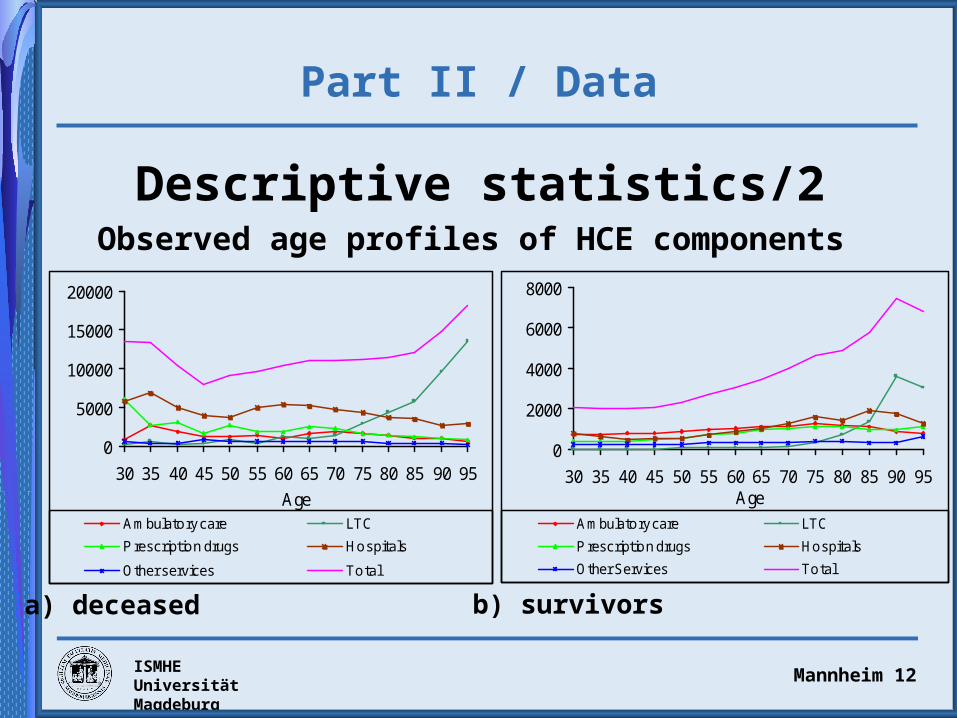
Part II / Data
Descriptive statistics/2Observed age profiles of HCE components
0
5000
10000
15000
20000
30 35 40 45 50 55 60 65 70 75 80 85 90 95
Age
Ambulatory care LTC
P rescription drugs Hospitals
Other services Total
0
2000
4000
6000
8000
30 35 40 45 50 55 60 65 70 75 80 85 90 95Age
Ambulatory care LTC
P rescription drugs Hospitals
Other Services Total
a) deceased b) survivors

ISMHEUniversität Magdeburg
Mannheim 13
Part II / Model
3-stage model: 1. Probit for Pr (LTC>0)
(LTC > 0 = NHC > 0 v HC > 0)
2. Multivariate probit for Pr (HCEj > 0)
3. SUR estimation for HCEj | HCEj > 0
• j = AC, Drug, HOP, HIP, NHC, HC, OS
• Second and third stage for LTC and non-LTC users separately
• r.h.s variables: TTD, Age, Age^2, Age^3, SEXM, SEXM*Age,
Death, Death *Age +variables describing region, deductible and suppl. ins.

ISMHEUniversität Magdeburg
Mannheim 14
Part IIPrevalence of LTC
0.0
0.1
0.2
0.3
0.4
0.5
30 40 50 60 70 80 90Age
Pr
Pr(LTC>0) deceased Pr(LTC>0) survivorsPr(LTC>0) naïve
Probability of LTC > 0 of surviving and deceased men
•Strong positive age effect
•Small negative TTD effect
•But TTD is important

ISMHEUniversität Magdeburg
Mannheim 15
Part II /Age effects in non-LTC patients
0
2,000
4,000
6,000
8,000
10,000
30 40 50 60 70 80 90Age
HC
E in
SFr
AC Drugs HOP HIP OS Total
Expected outlays for acute HCE components for deceased and surviving men
0
1,000
2,000
3,000
4,000
30 40 50 60 70 80 90Age
HC
E in
SFr
AC Drugs HOP HIP OS Total
deceased survivors

ISMHEUniversität Magdeburg
Mannheim 16
Part IIAge effects in LTC patients
0
2,000
4,000
6,000
8,000
10,000
12,000
14,000
30 40 50 60 70 80 90Age
HC
E in
SFr
NHC_deceased NHC_survivorsHC_deceased HC_survivors
Conditional and expected outlays for nursing home care (NHC) and home care (HC) of deceased and surviving men
0
1,000
2,000
3,000
4,000
30 40 50 60 70 80 90Age
HC
E in
SFr
NHC_deceased NHC_survivorsHC_deceased HC_survivors
HCE | HCE > 0 LTC > 0 E(HCE)
ISMHEUniversität Magdeburg
Mannheim 17
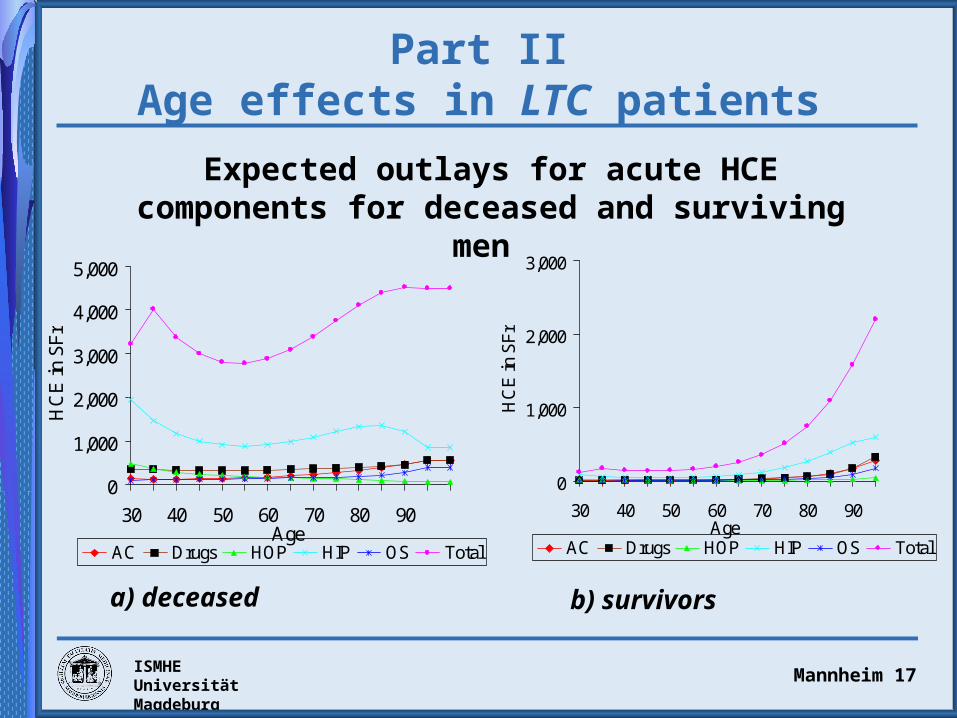
Part IIAge effects in LTC patients
0
1,000
2,000
3,000
4,000
5,000
30 40 50 60 70 80 90Age
HC
E in
SF
r
AC Drugs HOP HIP OS Total
Expected outlays for acute HCE components for deceased and surviving men
0
1,000
2,000
3,000
30 40 50 60 70 80 90Age
HC
E in
SF
r
AC Drugs HOP HIP OS Total
a) deceased b) survivors

ISMHEUniversität Magdeburg
Mannheim 18
Discussion and summary /1
Methodology
• Decomposition of HCE in its components
• Multivariate probit and SUR estimation to account for correlation between components
Empirical results
• Non-LTC patients:
– Decreasing age profile for all HCE components among the deceased
– Outlays for ambulatory care, drugs and inpatient care among
survivors rise with age

ISMHEUniversität Magdeburg
Mannheim 19
Discussion and summary /2
... Empirical results• LTC patients
– Pos. age gradient for nursing home and home care - for deceased as well as for survivors (due to a rising prevalence)
– Outlays for acute HCE:deceased: small pos. age effect for ambulatory care and drugssurvivors: small pos. age effect for all components of acute HCE
Conclusion• Most components of HCE are driven not by age but by TTD• Exception: outlays for LTC patients
There is a school of ´red herrings`!

ISMHEUniversität Magdeburg
Mannheim 20
Part III
Forcast of future HCE for Switzerland 2000-2060 using
– Model from part I – Age specific survival rates– Population forecasts of the Swiss
Statistical Office

ISMHEUniversität Magdeburg
Mannheim 21
Part III
Competing hypotheses:a) Status-quo hypothesis: age-specific per-capita expenditures
depend only on medical technology.
b) Expansion-of-morbidity hypothesis: prolonging life means prolonging morbidity and increasing costs
c) Time-to-death hypothesis: health care expenditures are determined by proximity to death. “Compression of morbidity” effect: sickness gets compressed in a shorter and shorter period

ISMHEUniversität Magdeburg
Mannheim 22
Part IIITwo models
1) n-model: based on “naïve” regression
2) q-model: based on regressions including survival status

ISMHEUniversität Magdeburg
Mannheim 23
Part IIIAge profile of HCE
0
4,000
8,000
12,000
16,000
30 50 70 90Age
HC
E in
SF
r
deceased_0 Deceased_1 deceased_2 deceased_3deceased_4 survivors naiv
Predicted expenditure for men

ISMHEUniversität Magdeburg
Mannheim 24
Part IIIHCE with constant medical technology
n-model q-model Error of n-model in %Year Absolute 2000=100 Absolute 2000=100
2000 2,155 100 2,155 100 0
2005 2,182 101.23 2,175 100.92 24.85
2010 2,217 102.85 2,205 102.32 18.54
2020 2,301 106.76 2,276 105.61 17.12
2030 2,388 110.80 2,348 108.96 17.04
2040 2,451 113.72 2,400 111.37 17.13
2050 2,471 114.65 2,414 112.00 18.14
2060 2,451 113.74 2,381 110.50 23.58

ISMHEUniversität Magdeburg
Mannheim 25
Part IIIHCE with 1% medical progress
n-model q-model Error of n-model
in %Year Absolute 2000=100 Absolute 2000=100
2000 2,155 100 2,155 100 0
2005 2,293 106.39 2,286 106.07 5.02
2010 2,448 113.61 2,436 113.02 4.28
2020 2,808 130.27 2,777 128.86 4.67
2030 3,219 149.34 3,165 146.86 5.03
2040 3,649 169.31 3,574 165.81 5.05
2050 4,064 188.56 3,970 184.19 4.94
2060 4,453 206.63 4,326 200.74 5.52

ISMHEUniversität Magdeburg
Mannheim 26
Part IIIDiscussion
• Small demographic effect in the forecast of future health care expenditure (index in 2060 = 114)
• The cost-of-dying effect reduces the forecast of future expenditure (index in 2060 = 110)
• With growth factor “technology change” of 1% per annum the increase of per-capita expenditure is stronger (index in 2060 = 207, resp. 201)
=> cost-of-dying effect is small in comparison to the effect of technology changes

ISMHEUniversität Magdeburg
Mannheim 27
Summary
1. Purely demographic growth of per-capita HCE is not really dramatic.
2. The (strong) time-to-death hypothesis, which claims that ageing as such will have no positive effect on HCE, is not confirmed.
3. Explicit distinction between expenditures of survivors and those of decedents reduces the growth forecast only by one-fourth.
4. Accounting for costs in the last years of life leads to a downward correction of the demographic impact on HCE, as compared to a calculation on the basis of crude age-specific HCE.
5. Impact of medical progress on HCE is much greater than the error in the forecast of ageing.