Embed Size (px)
Citation preview
Population Ageing – A Threat to the
Welfare State?
Tommy Bengtsson
Centre for Economic Demography
School of Economics and Management [email protected]
Eurostat/UNECE Work Session on Demographic Projections,
Rome, 2013-10-29
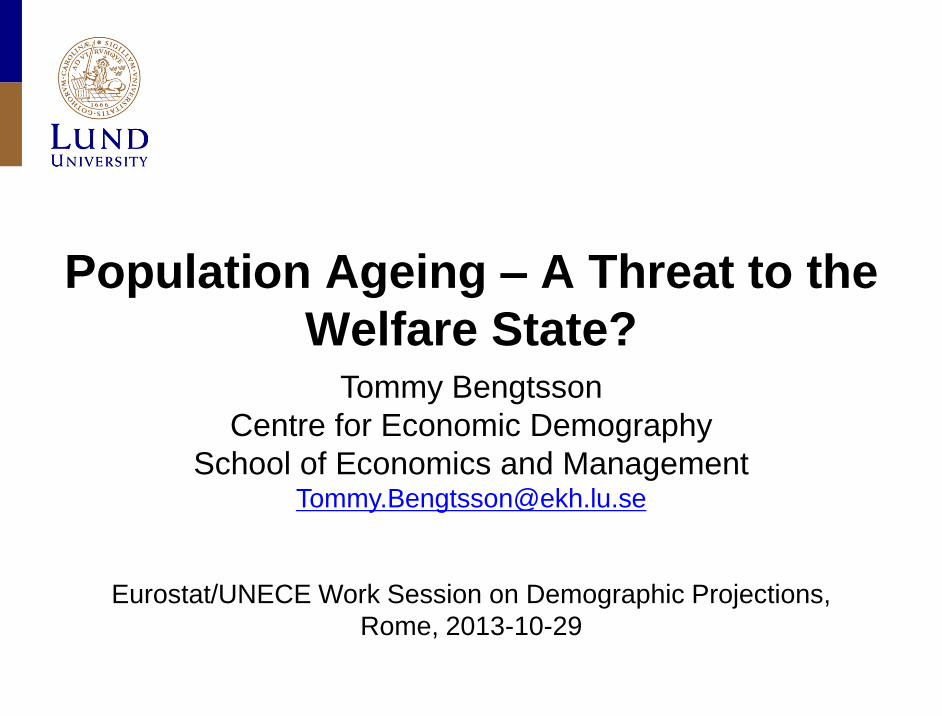
OECD 2009
Global ageing 2000 and 2050:
Elderly (65+) in relation to the labour force (20-64)
2
1
Lund University / Centre for Economic Demography
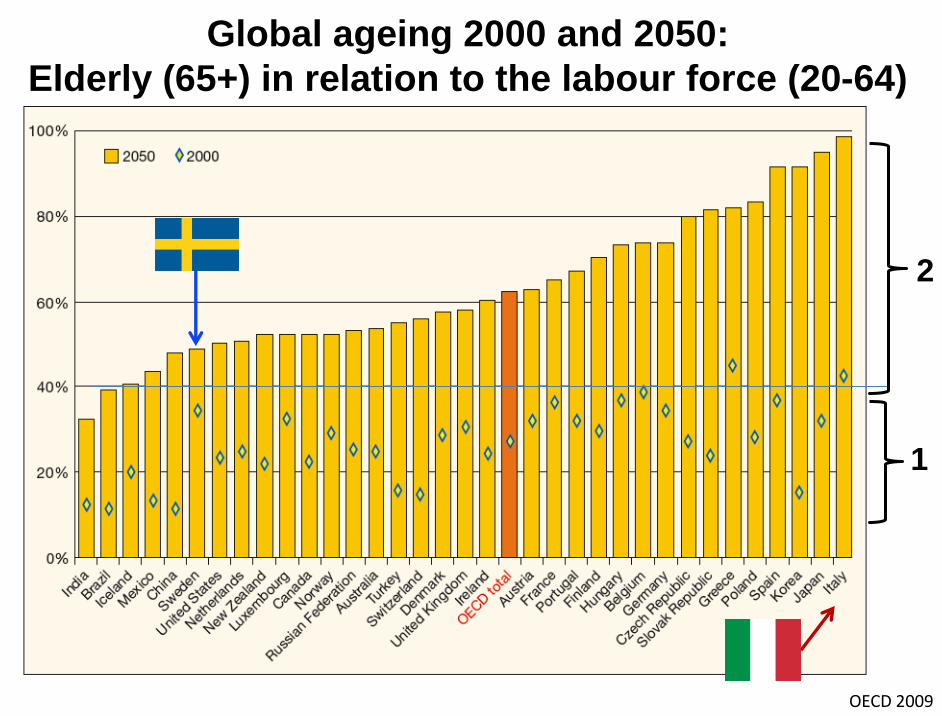
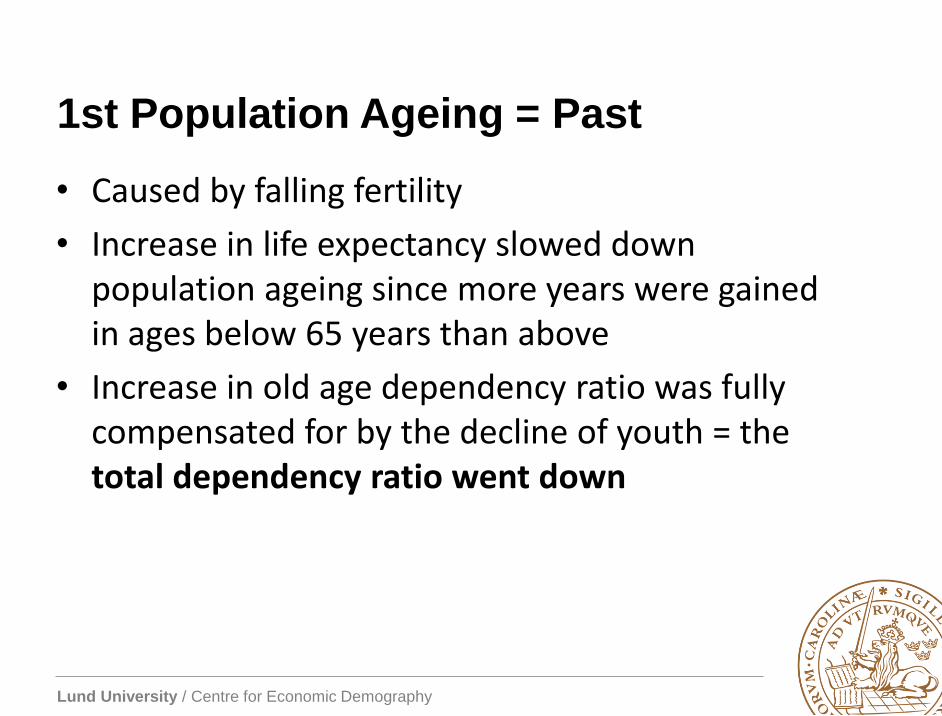
1st Population Ageing = Past
• Caused by falling fertility
• Increase in life expectancy slowed down population ageing since more years were gained in ages below 65 years than above
• Increase in old age dependency ratio was fully compensated for by the decline of youth = the total dependency ratio went down
Lund University / Centre for Economic Demography
2nd Population Ageing = Present
• Caused by reductions in mortality among the elderly
• Both old age and total dependency ratio will increase, the latter from 70 to 85 until 2050 in Sweden ( ~ 20 % increase)
• What are the consequences? To fully understand, we need to analyse consumption and production for each age group
Lund University / Centre for Economic Demography
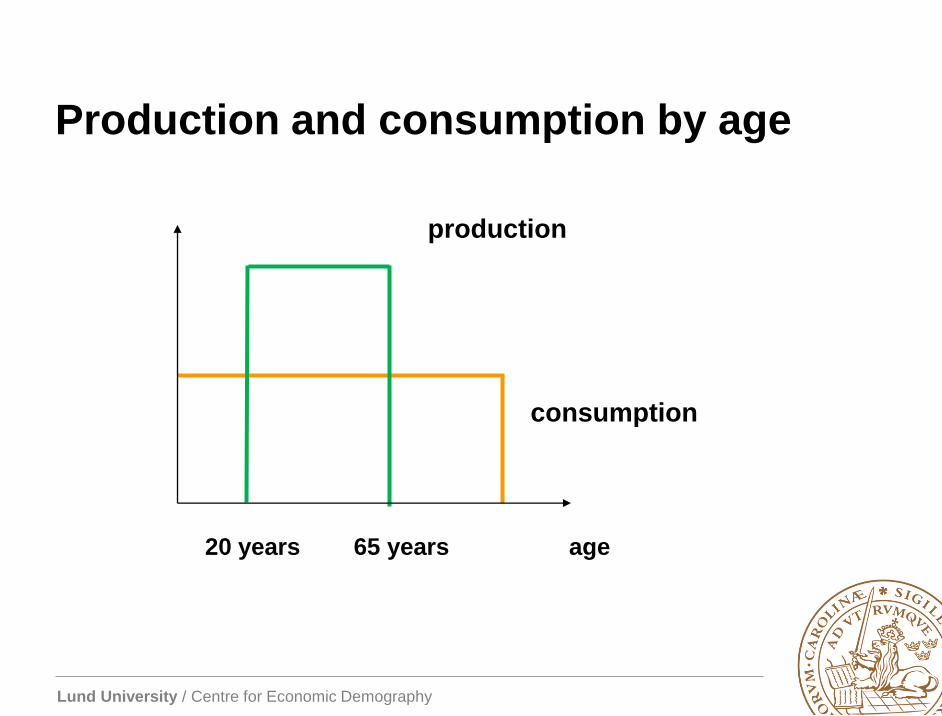
Production and consumption by age
production
consumption
20 years 65 years age
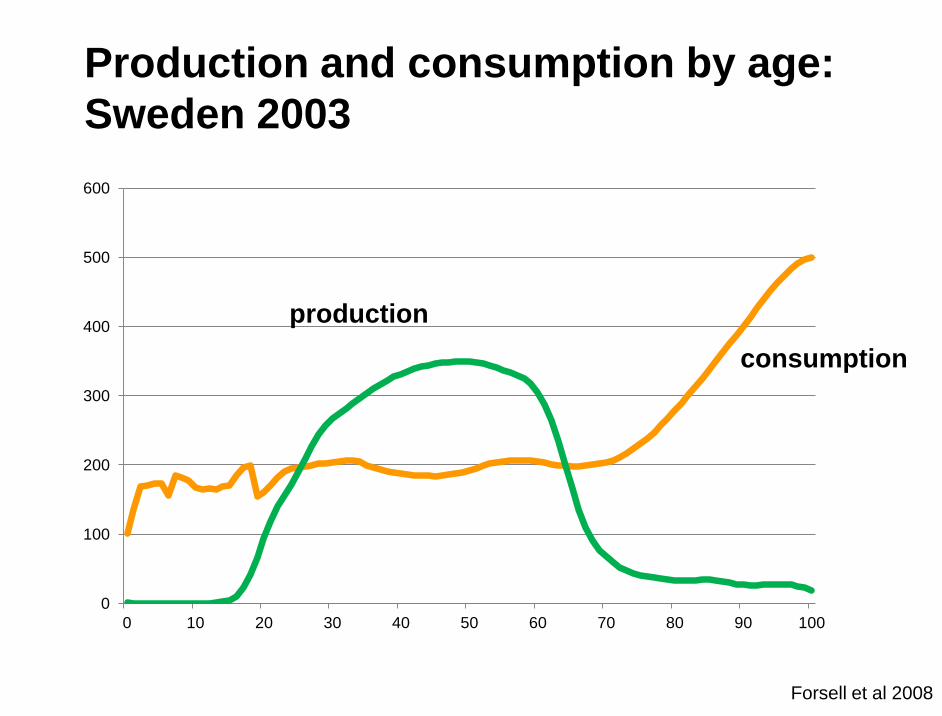
Production and consumption by age:
Sweden 2003
Forsell et al 2008
0
100
200
300
400
500
600
0 10 20 30 40 50 60 70 80 90 100
consumption
production
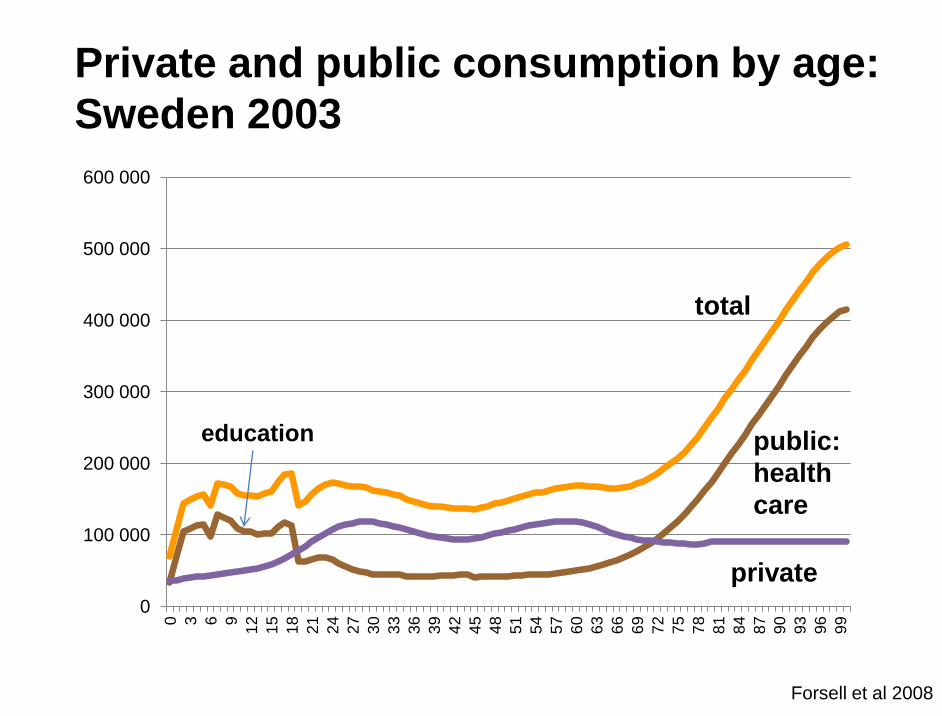
Private and public consumption by age:
Sweden 2003
0
100 000
200 000
300 000
400 000
500 000
600 000 0
3
6
9
12
15
18
21
24
27
30
33
36
39
42
45
48
51
54
57
60
63
66
69
72
75
78
81
84
87
90
93
96
99
total
public:
health
care
private
Forsell et al 2008
education
0
50
100
150
200
250
300
350
400
2005 2010 2015 2020 2025 2030 2035 2040 2045 2050
Aggre
gate
Life C
ycle
Deficit
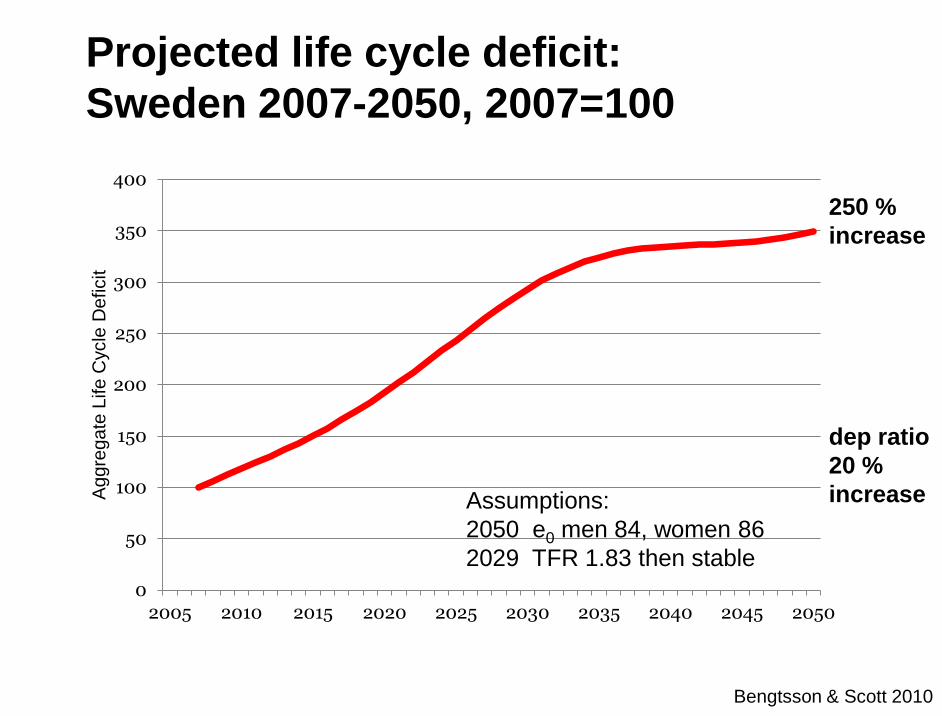
Projected life cycle deficit:
Sweden 2007-2050, 2007=100
Bengtsson & Scott 2010
250 %
increase
dep ratio
20 %
increase Assumptions:
2050 e0 men 84, women 86
2029 TFR 1.83 then stable
Lund University / Centre for Economic Demography
Increase in life cycle deficit
• Health care costs has been increasing by more than
1 % per year per capita in real value over recent
decades
• If it continues, then the life cycle deficit will grow with a
factor of at least 400 % instead of 250 % until 2050
• 0.3-0.5 percent annual increase in GDP/capita needed
to compensate
• Most of the change takes place within
the next 20 years
Lund University / Centre for Economic Demography
What can we do about it?
• Higher immigration?
• Higher fertility?
• Productivity increase?
• Increase in working hours?
• Reduced consumption?
Lund University / Centre for Economic Demography
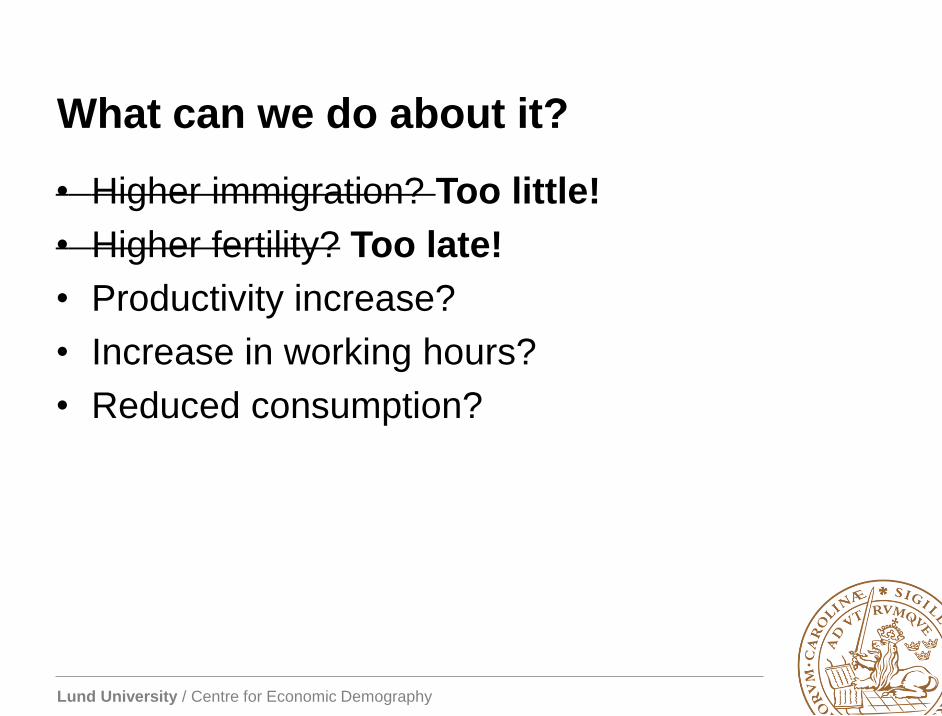
What can we do about it?
• Higher immigration? Too little!
• Higher fertility?
• Productivity increase?
• Increase in working hours?
• Reduced consumption?
Lund University / Centre for Economic Demography
What can we do about it?
• Higher immigration? Too little!
• Higher fertility? Too late!
• Productivity increase?
• Increase in working hours?
• Reduced consumption?
Lund University / Centre for Economic Demography
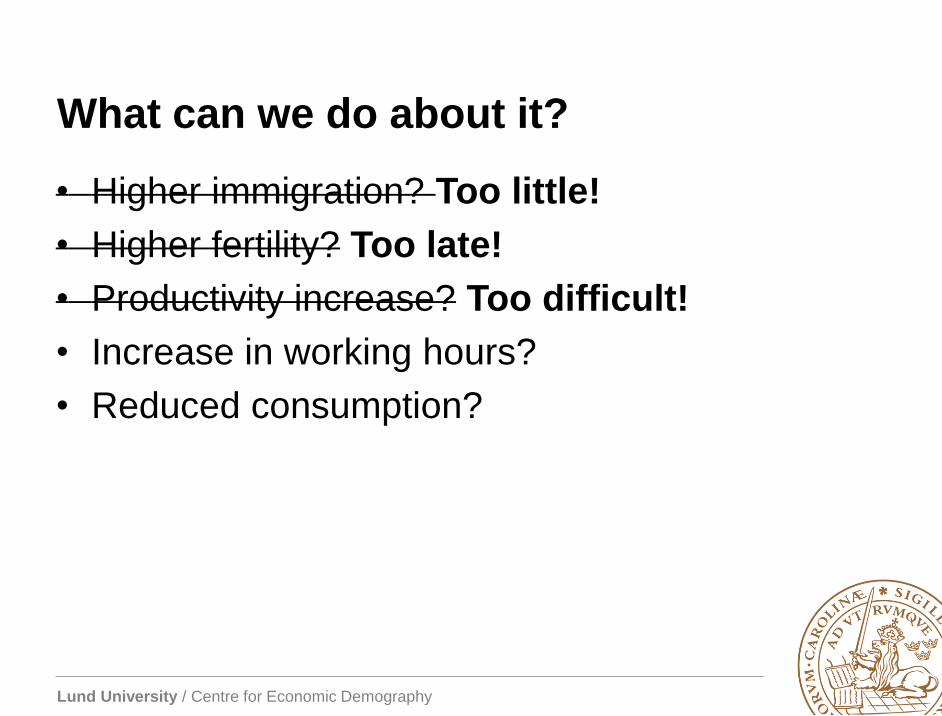
What can we do about it?
• Higher immigration? Too little!
• Higher fertility? Too late!
• Productivity increase? Too difficult!
• Increase in working hours?
• Reduced consumption?
Lund University / Centre for Economic Demography
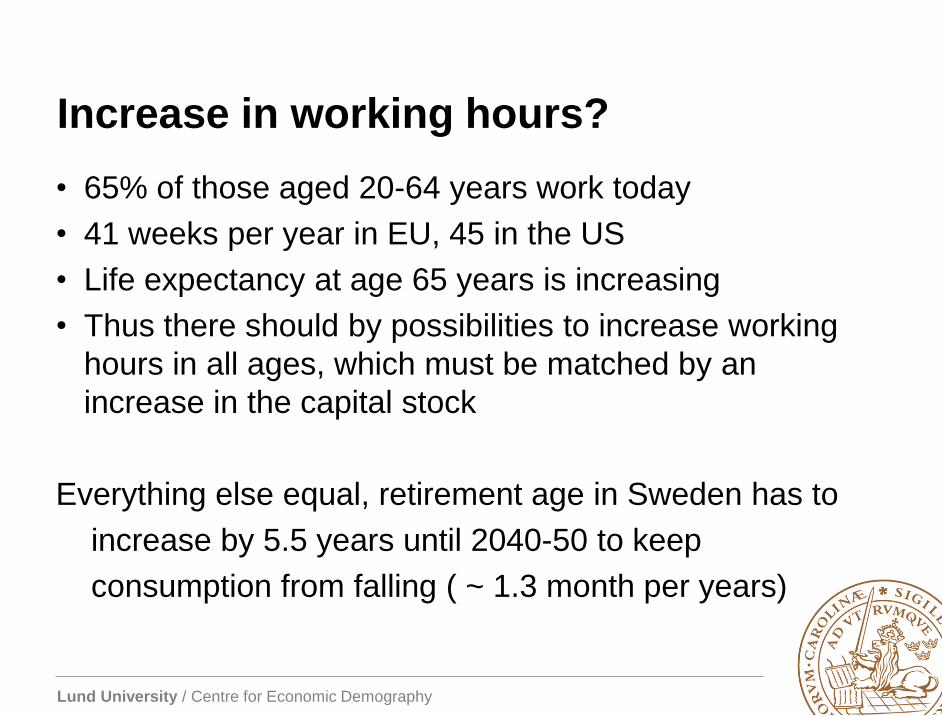
Increase in working hours?
• 65% of those aged 20-64 years work today
• 41 weeks per year in EU, 45 in the US
• Life expectancy at age 65 years is increasing
• Thus there should by possibilities to increase working
hours in all ages, which must be matched by an
increase in the capital stock
Everything else equal, retirement age in Sweden has to
increase by 5.5 years until 2040-50 to keep
consumption from falling ( ~ 1.3 month per years)
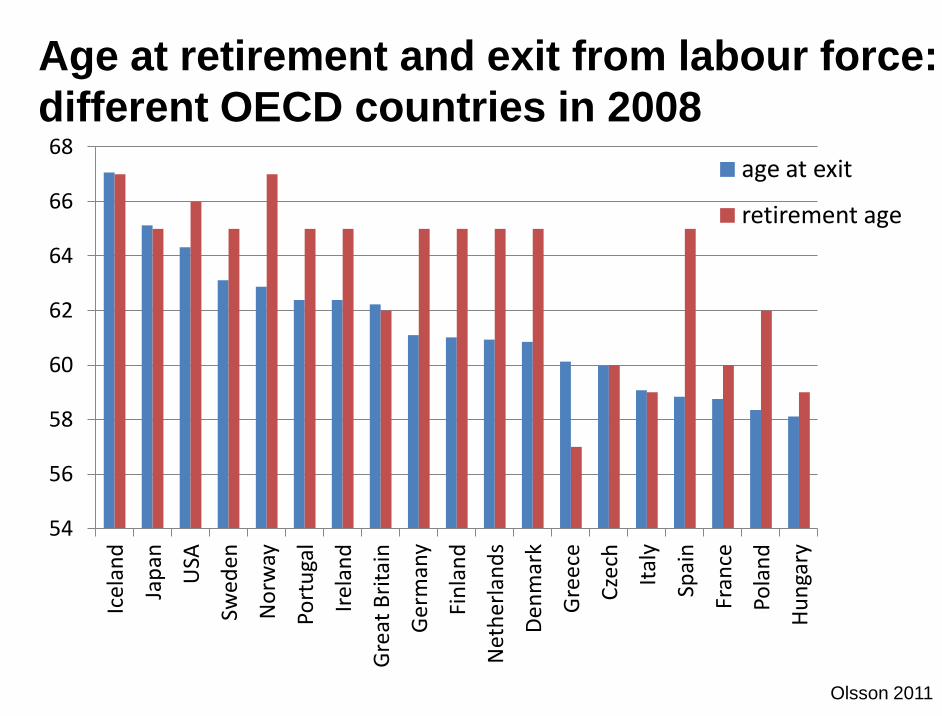
Age at retirement and exit from labour force:
different OECD countries in 2008
Olsson 2011
54
56
58
60
62
64
66
68
Icel
and
Jap
an
USA
Swed
en
No
rway
Port
uga
l
Irel
and
Gre
at B
rita
in
Ge
rman
y
Fin
lan
d
Net
her
lan
ds
Den
mar
k
Gre
ece
Cze
ch
Ital
y
Spai
n
Fran
ce
Pola
nd
Hu
nga
ry
age at exit
retirement age

Exit age for those working at age 50 years:
different OECD countries 1990-2010
Karlsson &
Olsson 2012
57
58
59
60
61
62
63
64
65
66
1990 1992 1994 1996 1998 2000 2002 2004 2006 2008 2010
Japan
Sweden
USA
Greece
Germany
Italy
France
Netherlands
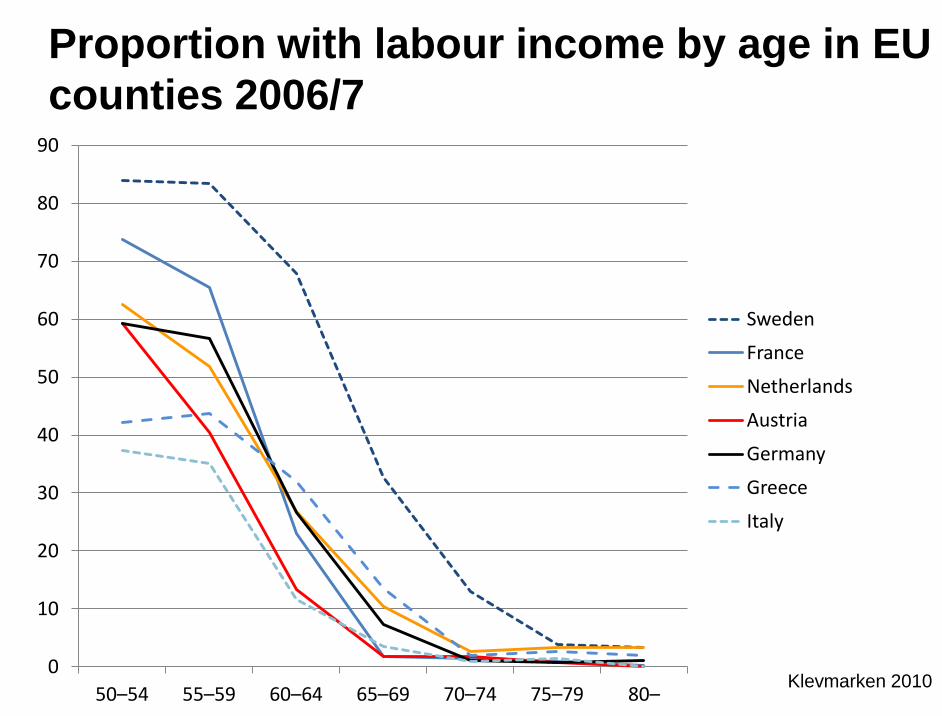
Proportion with labour income by age in EU
counties 2006/7
Klevmarken 2010 0
10
20
30
40
50
60
70
80
90
50–54 55–59 60–64 65–69 70–74 75–79 80–
Sweden
France
Netherlands
Austria
Germany
Greece
Italy
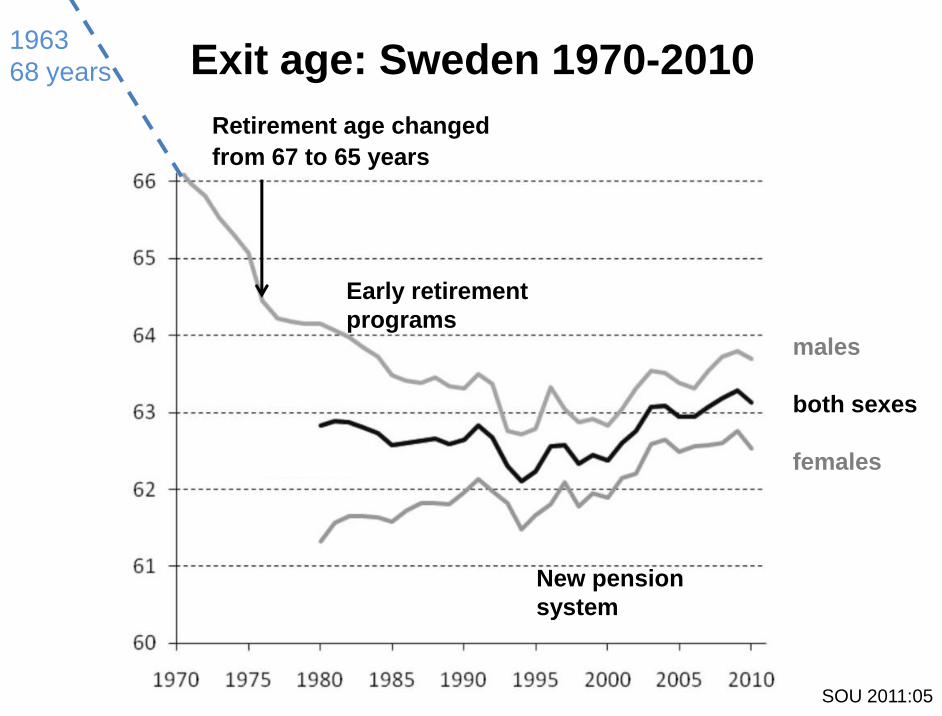
Exit age: Sweden 1970-2010
males
both sexes
females
Retirement age changed
from 67 to 65 years
SOU 2011:05
1963
68 years
Early retirement
programs
New pension
system
Lund University / Centre for Economic Demography
How much has the recent increase in age at
exit from the labour force affected income at
older ages?
Lund University / Centre for Economic Demography
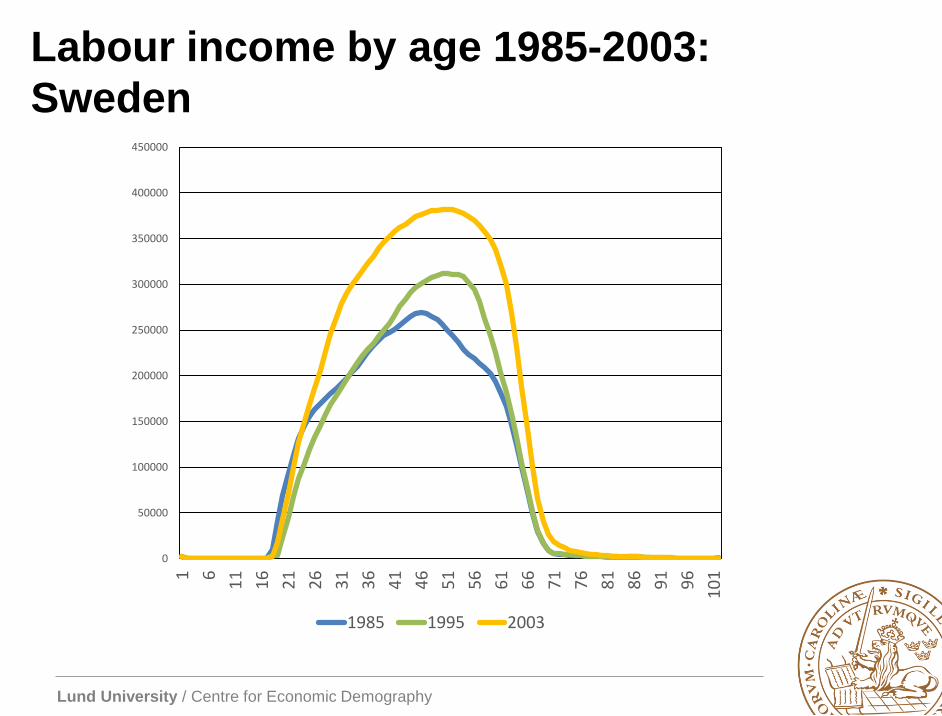
Haodong Qi forthcoming
Labour income by age 1985-2003:
Sweden
0
50000
100000
150000
200000
250000
300000
350000
400000
450000
1
6
11
16
21
26
31
36
41
46
51
56
61
66
71
76
81
86
91
96
10
1
1985 1995 2003
Lund University / Centre for Economic Demography
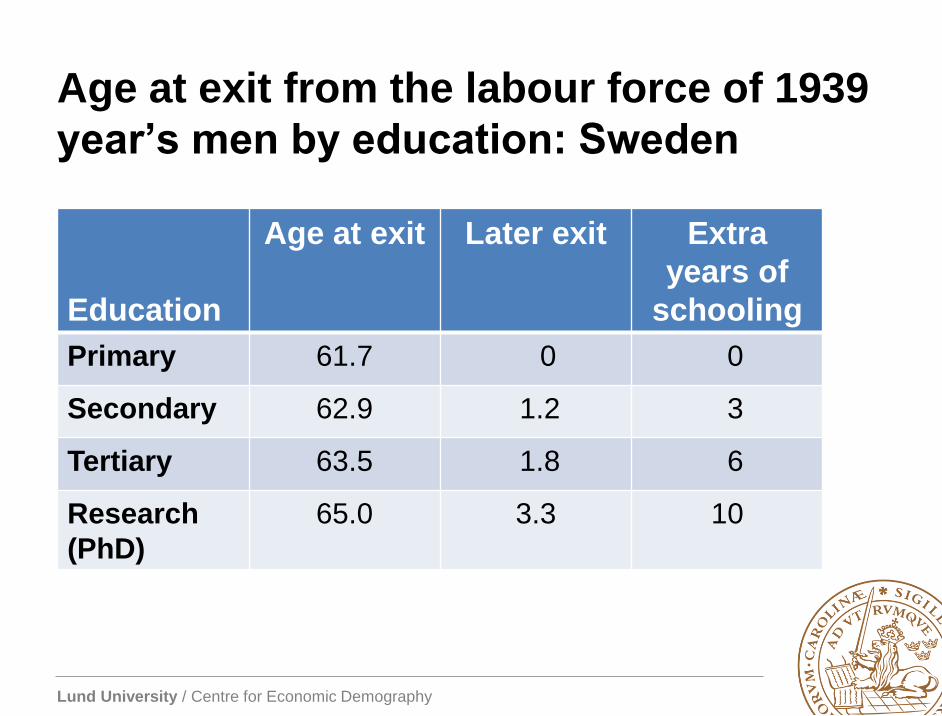
Age at exit from the labour force of 1939
year’s men by education: Sweden
Education
Age at exit Later exit Extra
years of
schooling
Primary 61.7 0 0
Secondary 62.9 1.2 3
Tertiary 63.5 1.8 6
Research
(PhD)
65.0 3.3 10
Lund University / Centre for Economic Demography
Will the present increase in age at exit from
the labour force solve the funding problem
of population ageing?
• Costs for the elderly goes also up
Lund University / Centre for Economic Demography
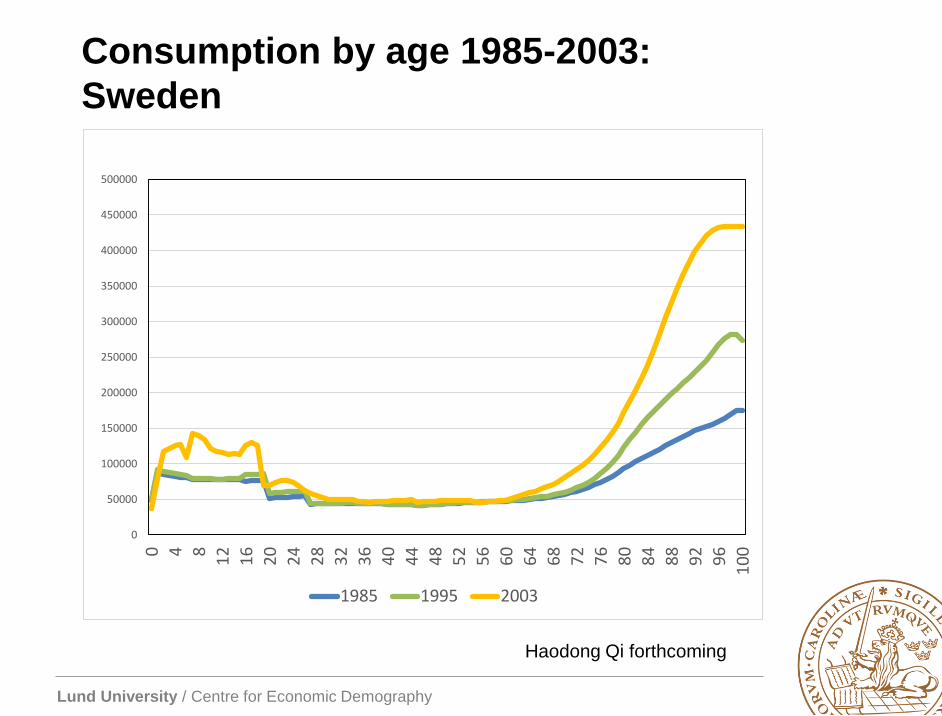
Haodong Qi forthcoming
Consumption by age 1985-2003:
Sweden
0
50000
100000
150000
200000
250000
300000
350000
400000
450000
500000
0
4
8
12
16
20
24
28
32
36
40
44
48
52
56
60
64
68
72
76
80
84
88
92
96
10
0
1985 1995 2003
Lund University / Centre for Economic Demography
Will the present increase in age at exit from
the labour force solve the funding problem
of population ageing?
• Costs for the elderly also goes up
• So does age at entry into labour force
Lund University / Centre for Economic Demography
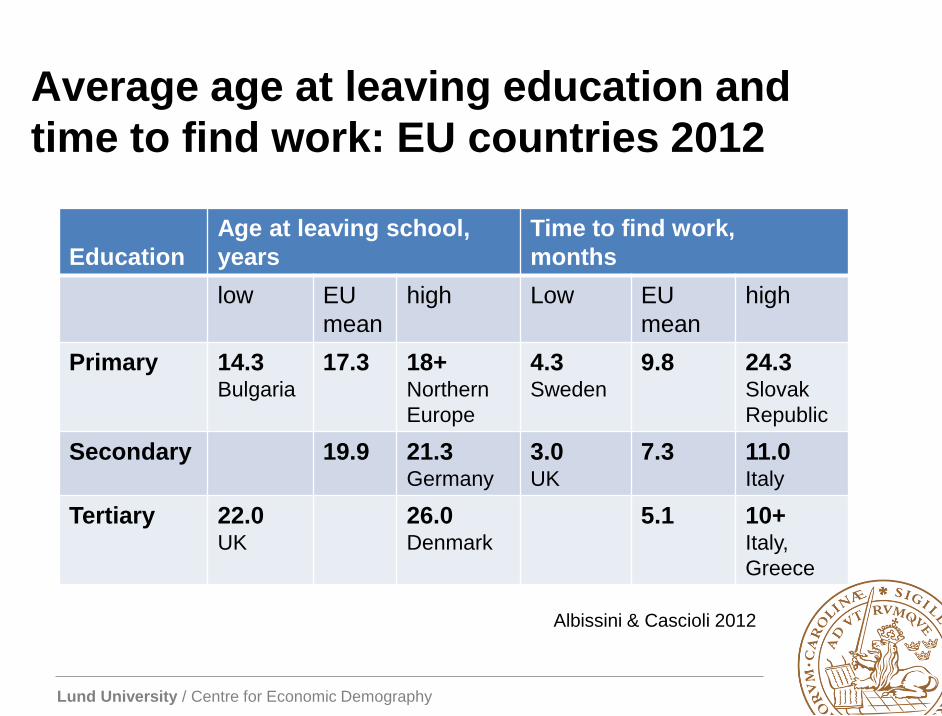
Average age at leaving education and
time to find work: EU countries 2012
Education
Age at leaving school,
years
Time to find work,
months
low EU
mean
high Low EU
mean
high
Primary 14.3 Bulgaria
17.3 18+ Northern
Europe
4.3 Sweden
9.8 24.3 Slovak
Republic
Secondary 19.9 21.3 Germany
3.0 UK
7.3 11.0 Italy
Tertiary 22.0 UK
26.0 Denmark
5.1 10+ Italy,
Greece
Albissini & Cascioli 2012
Lund University / Centre for Economic Demography
European challenges, welfare issues
• Pension systems need to be reformed
– Pay-as-you-go system supplemented by funded
systems. Stronger link between contributions and
benefits
– The Swedish system is contribution based with a break
at 11 % of GDP. Swedish system is stable from an
actuarial point of view, but pensions will decline unless
retirement age increase
• Social care systems need to be reformed
– Family versus public? Contribution based as well?
• Health care systems need to be reformed
– But is it really possible to make similar reforms
as in pension systems?
Lund University / Centre for Economic Demography
European challenges, labour market
issues
• Incentives and opportunities to work at older ages
• Life time learning instead of early retirement
programs
• Incentives and opportunities for young and
immigrants to get into the labour force faster
• Improvements in educational programs
• Shorten time to finding work by vocational training,
internship, etc
• Flexicurity?
• LABOUR DEMAND
Lund University / Centre for Economic Demography
Forecasting issues
• How sensitive are our forecasts of life cycles deficits to
mortality assumptions?
• How sensitive are they to assumptions on age-specific
production and consumption?
Lund University / Centre for Economic Demography
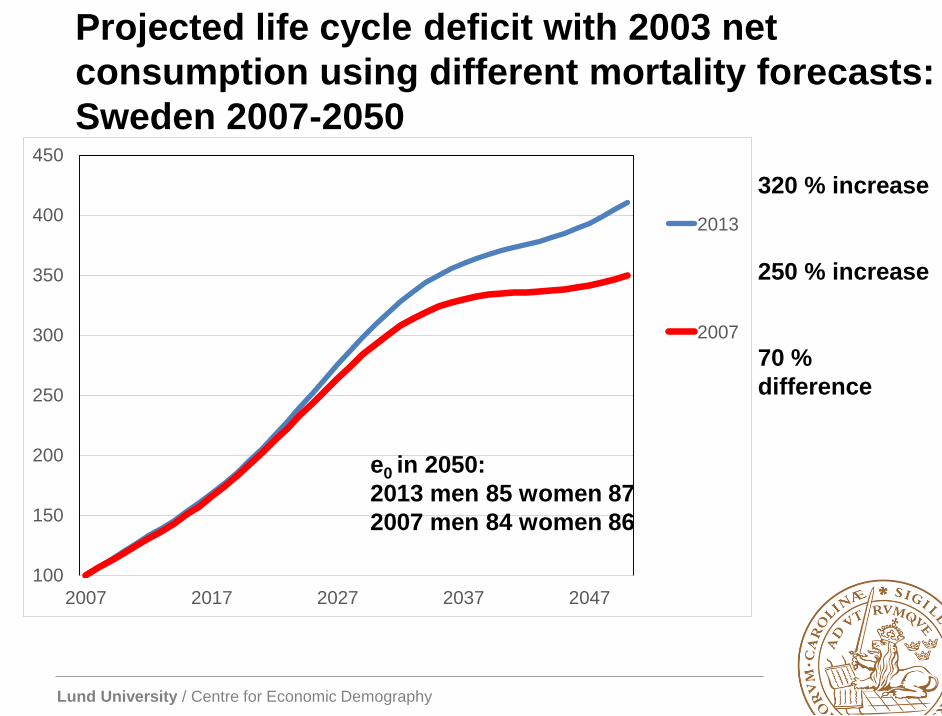
Projected life cycle deficit with 2003 net
consumption using different mortality forecasts:
Sweden 2007-2050
100
150
200
250
300
350
400
450
2007 2017 2027 2037 2047
2013
2007
320 % increase
250 % increase
70 %
difference
e0 in 2050:
2013 men 85 women 87
2007 men 84 women 86
Lund University / Centre for Economic Demography
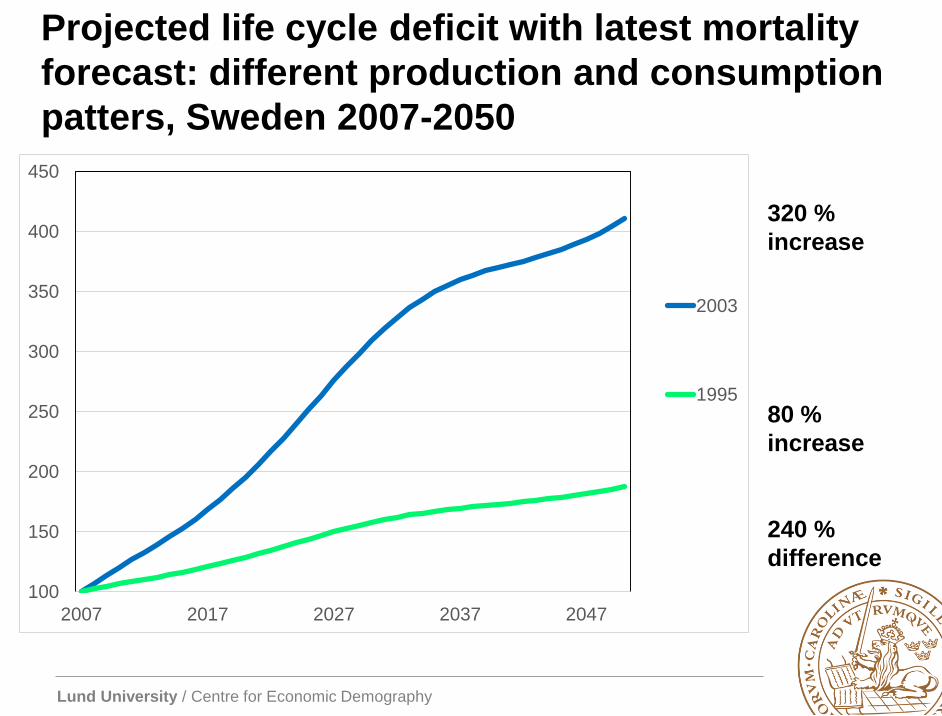
Projected life cycle deficit with latest mortality
forecast: different production and consumption
patters, Sweden 2007-2050
320 %
increase
80 %
increase
240 %
difference
100
150
200
250
300
350
400
450
2007 2017 2027 2037 2047
2003
1995
Lund University / Centre for Economic Demography
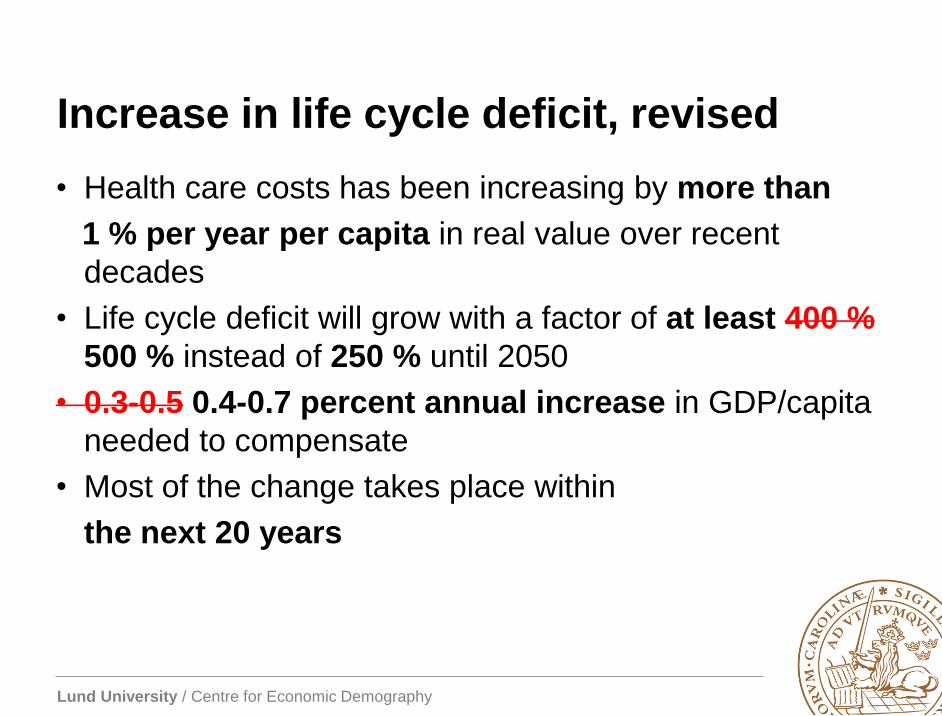
Increase in life cycle deficit, revised
• Health care costs has been increasing by more than
1 % per year per capita in real value over recent
decades
• Life cycle deficit will grow with a factor of at least 400 %
500 % instead of 250 % until 2050
• 0.3-0.5 0.4-0.7 percent annual increase in GDP/capita
needed to compensate
• Most of the change takes place within
the next 20 years
Lund University / Centre for Economic Demography
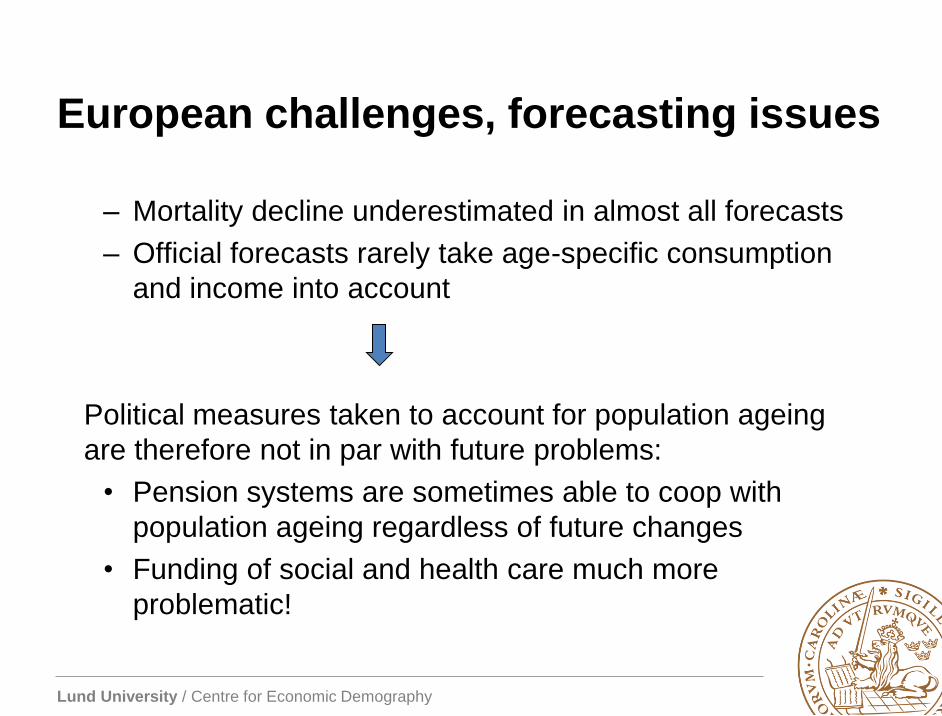
European challenges, forecasting issues
– Mortality decline underestimated in almost all forecasts
– Official forecasts rarely take age-specific consumption
and income into account
Political measures taken to account for population ageing
are therefore not in par with future problems:
• Pension systems are sometimes able to coop with
population ageing regardless of future changes
• Funding of social and health care much more
problematic!
Lund University / Centre for Economic Demography
European challenges, forecasting issues
– Mortality forecasts are very important!
Lund University / Centre for Economic Demography
European challenges, forecasting issues
– Mortality forecasts are very important!
– Even more important is to take age-specific
consumption and production into account!