Embed Size (px)
Citation preview
Popularity and Conformity Predicting Romantic Popularity and Conformity Predicting Romantic
Relationship Quality, Academic Achievement, and Relationship Quality, Academic Achievement, and
Problem Behavior from Ages 13 to 20Problem Behavior from Ages 13 to 20
Joseph P. AllenJoseph P. Allen
Amanda HareAmanda Hare
Erin MigaErin Miga
University of VirginiaUniversity of Virginia Collaborators:Maryfrances Porter, Ph.D.Penny MarshKathleen McElhaney, Ph.D.F. Christy McFarlandJessica Meyer, Ph.D.
Farah WilliamsDave SzwedoKatie LittleMeredyth EvansJill Antonishak, Ph.D.
Claire StephensonMindy Schmidt, Ph.D.Glenda Insabella, Ph.D.Megan SchadJoanna Chango
Copies of this and related papers are available at:WWW.TEENRESEARCH.ORG
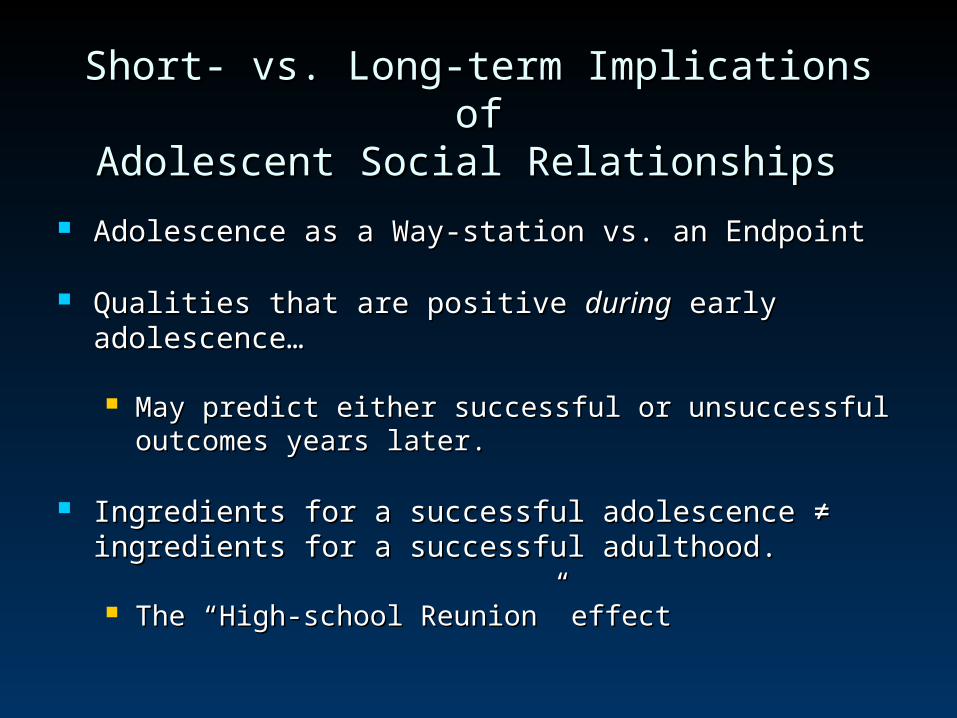
Short- vs. Long-term Implications ofShort- vs. Long-term Implications ofAdolescent Social Relationships Adolescent Social Relationships
Adolescence as a Way-station vs. an EndpointAdolescence as a Way-station vs. an Endpoint
Qualities that are positive Qualities that are positive duringduring early adolescence… early adolescence…
May predict either successful or unsuccessful outcomes May predict either successful or unsuccessful outcomes years later.years later.
Ingredients for a successful adolescence ≠ ingredients for a Ingredients for a successful adolescence ≠ ingredients for a successful adulthood.successful adulthood.
The “High-school Reunion” effectThe “High-school Reunion” effect

Overarching QuestionOverarching Question::
How do Predictors of Adaptation by the END of How do Predictors of Adaptation by the END of Adolescence Differ from Predictors of Adaptation Adolescence Differ from Predictors of Adaptation DURING Adolescence?DURING Adolescence?
PredictorsPredictors:: PopularityPopularity Peer-refusal skillsPeer-refusal skills Autonomy & Connection with a Best FriendAutonomy & Connection with a Best Friend
OutcomesOutcomes:: Delinquent Behavior Delinquent Behavior Alcohol & Drug Use and ProblemsAlcohol & Drug Use and Problems Academic AchievementAcademic Achievement Long-term success with peers and romantic partnersLong-term success with peers and romantic partners
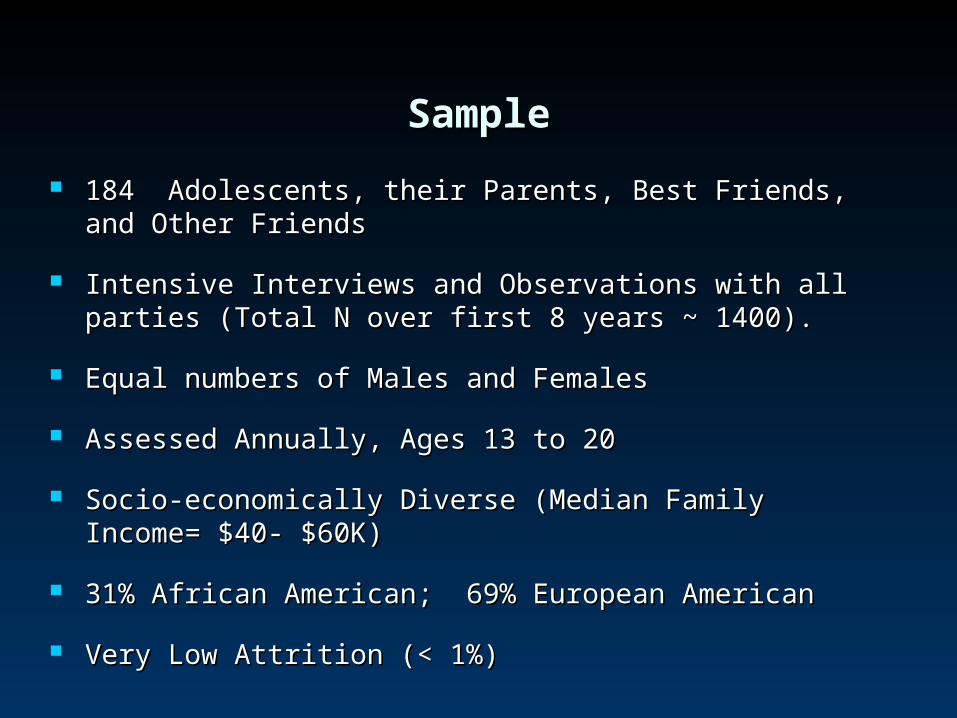
SampleSample
184 Adolescents, their Parents, Best Friends, and Other Friends184 Adolescents, their Parents, Best Friends, and Other Friends
Intensive Interviews and Observations with all parties (Total N over Intensive Interviews and Observations with all parties (Total N over first 8 years ~ 1400).first 8 years ~ 1400).
Equal numbers of Males and FemalesEqual numbers of Males and Females
Assessed Annually, Ages 13 to 20Assessed Annually, Ages 13 to 20
Socio-economically Diverse (Median Family Income= $40- $60K)Socio-economically Diverse (Median Family Income= $40- $60K)
31% African American; 69% European American31% African American; 69% European American
Very Low Attrition (< 1%)Very Low Attrition (< 1%)
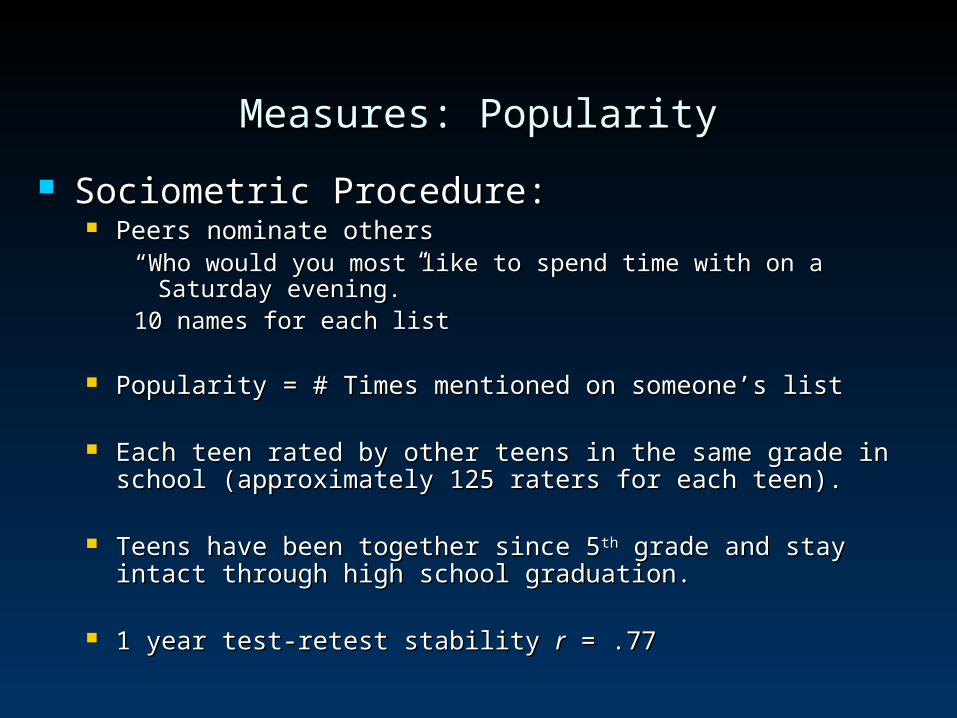
Measures: PopularityMeasures: Popularity
Sociometric Procedure:Sociometric Procedure: Peers nominate others Peers nominate others
““Who would you most like to spend time with on a Saturday evening.” Who would you most like to spend time with on a Saturday evening.” 10 names for each list10 names for each list
Popularity = # Times mentioned on someone’s listPopularity = # Times mentioned on someone’s list
Each teen rated by other teens in the same grade in school Each teen rated by other teens in the same grade in school (approximately 125 raters for each teen).(approximately 125 raters for each teen).
Teens have been together since 5Teens have been together since 5thth grade and stay intact through high grade and stay intact through high school graduation.school graduation.
1 year test-retest stability 1 year test-retest stability rr = .77 = .77
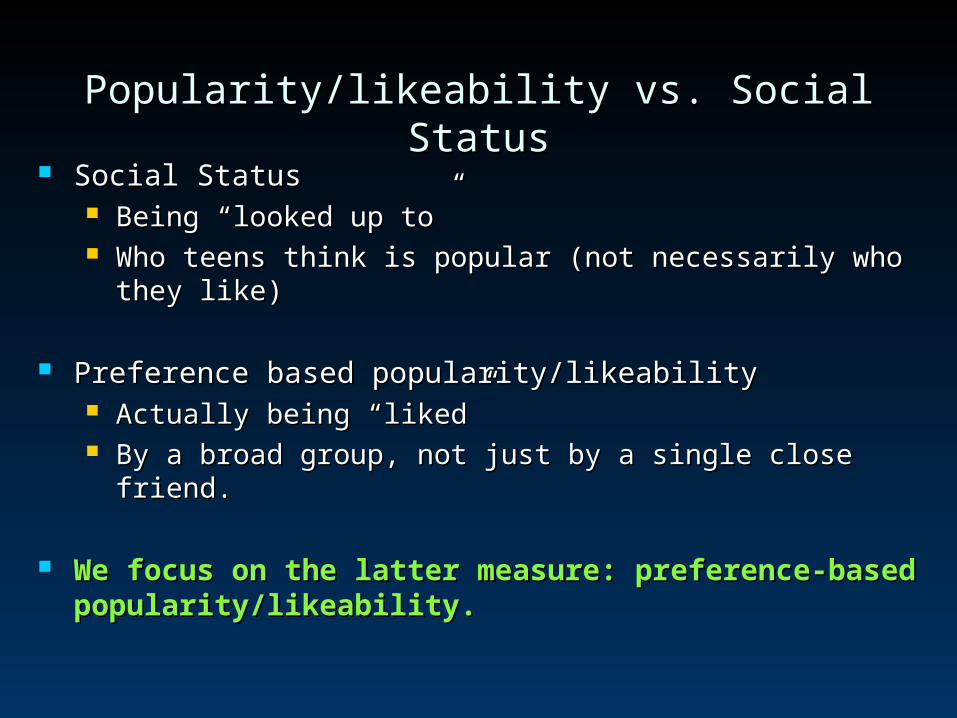
Popularity/likeability vs. Social StatusPopularity/likeability vs. Social Status Social StatusSocial Status
Being “looked up to”Being “looked up to” Who teens think is popular (not necessarily who they like)Who teens think is popular (not necessarily who they like)
Preference based popularity/likeabilityPreference based popularity/likeability Actually being “liked”Actually being “liked” By a broad group, not just by a single close friend.By a broad group, not just by a single close friend.
We focus on the latter measure: preference-based We focus on the latter measure: preference-based popularity/likeability. popularity/likeability.
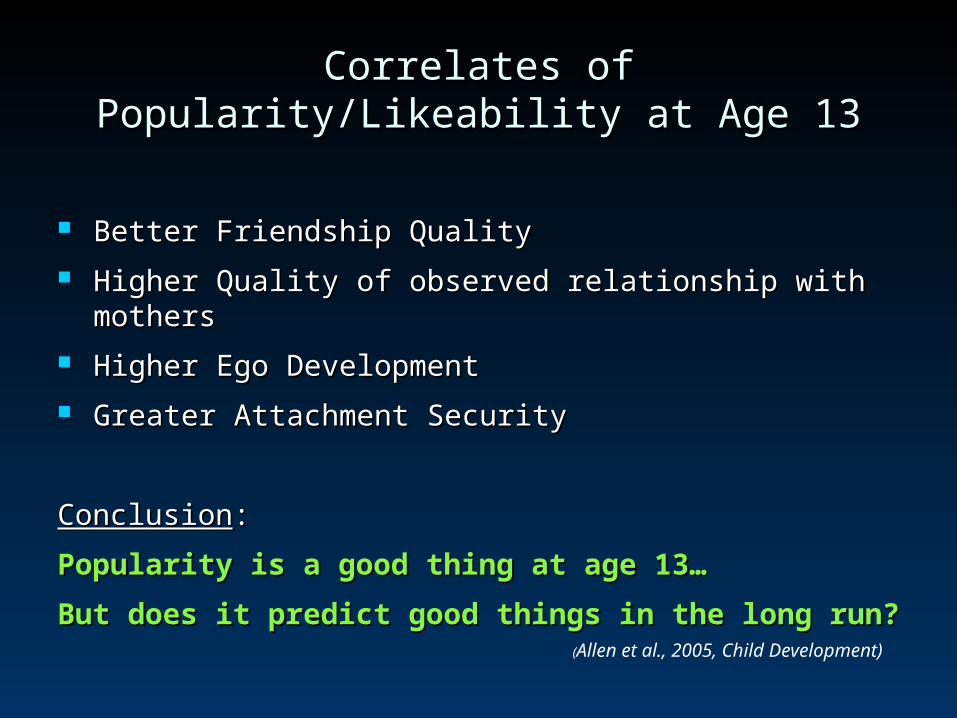
Correlates of Popularity/Likeability at Age 13Correlates of Popularity/Likeability at Age 13
Better Friendship QualityBetter Friendship Quality
Higher Quality of observed relationship with mothersHigher Quality of observed relationship with mothers
Higher Ego DevelopmentHigher Ego Development
Greater Attachment SecurityGreater Attachment Security
ConclusionConclusion::
Popularity is a good thing at age 13…Popularity is a good thing at age 13…
But does it predict good things in the long run?But does it predict good things in the long run?
(Allen et al., 2005, Child Development)
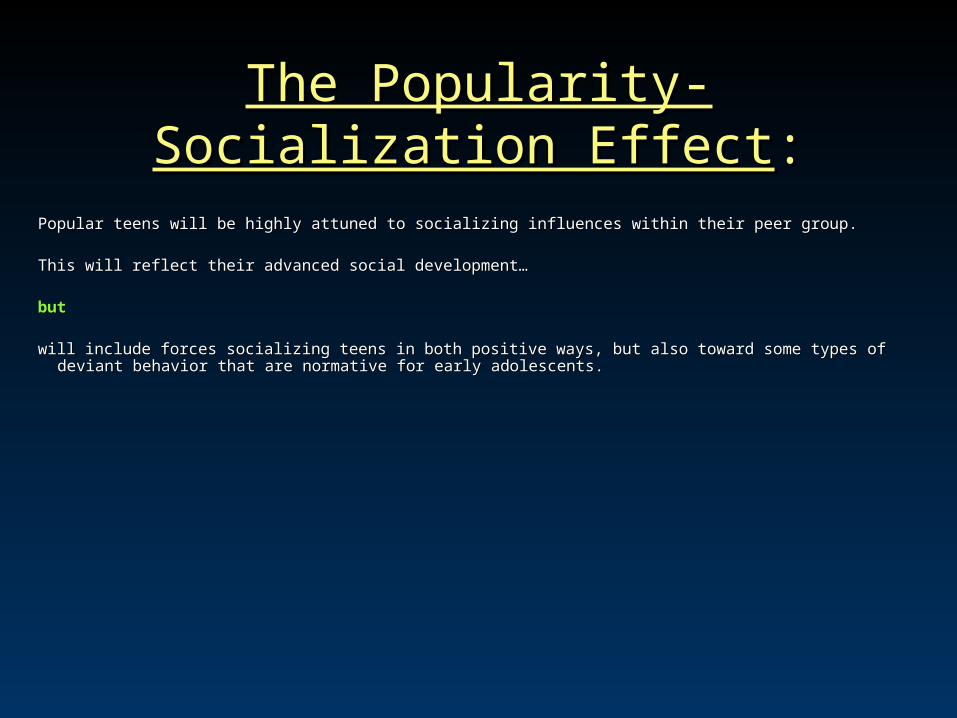
The Popularity-Socialization EffectThe Popularity-Socialization Effect::
Popular teens will be highly attuned to socializing influences within their peer group.Popular teens will be highly attuned to socializing influences within their peer group.
This will reflect their advanced social development…This will reflect their advanced social development…
butbut
will include forces socializing teens in both positive ways, but also toward some types of deviant behavior that are will include forces socializing teens in both positive ways, but also toward some types of deviant behavior that are normative for early adolescents.normative for early adolescents.
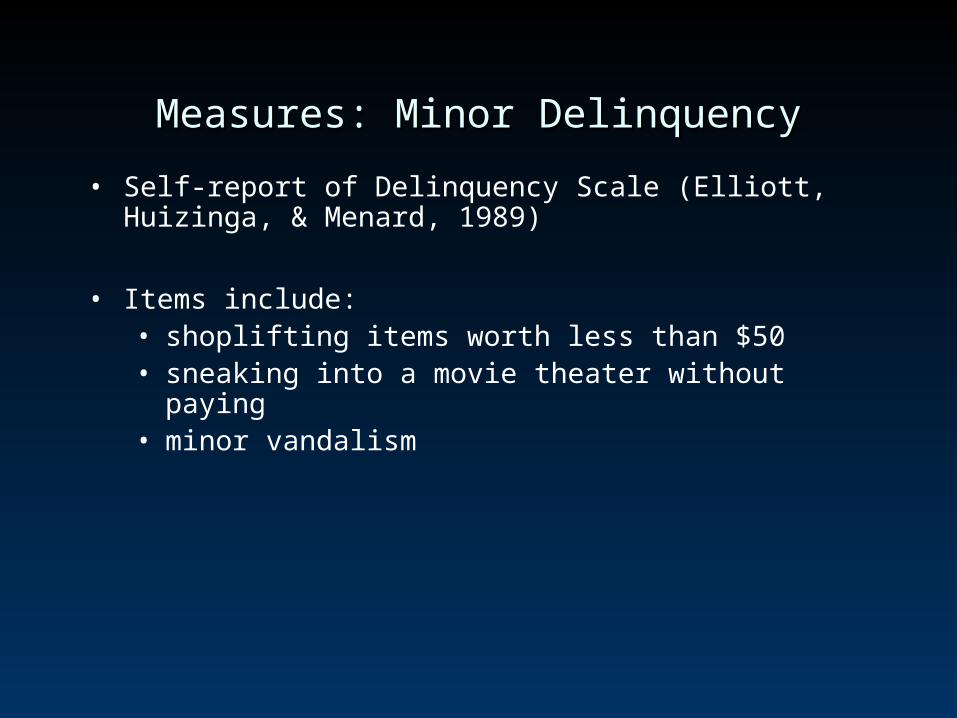
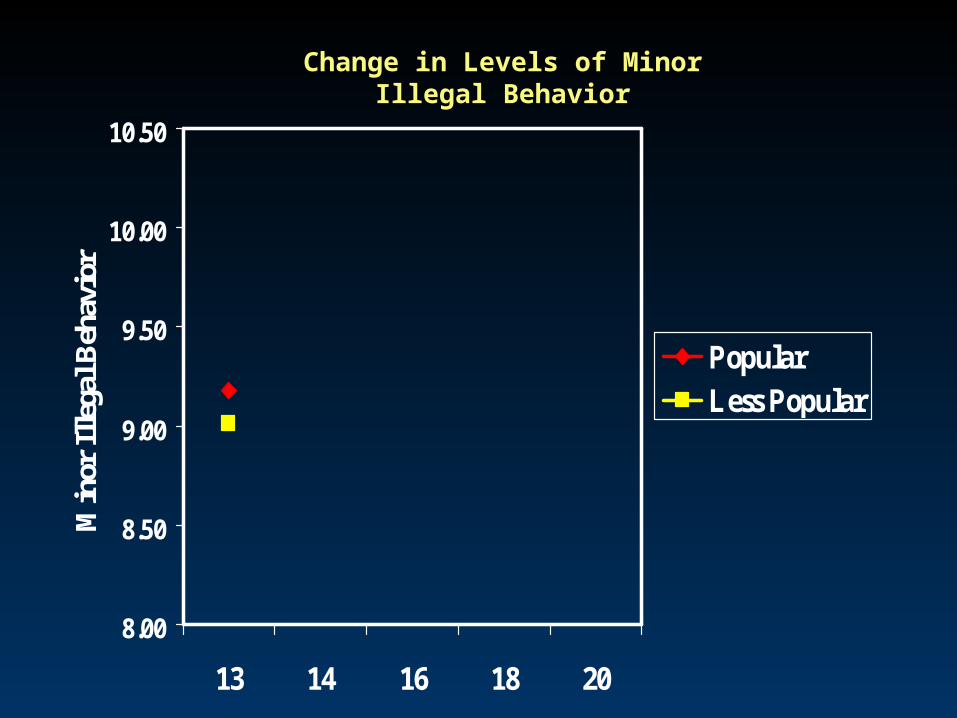
Measures: Minor DelinquencyMeasures: Minor Delinquency
• Self-report of Delinquency Scale (Elliott, Huizinga, & Menard, 1989)
• Items include:• shoplifting items worth less than $50• sneaking into a movie theater without paying• minor vandalism
8.00
8.50
9.00
9.50
10.00
10.50
13 14 16 18 20
Min
or I
llega
l Beh
avio
r
PopularLess Popular
Change in Levels of Minor Illegal Behavior

8.00
8.50
9.00
9.50
10.00
10.50
13 14 16 18 20
Min
or I
llega
l Beh
avio
r
PopularLess Popular
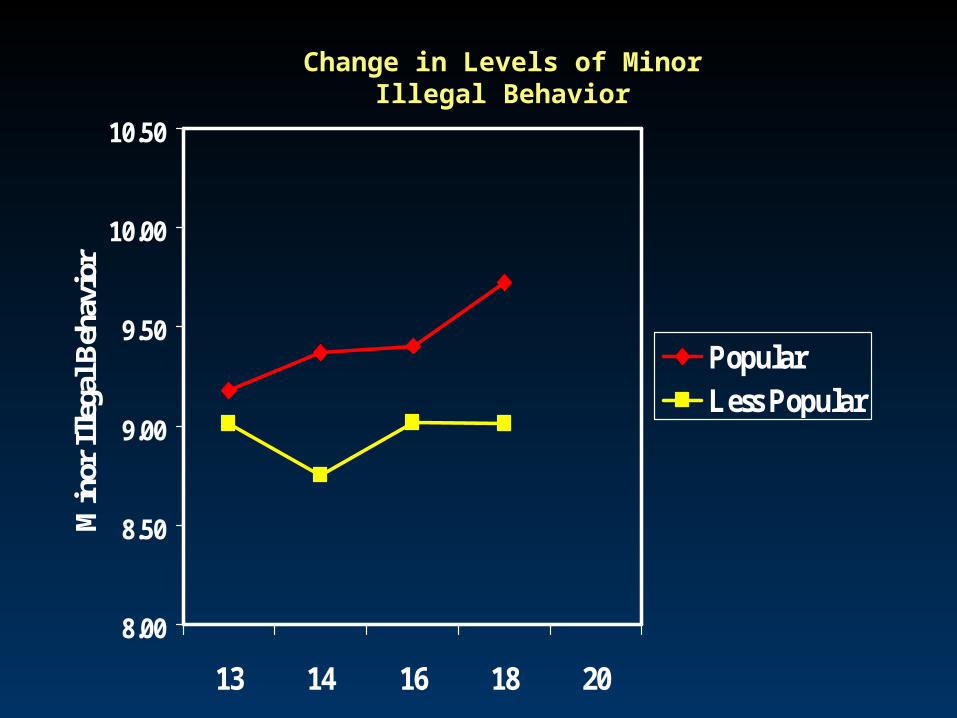
Change in Levels of Minor Illegal Behavior

Minor
Delinquency
Minor Delinquency
Popularity
Age 13 Age 14
.23**
.42***
Predicting Relative Changes in Minor Delinquency Predicting Relative Changes in Minor Delinquency From Baseline Popularity (Ages 13 to 14)From Baseline Popularity (Ages 13 to 14)
Popular teens show greater relative increases in minor delinquency from 13 to 14.
(Allen, Porter, McFarland, Marsh & McElhaney, 2005, Child Development)

8.00
8.50
9.00
9.50
10.00
10.50
13 14 16 18 20
Min
or I
llega
l Beh
avio
r
PopularLess Popular
Change in Levels of Minor Illegal Behavior
?

8.00
8.50
9.00
9.50
10.00
10.50
13 14 16 18 20
Min
or I
llega
l Beh
avio
r
PopularLess Popular
Change in Levels of Minor Illegal Behavior
8.00
8.50
9.00
9.50
10.00
10.50
13 14 16 18 20
Min
or I
llega
l Beh
avio
r
PopularLess Popular
Change in Levels of Minor Illegal Behavior

8.00
8.50
9.00
9.50
10.00
10.50
13 14 16 18 20
Min
or I
llega
l Beh
avio
r
PopularLess Popular
Change in Levels of Minor Illegal Behavior

Socialization appears to have ultimately taken a turn Socialization appears to have ultimately taken a turn for the better…for the better…
At least for delinquencyAt least for delinquency
What about other behaviors?What about other behaviors?
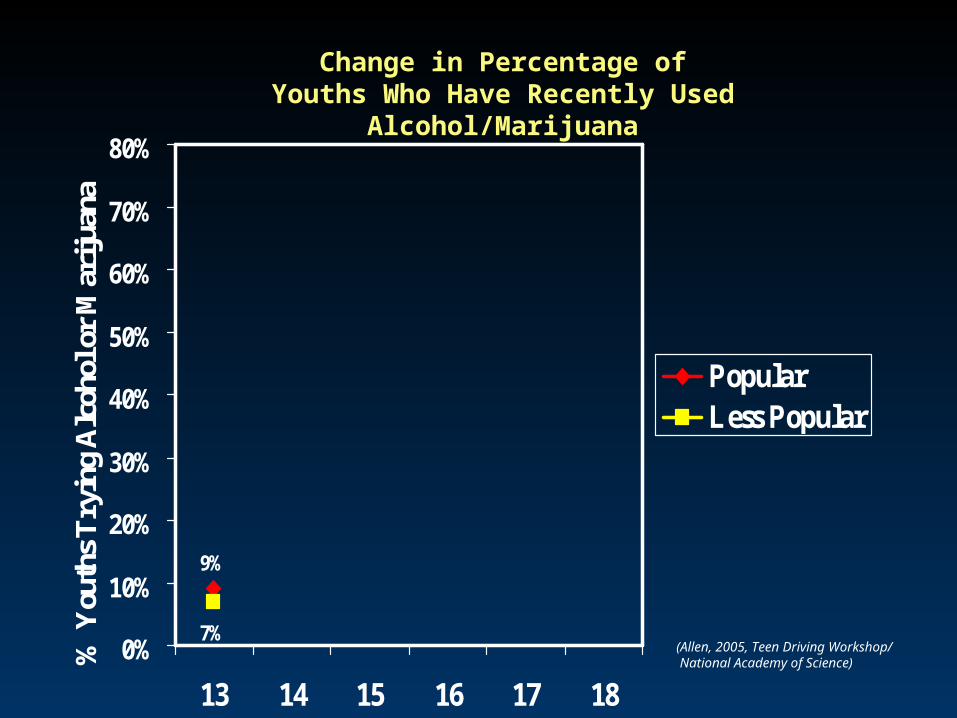
9%
7%0%
10%
20%
30%
40%
50%
60%
70%
80%
13 14 15 16 17 18
% Y
outh
s T
ryin
g A
lcoh
ol o
r M
arij
uana
PopularLess Popular
Change in Percentage of Youths Who Have Recently Used Alcohol/Marijuana
(Allen, 2005, Teen Driving Workshop/ National Academy of Science)

26%
9%
9%
7%0%
10%
20%
30%
40%
50%
60%
70%
80%
13 14 15 16 17 18
% Y
outh
s T
ryin
g A
lcoh
ol o
r M
arij
uana
PopularLess Popular
Change in Percentage of Youths Who Have Recently Used Alcohol/Marijuana
(Allen, 2005, Teen Driving Workshop/ National Academy of Science)

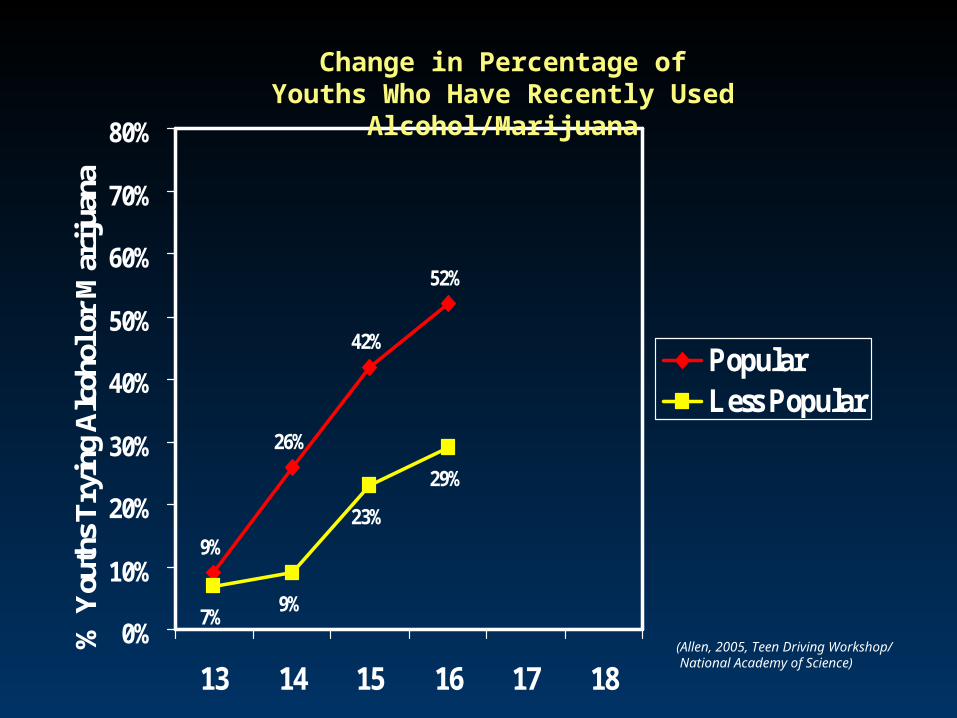
26%
42%
9%
23%
9%
7%0%
10%
20%
30%
40%
50%
60%
70%
80%
13 14 15 16 17 18
% Y
outh
s T
ryin
g A
lcoh
ol o
r M
arij
uana
PopularLess Popular
Change in Percentage of Youths Who Have Recently Used Alcohol/Marijuana
(Allen, 2005, Teen Driving Workshop/ National Academy of Science)
26%
42%
52%
9%
23%
9%
7%
29%
0%
10%
20%
30%
40%
50%
60%
70%
80%
13 14 15 16 17 18
% Y
outh
s T
ryin
g A
lcoh
ol o
r M
arij
uana
PopularLess Popular
Change in Percentage of Youths Who Have Recently Used Alcohol/Marijuana
(Allen, 2005, Teen Driving Workshop/ National Academy of Science)
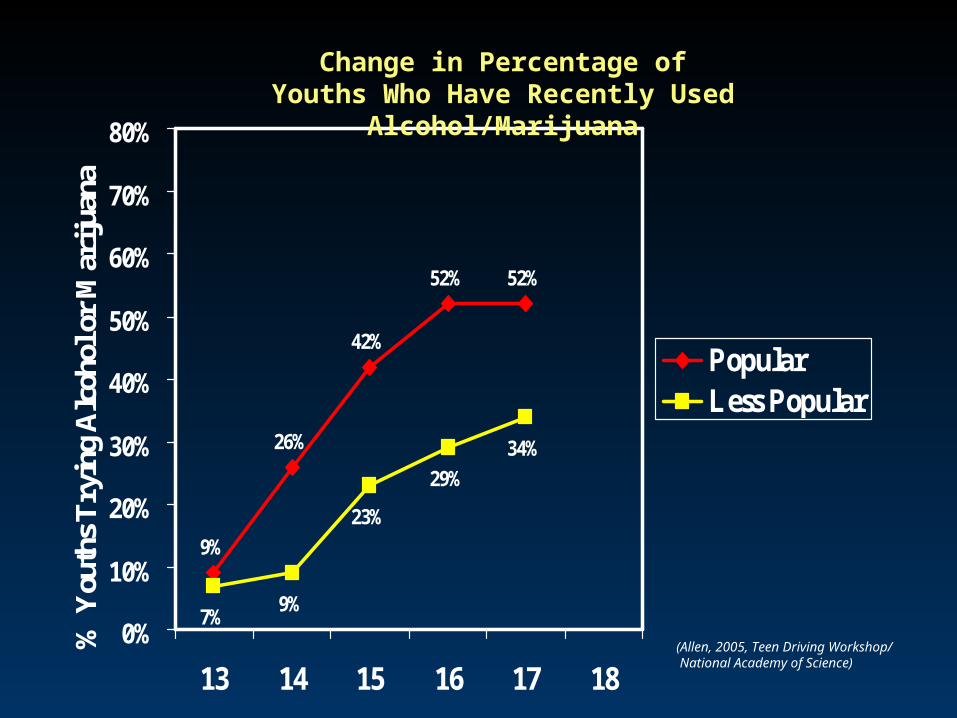
26%
42%
52% 52%
9%
23%
9%
7%
34%
29%
0%
10%
20%
30%
40%
50%
60%
70%
80%
13 14 15 16 17 18
% Y
outh
s T
ryin
g A
lcoh
ol o
r M
arij
uana
PopularLess Popular
Change in Percentage of Youths Who Have Recently Used Alcohol/Marijuana
(Allen, 2005, Teen Driving Workshop/ National Academy of Science)

26%
42%
52% 52%
68%
9%
23%
36%
9%
7%
34%
29%
0%
10%
20%
30%
40%
50%
60%
70%
80%
13 14 15 16 17 18
% Y
outh
s T
ryin
g A
lcoh
ol o
r M
arij
uana
PopularLess Popular
Change in Percentage of Youths Who Have Recently Used Alcohol/Marijuana
(Allen, 2005, Teen Driving Workshop/ National Academy of Science)
0.300.42
0.79
1.38
1.75
2.27
0.12
0.31
0.90
1.76
0.13
0.07
0.91
0.37
0.00
0.50
1.00
1.50
2.00
2.50
13 14 15 16 17 18 19 20
Fre
quen
cy o
f Use
PopularLess Popular
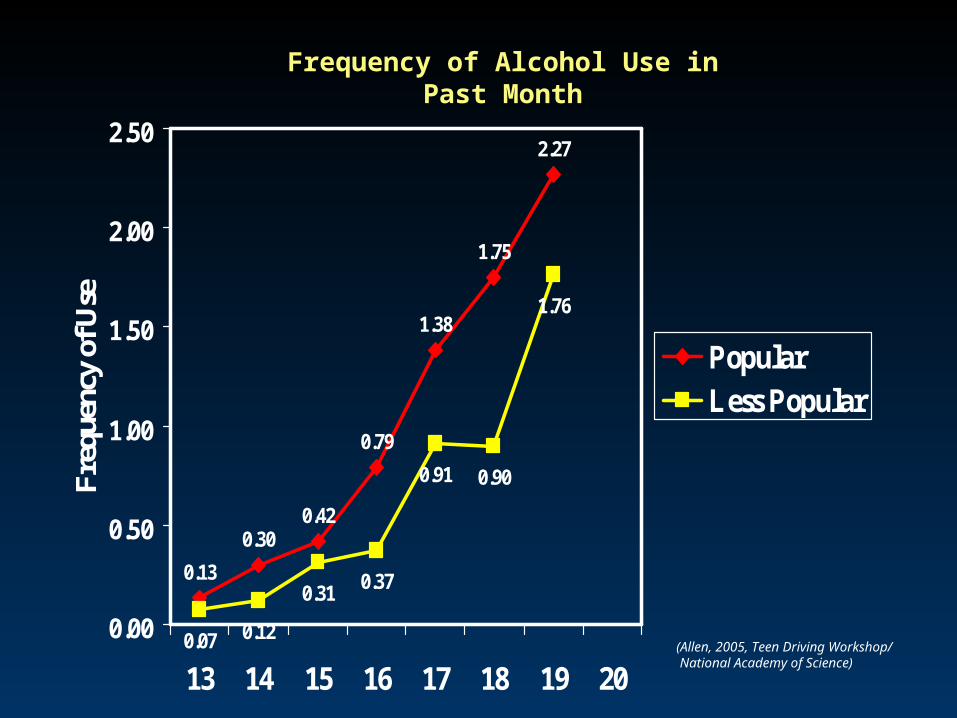
Frequency of Alcohol Use in Past Month
(Allen, 2005, Teen Driving Workshop/ National Academy of Science)

0.30 0.420.79
1.381.75
0.12 0.31
0.900.13
0.07
0.91
0.370.00
1.00
2.00
3.00
4.00
5.00
6.00
7.00
8.00
9.00
13 14 15 16 17 18 19 20
Fre
quen
cy o
f Use
PopularLess Popular
Frequency of Alcohol Use in Past Month
(Allen, 2005, Teen Driving Workshop/ National Academy of Science)

0.30 0.420.79
1.381.75
2.27
0.12 0.31
0.90
1.76
0.13
0.07
0.91
0.370.00
1.00
2.00
3.00
4.00
5.00
6.00
7.00
8.00
9.00
13 14 15 16 17 18 19 20
Fre
quen
cy o
f Use
PopularLess Popular
Frequency of Alcohol Use in Past Month
(Allen, 2005, Teen Driving Workshop/ National Academy of Science)

0.30 0.420.79
1.381.75
2.27
7.74
0.12 0.31
0.90
1.76
4.7
0.13
0.07
0.91
0.370.00
1.00
2.00
3.00
4.00
5.00
6.00
7.00
8.00
9.00
13 14 15 16 17 18 19 20
Fre
quen
cy o
f Use
PopularLess Popular
Frequency of Alcohol Use in Past Month
(Allen, 2005, Teen Driving Workshop/ National Academy of Science)
Measures: Problems Related to Alcohol UseMeasures: Problems Related to Alcohol Use
• Self-report problems occurring with alcohol use (CORE Survey, Presley & Meilman, 1994)
• 19 problems ranging from driving under the influence to injuring others to arrests to arguments and hangovers.
0.00
0.50
1.00
1.50
2.00
2.50
3.00
3.50
4.00
Popular Less Popular
Pro
blem
s as
a R
esul
t of D
rink
ing
PopularLess Popular
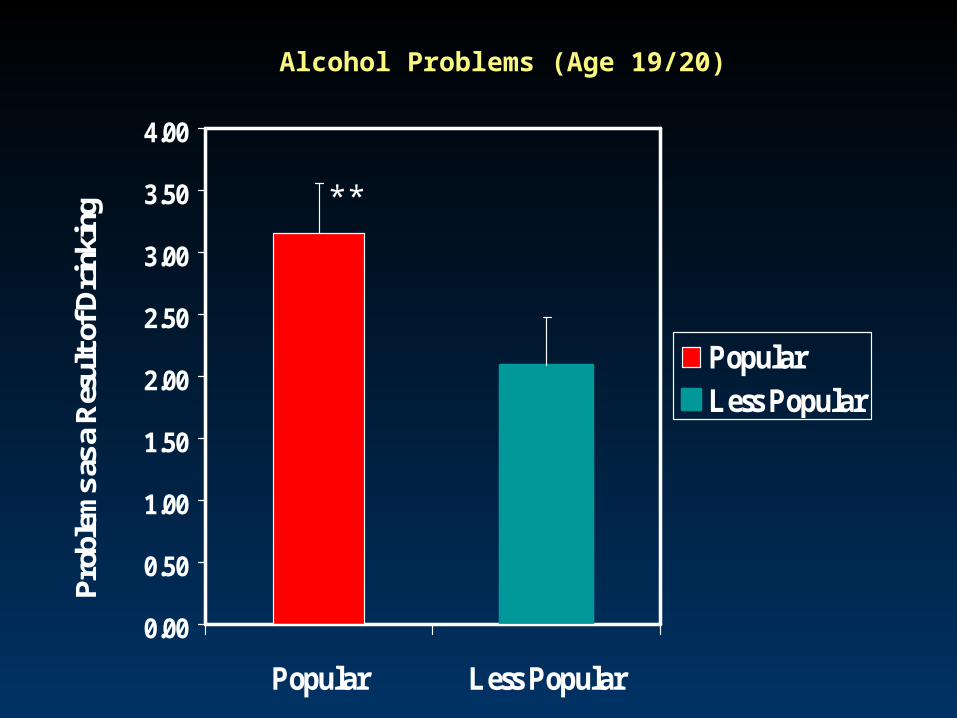
Alcohol Problems (Age 19/20)
**
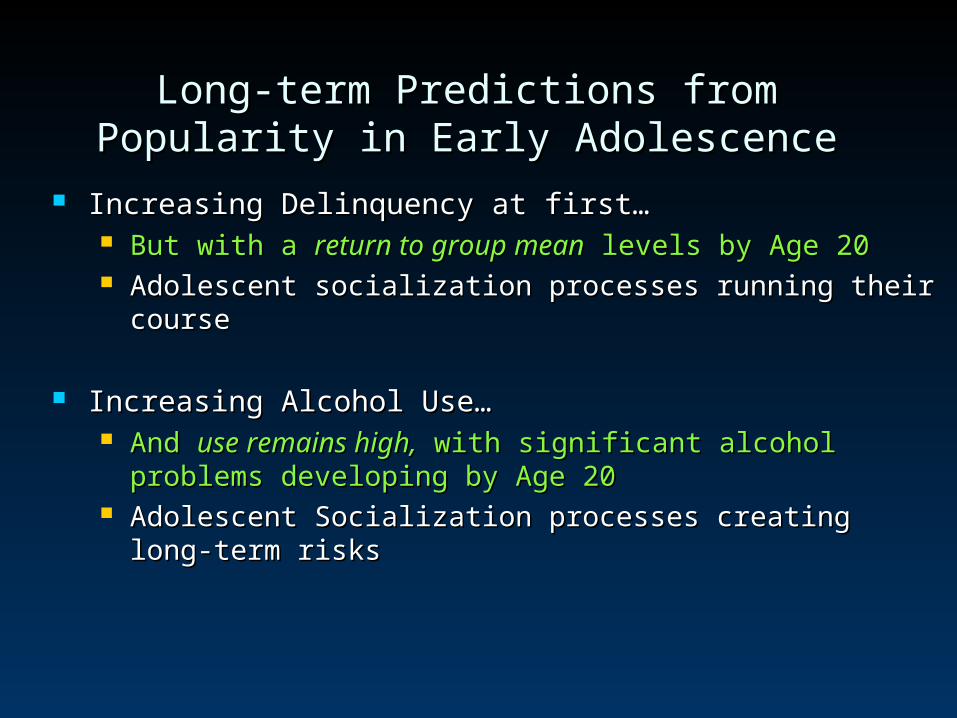
Long-term Predictions from Long-term Predictions from Popularity in Early Adolescence Popularity in Early Adolescence
Increasing Delinquency at first…Increasing Delinquency at first… But with a But with a return to group meanreturn to group mean levels by Age 20 levels by Age 20 Adolescent socialization processes running their courseAdolescent socialization processes running their course
Increasing Alcohol Use…Increasing Alcohol Use… And And use remains high,use remains high, with significant alcohol problems with significant alcohol problems
developing by Age 20developing by Age 20 Adolescent Socialization processes creating long-term risksAdolescent Socialization processes creating long-term risks

0.00
0.50
1.00
1.50
2.00
2.50
3.00
3.50
4.00
13 14 15 16 17
GP
A PopularLess Popular
Change in Grade Point Average
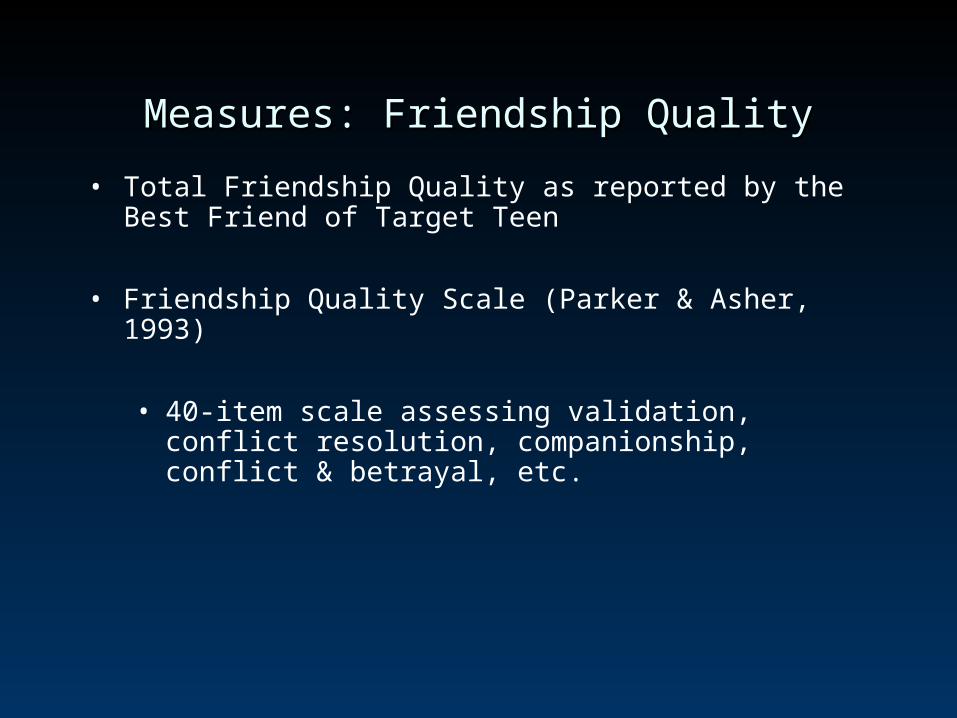
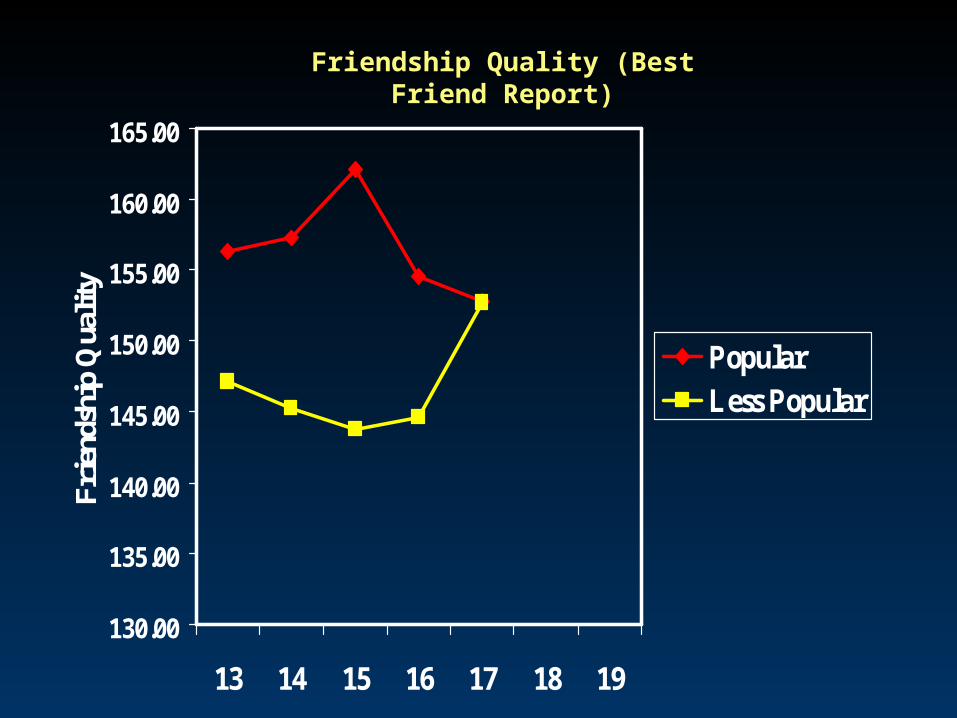
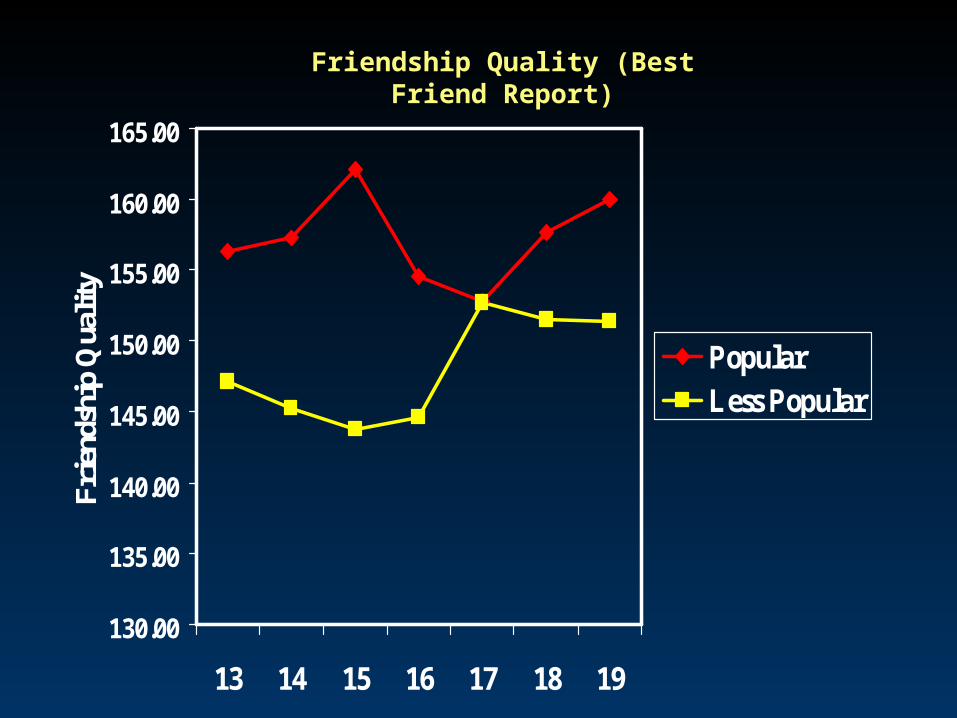
Measures: Friendship QualityMeasures: Friendship Quality
• Total Friendship Quality as reported by the Best Friend of Target Teen
• Friendship Quality Scale (Parker & Asher, 1993)
• 40-item scale assessing validation, conflict resolution, companionship, conflict & betrayal, etc.
130.00
135.00
140.00
145.00
150.00
155.00
160.00
165.00
13 14 15 16 17 18 19
Fri
ends
hip
Qua
lity
PopularLess Popular
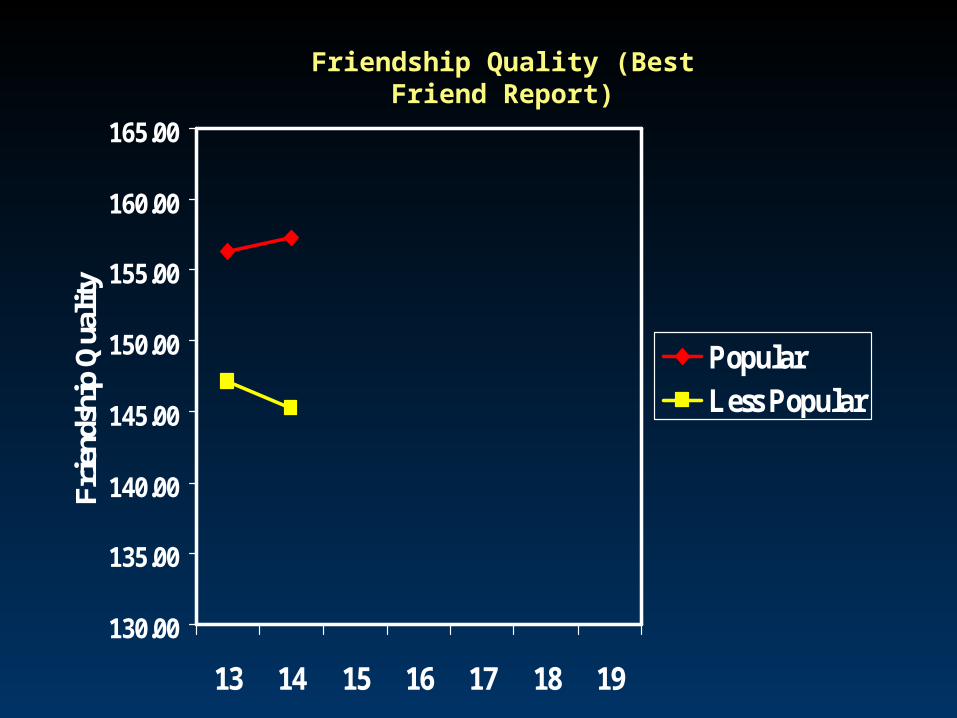
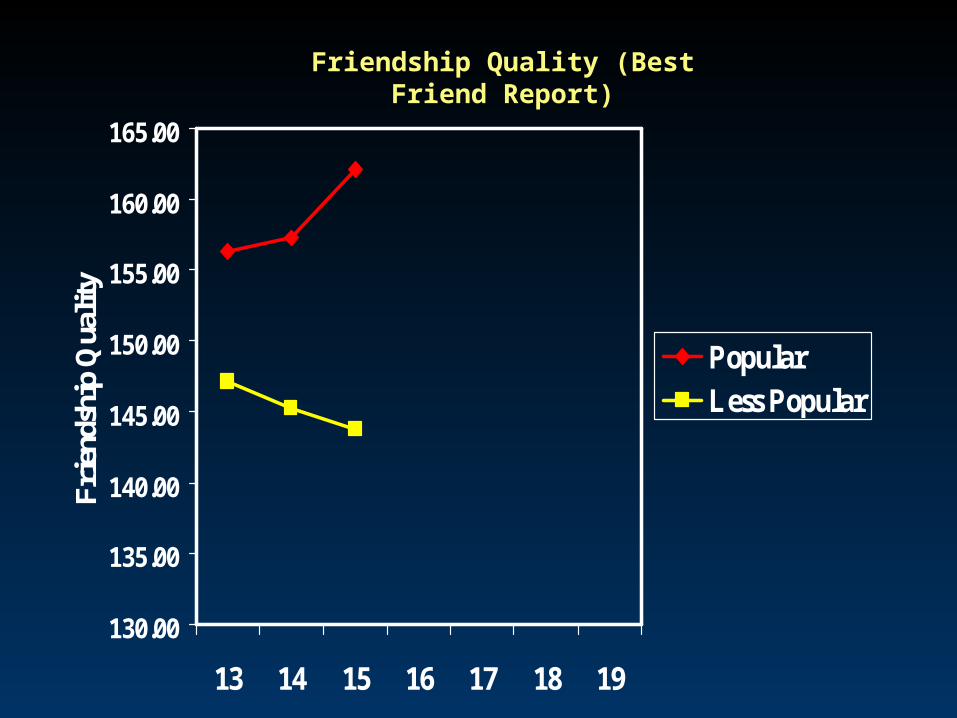
Friendship Quality (Best Friend Report)
130.00
135.00
140.00
145.00
150.00
155.00
160.00
165.00
13 14 15 16 17 18 19
Fri
ends
hip
Qua
lity
PopularLess Popular
Friendship Quality (Best Friend Report)
130.00
135.00
140.00
145.00
150.00
155.00
160.00
165.00
13 14 15 16 17 18 19
Fri
ends
hip
Qua
lity
PopularLess Popular
Friendship Quality (Best Friend Report)
130.00
135.00
140.00
145.00
150.00
155.00
160.00
165.00
13 14 15 16 17 18 19
Fri
ends
hip
Qua
lity
PopularLess Popular
Friendship Quality (Best Friend Report)
Romantic Relationships:Romantic Relationships:
Assessed via Network of Relationships Inventory (teen report)Assessed via Network of Relationships Inventory (teen report)
Relationship duration of 3 months or longer between ages of Relationship duration of 3 months or longer between ages of 17-19. 17-19.
5.00
6.00
7.00
8.00
9.00
10.00
11.00
12.00
13.00
14.00
15.00
Popular Less Popular
Rom
anti
c R
elat
ions
hip
Qua
lity
PopularLess Popular
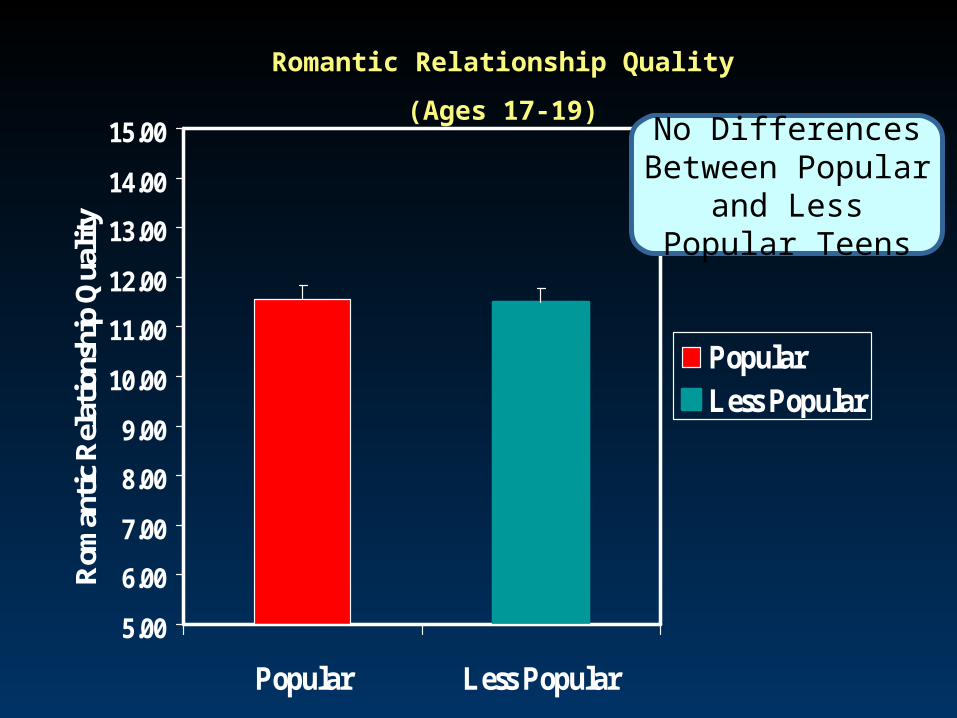
Romantic Relationship Quality
(Ages 17-19)
No Differences Between Popular and Less Popular Teens

61%
43%
0%
10%
20%
30%
40%
50%
60%
70%
Popular Less Popular
%
PopularLess Popular
Percentage of Teens in Significant Romantic Relationship
** Popular Teens are More Likely to Have a Romantic Relationship
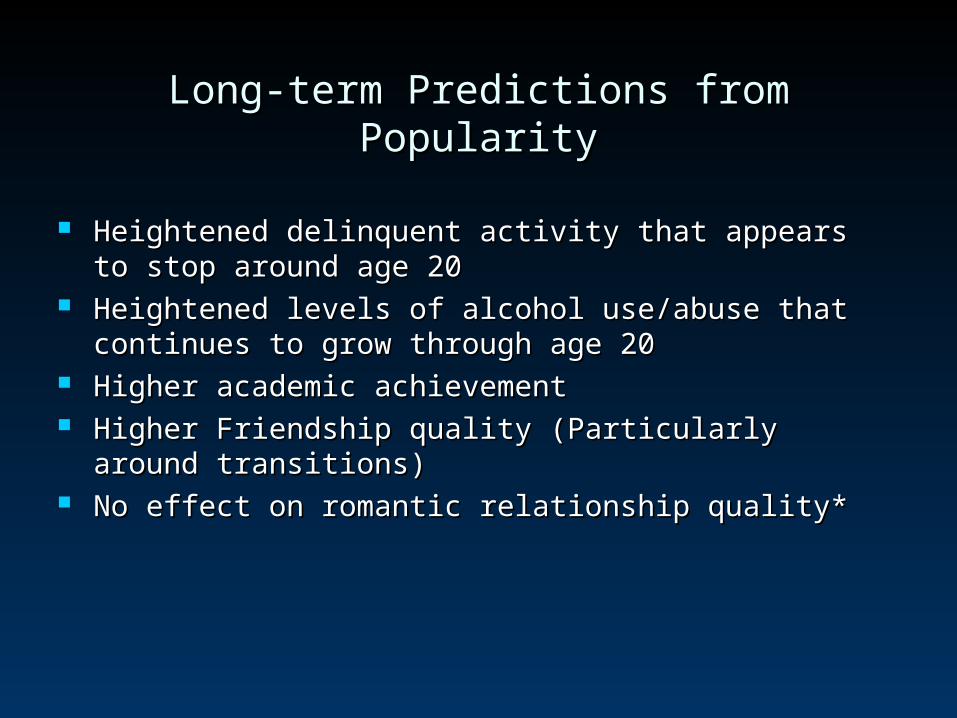
Long-term Predictions from PopularityLong-term Predictions from Popularity
Heightened delinquent activity that appears to stop around Heightened delinquent activity that appears to stop around age 20age 20
Heightened levels of alcohol use/abuse that continues to grow Heightened levels of alcohol use/abuse that continues to grow through age 20through age 20
Higher academic achievementHigher academic achievement Higher Friendship quality (Particularly around transitions)Higher Friendship quality (Particularly around transitions) No effect on romantic relationship quality*No effect on romantic relationship quality*
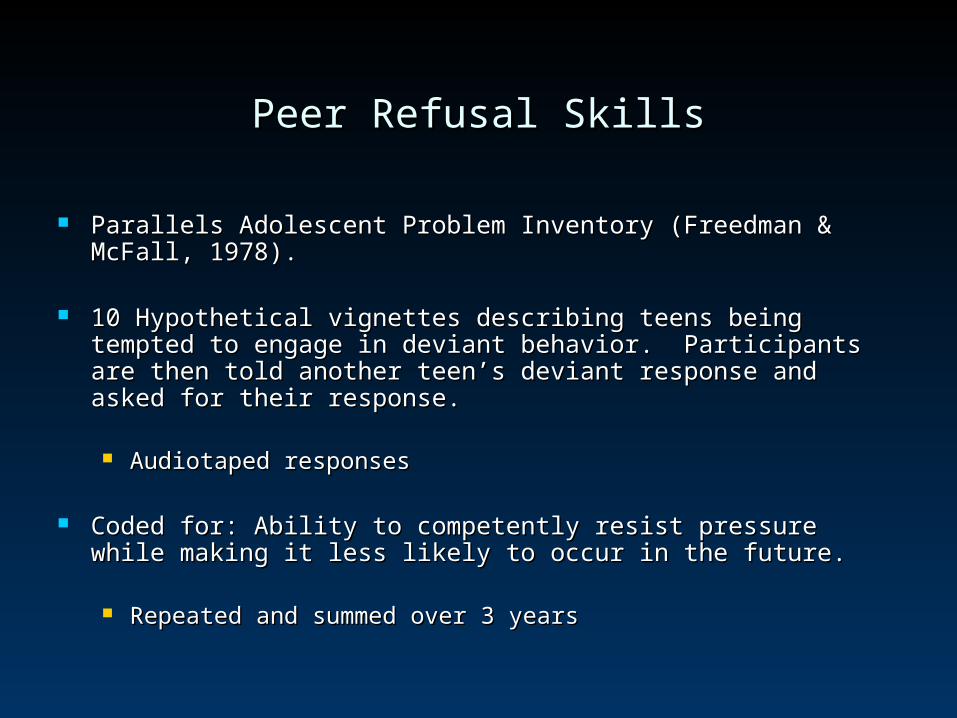
Peer Refusal SkillsPeer Refusal Skills
Parallels Adolescent Problem Inventory (Freedman & McFall, 1978).Parallels Adolescent Problem Inventory (Freedman & McFall, 1978).
10 Hypothetical vignettes describing teens being tempted to engage 10 Hypothetical vignettes describing teens being tempted to engage in deviant behavior. Participants are then told another teen’s in deviant behavior. Participants are then told another teen’s deviant response and asked for their response.deviant response and asked for their response.
Audiotaped responsesAudiotaped responses
Coded for: Ability to competently resist pressure while making it less Coded for: Ability to competently resist pressure while making it less likely to occur in the future.likely to occur in the future.
Repeated and summed over 3 yearsRepeated and summed over 3 years
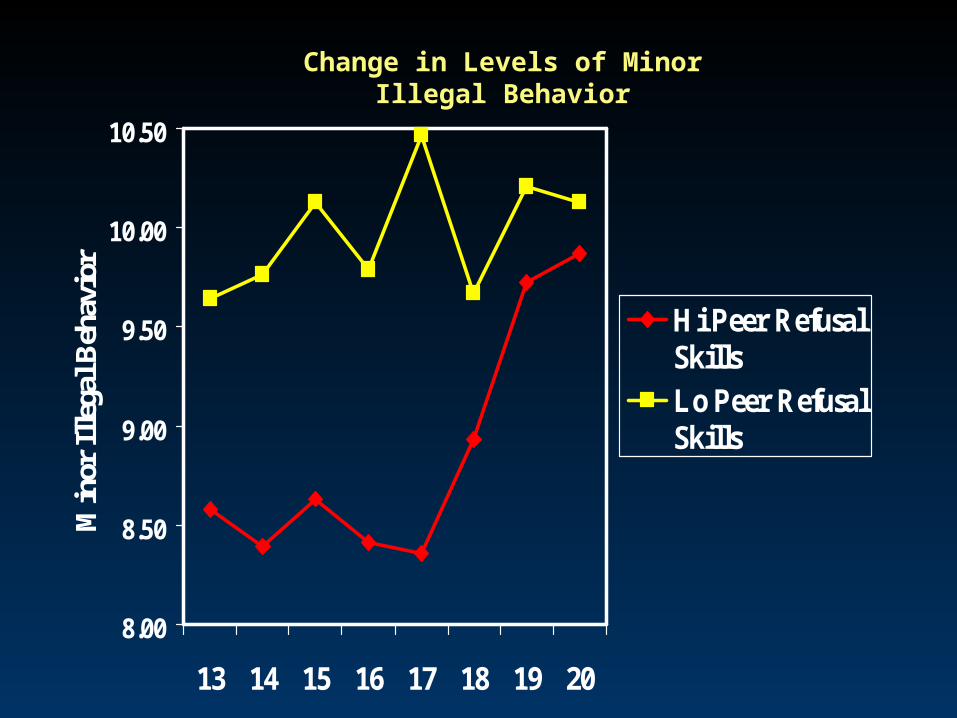
8.00
8.50
9.00
9.50
10.00
10.50
13 14 15 16 17 18 19 20
Min
or I
llega
l Beh
avio
r
Hi Peer RefusalSkillsLo Peer RefusalSkills
Change in Levels of Minor Illegal Behavior

0
1
2
3
4
5
6
7
8
9
13 14 15 16 17 18 19 20
Fre
quen
cy o
f Use
Hi Peer RefusalSkillsLo Peer RefusalSkills
Frequency of Alcohol Use in Past Month
(Allen, 2005, Teen Driving Workshop/ National Academy of Science)

0.00
0.50
1.00
1.50
2.00
2.50
3.00
3.50
4.00
4.50
5.00
Hi Peer Refusal Skills Low Peer Refusal Skills
Alc
ohol
Pro
blem
sAlcohol Problems (Age 19/20)
***
0.00
0.50
1.00
1.50
2.00
2.50
3.00
3.50
4.00
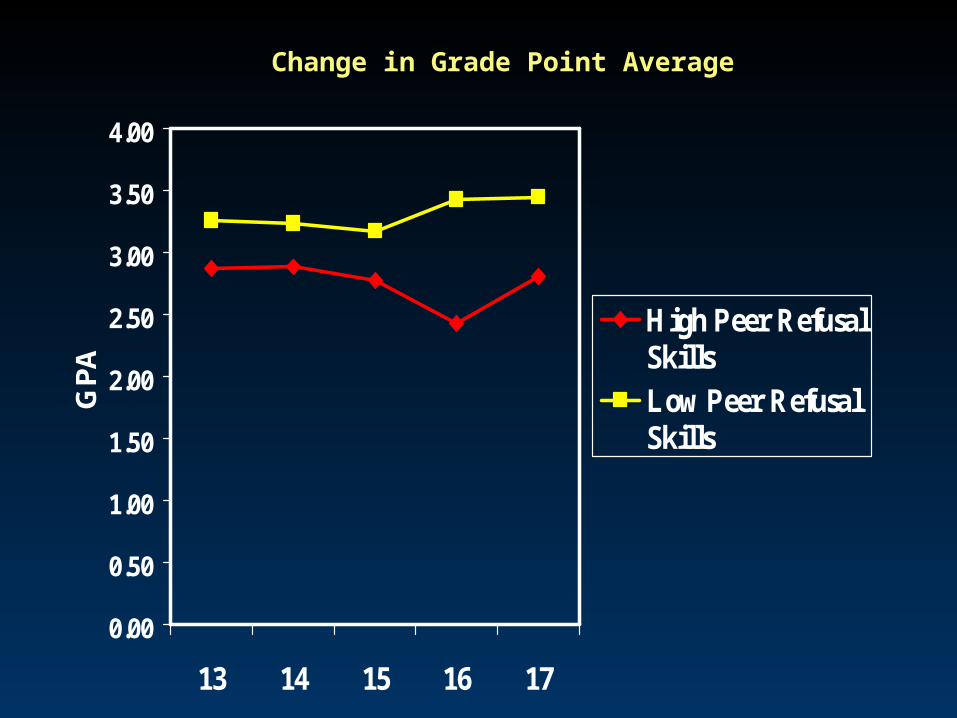
13 14 15 16 17
GP
A
High Peer RefusalSkillsLow Peer RefusalSkills
Change in Grade Point Average

100.00
110.00
120.00
130.00
140.00
150.00
160.00
170.00
180.00
13 14 15 16 17 18 19
Fri
ends
hip
Qua
lity
Hi Peer RefusalSkillsLow Peer RefusalSkills
Friendship Quality (Best Friend Report)
No difference in friendship quality for
Hi & Lo Peer Refusers
5.00
6.00
7.00
8.00
9.00
10.00
11.00
12.00
13.00
14.00
15.00
Hi Peer Refusal Low Peer Refusal
Rom
anti
c R
elat
ions
hip
Qua
lity
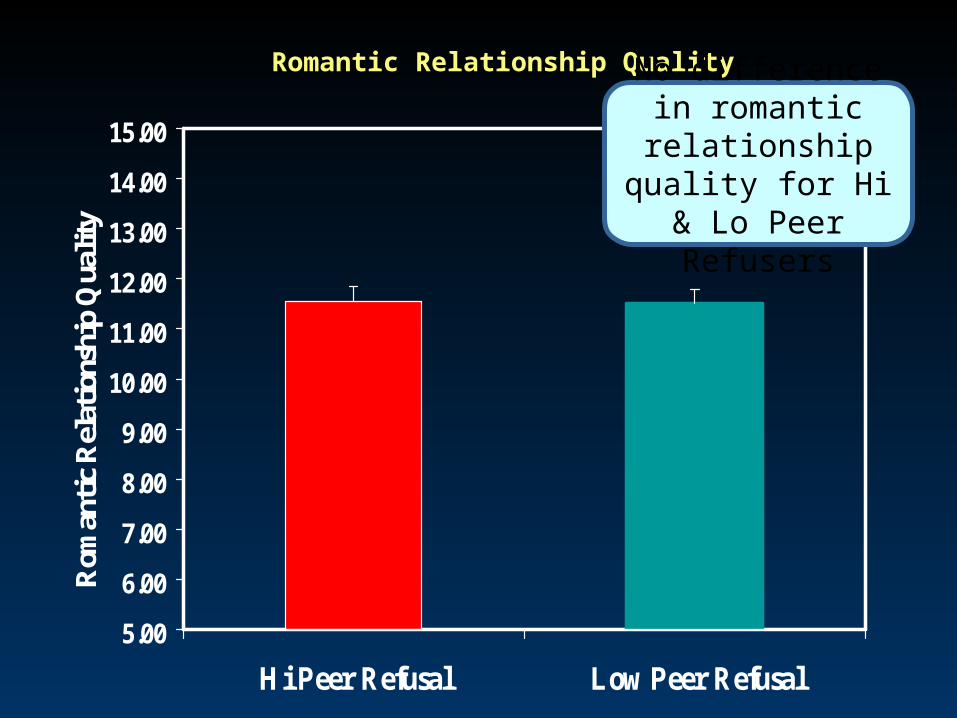
Romantic Relationship Quality
No difference in romantic relationship quality for Hi & Lo
Peer Refusers

The Adolescent “Bind”:The Adolescent “Bind”:Conform to Peers or Conform to Adults?Conform to Peers or Conform to Adults?
Achieving popularity with peers increases risk for alcohol and Achieving popularity with peers increases risk for alcohol and drug and legal problems…drug and legal problems…
but is linked to better friendships and more romantic but is linked to better friendships and more romantic relationships.relationships.
Skill at refusing peer temptations is linkd to fewer behavior Skill at refusing peer temptations is linkd to fewer behavior problems…problems…
but a lower GPA.but a lower GPA.
Neither behavior explains future romantic relationship Neither behavior explains future romantic relationship qualities (i.e., the precursors of adult marriages)qualities (i.e., the precursors of adult marriages)

Role of Autonomy AND RelatednessRole of Autonomy AND Relatedness
A key social-developmental task:A key social-developmental task: Establish one’s autonomy while learning to maintain and Establish one’s autonomy while learning to maintain and
deepen important relationshipsdeepen important relationships
Assessed via observations of close-friends handling Assessed via observations of close-friends handling disagreements at ages 13-15. (Peer Autonomy Task, Allen et disagreements at ages 13-15. (Peer Autonomy Task, Allen et al., 2005)al., 2005) Behaviors acknowledging other’s points; validating; carefully Behaviors acknowledging other’s points; validating; carefully
listening. listening.
7.00
7.50
8.00
8.50
9.00
9.50
10.00
10.50
11.00
11.50
12.00
13 14 15 16 17 18 19 20
Min
or I
llega
l Beh
avio
r
Lo Autonomy &RelatednessHi Autonomy &Relatedness
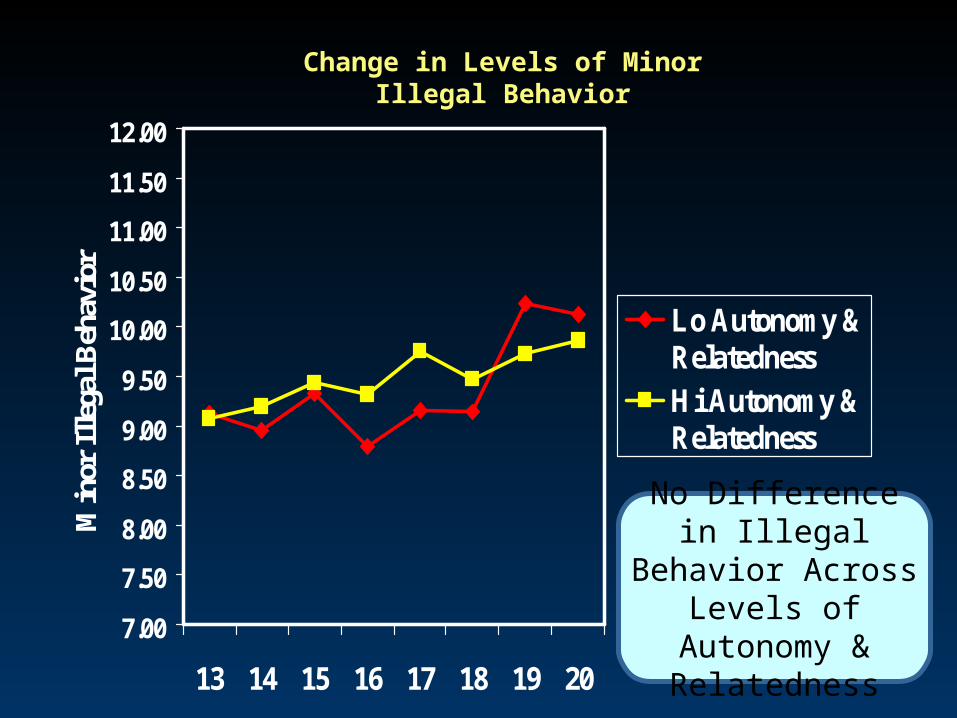
Change in Levels of Minor Illegal Behavior
No Difference in Illegal Behavior Across Levels of
Autonomy & Relatedness
0.210.4 0.54
1.04 1.08
1.85
5.49
0.22 0.35
1.54
2.23
7.44
0.110.901.27
0.650
1
2
3
4
5
6
7
8
13 14 15 16 17 18 19 20
Fre
quen
cy o
f Use
Lo Autonomy &RelatednessHi Autonomy &Relatedness
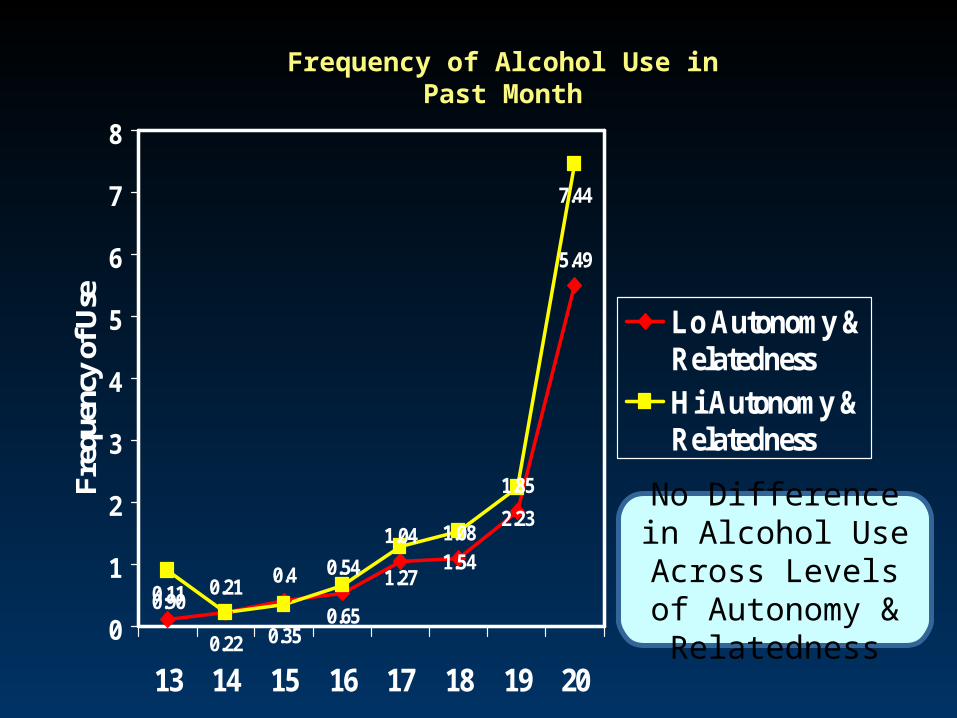
Frequency of Alcohol Use in Past Month
No Difference in Alcohol Use Across
Levels of Autonomy & Relatedness

0.00
0.50
1.00
1.50
2.00
2.50
3.00
3.50
Low Autonomy &Relatedness
Hi Autonomy &Relatedness
Min
or I
llega
l Beh
avio
rAlcohol Problems (Age 19/20)
No Difference in Alcohol Problems Across Levels of Autonomy & Relatedness
0.00
0.50
1.00
1.50
2.00
2.50
3.00
3.50
4.00
13 14 15 16 17
GP
A
Lo Autonomy &RelatednessHi Autonomy &Relatedness
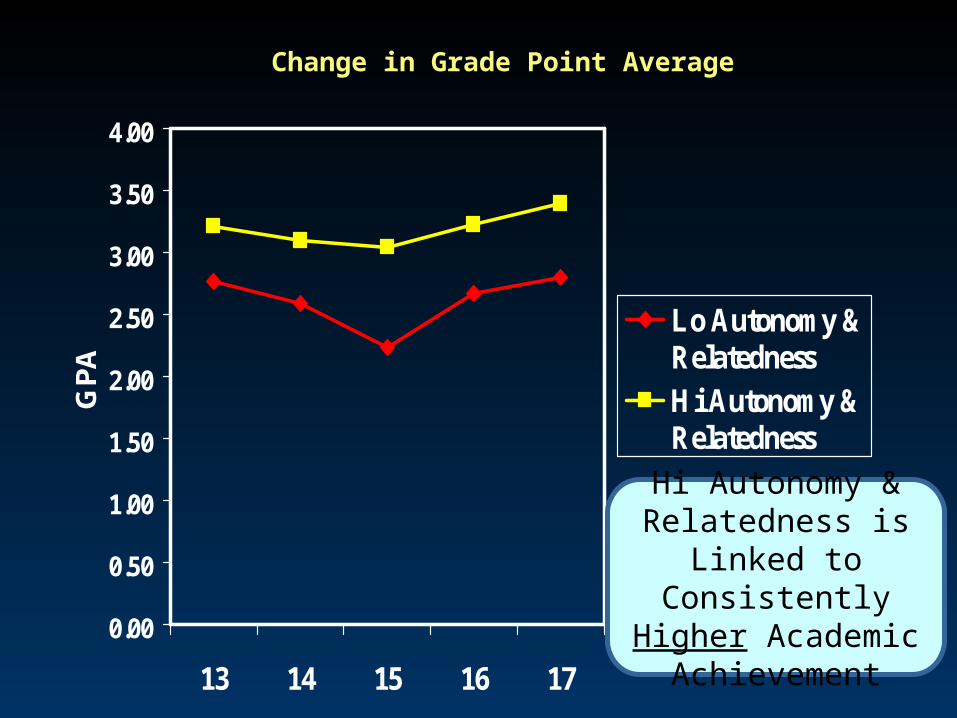
Change in Grade Point Average
Hi Autonomy & Relatedness is Linked to
Consistently Higher Academic Achievement

100.00
110.00
120.00
130.00
140.00
150.00
160.00
170.00
180.00
190.00
200.00
13 14 15 16 17 18 19
Fri
ends
hip
Qua
lity
Lo Autonomy &RelatednessHi Autonomy &Relatedness
Friendship Quality (Best Friend Report)
No Effects on Friendship Quality
5.00
6.00
7.00
8.00
9.00
10.00
11.00
12.00
13.00
14.00
15.00
Low Autonomy &Relatedness
Hi Autonomy &Relatedness
Rom
anti
c R
elat
ions
hip
Qua
lity
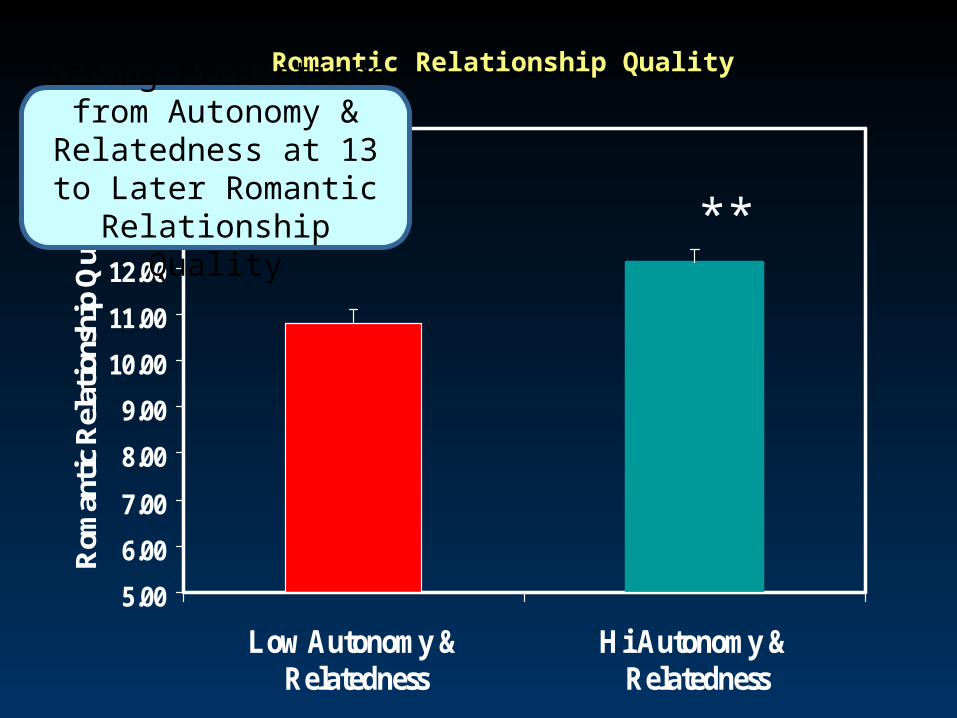
Romantic Relationship Quality
**
Strong Predictions from Autonomy & Relatedness at
13 to Later Romantic Relationship Quality

48%
57%
0%
10%
20%
30%
40%
50%
60%
70%
Low Autonomy &Relatedness
Hi Autonomy &Relatedness
%Percentage of Teens in Significant
Romantic Relationship

Summary of Autonomy & Relatedness FindingsSummary of Autonomy & Relatedness Findings
The one adolescent social trait with NO negative findings.The one adolescent social trait with NO negative findings.
Links to:Links to:
Higher grades in schoolHigher grades in school
Better romantic relationshipsBetter romantic relationships
Without links to:Without links to:
Drinking or Deviant BehaviorDrinking or Deviant Behavior
Only thing missing is a link to friendship quality over time.Only thing missing is a link to friendship quality over time.

LimitationsLimitations
Non-experimental nature of dataNon-experimental nature of data
Examining a limited number of outcomesExamining a limited number of outcomes
NOT following teens all the way into adulthood (yet). NOT following teens all the way into adulthood (yet).
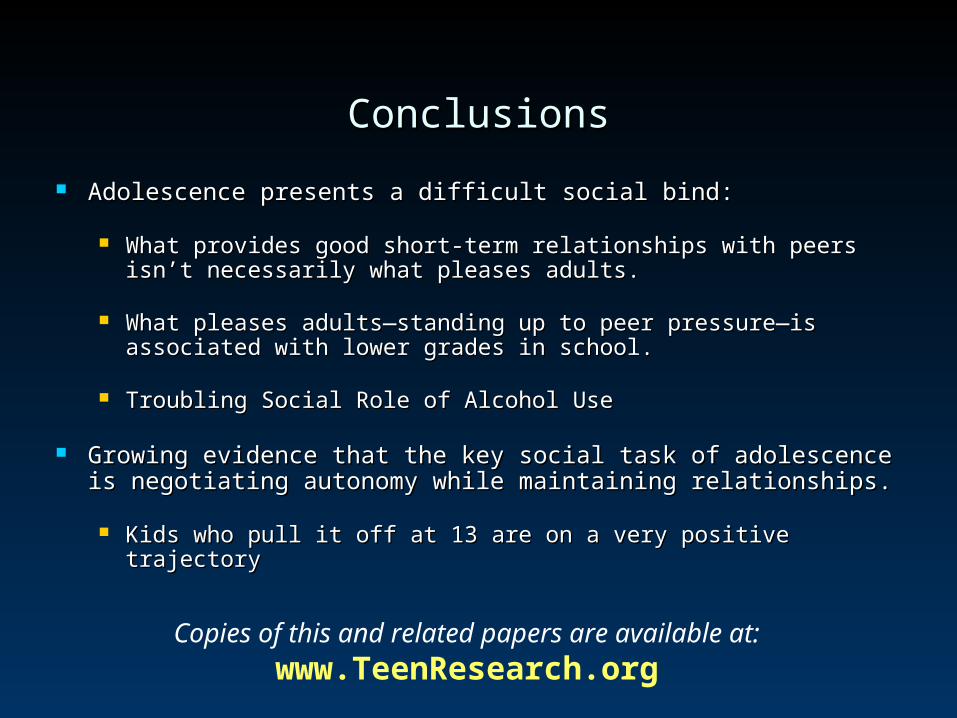
ConclusionsConclusions
Adolescence presents a difficult social bind:Adolescence presents a difficult social bind:
What provides good short-term relationships with peers isn’t What provides good short-term relationships with peers isn’t necessarily what pleases adults.necessarily what pleases adults.
What pleases adults—standing up to peer pressure—is associated What pleases adults—standing up to peer pressure—is associated with lower grades in school.with lower grades in school.
Troubling Social Role of Alcohol UseTroubling Social Role of Alcohol Use
Growing evidence that the key social task of adolescence is Growing evidence that the key social task of adolescence is negotiating autonomy while maintaining relationships.negotiating autonomy while maintaining relationships.
Kids who pull it off at 13 are on a very positive trajectoryKids who pull it off at 13 are on a very positive trajectory
Copies of this and related papers are available at:
www.TeenResearch.org
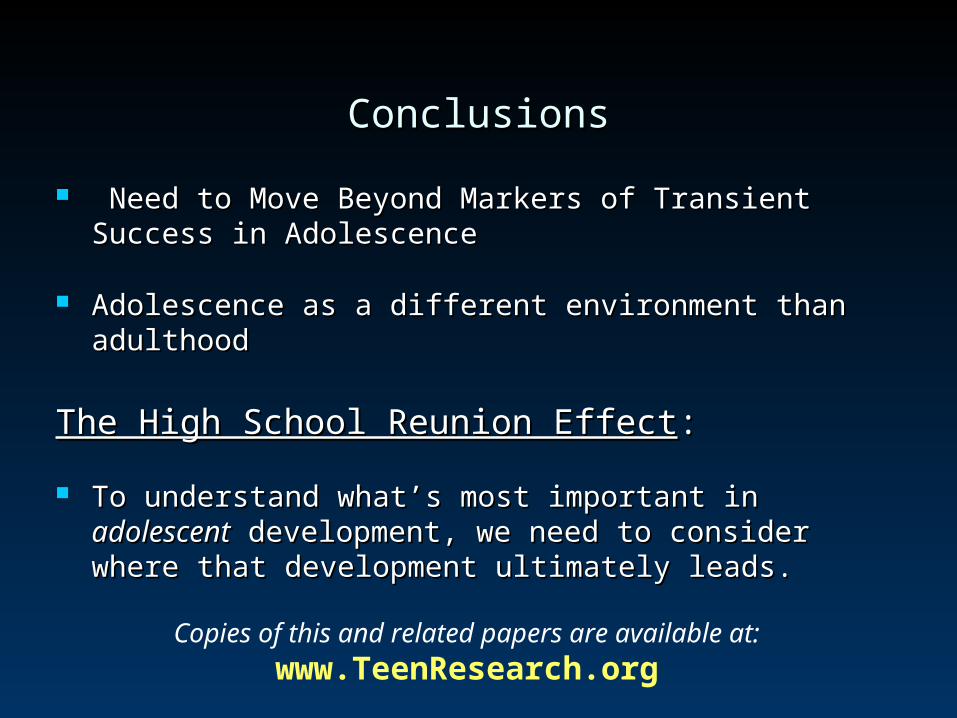
ConclusionsConclusions
Need to Move Beyond Markers of Transient Success in Need to Move Beyond Markers of Transient Success in AdolescenceAdolescence
Adolescence as a different environment than adulthoodAdolescence as a different environment than adulthood
The High School Reunion EffectThe High School Reunion Effect::
To understand what’s most important in To understand what’s most important in adolescentadolescent development, we need to consider where that development development, we need to consider where that development ultimately leads.ultimately leads.
Copies of this and related papers are available at:
www.TeenResearch.org