Embed Size (px)
Citation preview
POPE One Year After Study
M1 Junction 31-32 Widening
September 2009
NoticeThis report was produced by Atkins Limited for the Highways Agency for the specific purpose of POPE One Year After evaluation of M1 J31 to 32 Widening Scheme. This report may not be used by any person other than the Highways Agency without the Highways Agency’s express permission. In any event, Atkins accepts no liability for any costs, liabilities or losses arising as a result of the use of or reliance upon the contents of this report by any person other than the Highways Agency.
Document History
JOB NUMBER: 5081587 DOCUMENT REF: M1 J31-32 OYA final.docx
1 Final for Internal Review RB SB / AC YP 25/08/09
2 Final for External Review RB SB NM PR 18/09/09
3 Final RB SB NM PR 29/10/09
Revision Purpose Description Origin Checked Reviewed Authorised Date
POPE One Year After Evaluation: M1 Junction 31-32 Widening
POPE _ M1 J31-32 OYA _ final.docx
ContentsSection Page Glossary of Terms III�
Executive Summary VII�
1.� Introduction 1�Scheme Problems & Objectives 2�Scheme in Detail 2�Post Opening Project Evaluation 9�Report Format 10�
2.� Data Collection 11�Introduction 11�Traffic Data 11�Traffic Volume and Growth 11�Journey Times 15�Accident Data 20�
3.� Traffic Analysis 22�Introduction 22�Traffic Volume Changes 22�Forecast Traffic Volumes 27�Journey Times 29�Route Stress 33�Key Points from Section 3 - Traffic 34�
4.� Safety 35�Introduction 35�Methodology 35�Predicted Accident Savings (OPR COBA Assessment) 35�Re-forecast Assessment of Accidents 38�Personal Security 52�Key Points from Section 4 – Safety Analysis 55�
5.� Economy 56�Introduction 56�Methodology 56�Predicted Benefits 58�Outturn Benefits 61�Key Points from Section 5 – Economy 67�
6.� Environment 68�Introduction 68�Traffic Volumes 70�Noise 71�Local Air Quality 71�Greenhouse Gases 71�
POPE One Year After Evaluation: M1 Junction 31-32 Widening
POPE _ M1 J31-32 OYA _ final.docx
Landscape 72�Cultural Heritage 73�Biodiversity 73�Water Environment 75�Physical Fitness 76�Journey Ambience 76�Key Points from Section 6 – Environment 78�
7.� Accessibility and Integration 79�Accessibility 79�Integration 80�Key Points from Section 7 – Accessibility and Integration 83�
8.� Appraisal and Evaluation Summary Tables 84�Introduction 84�
9.� Conclusions 88�
AppendicesAppendix A Traffic Volume Tables with Growth 90�A.1� HA Traffic Volumes and Growth 91�A.2� SCC Traffic Volumes and Growth 93�
Appendix B – A6102 Timing Points 94�
Appendix C – Calculation of Route Stress 96�C.1� Calculation of Route Stress 97�
Appendix D – Calculation of Accident Rates 98�D.1� Accident Rate for OPR COBA Accident Boundary 99�D.2� Accident Rate for Revised Accident Boundary 99�
Appendix E – Chi Squared Statistical Tests 100�E.1� Chi Squared Statistical Test for OPR COBA Accident Boundary 101�E.2� Chi Squared Statistical Test for Revised Accident Boundary 102�
Appendix F – OPR COBA Network Diagram 103�
Appendix G – Calculation of Safety Benefits 105�G.1� Calculation of Safety Benefits for M1 J31-32 Section Only 106�G.2� Calculation of Safety Benefits for Revised Accident Area 107�
Appendix H – Economy Calculations 108�H.1� Vehicle Hours and Vehicle Hour Savings per Weekday 109�H.2� Vehicle Hours and Vehicle Hour Savings per Weekday with equal Before and After Flows 109�H.3� Calculation of Value of Time (VoT) Benefits 109�H.4� Present Value of Benefits for M1 J31-32 Widening Scheme (£Ms in 2002 prices) 110�
Appendix I – Environmental Evaluation 111�I.1� Introduction 112�I.2� Data Collection 112�I.3� Site Visit 112�I.4� Consultations 112�I.5� Traffic Flows 113�
POPE One Year After Evaluation: M1 Junction 31-32 Widening
POPE _ M1 J31-32 OYA _ final.docx
I.6� Noise 114�I.7� Local Air Quality 117�I.8� Greenhouse Gases 118�I.9� Landscape 119�I.10� Cultural Heritage 129�I.11� Biodiversity 134�I.12� Water Environment 139�I.13� Physical Fitness 145�I.14� Journey Ambience 148�
Glossary of Terms Term Abr. Description where appropriate
Annual Average Daily Traffic AADT Average of 24 hour flows, seven days a week, for all days within the
year.
Annual Average Weekday Traffic AAWT As AADT but for five days, (Monday to Friday) only.
Accessibility - Accessibility can be defined as ‘ease of reaching’. The accessibility objective is concerned with increasing the ability with which people in different locations, and with differing availability of transport, can reach different types of facility.
AM - Denoting the morning peak period
Appraisal Summary Table AST
This records the impacts of the scheme according to the Government’s five key objects for transport, as defined in DfT guidance contained on its Transport Analysis Guidance web pages, WebTAG
Automatic Traffic Count ATC An automated method of recording the volume (and sometimes
classification) of vehicles passing a particular point on a road.
Average Weekday Traffic AWT Average of Monday to Friday 24 hour flows over a particular period.
Average Daily Traffic ADT Average of Monday to Sunday 24 hour flows over a particular
period.
Benefit Cost Ratio BCR The ratio between the monetised benefits and costs of a scheme, used as a measure of value for money in economic terms.
Capacity - The maximum hourly lane throughput
Capitalisation - The process by which benefits for a scheme are factored to give an estimate for the appropriate appraisal period.
Chi-Square -
A statistical test to determine whether the observed values of a variable are significantly different from those expected on the basis of a null hypothesis. Variables are categorised to determine whether a distribution of scores is due to chance or experimental factors and tests whether one variable is independent of another.
POPE One Year After Evaluation: M1 Junction 31-32 Widening
POPE _ M1 J31-32 OYA _ final.docx
Term Abr. Description where appropriate
Close Circuit Television CCTV Closed Circuit Televisions are used on the Highways Agency
Network to provide Real Time Information
Cost Benefit Analysis COBA
A computer program which compares the costs of providing road schemes with the benefits derived by road users (in terms of time, vehicle operating costs and accidents), and expresses the results in terms of a monetary valuation. The COBA model uses a fixed trip matrix.
Congestion Reference Flow CRF An AADT flow estimate at which a road is likely to be congested in
the peak periods on an average day.
Department for Transport DfT
A Government department whose objective is to oversee the delivery of a reliable, safe and secure transport system that responds efficiently to the needs of individuals and business whilst safeguarding our environment. The Highways Agency is an executive of the DfT.
Discounting -
Discounting is a technique used to compare costs and benefits that occur in different time periods and is the process of adjusting future cash flows to their present values to reflect the time value of money, e.g. £1 worth of benefits now is worth more than £1 in the future. A standard base year needs to be used which is 2002 for the appraisal used in this report.
Design Manual for Roads and Bridges DMRB
A comprehensive manual system which sets out current standards, Advice Notes and other published documents relating to Trunk Road works.
Do-minimum DM In scheme modelling, this is the scenario which comprises the existing road network plus improvement schemes that have already been committed.
Do-something DS In scheme modelling, this is the scenario detailing the planned scheme.
Enhanced Messaging Signs EMS
Can be mounted either on cantilever posts or alongside Gantry Mounted Signals. Display information about incidents and hazards. 2 lines of 12 or 16 characters are used for tactical messages and 3 lines of 12 or 18 characters are used for strategic messages.
Environmental Impact Assessment EIA
A procedure that must be followed for certain types of development before they are granted development consent. The requirement for EIA comes from a European Directive (85/33/EEC as amended by 97/11/EC).
Environmental Statement ES
This must be submitted with the initial planning application and covers all potential significant impacts that the road project may have.
Evaluation Summary Table EST In POPE studies, this is a summary of the evaluations of the TAG
objectives using a similar format to the forecasts in the AST.
Emergency Refuge ER A lay-by or safe area for vehicles to pull into in emergency situations, usually equipped with emergency telephones.
Grade Separated - The process of aligning a junction of two or more transport axes at different heights (grades) so that they will not disrupt the traffic flow on other transit routes when they cross each other.
Great Crested Newt GCN A newt found in Europe and parts of Asia
POPE One Year After Evaluation: M1 Junction 31-32 Widening
POPE _ M1 J31-32 OYA _ final.docx
Term Abr. Description where appropriate
Heavy Goods Vehicle HGV Goods-carrying vehicle over 3,500kg unladen weight.
Highways Agency HA An Executive Agency of the Department for Transport (DfT),responsible for operating, maintaining and improving the strategic road network in England.
Journey Time Data Base JTDB
The database contains average journey times and traffic flow information for vehicles on the network for each 15-minute interval throughout the year. This tool can be used to view information on performance indicators such as delay, level of service and journey time variability.
Kph Kph Kilometres per hour
Killed or Seriously Injured
KSI A term used to describe the number of people killed or seriously injured as a result of PIAs.
Local Authority LA Local Government of the United Kingdom
Major Schemes Programme -
The HA’s programme of investment in improvements to the Trunk road and Motorway road network comprised of a number of major schemes each costing more than £5m. Formerly known as TPI.
Managing Agent Contractor MAC The term maintenance contractor, who look after a specific segment
of the HA trunk road network.
New Approach To Appraisal NATA Used for transport scheme appraisal since 1998.
Non Motorised User NMU A term used to describe pedestrians, cyclists and equestrians.
National Road Traffic Forecast NRTF
This document defines the latest forecasts produced by the DfT of the growth in the volume of motor traffic. The most recent one is NRTF 08.
Office of Government Commerce
OGC An office of HM Treasury that helps the Government to deliver best value for money from its funding
One Year After OYA Relating to a POPE study One Year After scheme opening.
Order Publication Report OPR A specific stage in the scheme appraisal process.
Project Appraisal Report PAR
The PAR is a key summary document in which the need for a project, its costs and benefits are appraised. Used for road scheme’s less than £5m.
Part 1 Claims - Claims for compensation under Part 1 of the Land Compensation Act 1973, relating to homeowners affected by road schemes
Personal Injury Accident PIA A term commonly used to refer to road accidents.
Personal Injury Accidents per million vehicle kilometres
PIA/mvkm
A term used to express accident rates for a particular link on a road, i.e. the number of accidents per million vehicle kilometres travelled.
PM - Evening peak period
POPE One Year After Evaluation: M1 Junction 31-32 Widening
POPE _ M1 J31-32 OYA _ final.docx
Term Abr. Description where appropriate
Post Opening Project Evaluation POPE Before & after monitoring of all major highway schemes in England.
Present Value of Benefits PVB The value of the scheme’s estimated benefits discounted back to a
common base year.
Present Value of Costs PVC The value of the scheme’s estimated costs discounted back to a
common base year.
Road Transport Forecasts 2008 RTF08
The latest DfT forecasts of road traffic growth, the associated congestion, journey times and emissions. The estimates are provided up to 2025.
Security - In terms of the NATA sub-objective relating to the likelihood of crime or perception of likely crime.
Severance - Community severance is the separation of adjacent areas by road or heavy traffic, causing negative impact on non-motorised users, particularly pedestrians.
Site of Scientific Interest SSI Local sites as being of ecological importance in terms of flora,
fauna, geological or physiological features.
Sites and Monuments Record SMR
Sites and Monuments Record is an inventory of known archaeological and historical features usually held on an electronic database
South and West Yorkshire Multi Modal Study
SWYMMS
The SWYMMS made recommendations for an integrated and sustainable strategy for the strategic road, rail and water networks in South and West Yorkshire, including a plan of specific interventions to address the most urgent key strategic problems in this area through to 2021.
STATS19 - A database of injury accident statistics recorded by police officers attending accidents
‘Route Stress’ Stress Ratio of the AADT flow to the CRF. When the traffic flow on a particular link reaches the CRF it is considered to be at 100% Stress.
Trip End Model Program
TEMPRO
A program which provides access to the DfT's national Trip End Model projections of growth in travel demand, and the underlying car ownership and planning data projections.
Targeted Programme of Improvements.
TPIThe Highways Agency’s programme of investment in improvements to the Trunk road and Motorway road network comprised of a number of major schemes each costing more than £5m. Now called Major Schemes.
Traffic Database TRADs Traffic count database developed by the Agency, to hold data from the Midlands, Southern and Northern monitoring regions.
Vehicle Operating Cost VOC Reflects fuel and other operating costs calculated from total
distance travelled on affected links, also taking into account speeds.
Value of Time VOT A monetary value placed on the benefits accrued by a road scheme in terms of vehicle hours.
webTAG - Department for Transport’s website for guidance on the conduct of transport studies at http://www.webtag.org.uk/

POPE One Year After Evaluation: M1 Junction 31-32 Widening
POPE _ M1 J31-32 OYA _ final.docx
Executive Summary
Scheme Title M1 Junction 31-32 Widening Opening Date February 2008 POPE Stage One Year After
Scheme Description The scheme comprised of widening of the M1 between junctions 31 and 32. Specific elements of the scheme include:
� Widening 2 kms of the northbound and southbound carriageways from 3 to 4 lanes;� Installation of new electronic signage, providing better driver information and
improved traffic management; � Installation of new emergency telephones; � Improved road markings including a ‘ghost island’ separating two merging lanes
between the M18 and M1 southbound; � Low noise surface and mounding; and � Mitigation planting to reduce the impact for visual receptors.
Objectives (Traffic Appraisal and Economics Report) Objective Achieved?
� To reduce congestion by increasing the overall capacity of the section by adding a fourth lane for traffic in both directions
Yes
� Improve safety through improved traffic management No
� Improve journey times and journey time reliability� Reduce or minimise traffic diverting onto Local
Authority routes � Reduce traveller stress by improving traffic flow and
reducing delays.
Yes
Yes
Yes
Key Findings
� This scheme has reduced congestion, improved journey times and reliability and minimised traffic diverting onto Local Authority roads.
� After one year the number of accidents in the widened section have increased, but not at a statistically significant level. However, accidents in a wider study area including adjacent sections of the motorway have decreased.
� Outturn traffic volumes are lower than forecast. The forecasts did not take into account the general decrease in motorway traffic flows in the area that has occurred in recent years.
� There is little evidence to suggest that the impacts of the scheme on traffic volumes extend beyond the link that has been widened.
� There has been a general decrease in journey times on most motorway links, both on the widened J31-32 and most of the other links.
� Travel time benefits are considerably lower than forecast but it is not clear whether the journey time benefits have been caused by the scheme or by falling traffic volumes on the motorway.
POPE One Year After Evaluation: M1 Junction 31-32 Widening
POPE _ M1 J31-32 OYA _ final.docx
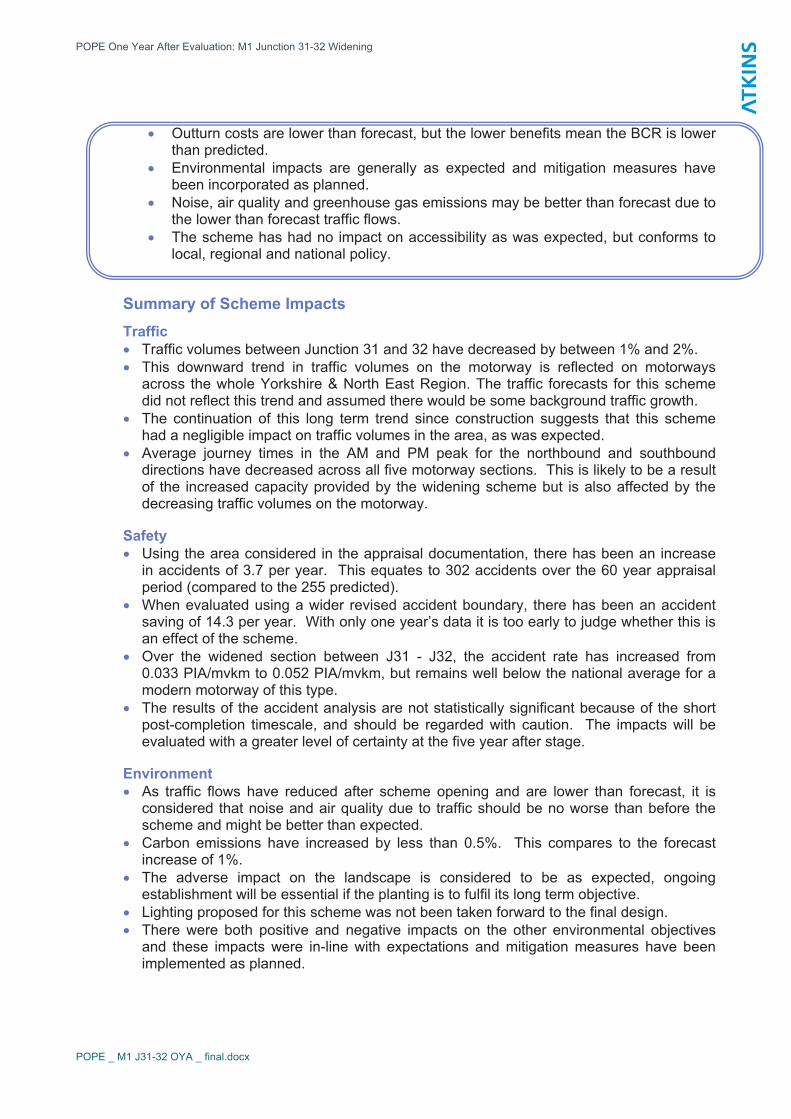
� Outturn costs are lower than forecast, but the lower benefits mean the BCR is lower than predicted.
� Environmental impacts are generally as expected and mitigation measures have been incorporated as planned.
� Noise, air quality and greenhouse gas emissions may be better than forecast due to the lower than forecast traffic flows.
� The scheme has had no impact on accessibility as was expected, but conforms to local, regional and national policy.
Summary of Scheme Impacts Traffic� Traffic volumes between Junction 31 and 32 have decreased by between 1% and 2%. � This downward trend in traffic volumes on the motorway is reflected on motorways
across the whole Yorkshire & North East Region. The traffic forecasts for this scheme did not reflect this trend and assumed there would be some background traffic growth.
� The continuation of this long term trend since construction suggests that this scheme had a negligible impact on traffic volumes in the area, as was expected.
� Average journey times in the AM and PM peak for the northbound and southbound directions have decreased across all five motorway sections. This is likely to be a result of the increased capacity provided by the widening scheme but is also affected by the decreasing traffic volumes on the motorway.
Safety � Using the area considered in the appraisal documentation, there has been an increase
in accidents of 3.7 per year. This equates to 302 accidents over the 60 year appraisal period (compared to the 255 predicted).
� When evaluated using a wider revised accident boundary, there has been an accident saving of 14.3 per year. With only one year’s data it is too early to judge whether this is an effect of the scheme.
� Over the widened section between J31 - J32, the accident rate has increased from 0.033 PIA/mvkm to 0.052 PIA/mvkm, but remains well below the national average for a modern motorway of this type.
� The results of the accident analysis are not statistically significant because of the short post-completion timescale, and should be regarded with caution. The impacts will be evaluated with a greater level of certainty at the five year after stage.
Environment� As traffic flows have reduced after scheme opening and are lower than forecast, it is
considered that noise and air quality due to traffic should be no worse than before the scheme and might be better than expected.
� Carbon emissions have increased by less than 0.5%. This compares to the forecast increase of 1%.
� The adverse impact on the landscape is considered to be as expected, ongoing establishment will be essential if the planting is to fulfil its long term objective.
� Lighting proposed for this scheme was not been taken forward to the final design. � There were both positive and negative impacts on the other environmental objectives
and these impacts were in-line with expectations and mitigation measures have been implemented as planned.

POPE One Year After Evaluation: M1 Junction 31-32 Widening
POPE _ M1 J31-32 OYA _ final.docx
Accessibility � The scheme has had no impact on accessibility as was expected. � The scheme has not resulted in new public transport schemes or improved access to
public transport. Due to the nature of the scheme (motorway widening) there has been no direct impact on any routes used by pedestrians, equestrians or cyclists or to the standard and quality of the routes.
Integration� The appraisal forecast a neutral impact on local, regional and national land use policy,
as the scheme had both adverse and beneficial effects. The schemes objectives are generally consistent with those in the following documents: White Paper: 'A New Deal For Transport: Better For Everyone' (1998), South and West Yorkshire Multi-Modal Study (SWYMMS); The Yorkshire & Humber Plan: Regional Spatial Strategy to 2026: (2008) and South Yorkshire Local Transport Plan 1 (2001 – 2006).
� However, the adverse impacts on biodiversity, heritage and landscape and the increase in accidents do not meet objectives in White Paper.
Summary of Economic Performance
Costs in £m 2002 Prices discounted to 2002 at 3.5%
Pre Scheme Forecast
Order Publication Report (OPR) COBA
Updated COBA (using actual
outturn figures)
Post-scheme
Re-forecast
Journey Time Benefit £329.0m £180.1m £77.2m
Vehicle Operating Cost - £17.9m - £15.4m - £15.4m
Highway Maintenance Impacts - £4.1m - £4.1m - £4.1m
Safety Benefits - £11.4m - £3.7m - £18.0m
Total 60 Year Benefits (PVB) £295.6m £157.2m £39.7m
Costs (2002) prices £17.1m £16.5m £11.3m
Benefit Cost Ratio (BCR) 17.4 9.6 3.5
� The re-forecast of scheme benefits has concentrated on journey time and safety impacts. The vehicle operating costs and the maintenance delay impacts have been assumed to be the same as the appraisal.
� Journey time benefits at £77m are 75% less than predicted (OPR COBA), which is largely due to lower than expected volumes of traffic on the motorway.
� Despite construction costs being less than forecast, the lower benefits result in the BCR being much lower than expected. However, at 3.5 the scheme still represents good value for money.
This document summarises the findings of the one year after post opening evaluation study completed in September 2009.
POPE One Year After Evaluation: M1 Junction 31-32 Widening
POPE _ M1 J31-32 OYA _ final.docx 1
1. Introduction 1.1 This report is the Post Opening Project Evaluation (POPE) of the Highway
Agency scheme to widen the M1 motorway between J31 – 32 in South Yorkshire. It is a One Year After opening report.
1.2 The widening of the M1 motorway between J31 - J32 was part of a wider improvement package to widen the M1 between J30 - J42, and the M62 between J25 - J28. These schemes were the response to Department for Transport (DfT) recommendations in the South and West Yorkshire Multi Modal Study (SWYMMS) for increased capacity on the M1 and M62.
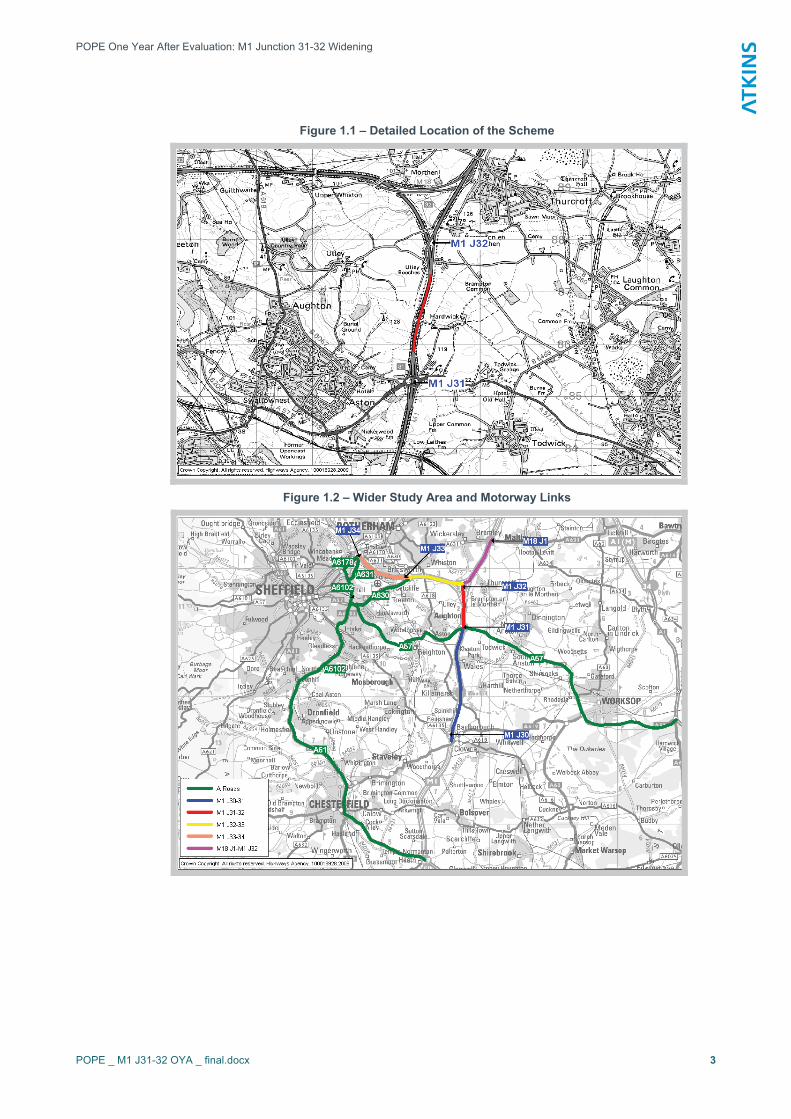
1.3 More recently, the scale of the motorway widening proposals in this corridor has been reduced and the carriageway widening has been replaced by a Managed Motorway scheme between J32 – J35a that makes use of new hard shoulder running and traffic management systems to provide additional capacity.
1.4 The M1 J31-32 widening is a major Highways Agency scheme designed to reduce congestion, improve safety and journey time reliability on this section of the M1. The scheme widened the motorway from three lanes to four lanes in both directions between the two junctions and included new electronic overhead signs along the length of the section. Construction on the scheme started in January 2007 and was completed in December 2007, although a 50mph speed restriction on the section was not removed until February 2008. The scheme lies within Highways Agency (HA) Area 12.
1.5 The original scheme became a part of the wider M1 and M62 Motorway Improvements in Yorkshire. The original appraisal does not take into account the impact of the widening scheme on the sections of the motorway upstream or downstream of J31 – 32, or on the local authority road network.
1.6 This Post Opening Project Evaluation (POPE) of the scheme One Year After (OYA) opening will, however, consider the wider impacts of the scheme on the adjacent motorway sections and on the strategic local authority (LA) routes, in addition to the local area analysed in the pre-scheme appraisal. This analysis will be used to assess whether the appraisal of just the single motorway link was a valid approach.
POPE One Year After Evaluation: M1 Junction 31-32 Widening
POPE _ M1 J31-32 OYA _ final.docx 2
Scheme Problems & Objectives Scheme Problems
1.7 Prior to the construction of the scheme, there were a number of problems reported along this section of the M1. These are summarised below:
� Traffic flows exceeding capacity;
� Difficult approach gradients;
� Close proximity of junctions creating difficult weaving, merging and diverging conditions;
� Unreliable journey times;
� Traveller stress caused by queuing traffic and delays; and
� Potential wider impacts with traffic diverting on to local authority roads.
Scheme Objectives1
1.8 To alleviate the problems identified on this section of the M1, the primary objectives of the scheme were to:
� Reduce congestion by increasing the overall capacity of the section by adding a fourth lane for traffic in both directions;
� Improve safety through improved traffic management;
� Improve journey times and journey time reliability;
� Reduce or minimise traffic diverting on to local authority routes; and
� Reduce traveller stress by improving traffic flow and reducing delays.
Scheme in Detail Scheme Location
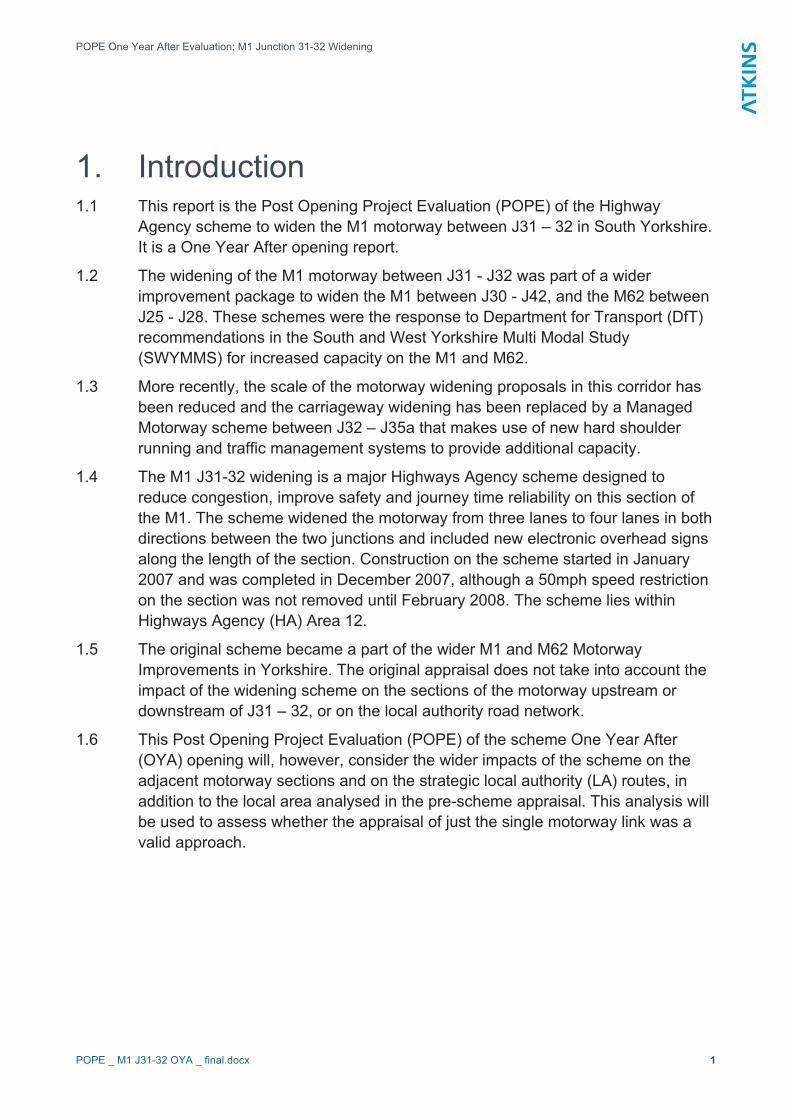
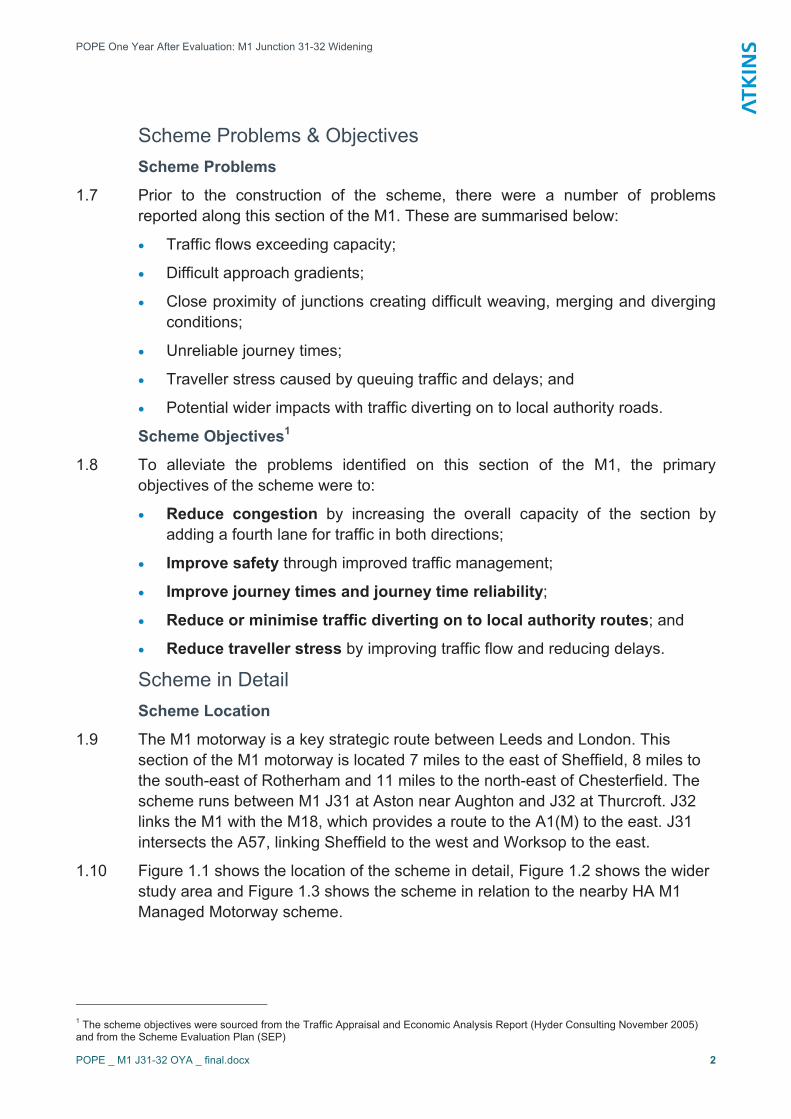
1.9 The M1 motorway is a key strategic route between Leeds and London. This section of the M1 motorway is located 7 miles to the east of Sheffield, 8 miles to the south-east of Rotherham and 11 miles to the north-east of Chesterfield. The scheme runs between M1 J31 at Aston near Aughton and J32 at Thurcroft. J32 links the M1 with the M18, which provides a route to the A1(M) to the east. J31 intersects the A57, linking Sheffield to the west and Worksop to the east.
1.10 Figure 1.1 shows the location of the scheme in detail, Figure 1.2 shows the wider study area and Figure 1.3 shows the scheme in relation to the nearby HA M1 Managed Motorway scheme.
1 The scheme objectives were sourced from the Traffic Appraisal and Economic Analysis Report (Hyder Consulting November 2005) and from the Scheme Evaluation Plan (SEP)
POPE One Year After Evaluation: M1 Junction 31-32 Widening
POPE _ M1 J31-32 OYA _ final.docx 3
Figure 1.1 – Detailed Location of the Scheme
Figure 1.2 – Wider Study Area and Motorway Links
POPE One Year After Evaluation: M1 Junction 31-32 Widening
POPE _ M1 J31-32 OYA _ final.docx 4
Figure 1.3 - M1 J31-32 in relation to HA Managed Motorway Scheme2
Historical Context
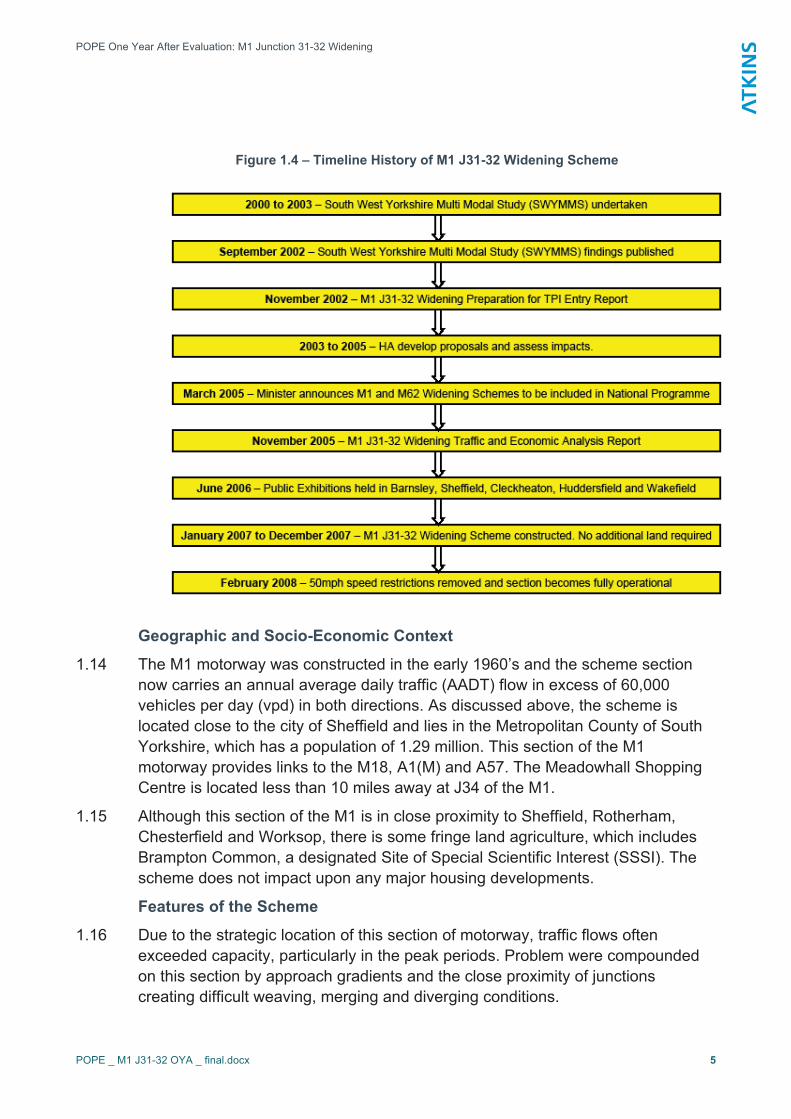
1.11 In September 2002, the government published the findings of the South and West Yorkshire Multi-Modal Study (SWYMMS). The study recommended that the section of the M1 between junction 31 and 32 should be included in the Government’s Targeted Programme of Improvements (TPI) for completion by the year 2006. The TPI Programme is now known as ‘Major Schemes’.
1.12 Between 2003 and 2005 the proposals for the scheme were developed in more detail and the scheme impacts were assessed, including a traffic and economic appraisal of the scheme. Scheme construction took place between January 2007 and December 2007.
1.13 The flow chart in Figure 1.4 provides a timeline history of the scheme.
2 Source: HA Website, Road Projects, October 2009,
POPE One Year After Evaluation: M1 Junction 31-32 Widening
POPE _ M1 J31-32 OYA _ final.docx 5
Figure 1.4 – Timeline History of M1 J31-32 Widening Scheme
Geographic and Socio-Economic Context
1.14 The M1 motorway was constructed in the early 1960’s and the scheme section now carries an annual average daily traffic (AADT) flow in excess of 60,000 vehicles per day (vpd) in both directions. As discussed above, the scheme is located close to the city of Sheffield and lies in the Metropolitan County of South Yorkshire, which has a population of 1.29 million. This section of the M1 motorway provides links to the M18, A1(M) and A57. The Meadowhall Shopping Centre is located less than 10 miles away at J34 of the M1.
1.15 Although this section of the M1 is in close proximity to Sheffield, Rotherham, Chesterfield and Worksop, there is some fringe land agriculture, which includes Brampton Common, a designated Site of Special Scientific Interest (SSSI). The scheme does not impact upon any major housing developments.
Features of the Scheme
1.16 Due to the strategic location of this section of motorway, traffic flows often exceeded capacity, particularly in the peak periods. Problem were compounded on this section by approach gradients and the close proximity of junctions creating difficult weaving, merging and diverging conditions.
POPE One Year After Evaluation: M1 Junction 31-32 Widening
POPE _ M1 J31-32 OYA _ final.docx 6
1.17 J31 was a conventional grade separated junction with a two bridge roundabout over the M1. Between the two junctions, there is one overbridge for farm access and no underbridges. No additional land was required as the scheme was constructed within the existing highway boundary.
1.18 The scheme was expected to include the following:
� Widening of the northbound and southbound carriageways from 3 to 4 lanes along a length of 2km;
� Installation of new electronic signage, providing better driver information and improved traffic management;
� Improved lighting (although no specific details of lighting were provided in the appraisal and this element was subsequently removed);
� Installation of new emergency telephones;
� Improved road markings including a ‘ghost island’ separating two merging lanes between the M18 and M1 southbound;
� Low noise surface and mounding; and
� Mitigation planting to reduce the impact for visual receptors.
1.19 During scheme construction the following was expected:
� During the day, 3 lanes in each direction were to remain open to traffic to minimise disruption;
� Any lane closures to occur either at weekends, or during the night3; and
� A 50mph speed limit to be implemented and enforced by speed cameras throughout the works.
Implementation
1.20 After a visit to the site in July 2009, an assessment of the scheme was undertaken, comparing the predicted scheme detail against what was actually implemented on the ground. The following observations were recorded;
� The section has been widened in both directions and the scheme did cover a total of 2km in length. Figure 1.5 is a photograph taken from the Vessey Farm Overbridge showing the additional lanes in both the northbound and southbound directions;
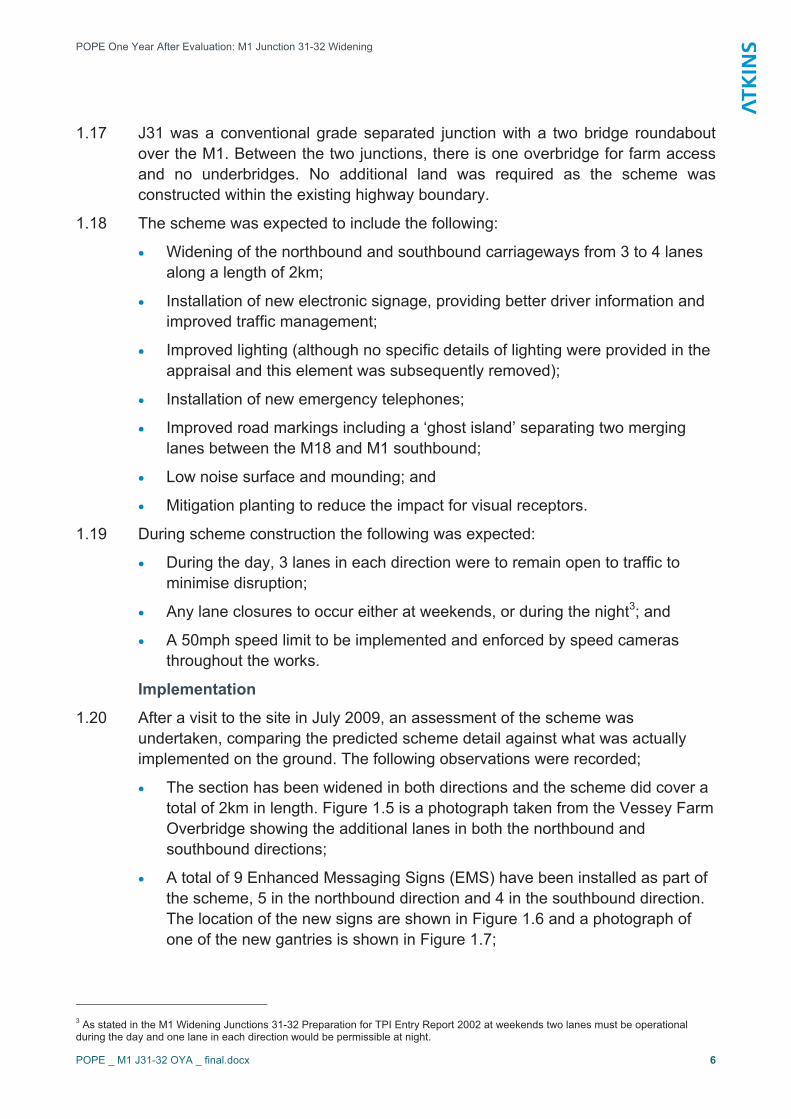
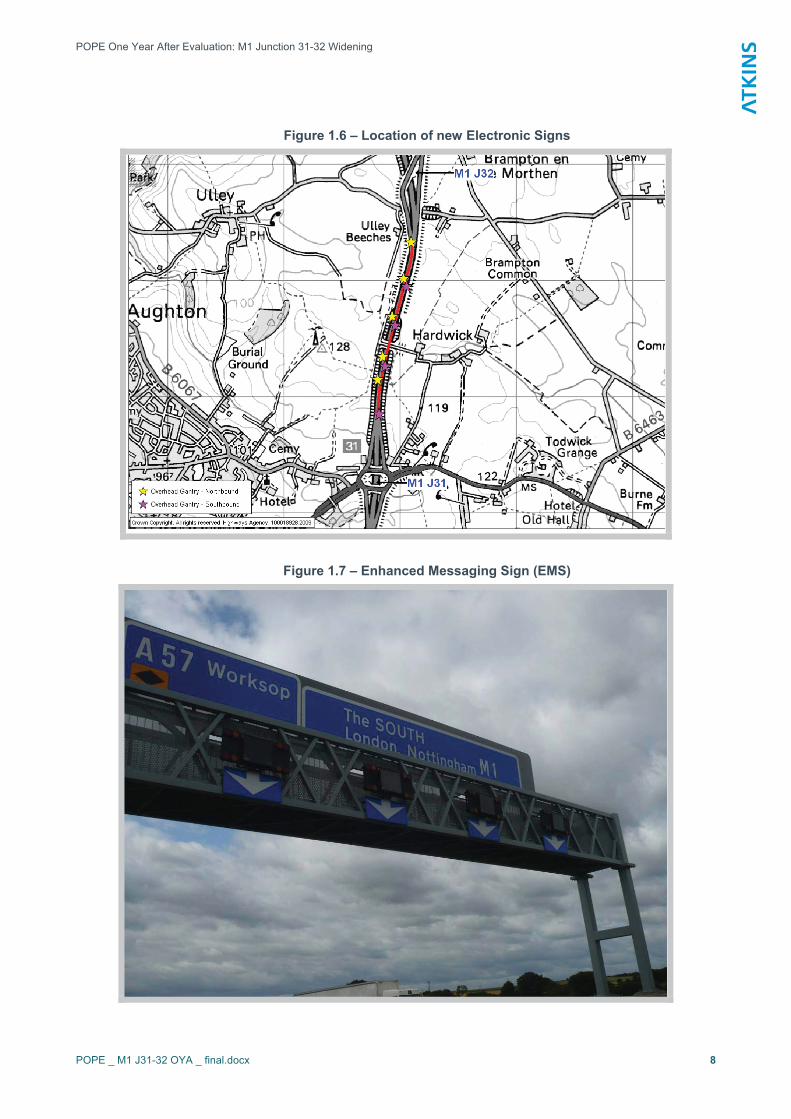
� A total of 9 Enhanced Messaging Signs (EMS) have been installed as part of the scheme, 5 in the northbound direction and 4 in the southbound direction. The location of the new signs are shown in Figure 1.6 and a photograph of one of the new gantries is shown in Figure 1.7;
3 As stated in the M1 Widening Junctions 31-32 Preparation for TPI Entry Report 2002 at weekends two lanes must be operational during the day and one lane in each direction would be permissible at night.

POPE One Year After Evaluation: M1 Junction 31-32 Widening
POPE _ M1 J31-32 OYA _ final.docx 7
� New emergency telephones have been installed. Two emergency telephones have been added to both the northbound and southbound carriageways;
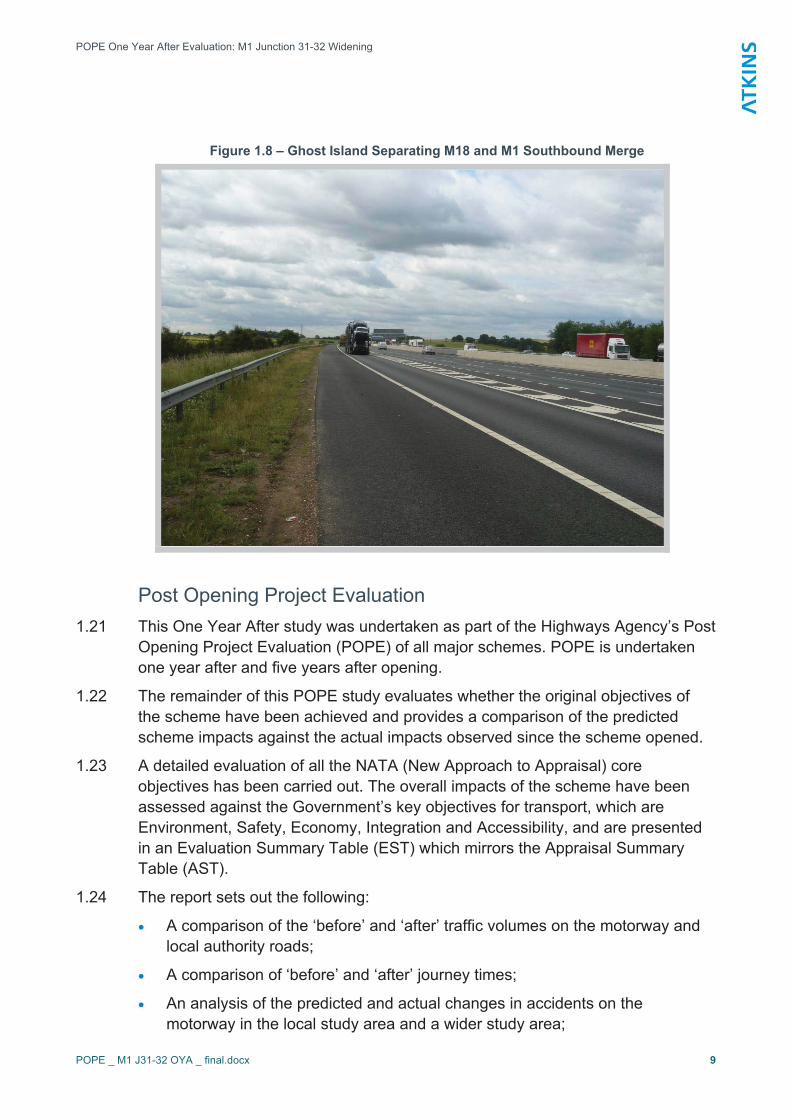
� Improved road markings have been added, including the ghost island separating the merging lanes between the M1 and M18 at J32. This is shown in Figure 1.8;
� Low noise surfacing has been added to the section. This was confirmed with the Area 12 MAC; and
� Mitigation planting has been included as part of the scheme.Figure 1.5 – View of additional lanes from Vessey Close Farm Overbridge
POPE One Year After Evaluation: M1 Junction 31-32 Widening
POPE _ M1 J31-32 OYA _ final.docx 8
Figure 1.6 – Location of new Electronic Signs
Figure 1.7 – Enhanced Messaging Sign (EMS)
POPE One Year After Evaluation: M1 Junction 31-32 Widening
POPE _ M1 J31-32 OYA _ final.docx 9
Figure 1.8 – Ghost Island Separating M18 and M1 Southbound Merge
Post Opening Project Evaluation
1.21 This One Year After study was undertaken as part of the Highways Agency’s Post Opening Project Evaluation (POPE) of all major schemes. POPE is undertaken one year after and five years after opening.
1.22 The remainder of this POPE study evaluates whether the original objectives of the scheme have been achieved and provides a comparison of the predicted scheme impacts against the actual impacts observed since the scheme opened.
1.23 A detailed evaluation of all the NATA (New Approach to Appraisal) core objectives has been carried out. The overall impacts of the scheme have been assessed against the Government’s key objectives for transport, which are Environment, Safety, Economy, Integration and Accessibility, and are presented in an Evaluation Summary Table (EST) which mirrors the Appraisal Summary Table (AST).
1.24 The report sets out the following:
� A comparison of the ‘before’ and ‘after’ traffic volumes on the motorway and local authority roads;
� A comparison of ‘before’ and ‘after’ journey times;
� An analysis of the predicted and actual changes in accidents on the motorway in the local study area and a wider study area;

POPE One Year After Evaluation: M1 Junction 31-32 Widening
POPE _ M1 J31-32 OYA _ final.docx 10
� A monetised comparison of the predicted and actual economic impacts of the M1 widening scheme; and
� An evaluation of the scheme against the environment, accessibility and integration sub-objectives.
Report Format 1.25 Following on from this introduction to the scheme, the report includes:
� Section 2 – Data Collection. This section describes the sources that have been used to gather the data for the traffic and safety analyses, and how this data has been interpreted and used;
� Section 3 – Traffic Analysis. This section is an analysis of the traffic impacts of the scheme and includes a comparison of ‘before’ and ‘OYA’ traffic volumes, journey times and speeds on the HA trunk road network and on surrounding local authority maintained roads;
� Section 4 – Safety. This section discusses changes in accident patterns as a result of the scheme and makes detailed analysis based on accident data from 3 years prior to scheme construction and 1 year after the scheme opened;
� Section 5 – Economy. A re-evaluation of the scheme costs and benefits using observed journey times and accident numbers from the first full year after opening, comparing predicted benefits and costs with actual;
� Section 6 – Environment. A review of the environmental impacts of the scheme is given and supported by an evaluation of the mitigation measures proposed within the scheme’s Environmental Statement;
� Section 7 – Accessibility and Integration. A review of how the widening scheme has affected accessibility for pedestrians, cyclists and public transport users is presented. Furthermore, a review of how the scheme links with wider policy objectives is also given;
� Section 8 – Appraisal and Evaluation Summary Tables. This section contains an overview of the actual scheme impacts compared to those predicted in the original Appraisal Summary Table; and
� Section 9 – Conclusions. This section summarises the findings of the report in order to evaluate the overall success of the scheme against its objectives.
POPE One Year After Evaluation: M1 Junction 31-32 Widening
POPE _ M1 J31-32 OYA _ final.docx 11
2. Data Collection Introduction
2.1 This section presents the sources of data for the various evaluations that been carried out and how that data has been interpreted and used in the following sections.
Traffic Data 2.2 Traffic volume, journey time and speed data used in the post opening evaluation
has been obtained from a variety of different sources.
2.3 Before and after traffic volume data has been obtained from two main sources as detailed below:
� Automatic Traffic Count (ATC) data from the Highways Agency Traffic Flow Database (TRADs) for the HA motorway and trunk road network; and
� Automatic Traffic Count data from Sheffield City Council (SCC) for LA routes.
2.4 Before and after journey time and speed data has been obtained from two main sources as detailed below:
� HA Journey Time Database (JTDB) for motorway links; and
� SCC Journey Time surveys for LA routes.
2.5 It should be noted that only spot speeds were available from the SCC journey time surveys and therefore speeds for LA routes have not been analysed in this evaluation.
Traffic Volume and Growth Count Site Locations
2.6 Traffic volume data was collated for the following motorway links and LA routes:
� HA motorway links including M1 J30-31, J31-32, J32-33, J33-34 and M18 J1-M1 J32;
� LA routes including the A57, A63, A6178 and A6102; and
� M1 J34 northbound and southbound exit slips4.
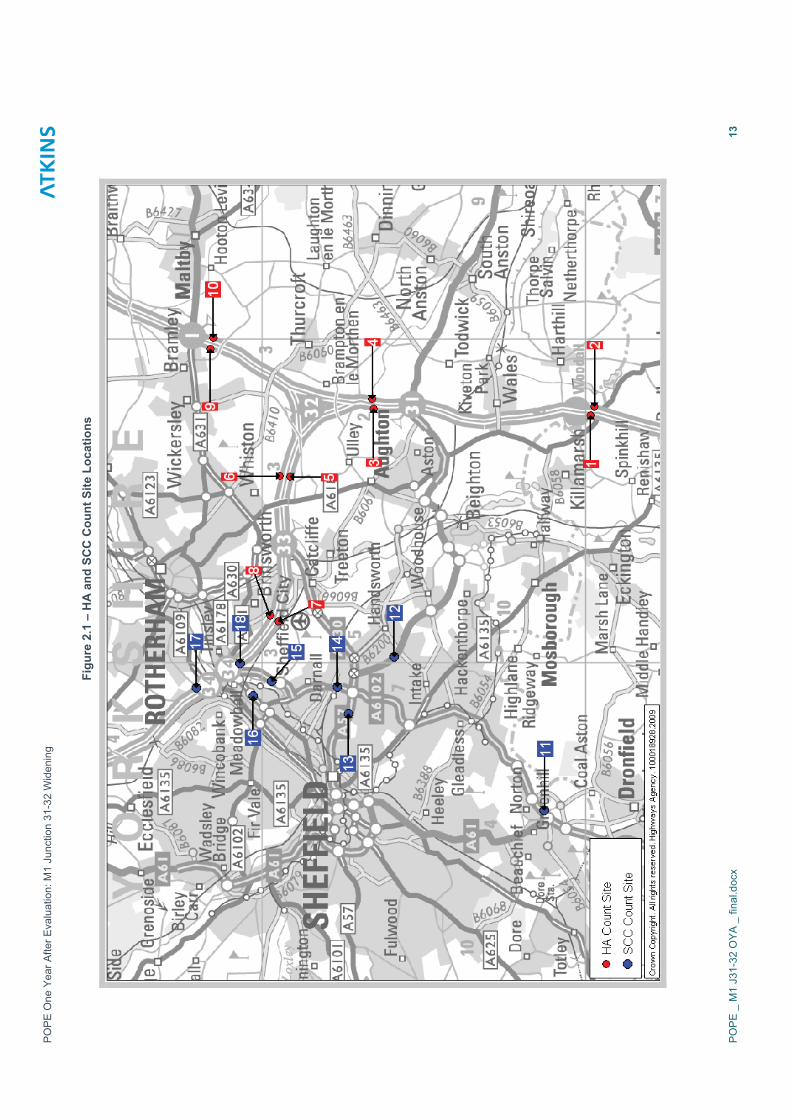
2.7 The SCC count sites in Sheffield were selected as they were located on roads which were identified as potential diversionary routes for motorway traffic. In particular, prior to the scheme there was concern over traffic volumes to the east of Sheffield on the A6102 Outer Ring Road.
4 Only exit slip data was available from SCC
POPE One Year After Evaluation: M1 Junction 31-32 Widening
POPE _ M1 J31-32 OYA _ final.docx 12
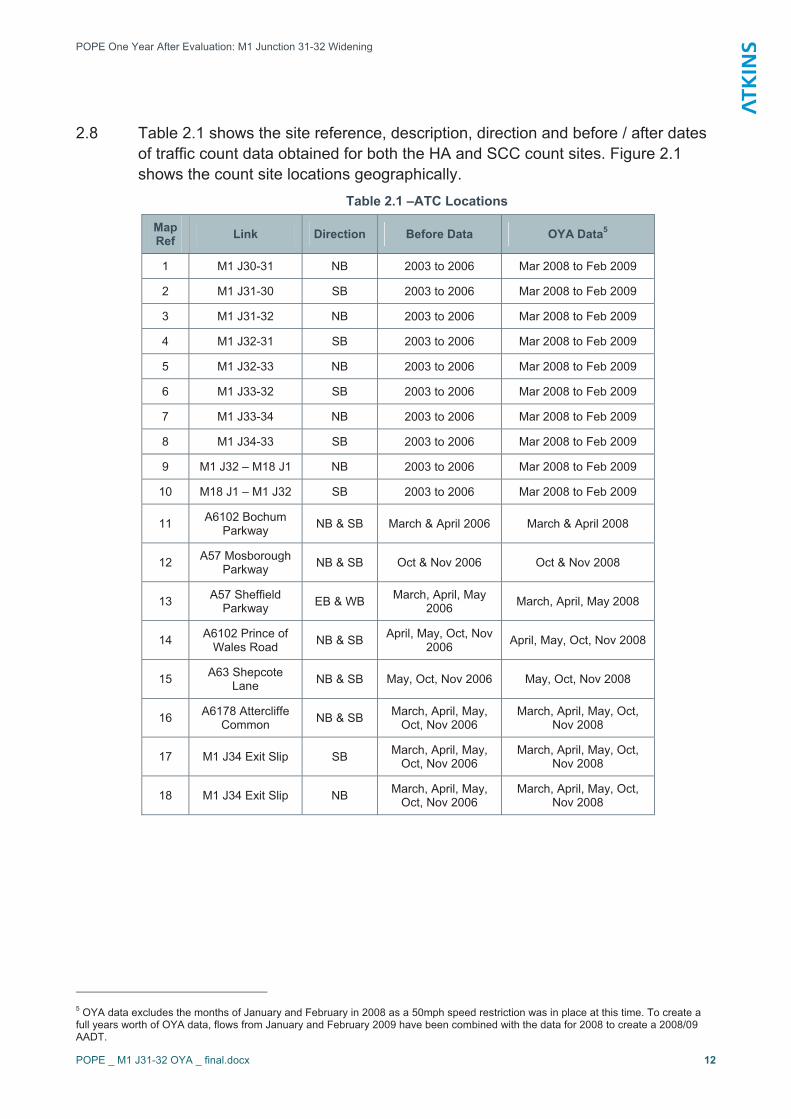
2.8 Table 2.1 shows the site reference, description, direction and before / after dates of traffic count data obtained for both the HA and SCC count sites. Figure 2.1 shows the count site locations geographically.
Table 2.1 –ATC Locations
MapRef Link Direction Before Data OYA Data5
1 M1 J30-31 NB 2003 to 2006 Mar 2008 to Feb 2009
2 M1 J31-30 SB 2003 to 2006 Mar 2008 to Feb 2009
3 M1 J31-32 NB 2003 to 2006 Mar 2008 to Feb 2009
4 M1 J32-31 SB 2003 to 2006 Mar 2008 to Feb 2009
5 M1 J32-33 NB 2003 to 2006 Mar 2008 to Feb 2009
6 M1 J33-32 SB 2003 to 2006 Mar 2008 to Feb 2009
7 M1 J33-34 NB 2003 to 2006 Mar 2008 to Feb 2009
8 M1 J34-33 SB 2003 to 2006 Mar 2008 to Feb 2009
9 M1 J32 – M18 J1 NB 2003 to 2006 Mar 2008 to Feb 2009
10 M18 J1 – M1 J32 SB 2003 to 2006 Mar 2008 to Feb 2009
11 A6102 Bochum Parkway NB & SB March & April 2006 March & April 2008
12 A57 Mosborough Parkway NB & SB Oct & Nov 2006 Oct & Nov 2008
13 A57 Sheffield Parkway EB & WB March, April, May
2006 March, April, May 2008
14 A6102 Prince of Wales Road NB & SB April, May, Oct, Nov
2006 April, May, Oct, Nov 2008
15 A63 Shepcote Lane NB & SB May, Oct, Nov 2006 May, Oct, Nov 2008
16 A6178 Attercliffe Common NB & SB March, April, May,
Oct, Nov 2006 March, April, May, Oct,
Nov 2008
17 M1 J34 Exit Slip SB March, April, May, Oct, Nov 2006
March, April, May, Oct, Nov 2008
18 M1 J34 Exit Slip NB March, April, May, Oct, Nov 2006
March, April, May, Oct, Nov 2008
5 OYA data excludes the months of January and February in 2008 as a 50mph speed restriction was in place at this time. To create a full years worth of OYA data, flows from January and February 2009 have been combined with the data for 2008 to create a 2008/09AADT.
PO
PE
One
Yea
r Afte
r Eva
luat
ion:
M1
Junc
tion
31-3
2 W
iden
ing
PO
PE
_ M
1 J3
1-32
OYA
_ fi
nal.d
ocx
13
Fig
ure
2.1
– H
A a
nd S
CC
Cou
nt S
ite L
ocat
ions
POPE One Year After Evaluation: M1 Junction 31-32 Widening
POPE _ M1 J31-32 OYA _ final.docx 14
Method of Analysis
2.9 All the traffic counts that have been used are observed volumes. No factoring has been applied to account for background traffic growth.
HA Count Data
2.10 Annual Average Daily Traffic (AADT) volumes have been collated for 2006 to represent the ‘before’ traffic flows. AADT volumes have also been collated from 2003-05 in order to quantify the traffic growth that took place in the years before the scheme was constructed.
2.11 Scheme construction was from January 2007 to December 2007. Throughout the construction period, a 50mph speed was in place on the M1 J31-32 section. This speed restriction remained in place until the end of February 2008.
2.12 The OYA period is represented by a 12 month AADT figure calculated from data between March 2008 and February 20096.
SCC Count Data
2.13 Traffic volumes from the SCC ATC sites have been extracted from selected months in 2006 to represent the ‘before’ period and, where the data was available, the same months in the year 2008 to represent the OYA period.
2.14 The numbers presented are an Average Daily Total ADT based on a sample of the months of March, April, May, October and November7.
6 This represents the first full 12 months of data post scheme opening7 See Table 2.1 for data sample
POPE One Year After Evaluation: M1 Junction 31-32 Widening
POPE _ M1 J31-32 OYA _ final.docx 15
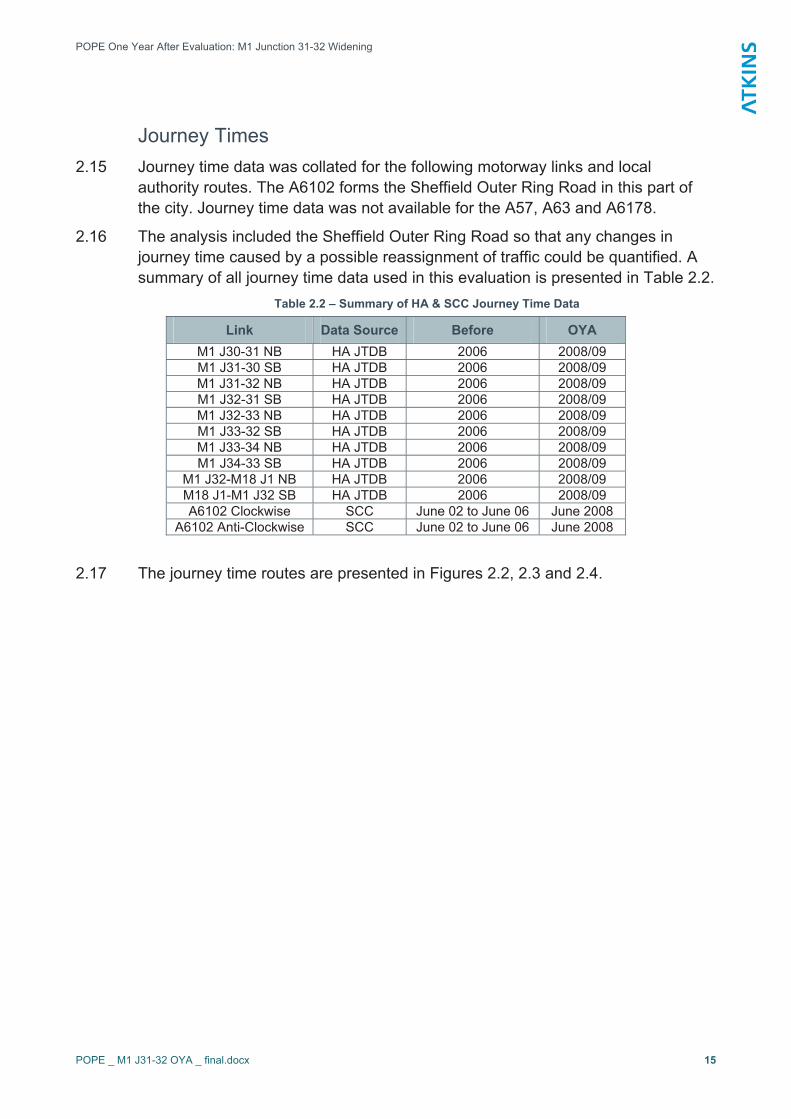
Journey Times 2.15 Journey time data was collated for the following motorway links and local
authority routes. The A6102 forms the Sheffield Outer Ring Road in this part of the city. Journey time data was not available for the A57, A63 and A6178.
2.16 The analysis included the Sheffield Outer Ring Road so that any changes in journey time caused by a possible reassignment of traffic could be quantified. A summary of all journey time data used in this evaluation is presented in Table 2.2.
Table 2.2 – Summary of HA & SCC Journey Time Data
Link Data Source Before OYAM1 J30-31 NB HA JTDB 2006 2008/09 M1 J31-30 SB HA JTDB 2006 2008/09 M1 J31-32 NB HA JTDB 2006 2008/09 M1 J32-31 SB HA JTDB 2006 2008/09 M1 J32-33 NB HA JTDB 2006 2008/09 M1 J33-32 SB HA JTDB 2006 2008/09 M1 J33-34 NB HA JTDB 2006 2008/09 M1 J34-33 SB HA JTDB 2006 2008/09
M1 J32-M18 J1 NB HA JTDB 2006 2008/09 M18 J1-M1 J32 SB HA JTDB 2006 2008/09 A6102 Clockwise SCC June 02 to June 06 June 2008
A6102 Anti-Clockwise SCC June 02 to June 06 June 2008
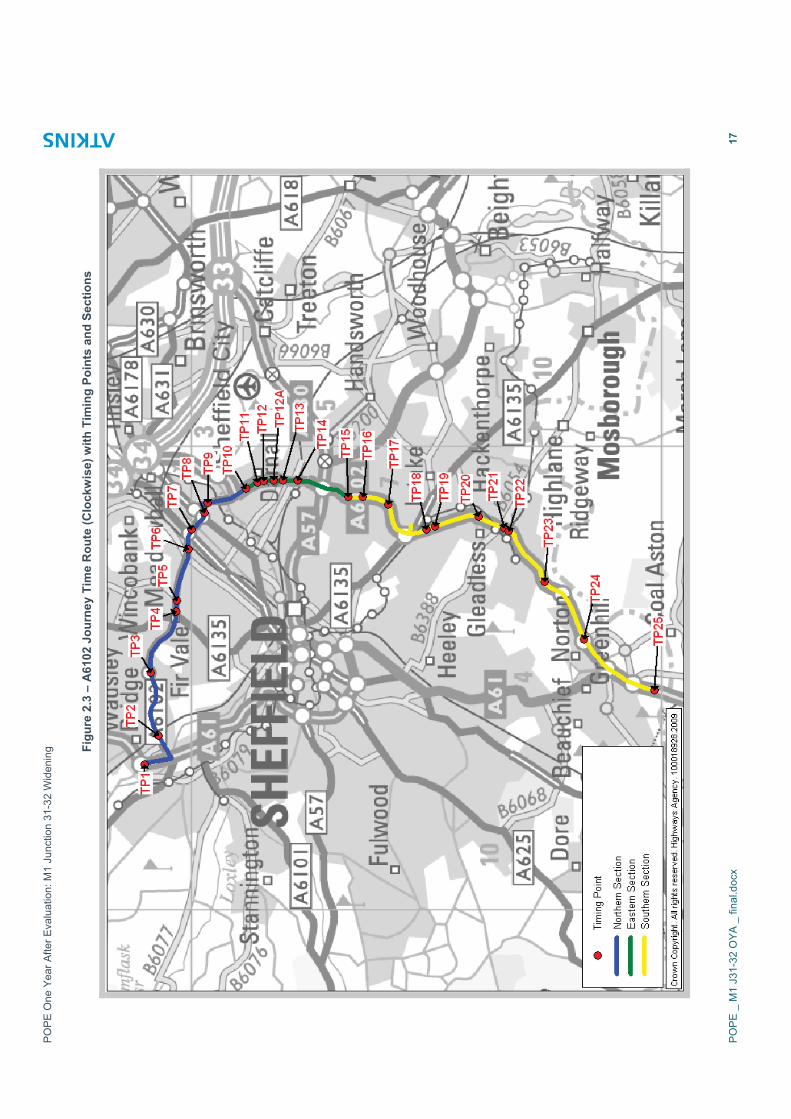
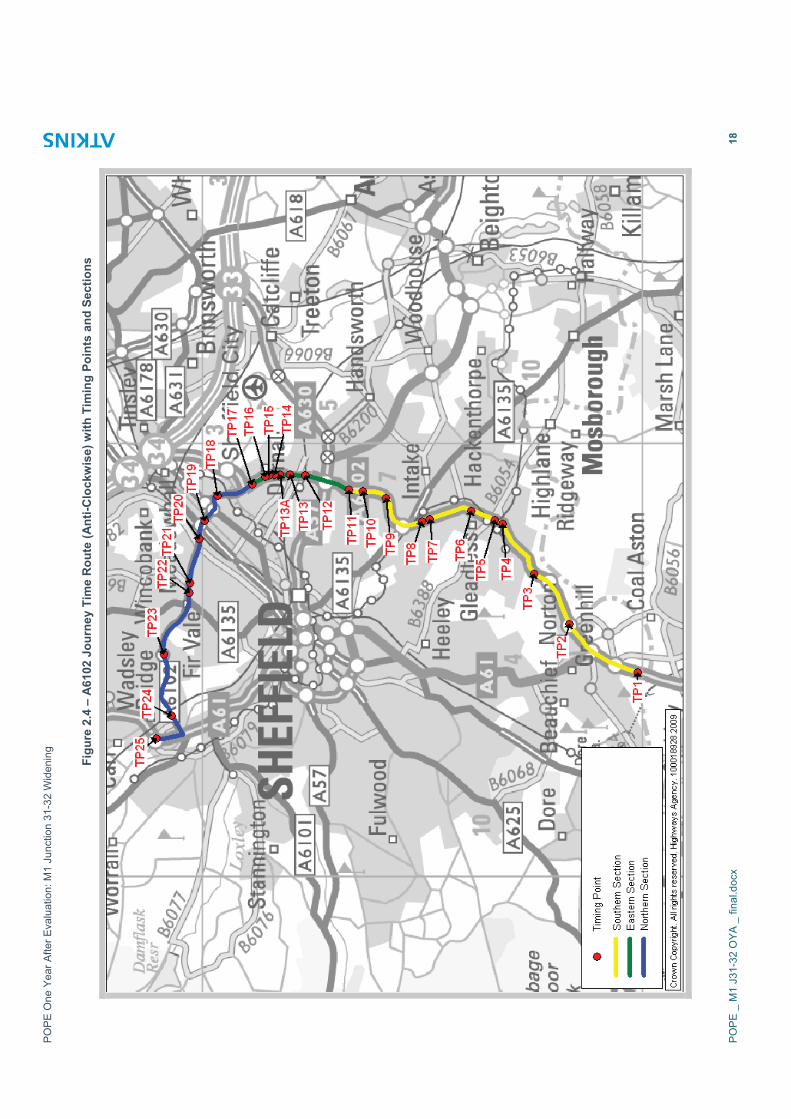
2.17 The journey time routes are presented in Figures 2.2, 2.3 and 2.4.

PO
PE
One
Yea
r Afte
r Eva
luat
ion:
M1
Junc
tion
31-3
2 W
iden
ing
PO
PE
_ M
1 J3
1-32
OYA
_ fi
nal.d
ocx
16
Figu
re 2
.2 –
HA
Jou
rney
Tim
e R
oute
s
PO
PE
One
Yea
r Afte
r Eva
luat
ion:
M1
Junc
tion
31-3
2 W
iden
ing
PO
PE
_ M
1 J3
1-32
OYA
_ fi
nal.d
ocx
17
Figu
re 2
.3 –
A61
02 J
ourn
ey T
ime
Rou
te (C
lock
wis
e) w
ith T
imin
g Po
ints
and
Sec
tions
PO
PE
One
Yea
r Afte
r Eva
luat
ion:
M1
Junc
tion
31-3
2 W
iden
ing
PO
PE
_ M
1 J3
1-32
OYA
_ fi
nal.d
ocx
18
Figu
re 2
.4 –
A61
02 J
ourn
ey T
ime
Rou
te (A
nti-C
lock
wis
e) w
ith T
imin
g Po
ints
and
Sec
tions
POPE One Year After Evaluation: M1 Junction 31-32 Widening
POPE _ M1 J31-32 OYA _ final.docx 19
Method of Analysis
HA Journey Time Data
2.18 Journey time data has been extracted from the JTDB for the before (2006) and OYA (2008/09) period. As part of this post opening evaluation, journey times on motorway links have been analysed as follows:
� An annual average of the AM (07:00-09:00) and PM (16:00-18:00) peak periods8; and
� An annual average for the whole day.
2.19 Annual average journey times for the AM and PM peak periods include data for all weekdays in the year but exclude weekends.
2.20 Annual average journey times for the whole day include data for both weekdays and weekends.
2.21 Annual average journey times are calculated by multiplying the flow in a given hour by the average journey time in that particular hour and dividing this total by the total number of vehicles travelling on that link in a year.
SCC Journey Time Data
2.22 The Local Authority (A6102 Outer Ring Road) journey times were recorded using the moving observer method. Journey time surveys are undertaken by SCC on an annual basis in the month of June. The data provided is based on a minimum of four journey time runs and times were recorded at 26 different timing points. These are shown in Figures 2.4 and 2.5 and listed in more detail in Appendix B.
2.23 In this analysis, an average of journey times from the years 2003, 2004, 2005 and 2006 are taken as the before period and journey times recorded in 2008 are the OYA period. The journey time data covers the AM (08:00-09:30) and PM (16:30-18:30) peak periods.
2.24 Additionally, the A6102 journey time routes have been split into 3 sections; northern, eastern and southern to allow longer distance comparisons to be made.
2.25 In the clockwise direction, the sections are split as below:
� Northern (TP1 to TP10) � Eastern (TP10 to TP15); and� Southern (TP15 to TP25)
2.26 In the anti-clockwise direction, the sections are split as below:
� Southern (TP1 to TP11); � Eastern (TP11 to TP17) and� Northern (TP17 to TP25)
8 After a detailed review of traffic volumes on all the above motorway links, the AM and PM peak hour varied between 07:00-08:00 and 08:00-09:00 for the AM peak and 16:00-17:00 and 17:00-18:00 for the PM. Therefore, journey times- on HA links are analysed as anaverage of a two hour AM (07:00-09:00) and PM (16:00-18:00) peak period.
POPE One Year After Evaluation: M1 Junction 31-32 Widening
POPE _ M1 J31-32 OYA _ final.docx 20
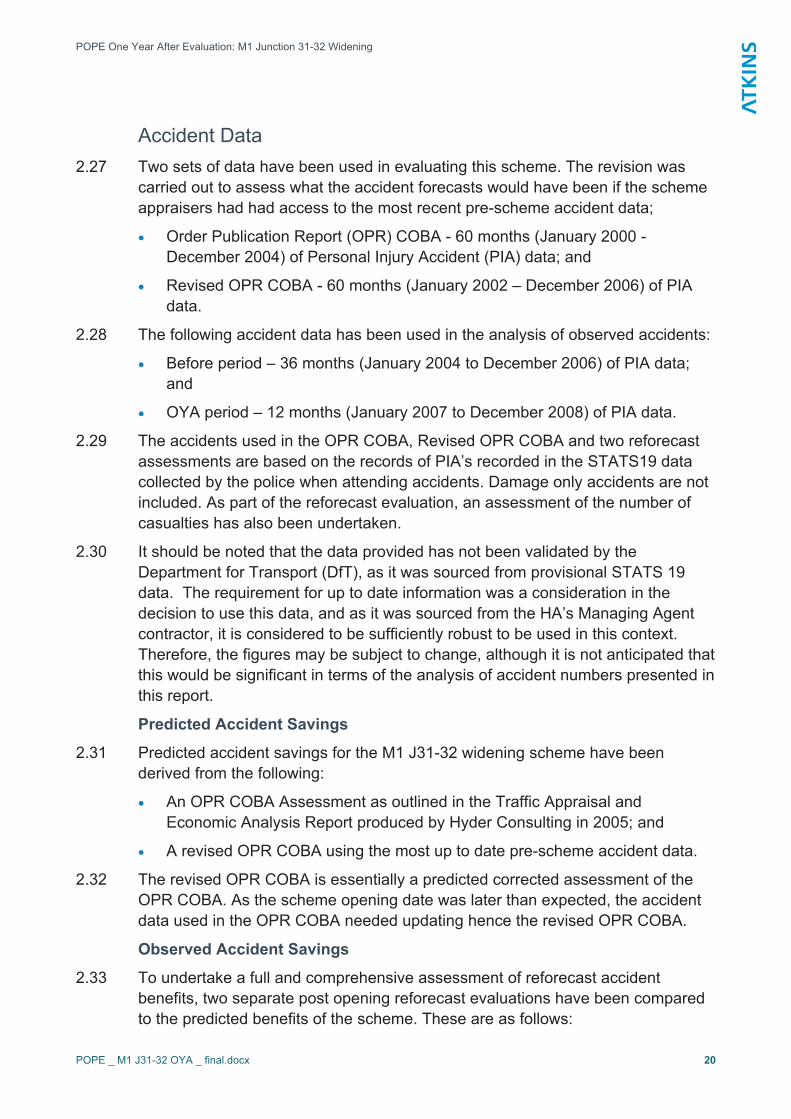
Accident Data 2.27 Two sets of data have been used in evaluating this scheme. The revision was
carried out to assess what the accident forecasts would have been if the scheme appraisers had had access to the most recent pre-scheme accident data;
� Order Publication Report (OPR) COBA - 60 months (January 2000 - December 2004) of Personal Injury Accident (PIA) data; and
� Revised OPR COBA - 60 months (January 2002 – December 2006) of PIA data.
2.28 The following accident data has been used in the analysis of observed accidents:
� Before period – 36 months (January 2004 to December 2006) of PIA data; and
� OYA period – 12 months (January 2007 to December 2008) of PIA data.
2.29 The accidents used in the OPR COBA, Revised OPR COBA and two reforecast assessments are based on the records of PIA’s recorded in the STATS19 data collected by the police when attending accidents. Damage only accidents are not included. As part of the reforecast evaluation, an assessment of the number of casualties has also been undertaken.
2.30 It should be noted that the data provided has not been validated by the Department for Transport (DfT), as it was sourced from provisional STATS 19 data. The requirement for up to date information was a consideration in the decision to use this data, and as it was sourced from the HA’s Managing Agent contractor, it is considered to be sufficiently robust to be used in this context. Therefore, the figures may be subject to change, although it is not anticipated that this would be significant in terms of the analysis of accident numbers presented in this report.
Predicted Accident Savings
2.31 Predicted accident savings for the M1 J31-32 widening scheme have been derived from the following:
� An OPR COBA Assessment as outlined in the Traffic Appraisal and Economic Analysis Report produced by Hyder Consulting in 2005; and
� A revised OPR COBA using the most up to date pre-scheme accident data.
2.32 The revised OPR COBA is essentially a predicted corrected assessment of the OPR COBA. As the scheme opening date was later than expected, the accident data used in the OPR COBA needed updating hence the revised OPR COBA.
Observed Accident Savings
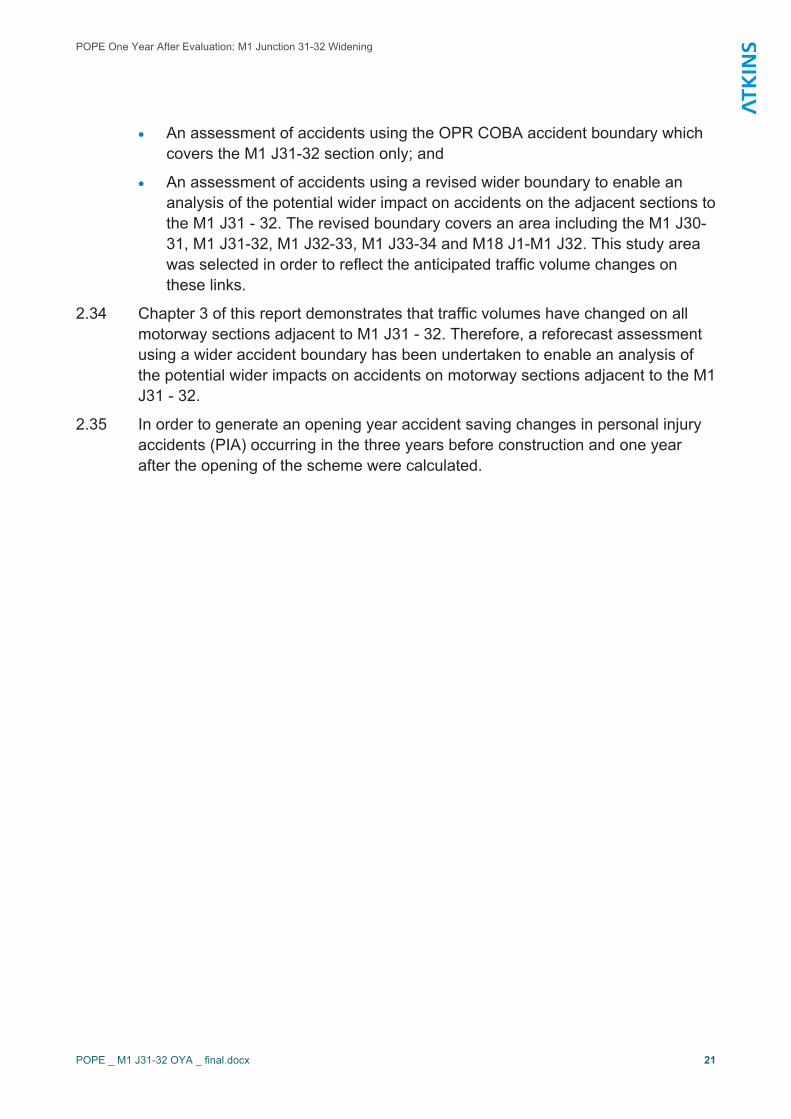
2.33 To undertake a full and comprehensive assessment of reforecast accident benefits, two separate post opening reforecast evaluations have been compared to the predicted benefits of the scheme. These are as follows:
POPE One Year After Evaluation: M1 Junction 31-32 Widening
POPE _ M1 J31-32 OYA _ final.docx 21
� An assessment of accidents using the OPR COBA accident boundary which covers the M1 J31-32 section only; and
� An assessment of accidents using a revised wider boundary to enable an analysis of the potential wider impact on accidents on the adjacent sections to the M1 J31 - 32. The revised boundary covers an area including the M1 J30-31, M1 J31-32, M1 J32-33, M1 J33-34 and M18 J1-M1 J32. This study area was selected in order to reflect the anticipated traffic volume changes on these links.
2.34 Chapter 3 of this report demonstrates that traffic volumes have changed on all motorway sections adjacent to M1 J31 - 32. Therefore, a reforecast assessment using a wider accident boundary has been undertaken to enable an analysis of the potential wider impacts on accidents on motorway sections adjacent to the M1 J31 - 32.
2.35 In order to generate an opening year accident saving changes in personal injury accidents (PIA) occurring in the three years before construction and one year after the opening of the scheme were calculated.
POPE One Year After Evaluation: M1 Junction 31-32 Widening
POPE _ M1 J31-32 OYA _ final.docx 22
3. Traffic Analysis Introduction
3.1 In order to correctly assess the impacts of a scheme it is important to understand any changes in traffic volume, journey times and speeds before and after the scheme’s implementation. Significant changes to traffic volumes can reveal impacts such as induced traffic and changes in journey times and speeds may explain potential wider scheme impacts, such as rerouting or induced traffic.
3.2 This section of the report presents traffic volume, journey time and speed data from before scheme opening and compares it to data collected from one year after scheme opening.
Traffic Volume Changes HA Count Sites
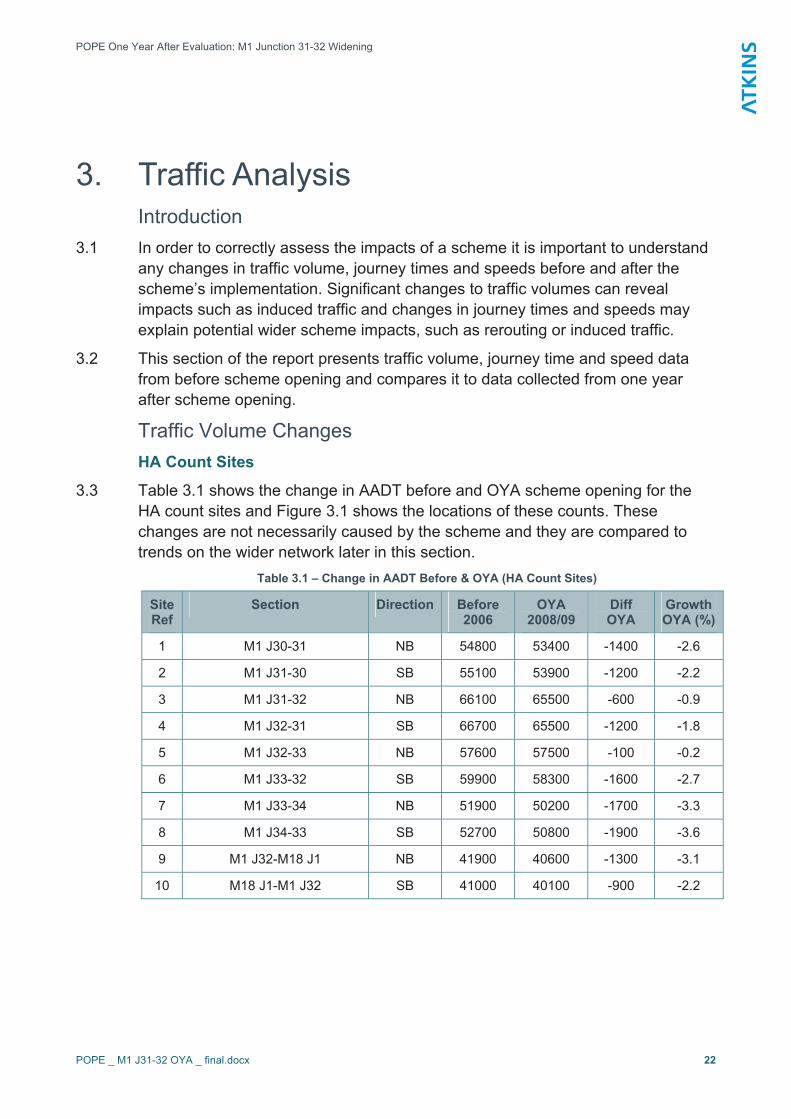
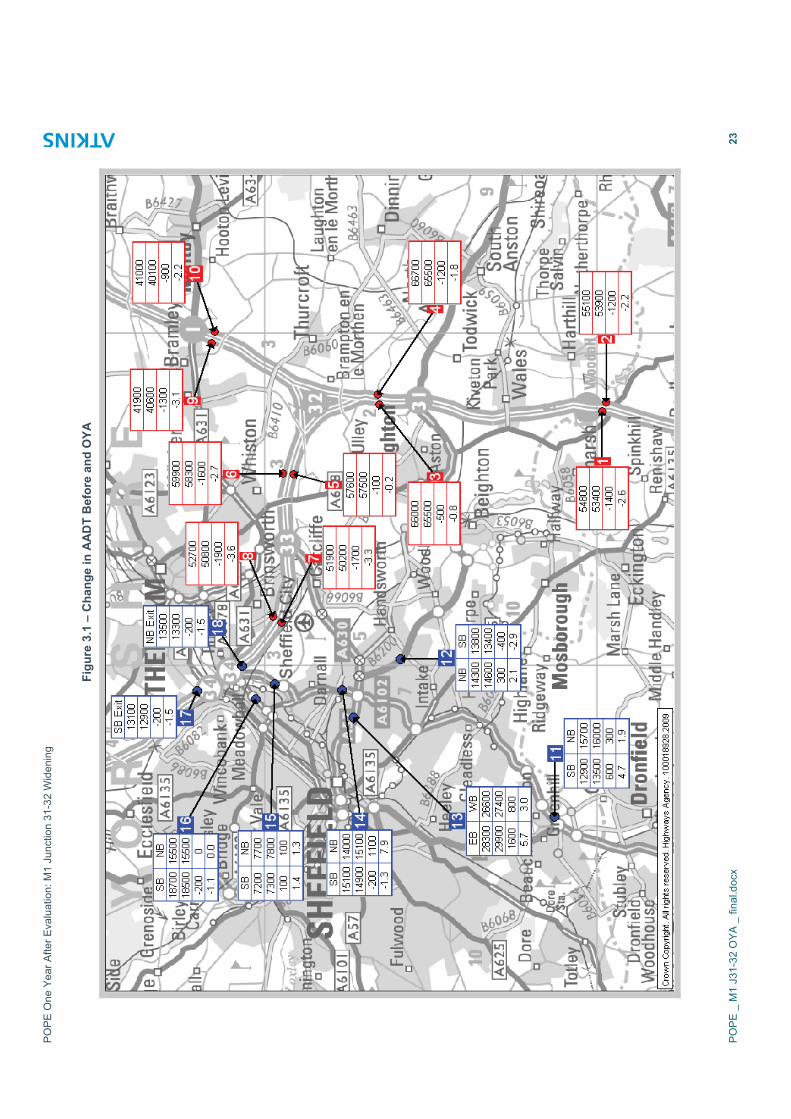
3.3 Table 3.1 shows the change in AADT before and OYA scheme opening for the HA count sites and Figure 3.1 shows the locations of these counts. These changes are not necessarily caused by the scheme and they are compared to trends on the wider network later in this section.
Table 3.1 – Change in AADT Before & OYA (HA Count Sites)
SiteRef
Section Direction Before 2006
OYA2008/09
DiffOYA
Growth OYA (%)
1 M1 J30-31 NB 54800 53400 -1400 -2.6
2 M1 J31-30 SB 55100 53900 -1200 -2.2
3 M1 J31-32 NB 66100 65500 -600 -0.9
4 M1 J32-31 SB 66700 65500 -1200 -1.8
5 M1 J32-33 NB 57600 57500 -100 -0.2
6 M1 J33-32 SB 59900 58300 -1600 -2.7
7 M1 J33-34 NB 51900 50200 -1700 -3.3
8 M1 J34-33 SB 52700 50800 -1900 -3.6
9 M1 J32-M18 J1 NB 41900 40600 -1300 -3.1
10 M18 J1-M1 J32 SB 41000 40100 -900 -2.2
PO
PE
One
Yea
r Afte
r Eva
luat
ion:
M1
Junc
tion
31-3
2 W
iden
ing
PO
PE
_ M
1 J3
1-32
OYA
_ fi
nal.d
ocx
23
Figu
re 3
.1 –
Cha
nge
in A
AD
T B
efor
e an
d O
YA
POPE One Year After Evaluation: M1 Junction 31-32 Widening
POPE _ M1 J31-32 OYA _ final.docx 24
3.4 From the information presented in Table 3.1 and Figure 3.1 the key points regarding changes in traffic volumes on the motorway links in the vicinity of the scheme are as follows:
� Comparing the before and OYA data, there has been a reduction in traffic volumes on all motorways links in both directions;
� The average decrease in traffic volumes across all 10 links in both directions between 2006 and 2008/09 is 2.2%;
� The largest traffic volume reduction occurred on the M1 J34-33 southbound section, which shows a decrease of 3.6% between 2006 and 2008/09; and
� The smallest traffic volume reduction occurs on the M1 J32-33 northbound section, which shows a decrease of 0.2% between 2006 and 2008/09.
� There is little evidence to suggest that the impacts of the scheme on traffic volume extend beyond the link that has been widened.
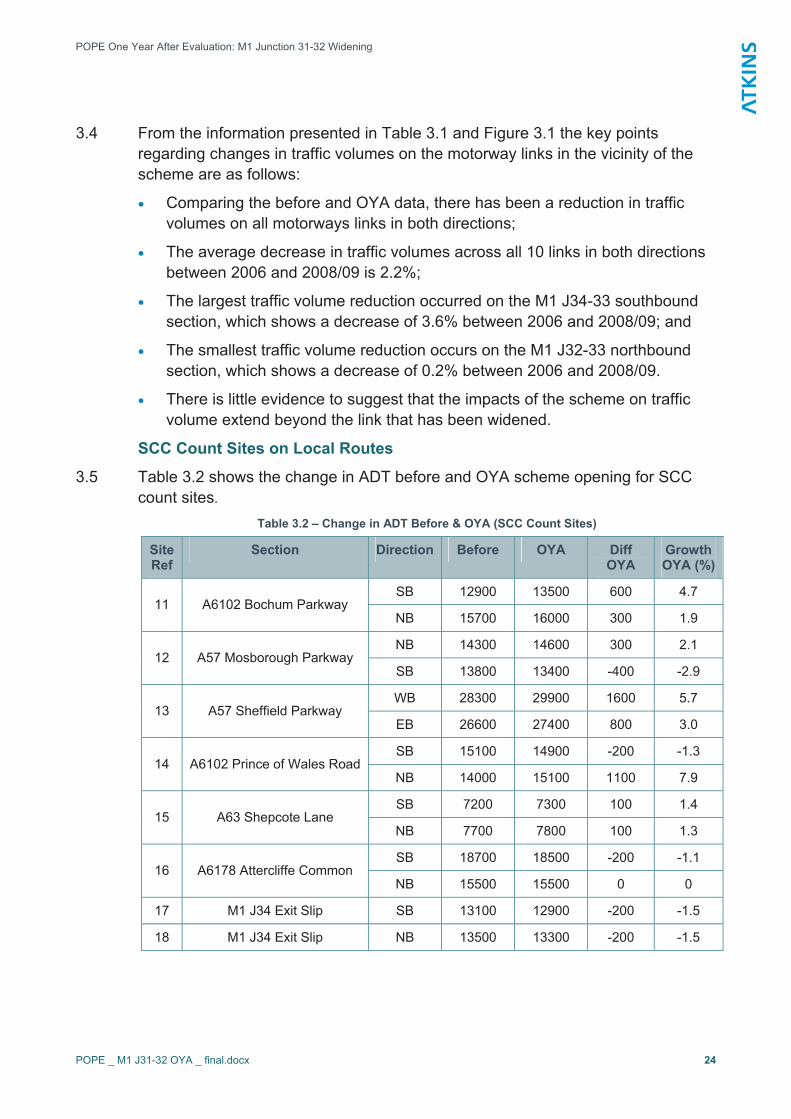
SCC Count Sites on Local Routes
3.5 Table 3.2 shows the change in ADT before and OYA scheme opening for SCC count sites.
Table 3.2 – Change in ADT Before & OYA (SCC Count Sites)
SiteRef
Section Direction Before OYA DiffOYA
GrowthOYA (%)
SB 12900 13500 600 4.7 11 A6102 Bochum Parkway
NB 15700 16000 300 1.9
NB 14300 14600 300 2.1 12 A57 Mosborough Parkway
SB 13800 13400 -400 -2.9
WB 28300 29900 1600 5.7 13 A57 Sheffield Parkway
EB 26600 27400 800 3.0
SB 15100 14900 -200 -1.3 14 A6102 Prince of Wales Road
NB 14000 15100 1100 7.9
SB 7200 7300 100 1.4 15 A63 Shepcote Lane
NB 7700 7800 100 1.3
SB 18700 18500 -200 -1.1 16 A6178 Attercliffe Common
NB 15500 15500 0 0
17 M1 J34 Exit Slip SB 13100 12900 -200 -1.5
18 M1 J34 Exit Slip NB 13500 13300 -200 -1.5
POPE One Year After Evaluation: M1 Junction 31-32 Widening
POPE _ M1 J31-32 OYA _ final.docx 25
3.6 From the information presented in Table 3.2 and Figure 3.1, the key points regarding changes in traffic volumes at SCC count sites are as follows:
� In general, traffic volumes on local authority roads have increased between 2006 and 2008 at most sites, although the actual increase in vehicle numbers has been relatively small;
� The largest increase in traffic volumes is seen on the A6102 at Prince of Wales Road travelling northbound (+7.9%) and traffic travelling westbound towards Sheffield city centre on the A57 Sheffield Parkway (+5.7%);
� Sites which have had traffic volumes decreases are the A57 Mosborough Parkway southbound, A6102 Prince of Wales Road southbound, A6178 Attercliffe Common southbound and both the exit slips at the M1 J34.However, most of these decreases were relatively small; and
� It is difficult to identify the causes of these changes and to isolate the impact of the M1 scheme alone. The sites closest to the M1 (A57, A63, A6178 and the J34 slip roads) have seen little or no growth while the sites closer to Sheffield city centre have grown more. This suggests that the changes are more likely to be caused by changes in local traffic patterns than by the M1.
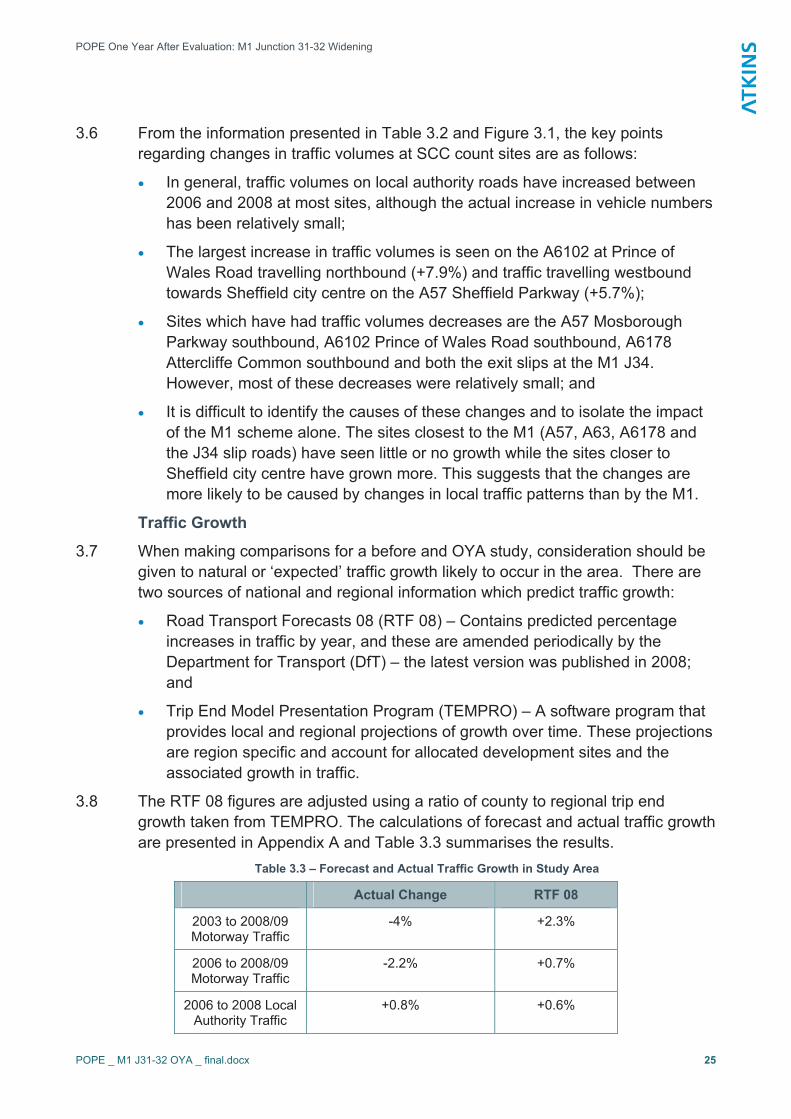
Traffic Growth
3.7 When making comparisons for a before and OYA study, consideration should be given to natural or ‘expected’ traffic growth likely to occur in the area. There are two sources of national and regional information which predict traffic growth:
� Road Transport Forecasts 08 (RTF 08) – Contains predicted percentage increases in traffic by year, and these are amended periodically by the Department for Transport (DfT) – the latest version was published in 2008; and
� Trip End Model Presentation Program (TEMPRO) – A software program that provides local and regional projections of growth over time. These projections are region specific and account for allocated development sites and the associated growth in traffic.
3.8 The RTF 08 figures are adjusted using a ratio of county to regional trip end growth taken from TEMPRO. The calculations of forecast and actual traffic growth are presented in Appendix A and Table 3.3 summarises the results.
Table 3.3 – Forecast and Actual Traffic Growth in Study Area
Actual Change RTF 08
2003 to 2008/09 Motorway Traffic
-4% +2.3%
2006 to 2008/09 Motorway Traffic
-2.2% +0.7%
2006 to 2008 Local Authority Traffic
+0.8% +0.6%
POPE One Year After Evaluation: M1 Junction 31-32 Widening
POPE _ M1 J31-32 OYA _ final.docx 26
3.9 The following observations can be made with regard to traffic growth:
� Traffic volumes on the 10 motorway links in both directions decreased by 4% from 2003-2008/09 while the forecast was for 2.3% growth;
� Over half of this traffic volume decrease has occurred in the last 2 years, suggesting that the current economic climate has reinforced the longer term reduction in flows;
� Traffic has grown on the local authority roads by 0.8% from 2006-08, largely in line with the forecast traffic growth of 0.6%. Traffic growth on the local roads closest to the M1 has shown little or no growth so it could be argued that there has been a relative decrease in traffic, compared to general traffic levels; and
� There is a long term trend of traffic flow decrease on the motorway network in this area which is in contrast to flow changes on local roads. This may suggest that local economic and traffic flow growth has continued as expected but that the fall in strategic flows on the motorway reflects a long term lack of growth in the regional and/or national economy and also the more recent effects of the wider economic climate.
Conclusions Regarding Traffic Volume Changes
3.10 The results detailed in the previous section show that there has been a decrease in traffic volumes on all motorway links in the study area between 2006 and 2008/09. Prior to scheme opening, between 2003 and 2006 there was an annual reduction in traffic volumes across motorway links in the Yorkshire and Humber Region and this trend has continued, and even accelerated, since scheme implementation.
3.11 Given that traffic volume reductions are in-line with background trends elsewhere on the network, it can be concluded that the widening of the section between J31-32 of the M1 has had little impact on overall traffic volumes on any of the motorway sections analysed. This suggests that the original appraisal of the single motorway link was more appropriate than a wider appraisal that included the neighbouring motorway links.
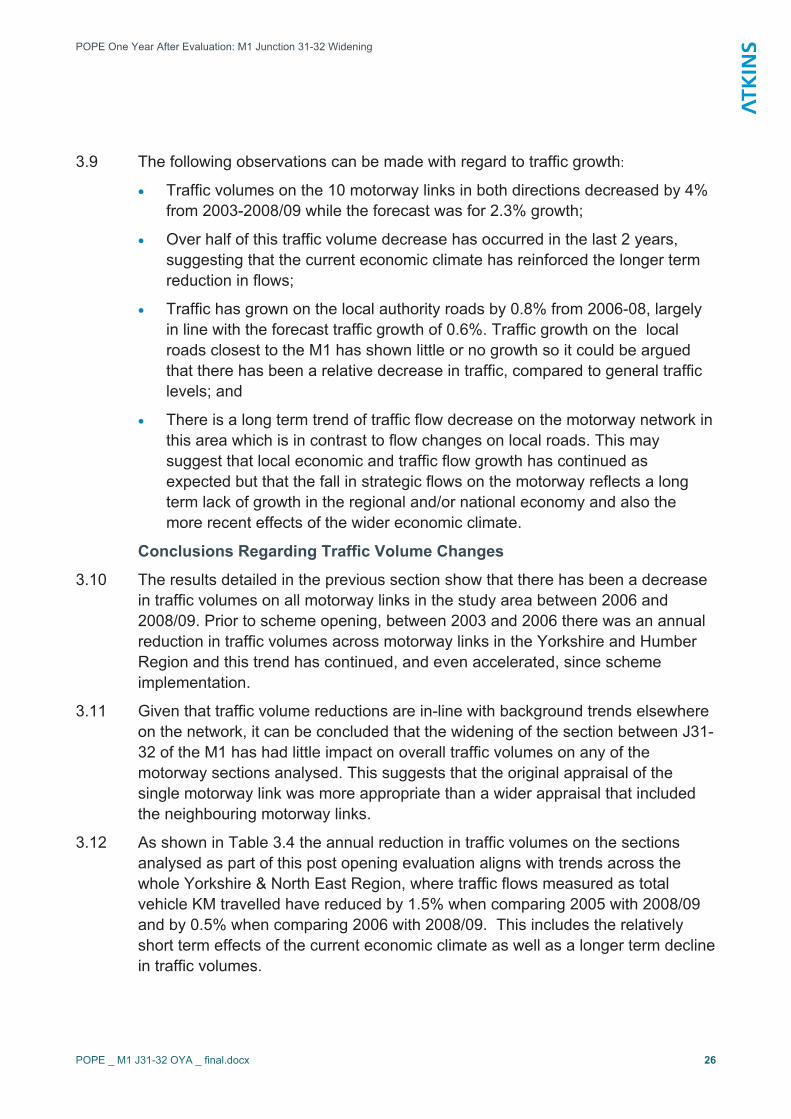
3.12 As shown in Table 3.4 the annual reduction in traffic volumes on the sections analysed as part of this post opening evaluation aligns with trends across the whole Yorkshire & North East Region, where traffic flows measured as total vehicle KM travelled have reduced by 1.5% when comparing 2005 with 2008/09 and by 0.5% when comparing 2006 with 2008/09. This includes the relatively short term effects of the current economic climate as well as a longer term decline in traffic volumes.
POPE One Year After Evaluation: M1 Junction 31-32 Widening
POPE _ M1 J31-32 OYA _ final.docx 27
Table 3.4 – Yorkshire & North East Traffic Flow (Total Vehicle KM (billion)9
Year 2005 2006 2008/09
Vehicle KM (billion) 17.847 17.664 17.583
3.13 On local authority routes, overall traffic volumes have increased at most count sites between 2006 and 2008, particularly on the A6102 Bochum Parkway and Prince of Wales Road sites northbound and at the A57 Sheffield Parkway site both towards and away from Sheffield. These sites have seen growth above that predicted for local authority routes in RTF 08. However, the remaining sites haveseen growth below that predicted in RTF 08 and at some sites there has been a reduction in traffic volumes.
3.14 Growth at the A6102 (Sheffield Outer Ring Road) site has increased above the 0.6% predicted in RTF 08 in the northbound direction at both the Bochum Parkway and Prince of Wales Road count sites. It is unlikely, however, that the increased traffic growth at these sites is a result of traffic leaving the M1, re-routing on to the A6102 and then rejoining the M1 to continue northbound as the traffic volumes in the northbound direction (heading towards M1 J34) on the A631 Shepcote Lane and A6178 Attercliffe Common sites have growth below that projected in RTF 08. A possible diversion along Sheffield Parkway to re-join the M1 at J33 is unlikely because traffic volumes between J33-J34 heading northbound on the M1 have decreased.
3.15 If the widened motorway were to have an impact on traffic volumes on alternative routes, it would most likely be to attract traffic away from those roads. The reforecast results show that traffic volumes have increased on some local roads and the trend of reduced traffic volumes has continued on the motorway sections. The conclusion is that the scheme has had a small impact on traffic volumes in the area at the OYA stage.
Forecast Traffic Volumes 3.16 An important element of the POPE process is a review of the accuracy of traffic
forecasts that were made during the appraisal process. However, in this case the information is either not available or is unsuitable to enable a review of this type to be carried out.
3.17 A traffic model Forecasting Report is not available for the scheme and it is not clear how the modelling work that was carried out as part of the South and West Yorkshire Multi Modal Study (SWYMMS) was used in the appraisal. Therefore, no modelled traffic flows are available.
3.18 The original scheme economics calculations used observed traffic flows that were then factored using growth factors derived from the SWYMMS model. The traffic
9 Source - HA report ‘Problem Profile M1 J31-32 Widening Effect on Congestion’ – May 2009
POPE One Year After Evaluation: M1 Junction 31-32 Widening
POPE _ M1 J31-32 OYA _ final.docx 28
volumes were not produced by a model but they were observed flows multiplied by a general growth factor that was extracted from the strategic SWYMMS model.
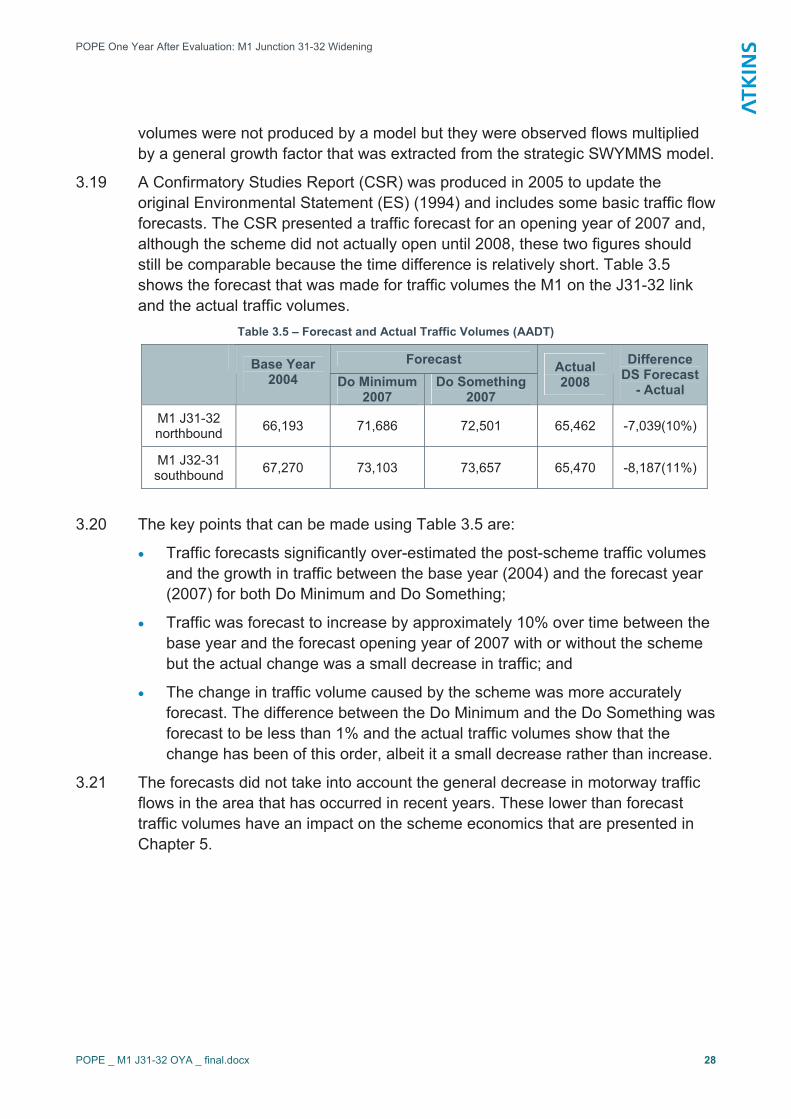
3.19 A Confirmatory Studies Report (CSR) was produced in 2005 to update the original Environmental Statement (ES) (1994) and includes some basic traffic flow forecasts. The CSR presented a traffic forecast for an opening year of 2007 and, although the scheme did not actually open until 2008, these two figures should still be comparable because the time difference is relatively short. Table 3.5 shows the forecast that was made for traffic volumes the M1 on the J31-32 link and the actual traffic volumes.
Table 3.5 – Forecast and Actual Traffic Volumes (AADT)
ForecastBase Year 2004 Do Minimum
2007Do Something
2007
Actual 2008
Difference DS Forecast
- Actual
M1 J31-32 northbound 66,193 71,686 72,501 65,462 -7,039(10%)
M1 J32-31 southbound 67,270 73,103 73,657 65,470 -8,187(11%)
3.20 The key points that can be made using Table 3.5 are:
� Traffic forecasts significantly over-estimated the post-scheme traffic volumes and the growth in traffic between the base year (2004) and the forecast year (2007) for both Do Minimum and Do Something;
� Traffic was forecast to increase by approximately 10% over time between the base year and the forecast opening year of 2007 with or without the scheme but the actual change was a small decrease in traffic; and
� The change in traffic volume caused by the scheme was more accurately forecast. The difference between the Do Minimum and the Do Something was forecast to be less than 1% and the actual traffic volumes show that the change has been of this order, albeit it a small decrease rather than increase.
3.21 The forecasts did not take into account the general decrease in motorway traffic flows in the area that has occurred in recent years. These lower than forecast traffic volumes have an impact on the scheme economics that are presented in Chapter 5.
POPE One Year After Evaluation: M1 Junction 31-32 Widening
POPE _ M1 J31-32 OYA _ final.docx 29
Journey Times Motorway Journey Times and Speeds
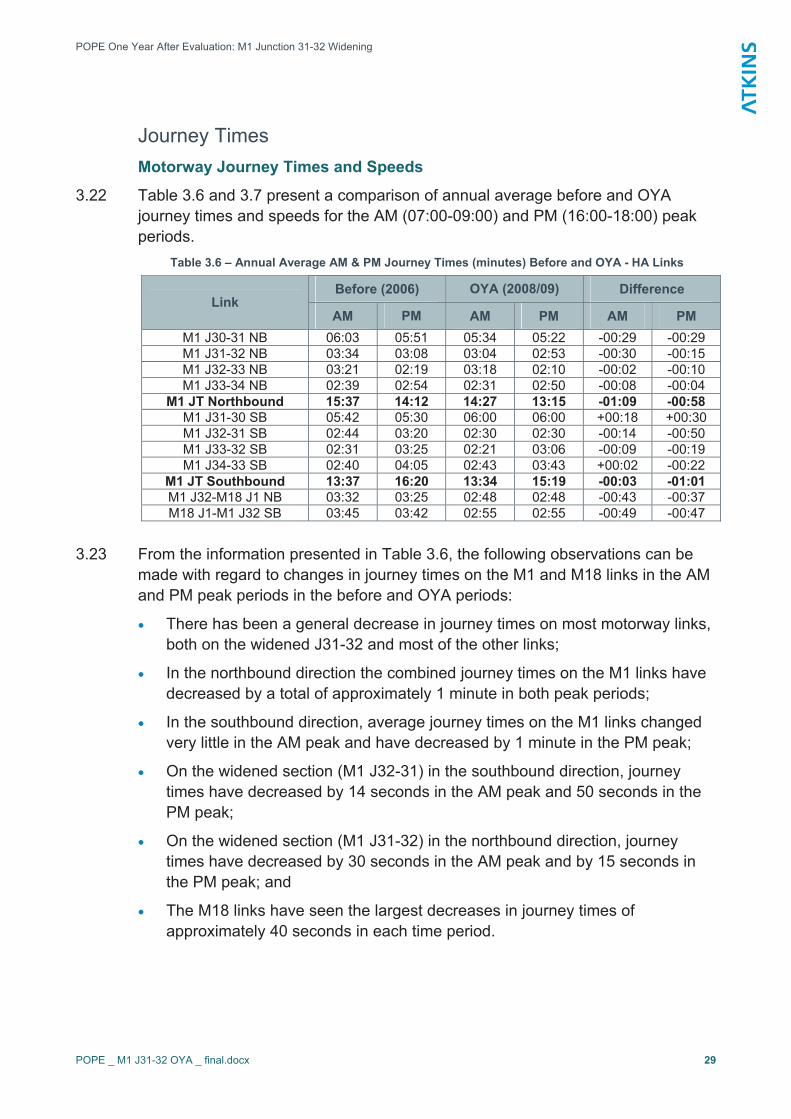
3.22 Table 3.6 and 3.7 present a comparison of annual average before and OYA journey times and speeds for the AM (07:00-09:00) and PM (16:00-18:00) peak periods.
Table 3.6 – Annual Average AM & PM Journey Times (minutes) Before and OYA - HA Links
Before (2006) OYA (2008/09) Difference Link
AM PM AM PM AM PMM1 J30-31 NB 06:03 05:51 05:34 05:22 -00:29 -00:29 M1 J31-32 NB 03:34 03:08 03:04 02:53 -00:30 -00:15 M1 J32-33 NB 03:21 02:19 03:18 02:10 -00:02 -00:10 M1 J33-34 NB 02:39 02:54 02:31 02:50 -00:08 -00:04
M1 JT Northbound 15:37 14:12 14:27 13:15 -01:09 -00:58 M1 J31-30 SB 05:42 05:30 06:00 06:00 +00:18 +00:30 M1 J32-31 SB 02:44 03:20 02:30 02:30 -00:14 -00:50 M1 J33-32 SB 02:31 03:25 02:21 03:06 -00:09 -00:19 M1 J34-33 SB 02:40 04:05 02:43 03:43 +00:02 -00:22
M1 JT Southbound 13:37 16:20 13:34 15:19 -00:03 -01:01 M1 J32-M18 J1 NB 03:32 03:25 02:48 02:48 -00:43 -00:37M18 J1-M1 J32 SB 03:45 03:42 02:55 02:55 -00:49 -00:47
3.23 From the information presented in Table 3.6, the following observations can be made with regard to changes in journey times on the M1 and M18 links in the AM and PM peak periods in the before and OYA periods:
� There has been a general decrease in journey times on most motorway links, both on the widened J31-32 and most of the other links;
� In the northbound direction the combined journey times on the M1 links have decreased by a total of approximately 1 minute in both peak periods;
� In the southbound direction, average journey times on the M1 links changed very little in the AM peak and have decreased by 1 minute in the PM peak;
� On the widened section (M1 J32-31) in the southbound direction, journey times have decreased by 14 seconds in the AM peak and 50 seconds in the PM peak;
� On the widened section (M1 J31-32) in the northbound direction, journey times have decreased by 30 seconds in the AM peak and by 15 seconds in the PM peak; and
� The M18 links have seen the largest decreases in journey times of approximately 40 seconds in each time period.
POPE One Year After Evaluation: M1 Junction 31-32 Widening
POPE _ M1 J31-32 OYA _ final.docx 30
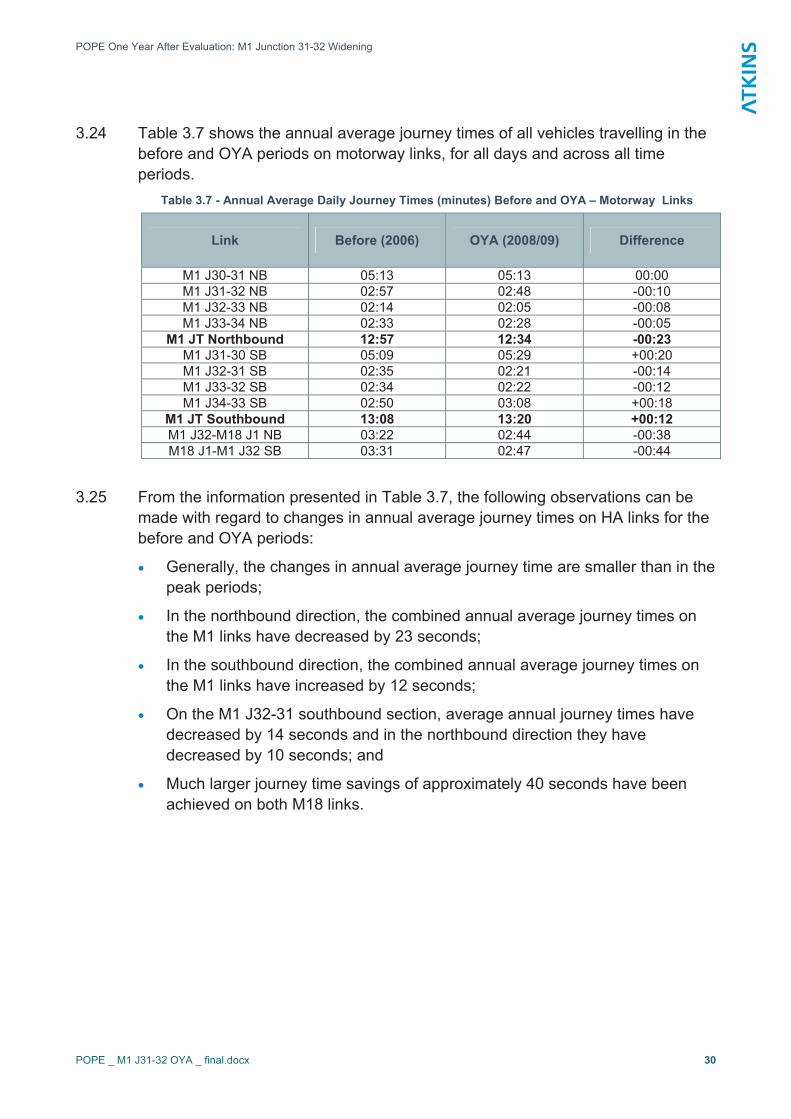
3.24 Table 3.7 shows the annual average journey times of all vehicles travelling in the before and OYA periods on motorway links, for all days and across all time periods.
Table 3.7 - Annual Average Daily Journey Times (minutes) Before and OYA – Motorway Links
Link Before (2006) OYA (2008/09) Difference
M1 J30-31 NB 05:13 05:13 00:00 M1 J31-32 NB 02:57 02:48 -00:10 M1 J32-33 NB 02:14 02:05 -00:08 M1 J33-34 NB 02:33 02:28 -00:05
M1 JT Northbound 12:57 12:34 -00:23 M1 J31-30 SB 05:09 05:29 +00:20 M1 J32-31 SB 02:35 02:21 -00:14 M1 J33-32 SB 02:34 02:22 -00:12 M1 J34-33 SB 02:50 03:08 +00:18
M1 JT Southbound 13:08 13:20 +00:12 M1 J32-M18 J1 NB 03:22 02:44 -00:38M18 J1-M1 J32 SB 03:31 02:47 -00:44
3.25 From the information presented in Table 3.7, the following observations can be made with regard to changes in annual average journey times on HA links for the before and OYA periods:
� Generally, the changes in annual average journey time are smaller than in the peak periods;
� In the northbound direction, the combined annual average journey times on the M1 links have decreased by 23 seconds;
� In the southbound direction, the combined annual average journey times on the M1 links have increased by 12 seconds;
� On the M1 J32-31 southbound section, average annual journey times have decreased by 14 seconds and in the northbound direction they have decreased by 10 seconds; and
� Much larger journey time savings of approximately 40 seconds have been achieved on both M18 links.
POPE One Year After Evaluation: M1 Junction 31-32 Widening
POPE _ M1 J31-32 OYA _ final.docx 31
SCC Local Route Journey Times
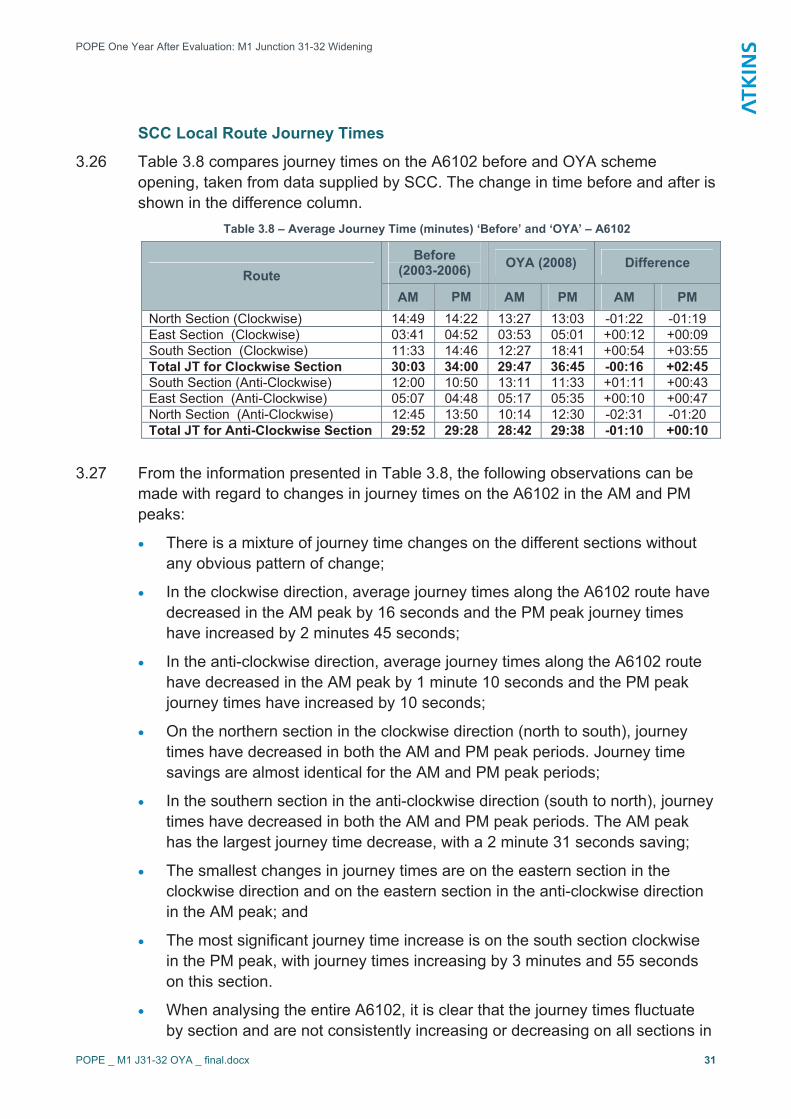
3.26 Table 3.8 compares journey times on the A6102 before and OYA scheme opening, taken from data supplied by SCC. The change in time before and after is shown in the difference column.
Table 3.8 – Average Journey Time (minutes) ‘Before’ and ‘OYA’ – A6102
Before(2003-2006) OYA (2008) Difference
Route AM PM AM PM AM PM
North Section (Clockwise) 14:49 14:22 13:27 13:03 -01:22 -01:19 East Section (Clockwise) 03:41 04:52 03:53 05:01 +00:12 +00:09 South Section (Clockwise) 11:33 14:46 12:27 18:41 +00:54 +03:55 Total JT for Clockwise Section 30:03 34:00 29:47 36:45 -00:16 +02:45 South Section (Anti-Clockwise) 12:00 10:50 13:11 11:33 +01:11 +00:43 East Section (Anti-Clockwise) 05:07 04:48 05:17 05:35 +00:10 +00:47 North Section (Anti-Clockwise) 12:45 13:50 10:14 12:30 -02:31 -01:20 Total JT for Anti-Clockwise Section 29:52 29:28 28:42 29:38 -01:10 +00:10
3.27 From the information presented in Table 3.8, the following observations can be made with regard to changes in journey times on the A6102 in the AM and PM peaks:
� There is a mixture of journey time changes on the different sections without any obvious pattern of change;
� In the clockwise direction, average journey times along the A6102 route have decreased in the AM peak by 16 seconds and the PM peak journey times have increased by 2 minutes 45 seconds;
� In the anti-clockwise direction, average journey times along the A6102 route have decreased in the AM peak by 1 minute 10 seconds and the PM peak journey times have increased by 10 seconds;
� On the northern section in the clockwise direction (north to south), journey times have decreased in both the AM and PM peak periods. Journey time savings are almost identical for the AM and PM peak periods;
� In the southern section in the anti-clockwise direction (south to north), journey times have decreased in both the AM and PM peak periods. The AM peak has the largest journey time decrease, with a 2 minute 31 seconds saving;
� The smallest changes in journey times are on the eastern section in the clockwise direction and on the eastern section in the anti-clockwise direction in the AM peak; and
� The most significant journey time increase is on the south section clockwise in the PM peak, with journey times increasing by 3 minutes and 55 seconds on this section.
� When analysing the entire A6102, it is clear that the journey times fluctuate by section and are not consistently increasing or decreasing on all sections in
POPE One Year After Evaluation: M1 Junction 31-32 Widening
POPE _ M1 J31-32 OYA _ final.docx 32
a single direction. This would tend to indicate that the changes in journey times on local routes (both increases and decreases) are caused by local level traffic conditions, and not a strategic impact of the motorway widening scheme.
Conclusions Regarding Journey Times
3.28 Taking into consideration the information presented in this section, the following conclusions can be drawn for journey times on the motorway links and the A6102:
� Combined journey times on all five motorway sections have decreased in both the AM and PM peaks in both the northbound and southbound directions;
� There has been a reduction in journey times on all the northbound motorway links. This could be as a result of the increased capacity provided by the widening scheme but it could also be caused by the reduction in northbound traffic volumes since 2003;
� In the southbound direction, journey times have decreased on the majority of links. Again, this may be a result of the widening scheme or the reduction in southbound traffic flows. The exceptions are on the M1 between J31 - 30 and J34 – 33 where journey times have increased by a small amount;
� It is difficult to be certain that journey time savings on the wider motorway network are a result of the scheme, so a robust evaluation would be to assess the impacts on the widened link only, in line with the original scheme appraisal;
� On the A6102, combined journey times have decreased in the AM peak, but there has been an increase in journey times in both directions in the PM peak;
� The different sections within the overall A6102 journey time routes show a mixture of results. There has been a reduction in journey times on the northern section of the A6102 in both directions, although journey times have increased on the southern section in both directions. Journey times on the eastern section have shown little change; and
� The variation in change on the A6102 suggests that traffic flows are responding to local factors rather than the strategic impact of the motorway widening scheme.
POPE One Year After Evaluation: M1 Junction 31-32 Widening
POPE _ M1 J31-32 OYA _ final.docx 33
Route Stress 3.29 One of this scheme’s objectives was not only to improve journey times, but also
to improve journey reliability. WebTag guidance specifies a stress based approach to the assessment of reliability impacts of road proposals. The Appraisal Summary Table (AST) for this scheme did not contain a numeric forecast of route stress, but it did state that ‘Journey Time Reliability’ should improve as a result of increased capacity and reduced levels of congestion’. The overall assessment was large beneficial.
Definition of Route Stress
3.30 The Stress Factor for a particular link is defined as the ratio of the Annual Average Daily Traffic (AADT) flow to the Congestion Reference Flow (CRF). The CRF is expressed as an AADT flow estimate at which a road is likely to be congested in the peak periods on an average day. When the traffic flow on a particular link reaches the CRF it is considered to be at 100% Stress.
Changes to Route Stress
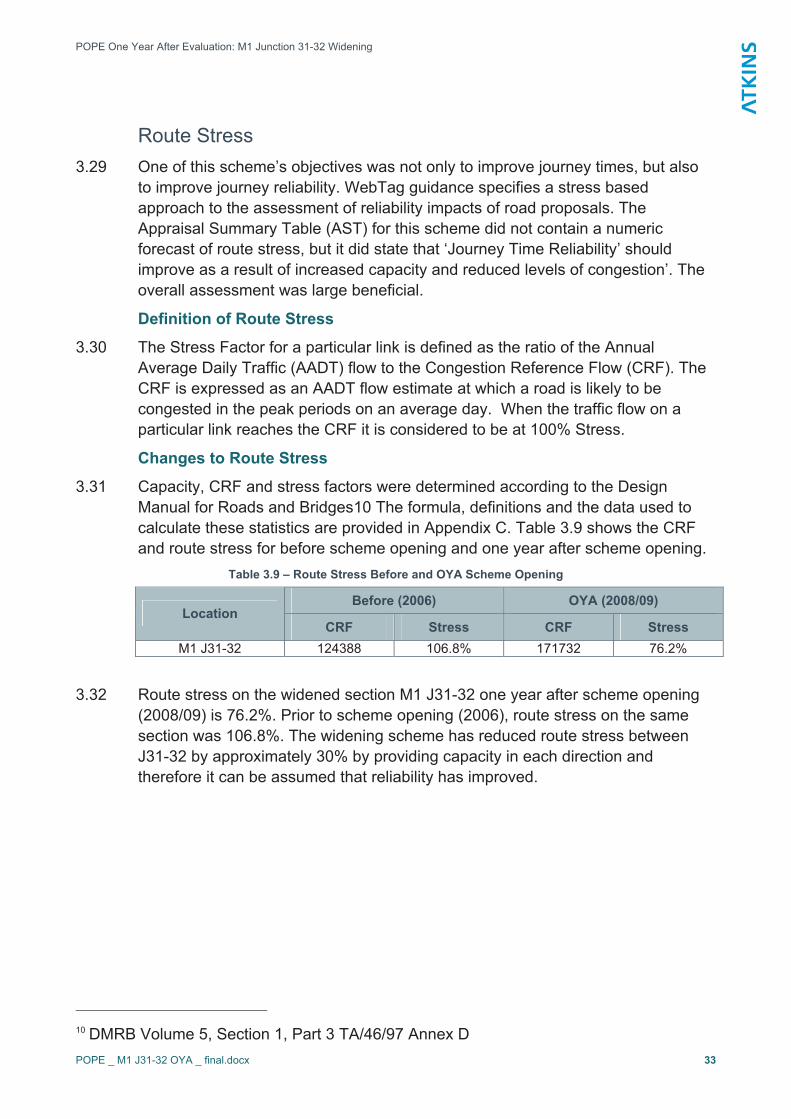
3.31 Capacity, CRF and stress factors were determined according to the Design Manual for Roads and Bridges10 The formula, definitions and the data used to calculate these statistics are provided in Appendix C. Table 3.9 shows the CRF and route stress for before scheme opening and one year after scheme opening.
Table 3.9 – Route Stress Before and OYA Scheme Opening
Before (2006) OYA (2008/09) Location
CRF Stress CRF StressM1 J31-32 124388 106.8% 171732 76.2%
3.32 Route stress on the widened section M1 J31-32 one year after scheme opening (2008/09) is 76.2%. Prior to scheme opening (2006), route stress on the same section was 106.8%. The widening scheme has reduced route stress between J31-32 by approximately 30% by providing capacity in each direction and therefore it can be assumed that reliability has improved.
10 DMRB Volume 5, Section 1, Part 3 TA/46/97 Annex D
POPE One Year After Evaluation: M1 Junction 31-32 Widening
POPE _ M1 J31-32 OYA _ final.docx 34
Key Points from Section 3 - Traffic
Traffic Volume Changes
� Comparing the before and OYA data, there has been a reduction in traffic volumes on all motorways links in both directions of over 2% on average;
� In general, traffic volumes on Local Authority roads have had small traffic increases between 2006 - 2008, although there was quite high variation between sites; and
� Local Authority roads closest to the M1 experienced traffic reductions or low levels of growth. Traffic at these sites has reduced in relation to background traffic change.
Traffic Growth
� The downward trend in traffic on the M1 / M18 motorway links from the year 2003 to 2008/09 is reflected by trends across the whole Yorkshire & North East Region, where motorway flows have reduced over the last 5 years;
� On local authority routes, from 2006-2008, there has been a 0.8% increase in traffic across all 8 count sites in both directions, which is slightly above growth predicted in RTF 08 factored by TEMPRO over the same period; and
� Long term trends in traffic on the network have continued since the scheme was constructed which suggests that it has had a negligible impact on traffic volumes in the area at the OYA stage.
Traffic Forecasts
� The forecasts that were available showed that traffic volumes were forecast to increase between the baseline level and the scheme opening year as a result of background traffic growth;
� The scheme itself was not forecast to have any significant effect on traffic volumes; and
� The actual traffic volumes were significantly lower than forecast, which reflects traffic reductions on the motorway network in the region.
Journey Times
� Journey times in the AM and PM peak have decreased on the M1 and M18;
� The M1 J31-30 (AM and PM) and M1 J34-33 (AM only) are the only sections to show increased journey times;
� Average annual journey times of vehicles in the before and OYA period on the M1 sections show that journey times have not changed by a significant amount but there is a much more significant reduction on the M18 link; and
� On the A6102 route, journey times have decreased in the AM peak but increased in the PM peak; although there are differential journey times on this route.
Route Stress
� As expected, the additional capacity on the M1 J31-32 section, coupled with decreasing traffic volumes has led to a reduction in route stress from 106.8% before scheme opening to 76.2% OYA scheme opening.