Embed Size (px)
Citation preview
HAL Id: hal-02098886https://hal-univ-lyon1.archives-ouvertes.fr/hal-02098886
Submitted on 13 Apr 2019
HAL is a multi-disciplinary open accessarchive for the deposit and dissemination of sci-entific research documents, whether they are pub-lished or not. The documents may come fromteaching and research institutions in France orabroad, or from public or private research centers.
L’archive ouverte pluridisciplinaire HAL, estdestinée au dépôt et à la diffusion de documentsscientifiques de niveau recherche, publiés ou non,émanant des établissements d’enseignement et derecherche français ou étrangers, des laboratoirespublics ou privés.
Poor transcript-protein correlation in the brain:negatively correlating gene products reveal neuronal
polarity as a potential causeChristian Moritz, Timo Mühlhaus, Stefan Tenzer, Thomas Schulenborg,
Eckhard Friauf
To cite this version:Christian Moritz, Timo Mühlhaus, Stefan Tenzer, Thomas Schulenborg, Eckhard Friauf. Poortranscript-protein correlation in the brain: negatively correlating gene products reveal neuronal po-larity as a potential cause. Journal of Neurochemistry, Wiley, In press, �10.1111/jnc.14664�. �hal-02098886�
1
Regular research paper Submitted to J Neurochem
Poor transcript-protein correlation in the brain:
negatively correlating gene products reveal
neuronal polarity as potential cause
Christian P. Moritzab*, Timo Mühlhausc, Stefan Tenzerd, Thomas Schulenborgae, Eckhard
Friaufa
aAnimal Physiology Group, Department of Biology, University of Kaiserslautern, Erwin-
Schrödinger-Straße 13, 67663 Kaiserslautern, Germany
bSynaptopathies and Autoantibodies, Institut NeuroMyoGène, Faculty of Medicine,
University Jean Monnet, 10 rue de Marandière, 42270 Saint-Étienne, France
cComputational Systems Biology, Department of Biology, University of Kaiserslautern, Erwin-
Schrödinger-Straße 56, 67663 Kaiserslautern, Germany
dInstitute of Immunology, University Medical Center of the Johannes Gutenberg University
Mainz, Langenbeckstr. 1, 55131 Mainz, Germany
eDivision of Allergology, Paul-Ehrlich-Institut, Paul-Ehrlich-Straße 51-59, 63225 Langen,
Germany
*Correspondence to: Christian P. Moritz Synaptopathies and Autoantibodies, Institut NeuroMyoGène, Faculty of Medicine, University Jean Monnet, 10 rue de Marandière, 42270 Saint-Étienne, France [email protected] Running title (up to 45 characters): Poor transcript-protein correlation in the brain Keywords (up to 6): negative transcript|protein correlation; integrative omics; neuronal polarity; protein transport; transcriptomics; proteomics
2
Abbreviations used: CN: cochlear nuclear complex, CNS: central nervous system, cRNA: complementary RNA, DNA: deoxyribonucleic acid, GO: gene ontology, IC: inferior colliculi, MA (plot): log ratio versus mean average (plot), mRNA: messenger RNA, PC: principal component, QI-QIV: quadrant I – quadrant IV, RNA: ribonucleic acid, RoB: rest of the brain, ROI: region of interest, SOC: superior olivary complex
3
Abstract
Transcription, translation, and turnover of transcripts and proteins are essential for cellular
function. The contribution of those factors to protein levels is under debate, as transcript levels
and cognate protein levels do not necessarily correlate due to regulation of translation and
protein turnover. Here we propose neuronal polarity as a third factor that is particularly evident
in the CNS, leading to considerable distances between somata and axon terminals.
Consequently, transcript levels may negatively correlate with cognate protein levels in CNS
regions, i.e., transcript and protein levels behave reciprocally. To test this hypothesis, we
analyzed three interconnected rat auditory brainstem regions and the rest of the brain as a
reference. We obtained transcript and protein sets in these regions of interest (ROIs) by DNA
microarrays and label-free mass spectrometry, and performed principal component and
correlation analyses. We found 508 transcript|protein pairs and detected poor to moderate
transcript|protein correlation in all ROIs, as evidenced by coefficients of determination
between 0.34-0.54. We identified 57-80 negatively correlating gene products in the ROIs and
intensively analyzed four of them for which the correlation was poorest. Three cognate
proteins (Slc6a11, Syngr1, Tppp) were synaptic and hence candidates for a negative
correlation because of protein transport into axon terminals. Thus, we systematically analyzed
the negatively correlating gene products. GO analyses revealed overrepresented
transport/synapse-related proteins, supporting our hypothesis. We present 30
synapse/transport-related proteins displaying poor transcript|protein correlation. In conclusion,
our analyses support that protein transport in polar cells is a third factor that influences the
protein level and, thereby, the transcript|protein correlation.
4
Introduction
Transcription, translation, and turnover of transcripts (mRNA) and proteins are essential for
cellular function. How closely transcript levels correspond to protein abundance is a
fundamental question in molecular biology (Nie et al. 2007, Liu et al. 2016). Mapping
experiments demonstrated a poor correlation of expression levels at the transcriptome and
the cognate proteome level (Gygi et al. 1999, Maier et al. 2009, Burkhart et al. 2012); see,
however, (Lu et al. 2007)). To quantify correlation in a statistical way, the coefficient of
determination (R2) is used to describe the degree of the variance in protein level that is
predictable from the transcript level. A broad range of R2 values ranging from no correlation
at all (R2 = 0) to good correlation (R2 0.9) has been described (e.g., R2 = 0.55; (Marguerat
et al. 2012); R2 = 0.41; (Schwanhäusser et al. 2011, Jovanovic et al. 2015); R2 = 0.001-0.87,
reviewed by (Waters et al. 2006)). Therefore, transcript levels are rather proxies for protein
abundance (Gunawardana et al. 2015). That transcript and protein levels of the same gene
do not always strongly correlate is explained by (1) regulation of translation (Schwanhäusser
et al. 2011) and (2) protein stability (Geiger et al. 2013). According to Schwanhäusser and
colleagues, regulation of translation plays the major role for determining the protein level
from the transcript level, while protein stability plays a minor role. A third, not mutually
exclusive explanation, forms the basis for the present study and is particularly evident in the
nervous system. Hence, it could not be described in Schwanhäusser’s study employing
fibroblasts. In the nervous system, neurons display a drastically polar morphology, which is
evidenced by the fact that soma and axon terminals of a given neuron may be separated by
several millimeters, if not tens of centimeters. Whereas transcript molecules usually reside in
the soma, many proteins are transported into the axon terminals, which, in case of projection
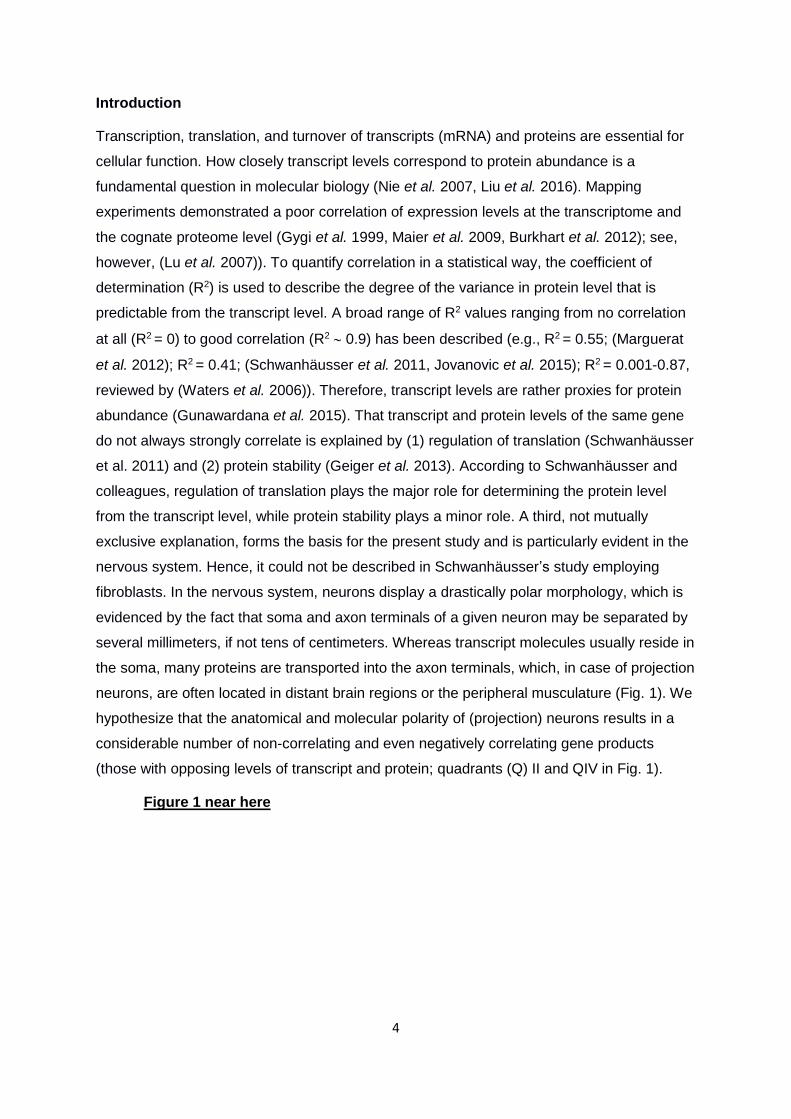
neurons, are often located in distant brain regions or the peripheral musculature (Fig. 1). We
hypothesize that the anatomical and molecular polarity of (projection) neurons results in a
considerable number of non-correlating and even negatively correlating gene products
(those with opposing levels of transcript and protein; quadrants (Q) II and QIV in Fig. 1).
Figure 1 near here
5
Fig. 1 Schematic illustration of the neuronal polarity hypothesis. Drawings at the bottom of each panel show a schematic neuron whose soma resides in region A. The axon, which may be < 1 mm to > 1 m long, projects into region B where it contacts the soma of a postsynaptic neuron. Proportions of cellular elements are distorted for the purpose of clarity. Transcripts (blue), proteins (green), and the cell nuclei (brown) are also shown. Diagrams at the top of each panel depict exemplary levels of the transcript and the cognate protein in region A and
6
B. (a) A region-typical somatic protein shows a high transcript|protein correlation; either it appears in QI (both levels high) or in QIII (both levels low). (b) Trafficking of a region-typical protein into the remote axon terminal in region B causes negative correlation of transcript|protein. Therefore, it appears either in QII (protein high, transcript low) or in QIV (protein low, transcript high). (c) A ubiquitously and high-abundant protein, in contrast to a region-typical protein of (a) and (b), that is transported into the axon terminal, results in a high transcript|protein correlation in region A and region B, and, consequently, a dot in QI.
When disregarding different half-lives of molecules, translational regulation, and transport
effects in polar neurons, transcript and protein levels likely correlate strongly (Fig. 1a).
Transport processes, however, that separate the protein spatially from the transcript, may
cause poor correlation (Fig. 1b). Notably, protein transport affects the transcript|protein
correlation only for gene products that are higher abundant in specific regions, in the
following called region-typical gene products (compare regions A and B in Fig. 1b), because
the protein is transported into a region with low transcript level of the cognate protein,
creating a negative correlation. In contrast, the transcript|protein correlation of widely
expressed gene products should be less affected by protein transport (Fig. 1c), unless
presynaptic axon terminals and postsynaptic somata are separated prior to analysis.
In order to study the peculiarities of neuronal polarity in terms of transcript|protein
correlation, we aimed to perform transcriptomics and proteomics experiments in
interconnected brain regions. The mammalian brainstem appeared appropriate to us as it
contains a multitude of nuclei which are gathered together in highly interconnected
complexes (Malmierca and Hackett 2010, Schofield 2010), such as the cochlear nuclear
complex (CN), the superior olivary complex (SOC), and the inferior colliculi (IC). Recently,
we have described region-typical proteins in these brainstem regions in a proteomic shotgun
approach (Moritz et al. 2015). Because of the neuronal polarity, we hypothesize that
negatively correlating transcript|protein pairs are likely in these regions. In order to address
our hypothesis and to identify negatively correlating transcript|protein pairs, we here
analyzed the transcriptome and proteome of the CN, SOC, and IC. We included the rest of
the brain (RoB) as a fourth and more general region. The transcriptome was enclosed by
DNA microarrays to measure transcript levels, and the proteome was analyzed by label-free
quantitative proteomics (Distler et al. 2014).
Vogel and Marcotte (2012) suggested categorizing transcriptomic|proteomic studies with
the following key concepts. 1) Absolute concentrations (amount per unit) versus relative
concentrations (ratios of two absolute concentrations) of transcripts and proteins; 2) rates (of
a process such as translation) versus concentrations (relative or absolute amounts); 3)
steady-state (zero net change of gene products) versus non-steady-state (perturbed by a
stimulus) systems; 4) single cell versus population analysis. Our approach addressed

7
relative concentrations of transcripts and proteins, steady-state (unperturbed) conditions,
and cell populations. Several studies reporting a good transcript|protein correlation have
focused on cell cultures such as yeast, E. coli or fibroblasts, where cell polarity is virtually
absent (Futcher et al. 1999, Greenbaum et al. 2003, Lu et al. 2007). In contrast, our study
has addressed interconnected brain regions. We found negatively correlating gene products
that indicate neuronal cell polarity as a potential cause of reduced transcript|protein
correlation in brain tissue.
8
Materials and methods
Animals and tissue preparation
Animal treatment was in accordance with the German law for conducting animal experiments
(Tierschutzgesetz) and followed the NIH guide for the care and use of laboratory animals.
We utilized 60(+/-3)-day-old Sprague-Dawley rats of both sexes purchased from Charles
River (Sulzfeld, Germany). As the compared brain regions were prepared from the same
cohort of rats, no randomization was necessary. As we used objective quantitative data, no
blinding was necessary.
Protein analysis
Tissue preparation and protein analytics:
We reused the protein data from our published proteomics project, of which relevant
materials and methods were described in detail (Moritz et al. 2015). In brief, we extracted
proteins from CN, SOC, IC, and RoB tissue and digested them with trypsin. Peptides were
separated by nanoscale reversed phase UPLC using a nanoAcquity system (Waters
Corporation) and analyzed per mass spectrometry using a Q-TOF Premier mass
spectrometer (Waters Corporation). For each ROI, three biological replicates were prepared,
each comprising tissue pooled over six animals, and each biological replicate was measured
in four technical replicates, resulting in 12 replicates (n=12).
Transcript analysis
Tissue preparation for microarray experiments:
Brain tissue was obtained as described (Ehmann et al. 2013, Kaltwaßer et al. 2013, Moritz et
al. 2015). Tissue samples were stored in RNAlater® (ThermoFisher Scientific, Dreieich,
Germany) until further use. All steps were performed using RNAse-free instruments or the
equipment was cleaned using RNase AWAY (ThermoFisher Scientific).
Total RNA isolation:
Total RNA from the four ROIs was purified using RNeasy Mini (CN, SOC, IC) or Midi (RoB)
(Qiagen GmbH, Hilden, Germany) following manufacturer’s instructions. In brief, brain
tissues of two individuals were combined and homogenized in 1 mL (Mini Kit) or 4 mL (Midi
Kit) phenol using an MICCRA D-8 (MICCRA GmbH, Müllheim, Germany) and mixed
afterwards with 200 µL or 1 mL chloroform, respectively. After centrifugation (Biofuge fresco,
Heraeus, Hanau, Germany, 13,700 × g, 15 min, 4°C or Multifuge 1S-R, ThermoFisher
Scientific, 4,618 × g, 19 min, 4°C), the top phase was diluted with an equal volume of 70%
ethanol, applied to spin columns, and concentrated (13,700 × g, 15 s, or 4,618 × g, 15 s).
9
DNA was digested on-column prior to elution of the RNA with RNase-free water. The quality
of the RNA was monitored using Bioanalyzer Expert 2100 and Agilent RNA 600 Pico Kit
(Agilent Technologies, Santa Clara, USA).
Microarray experiments:
1,000 ng of RNA were amplified and labeled using the Quick Amp Labeling Kit, two-color
(Agilent Technologies) and purified using RNAeasy Lipid Tissue Min Kit (Qiagen GmbH)
according to the manufacturer’s instructions. To review the yield and the dye incorporation,
samples were analyzed using a NanoDrop ND-1000 UV-visible spectrophotometer (Peqlab,
Erlangen, Germany). Hybridization of the fluorescently labeled cRNA was performed on
whole genome, 60-mer sequence nucleotide microarrays from Agilent Technologies
(G4131F, 4 x 44,000), containing 41,012 rat genes, expressed sequence tags or predicted
genes. We hybridized 825 ng of cRNA samples of CN, SOC, IC, and RoB twice in dye swap
experiments (Suppl. Fig 1). Slides were scanned on a Microarray Scanner (G2505, Agilent
Technologies). We analyzed five biological replicates for each ROI, each with two technical
replicates, resulting in 10 replicates (n=10).
Array data extraction and normalization:
For further analyses, we extracted the median signal intensities of all coding regions and
RNA genes. Data were log2 transformed and then background-corrected by subtracting the
minima of the background intensities of the dot and its eight neighbors. Variance stabilization
and normalization were performed with the vsn packages (Huber et al. 2002) of the R
software environment (RDevelopmentCoreTeam 2011). The loess method was applied for
normalizing within the arrays and a 0.8 quantile normalization for normalizing between the
arrays. For each probe, set outliers were removed by boxplot statistics (± 1.5 interquartile
range), and outlier-removed probe intensities were averaged in a robust way by computing
the Tukey’s biweight.
Data availability
Both data sets (transcriptome and proteome) are available as supplementary tables (Suppl.
Tab. 1 and 2).
General statistical analysis
Transcripts and proteins were analyzed using BioFSharp and FSharp.Stats
(https://github.com/CSBiology/). Protein data were normalized by shifting the samples to an
equal median under the assumption that the overall protein content was kept constant after
10
log2 transformation. Transcript and protein quantities of the different brain regions were
compared by using limma (Lim et al. 2005). The test for significance, we used a p ≤ 0.05 and
false discovery rate control (Benjamini and Hochberg 1995). Principal component (PC)
analysis was performed over the single replicates (n = 10 for transcriptome, n = 12 for
proteome), and the principal component loadings responsible for the main source of
variation were selected for presentation. In order to calculate the association between the
protein abundancies on their respective transcripts abundancies, we performed a linear
regression analysis in log2 space after z-score transformation. As we excluded proteins with
missing intensity data from further quantitative protein analysis, all proteins in the data set
(n = 508) appear in each of the four brain regions. Sample sizes were not statistically
predetermined, because finding significant level differences was not the focus of our study.
Outliers were not excluded.
GO term enrichment analysis
GO terms describing ‘Biological processes’ and ‘Cellular components’ were obtained from
the Rat Genome Database (http://rgd.mcw.edu/) and assigned to all 508 identified transcript-
protein pairs. Analysis of overrepresentation of certain functional categories was done using
hypergeometric formulation of the null hypothesis to test that the particularly linear
relationship between transcript and protein quantity and its belonging to an annotation
category is statistically independent (Rivals et al. 2007). P values were adjusted according to
Benjamini and Hochberg (1995), and the significance threshold was set to p ≤ 0.01.
11
Results
Quality control
In a first step toward quality controlling our DNA microarray data concerning comparability of
the red Cy3- and the green Cy5-labeled samples, we inspected density plots of probe
intensities and MA plots (i.e., plotting signal ratio versus mean). Those plots allowed us to
visualize the differences between signal intensities obtained for the two labels (Dudoit et al.
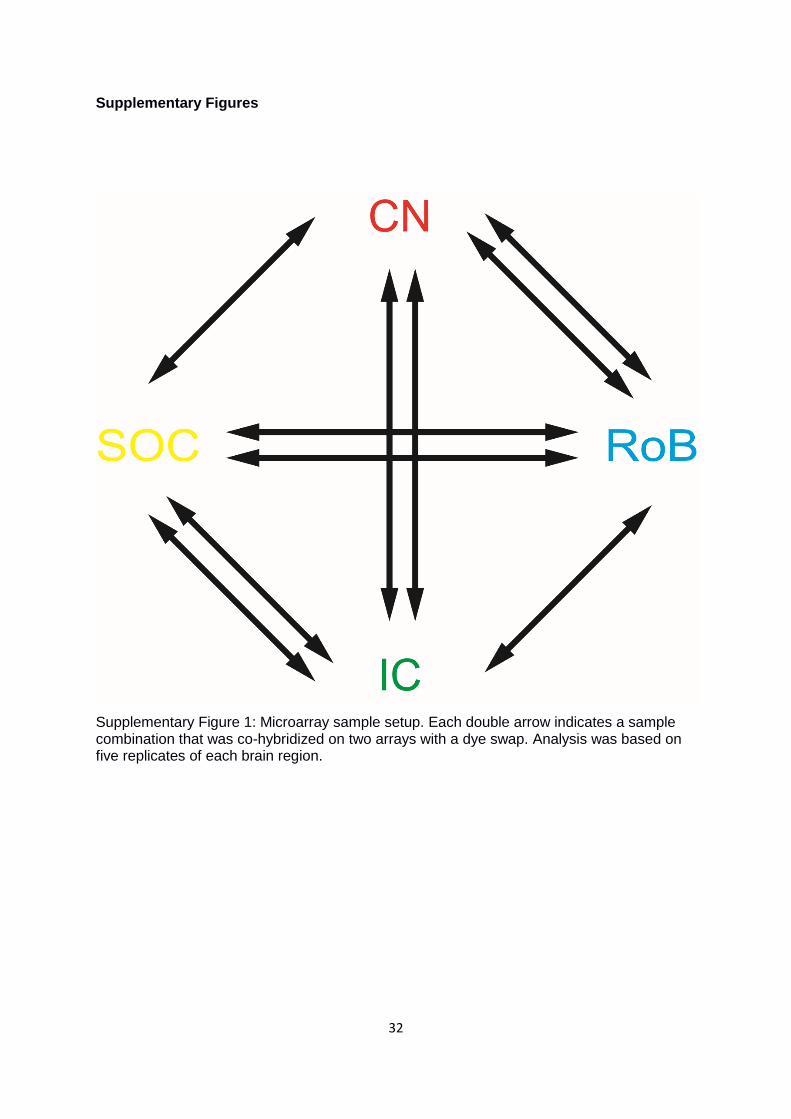
2002, Yang et al. 2002, Bolstad et al. 2003). As demonstrated by the density plots,
distribution of red and green signal intensities was similar, yet red signals emerged less
densely in the low intensity range and were slightly shifted to the right (Suppl. Fig. 2a-c).
This implies that Cy3/5-labeling of the transcripts introduced a quantification bias to the non-
normalized data. A bias toward positive signal ratios was further evident in the MA plots
(Suppl. Fig. 2d). After local regression (loess) and quantile normalization, density plots of the
two dyes matched nearly perfectly (Suppl. Fig. 2c) and the MA plot spread around an
expected ratio of 1 (Suppl. Fig. 2e). As proteins were unlabeled for quantification, systematic
bias was unlikely for these samples. Nevertheless, we normalized the protein levels by
shifting the sum of all protein levels among the samples to an equal median.
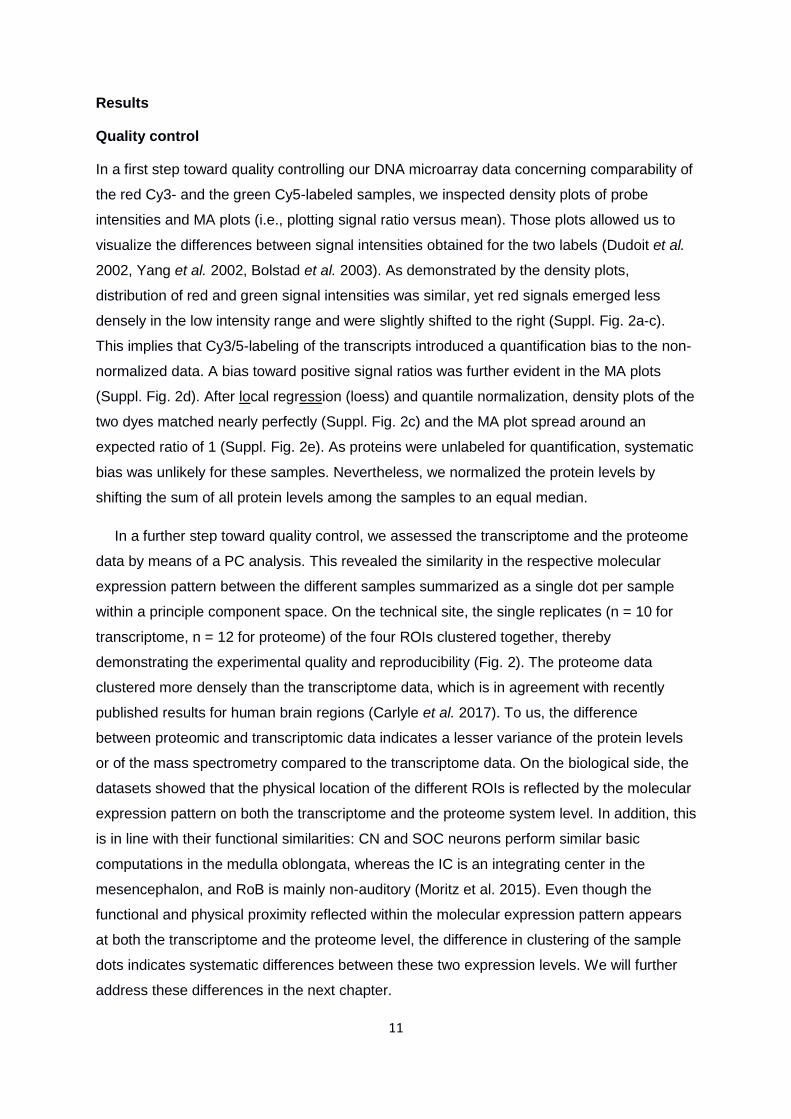
In a further step toward quality control, we assessed the transcriptome and the proteome
data by means of a PC analysis. This revealed the similarity in the respective molecular
expression pattern between the different samples summarized as a single dot per sample
within a principle component space. On the technical site, the single replicates (n = 10 for
transcriptome, n = 12 for proteome) of the four ROIs clustered together, thereby
demonstrating the experimental quality and reproducibility (Fig. 2). The proteome data
clustered more densely than the transcriptome data, which is in agreement with recently
published results for human brain regions (Carlyle et al. 2017). To us, the difference
between proteomic and transcriptomic data indicates a lesser variance of the protein levels
or of the mass spectrometry compared to the transcriptome data. On the biological side, the
datasets showed that the physical location of the different ROIs is reflected by the molecular
expression pattern on both the transcriptome and the proteome system level. In addition, this
is in line with their functional similarities: CN and SOC neurons perform similar basic
computations in the medulla oblongata, whereas the IC is an integrating center in the
mesencephalon, and RoB is mainly non-auditory (Moritz et al. 2015). Even though the
functional and physical proximity reflected within the molecular expression pattern appears
at both the transcriptome and the proteome level, the difference in clustering of the sample
dots indicates systematic differences between these two expression levels. We will further
address these differences in the next chapter.
12
Figure 2 near here
Fig. 2 Principal component (PC) analysis of the ROIs´ (a) transcriptome and (b) proteome data. We performed the PC analysis on normalized microarray signal intensity and the normalized mass spectrometry peak areas as a proxy for protein quantity. Each dot represents the data set of one replicate sample (n = 10 for transcriptome, n = 12 for proteome; several dots overlap). Coordinates show the relative location of the samples in the PC space of PC1 versus PC2, carrying the highest variance depicted in percent of variance in brackets.
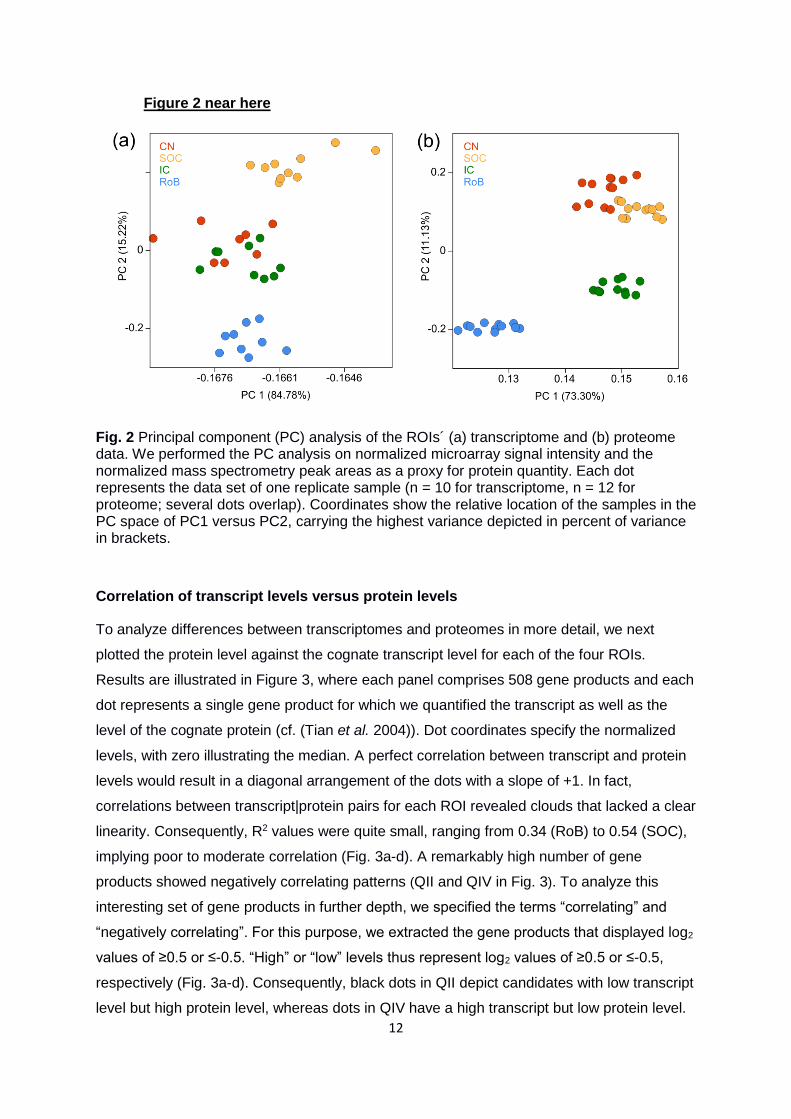
Correlation of transcript levels versus protein levels
To analyze differences between transcriptomes and proteomes in more detail, we next
plotted the protein level against the cognate transcript level for each of the four ROIs.
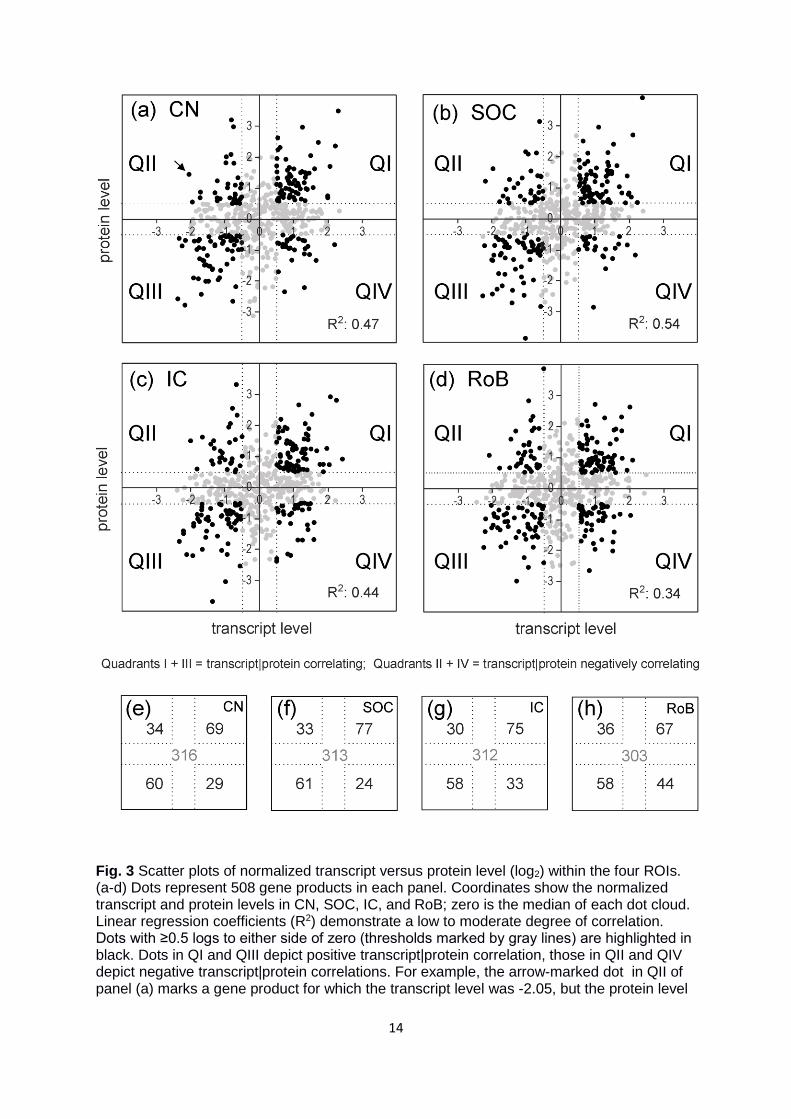
Results are illustrated in Figure 3, where each panel comprises 508 gene products and each
dot represents a single gene product for which we quantified the transcript as well as the
level of the cognate protein (cf. (Tian et al. 2004)). Dot coordinates specify the normalized
levels, with zero illustrating the median. A perfect correlation between transcript and protein
levels would result in a diagonal arrangement of the dots with a slope of +1. In fact,
correlations between transcript|protein pairs for each ROI revealed clouds that lacked a clear
linearity. Consequently, R2 values were quite small, ranging from 0.34 (RoB) to 0.54 (SOC),
implying poor to moderate correlation (Fig. 3a-d). A remarkably high number of gene
products showed negatively correlating patterns (QII and QIV in Fig. 3). To analyze this
interesting set of gene products in further depth, we specified the terms “correlating” and
“negatively correlating”. For this purpose, we extracted the gene products that displayed log2
values of ≥0.5 or ≤-0.5. “High” or “low” levels thus represent log2 values of ≥0.5 or ≤-0.5,
respectively (Fig. 3a-d). Consequently, black dots in QII depict candidates with low transcript
level but high protein level, whereas dots in QIV have a high transcript but low protein level.
13
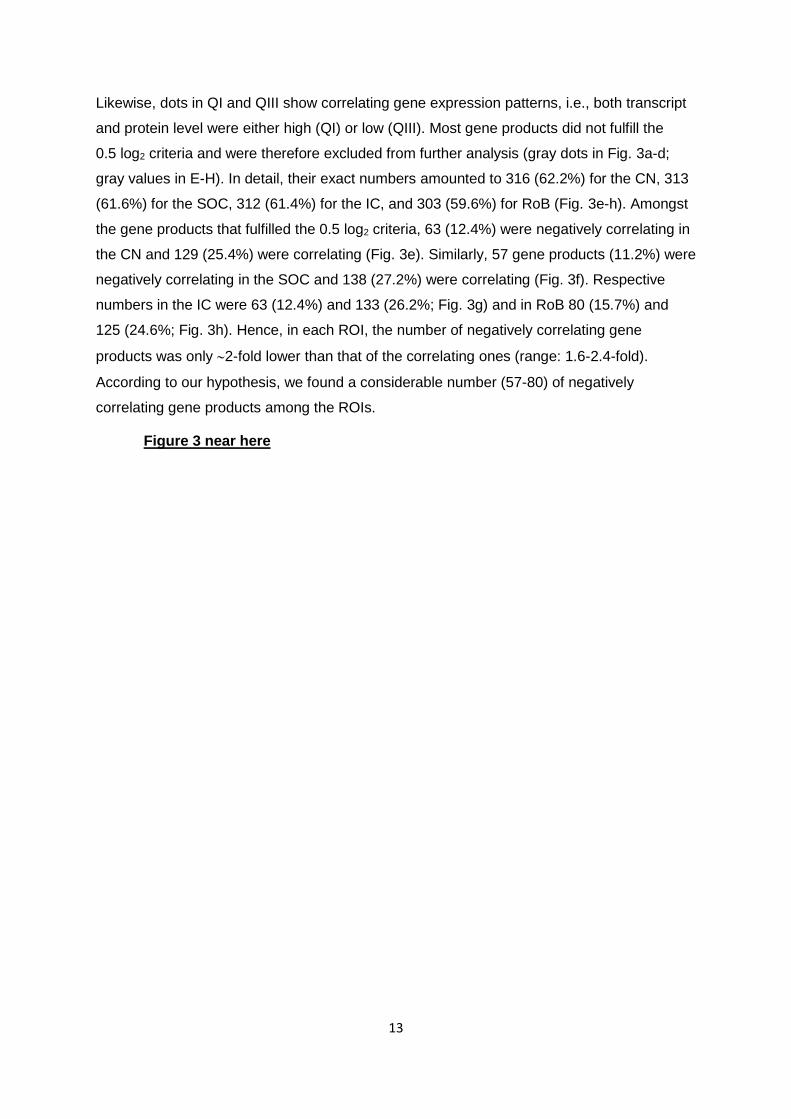
Likewise, dots in QI and QIII show correlating gene expression patterns, i.e., both transcript
and protein level were either high (QI) or low (QIII). Most gene products did not fulfill the
0.5 log2 criteria and were therefore excluded from further analysis (gray dots in Fig. 3a-d;
gray values in E-H). In detail, their exact numbers amounted to 316 (62.2%) for the CN, 313
(61.6%) for the SOC, 312 (61.4%) for the IC, and 303 (59.6%) for RoB (Fig. 3e-h). Amongst
the gene products that fulfilled the 0.5 log2 criteria, 63 (12.4%) were negatively correlating in
the CN and 129 (25.4%) were correlating (Fig. 3e). Similarly, 57 gene products (11.2%) were
negatively correlating in the SOC and 138 (27.2%) were correlating (Fig. 3f). Respective
numbers in the IC were 63 (12.4%) and 133 (26.2%; Fig. 3g) and in RoB 80 (15.7%) and
125 (24.6%; Fig. 3h). Hence, in each ROI, the number of negatively correlating gene
products was only 2-fold lower than that of the correlating ones (range: 1.6-2.4-fold).
According to our hypothesis, we found a considerable number (57-80) of negatively
correlating gene products among the ROIs.
Figure 3 near here
14
Fig. 3 Scatter plots of normalized transcript versus protein level (log2) within the four ROIs. (a-d) Dots represent 508 gene products in each panel. Coordinates show the normalized transcript and protein levels in CN, SOC, IC, and RoB; zero is the median of each dot cloud. Linear regression coefficients (R2) demonstrate a low to moderate degree of correlation. Dots with ≥0.5 logs to either side of zero (thresholds marked by gray lines) are highlighted in black. Dots in QI and QIII depict positive transcript|protein correlation, those in QII and QIV depict negative transcript|protein correlations. For example, the arrow-marked dot in QII of panel (a) marks a gene product for which the transcript level was -2.05, but the protein level
15
+1.44. (e-h) Numbers of black dots (≥0.5 logs to either side of zero) in the four quadrants and of gray dots (≤0.5 logs to either side of zero) are provided in the miniaturized diagrams.
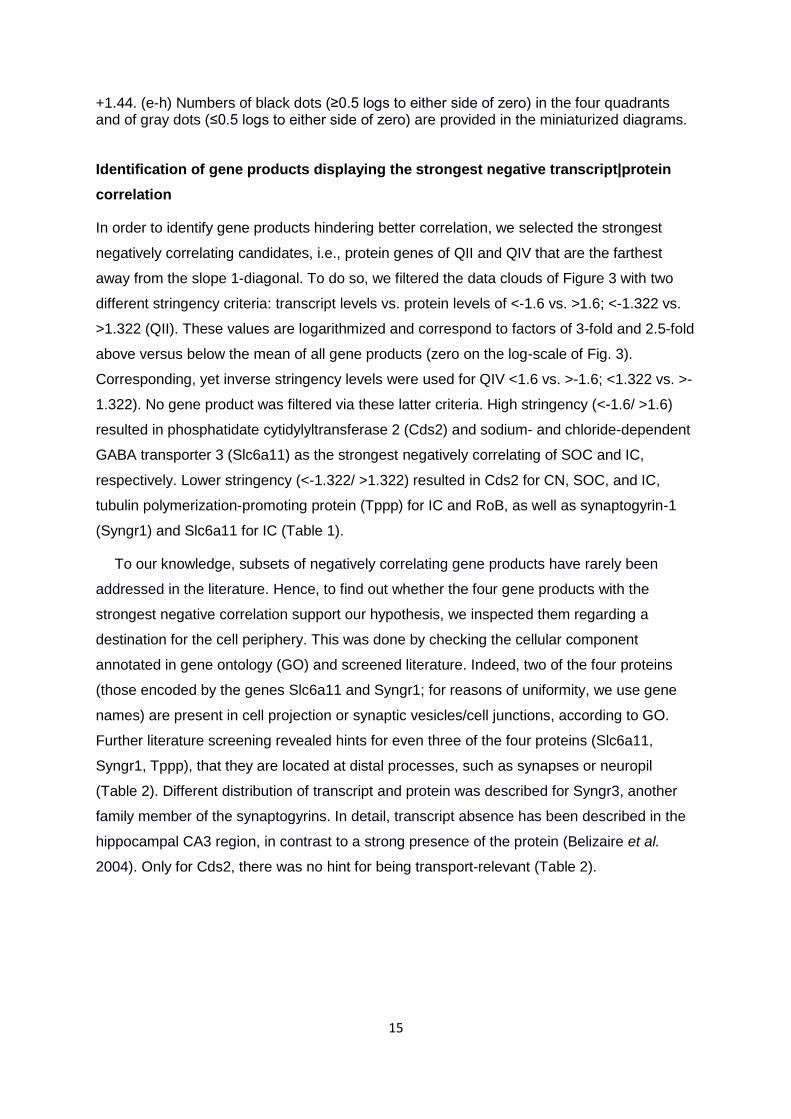
Identification of gene products displaying the strongest negative transcript|protein
correlation
In order to identify gene products hindering better correlation, we selected the strongest
negatively correlating candidates, i.e., protein genes of QII and QIV that are the farthest
away from the slope 1-diagonal. To do so, we filtered the data clouds of Figure 3 with two
different stringency criteria: transcript levels vs. protein levels of <-1.6 vs. >1.6; <-1.322 vs.
>1.322 (QII). These values are logarithmized and correspond to factors of 3-fold and 2.5-fold
above versus below the mean of all gene products (zero on the log-scale of Fig. 3).
Corresponding, yet inverse stringency levels were used for QIV <1.6 vs. >-1.6; <1.322 vs. >-
1.322). No gene product was filtered via these latter criteria. High stringency (<-1.6/ >1.6)
resulted in phosphatidate cytidylyltransferase 2 (Cds2) and sodium- and chloride-dependent
GABA transporter 3 (Slc6a11) as the strongest negatively correlating of SOC and IC,
respectively. Lower stringency (<-1.322/ >1.322) resulted in Cds2 for CN, SOC, and IC,
tubulin polymerization-promoting protein (Tppp) for IC and RoB, as well as synaptogyrin-1
(Syngr1) and Slc6a11 for IC (Table 1).
To our knowledge, subsets of negatively correlating gene products have rarely been
addressed in the literature. Hence, to find out whether the four gene products with the
strongest negative correlation support our hypothesis, we inspected them regarding a
destination for the cell periphery. This was done by checking the cellular component
annotated in gene ontology (GO) and screened literature. Indeed, two of the four proteins
(those encoded by the genes Slc6a11 and Syngr1; for reasons of uniformity, we use gene
names) are present in cell projection or synaptic vesicles/cell junctions, according to GO.
Further literature screening revealed hints for even three of the four proteins (Slc6a11,
Syngr1, Tppp), that they are located at distal processes, such as synapses or neuropil
(Table 2). Different distribution of transcript and protein was described for Syngr3, another
family member of the synaptogyrins. In detail, transcript absence has been described in the
hippocampal CA3 region, in contrast to a strong presence of the protein (Belizaire et al.
2004). Only for Cds2, there was no hint for being transport-relevant (Table 2).
16
Table 1: Identification of gene products displaying the strongest negative transcript|protein correlation in the four ROIs
transcript level/ protein
level* CN SOC IC RoB
< -1.6/ >1.6 Cds2 Slc6a11
< -1.322/ >1.322
Cds2 Cds2
Syngr1, Cds2, Tppp,
Slc6a11
Tppp
The log2 values provided in the table correspond to factors 0.333/3 and 0.4/2.5.
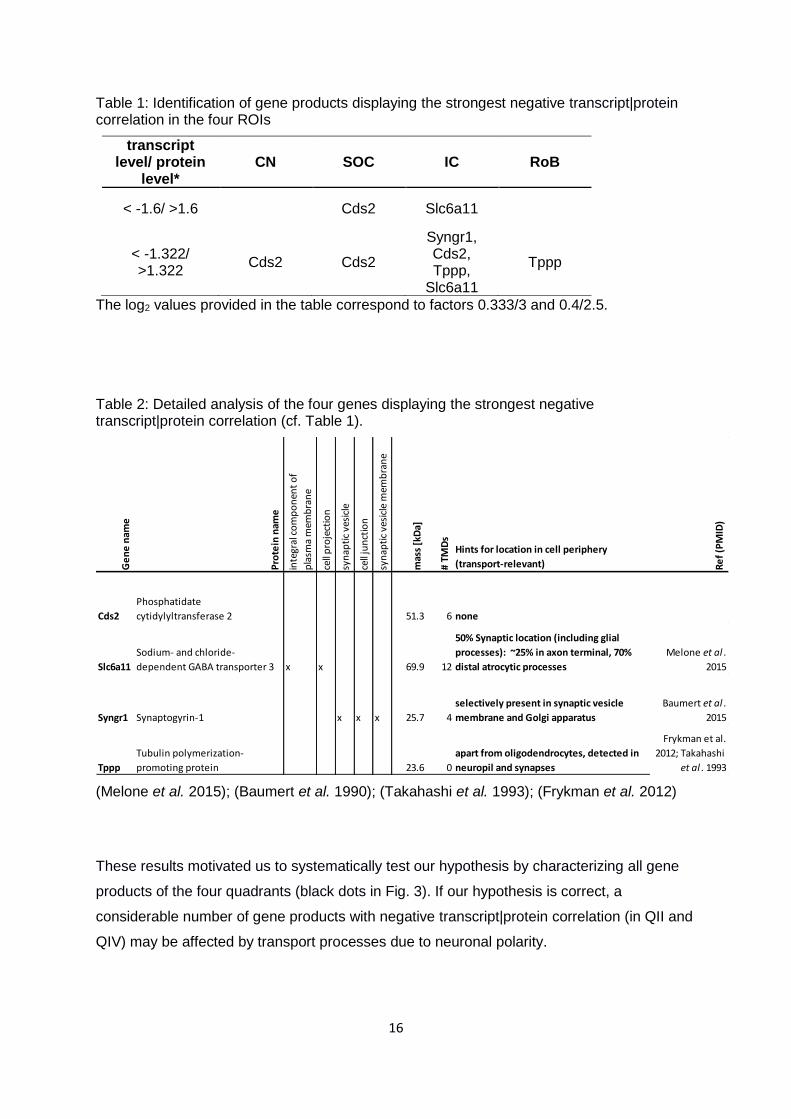
Table 2: Detailed analysis of the four genes displaying the strongest negative transcript|protein correlation (cf. Table 1).
(Melone et al. 2015); (Baumert et al. 1990); (Takahashi et al. 1993); (Frykman et al. 2012)
These results motivated us to systematically test our hypothesis by characterizing all gene
products of the four quadrants (black dots in Fig. 3). If our hypothesis is correct, a
considerable number of gene products with negative transcript|protein correlation (in QII and
QIV) may be affected by transport processes due to neuronal polarity.
Ge
ne
nam
e
Pro
tein
nam
e
inte
gral
co
mp
on
ent
of
pla
sma
mem
bra
ne
cell
pro
ject
ion
syn
apti
c ve
sicl
e
cell
jun
ctio
n
syn
apti
c ve
sicl
e m
emb
ran
e
mas
s [k
Da]
# T
MD
s
Hints for location in cell periphery
(transport-relevant) Re
f (P
MID
)
Cds2
Phosphatidate
cytidylyltransferase 2 51.3 6 none
Slc6a11
Sodium- and chloride-
dependent GABA transporter 3 x x 69.9 12
50% Synaptic location (including glial
processes): ~25% in axon terminal, 70%
distal atrocytic processes
Melone et al .
2015
Syngr1 Synaptogyrin-1 x x x 25.7 4
selectively present in synaptic vesicle
membrane and Golgi apparatus
Baumert et al .
2015
Tppp
Tubulin polymerization-
promoting protein 23.6 0
apart from oligodendrocytes, detected in
neuropil and synapses
Frykman et al.
2012; Takahashi
et al . 1993
17
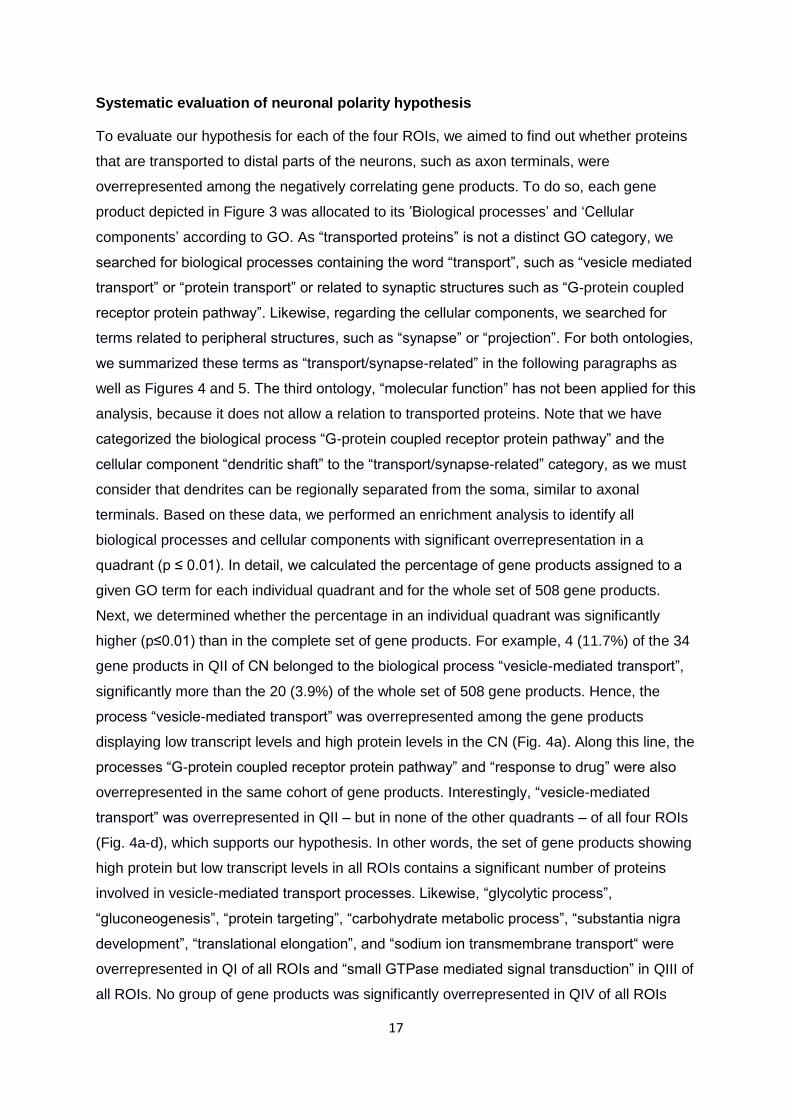
Systematic evaluation of neuronal polarity hypothesis
To evaluate our hypothesis for each of the four ROIs, we aimed to find out whether proteins
that are transported to distal parts of the neurons, such as axon terminals, were
overrepresented among the negatively correlating gene products. To do so, each gene
product depicted in Figure 3 was allocated to its ’Biological processes’ and ‘Cellular
components’ according to GO. As “transported proteins” is not a distinct GO category, we
searched for biological processes containing the word “transport”, such as “vesicle mediated
transport” or “protein transport” or related to synaptic structures such as “G-protein coupled
receptor protein pathway”. Likewise, regarding the cellular components, we searched for
terms related to peripheral structures, such as “synapse” or “projection”. For both ontologies,
we summarized these terms as “transport/synapse-related” in the following paragraphs as
well as Figures 4 and 5. The third ontology, “molecular function” has not been applied for this
analysis, because it does not allow a relation to transported proteins. Note that we have
categorized the biological process “G-protein coupled receptor protein pathway” and the
cellular component “dendritic shaft” to the “transport/synapse-related” category, as we must
consider that dendrites can be regionally separated from the soma, similar to axonal
terminals. Based on these data, we performed an enrichment analysis to identify all
biological processes and cellular components with significant overrepresentation in a
quadrant (p ≤ 0.01). In detail, we calculated the percentage of gene products assigned to a
given GO term for each individual quadrant and for the whole set of 508 gene products.
Next, we determined whether the percentage in an individual quadrant was significantly
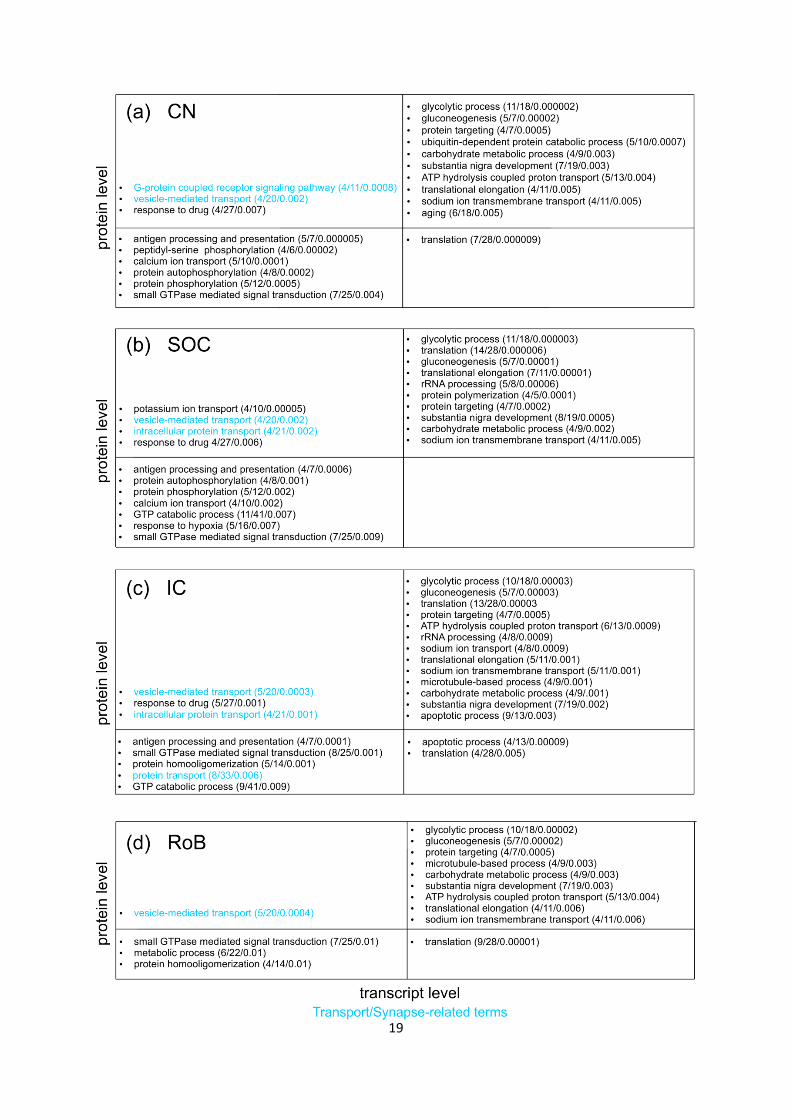
higher (p≤0.01) than in the complete set of gene products. For example, 4 (11.7%) of the 34
gene products in QII of CN belonged to the biological process “vesicle-mediated transport”,
significantly more than the 20 (3.9%) of the whole set of 508 gene products. Hence, the
process “vesicle-mediated transport” was overrepresented among the gene products
displaying low transcript levels and high protein levels in the CN (Fig. 4a). Along this line, the
processes “G-protein coupled receptor protein pathway” and “response to drug” were also
overrepresented in the same cohort of gene products. Interestingly, “vesicle-mediated
transport” was overrepresented in QII – but in none of the other quadrants – of all four ROIs
(Fig. 4a-d), which supports our hypothesis. In other words, the set of gene products showing
high protein but low transcript levels in all ROIs contains a significant number of proteins
involved in vesicle-mediated transport processes. Likewise, “glycolytic process”,
“gluconeogenesis”, “protein targeting”, “carbohydrate metabolic process”, “substantia nigra
development”, “translational elongation”, and “sodium ion transmembrane transport“ were
overrepresented in QI of all ROIs and “small GTPase mediated signal transduction” in QIII of
all ROIs. No group of gene products was significantly overrepresented in QIV of all ROIs

18
(Fig. 4). In total, 50-100% (2/4 to 2/2) of the overrepresented biological process terms in QII
of all ROIs belonged to GO terms related to transport/synapse (cyan-marked in Fig. 4).
Figure 4 near here
19
20
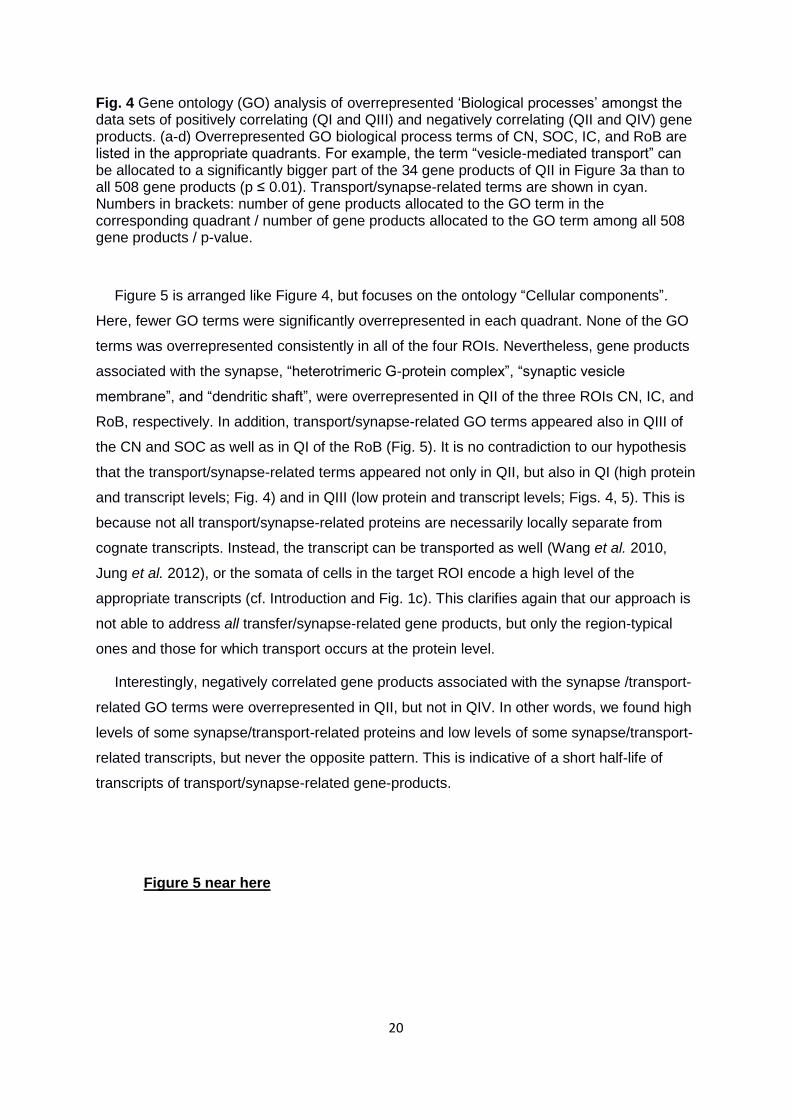
Fig. 4 Gene ontology (GO) analysis of overrepresented ‘Biological processes’ amongst the data sets of positively correlating (QI and QIII) and negatively correlating (QII and QIV) gene products. (a-d) Overrepresented GO biological process terms of CN, SOC, IC, and RoB are listed in the appropriate quadrants. For example, the term “vesicle-mediated transport” can be allocated to a significantly bigger part of the 34 gene products of QII in Figure 3a than to all 508 gene products (p ≤ 0.01). Transport/synapse-related terms are shown in cyan. Numbers in brackets: number of gene products allocated to the GO term in the corresponding quadrant / number of gene products allocated to the GO term among all 508 gene products / p-value.
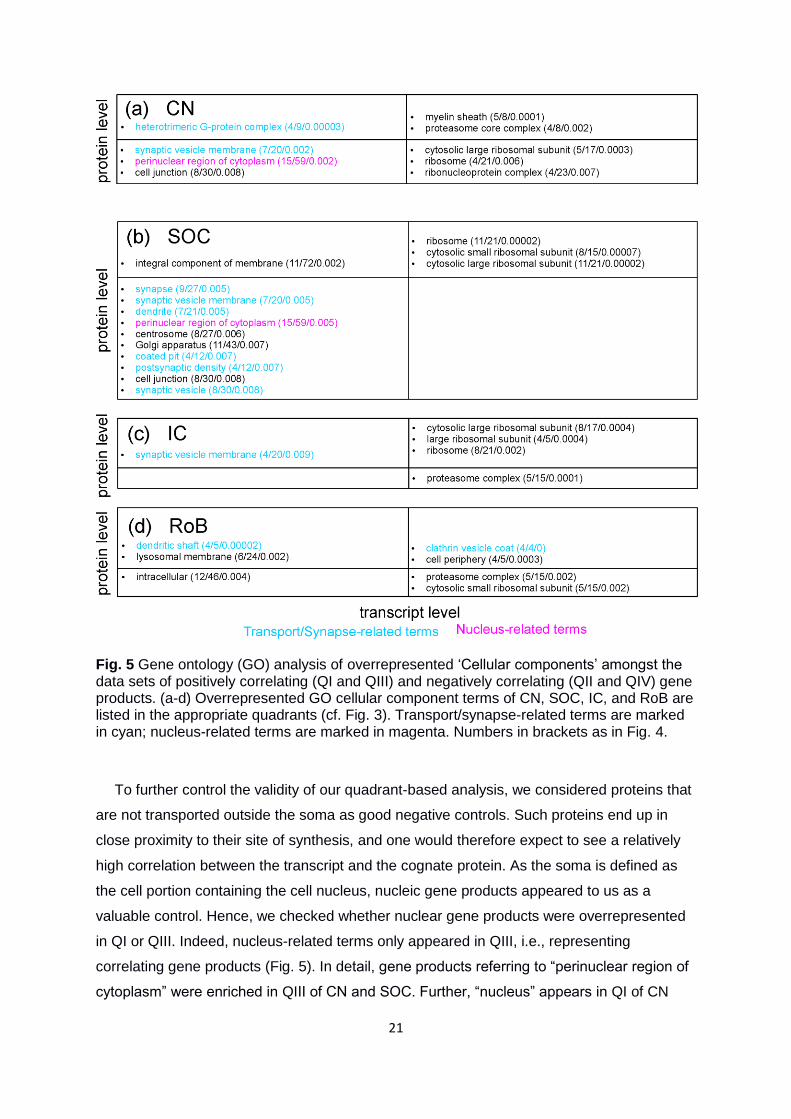
Figure 5 is arranged like Figure 4, but focuses on the ontology “Cellular components”.
Here, fewer GO terms were significantly overrepresented in each quadrant. None of the GO
terms was overrepresented consistently in all of the four ROIs. Nevertheless, gene products
associated with the synapse, “heterotrimeric G-protein complex”, “synaptic vesicle
membrane”, and “dendritic shaft”, were overrepresented in QII of the three ROIs CN, IC, and
RoB, respectively. In addition, transport/synapse-related GO terms appeared also in QIII of
the CN and SOC as well as in QI of the RoB (Fig. 5). It is no contradiction to our hypothesis
that the transport/synapse-related terms appeared not only in QII, but also in QI (high protein
and transcript levels; Fig. 4) and in QIII (low protein and transcript levels; Figs. 4, 5). This is
because not all transport/synapse-related proteins are necessarily locally separate from
cognate transcripts. Instead, the transcript can be transported as well (Wang et al. 2010,
Jung et al. 2012), or the somata of cells in the target ROI encode a high level of the
appropriate transcripts (cf. Introduction and Fig. 1c). This clarifies again that our approach is
not able to address all transfer/synapse-related gene products, but only the region-typical
ones and those for which transport occurs at the protein level.
Interestingly, negatively correlated gene products associated with the synapse /transport-
related GO terms were overrepresented in QII, but not in QIV. In other words, we found high
levels of some synapse/transport-related proteins and low levels of some synapse/transport-
related transcripts, but never the opposite pattern. This is indicative of a short half-life of
transcripts of transport/synapse-related gene-products.
Figure 5 near here
21
Fig. 5 Gene ontology (GO) analysis of overrepresented ‘Cellular components’ amongst the data sets of positively correlating (QI and QIII) and negatively correlating (QII and QIV) gene products. (a-d) Overrepresented GO cellular component terms of CN, SOC, IC, and RoB are listed in the appropriate quadrants (cf. Fig. 3). Transport/synapse-related terms are marked in cyan; nucleus-related terms are marked in magenta. Numbers in brackets as in Fig. 4.
To further control the validity of our quadrant-based analysis, we considered proteins that
are not transported outside the soma as good negative controls. Such proteins end up in
close proximity to their site of synthesis, and one would therefore expect to see a relatively
high correlation between the transcript and the cognate protein. As the soma is defined as
the cell portion containing the cell nucleus, nucleic gene products appeared to us as a
valuable control. Hence, we checked whether nuclear gene products were overrepresented
in QI or QIII. Indeed, nucleus-related terms only appeared in QIII, i.e., representing
correlating gene products (Fig. 5). In detail, gene products referring to “perinuclear region of
cytoplasm” were enriched in QIII of CN and SOC. Further, “nucleus” appears in QI of CN
22
and SOC, but not in the quadrants representing negative correlating (QII and QIV), when
using a significance level of 0.05 instead of 0.01 (not shown). In summary, the negative
control further strengthens our hypothesis.
In conclusion, the GO analysis of the four quadrants supports our hypothesis, as the set
of gene products in QII of all ROIs are to a significant extent characterized by protein
transport-related gene products. In addition to systematically analyzing subcellular
compartments and addressing transport/synapse-related GO terms, it makes sense to
characterize this set of gene products in more detail by checking single gene products. To
do so, we disclosed those gene products that contributed to the overrepresentation of
transport/synapse-related GO terms in Figures 4 and 5. We identified 13 negatively
correlating gene products from QII in one or more ROI that were associated with
transport/synapse-related biological processes (protein transport, vesicle-mediated
transport, G-protein-related processes; Table 3). We further identified 23 negatively
correlating gene products with high protein levels, but low transcript levels, in one or more
ROI which were associated with transport/synapse-related cellular components
(heterotrimeric G-protein complex, synaptic vesicle membrane, and dendritic shaft; Table 4).
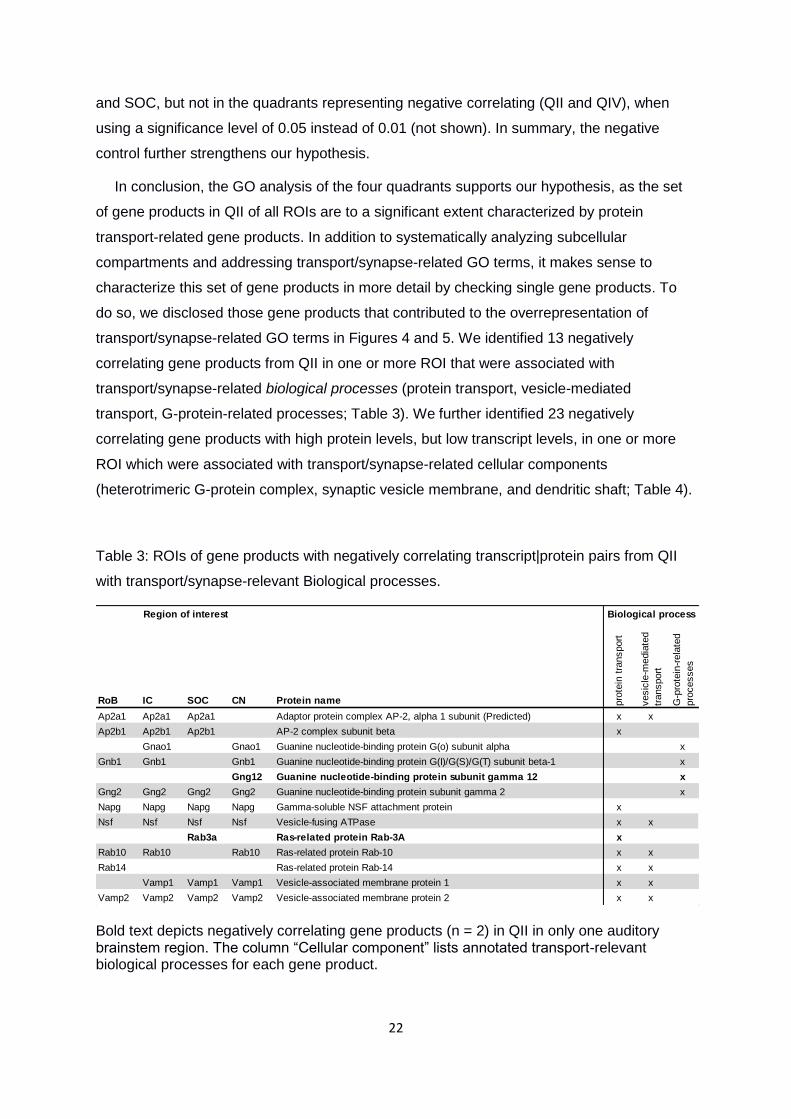
Table 3: ROIs of gene products with negatively correlating transcript|protein pairs from QII
with transport/synapse-relevant Biological processes.
Bold text depicts negatively correlating gene products (n = 2) in QII in only one auditory brainstem region. The column “Cellular component” lists annotated transport-relevant biological processes for each gene product.
RoB IC SOC CN Protein name pro
tein
tra
nsport
vesic
le-m
edia
ted
transport
G-p
rote
in-r
ela
ted
pro
cesses
Ap2a1 Ap2a1 Ap2a1 Adaptor protein complex AP-2, alpha 1 subunit (Predicted) x x
Ap2b1 Ap2b1 Ap2b1 AP-2 complex subunit beta x
Gnao1 Gnao1 Guanine nucleotide-binding protein G(o) subunit alpha x
Gnb1 Gnb1 Gnb1 Guanine nucleotide-binding protein G(I)/G(S)/G(T) subunit beta-1 x
Gng12 Guanine nucleotide-binding protein subunit gamma 12 x
Gng2 Gng2 Gng2 Gng2 Guanine nucleotide-binding protein subunit gamma 2 x
Napg Napg Napg Napg Gamma-soluble NSF attachment protein x
Nsf Nsf Nsf Nsf Vesicle-fusing ATPase x x
Rab3a Ras-related protein Rab-3A x
Rab10 Rab10 Rab10 Ras-related protein Rab-10 x x
Rab14 Ras-related protein Rab-14 x x
Vamp1 Vamp1 Vamp1 Vesicle-associated membrane protein 1 x x
Vamp2 Vamp2 Vamp2 Vamp2 Vesicle-associated membrane protein 2 x x
Region of interest Biological process
23
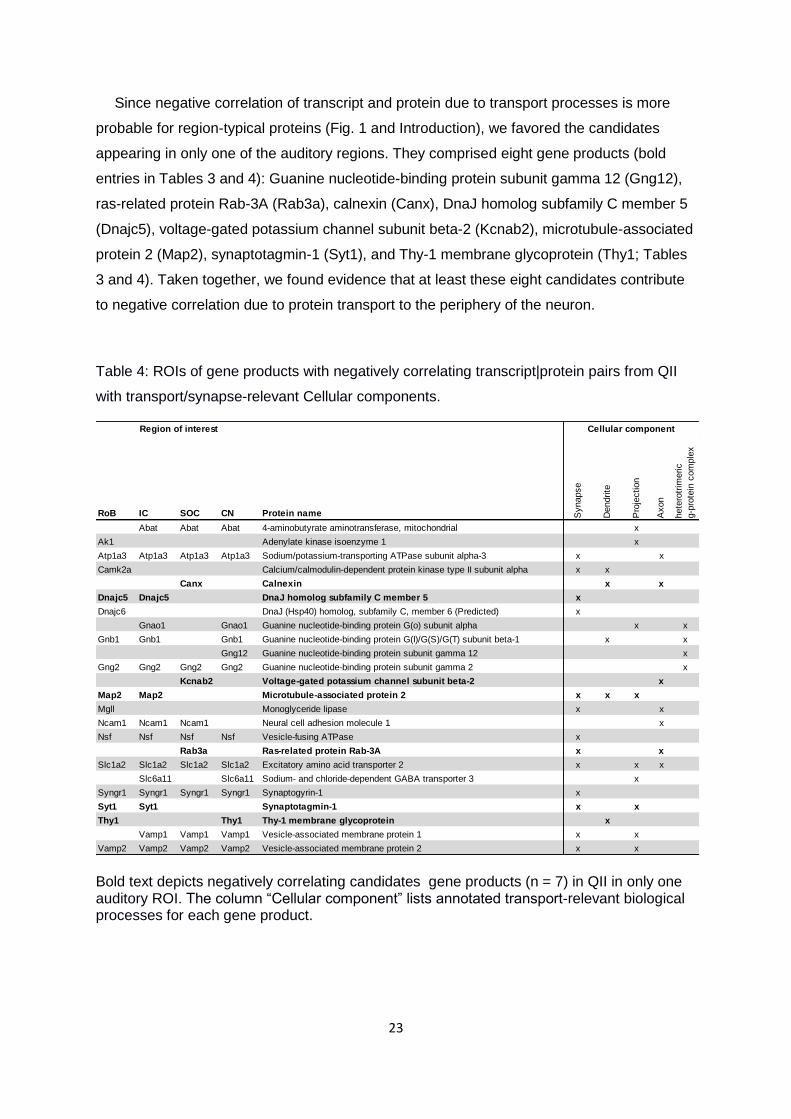
Since negative correlation of transcript and protein due to transport processes is more
probable for region-typical proteins (Fig. 1 and Introduction), we favored the candidates
appearing in only one of the auditory regions. They comprised eight gene products (bold
entries in Tables 3 and 4): Guanine nucleotide-binding protein subunit gamma 12 (Gng12),
ras-related protein Rab-3A (Rab3a), calnexin (Canx), DnaJ homolog subfamily C member 5
(Dnajc5), voltage-gated potassium channel subunit beta-2 (Kcnab2), microtubule-associated
protein 2 (Map2), synaptotagmin-1 (Syt1), and Thy-1 membrane glycoprotein (Thy1; Tables
3 and 4). Taken together, we found evidence that at least these eight candidates contribute
to negative correlation due to protein transport to the periphery of the neuron.
Table 4: ROIs of gene products with negatively correlating transcript|protein pairs from QII
with transport/synapse-relevant Cellular components.
Bold text depicts negatively correlating candidates gene products (n = 7) in QII in only one auditory ROI. The column “Cellular component” lists annotated transport-relevant biological processes for each gene product.
RoB IC SOC CN Protein name Synapse
Dendrite
Pro
jection
Axon
hete
rotr
imeric
g-p
rote
in c
om
ple
x
Abat Abat Abat 4-aminobutyrate aminotransferase, mitochondrial x
Ak1 Adenylate kinase isoenzyme 1 x
Atp1a3 Atp1a3 Atp1a3 Atp1a3 Sodium/potassium-transporting ATPase subunit alpha-3 x x
Camk2a Calcium/calmodulin-dependent protein kinase type II subunit alpha x x
Canx Calnexin x x
Dnajc5 Dnajc5 DnaJ homolog subfamily C member 5 x
Dnajc6 DnaJ (Hsp40) homolog, subfamily C, member 6 (Predicted) x
Gnao1 Gnao1 Guanine nucleotide-binding protein G(o) subunit alpha x x
Gnb1 Gnb1 Gnb1 Guanine nucleotide-binding protein G(I)/G(S)/G(T) subunit beta-1 x x
Gng12 Guanine nucleotide-binding protein subunit gamma 12 x
Gng2 Gng2 Gng2 Gng2 Guanine nucleotide-binding protein subunit gamma 2 x
Kcnab2 Voltage-gated potassium channel subunit beta-2 x
Map2 Map2 Microtubule-associated protein 2 x x x
Mgll Monoglyceride lipase x x
Ncam1 Ncam1 Ncam1 Neural cell adhesion molecule 1 x
Nsf Nsf Nsf Nsf Vesicle-fusing ATPase x
Rab3a Ras-related protein Rab-3A x x
Slc1a2 Slc1a2 Slc1a2 Slc1a2 Excitatory amino acid transporter 2 x x x
Slc6a11 Slc6a11 Sodium- and chloride-dependent GABA transporter 3 x
Syngr1 Syngr1 Syngr1 Syngr1 Synaptogyrin-1 x
Syt1 Syt1 Synaptotagmin-1 x x
Thy1 Thy1 Thy-1 membrane glycoprotein x
Vamp1 Vamp1 Vamp1 Vesicle-associated membrane protein 1 x x
Vamp2 Vamp2 Vamp2 Vamp2 Vesicle-associated membrane protein 2 x x
Region of interest Cellular component
24
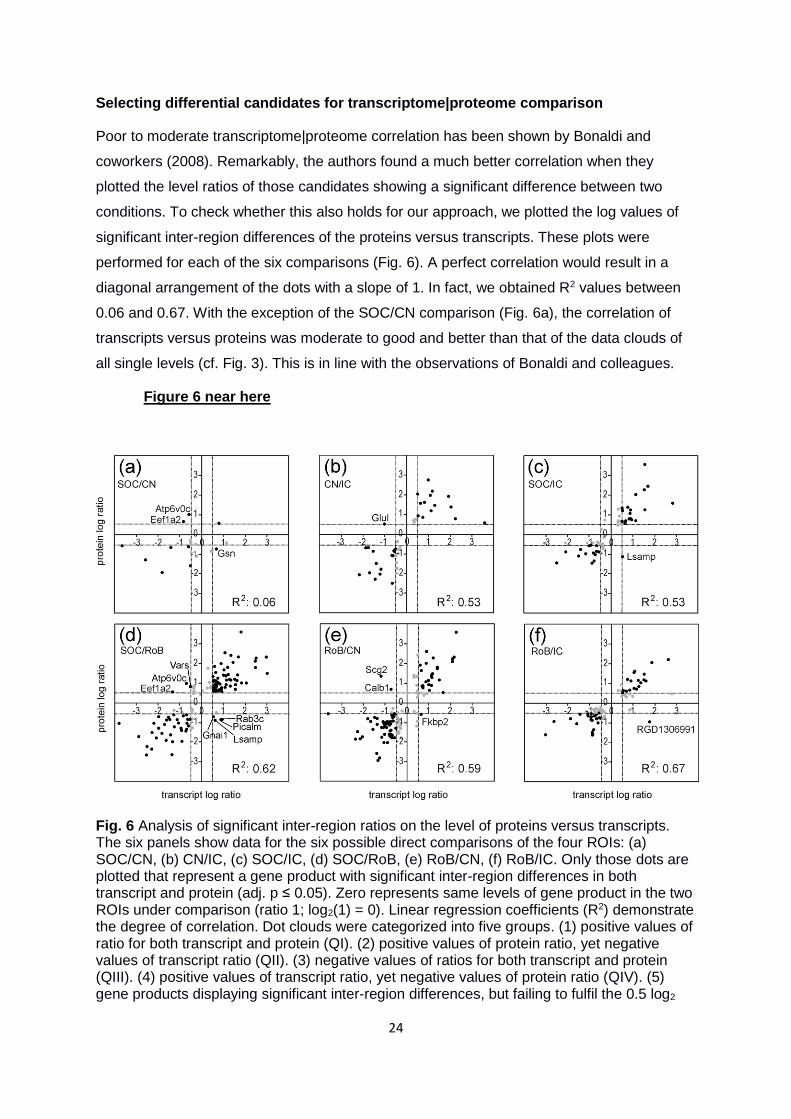
Selecting differential candidates for transcriptome|proteome comparison
Poor to moderate transcriptome|proteome correlation has been shown by Bonaldi and
coworkers (2008). Remarkably, the authors found a much better correlation when they
plotted the level ratios of those candidates showing a significant difference between two
conditions. To check whether this also holds for our approach, we plotted the log values of
significant inter-region differences of the proteins versus transcripts. These plots were
performed for each of the six comparisons (Fig. 6). A perfect correlation would result in a
diagonal arrangement of the dots with a slope of 1. In fact, we obtained R2 values between
0.06 and 0.67. With the exception of the SOC/CN comparison (Fig. 6a), the correlation of
transcripts versus proteins was moderate to good and better than that of the data clouds of
all single levels (cf. Fig. 3). This is in line with the observations of Bonaldi and colleagues.
Figure 6 near here
Fig. 6 Analysis of significant inter-region ratios on the level of proteins versus transcripts. The six panels show data for the six possible direct comparisons of the four ROIs: (a) SOC/CN, (b) CN/IC, (c) SOC/IC, (d) SOC/RoB, (e) RoB/CN, (f) RoB/IC. Only those dots are plotted that represent a gene product with significant inter-region differences in both transcript and protein (adj. p ≤ 0.05). Zero represents same levels of gene product in the two ROIs under comparison (ratio 1; log2(1) = 0). Linear regression coefficients (R2) demonstrate the degree of correlation. Dot clouds were categorized into five groups. (1) positive values of ratio for both transcript and protein (QI). (2) positive values of protein ratio, yet negative values of transcript ratio (QII). (3) negative values of ratios for both transcript and protein (QIII). (4) positive values of transcript ratio, yet negative values of protein ratio (QIV). (5) gene products displaying significant inter-region differences, but failing to fulfil the 0.5 log2
25
criteria (gray dots). Gene names of all negatively correlating transcript|protein pairs are stated (n = 3, 1, 1, 7, 3, and 1 in (a), (b), (c), (d), (e), and (f), respectively).
Despite the better correlation when taking the ratios, there were still several candidates in
QII and QIV, which represent negatively correlating transcript|protein pairs (Fig. 6). They
offer another fundament to specify region-typical proteins that are transported to the synapse
(cf. Fig. 1b). For example, the protein coded by the gene Atp6v0c (V-type proton ATPase 16
kDa proteolipid subunit) was two times more abundant in the SOC than in the CN
(log2(2) = 1 on y axis in Fig. 6a). In contrast, the transcript abundance of this gene was 1.5-
fold lower in the SOC than in the CN (log2(1.5) = 0.58 on x-axis). Thus, Atp6v0c is a
candidate gene for which transcription takes place in neuronal somata of the CN, followed by
anterograde transport of the protein into axon terminals within the SOC, a major target of CN
neurons (Malmierca and Hackett 2010). The presynaptic location of the V-type proton
ATPase and its association with synaptic vesicles (Moriyama et al. 1992, El Far and Seagar
2011), of which the Atp6v0c protein is a component, further supports this scenario.
26
Discussion
In our integrative inter-omics study employing various rat brain regions, we found poor to
moderate correlation at three levels of analysis. 1) According to the PC analysis,
transcriptome and proteome differ in that the transcriptomes enclose highest similarities
between CN and IC, whereas the proteomes enclose highest similarity between CN and
SOC (Fig. 2). 2) Plotting transcript levels versus cognate protein levels revealed R2 values of
0.34 to 0.54, implying poor to moderate transcript|protein correlation (Fig. 3). 3) Better
correlation, although less than expected (Bonaldi et al. 2008), occurred when viewing
significant inter-region ratios only (0.53 to 0.67; except for CN/SOC: 0.06; Fig. 6).
Poor to moderate correlations between transcriptome and proteome have been reported
for several samples and conditions (see Introduction). Waters and colleagues (2006) offer an
overview over different transcriptome|proteome studies. It is obvious that the degree of
correlation strongly depends on the condition. For example, the presence or absence of
high-abundant proteins can strongly influence the correlation result. In detail, an analysis in
yeast revealed good correlation (R2 = 0.87) between transcript and protein when high-
abundant proteins remained in the data set. Excluding them, however, lead to drastically
reduced correlation (R2 = 0.13; (Gygi et al. 1999)). A similar difference, albeit less drastic,
was reported for U937 cells (R2 = 0.74 if high-abundant proteins were included; R2 = 0.24 if
they were excluded; (Verhoeckx et al. 2004)). Further, analyzing mouse lung resulted in no
correlation regarding all data (R2 = 0.03), but in a better correlation for structural gene
products (Cox et al. 2005). It is discussed that poor correlations are caused by small data
sets that are not representative for the global set of gene products and by outdated
techniques. However, recent studies, which used more modern and more precise methods
than those summarized in Waters et al., found no better correlation, arguing against
technical issues as the main source of poor correlation. In detail, recent advances in next-
generation RNA/DNA sequencing and mass spectrometry-based proteomics have provided
an extraordinary chance to examine transcript and protein levels, assessing the relative
importance of different regulation steps (Vogel and Marcotte 2012). For example,
Schwanhäuser and colleagues (2011) quantified absolute copy numbers of proteins and
transcripts per cell by using intensity-based absolute quantification (iBAQ) and mRNA
sequencing, respectively, in a mammalian cell culture. Their R2 values of 0.37 and 0.41 in
two replicate experiments is in the range displayed by the four ROIs of our study. Note,
however, that Li and colleagues (2014) corrected the results of Schwanhäusser et al., which
resulted in R2 values of 0.56 and 0.84, depending on the correction strategy. The
discrepancies demonstrate the disagreement regarding good or poor transcript|protein
correlation, even within the same data set, not to mention different tissues or cell types.
27
Furthermore, Wilhelm and colleagues (2014) applied the same methods as Schwanhäusser
and colleagues and investigated transcript|protein correlation in 12 organs, excluding the
brain. Their R2 values ranged from 0.10 (thyroid gland) to 0.31 (kidney). Nevertheless, the
authors claimed that transcripts accurately predict protein levels when considering gene-
specific translation rates. This claim, however, has been rebutted (Fortelny et al. 2017).
Many studies showing good correlation are based on exponentially growing cells, where
close congruence between transcripts and proteins are biologically meaningful and where
protein stability plays a minor role. In contrast, tissue in steady state – neurons in particular –
depend to a lesser extend on synthesis of new proteins, but balance the protein turnover
only.
Main reasons for poor correlation are regulation of stability and translation of the
transcript. For example, small RNAs can interfere with transcripts, thereby regulating their
stability and translation (Tomari and Zamore 2005). Even single microRNAs (miRNAs) can
cause reduced levels of dozens of transcripts (Lim et al. 2005, Shyu et al. 2008) and have a
widespread impact on translation of hundreds of transcripts into proteins (Baek et al. 2008,
Selbach et al. 2008). Apart from miRNA binding, also other mechanisms such as binding of
small interfering RNAs or RNA-binding proteins can regulate transcript stability (Mata et al.
2005, Tomari and Zamore 2005).
Because of poor transcript|protein correlation, Payne (2015) suggested to think of a “more
nuanced relationship” between transcript and protein, instead of expecting “trivial and
predictable correlation”. Those nuances comprise degradation of transcripts and proteins as
well as regulation of translation. We add another nuance that particularly applies for
neuronal tissue. In detail, we hypothesize that a special property of brain tissue affects the
degree of correlation, especially when addressing different brain regions. According to this
hypothesis, levels of some proteins differ strongly from their cognate transcript level,
because both products are spatially separated due to neuronal polarity (Fig. 1). In more
detail, in neurons, unlike most of other tissues, the destiny sites of some proteins may be far
remote (mm-cm) from the origin sites of transcripts. This can result in a situation where high
transcript levels are not mirrored by high protein levels in the same brain region, but rather in
distal regions via axonal transport to synapses or other peripheral sites. In our study, we
found striking evidence for this hypothesis: First, from the four proteins with the strongest
negative transcript|protein correlation, three (Slc6a11, Syngr1, Tppp) were synaptic and
hence candidates for spatial separation of transcript. The third one (Cds2) provides no hints
for special separation. However, as Cds2 showed the same negative correlation pattern (low
transcript level, high protein level) in all three interconnected auditory regions, another
reason than protein transport and spatial separation may cause negative correlation.
28
Second, a systematic bioinformatics analysis revealed that most of the biological processes
that are overrepresented in the group of candidates with high protein levels but low transcript
levels (QII) were related to vesicle-mediated transport (cf. Fig. 4). Further, cellular
components related to synapses, axons or peripheral cell parts were overrepresented in this
group of candidates (Fig. 5). Thus, these peripheral gene products strongly contribute to the
poor correlation between transcriptome and proteome among our brain ROIs.
Also other articles have addressed the spatial impact on processes impacting
transcript|protein correlation, such as translation and protein degradation. Interestingly,
murine stem cells showed a poor correlation for nuclear transcripts and proteins (Lu et al.
2009). This is not concordant to our findings of nuclear proteins being overrepresented
among the correlating gene-products. However, our results concerned a steady-state
situation while the results of Lu and colleagues were obtained during fate change.
As another potentially special impact onto transcript|protein correlation, Boisvert and
colleagues (2012) quantified proteins and their turnover rates, i.e., the balance between
protein synthesis and protein degradation, in three different cellular compartments, namely
cytoplasm, nucleus, and nucleolus. They detected most of the proteins (>50%) in more than
one compartment. Further, most proteins had similar turnover rates among the
compartments. Nevertheless, proteins commonly showed different levels between the two or
three compartments in their study. Further, protein degradation has been described to
depend on cellular location. In detail, Larance and colleagues (2013) used pulse-SILAC to
identify rapidly depleted proteins, of which some showed different degradation rates in
separate subcellular compartments such as nucleus, cytosol, cytoskeleton, and membrane.
Ori and colleagues (2015) performed subcellular shotgun mass spectrometry, RNA
sequencing, and ribosome profiling to compare liver and brain of 6-month-old and 24-month-
old rats. They found cases in which changes in protein level were unexplainable by changes
in translation level, predominantly in the brain. These interesting results are in line with our
observations and can be explained by changes in protein localization. In detail, the authors
detected seven proteins in the brain for which the intracellular distribution changed
significantly. For example, the serine/threonine-protein kinase BRSK1significantly changed
from the mitochondrial fraction in young rats to the soluble cytosolic fraction in old rats. In the
liver, in contrast, only two proteins displayed a significantly changed subcellular location with
age. None of the proteins detected to change the subcellular location by Ori and colleagues
is present in our data set. This might be because the authors did not address cellular
components that might be relevant for transport into the cell periphery, such as the synapse.
29
Using a similar approach to ours, Carlyle and colleagues (2017) found considerable
evidence for mobile proteins affecting transcript and/or protein abundance in certain brain
regions. For example, they analyzed a set of gene products that differed between brain
regions in their transcript levels, but not in their protein levels. They observed enriched
synaptic proteins in this set, which they interpreted as a consequence of protein transport,
leading to a balanced protein level in the source (soma) and target (synapse) region, but
level differences for the transcript that remained only in the source region. In summary, from
these and our findings it is evident that spatial aspects affect the ratio between transcript and
cognate protein. Liu and colleagues (2016) even hypothesized that correlations between
proteins and their transcript levels break down when addressing even smaller spatial scales.
Limitations of our study
A negative correlation of transcript|protein pairs is not necessarily caused by transport
processes. For example, elongation factor 1-alpha (2Eef1a2) appeared in QII in Figure 6a,d,
demonstrating a higher protein level in the CN than in the SOC and the RoB and an inverse
pattern for the transcript level. However, for an elongation factor, which plays a role in
translation processes that mainly happen in the soma, there is no need for transport. Hence,
unless being a player of “decentralized” translation in neuronal processes (Holt and
Schuman 2013), the negative correlation may be explained by spatially differing protein
degradation, as discussed above.
Statistically, correlation values of 0.34 to 0.54 mean that 34-54% of the variation of
protein level is explained by the variation of transcript level. Over the past five years,
however, analyses and considerations have demonstrated that the real correlation between
transcript level and protein level may be higher (cf. first paragraphs of Discussion). The
strong discrepancy between transcript and protein levels in many studies, such as our study
and those mentioned above, partly come from technical issues. For example, in label-free
mass spectrometry, as used in the present study, quantification errors are not homogeneous
across the different levels of protein abundances. The iBAQ method, used in key papers for
absolute quantification, underestimates protein amounts in the low-abundance range 5-fold
(Ahrne et al. 2013). This is probably so because the average intensity of low-abundant
proteins is biased towards peptides with the highest ionization efficiency (Ahrne et al. 2013).
Hence, statistical efforts have been made to reduce errors for iBAQ-based protein and RNA-
sequencing-based transcript measurements (Li et al. 2014, Jovanovic et al. 2015). Similarly,
we applied normalization methods to address systematic errors based on the Cy dyes used
for microarrays.
30
Further, based on the methods applied, we cannot make quantitative conclusions about
the regulation rates influencing transcript and protein level. In other words, although we
suggest that protein transport is another important factor that influences the transcript|protein
correlation in neuronal tissue, we are aware that we cannot draw conclusions about how
strong this impact is. As Vogel and Marcotte (2012) pointed out, transcript and protein levels
should not be confused with the rate of translation or transcription, respectively. Only the
complex interaction of production and degradation rate, as well as protein transport,
determines the exact transcript|protein correlation. To draw conclusions about relative or
even absolute rates of transcript and protein production, degradation and transport, one has
to await more detailed studies. These should measure the absolute quantities and turnover
rates while in parallel tracking proteins locations among subcellular components (e.g., as in
(Boisvert et al. 2012), but comparing soma with synapse instead of cytoplasm with nucleus).
Our lists of 30 transport/synapse-relevant gene products with negatively correlating
transcript|protein levels may be starting point for future analyses.
Finally, transcript isoforms can be generated by the same gene via alternative splicing,
thus affecting transcript|protein correlation. Future experimental series may avoid this
drawback by using RNA sequencing, which is better in quantifying transcript isoforms than
mRNA microarrays (Lui et al. 2016, Liu et al. 2017).
Conclusion and outlook
To our knowledge, there are only very few studies in which negatively correlating gene
products have been analyzed in detail. In our data set, both the analysis of gene product
levels (Fig. 3) and the significant inter-ROI ratios (Fig. 6) provide a solid basis for further
analysis of negatively correlating transcript|protein pairs. We suggest a third aspect that
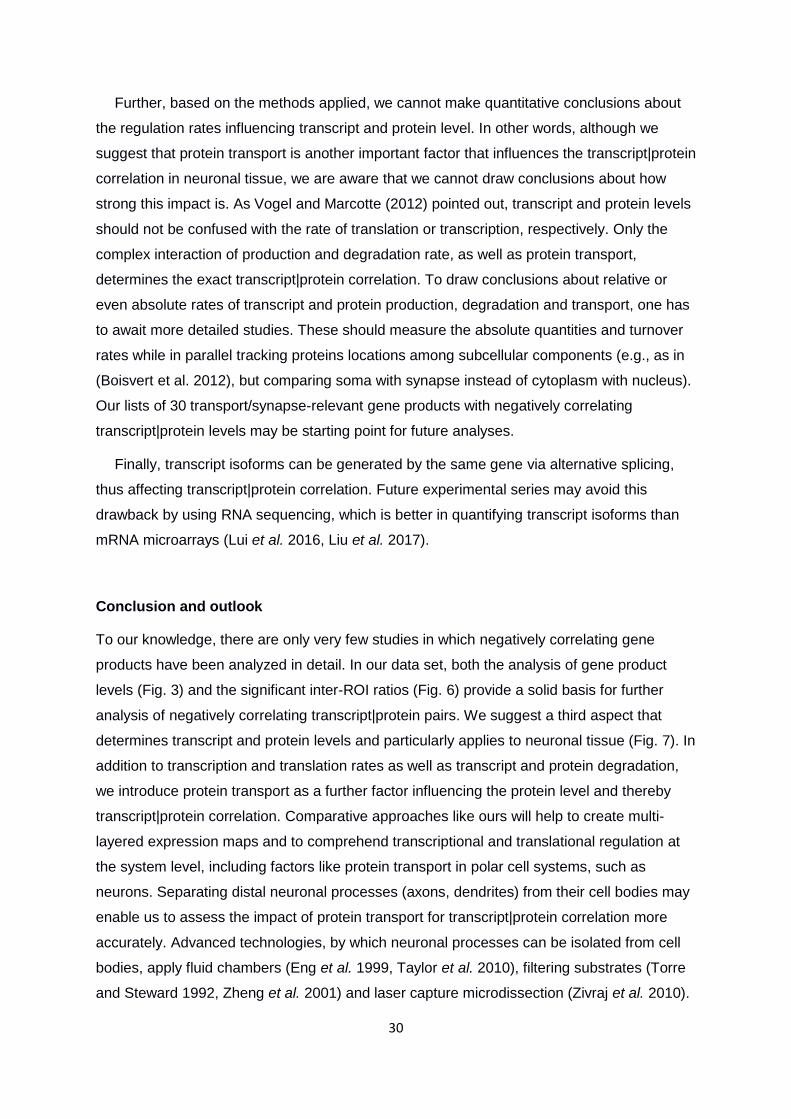
determines transcript and protein levels and particularly applies to neuronal tissue (Fig. 7). In
addition to transcription and translation rates as well as transcript and protein degradation,
we introduce protein transport as a further factor influencing the protein level and thereby
transcript|protein correlation. Comparative approaches like ours will help to create multi-
layered expression maps and to comprehend transcriptional and translational regulation at
the system level, including factors like protein transport in polar cell systems, such as
neurons. Separating distal neuronal processes (axons, dendrites) from their cell bodies may
enable us to assess the impact of protein transport for transcript|protein correlation more
accurately. Advanced technologies, by which neuronal processes can be isolated from cell
bodies, apply fluid chambers (Eng et al. 1999, Taylor et al. 2010), filtering substrates (Torre
and Steward 1992, Zheng et al. 2001) and laser capture microdissection (Zivraj et al. 2010).
31
Fig. 7 Steps regulating regional protein expression in neurons. Production rate (transcription and translation), degradation, and transport all contribute to the levels of transcripts and proteins.
Acknowledgements and conflict of interests
CP Moritz is a research fellow of the German Research Foundation (Deutsche
Forschungsgemeinschaft; reference number MO 3240/1-1). Research has received funding
from the Research Unit BioComp – Complex Data Analysis in Life Sciences and
Biotechnology and from the Center for Mathematical and Computational Modelling (CM2).
We appreciate helpful discussions regarding best study design with Jan Hauth, Patrick Lang
and Christian Salzig as well as editorial support by Ulrike Eschbach.
The authors have no conflicts of interest to declare.
32
Supplementary Figures
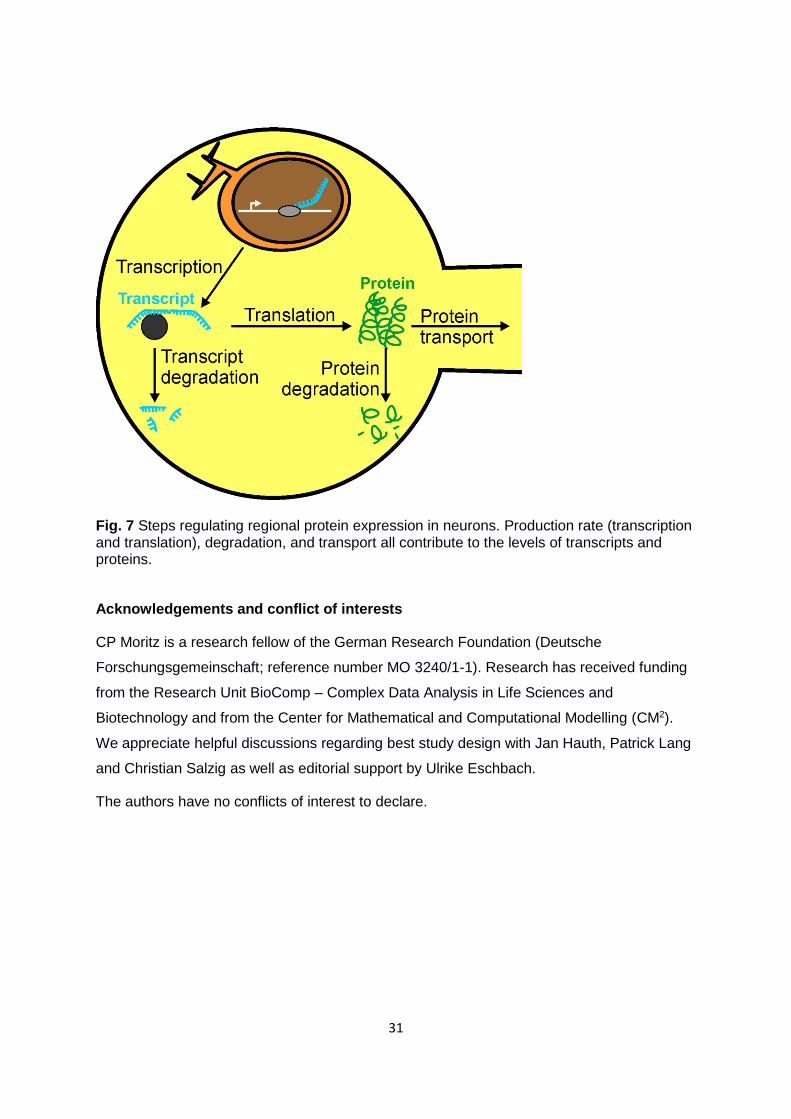
Supplementary Figure 1: Microarray sample setup. Each double arrow indicates a sample combination that was co-hybridized on two arrays with a dye swap. Analysis was based on five replicates of each brain region.
33
Supplementary Figure 2: Density blots and MA plots of the microarray analysis (a-c) Density plot of the logarithmized fluorescence intensity of the microarray probes, demonstrating the signal distribution of the red (R) and green (G) signals for each array (n = 20) before and after different normalization steps. (d,e) MA plots showing the relationship of log signal ratios (M, log2(red/green)) to signal intensities (A, 1/2*log2(red*green)) before and after loess and quantile normalization. Dots with equal signal intensity for the red and green signal (ratio = 1; log2(1) = 0) are plotted on the blue horizontal line.
Supplementary Figures
Supplementary Table 1: Normalized microarray data showing probe name, gene name, and
GenBank Accession number of all probes as well as Cy3 and Cy5 signal intensities for the
four ROI and its replicates.
Supplementary Table 2: Normalized mass spectrometry data showing International Protein
Index (IPI) number and gene name of all identified proteins as well as signal intensities for
the four ROI and its replicates.
34
References
Ahrne E., Molzahn L., Glatter T. and Schmidt A. (2013) Critical assessment of proteome-wide label-free absolute abundance estimation strategies. Proteomics 13, 2567-2578.
Baek D., Villen J., Shin C., Camargo F. D., Gygi S. P. and Bartel D. P. (2008) The impact of microRNAs on protein output. Nature 455, 64-71.
Baumert M., Takei K., Hartinger J., Burger P. M., Fischer von Mollard G., Maycox P. R., De Camilli P. and Jahn R. (1990) P29: a novel tyrosine-phosphorylated membrane protein present in small clear vesicles of neurons and endocrine cells. J. Cell Biol. 110, 1285-1294.
Belizaire R., Komanduri C., Wooten K., Chen M., Thaller C. and Janz R. (2004) Characterization of synaptogyrin 3 as a new synaptic vesicle protein. J. Comp. Neurol. 470, 266-281.
Benjamini Y. and Hochberg Y. (1995) Controlling the false discovery rate: a practical and powerful approach to multiple testing. J. R. Stat. Soc. Series B 57, 289-300.
Boisvert F. M., Ahmad Y., Gierlinski M., Charriere F., Lamont D., Scott M., Barton G. and Lamond A. I. (2012) A quantitative spatial proteomics analysis of proteome turnover in human cells. Mol. Cell Proteomics 11, M111 011429.
Bolstad B. M., Irizarry R. A., Astrand M. and Speed T. P. (2003) A comparison of normalization methods for high density oligonucleotide array data based on variance and bias. Bioinformatics 19, 185-193.
Bonaldi T., Straub T., Cox J., Kumar C., Becker P. B. and Mann M. (2008) Combined use of RNAi and quantitative proteomics to study gene function in Drosophila. Mol. Cell 5, 762-772.
Burkhart J. M., Vaudel M., Gambaryan S., Radau S., Walter U., Martens L., Geiger J., Sickmann A. and Zahedi R. P. (2012) The first comprehensive and quantitative analysis of human platelet protein composition allows the comparative analysis of structural and functional pathways. Blood 120, e73-82.
Carlyle B. C., Kitchen R. R., Kanyo J. E., Voss E. Z., Pletikos M., Sousa A. M. M., Lam T. T., Gerstein M. B., Sestan N. and Nairn A. C. (2017) A multiregional proteomic survey of the postnatal human brain. Nat. Neurosci. 20, 1787-1795.
Cox B., Kislinger T. and Emili A. (2005) Integrating gene and protein expression data: pattern analysis and profile mining. Methods 35, 303-314.
Distler U., Kuharev J., Navarro P., Levin Y., Schild H., Tenzer S. (2014) Drift time-specific collision energies enable deep-coverage data-independent acquisition proteomics. Nat. Methods 11, 167–70.
Dudoit S., Yang Y. H., Callow M. J. and Speed T. P. (2002) Statistical methods for identifying differentially expressed genes in replicated cDNA microarray experiments. Stat. Sin. 12, 111-139. Ehmann H., Hartwich H., Salzig C., Hartmann N., Clément-Ziza M., Ushakov K., Avraham K. B.,
Bininda-Edmonds O. R. P., Hartmann A. K., Lang P., Friauf E. and Nothwang H. G. (2013) Time-dependent gene expression analysis of the developing superior olivary complex. J. Biol. Chem. 288, 25865-25879.
El Far O. and Seagar M. (2011) A role for V-ATPase subunits in synaptic vesicle fusion? J. Neurochem. 117, 603-612.
Eng H., Lund K. and Campenot R. B. (1999) Synthesis of beta-tubulin, actin, and other proteins in axons of sympathetic neurons in compartmented cultures. J. Neurosci. 19, 1-9.
Fortelny N., Overall C. M., Pavlidis P. and Freue G. V. C. (2017) Can we predict protein from mRNA levels? Nature 547, E19-E20.
Frykman S., Teranishi Y., Hur J. Y., Sandebring A., Yamamoto N. G., Ancarcrona M., Nishimura T., Winblad B., Bogdanovic N., Schedin-Weiss S., Kihara T. and Tjernberg L. O. (2012) Identification of two novel synaptic gamma-secretase associated proteins that affect amyloid beta-peptide levels without altering Notch processing. Neurochem. Int. 61, 108-118.
35
Futcher B., Latter G. I., Monardo P., McLaughlin C. S. and Garrels J. I. (1999) A sampling of the yeast proteome. Mol. Cell Biol. 19, 7357-7368.
Geiger J., Burkhart J. M., Gambaryan S., Walter U., Sickmann A. and Zahedi R. P. (2013) Response: platelet transcriptome and proteome - relation rather than correlation. Blood 121, 5257-5258.
Greenbaum D., Colangelo C., Williams K. and Gerstein M. (2003) Comparing protein abundance and mRNA expression levels on a genomic scale. Genome Biol. 4, 117.
Gunawardana Y., Fujiwara S., Takeda A., Woo J., Woelk C. and Niranjan M. (2015) Outlier detection at the transcriptome-proteome interface. Bioinformatics 31, 2530-2536.
Gygi S. P., Rochon Y., Franza B. R. and Aebersold R. (1999) Correlation between protein and mRNA abundance in yeast. Mol. Cell Biol. 19, 1720-1730.
Holt C. E. and Schuman E. M. (2013) The central dogma decentralized: new perspectives on RNA function and local translation in neurons. Neuron 80, 648-657.
Huber W., von Heydebreck A., Sultmann H., Poustka A. and Vingron M. (2002) Variance stabilization applied to microarray data calibration and to the quantification of differential expression. Bioinformatics 18, S96-S104.
Jovanovic M., Rooney M. S., Mertins P. et al. (2015) Immunogenetics. Dynamic profiling of the protein life cycle in response to pathogens. Science 347, 1259038.
Jung H., Yoon B. C. and Holt C. E. (2012) Axonal mRNA localization and local protein synthesis in nervous system assembly, maintenance and repair. Nat. Rev. Neurosci. 13, 308-324.
Kaltwaßer B., Schulenborg T., Beck F., Klotz M., Schafer K. H., Schmitt M., Sickmann A. and Friauf E. (2013) Developmental changes of the protein repertoire in the rat auditory brainstem: a comparative proteomics approach in the superior olivary complex and the inferior colliculus with DIGE and iTRAQ. J. Proteomics 79, 43-59.
Khan Z., Ford M. J., Cusanovich D. A., Mitrano A., Pritchard J. K. and Gilad Y. (2013) Primate transcript and protein expression levels evolve under compensatory selection pressures. Science 342, 1100-1104.
Larance M., Ahmad Y., Kirkwood K. J., Ly T. and Lamond A. I. (2013) Global subcellular characterization of protein degradation using quantitative proteomics. Mol. Cell Proteomics 12, 638-650.
Li J. J., Bickel P. J. and Biggin M. D. (2014) System wide analyses have underestimated protein abundances and the importance of transcription in mammals. PeerJ 2, e270.
Lim L. P., Lau N. C., Garrett-Engele P., Grimson A., Schelter J. M., Castle J., Bartel D. P., Linsley P. S. and Johnson J. M. (2005) Microarray analysis shows that some microRNAs downregulate large numbers of target mRNAs. Nature 433, 769-773.
Liu Y., Beyer A. and Aebersold R. (2016) On the dependency of cellular protein levels on mRNA abundance. Cell 165, 535-550.
Liu Y., Gonzalez-Porta M., Santos S., Brazma A., Marioni J. C., Aebersold R., Venkitaraman A. R. and Wickramasinghe V. O. (2017) Impact of alternative splicing on the human proteome. Cell Rep. 20, 1229-1241.
Lu P., Vogel C., Wang R., Yao X. and Marcotte E. M. (2007) Absolute protein expression profiling estimates the relative contributions of transcriptional and translational regulation. Nat. Biotechnol. 25, 117-124.
Lu R., Markowetz F., Unwin R. D., Leek J. T., Airoldi E. M., MacArthur B. D., Lachmann A., Rozov R., Ma'ayan A., Boyer L. A., Troyanskaya O. G., Whetton A. D. and Lemischka I. R. (2009) Systems-level dynamic analyses of fate change in murine embryonic stem cells. Nature 462, 358-362.
Lui H., Zhang J., Makinson S. R. et al. (2016) Progranulin deficiency promotes circuit-specific synaptic pruning by microglia via complement activation. Cell 165, 921-935.
Maier T., Guell M. and Serrano L. (2009) Correlation of mRNA and protein in complex biological samples. FEBS Lett. 583, 3966-3973.
36
Malmierca M. S. and Hackett T. A. (2010) Structural organization of the ascending auditory pathway. In: The Oxford Handbook of Auditory Science: The Auditory Brain, (A. Rees and A. R. Palmer eds.), Vol. 2, pp. 9-42. Oxford University Press, Oxford
Marguerat S., Schmidt A., Codlin S., Chen W., Aebersold R. and Bähler J. (2012) Quantitative analysis of fission yeast transcriptomes and proteomes in proliferating and quiescent cells. Cell 151, 671-683.
Mata J., Marguerat S. and Bähler J. (2005) Post-transcriptional control of gene expression: a genome-wide perspective. Trends Biochem. Sci. 30, 506-514.
Melone M., Ciappelloni S. and Conti F. (2015) A quantitative analysis of cellular and synaptic localization of GAT-1 and GAT-3 in rat neocortex. Brain Struct. Funct. 220, 885-897.
Moritz C. P., Eckstein E., Tenzer S. and Friauf E. (2015) Neuroproteomics in the auditory brainstem: candidate proteins for ultrafast and precise information processing. Mol. Cell Neurosci. 64, 9-23.
Moriyama Y., Maeda M. and Futai M. (1992) The role of V-ATPase in neuronal and endocrine systems. J. Exp. Biol. 172, 171-178.
Nie L., Wu G., Culley D. E., Scholten J. C. and Zhang W. (2007) Integrative analysis of transcriptomic and proteomic data: challenges, solutionsa and applications. Critic Rev Biotechnol 27, 63-75.
Ori A., Toyama B. H., Harris M. S., Bock T., Iskar M., Bork P., Ingolia N. T., Hetzer M. W. and Beck M. (2015) Integrated transcriptome and proteome analyses reveal organ-specific proteome deterioration in old rats. Cell Syst 1, 224-237.
Payne S. H. (2015) The utility of protein and mRNA correlation. Trends Biochem. Sci. 40, 1-3. RDevelopmentCoreTeam (2011) R: A language and environment for statistical computing. R
Foundation for Statistical Computiong Vienna. Rivals I., Personnaz L., Taing L. and Potier M. C. (2007) Enrichment or depletion of a GO category
within a class of genes: which test? Bioinformatics 23, 401-407. Schofield B. R. (2010) Structural organization of the descending auditory pathway. In: The Oxford
Handbook of Auditory Science: The Auditory Brain, (A. Rees and A. R. Palmer eds.), Vol. 2, pp. 43-64. Oxford University Pres, Oxford.
Schwanhäusser B., Busse D., Li N., Dittmar G., Schuchhardt J., Wolf J., Chen W. and Selbach M. (2011) Global quantification of mammalian gene expression control. Nature 473, 337-342.
Selbach M., Schwanhäusser B., Thierfelder N., Fang Z., Khanin R. and Rajewsky N. (2008) Widespread changes in protein synthesis induced by microRNAs. Nature 455, 58-63.
Shyu A. B., Wilkinson M. F. and van Hoof A. (2008) Messenger RNA regulation: to translate or to degrade. EMBO J. 27, 471-481.
Takahashi M., Tomizawa K., Fujita S. C., Sato K., Uchida T. and Imahori K. (1993) A brain-specific protein p25 is localized and associated with oligodendrocytes, neuropil, and fiber-like structures of the CA3 hippocampal region in the rat brain. J. Neurochem. 60, 228-235.
Taylor A. M., Dieterich D. C., Ito H. T., Kim S. A. and Schuman E. M. (2010) Microfluidic local perfusion chambers for the visualization and manipulation of synapses. Neuron 66, 57-68.
Tian Q., Stepaniants S. B., Mao M. et al. (2004) Integrated genomic and proteomic analyses of gene expression in mammalian cells. Mol. Cell Proteomics 3.10, 960-969.
Tomari Y. and Zamore P. D. (2005) Perspective: machines for RNAi. Genes Dev. 19, 517-529. Torre E. R. and Steward O. (1992) Demonstration of local protein-synthesis within dendrites using a
new cell-culture system that permits the isolation of living axons and dendrites from their cell-bodies. J. Neurosci. 12, 762-772.
Verhoeckx K. C., Bijlsma S., de Groene E. M., Witkamp R. F., van der Greef J. and Rodenburg R. J. (2004) A combination of proteomics, principal component analysis and transcriptomics is a powerful tool for the identification of biomarkers for macrophage maturation in the U937 cell line. Proteomics 4, 1014-1028.
Vogel C. and Marcotte E. M. (2012) Insights into the regulation of protein abundance from proteomic and transcriptomic analyses. Nat. Rev. Genet. 13, 227-232.
37
Wang D. O., Martin K. C. and Zukin R. S. (2010) Spatially restricting gene expression by local translation at synapses. Trends Neurosci. 33, 173-182.
Waters K. M., Pounds J. G. and Thrall B. D. (2006) Data merging for integrated microarray and proteomic analysis. Brief Funct. Genomic Proteomic 5, 261-272.
Wilhelm M., Schlegl J., Hahne H. et al. (2014) Mass-spectrometry-based draft of the human proteome. Nature 509, 582-587.
Yang Y. H., Dudoit S., Luu P., Lin D. M., Peng V., J. N. and Speed T. P. (2002) Normalization for cDNA microarray data: a robust composite method addressing single and multiple slide systematic variation. Nucleic Acids Research 30:e15.
Zheng J. Q., Kelly T. K., Chang B., Ryazantsev S., Rajasekaran A. K., Martin K. C. and Twiss J. L. (2001) A functional role for intra-axonal protein synthesis during axonal regeneration from adult sensory neurons. J. Neurosci. 21, 9291-9303.
Zivraj K. H., Tung Y. C., Piper M., Gumy L., Fawcett J. W., Yeo G. S. and Holt C. E. (2010) Subcellular profiling reveals distinct and developmentally regulated repertoire of growth cone mRNAs. J. Neurosci. 30, 15464-15478.