Embed Size (px)
Citation preview

American Journal of Medical Genetics Part B (Neuropsychiatric Genetics) 141B:844–853 (2006)
Pooled Association Genome Scanning for AlcoholDependence Using 104,268 SNPs: Validation and Useto Identify Alcoholism Vulnerability Loci in UnrelatedIndividuals From the Collaborative Study on theGenetics of AlcoholismCatherine Johnson,1 Tomas Drgon,1 Qing-Rong Liu,1 Donna Walther,1 Howard Edenberg,2
John Rice,3 Tatiana Foroud,4 and George R. Uhl1*1Molecular Neurobiology Branch, NIDA-IRP, NIH, Baltimore, Maryland2Department of Biochemistry and Molecular Biology, Indiana University, Indianapolis, Indiana3Department of Psychiatry, Washington University School of Medicine, St. Louis, Missouri4Department of Medicine, Indiana University, Indianapolis, Indiana
Association genome scanning can identify mar-kers for the allelic variants that contribute tovulnerability to complex disorders, includingalcohol dependence. To improve the power andfeasibility of this approach, we report validationof ‘‘100k’’ microarray-based allelic frequencyassessments in pooled DNA samples. We then usethis approach with unrelated alcohol-dependentversus control individuals sampled from pedi-grees collected by the Collaborative Study on theGenetics of Alcoholism (COGA). Allele frequencydifferences between alcohol-dependent and con-trol individuals are assessed in quadruplicate at104,268 autosomal SNPs in pooled samples. Onehundred eighty-eight SNPs provide (1) the largestallele frequency differences between dependentversus control individuals; (2) t values�3 forthese differences; and (3) clustering, so that51 relatively small chromosomal regions containat least three SNPs that satisfy criteria 1 and 2above (Monte Carlo P¼0.00034). These positiveSNP clusters nominate interesting genes whoseproducts are implicated in cellular signaling,gene regulation, development, ‘‘cell adhesion,’’and Mendelian disorders. The results convergewith linkage and association results for alcoholand other addictive phenotypes. The data supportpolygenic contributions to vulnerability to alco-hol dependence. These SNPs provide new tools toaid the understanding, prevention, and treatmentof alcohol abuse and dependence.� 2006 Wiley-Liss, Inc.
KEY WORDS: microarray; complex genetics;substance dependence; addiction
Please cite this article as follows: Johnson C, Drgon T,Liu Q-R, Walther D, Edenberg H, Rice J, Foroud T, UhlGR. 2006. Pooled Association Genome Scanning forAlcohol Dependence Using 104,268 SNPs: Validationand Use to Identify Alcoholism Vulnerability Loci inUnrelated Individuals From the Collaborative Study onthe Genetics of Alcoholism. Am J Med Genet Part B141B:844–853.
INTRODUCTION
Substance abuse vulnerabilities are complex traits withstrong genetic influences documented by family and twinstudies [Kaprio et al., 1982; Cadoret et al., 1986, 1995; Groveet al., 1990; Goldberg et al., 1993; Gynther et al., 1995; Uhl et al.,1995, 1997; Tsuang et al., 1996; Woodward et al., 1996; Kendlerand Prescott, 1998; Merikangas et al., 1998; Tsuang et al., 1998;Kendler et al., 1999; Maes et al., 1999; Uhl, 1999; Karkowskiet al., 2000]. Much of the genetic vulnerability to abuse ofdifferent legal and illegal addictive substances is shared; manyabusers use multiple addictive substances [Kendler andPrescott, 1998; Tsuang et al., 1998, 1999; Kendler et al., 1999;Karkowski et al., 2000]. Identifying the allelic variants thatcontribute to vulnerability to alcohol dependence and compar-ing them to the variants that predispose to other addictions canimprove understanding of human addictions and assist effortsto match vulnerable individuals with the prevention andtreatment strategies most likely to work for them.
Association genome scanning can help determine whichchromosomal regions and genes contain allelic variants thatpredispose to dependence on alcohol and other substances.This approach does not require family member participation,gains power as genomic marker densities increase [Risch andMerikangas, 1996; Cervino and Hill, 2000; Schork et al., 2000;Sham et al., 2000], identifies smaller chromosomal regionsthan linkage-based approaches, fosters pooling strategies thatpreserve confidentiality and reduce costs [Barcellos et al.,1997; Hacia et al., 1999; Germer et al., 2000; Uhl et al., 2001]and provides ample genomic controls that can minimize thechances of unintended ethnic mismatches between disease andcontrol samples. We have used these approaches to assessallelic frequencies at 1,494 and then 11,522 SNPs in unrelatedcontrol versus polysubstance abusing individuals who reportdependence on at least one illegal substance [Uhl et al., 2001;Liu et al., 2005]. SNPs that displayed nominally ‘‘reproducibly-positive’’ allele frequency differences between abuser andcontrols in both European- and African-American samples[Uhl et al., 2001] cluster closer to each other and to positive
Catherine Johnson, Tomas Drgon, and Qing-Rong Liu con-tributed equally to this work.
Grant sponsor: Intramural Research Program of the NIH;Grant sponsor: NIDA DHSS; Grant sponsor: NIDA-IRP.
*Correspondence to: George R. Uhl, Molecular Neurobiology,Suite 3510, 333 Cassell Drive, Baltimore, MD 21224.E-mail: [email protected]
Received 2 December 2005; Accepted 3 April 2006
DOI 10.1002/ajmg.b.30346
� 2006 Wiley-Liss, Inc.

markers from linkage studies of addictions than anticipated bychance [Uhl et al., 2002; Uhl, 2004]. However, this density ofSNP markers provides information about possible associationswith addiction for only a modest number of the blocks ofrestricted haplotype diversity found in these subjects’ gen-omes. Association genome scanning has not yet been employedto study alcohol dependence, to our knowledge.
Unrelated individuals sampled from pedigrees collected bythe Collaborative Study on the Genetics of Alcoholism providean interesting sample for this approach for several reasons.Dependence on alcohol and other substances has been carefullycharacterized in these individuals using validated instru-ments. Unrelated control individuals free from substanceabuse or dependence diagnoses, largely individuals whomarry into these pedigrees, are available. Linkage work withthese pedigrees has identified a number of interesting loci[Reich et al., 1998; Bierut et al., 2002]. In addition, GeneticsAnalysis Workshop data provides individual genotypes forover 14,000 SNPs for a subset of COGA individuals (http://www.gaworkshop.org).
‘‘100k’’ SNP microarrays (CenturionTM, Affymetrix) use size-selected PCR products of genomic restriction fragments thathave been ligated to universal linker sequences and amplifiedusing single PCR primer pairs. Early access versions of thesearrays allow assessment of 104,268 SNPs that can be localizedto autosomes and display minor allele frequencies �2%. Thesearrays thus allow studies of many more SNP markers for moreunrelated individuals than previously available. The dataalso overlaps with genotypes obtained in some of these sameindividuals as part of the Genetics Analysis Workshop,providing a rich set of comparisons of individual versus pooledgenotypes that help validate use of pooling with these samples.
We thus now report validation and use of pooled associationgenome scanning using 100k arrays hybridized with size-selected amplicons from end-ligated Xba I and Hind IIIgenomic DNA restriction fragments of pooled genomic DNAs.DNAs come from unrelated COGA individuals who report (1)dependence on alcohol versus (2) control individuals free fromany alcohol dependence, largely those who have married intothese pedigrees. We use this approach to generate more than29 million person/genotype equivalents, determined in quad-ruplicate. We discuss the convergence that these resultsprovide with association and linkage studies for alcohol andother addictive phenotypes, the genetic architecture for alcoholdependence that the results support, the classes of candidategenes that they nominate for roles in human alcohol dependenceand the implications of these findings for pooled associationgenome scanning approaches to complex genetic disorders.
MATERIALS AND METHODS
Research Volunteers
We searched COGA pedigrees to identify unrelated indivi-duals who displayed phenotypes 2–3 (‘‘pure unaffected’’ or‘‘unaffected with some symptoms’’) or 4 (‘‘affected,’’ e.g., alcoholdependent). We identified 120 unrelated alcohol-dependentindividuals and 160 unrelated unaffected controls who self-reported European-American ethnicities. Information wasavailable for Genetics Analysis Workshop (GAW) genotypesfor 120 of these individuals. DNAs from these 120 individualswere placed into four of the control pools and two of the pools ofalcohol-dependent individuals. DNAs from other COGAsubjects who were not included in GAW formed eightadditional pools.
Genomic DNA
Genomic DNA was prepared from lymphoblastoid cell lines(Corriel Institute), requantitated by spectrophotometry, pico-green and Heochst dye fluorescence and diluted to 10 ng/ml.
Validation studies compared: (1a) allelic determinations fromindividual CEPH DNAs versus (1b) results from pools (n¼ 2) ofthe same DNAs; and (2a) allelic determinations from indivi-dual COGA DNAs versus (2b) results from pools (n¼ 20) of thesame DNAs. Other validation studies examined pool-to-poolvariation and test-retest variation for each pool tested on fourdifferent sets of microarrays.
Allelic Frequencies in PolysubstanceAbusers and Controls
Allelic frequencies in polysubstance abusers and controlswere compared using pools made by carefully combining equalamounts of DNA from 20 individuals of the same phenotypes.We used hybridization probes prepared from genomic DNA asdescribed (Affymetrix Genechip Mapping Assay Manual) withprecautions to avoid contamination. Fifty nanograms of pooledgenomic DNA was digested by Xba I or by Hind III, ligated toappropriate adaptors, amplified by PCR using 3 min 958C hotstart, 35 cycles of 20 sec 958C/15 sec 598C/15 sec 728C, and afinal 7 min 728C extension. PCR products were purified(MinEluteTM 96 UF kits, Qiagen, Valencia, CA), digested for30 min with 0.04 U/ml DNase I to produce 30–200 bp fragments,end-labeled using terminal deoxynucleotidyl transferase andbiotinylated dideoxynucleotides and hybridized to 100k arrays(Centurion, Affymetrix, Santa Clara, CA) which were stainedand washed as described (Affymetrix Genechip Mapping AssayManual) using immunopure strepavidin (Pierce, Milwaukee,WI), biotinylated antistreptavidin antibody (Vector Labs,Burlingame, CA), and R-phycoerythrin strepavidin (MolecularProbes, Eugene, OR). Arrays were scanned and fluorescenceintensities quantitated using an Affymetrix array scanner asdescribed [Uhl et al., 2001].
Chromosomal positions for each SNP were sought usingNCBI and NETAFFYX (Affymetrix) data. Allele frequenciesfor each SNP in each DNA pool were assessed based onhybridization intensity signals from four arrays, allowingassessment of hybridization to the 20 ‘‘perfect match’’ cells oneach array that are complementary to the PCR products fromalleles ‘‘A’’ and ‘‘B’’ for each diallelic SNP. Each array wasanalyzed as follows: (1) ‘‘Background’’ values, the averagefluorescence intensity from the 5% of cells with the lowestvalues, were subtracted from the fluorescence intensity ofevery cell; (2) background-subtracted values were normalizedby division by the average value obtained from the 5% of cellswith the highest values; (3) normalized hybridization inten-sities from the 20 array cells that corresponded to the perfectmatch ‘‘A’’ and ‘‘B’’ cells for each SNP were averaged; (4) ‘‘A/Bratios’’ were determined by dividing average normalized Avalues by average normalized B values; (5) arctangenttransformations were applied to each ratio to aid combinationof data from arrays hybridized and scanned on different days;(6) average arctan values from the four replicates of eachexperiment were determined; (7) mean and standard devia-tions of average arctan values for each diagnostic group werecalculated; (8) SNPs that displayed any of three criteriawere eliminated from further analyses: (i) SNPs with minorallele frequencies <0.02, determined using Affymetrix datafrom analyses of European-American chromosomes; (ii) SNPson sex chromosomes; and (iii) SNPs whose chromosomalpositions could not be adequately determined; (9) for theremaining 104,268 SNPs, mean arctan A/B ratios for abuserswere divided by mean arctan A/B ratios for controls for the restof the SNPs to form abuser/control ratios; (10) A ‘‘t’’ statistic forthe differences between abusers and controls was generatedusing the formula:
t ¼ Xabuser � Xcontrolffiffiffiffiffiffiffiffiffiffiffiffiffiffiffiffiffiffiffiffiffiffiffiffiffiffiffiffiffiffiffiffiffiffiffiffiffiffiffiffiffiffiffiffiffiffiffiffiffiffiffiffiffiffiffiffiffiðnabuser�1Þs2
abuserþðncontrol�1Þs2
control
nabuserþncontrol�2
q�
ffiffiffiffiffiffiffiffiffiffiffiffiffiffiffiffiffiffiffiffiffiffiffiffiffiffi1
nabuserþ 1
ncontrol
q
Association Genome Scanning for Alcohol Dependence 845

where Xabuser and Xcontrol are means of ‘‘arctan A/B’’ values forpools of the same diagnostic group, nabuser and ncontrol arenumber of pools in corresponding diagnostic group ands2 is thevariance of the mean of arctan A/B values for pools of the samediagnostic group.
Although there is no universally accepted method foranalyzing association genome scanning data, we used apreplanned analysis (for favorable mention of similarapproaches see [Bansal, 2001]). We identified SNPs withabuser/control ratios in the top or bottom 2.5% of all abuserversus control comparisons that also displayed t statistics �3for the abuser versus control differences. We then soughtevidence for clustering of these SNPs by focusing on chromo-somal regions in which at least three of these outlier SNPs laywithin 1 Mb of each other; we note that this somewhatarbitrary distance may or may not reflect the entire extent oflong range linkage disequilibrium, which varies from chromo-somal region to chromosomal region. We term these clustered,nominally positive SNPs ‘‘clustered positive SNPs’’, and focusour analyses on regions in which they lie (Table I).
To seek convergence between current and other associationdata, we compared the locations of the current clusteredpositive SNPs with SNPs that met criteria for reproduciblypositive association in analyses of (1) European-American andAfrican-American NIDA samples [Uhl et al., 2001], Liu et al.,2005; Liu, Uhl et al., in preparation] and (2) Japaneseunrelated methamphetamine dependent and control indivi-duals sampled from the Japanese Genetics Initiative on DrugAbuse (JGIDA), [Drgon et al., submitted].
We assessed the statistical power of our analyses. We used(1) the observed control or abuser pool to pool, standarddeviations from the current datasets, (2) the mean abuser/control differences for the SNPs that provided the largestabuser/control differences from the current datasets, (3)a¼ 0.05, (4) sample sizes from the current datasets, (5)abuser/control ratios from the current dataset and the programPS v2.1.31 [Dupont and Plummer, 1990].
Observed results were compared to those expected by chanceusing 100,000 Monte Carlo simulation trials that sampled froma Microsoft SQL server database that contained the resultsfrom the current study: 14 pools x 4 arrays/pool x 20 perfectmatch cells/array/SNP x 104,268 SNPs¼ 116,780,160 cells(1120 cells/SNP) (see also Uhl et al. [2001]). For each of 100,000simulation trials, a randomly selected set of SNPs was chosenand the same procedure that had been followed for the actualdata was run. The number of trials for which the results fromthe randomly selected set of SNPs matched or exceeded theresults actually observed from the SNPs identified in thecurrent study was tabulated. Empirical P-values were calcu-lated by dividing the number of trials for which the observedresults were matched or exceeded by the total number of MonteCarlo simulation trials performed. Since this method examinesthe properties of the SNPs in the current dataset, it should berelatively robust in the face of a number of features that includethe uneven distribution of Affymetrix SNP markers acrossthe genome.
To provide insights into some of the genes that we nominatefor further study since they might harbor variants thatcontribute to individual differences in addiction vulnerability,we sought an identifiable candidate gene(s) for each cluster ofpositive SNPs. We selected candidate gene nominees whenmultiple clustered-positive SNPs lay (1) within the gene or (2)in 30 or 50 flanking sequences that were contained on a block ofhigh-restricted haplotype diversity along with exon sequencesfrom that gene. We defined the blocks of high-restrictedhaplotype diversity using Haploviewer and data from CEPHindividuals. Clusters that did not identify genes that meetthese criteria are annotated as ‘‘intergene’’ in Table I. To assessthe nominal false discovery rates for these genes, we obtained
the joint false discovery rates for the clustered positive SNPsbased on their individual q values, derived from the 104,268t values and QVALUE software [Storey, 2002; Storey andTibshirani, 2003]. To provide one of several possible controlsfor the possibility that observed abuser-control differencesmight reflect occult stratification and correspondingly differ-ent allelic frequencies at the SNPs that display these abuser/control differences, we note the SNPs for which European-American versus African-American ethnicity difference scoresfrom MNB/NIDA control individuals [Liu et al., submitted] liein the outlying 2.5% of all such differences (Table I).
RESULTS
There were 122,828 SNPs assigned to chromosomes 1–22that were assessed using these arrays. Of these 104,268 SNPsdisplayed minor allele frequencies of >2% in European-American samples (Netaffyx), could be assigned reasonablyaccurate chromosomal locations and were thus used forsubsequent analyses.
Pooled genotyping using 100k arrays displays features thatsupport the validity of our results. Regression analysesexamined the relationships between (a) ‘‘observed alleleratios’’, background-subtracted, normalized, arctangent trans-formed hybridization intensity ratio values obtained from sixpools of COGA DNAs and (b) ‘‘expected allele ratios’’ thefraction of A and B alleles obtained from individual genotypesobtained for 7393 SNPs from these same individuals inwork performed for the Genetics Analysis Workshop usingAffymetrix ‘‘10k’’ arrays. Pearson correlation coefficients were0.91–0.92 for each of these pools (P< 0.001 for each). Therewere 31 ‘‘quality control’’ SNPs that were assessed using bothXbaI and HindIII arrays. Correlations between the intensityratios for these SNPs yielded a Pearson correlation coefficientof 0.94.
Abuser/control hybridization ratios for the 104,268 SNPsexamined here fell into nearly Gaussian distributions withmean values close to one (Fig. 1). There was modest variabilityof these assessments. Mean arctan A/B allele hybridizationratios for all SNPs assessed here �standard errors of the mean(SEM) for pool-to-pool differences were 0.79� 0.028 forabusers and 0.79� 0.024 for controls. SEMs for the fourreplicate arrays that assessed each sample were 0.036 and0.034 for abusers and controls, respectively.
For analyses, we selected (1) the 5,216 candidate positivemarkers that represented the 2.5% of SNPs with greatest andthe 2.5% of SNPs with the smallest abuser/control ratios and(2) the 1474 SNPs for which abuser/control differences yielded tvalues �3. Six hundred sixty-seven SNPs satisfied both ofthese criteria; we note that these two criteria are neithertotally dependent nor totally independent of each other, and weterm the SNPs that satisfy both criteria ‘‘candidate positiveSNPs’’. Chance findings of 667 SNPs that satisfy both criteriaare rare. We performed 100,000 Monte Carlo simulations, eachof which a sampled a random set of 5,216 SNPs. None of thesesimulation trials identified as many as 667 randomly selectedSNPs that shared the properties (abuser/control differencesand t values for these abuser control differences) found in thetrue results of these experiments, yielding Monte CarloP< 0.00001.
These candidate positive SNPs clustered together in waysthat would also not be expected by chance, although suchclustering would be expected if they identified loci that containallelic variants that distinguished alcohol-dependent subjectsfrom control subjects. Three hundred sixty-two of these667 candidate positive SNPs lay in 138 clusters in which theywere positioned within 1 Mb of at least one other candidatepositive SNP (P¼ 0.03715). One hundred eighty-eight of thesecandidate-positive SNPs lay in 51 clusters in which at least
846 Johnson et al.
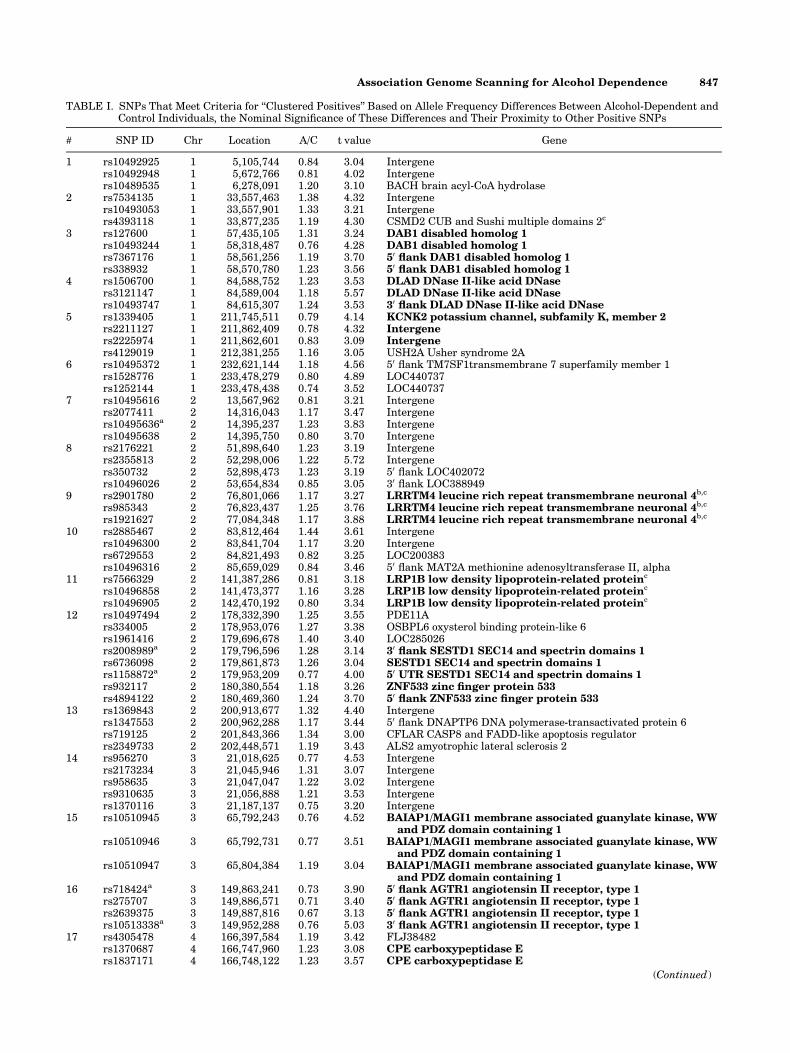
TABLE I. SNPs That Meet Criteria for ‘‘Clustered Positives’’ Based on Allele Frequency Differences Between Alcohol-Dependent andControl Individuals, the Nominal Significance of These Differences and Their Proximity to Other Positive SNPs
# SNP ID Chr Location A/C t value Gene
1 rs10492925 1 5,105,744 0.84 3.04 Intergeners10492948 1 5,672,766 0.81 4.02 Intergeners10489535 1 6,278,091 1.20 3.10 BACH brain acyl-CoA hydrolase
2 rs7534135 1 33,557,463 1.38 4.32 Intergeners10493053 1 33,557,901 1.33 3.21 Intergeners4393118 1 33,877,235 1.19 4.30 CSMD2 CUB and Sushi multiple domains 2c
3 rs127600 1 57,435,105 1.31 3.24 DAB1 disabled homolog 1rs10493244 1 58,318,487 0.76 4.28 DAB1 disabled homolog 1rs7367176 1 58,561,256 1.19 3.70 50 flank DAB1 disabled homolog 1rs338932 1 58,570,780 1.23 3.56 50 flank DAB1 disabled homolog 1
4 rs1506700 1 84,588,752 1.23 3.53 DLAD DNase II-like acid DNasers3121147 1 84,589,004 1.18 5.57 DLAD DNase II-like acid DNasers10493747 1 84,615,307 1.24 3.53 30 flank DLAD DNase II-like acid DNase
5 rs1339405 1 211,745,511 0.79 4.14 KCNK2 potassium channel, subfamily K, member 2rs2211127 1 211,862,409 0.78 4.32 Intergeners2225974 1 211,862,601 0.83 3.09 Intergeners4129019 1 212,381,255 1.16 3.05 USH2A Usher syndrome 2A
6 rs10495372 1 232,621,144 1.18 4.56 50 flank TM7SF1transmembrane 7 superfamily member 1rs1528776 1 233,478,279 0.80 4.89 LOC440737rs1252144 1 233,478,438 0.74 3.52 LOC440737
7 rs10495616 2 13,567,962 0.81 3.21 Intergeners2077411 2 14,316,043 1.17 3.47 Intergeners10495636a 2 14,395,237 1.23 3.83 Intergeners10495638 2 14,395,750 0.80 3.70 Intergene
8 rs2176221 2 51,898,640 1.23 3.19 Intergeners2355813 2 52,298,006 1.22 5.72 Intergeners350732 2 52,898,473 1.23 3.19 50 flank LOC402072rs10496026 2 53,654,834 0.85 3.05 30 flank LOC388949
9 rs2901780 2 76,801,066 1.17 3.27 LRRTM4 leucine rich repeat transmembrane neuronal 4b,c
rs985343 2 76,823,437 1.25 3.76 LRRTM4 leucine rich repeat transmembrane neuronal 4b,c
rs1921627 2 77,084,348 1.17 3.88 LRRTM4 leucine rich repeat transmembrane neuronal 4b,c
10 rs2885467 2 83,812,464 1.44 3.61 Intergeners10496300 2 83,841,704 1.17 3.20 Intergeners6729553 2 84,821,493 0.82 3.25 LOC200383rs10496316 2 85,659,029 0.84 3.46 50 flank MAT2A methionine adenosyltransferase II, alpha
11 rs7566329 2 141,387,286 0.81 3.18 LRP1B low density lipoprotein-related proteinc
rs10496858 2 141,473,377 1.16 3.28 LRP1B low density lipoprotein-related proteinc
rs10496905 2 142,470,192 0.80 3.34 LRP1B low density lipoprotein-related proteinc
12 rs10497494 2 178,332,390 1.25 3.55 PDE11Ars334005 2 178,953,076 1.27 3.38 OSBPL6 oxysterol binding protein-like 6rs1961416 2 179,696,678 1.40 3.40 LOC285026rs2008989a 2 179,796,596 1.28 3.14 30 flank SESTD1 SEC14 and spectrin domains 1rs6736098 2 179,861,873 1.26 3.04 SESTD1 SEC14 and spectrin domains 1rs1158872a 2 179,953,209 0.77 4.00 50 UTR SESTD1 SEC14 and spectrin domains 1rs932117 2 180,380,554 1.18 3.26 ZNF533 zinc finger protein 533rs4894122 2 180,469,360 1.24 3.70 50 flank ZNF533 zinc finger protein 533
13 rs1369843 2 200,913,677 1.32 4.40 Intergeners1347553 2 200,962,288 1.17 3.44 50 flank DNAPTP6 DNA polymerase-transactivated protein 6rs719125 2 201,843,366 1.34 3.00 CFLAR CASP8 and FADD-like apoptosis regulatorrs2349733 2 202,448,571 1.19 3.43 ALS2 amyotrophic lateral sclerosis 2
14 rs956270 3 21,018,625 0.77 4.53 Intergeners2173234 3 21,045,946 1.31 3.07 Intergeners958635 3 21,047,047 1.22 3.02 Intergeners9310635 3 21,056,888 1.21 3.53 Intergeners1370116 3 21,187,137 0.75 3.20 Intergene
15 rs10510945 3 65,792,243 0.76 4.52 BAIAP1/MAGI1 membrane associated guanylate kinase, WWand PDZ domain containing 1
rs10510946 3 65,792,731 0.77 3.51 BAIAP1/MAGI1 membrane associated guanylate kinase, WWand PDZ domain containing 1
rs10510947 3 65,804,384 1.19 3.04 BAIAP1/MAGI1 membrane associated guanylate kinase, WWand PDZ domain containing 1
16 rs718424a 3 149,863,241 0.73 3.90 50 flank AGTR1 angiotensin II receptor, type 1rs275707 3 149,886,571 0.71 3.40 50 flank AGTR1 angiotensin II receptor, type 1rs2639375 3 149,887,816 0.67 3.13 50 flank AGTR1 angiotensin II receptor, type 1rs10513338a 3 149,952,288 0.76 5.03 30 flank AGTR1 angiotensin II receptor, type 1
17 rs4305478 4 166,397,584 1.19 3.42 FLJ38482rs1370687 4 166,747,960 1.23 3.08 CPE carboxypeptidase Ers1837171 4 166,748,122 1.23 3.57 CPE carboxypeptidase E
(Continued)
Association Genome Scanning for Alcohol Dependence 847

18 rs1643658 5 79,972,097 0.83 3.54 DHFR dihydrofolate reductasers2897262 5 79,998,432 0.79 3.62 MSH3 mutS homolog 3 (E. coli)rs1650663 5 79,998,953 1.17 3.37 MSH3 mutS homolog 3 (E. coli)
19 rs152608 5 106,799,108 0.83 3.18 EFNA5 ephrin-A5rs164838 5 107,008,867 0.80 3.42 EFNA5 ephrin-A5rs770167 5 107,154,817 0.71 3.09 Intergeners770166 5 107,155,126 0.68 3.26 Intergeners10515391 5 108,032,094 1.20 3.35 Intergene
20 rs1318774 5 123,246,619 0.80 3.23 Intergeners2129846 5 123,658,466 0.81 3.99 Intergeners696479 5 123,699,995 1.16 3.36 Intergeners10519804 5 124,560,322 1.16 3.06 Intergene
21 rs4091539 5 128,423,826 0.78 4.83 Intergeners42562 5 128,432,225 0.75 4.65 Intergeners10520031 5 128,529,519 1.26 3.99 Intergene
22 rs1549920 5 151,121,037 0.87 3.33 50 flank ATOX1 ATX1 antioxidant protein 1 homologrs10515675 5 151,993,982 1.16 3.39 50 flank NMUR2 neuromedin U receptor 2c
rs4310018 5 152,266,397 1.17 4.08 Intergeners10515678 5 152,303,429 0.81 3.49 Intergene
23 rs261612 5 169,151,419 1.25 3.31 DOCK2 dedicator of cytokinesis 2rs1477316 5 169,372,306 1.26 3.22 DOCK2 dedicator of cytokinesis 2rs1477317 5 169,372,320 1.28 3.14 DOCK2 dedicator of cytokinesis 2
24 rs10498762 6 45,851,264 1.26 3.43 Intergeners953062 6 46,734,312 0.77 4.06 SLC25A27 solute carrier family 25, member 27rs1490296 6 47,228,712 1.27 3.63 Intergene
25 rs989191 6 79,970,675 0.72 3.33 HMGN3 high mobility group nucleosomal binding domain 3rs3846741 6 80,198,421 0.83 4.78 Intergeners2803183 6 80,235,582 0.87 5.54 Intergene
26 rs1753826 6 91,283,465 0.71 3.84 MAP3K7 mitogen-activated protein kinase kinase kinase 7rs806284 6 91,300,645 0.85 3.92 MAP3K7 mitogen-activated protein kinase kinase kinase 7rs1145735 6 91,335,141 1.19 3.16 MAP3K7 mitogen-activated protein kinase kinase kinase 7
27 rs2181069 6 155,896,762 1.16 3.26 Intergeners1391655 6 156,092,837 1.34 3.82 Intergeners9322535 6 156,158,886 0.85 3.52 Intergene
28 rs2191480 7 14,607,796 1.33 3.00 DGKB diacylglycerol kinase, beta 90 kDac
rs217560 7 14,684,842 1.17 3.69 50 flank DGKB diacylglycerol kinase, beta 90 kDac
rs2191349 7 14,837,549 1.29 3.11 Intergene29 rs10486606 7 28,956,707 1.19 4.07 CPVL carboxypeptidase, vitellogenic-like
rs6978690 7 29,364,669 1.28 3.97 Intergeners10499584 7 29,364,852 1.17 3.08 Intergeners2391802 7 29,636,004 1.21 3.95 LOC441208
30 rs7789889 7 33,916,358 1.20 3.30 BMPER BMP-binding endothelial regulator precursor proteinrs714588 7 34,466,466 1.19 3.78 50 flank GPR154 G protein-coupled receptor 154/NPS receptorc
rs1419794 7 34,474,245 0.84 3.54 GPR154 G protein-coupled receptor 154/NPS receptorc
rs324960 7 34,575,631 1.15 3.97 GPR154 G protein-coupled receptor 154/NPS receptorc
31 rs321967 7 77,959,200 1.17 3.64 AIP1c
rs2190662 7 77,966,715 1.18 4.14 AIP1c
rs2190665 7 77,966,810 0.71 4.73 AIP1c
32 rs17071791 8 4,744,386 0.83 4.93 Intron I CSMD1 CUB and Sushi multiple domains 1c
rs1377881 8 4,948,992 0.85 3.74 50 flank CSMD1 CUB and Sushi multiple domains 1c
rs7822993 8 5,187,543 0.85 3.48 50 flank CSMD1 CUB and Sushi multiple domains 1c
rs4146469 8 5,253,259 1.20 3.10 50 flank CSMD1 CUB and Sushi multiple domains 1c
rs10503302 8 5,269,281 1.29 3.17 50 flank CSMD1 CUB and Sushi multiple domains 1c
33 rs10503688 8 20,635,206 1.34 3.12 Intergeners1459328a 8 21,141,281 1.20 3.12 Intergeners9314269 8 21,860,935 0.88 3.22 XPO7 exportin 7
34 rs1381113 8 28,202,619 1.18 3.18 Intergeners524458 8 29,148,550 1.19 4.77 KIF13B kinesin family member 13Brs6558132 8 29,526,866 1.28 3.60 LOC392208similar to 60S ribosomal protein L17 (L23)
35 rs3935233 8 39,307,991 0.84 3.73 ADAM5 a disintegrin and metalloproteinase domain 5rs2980817 8 40,155,783 0.86 3.16 Intergeners966169 8 40,156,816 1.21 3.58 Intergeners724322 8 40,157,961 0.88 4.26 Intergeners2980813 8 40,169,167 0.87 3.40 Intergene
36 rs723085 8 77,949,261 1.24 3.51 30 flank ZFHX4 zinc finger homeodomain 4rs2128944 8 77,957,795 1.25 5.01 30 flank ZFHX4 zinc finger homeodomain 4rs1545881 8 77,983,105 1.21 3.36 30 flank ZFHX4 zinc finger homeodomain 4
TABLE I. (Continued)
# SNP ID Chr Location A/C t value Gene
848 Johnson et al.
37 rs10504751 8 83,374,045 0.82 3.69 LOC389674rs1404759 8 83,850,716 0.72 3.23 Intergeners10504770 8 83,886,603 1.21 3.16 Intergene
38 rs572811 9 75,329,015 1.22 3.11 50 flank proprotein convertase subtilisin/kexin type 5 PCSK5c
rs10512042 9 75,348,913 1.33 4.23 50 flank proprotein convertase subtilisin/kexin type 5 PCSK5c
rs10521468 9 76,033,066 1.22 4.30 proprotein convertase subtilisin/kexin type 5 PCSK5c
rs2270571 9 76,033,485 0.83 4.19 proprotein convertase subtilisin/kexin type 5 PCSK5c
39 rs7897412 10 82,792,026 1.26 3.20 Intergeners7093354 10 82,800,051 1.26 3.90 Intergeners7069222a 10 83,746,082 1.23 3.28 NRG3 neuregulin 3 NRG3 Pro-neuregulin-3 precursor
40 rs4298845 10 84,889,336 1.24 5.02 30 flank NRG3 neuregulin 3rs10509466 10 84,890,641 1.40 3.97 Intergeners987312 10 85,304,655 1.25 3.33 Intergeners2350152 10 85,778,039 0.84 4.46 LOC439991
41 rs10505947 12 24,811,933 1.21 3.58 LOC387846 hypothetical LOC387846rs1489907 12 25,447,971 1.18 3.77 30 flank of FLJ36004; likely ortholog of mouse Pas1 candidate 1rs7301836 12 25,537,419 0.83 3.11 FLJ36004; likely ortholog of mouse Pas1 candidate 1rs1049380 12 26,380,811 1.16 5.22 30 ITPR2 inositol 1,4,5-triphosphate receptor, type 2rs4654 12 26,381,422 0.86 3.22 30 ITPR2 inositol 1,4,5-triphosphate receptor, type 2
42 rs724026 12 112,555,413 1.23 3.49 Intergeners3782422 12 112,722,445 0.80 4.79 RBM19 RNA binding motif protein 19rs2114865 12 113,034,425 0.82 3.22 Intergene
43 rs1927384 13 101,943,751 1.20 3.09 Intergene; 50 flank of TPP2 tripeptidyl peptidase IIrs279929 13 102,538,720 1.39 3.50 30 flank SLC10A2 solute carrier family 10 (sodium/bile acid
cotransporter family), member 2rs1529281 13 102,706,611 0.79 3.76 Intergeners951348 13 102,788,188 0.86 3.10 Intergene
44 rs726449 13 107,949,490 0.88 3.19 50 flank MYR8 myosin heavy chain Myr 8rs1033871 13 108,629,670 0.88 3.18 MYR8 myosin heavy chain Myr 8rs1328837 13 108,677,100 0.83 4.67 30 flank MYR8 myosin heavy chain Myr 8
45 rs10498431 14 51,213,444 1.20 3.54 C14orf31 FRMD6 FREM domain containing 6rs9285578 14 51,222,351 0.85 3.62 C14orf31 FRMD6 FREM domain containing 6rs10498445 14 51,810,191 0.86 3.50 PTGDR prostaglandin D2 receptor
46 rs10518930 15 35,280,878 1.35 3.67 Intergeners603575 15 35,462,954 0.85 3.44 Intergeners10518950a 15 35,539,179 0.74 3.34 Intergeners10518952 15 35,567,312 1.20 3.69 50 flank LOC390576rs10520086a 15 35,861,390 1.24 3.21 Intergene
47 rs8049647 16 50,695,297 1.18 3.46 50 flank LOC388276rs10521256 16 50,764,161 1.24 3.03 50 flank LOC388277rs7206384 16 51,299,759 1.18 3.02 Intergene
48 rs40510 16 63,530,623 1.25 3.51 30 flank CDH11 cadherin 11, type 2rs35164 16 63,532,702 1.19 4.28 30 flank CDH11 cadherin 11, type 2rs35200 16 63,579,045 0.87 3.10 CDH11 cadherin 11, type 2rs10500508 16 63,679,379 1.19 4.03 CDH11 cadherin 11, type 2
49 rs10514542 16 81,115,185 0.88 3.21 50 flank cadherin 13c
rs192599 16 81,443,739 1.21 4.81 cadherin 13c
rs7206473 16 81,458,377 0.73 3.91 cadherin 13c
50 rs10515112 17 51,240,116 0.76 3.07 30 flank PCTP phosphatidylcholine transfer proteinrs1879143 17 52,113,556 1.17 4.44 Intergeners721427 17 52,519,635 0.85 3.13 AKAP1 A kinase (PRKA) anchor protein 1rs998113 17 52,520,226 1.32 3.08 AKAP1 A kinase (PRKA) anchor protein 1rs4793900 17 53,145,196 0.84 3.31 30 flank MSI2 musashi homolog 2 (Drosophila)rs4793902 17 53,149,218 0.78 3.54 30 flank MSI2 musashi homolog 2 (Drosophila)
51 rs10502332 18 5,703,232 1.18 4.49 LOC388459 TTM2 two transmembrane protein Ars341184 18 6,355,614 1.19 3.08 L3MBTL4 l(3)mbt-like 4rs971529 18 6,822,779 1.47 4.53 LOC388462/ARHGAP28 Rho GTPase activating protein 28
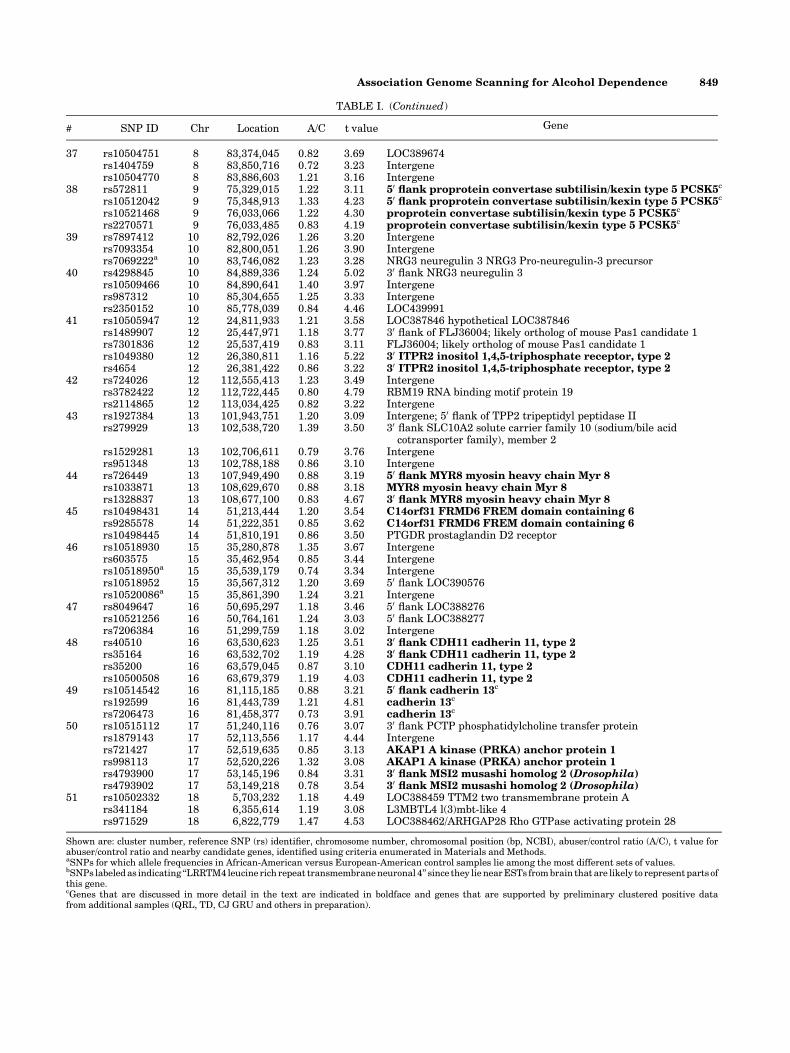
Shown are: cluster number, reference SNP (rs) identifier, chromosome number, chromosomal position (bp, NCBI), abuser/control ratio (A/C), t value forabuser/control ratio and nearby candidate genes, identified using criteria enumerated in Materials and Methods.aSNPs for which allele frequencies in African-American versus European-American control samples lie among the most different sets of values.bSNPs labeled as indicating ‘‘LRRTM4 leucine rich repeat transmembrane neuronal 4’’ since they lie near ESTs from brain that are likely to represent parts ofthis gene.cGenes that are discussed in more detail in the text are indicated in boldface and genes that are supported by preliminary clustered positive datafrom additional samples (QRL, TD, CJ GRU and others in preparation).
TABLE I. (Continued)
# SNP ID Chr Location A/C t value Gene
Association Genome Scanning for Alcohol Dependence 849

three positive SNPs met the same criterion (P¼ 0.00034). Thuswhen we performed 100,000 Monte Carlo simulation trials ineach of which a random set of 667 SNPs was sampled, only 34such trials involved 188 or more SNPs in such clusters.
We focus our subsequent analyses on these 51 clusters ofcandidate-positive SNPs (Table I). We identify candidate genenominees for many of these 51 clusters of positive SNPs basedon information from Mapviewer, HapMap, and Unigene andthe criteria noted in Materials and Methods.
The clustered-positive results from this dataset can becompared with results from other association and linkageresults for addictions. Fourteen of the two-SNP clusters andfour of the three-SNP clusters from the present work lie within1 Mb of at least one of the clustered positive results obtainedfrom both NIDA European-American and NIDA African-American polysubstance abusers who report dependence onat least one illegal addictive substance (P� 0.00001 for bothcomparisons). These results provide additional support forpositive SNP clusters 9, 11, 32, and 38 in the current work. Ten
of the two-SNP clusters and five of the three-SNP clusters froma study of methamphetamine-dependent Japanese individualsversus controls also lie within 1 Mb of at least one of the currentclusters (P< 0.00001), providing additional support for clus-ters 11, 20, 22, 31, and 49 from the current work. Of the26 genes that are identified here by multiple-clustered positiveSNPs, LRP1B, AIP1, CDH13, LRRTM4, CSMD1, PCSK5,CSMD2, GPR154, and DGKB also contain clustered positiveresults from at least one other addiction association genome-scanning sample. NMUR2 is also identified by clustered-positive results from other samples. This level of replication isespecially remarkable since these convergences were soughtfor samples from different ethnic backgrounds and differentaddictions. Such a level of replication is consistent with falsediscovery rate calculations for the 51 loci, which range from0.06 for joint false discovery rates for the eight positive SNPcluster to ca. 0.33 for the three positive SNP clusters. Such alevel of replication is also consistent with simulation-basedMonte Carlo P-values for each of these loci. Each of 100,000
Fig. 1. Main axes: abuser/control ratios to the chromosomal position of each SNP for COGA alcohol-dependent and control individuals. The positions ofthe SNPs whose data yield outlier abuser/control values are indicated by larger symbols. Supplementary axis (right of main axis): SNPs for which abuser/control differences display t values�3. Red dots designate clustered positive SNPs that display outlier abuser/control and t values. Scale: chromosomalpositions based on NCBI Map Viewer coordinates and supplemental data from NETAFFYX. The vertical bar represents 25 MB.
850 Johnson et al.

trials selected a genomic segment that started with thebeginning of a randomly selected annotated gene, continued30 for the same number of bases as that identified by thepositive cluster and added an additional 1 Mb at either end ofthe segment. For each trial, the genomic segment was assessedto identify whether a cluster of positive SNPs with the sameproperties identified in the true dataset lay in the region. Thesestudies appear to yield P-values that range from 0.001 to 0.03,uncorrected for the 51 multiple comparisons [Johnson et al.,2006].
Based on the number of pools assessed here and the pool-to-pool variability actually observed in these experiments (SEMsfor four replicate arrays 0.03; mean�SEMs for pool-to-poolvariation 0.62� 0.02), we calculate 0.9 power to detect abuser/control allele frequency differences of 0.05.
DISCUSSION
The results of this study support the idea that array-basedpooled association genome scanning approaches can identifychromosomal regions likely to contain allelic variants thatdiffer in frequencies between alcohol-dependent and controlindividuals. This current identification of such frequencydifferences in alcohol-dependent individuals provides the firstgenome-wide association-based assessment for genomic locilikely to contain variants that contribute to dependence onalcohol. We discuss the strengths and possible limitations ofthese results, the ways in which they converge with results ofprevious association- and linkage-based studies and theclasses of genes that they nominate to play roles in humanvulnerabilities to alcohol dependence.
The reliability and validity of the current approach issupported by data that documents the reliability of clinicalassessments made by multiple observers and the extent towhich the markers that display nominally positive differencesbetween abusers and controls cluster together in specificchromosomal regions in these samples. We and others havealso provided extensive evidence for the reliability and validityof pooling approaches using related microarray-based assays[Butcher et al., 2004; Liu et al., 2005; Drgon et al., submitted].Correlations between the current data and preliminary dataobtained using the same samples and ‘‘10k’’ Affymetrix arrayswere 0.98 for the overlapping SNPs that displayed outlierabuser/control values [CJ, QRL, TD, GRU et al., unpublishedobservations, 2004].
Modeling studies support significant power for the currentmethods and also support the likelihood of both false-positiveand false-negative results. Power calculations support 0.9power to detect 5% allele frequencies differences in the currentexperiments. Despite the relatively high marker density usedin this report, however, there are still likely to be haplotypeblocks that contain vulnerability-modifying alleles but do notcontain three SNPs that are assessed in this report. Suchblocks could thus provide false negative results in thesestudies. False positives are also likely, since we make manycomparisons in this study. Simulation studies suggest a verylow likelihood that all of the clustered positive resultsdisplayed here represent false positives. However, falsepositive results are still likely even among the clusteredpositive SNPs. False discovery rates lie between 0.06 and ca.0.33 for the different clusters. Many, but not all, of thesefindings are supported by positive results from associationgenome scans of different addictions studied in differentpopulations.
Since the COGA sample was not collected for associationstudies, it is possible that there might be occult stratificationwithin these sample sets. We have examined this by comparingmean differences between arctangent transformed A/B allelic
ratios between European- and African-American samplescollected in Baltimore, Maryland [Liu et al., 2006] for theSNPs that are 5% outliers among the Affymetrix SNPs fromthe current dataset and with data for all Affymetrix SNPs. Theaverage normalized allele frequency ethnic difference for theSNPs that displayed outlier alcoholic/control values was 0.154.The average normalized ethic differences for all of the SNPsrepresented in the current dataset was 0.147. There was thusno evidence for overall stratification.
These results support the possibility that careful evaluationof associations within unrelated members of samples collectedfor linkage may be possible with the relatively high markerdensities provided by SNP methods, given the genomic controlsthat these high-SNP densities can also provide. These data andtheir convergence with prior results continue to providesupport for the idea that common allelic variants contributeto human vulnerability to abuse of addictive substances.Finding a number of SNPs with substantial abuser-controldifferences near markers previously linked to alcoholism inthis same dataset supports the idea that further fine mappingstudies using association approaches in these samples, as wellas others, might help to better define the specific genes,haplotypes and gene variants that contribute to previouslyobserved linkage signals in these datasets.
When we assess the extent to which the SNPs that displayoutlier abuser/control values also display outlier t values, theobserved results are found rarely by chance in simulationstudies. When we examine the degree to which these nominallypositive SNPs cluster together in groups of three or more onmodest-sized chromosomal regions we also observe strikingdepartures from chance values. Forty-two of the 51 clustersidentified here contain positive SNPs from bothXba I andHindIII arrays. Twenty-two of the 51 clusters identified here receiveat least some support from another linkage or associationstudy; others also receive support from candidate gene studies(see below).
Assessing convergence of the current data with results oflinkage analyses identifies 16 simple sequence length poly-morphism (SSLP) markers that were previously linked toalcohol phenotypes with nominal statistical significancethat lie within �5 Mb of clustered positive results from thecurrent study. Seven of these markers lie near linked markersfrom analyses of alcohol dependence in COGA pedigrees[Reich et al., 1998]; four from linkage analyses of alcoholdependence in Southwest Indians [Long et al., 1998] andfive from linkage analyses of alcohol quantity/frequencyphenotypes in data from the Framingham study [Bergenet al., 2003; Ma et al., 2003]. Each of these observations provideadditional levels of support for the validity of the observedclustering.
Interesting candidate gene nominees lie near many of theclustered positive markers identified in this work. Cell-signaling molecule genes that lie near reproducibly positiveSNPs (Table I) include those that signal within cells andbetween cells. Peptide signaling is implicated. Clustered-positive SNPs lie just in the 50 flank of the GPR154 G protein-coupled receptor 154 that has been characterized as thereceptor for neuropeptide S [Xu et al., 2004]. Several SNPslie in 50 and 30 flanks of the AGTR1 angiotensin II receptor, type1 gene. Clustered positive SNPs also flank and/or lie withinenzymes that function to convert propeptides to biologicallyactive peptides, including CPE carboxypeptidase E andproprotein convertase subtilisin/kexin type 5 (PCSK5).
Intracellular signaling with several different second mes-senger systems is implicated.
Phospholipid-signaling pathways could be altered by varia-tions in several genes that lie near clustered-positive SNPs.Positive SNPs cluster in the 50 flank and within the DGKBdiacylglycerol kinase, beta 90 kDa gene, the gene that encodes
Association Genome Scanning for Alcohol Dependence 851

the ITPR2 inositol 1,4,5-triphosphate receptor, type 2 andthe MAP3K7 mitogen-activated protein kinase kinase kinase7 gene. Other phosphorylation patterns could well be alteredby differences in the activities of the genes that encode the WWand PDZ domain containing BAIAP1/MAGI1 membrane-associated guanylate kinase and the anchor protein forAKAP1A kinase (PRKA).
Channels are implicated by these results. The KCNK2potassium channel, subfamily K, member 2 is implicated bymultiple positive SNPs.
Gene regulatory and/or developmental genes lie nearreproducibly positive SNPs. The ephrin EFNA5 gene’s 50 flankcontains positive SNPs that support roles for variations inthis single transmembrane domain receptor protein kinasein addiction vulnerability. The DAB1-disabled homolog1, DOCK2 dedicator of cytokinesis 2, CSMD1 CUB, and Sushimultiple domains 1, SESTD1 SEC14 and spectrin domains 1,ZNF533 zinc finger protein 533, and the MSH3 mutS homolog 3(E. coli) genes each contain multiple clustered positive SNPs.The 30 flank of the MSI2 musashi homolog 2 contains multiplepositive SNPs. Each of these genes’ products could alter braindevelopmental and/or adult form and function with conse-quences for addiction vulnerability.
The atrophin-1 interacting protein 1 (AIP1) gene is a disease-related gene that lies near clustered positive SNPs from thecurrent dataset and reproducibly positive SNPs in studies ofAfrican- and European-American polysubstance abusers ver-sus controls (see Liu et al. [2005]). This gene [Wood et al., 1998]is expressed largely in brain where it interacts with proteinsincluding atrophin, the protein in which trinucleotide repeatexpansions cause dentatorubral and pallidoluysian atrophy.
We have identified clustered positive SNPs near the genesthat encode documented or suspected cell adhesion moleculesand their possible ligands. These genes include the LRP1B low-density lipoprotein-related protein, cadherin 11 and cadherin13 genes. Cadherin 13 is expressed in neurons and is abundantin interesting brain regions including amygdala. We havepreviously identified clustered-positive SNPs in the cadherin13 gene in comparisons of methamphetamine abusers withcontrols [Drgon et al., submitted]. A number of SNPs are 30 tothe sequences currently annotated as the LRRTM4 leucine richrepeat transmembrane neuronal 4 gene. These SNPs lie nearESTs that derive from brain and seem likely to signalpreviously unelucidated more 30 portions of this gene. Thesedata add to previous nomination and or/confirmation ofaddiction-associated variants in cell adhesion moleculesincluding neurexin 3 [Liu et al., 2005], NrCAM [Ishiguroet al., 2005], PTPRB [Ishiguro et al., submitted], the minorhistocompatibility antigen HB-1 [Liu et al., 2005], multimerin1 [Drgon et al., submitted], ADAM23 [Drgon et al., submitted],the FAT tumor suppressor homolog 3 and the Downs syndromecell adhesion molecule [Drgon et al., submitted].
Clustered positive SNPs also lie near genes with otherdiverse cellular functions. DLAD DNase II-like acid DNase,MYR8 myosin heavy chain Myr 8, and the C14orf31 thatencodes the FRMD6 FREM domain containing 6 protein eachcontain multiple clustered positives SNPs. In addition,clustered-positive SNPs also lie near genes that encodeproteins of unknown function, including a number of hypothe-tical proteins (Table I).
While these data nominate interesting genes, it is onlyconfirmation in multiple datasets in ongoing and futurestudies that will link each of them securely to addictionvulnerability. In preliminary results from higher densitygenome scanning studies from at least three additionalsamples, several of these genes receive substantial support(Table I, TD, QRL, CJ, GRU and others in preparation).Nevertheless, the current data provide support for locinominated in prior SNP association and linkage-based studies
and identify new chromosomal regions with clustered-positiveSNPs and interesting genes. They provide a set of genomicmarkers in these 51 chromosomal regions that should be usefulin subsequent studies of alcohol abusers. As we identify moreand more of the allelic variants that contribute to vulnerabilityto abuse of alcohol and other substances, we will be better ableto understand addictions themselves.
ACKNOWLEDGMENTS
We acknowledge passionate statistical discussions and helpfrom Dr. Daniel Naiman, Department of MathematicalSciences, Johns Hopkins University. For assistance in obtain-ing these datasets and samples, we are especially grateful theGenetics Analysis Workshop, NIAAA and COGA investigators,including PI: H. Begleiter; co-PIs L. Bierut, H. Edenberg,V. Hesselbrock, and B. Porjesz; University of Connecticut (V.Hesselbrock); Indiana University (H. Edenberg, J. NurnbergerJr, P.M. Conneally, T. Foroud); University of Iowa (S.Kuperman, R. Crowe); SUNY Downstate Medical Center (B.Porjesz, H. Begleiter); Washington University in St. Louis (L.Bierut, A. Goate, J. Rice); University of California at San Diego(M. Schuckit); Howard University (R. Taylor); Rutgers Uni-versity (J. Tischfield); and Southwest Foundation (L. Almasy)and Zhaoxia Ren as NIAAA staff collaborator. We acknowledgesupport for sample and data collection and storage fromU10AA008401 (NIAAA and NIDA). COGA investigatorsespecially acknowledge the fundamental scientific contribu-tions of the late Theodore Reich, M.D., Co-Principal Investi-gator of COGA from its inception and a founder of modernpsychiatric genetics. The authors acknowledge assistance fromNIAAAA, the Genetics Analysis Workgroup and members ofthe Collaborative Study on the Genetics of Alcoholism.
REFERENCES
Bansal A. 2001. Trends in reporting of SNP associations. Lancet 358:2016.
Barcellos LF, Klitz W, Field LL, Tobias R, Bowcock AM, Wilson R, NelsonMP, Nagatomi J, Thomson G. 1997. Association mapping of disease loci,by use of a pooled DNA genomic screen. Am J Hum Genet 61:734–747.
Bergen AW, Yang XR, Bai Y, Beerman MB, Goldstein AM, Goldin LR. 2003.Genomic regions linked to alcohol consumption in the FraminghamHeart Study. BMC Genet 4(Suppl 1):S101.
Bierut LJ, Saccone NL, Rice JP, Goate A, Foroud T, Edenberg H, Almasy L,Conneally PM, Crowe R, Hesselbrock V, et al. 2002. Defining alcohol-related phenotypes in humans. The Collaborative Study on the geneticsof Alcoholism. Alcohol Res Health 26:208–213.
Butcher LM, Meaburn E, Liu L, Fernandes C, Hill L, Al-Chalabi A, PlominR, Schalkwyk L, Craig IW. 2004. Genotyping pooled DNA on micro-arrays: A systematic genome screen of thousands of SNPs in largesamples to detect QTLs for complex traits. Behav Genet 34:549–555.
Cadoret RJ, Troughton E, O’Gorman TW, Heywood E. 1986. An adoptionstudy of genetic and environmental factors in drug abuse. Arch GenPsychiatry 43:1131–1136.
Cadoret RJ, Yates WR, Troughton E, Woodworth G, Stewart MA. 1995.Adoption study demonstrating two genetic pathways to drug abuse.Arch Gen Psychiatry 52:42–52.
Cervino AC, Hill AV. 2000. Comparison of tests for association and linkage inincomplete families. Am J Hum Genet 67:120–132.
Drgon T, Lui OR, Johnson C, Walther D, Hishimoto A, Ujike H, Komiyama T,Harano M, Sekine Y, Inada T, Ozaki N, Iyo M, Iwata N, Yamada M,Sora I and Uhl GR. 2006. Addiction molecular genetics in Japanesemethamphetamine-dependent individuals: Pooled association genomescanning identifies addiction vulnerability loci and genes. (submitted).
Dupont WD, Plummer WD Jr. 1990. Power and sample size calculations. Areview and computer program. Control Clin Trials 11:116–128.
Germer S, Holland MJ, Higuchi R. 2000. High-throughput SNP allele-frequency determination in pooled DNA samples by kinetic PCR.Genome Res 10:258–266.
Goldberg J, Henderson WG, Eisen SA, True W, Ramakrishnan V, Lyons MJ,Tsuang MT. 1993. A strategy for assembling samples of adult twin pairsin the United States. Stat Med 12:1693–1702.
852 Johnson et al.

Grove WM, Eckert ED, Heston L, Bouchard TJ Jr, Segal N, Lykken DT.1990. Heritability of substance abuse and antisocial behavior: A study ofmonozygotic twins reared apart. Biol Psychiatry 27:1293–1304.
Gynther LM, Carey G, Gottesman II, Vogler GP. 1995. A twin study of non-alcohol substance abuse. Psychiatry Res 56:213–220.
Hacia JG, Fan JB, Ryder O, Jin L, Edgemon K, Ghandour G, Mayer RA, SunB, Hsie L, Robbins CM, et al. 1999. Determination of ancestral alleles forhuman single-nucleotide polymorphisms using high-density oligonu-cleotide arrays. Nat Genet 22:164–167.
Ishiguro H, Liu QR, Gong JP, Hall FS, Ujike H, Morales M, Sakurai T,Grumet M, Uhl GR. 2006. NrCAM in addiction vulnerability: Positionalcloning, drug-regulation, haplotype-specific expression, and altereddrug reward in knockout mice. Neuropsychopharmacology 31:572–584.
Kaprio J, Hammar N, Koskenvuo M, Floderus-Myrhed B, Langinvainio H,Sarna S. 1982. Cigarette smoking and alcohol use in Finland andSweden: A cross-national twin study. Int J Epidemiol 11:378–386.
Karkowski LM, Prescott CA, Kendler KS. 2000. Multivariate assessment offactors influencing illicit substance use in twins from female-femalepairs. Am J Med Genet 96:665–670.
Kendler KS, Prescott CA. 1998. Cocaine use, abuse and dependence in apopulation-based sample of female twins. Br J Psychiatry 173:345–350.
Kendler KS, Karkowski LM, Corey LA, Prescott CA, Neale MC. 1999.Genetic and environmental risk factors in the aetiology of illicit druginitiation and subsequent misuse in women. Br J Psychiatry 175:351–356.
Liu QR, Drgon T, Johnson C, Walther D, Hess J and Uhl GR. 2006. Addictionmolecular genetics: 639,401 SNP whole genome association revealsmany ‘‘cell adhesion’’ gene variants. (submitted).
Liu QR, Drgon T, Walther D, Johnson C, Poleskaya O, Hess J, Uhl GR. 2005.Pooled association genome scanning: Validation and use to identifyaddiction vulnerability loci in two samples. Proc Natl Acad Sci USA102:11864–11869.
Long JC, Knowler WC, Hanson RL, Robin RW, Urbanek M, Moore E,Bennett PH, Goldman D. 1998. Evidence for genetic linkage to alcoholdependence on chromosomes 4 and 11 from an autosome-wide scan in anAmerican Indian population. Am J Med Genet 81:216–221.
Ma JZ, Zhang D, Dupont RT, Dockter M, Elston RC, Li MD. 2003. Mappingsusceptibility loci for alcohol consumption using number of grams ofalcohol consumed per day as a phenotype measure. BMC Genet4(Suppl 1):S104.
Maes HH, Woodard CE, Murrelle L, Meyer JM, Silberg JL, Hewitt JK,Rutter M, Simonoff E, Pickles A, Carbonneau R, et al. 1999. Tobacco,alcohol and drug use in eight- to sixteen-year-old twins: The VirginiaTwin Study of Adolescent Behavioral Development. J Stud Alcohol60:293–305.
Merikangas KR, Stolar M, Stevens DE, Goulet J, Preisig MA, Fenton B,Zhang H, O’Malley SS, Rounsaville BJ. 1998. Familial transmission ofsubstance use disorders. Arch Gen Psychiatry 55:973–979.
Reich T, Edenberg HJ, Goate A, Williams JT, Rice JP, Van Eerdewegh P,Foroud T, Hesselbrock V, Schuckit MA, Bucholz K, et al. 1998. Genome-wide search for genes affecting the risk for alcohol dependence. Am JMed Genet 81:207–215.
Risch N, Merikangas K. 1996. The future of genetic studies of complexhuman diseases. Science 273:1516–1517.
Schork NJ, Nath SK, Fallin D, Chakravarti A. 2000. Linkage disequilibriumanalysis of biallelic DNA markers, human quantitative trait loci, andthreshold-defined case and control subjects. Am J Hum Genet 67:1208–1218.
Sham PC, Cherny SS, Purcell S, Hewitt JK. 2000. Power of linkage versusassociation analysis of quantitative traits, by use of variance-compo-nents models, for sibship data. Am J Hum Genet 66:1616–1630.
Storey JD. 2002. A direct approach to false discovery rates. J R Stat Soc B64:479–498.
Storey JD, Tibshirani R. 2003. Statistical significance for genomewidestudies. Proc Natl Acad Sci USA 100:9440–9445.
Tsuang MT, Lyons MJ, Eisen SA, Goldberg J, True W, Lin N, Meyer JM,Toomey R, Faraone SV, Eaves L. 1996. Genetic influences on DSM-III-Rdrug abuse and dependence: A study of 3,372 twin pairs. Am J Med Genet67:473–477.
Tsuang MT, Lyons MJ, Meyer JM, Doyle T, Eisen SA, Goldberg J, True W,Lin N, Toomey R, Eaves L. 1998. Co-occurrence of abuse of differentdrugs in men: The role of drug-specific and shared vulnerabilities. ArchGen Psychiatry 55:967–972.
Tsuang MT, Lyons MJ, Harley RM, Xian H, Eisen S, Goldberg J, True WR,Faraone SV. 1999. Genetic and environmental influences on transitionsin drug use. Behav Genet 29:473–479.
Uhl GR. 1999. Molecular genetics of substance abuse vulnerability: Acurrent approach. Neuropsychopharmacology 20:3–9.
Uhl GR. 2004. Molecular genetic underpinnings of human substance abusevulnerability: Likely contributions to understanding addiction as amnemonic process. Neuropharmacology 47(Suppl 1):140–147.
Uhl GR, Elmer GI, Labuda MC, Pickens RW. 1995. Genetic influencesin drug abuse. In: Gloom FE, Kupfer DJ, editors. Psychopharmacology:The fourth generation of progress. New York: Raven Press. pp 1793–2783.
Uhl GR, Gold LH, Risch N. 1997. Genetic analyses of complex behavioraldisorders. Proc Natl Acad Sci USA 94:2785–2786.
Uhl GR, Liu QR, Walther D, Hess J, Naiman D. 2001. Polysubstance abuse-vulnerability genes: Genome scans for association, using 1,004 subjectsand 1,494 single-nucleotide polymorphisms. Am J Hum Genet 69:1290–1300.
Uhl GR, Liu QR, Naiman D. 2002. Substance abuse vulnerability loci:Converging genome scanning data. Trends Genet 18:420–425.
Wood JD, Yuan J, Margolis RL, Colomer V, Duan K, Kushi J, Kaminsky Z,Kleiderlein JJ, Sharp AH, Ross CA. 1998. Atrophin-1, the DRPLA geneproduct, interacts with two families of WW domain-containing proteins.Mol Cell Neurosci 11:149–160.
Woodward CE, Maes HH, Silberg JL, Meyer JM, Eaves LJ. 1996. Tobacco,alcohol and drug use in 8–16 year old twins. NIDA Res Monograph162:309.
Xu YL, Reinscheid RK, Huitron-Resendiz S, Clark SD, Wang Z, Lin SH,Brucher FA, Zeng J, Ly NK, Henriksen SJ, et al. 2004. Neuropeptide S: Aneuropeptide promoting arousal and anxiolytic-like effects. Neuron43:487–497.
Association Genome Scanning for Alcohol Dependence 853