1
Pond detection over Arctic region with CALIOP lidar measurements Xiaomei Lu, 1 Yongxiang Hu, 2 Zhaoyan Liu 1 1 Science Systems and Applications, Inc., 1 Enterprise Parkway, Suite, 200, Hampton, VA, 23666, USA ([email protected]; [email protected]) 2 Atmospheric Composition Branch, NASA Langley research Center, 21 Langley Blvd., Hampton, VA, 23681, USA (yongxiang.hu- [email protected]) ABSTRACT Bibliography 1. Hunt, W. H., D. M. Winker, M. A. Vaughan, K. A. Powell, P. L. Lucker, and C. Weimer (2009), CALIPSO Lidar Description and Performance Assessment, Journal of Atmospheric and Oceanic Technology, 26(7), 1214-1228, doi:10.1175/2009JTECHA1223.1 2. Behrenfeld, M. J., Y. Hu, C. A. Hostetler, G. Dall'Olmo, S. D. Rodier, J. W. Hair, and C. R. Trepte (2013), Space-based lidar measurements of global ocean carbon stocks, Geophysical Research Letters, 40(16), 4355-4360, doi:10.1002/grl.50816 3. X. Lu, Y. Hu, C. Trepte, S. Zeng, and J. H. Churnside, "Ocean subsurface studies with the CALIPSO spaceborne lidar," Journal of Geophysical Research: Oceans, vol. 119, pp. 4305-4317, 2014. 4. J. Churnside, B. McCarty, and X. Lu, "Subsurface Ocean Signals from an Orbiting Polarization Lidar," Remote Sensing, vol. 5, pp. 3457-3475, 2013 5. X. Lu, Y. Hu, C. Trepte, and Z. Liu, "A super-resolution laser altimetry concept," Geoscience and Remote Sensing Letters, IEEE, vol. 11, pp. 298-302, 2014 . CALIOP lidar For the CALIPSO lidar system, the laser produces simultaneous laser pulses at 1064 nm and 532 nm. Beam expanders reduce the angular divergence of the transmitted laser beam to produce a beam diameter of 70 m at the Earth’s surface. CALIOP is the first polarization lidar (cross-polarization and co- polarization channels at 532 nm) to provide global vertical profiles of the elastic backscattering from a near nadir-viewing during both day and night with a vertical resolution of 30 m in the atmosphere, and 22.5 m in the water (because of the 1.32 refractive index of water at 532 nm) [9]. In this study, CALPSO level 1 version 3 data products were used. The integrated attenuated backscatter (IAB) is defined as , with the lidar ground reflectance ρ (/sr), c as the instrument constant and τ as the measured atmospheric optical depth, λ as the wavelength (532nm and 1064nm for the CALIOP lidar). The color ratio used in this study is defined as γ 532nm /γ 1064nm . The integrated depolarization ratio at 532nm is defined as the ratio of the cross-polarized signal to the co-polarized signal . .We also used AMSR-E/Aqua level 3 grided product at 12.5 km spatial resolution that provides a daily averaged sea ice concentration of the Arctic region [10], and MODIS/Aqua snow cover MYD10CM (level 3, monthly) [11] and snow albedo product MYD10A1 (level 3, daily) [12]. 6. Y. Hu, K. Powell, et al, "Elevation information in tail (EIT) technique for lidar altimetry," Opt. Express, vol. 15, pp. 14504-14515, 2007 7. X. Lu and Y. Hu, "Ice sheet surface elevation retrieval from CALIPSO lidar measurements," Proc. of SPIE Vol. 8731, pp. 8. Y. Hu, K. Stamnes, M. Vaughan, J. Pelon, C. Weimer, D. Wu, M. Cisewski, W. Sun, P. Yang, B. Lin, A. Omar, D. Flittner, C. Hostetler, C. Trepte, D. Winker, G. Gibson, and M. Santa-Maria, "Sea surface wind speed estimation from space-based lidar measurements," Atmos. Chem. Phys., vol. 8, pp. 3593-3601, 2008 . 9. C. A.Hostetler, Z. Liu, J. Reagan, M. Vaughan, D. Winker, M. Osborn, W. H.Hunt, and K. A.Powell, "CALOP Algorithm Theoretical Basis Document Calibration and Level 1 Data Products," vol. PC-SCI-201, 2006 10. http://nsidc.org/data/docs/daac/ae_si12_12km_tb_sea_ice_and_snow.gd.html 11. https://nsidc.org/data/myd10cm 12. https://nsidc.org/data/docs/daac/modis_v5/myd10a1_modis_aqua_snow_daily_global_500m_grid.gd.html. CALIPSO/CloudSat 2016 Science Team Meeting Newport News, Virginia, March 1-3, 2016 The Cloud-Aerosol Lidar with Orthogonal Polarization (CALIOP), a two-wavelength (532 nm and 1064 nm) polarization lidar (cross- polarized and co-polarized channels), is the prime payload instrument on the Cloud-Aerosol Lidar and Infrared Pathfinder Satellite Observations (CALIPSO) satellite. The CALIOP lidar was designed to provide the observations necessary to improve our understanding of the impact of clouds and aerosols on the Earth’s radiation budget and climate [1] . Current analyses indicate a potential of CALIOP lidar for quantifying global ocean carbon stocks [2] and ocean subsurface backscatter [3-4] as well. Although the primary objective of the CALIPSO mission has been studying the climate impact of clouds and aerosols in the atmosphere. CALIPSO also collects information about other components of the Earth’s ecosystem, such as oceans [3-4] and land [5-8]. The objective of this study is to distinguish pond from snow/ice surfaces and open water in the Arctic region from CALIPSO lidar measurements. Analysis shows that attenuated backscatter color ratio and depolarization ratio are sensitive to these surface covers. Snow/or ice is brighter at 532nm than at 1064nm with the color ratio larger than 1 and depolarization ratio at 532nm larger than 0.6. Open water is much darker at 532 and 1064nm than other natural surfaces with depolarization Ocean, land and snow surface characteristics The 2D histogram of depolarization ratio and color ratio using the CALIOP lidar measurements at nighttime in 2010 for ocean, land and snow/ice surfaces is shown in Fig. 1. The results of fig.1 show that the CALIPSO color ratio and depolarization ratio measurements can be used for surfaces classifications. For example, the permanent snow/ice surface has the depolarization ratio of about 0.770.07, and for the land surface the depolarization ratio is about 0.370.09. The depolarization ratio of ocean surface is about 0.010.01. ratio less than 0.2. The values of integrated attenuated backscatter and depolarization ratio of pond over snow/ice surfaces are between values of snow/ice surface and open water surface. That is because the melt of snow cover significantly changes the radiative balance of the surface with albedo dropping from ~0.8 for cold dry snow to 0.5 or less for ponds of melted snow on the ice, thus the attenuated backscatter decreases as snow/ice wetness increase. The depolarization ratio of pond is from 0.2 to 0.6 with the color ratio between 1 and 1.5. Conclusion CALIPSO land surface lidar measurements, such as depolarization ratio, color ratios can be used to understand land surface properties. Also, the surface lidar measurements in the clear sky can be used as pond/or snow melt observations in Arctic region, while it does not require any assumptions from a space-based lidar. Results show that The depolarization ratio of pond is from 0.2 to 0.6 with the color ratio between 1 and 1.5. We will continue on the study of pond statistics properties for a given area and an entire melt season. Fig. 1. 2D histogram of Depolarization ratio and color ratio using the CALIOP lidar measurements at nighttime in 2010 for ocean (left), land (middle), and snow/ice surfaces (right). γ λ = cρ exp(2 τ ) δ = γ /γ ! Pond Detection method Figure 2 shows the 2D histogram of the depolarization ratio and color ratio for different months. As shown in Fig. 2, there are no bare land surfaces in winter time (Jan., Feb. and Dec.). Snow melt can be observed by CALIOP over Spring, Summer and Fall seasons. The values of color ratio and depolarization ratio of pond over snow/ice surface (or over land surfaces) are between values of snow/ice surface and open water surfaces (or land surfaces). That is because snow albedo decreases as the liquid water content increase, thus the attenuated backscatter and depolarization ratio decreases as snow/ice wetness increase. Figure 3 and 4 shows the pond probability distribution compared very well with the AMSR-E sea ice concentration and MODIS snow cover. Fig. 2. 2D histogram of Depolarization ratio and color ratio for different months. No bare land surface in winter time-surface is covered by snow January April Pond and land surfaces appear in Mid-Spring More Pond and land surface appears in Summer time. June Nov. Pond and land surface still appear in Fall Fig. 3 Pond probability distribution vs. AMSR-E sea ice concentration Fig. 4 Pond probability distribution vs. MODIS snow cover AMSR-E sea ice concentration CALIOP Pond probability (over Arctic ocean region) distribution CALIOP Pond probability (over Arctic Land region) distribution MODIS snow cover

Pond detection over Arctic region with CALIOP lidar

  • Upload
    others

  • View
    3

  • Download
    0

Embed Size (px)

Citation preview

Pond detection over Arctic region with CALIOP lidar measurements Xiaomei Lu,1 Yongxiang Hu,2 Zhaoyan Liu1

1 Science Systems and Applications, Inc., 1 Enterprise Parkway, Suite, 200, Hampton, VA, 23666, USA([email protected]; [email protected])2 Atmospheric Composition Branch, NASA Langley research Center, 21 Langley Blvd., Hampton, VA, 23681, USA ([email protected])

ABSTRACT

Bibliography1. Hunt, W. H., D. M. Winker, M. A. Vaughan, K. A. Powell, P. L. Lucker, and C. Weimer (2009), CALIPSO Lidar

Description and Performance Assessment, Journal of Atmospheric and Oceanic Technology, 26(7), 1214-1228,doi:10.1175/2009JTECHA1223.1

2. Behrenfeld, M. J., Y. Hu, C. A. Hostetler, G. Dall'Olmo, S. D. Rodier, J. W. Hair, and C. R. Trepte (2013), Space-basedlidar measurements of global ocean carbon stocks, Geophysical Research Letters, 40(16), 4355-4360,doi:10.1002/grl.50816

3. X. Lu, Y. Hu, C. Trepte, S. Zeng, and J. H. Churnside, "Ocean subsurface studies with the CALIPSO spacebornelidar," Journal of Geophysical Research: Oceans, vol. 119, pp. 4305-4317, 2014.

4. J. Churnside, B. McCarty, and X. Lu, "Subsurface Ocean Signals from an Orbiting Polarization Lidar," RemoteSensing, vol. 5, pp. 3457-3475, 2013

5. X. Lu, Y. Hu, C. Trepte, and Z. Liu, "A super-resolution laser altimetry concept," Geoscience and Remote SensingLetters, IEEE, vol. 11, pp. 298-302, 2014 .

CALIOP lidar

For the CALIPSO lidar system, the laser produces simultaneous laser pulses at 1064 nm and 532 nm.Beam expanders reduce the angular divergence of the transmitted laser beam to produce a beam diameterof 70 m at the Earth’s surface. CALIOP is the first polarization lidar (cross-polarization and co-polarization channels at 532 nm) to provide global vertical profiles of the elastic backscattering from anear nadir-viewing during both day and night with a vertical resolution of 30 m in the atmosphere, and22.5 m in the water (because of the 1.32 refractive index of water at 532 nm) [9].

In this study, CALPSO level 1 version 3 data products were used. The integrated attenuated backscatter(IAB) is defined as , with the lidar ground reflectance ρ (/sr), c as the instrumentconstant and τ as the measured atmospheric optical depth, λ as the wavelength (532nm and 1064nm forthe CALIOP lidar). The color ratio used in this study is defined as γ532nm/γ1064nm. The integrateddepolarization ratio at 532nm is defined as the ratio of the cross-polarized signal to the co-polarized signal. .We also used AMSR-E/Aqua level 3 grided product at 12.5 km spatial resolution that providesa daily averaged sea ice concentration of the Arctic region [10], and MODIS/Aqua snow coverMYD10CM (level 3, monthly) [11] and snow albedo product MYD10A1 (level 3, daily) [12].

6. Y. Hu, K. Powell, et al, "Elevation information in tail (EIT) technique for lidar altimetry," Opt. Express, vol. 15, pp. 14504-14515,2007

7. X. Lu and Y. Hu, "Ice sheet surface elevation retrieval from CALIPSO lidar measurements," Proc. of SPIE Vol. 8731, pp.8. Y. Hu, K. Stamnes, M. Vaughan, J. Pelon, C. Weimer, D. Wu, M. Cisewski, W. Sun, P. Yang, B. Lin, A. Omar, D. Flittner, C. Hostetler,

C. Trepte, D. Winker, G. Gibson, and M. Santa-Maria, "Sea surface wind speed estimation from space-based lidar measurements,"Atmos. Chem. Phys., vol. 8, pp. 3593-3601, 2008 .

9. C. A.Hostetler, Z. Liu, J. Reagan, M. Vaughan, D. Winker, M. Osborn, W. H.Hunt, and K. A.Powell, "CALOP Algorithm TheoreticalBasis Document Calibration and Level 1 Data Products," vol. PC-SCI-201, 2006

10. http://nsidc.org/data/docs/daac/ae_si12_12km_tb_sea_ice_and_snow.gd.html11. https://nsidc.org/data/myd10cm12. https://nsidc.org/data/docs/daac/modis_v5/myd10a1_modis_aqua_snow_daily_global_500m_grid.gd.html.

CALIPSO/CloudSat 2016 Science Team MeetingNewport News, Virginia, March 1-3, 2016

The Cloud-Aerosol Lidar with Orthogonal Polarization (CALIOP), atwo-wavelength (532 nm and 1064 nm) polarization lidar (cross-polarized and co-polarized channels), is the prime payload instrumenton the Cloud-Aerosol Lidar and Infrared Pathfinder SatelliteObservations (CALIPSO) satellite. The CALIOP lidar was designed toprovide the observations necessary to improve our understanding of theimpact of clouds and aerosols on the Earth’s radiation budget andclimate [1] . Current analyses indicate a potential of CALIOP lidar forquantifying global ocean carbon stocks [2] and ocean subsurfacebackscatter [3-4] as well.

Although the primary objective of the CALIPSO mission has been studying theclimate impact of clouds and aerosols in the atmosphere. CALIPSO also collectsinformation about other components of the Earth’s ecosystem, such as oceans [3-4]and land [5-8].The objective of this study is to distinguish pond from snow/ice surfaces and openwater in the Arctic region from CALIPSO lidar measurements. Analysis shows thatattenuated backscatter color ratio and depolarization ratio are sensitive to thesesurface covers. Snow/or ice is brighter at 532nm than at 1064nm with the colorratio larger than 1 and depolarization ratio at 532nm larger than 0.6. Open water ismuch darker at 532 and 1064nm than other natural surfaces with depolarization

Ocean, land and snow surface characteristics

The 2D histogram of depolarization ratio and color ratio using the CALIOP lidar measurements at nighttime in 2010 for ocean, land andsnow/ice surfaces is shown in Fig. 1. The results of fig.1 show that the CALIPSO color ratio and depolarization ratio measurements can be usedfor surfaces classifications. For example, the permanent snow/ice surface has the depolarization ratio of about 0.77�0.07, and for the landsurface the depolarization ratio is about 0.37�0.09. The depolarization ratio of ocean surface is about 0.01�0.01.

ratio less than 0.2. The values of integrated attenuatedbackscatter and depolarization ratio of pond over snow/icesurfaces are between values of snow/ice surface and openwater surface. That is because the melt of snow coversignificantly changes the radiative balance of the surfacewith albedo dropping from ~0.8 for cold dry snow to 0.5 orless for ponds of melted snow on the ice, thus theattenuated backscatter decreases as snow/ice wetnessincrease. The depolarization ratio of pond is from 0.2 to 0.6with the color ratio between 1 and 1.5.

ConclusionCALIPSO land surface lidar measurements, such as depolarization ratio,color ratios can be used to understand land surface properties. Also, thesurface lidar measurements in the clear sky can be used as pond/or snowmelt observations in Arctic region, while it does not require any assumptionsfrom a space-based lidar. Results show that The depolarization ratio of pondis from 0.2 to 0.6 with the color ratio between 1 and 1.5.We will continue on the study of pond statistics properties for a given areaand an entire melt season.

Fig. 1. 2D histogram of Depolarization ratio and color ratio using the CALIOP lidar measurements at nighttime in 2010 for ocean (left), land(middle), and snow/ice surfaces (right).

γ λ = cρexp(−2τ )

δ = γ ⊥ /γ !

Pond Detection method

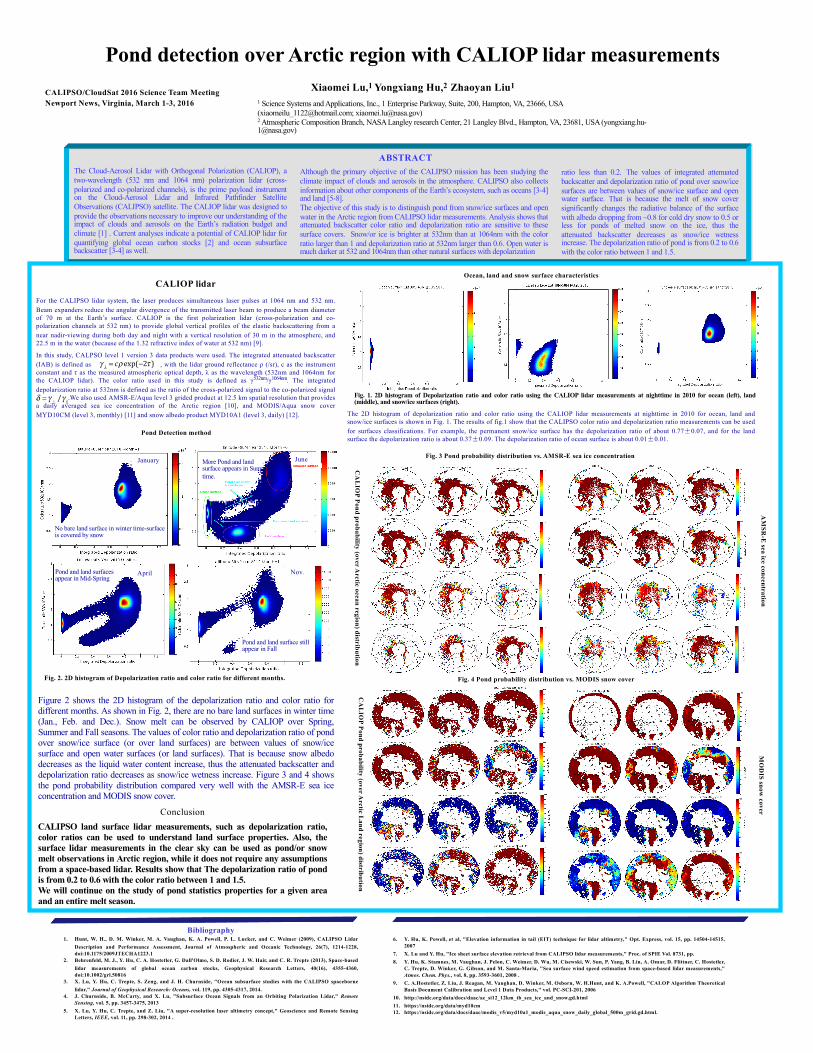
Figure 2 shows the 2D histogram of the depolarization ratio and color ratio fordifferent months. As shown in Fig. 2, there are no bare land surfaces in winter time(Jan., Feb. and Dec.). Snow melt can be observed by CALIOP over Spring,Summer and Fall seasons. The values of color ratio and depolarization ratio of pondover snow/ice surface (or over land surfaces) are between values of snow/icesurface and open water surfaces (or land surfaces). That is because snow albedodecreases as the liquid water content increase, thus the attenuated backscatter anddepolarization ratio decreases as snow/ice wetness increase. Figure 3 and 4 showsthe pond probability distribution compared very well with the AMSR-E sea iceconcentration and MODIS snow cover.

Fig. 2. 2D histogram of Depolarization ratio and color ratio for different months.

No bare land surface in winter time-surface is covered by snow

January

AprilPond and land surfacesappear in Mid-Spring

More Pond and land surface appears in Summer time.

June

Nov.

Pond and land surface still appear in Fall

Fig. 3 Pond probability distribution vs. AMSR-E sea ice concentration

Fig. 4 Pond probability distribution vs. MODIS snow cover

AM

SR-E

sea ice concentration

CA

LIO

P Pond probability (over Arctic ocean region) distribution

CA

LIO

P Pond probability (over Arctic L

and region) distribution

MO

DIS snow

cover