Embed Size (px)
Citation preview

UNIVERSITY OF NAPLES “FEDERICO II”
POLYTECHNIC SCHOOL AND OF BASIC SCIENCES
EDUCATIONAL AREA: MATHEMATICS, PHYSICS, NATURAL SCIENCES
PhD IN CHEMICAL SCIENCES
XXVI CYCLE
2011-2014
COURSE OF SYNTHESIS,STRUCTURE AND REACTIVITY OF
ORGANIC MOLECULES
Synthesis, properties and applications of bioinspired
nitrogen and/or group 16 aromatic heterocycles
DR. LOREDANA LEONE
Supervisor Assessor
Prof. Alessandra Napolitano Prof.Maria Rosaria Iesce
PhD Coordinator
Prof. Luigi Paduano
2
UNIVERSITA’ DEGLI STUDO DI NAPOLI
“FEDERICO II”
SCUOLA POLITECNICA E DELLE SCIENZE DI BASE
AREA EDUCAZIONALE:MATEMATICA, FISICA, SCIENZE NATURALI
DOTTORATO DI RICERCA IN SCIENZE CHIMICHE
XXVI CICLO
2011-2014
CORSO DI SINTESI, STRUTTURA E REATTIVITA’ DELLE MOLECOLE
ORGANICHE
Sintesi, proprieta’ e applicazioni di composti aromatici
eterociclici bioinspirati contenenti azoto e elementi del gruppo 16
DR. LOREDANA LEONE
Tutore Relatore
Prof. Alessandra Napolitano Prof.Maria Rosaria Iesce
Coordinatore
Prof. Luigi Paduano

3
Index
Abstract 6
1. Introduction 9
1.1. Overview of heterocyclic compounds containing nitrogen and
sulphur as biologically relevant compounds
9
1.2. Pheomelanin pigments: biogenesis and origin of the 1,4-
benzothiazine structural units.
26
2. Methods
2.1 EPR spectroscopy
2.2 Computational analysis
2.3 Time resolved fluorescence
3. Results and discussion
35
35
41
42
47
3.1. Photochromism and acidichromism of Δ2,2
-Bi-(2H-1,4-
benzothiazine).
47
3.2. Synthesis of 1,4-benzothiazines and investigation of their
oxidation reactivity
57
3.3. Oxidative coupling of 3-phenyl-(2H-1,4-benzothiazine)
promoted by peroxides or biometals.
66
3.4. Benzothiazine based cyanine dyes: a) synthesis and
characterization of dimeric cyanines.
78

4
3.5. Benzothiazine-based cyanine dyes: b)Cyanines by
condensation of benzothiazines with aldehydes
88
3.6. Role of benzothiazine structural units in pheomelanin
properties: UV-independent prooxidant effects of natural and model
pigments.
110
3.7. Photochemistry of pheomelanins: spectroscopic investigation
of benzothiazole building blocks
128
3.8. Photochemistry of pheomelanins: Spectroscopic investigation
of natural and synthetic pigments and related 1,4-benzothiazines
145
4. Conclusions 157
5. Experimental section
161
5.1. General methods
161
5.2 Photochromism and acidichromism of Δ2,2
-Bi-(2H-1,4-
benzothiazine).
165
5.3. Synthesis of 1,4-benzothiazines and investigation of their
oxidation reactivity
167
5.4. Oxidative coupling of 3-phenyl-(2H-1,4-benzothiazine)
promoted by peroxides or biometals.
169
5.5. Benzothiazine-based cyanine dyes: a) synthesis and
characterization of dimeric cyanines.
171

5
5.6. Benzothiazine-based cyanine dyes: b)Cyanines by
condensation of benzothiazines with aldehydes
174
5.7. Role of benzothiazine structural units in pheomelanin
properties: UV-independent prooxidant effects of natural and model
pigments.
180
5.8. Photochemistry of pheomelanins: spectroscopic investigation
of benzothiazole building blocks
184
5.9 Photochemistry of pheomelanins: Spectroscopic investigation of
natural and synthetic pigments and related 1,4-benzothiazines
187
6. References 189
Publication list
197

6
Abstract
A prominent position among naturally occurring N,S heterocyclic systems is occupied by 1,4-
benzothiazines that form the key structural unit of pheomelanin pigments responsible for the
red hair phenotype, typically found in red hair individuals with pale skin and enhanced
susceptibility to skin cancer and melanoma. The chromophore exhibited by these pigments has
been associated to the presence of the Δ2,2'
-bi-(2H-1,4-benzothiazine) system. This is an indigo
type chromophore which has not so far been fully exploited in the field of functional dyes. This
Δ2,2'
-bi-(2H-1,4-benzothiazine) exhibits a significant pH dependence, with a bathochromic shift
from red to blue in acids and a marked photochromism under sunlight with reversible
conversion in organic solvents of a yellow-orange species with abs max at 450 nm to a red one
with abs max at 480 nm. Another related chromophore based on a push pull system occurs in
the natural pigments cyanines, having organic nitrogen centers, one of the imine and the other
of the enamine type. Some of these cyanines are currently used as biological reporters and in
other technological applications .
In this PhD project the research activity has been focused on 1,4-benzothiazine systems.
Inspired by the peculiar properties of the chromophore exhibited by pheomelanin and natural
cyanines the access to new classes of dyes with potential technological applications has been
explored. The role of the benzothiazine structural units in the biological function of
pheomelanin pigment was also addressed.
Structural re-examination of the stable yellow isomer of 2,2’
-bibenzothiazine by an integrated
2D NMR and theoretical approach revealed that the stable yellow species is in fact the cis
isomer. A novel picture of 2,2’
-bibenzothiazine as a four-state system with photochromic and
pH-dependent behavior was proposed.
Stable 3-substituted 1,4-benzothiazines, namely the 3-phenyl- and the 3-methyl-2H-1,4-
benzothiazine were obtained by improvement of previously reported procedures in 50-60%

7
average yields.
When exposed to peroxides or biologically relevant metals at micromolar concentration and in
the presence of strong acids, 3-phenyl-2H-1,4-benzothiazine is efficiently converted to a green-
blue 2,2’
-bi(2H-1,4-benzothiazine) via colorless intermediates identified as single-bonded
dimers. A resonance-stabilized benzothiazinyl radical intermediate was evidenced and
characterized by EPR spectroscopy. Interestingly, 3-phenyl-2H-1,4-benzothiazine proved
useful for the visual detection of peroxides in aged ethereal solvents and an efficient inhibitor
against corrosion of the rusty iron objects induced by concentrated HCl.
Two different approaches were pursued for the synthetic access to benzothiazine cyanines, one
involving reaction with dialdehydes that may allow for the build-up of a conjugated bridge
between the two benzothiazine units and the other based on the condensation of the
benzothiazine with aromatic para N-alkyl substituted aldehydes. All these products showed a
marked pH dependence of the chromophores, associated in some cases to high molar extinction
coefficients (up to 18,000), and emission of fluorescence tunable with the pH conditions.
The chemistry of benzothiazine units accounting for the biological function of pheomelanin
pigments was also addressed. Though commonly regarded as photosensitizer agents capable of
amplifying generation of reactive oxygen species following UV radiation, recently,
pheomelanin has also been implicated in UV-independent pathways of oxidative stress. To get
an insight into these processes the reactivity of natural and synthetic pheomelanins toward
critical cellular antioxidants was investigated.
A marked ability of pheomelanin from red human hair, but not of eumelanin from black human
hair to reduce the levels of GSH and NADH was evidenced. In the absence of oxygen GSH and
NADH depletion was not observed while the presence of enzymes as superoxide dismutase and
catalase did not modify the effect of pheomelanin suggesting a ROS independent mechanism.
The mechanism of GSH oxidation by red hair pheomelanin was investigated by EPR
spectroscopy.

8
During a visit at the Department of Chemical Physics of Lund University (Sweden) in the
research unit headed by professor Sundstrom, the photochemistry of putative structural subunits
of pheomelanin including benzothiazoles, benzothiazine dimers and dihydroisoquinolines as
well as of the natural pigments and synthetic models was investigated. Steady state absorption
and emission spectra at different pHs showed marked differences that can be accounted for in
terms of the ionization state of the functional groups. Time resolved measurements under
different pH conditions allowed for identification of short lived species and characterization of
fast processes like intramolecular and solvent proton transfer that are primary processes of
excited state deactivation. Analysis of the results indicated the major role of the benzothiazine
units compared to benzothiazole and 3-substituted units in determining the behaviour of natural
pheomelanins.

9
1.Introduction
1.1 Overview of heterocyclic compounds containing nitrogen and
sulphur as biologically relevant compounds
Heterocyclic compounds containing nitrogen and elements of the 16 group mainly oxygen and
sulphur are widespread in nature and represent the core structural units of biologically active
compounds as well as of dyes and other functional systems that have raised interest in a variety
of fields.
Restricting to the most common five and six membered ring systems oxazoles, thiazoles, oxazine
and thiazine the most outstanding example of naturally occurring benzothiazole derivatives is
provided by the luciferins that fireflies use to generate light (bioluminescence) in a multistep
process mediated by luciferases (Figure 1).1
Figure 1. The luciferin-luciferase reaction

10
Several drugs include thiazole units like epothilones2 produced by the myxobacterium
Sorangium cellulosum So ce90 (Figure 2) , a new class of antimicrotubuline agents that display
improved potency against Taxol-resistant tumor cell lines.
Figure 2. Structure of Epothilones A-F
Additionally, thiazoles are frequently cropping up in peptide research. For example, the
pseudopeptide dolastatin 10 (Figure 3) is an exceptionally potent antineoplastic agent,3 and
other thiazole-containing marine cyclic peptides have demonstrated significant cytotoxicity.4
Figure 3. Structure of Dolastatin 10
Bengazole A (5) and related homologues isolated from marine sponges of the genus Jaspis are
remarkable examples of bisoxazole containing natural products 5 Bengazole A (Figure 4)
exhibits potent in vitro antifungal activity against Candida albicans 6 .

11
Figure.4 Structure of Bengazole A
The phenothiazine structure (Figure 5) occurs in various neuroleptic drugs,
e.g. chloropromazine7, and antihistaminic drugs, e.g. promethazine
8.
Figure 5. Phenothiazine drugs
The phenothiazine ring system appears prominently in dyes widely used for biological staining,
like thionine (Figure 6), a strongly staining metachromatic dye9 and structurally related
compounds.
Figure 6. Structure of thionine

12
Moreover, oxazine and thiazine dyes have found application as antimalarian drugs10
. (Figure 7)
Figure 7. Structure of some thiazine-based antimalarian drugs
Based on this overview it is clear that the N/S heterocycles offer a variety of opportunities for
research given their properties and biological activities. In this PhD project attention has been
focused on 1,4-benzothiazines that form a class of compounds occurring in nature whose
peculiar properties as illustrated in the following open the access to new classes of dyes with
potential technological applications.

13
1.1.2 The 1,4-benzothiazines
A prominent position among naturally occurring N,S heterocyclic systems is occupied by 1,4-
benzothiazines that form the key structural unit of pheomelanins the pigments responsible for
the red hair phenotype, typically found in individuals of Celtic origin, with red hair pale skin,
blue-green eyes and freckles. The chromophore exhibited by these pigments has been associated
to the presence of the Δ2,2'
-bi-(2H-1,4-benzothiazine), occurring in a group of low molecular
weight pheomelanins termed trichrochromes11
(Figure 8), but other benzothiazine containing
structures within the pigment contribute to the intense absorption in the visible region.
Figure 8. Structure of some benzothiazine compounds responsible for the visible absorption in
pheomelanin
The absorption properties of the benzothiazine occurring in pheomelanins have been extensively
investigated to define the commonly recognized role of these pigments to act as photosensitizer
determining ultimately the enhanced susceptibility of red hair individuals to actinic damage12,13
.

14
In this PhD project the research activity has been focused on 1,4-benzothiazine systems starting
from the Δ2,2'
-bi-(2H-1,4-benzothiazine) chromophore exhibited by the natural pheomelanin
pigments with the aim of exploring the access to new classes of dyes with potential technological
applications. The role of the benzothiazine structural units in the biological function of
pheomelanin pigment was also addressed. . Hence the results of the research work will be
presented following these two main lines of research that is 1) new dyes based on the 1,4-
benzothiazine system and 2 ) role of the 1,4-benzothiazine system in the properties of
pheomelanin pigments.
1.1.2 Functional dyes
The quest of organic chromophores exhibiting tailored electronic features has been extremely
active during the last decades. The term functional dyes first introduced in 1981 by a Japanese
group has been increasingly used to refer to a variety of molecules that have been newly
synthesized or re-appreciated because of their potential exploitation in high-technology (hi-tech)
applications different from the well-known traditional applications.14
Among such applications
particular interest has been focused on optoelectronics, such as dye sensitized solar cells,
photochromic materials, liquid crystal displays, and the newer emissive displays such as organic
light emitting devices; electronic materials, such as organic semiconductors; imaging
technologies, such as electrophotography (photocopying and laser printing), thermal printing,
and especially ink-jet printing; “invisible” imaging by using infrared absorbers in optical data
storage, computer-to-plate and security printing; biotechnology as dye-affinity chromatography
for the purification of proteins and enzymes; biomedical applications, such as fluorescent sensors
and anticancer treatments such as photodynamic therapy.

15
Typically, a number of different classes of molecules have been explored as sensitizers in dye
sensitized solar cells to replace the Rutenium complexes that are highly expensive.15
Such dyes
feature one or more electron donating structure linked through a conjugated bridge to electron
acceptors units as in the example shown in Figure 9:
Figure 9. Examples of structural classes designed for application as dye sensitized solar cells.
Other fields in which the potential of functional dyes has been explored include hybrid materials
from TiO2 or SiO2 nanoparticles and dyes exhibiting photochromic effects upon UV visible
irradiation for applications in photocatalysis.16
Organic/inorganic hybrids combining the
chemical and thermal resistance properties of microporous mineral substrates and the color of the
organic molecule have been explored to obtain stable and durable organic dyes; 17
inclusion in
zeolites of solvatochromic dyes may provide highly sensitive vapour and chemical sensing tools.
18

16
In all these fields biological chromophores representing the functional units of light harvesting
systems or plant pigments have often been considered as a valuable inspiration or a starting basis
in the design of the novel compounds. In addition to chemical stability and intense absorption in
the visible region, the design of functional dyes is focused on single molecule or polymer
systems exhibiting photochromic, solvatochromic properties or any change of the chromophoric
properties associated to modification of external parameters or aggregation state.
The most widely investigated classes of organic photochromes are based on the ring
opening/ring closure reactions in photoinduced electrocyclic reactions like in the case of
dithienylethenes, spiropyran, spiroxazines, naphthopyrans. In these, the UV irradiation of the
colorless forms results in the electrocyclic ring opening with generation of isomeric open forms
merocyanines that are intensely colored because of their extended conjugation 19
(Figure10)
Figure 10. Mechanism of photoinduced ring opening to merocyanine dyes and some
representative examples of photochromic switch families.

17
This property has several applications including implementation of optical data storage materials
as shown in Figure 11 for naphthopyran included into a rigid polymeric matrix 20
.
Another example of photochromic compounds is provided by synthetic flavylium salts,
benzopyrilium derivatives structurally close to anthocyanins. Their photochromism is based on
the photoinduced trans cis isomerization reaction that produces the cis form that undergoes ring
closure to form the flavylium form. The picture of Figure 12 shows photochromic gels in the
visible region prepared by the incorporation of flavylium salts in a gelator polymer . The
chromophore switches from its yellow chalcone form to the red flavylium cation upon
irradiation21
.
Figure 11. Writing and erasing based on the reversible photochromism of a spiroxazine linked to
a polymer matrix.

18
Figure 12 Photochromic gels in the visible region obtained by incorporation of synthetic
flavylium compounds into a polymeric gelator.
1,10-fused ring phenothiazine dyes of the type shown in Figure 13 have been proposed as new
kind of solvent sensitive fluorescent dyes with unique sensitivity of strongly fluorescence in
protic solvents than in aprotic solvents 22
.
Figure 13.Solvent sensitive fluorescent dyes from 1,10-fused ring phenothiazine dyes
1.1.3 The indigo chromophore
A class of chromophoric systems of potential practical interest but so far little explored in
materials science is represented by indigoid nitrogenous heterocycles. The indigo chromophore
contains two donor X ( S, or NH) and two acceptor groups (=O) arranged as shown to form a
doubly cross-conjugated push pull system (Figure 14).

19
Figure 14. The Indigo chromophore
This class of cromophores includes indigo occurring in the Indigofera tinctoria in the form of the
O-glucoside and the 6,6’dibromoindigo that is the tyrian purple, a secretion produced by certain
species of predatory sea snails in the family of Muricidae, a type of rock snail by the name
Murex The synthetic variant thioindigo is widely used for dying polyester fabrics.
1.1.4 The Δ2,2'
-bibenzothiazine chromophore
The Δ2,2'
-bi-(2H-1,4-benzothiazine) chromophore featured by trichochromes is closely related to
indigo (Figure 15 ).
Figure 15. Δ2,2'
-bi-(2H-1,4-benzothiazine) and trichochromes structures.
In addition to 2H-1,4-benzothiazine, the trichochromes include also the 3-oxobenzothiazine ring
system, which lowers the electron acceptor character of the imine group.
20
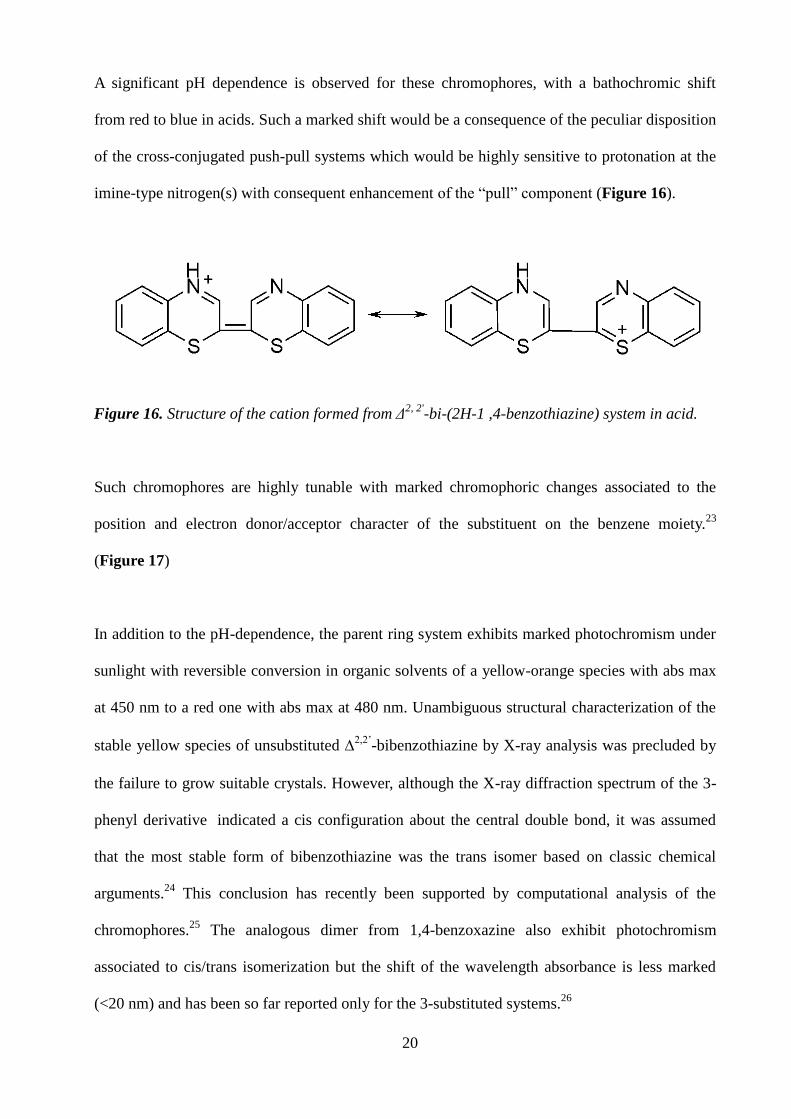
A significant pH dependence is observed for these chromophores, with a bathochromic shift
from red to blue in acids. Such a marked shift would be a consequence of the peculiar disposition
of the cross-conjugated push-pull systems which would be highly sensitive to protonation at the
imine-type nitrogen(s) with consequent enhancement of the “pull” component (Figure 16).
Figure 16. Structure of the cation formed from Δ2, 2'
-bi-(2H-1 ,4-benzothiazine) system in acid.
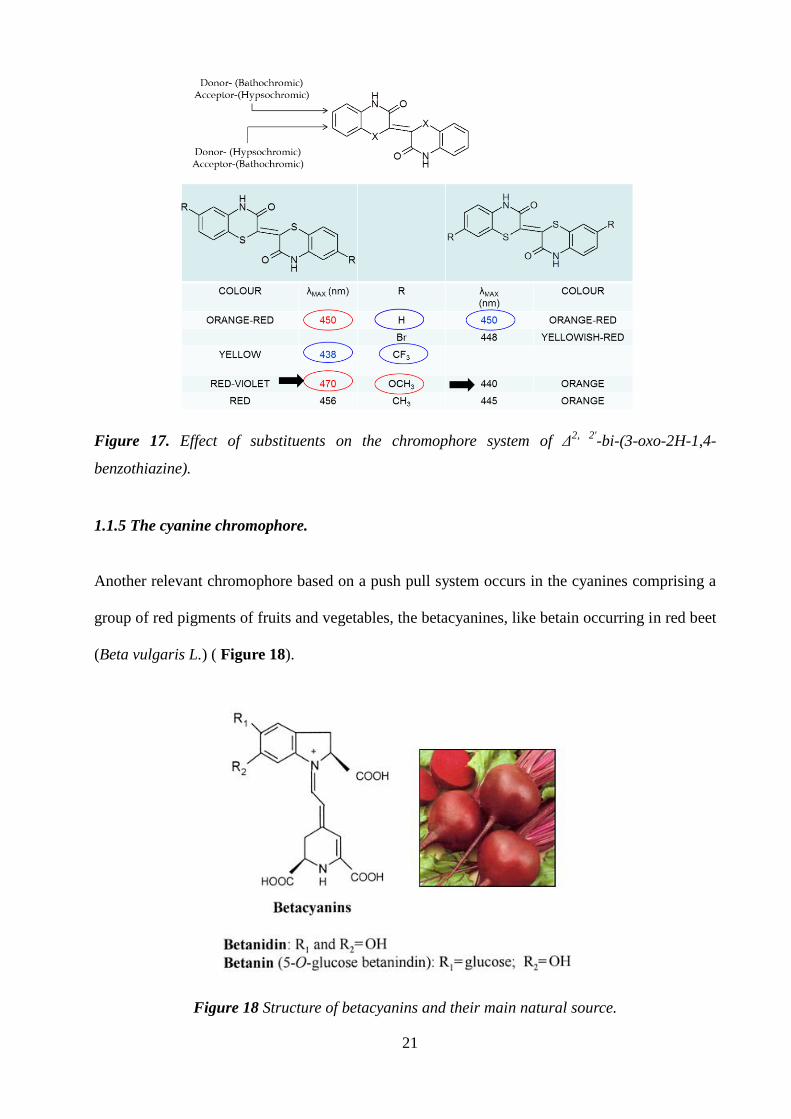
Such chromophores are highly tunable with marked chromophoric changes associated to the
position and electron donor/acceptor character of the substituent on the benzene moiety.23
(Figure 17)
In addition to the pH-dependence, the parent ring system exhibits marked photochromism under
sunlight with reversible conversion in organic solvents of a yellow-orange species with abs max
at 450 nm to a red one with abs max at 480 nm. Unambiguous structural characterization of the
stable yellow species of unsubstituted 2,2’
-bibenzothiazine by X-ray analysis was precluded by
the failure to grow suitable crystals. However, although the X-ray diffraction spectrum of the 3-
phenyl derivative indicated a cis configuration about the central double bond, it was assumed
that the most stable form of bibenzothiazine was the trans isomer based on classic chemical
arguments.24
This conclusion has recently been supported by computational analysis of the
chromophores.25
The analogous dimer from 1,4-benzoxazine also exhibit photochromism
associated to cis/trans isomerization but the shift of the wavelength absorbance is less marked
(<20 nm) and has been so far reported only for the 3-substituted systems.26
21
Figure 17. Effect of substituents on the chromophore system of Δ2, 2'
-bi-(3-oxo-2H-1,4-
benzothiazine).
1.1.5 The cyanine chromophore.
Another relevant chromophore based on a push pull system occurs in the cyanines comprising a
group of red pigments of fruits and vegetables, the betacyanines, like betain occurring in red beet
(Beta vulgaris L.) ( Figure 18).
Figure 18 Structure of betacyanins and their main natural source.

22
The term cyanine is now used to refer to a broad class of dyes having organic nitrogen centers,
one of the imine and the other of the enamine type, which may be included into an heterocyclic
system, linked through a variable number of double bonds, also called the methyne chain,
generally in the trans configuration (Figure 19). The most common heterocyclic systems that can
be found in cyanine dyes, are quinoline, benzoquinoloine, benzimidazole, pyridine,
benzothiazole, benzoxazole, indole, benzindole , etc.
Cyanine dyes are also called monomethine, trimethine, pentamethine and heptamethine, based
on the for n= 0,1 ,2 and 3 respectively.
Figure 19. Some groups of cyanines.
Cyanine dyes have a relatively good stability, high molar absorption coefficients ( ~105
M.-1
cm-
1) and medium fluorescence intensity.
For heterocyclic containing cyanine dyes, they can be also classified in symmetrical and
unsymmetrical , if the nature of the aromatic groups connecting the ring structures joined by the
I = Streptocyanine,
II = Emicyanine,
III = cyclic cyanine

23
methine chain are not the same. A number of cyanine systems featuring symmetric or
asymmetric scaffolds have been synthesized (Figure 20).
Figure 20. Examples of asymmetric cyanines.
Some of these cyanines, like the indoline cyanines are commercially available, and exhibit very
high molar extinction coefficients (ranging from 150,000 to 250,000 M-1
cm-1
) and an intense
fluorescence emission (Figure 21).
Figure 21. Structure and absorption emission spectra of indoline cyanines.

24
Because of these properties cyanine dyes are used in several fields including biology in the form
of biomolecule conjugates (proteins, nucleic acids) to act as fluorescence reporters, laser
technologies, as well as analytical applications. As an example, the acidichromism of a peculiar
class of cyanines, the merocyanines has been exploited for the sensing of anions in organic
solvents or water/organic solvents mixtures 27
(Figure 22)
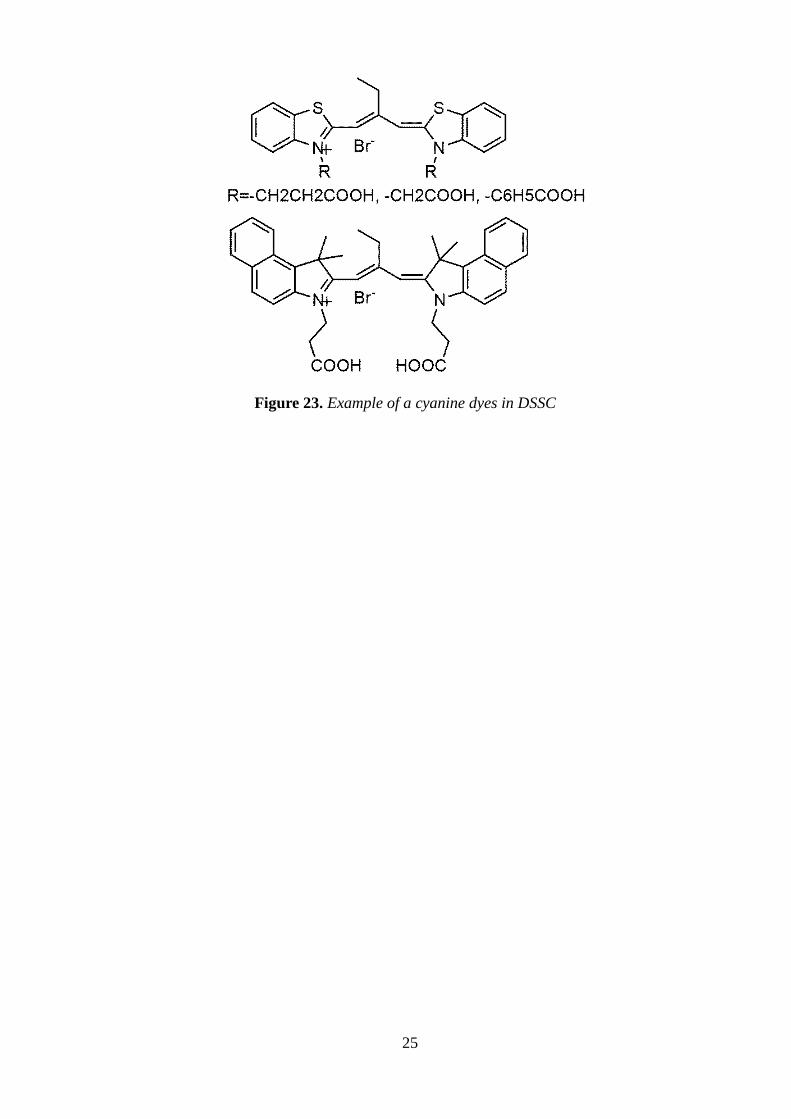
Cyanine dyes can also be employed as sensitizers in DSSC , dye-sensitized solar cells28
(Figure
23) , as an alternative to expensive heavy-metal-based polypyridil complexes, because of their
large absorption coefficientes, easy preparation, low cost, with no need to use precious metal
resources easy handling and the absorption spectrum can be finely tuned by tailoring their
stuctures.
Figure 22. Some merocyanine dyes and their color changes in the presence of different anions .
Solutions in trichloromethane of (a) dyes 1a–3a, (b) 1b–3b, the protonated forms , and
protonated dyes in the presence of (c) CN- , (d) Cl
-, (e) Br
-, (f) I
-, (g) H2PO4
-, (h) HSO4
-, (i) NO3
-,
and (j) F-,as tetra-n-butylammonium salts.
25
Figure 23. Example of a cyanine dyes in DSSC

26
1.2 Pheomelanin pigments: biogenesis and origin of the 1,4-
benzothiazine structural units.
The pigments responsible for the red hair phenotype, pheomelanin, typically found in
individuals of Celtic origin, with red hair pale skin, blue-green eyes and freckles, have always
stimulated the curiosity of researchers. In recent years, interest in these pigments has been
renewed by clinical data suggesting association of a fair complexion and red hair in Caucasians
with an abnormal susceptibility to actinic damage and skin cancer 12,13
. The biogenetic
relationship with the other more widely diffused group of epidermal melanin pigments,
eumelanin ,determining black pigmentation was first recognized in the 1960s by Prota and
Nicolaus29
, who proposed that red hair pigments might be formed in vivo by some deviation of
the normal course of melanogenesis involving cysteine, which would have explained the
common origin of dark and red melanins in melanocytes.
Yet, the factors controlling prevalence of either pathway have remained unclear for a long time.
A fundamental breakthrough came in 1995 with the discovery that people with red hair display
mutations in the human melanocortin 1 receptor (MC1R), similarly to what was seen in the case
of mouse coat models.30
The mc1r gene encodes a 317–amino acid G-coupled receptor, MC1R.
Human mc1r sequence variants are associated with red hair and fair skin in the Caucasian
population.31-33
These variant alleles are extremely common and in northern European
populations <50% of the mc1r genes encode the ‘wild-type’ or consensus protein. Three alleles
in particular, Arg151Cys, Arg160Trp and Asp294His together make up 22% of the mc1r genes
and account for 60% of all cases of red hair.33
Thus, a single locus, can contribute significantly to
human pigmentary variation.
In wild-type eumelanic subjects, MC1R activation induces eumelanin synthesis via tyrosinase
activation (Figure 24). Among red haired individuals, homozygous for alleles of the mc1r gene

27
can be found, that show varying degrees of diminished function. The main consequence is a
decrease in the amount of eumelanin pigments with prevalence of the pheomelanin variant. At
the biochemical level, this change is the result of the drop in tyrosinase activity favoring the
concomitant intervention of cysteine in the pathway.34
Non-enzymatic addition of the SH group
to the oxidation product of tyrosine, dopaquinone, leads to the formation of isomeric
cysteinyldopas.35-37
As a result, the intramolecular cyclization pathway of 5,6-dihydroxyindole
formation leading to eumelanin polymers is inhibited, and an alternate 1,4-benzothiazine route to
pheomelanins and trichochromes becomes dominant.
Figure 24. The melanocortin 1 receptor (MC1R), the tyrosine/tyrosinase pathway and their role
in human and mammalian pigmentation.

28
In the later stages of pheomelanogenesis oxidation of 5SCD followed by intramolecular
cyclization would then lead to the generation of a transient o-quinoneimine which can either
undergo redox exchange with the parent cysteinyldopa to give a dihydrobenzothiazine or
isomerize with or without concomitant decarboxylation to give 2H-1,4-benzothiazine derivatives
(Scheme 1). Notably, when the reaction is carried out in the presence of zinc ions,
decarboxylation of the quinoneimine is substantially inhibited, and the 3-carboxy derivative is
the main product which persists in the reaction medium for relatively long periods of time due to
the stabilizing effect of the metal.
Scheme 1. Origin of the benzothiazine system via intramolecular cyclization of cysteinyldopa.
Just formed, the 2H-1,4-benzothiazine derivatives may follow diverse routes reflecting the
presence or the absence of the carboxyl group on the 3-position, and the specific reaction
conditions.

29
Scheme 2 illustrates the variety of structural scaffolds that have been identified by oxidative
conversion of cysteinyldopa and/or of related 1,4-benzothiazines under different biomimetic
conditions. Alkaline or hydrogen peroxide treatment of 1,4-benzothiazines leads to a stable 3-
oxo derivative as in path a.38-40
Complex oligomers like those indicated in path b are produced by
peroxidase/H2O2 oxidation of cysteinyldopa after reductive treatment, suggesting formation of
benzothiazine intermediates that would then couple through C-C and C-O bonds at the benzene
moieties.41
Scheme 2. Overall view of the molecular scaffolds that may originate from biomimetic chemistry
of 1,4-benzothiazine compounds

30
Tyrosinase-catalyzed oxidation of cysteinyldopa follows an alternate pathway, as in c, in which
an unusual cycloaddition process apparently takes place involving both benzothiazine and
quinoneimine intermediates.42
It should be noticed that routes b and c have so far been observed
only in biomimetic chemical studies, so their interest would be mainly in relation to the reaction
behavior of cysteinyldopa-derived benzothiazine systems rather than to a possible relevance to
natural pheomelanin buildup. An intriguing oxidative dimerization process (path d) can be
observed by spontaneous oxidation under mild condition.43
Further oxidative steps lead to unusual bibenzothiazine derivatives commonly referred to as the
trichochromes. These latter comprise four main variants, two of which consist of symmetric
bibenzothiazine derivative (trichochromes E and F) while the other two are mixed systems
(trichochromes B and C).11
The trichochromes were originally discovered in red human hair and
are known to arise from cysteinyldopas, mainly the 5-S-isomer, but their mode of formation, the
direct precursors and actual biological relevance remain little defined. Trichochrome formation
by oxidation of 5-S-cysteinyldopa has been reported to be a minor process which is dramatically
enhanced under strongly acidic, non-natural conditions, suggesting a possible artifactual
generation under the harsh acidic conditions used for pheomelanin extraction from red hair.
Model studies43
showed that trichochrome generation from 5-S-cysteinyldopa is favored in the
presence of zinc ions, which are typically found in skin and hair, suggesting a possible role of
this metal in vivo.
By far, one of the most typical, chemically and biologically relevant characteristic of the 2H-1,4-
benzothiazines is their tendency to undergo ring contraction either spontaneously or following
UV irradiation to give benzothiazole products as in path e.
Facile conversion to benzothiazoles is an important feature of benzothiazine chemistry. Pending
mechanistic issues should incite investigation of this transformation which is triggered or
mediated by a variety of factors including UV light, oxidizing agents, metal cations.

31
1.2.1 Photochemical properties of pheomelanin
Although extensive epidemiological and biological studies over more than half a century have
shown that mutation at several pigmentation genes is involved in predisposition to skin cancer
and melanoma,44
red hair and a fair complexion associated with high levels of pheomelanins
have traditionally been regarded as a most important risk factor.45
This familiar observation has
prompted intense studies aimed to understand the (photo)chemical behavior of pheomelanins and
to assess the possible causal role of these pigment in UV susceptibility and skin cancer
development. A commonly held view is that pheomelanins may act as potent UV
photosensitizers leading to intense production of reactive oxygen species (ROS) which
contribute directly to the increased susceptibility of red haired individuals to actinic damage and
skin cancer. This concept was pioneered by Chedekel et al.46
and has spurred unabated interest
in the photochemical and photobiological properties of pheomelanins.47-50
Experiments on congenic mice of black, yellow, and albino coat colors after exposure to
predominantly UVB (280–320 nm) or UVA (320–400 nm) radiation have shown that
pheomelanin had 3-fold greater specific activity in photosensitizing adjacent cells to caspase-3
independent apoptosis, and this occurs at a frequency greater than the apoptosis induced by UV
absorption on DNA.50
Simon and coworkers demonstrated that different molecular components may be involved in the
transient absorption, emission and oxygen photoconsumption responses of pheomelanin.51-53
Moreover, pheomelanin-containing melanosomes from human hair were shown to display low
photo-ionization threshold values relative to eumelanins54
supporting a possible role of
pheomelanins in the onset of UV-induced skin cancer in redheads.
The characteristic absorption and photochemical properties of pheomelanins are generally
attributed to ‘‘benzothiazine’’ structural units derived biogenetically from 5-S-cysteinyldopa.

32
This notion, however, conveys little or no information about the structural chromophores
responsible for the photoreactivity of pheomelanins.
At pH 7.4, natural and synthetic pheomelanins show a defined maximum around 305 nm, which
is not affected by reductive treatment with sodium borohydride, and a monotonic decrease in the
absorption in the range 350–550 nm. These features are not compatible with a significant
proportion of structural units related to 2H-1,4-benzothiazine and 2H-1,4-benzothiazine-3-
carboxylic acid, the early borohydride reducible pheomelanin precursors featuring absorption
maxima above 340 nm. Rather, these features would better accommodate a contribution by the
nonreducible 3-oxo-3,4-dihydrobenzothiazine (max 299 nm) and benzothiazole (max 303 nm)
structural motifs, which are generated in the later stages of pheomelanogenesis in vitro.
Recently, the first ultrafast absorption spectroscopy measurements for synthetic pheomelanin
have been reported, and have highlighted the fast generation of a transient species with an
absorption maximum centered at 780 nm55
. This species has been attributed to a photoexcitation
product whose action spectrum peaks in the range between 350 and 360 nm, thus resembling the
reported absorption spectrum of benzothiazines. It was argued that the reactive chromophore of
pheomelanins is of low molecular weight but is present and exhibits similar photophysics in the
aggregated state, and may be adequately described in terms of ‘‘benzothiazine’’ structural motifs
which are biogenetically derived from the key pigment precursor, 5-S-cysteinyldopa56
.
It must be noted, however, that the occurrence of benzothiazine units in the pheomelanin
backbone is largely a matter of surmise, and has so far lacked direct and unambiguous
experimental support. Moreover, the term ‘‘benzothiazine’’ is commonly associated with a broad
range of structural motifs which exhibit however different chromophoric features. Nonetheless,
this notion has become a central axiom in pheomelanin research and has in part been built upon
the identification of trichochromes, featuring the peculiar 2,2
-bi(2H-1,4-benzothiazine)
skeleton11
. The configuration of the double bond in these pigments and the associated
chromophoric features have recently been reexamined by computational analysis25
. Similar to
33
pheomelanins, trichochromes exhibit a marked photoreactivity and the possibility to access to
multiple electronic states upon UV and visible photoexcitation 57
.
Though commonly cited among the primary determinants of the red colorations of hair in the
true ‘‘pheomelanic’’ phenotype, the trichochromes themselves have been a subject of
controversy and even their actual occurrence in human hair tissues has been questioned. In fact,
trichochrome formation by oxidation of 5-S-cysteinyldopa has been reported to be a minor
process which is dramatically enhanced under strongly acidic, non natural conditions, suggesting
a possible artifactual generation under the harsh acidic conditions used for pheomelanin
extraction from red hair58
.
1.2.2.Pheomelanin in the dark
A further issue of great relevance to the mechanisms of toxicity associated to pheomelanic
pigmentation has recently been disclosed by a series of papers that claimed identification of UV -
independent pathway for the induction of melanoma.59-62
Actually, compelling evidence for a
direct relationship between sun exposure and melanoma is still missing, and issues have been
raised of why, at variance with other forms of skin cancer, melanoma is not restricted to sun-
exposed areas of the body, and ultraviolet radiation signature mutations are infrequently
oncogenic drivers. Experiments have been described showing that induction of an activating
mutation in the melanoma oncoprotein kinase BRAF into red mice carrying an inactivating
mutation in the Mc1r gene resulted in a high incidence of invasive melanomas in the absence of
UV stimulation44
. Moreover, the same study demonstrated that the skin of pheomelanic mouse
contained higher levels of oxidative DNA and lipid damage than albino-Mc1re/e mouse skin.
These data clearly showed a strong association between pheomelanin and oxidative stress;
however the actual mechanisms implicated in pheomelanin-induced UV-independent oxidative
stress, DNA damage and melanomagenesis have remained unclear. In a related paper62
two

34
possible not mutually exclusive pathways by which the pheomelanin pathway could mediate
oxidative stress and melanomagenesis were postulated:
1) although pheomelanin is not located in the nucleus, it might cause damage by promoting the
formation of ROS which could overwhelm cellular antioxidant reserves and cause oxidative
damage to biomolecules including free nucleobases in the cytosol;
2) the pheomelanin biosynthetic pathway depletes cysteine-based cellular antioxidants making
the cell more vulnerable to elevated ROS levels. A hint to the peculiar properties of
pheomelanins in the dark was provided by a recent work showing that synthetic pheomelanins
can behave as pro-oxidant promoting formation of melanin pigments from catecholamines and
dopa, a process requiring the presence of oxygen.63

35
2.Methods
The research work developed during this PhD project was carried out also through several
collaborations with other research groups. The different experimental and computational
methodologies that were used and led to the results presented in this thesis are briefly
summarized in the following
2.1 EPR spectroscopy
Electron paramagnetic resonance spectroscopy (EPR) is a powerful tool for investigating
paramagnetic species, including organic radicals, inorganic radicals, and triplet states. The basic
principles behind EPR are very similar to the more ubiquitous nuclear magnetic resonance
spectroscopy (NMR), except that EPR focuses on the interaction of an external magnetic field
with the unpaired electron(s) in a molecule, rather than the nuclei of individual atoms.
From an applicative point of view almost all pure substances contain magnetic nuclei and are
thus accessible to NMR spectroscopy, while only few pure substances contain unpaired electrons
and are thus accessible to EPR spectroscopy. This is because chemical binding is based on
electron pair formation with spin cancellation. Most stable compounds are thus diamagnetic,
while the compounds that can be seen by EPR have to be paramagnetic.
As known, a molecule or atom has discrete states, each with a corresponding energy. The
energy differences between the atomic or molecular states is what is being measured in a
spectroscopic experiment. It is possible to measure these energy differences, ΔE, according to
Planck's law, which states that electromagnetic radiation will be absorbed if:

36
ΔE = hn
where h is Planck's constant and n is the frequency of the radiation. The absorption of energy
causes a transition from the lower energy state to the higher energy state.
The energy differences studied in EPR spectroscopy are predominately due to the
interaction of unpaired electrons in the sample with a magnetic field produced by a magnet . This
effect is called the Zeeman effect. Because the electron has a magnetic moment, it acts like a bar
magnet when you place it in a magnetic field, B0. It will have a state of lowest energy when the
moment of the electron, µ, is aligned with the magnetic field and a state of highest energy when
µ is aligned against the magnetic field. The two states are labeled by the projection of the
electron spin, Ms, on the direction of the magnetic field. Because the electron is a spin ½ particle,
the parallel state is designated as Ms = - ½ and the antiparallel state is Ms = + ½. From quantum
mechanics, the most basic equations of ESR is obtained:
E = gµBB0MS = ±½gµBB0
and
ΔE = hn = gµBB0
g is the g-factor, which is a proportionality constant and equal to 2.0023 for most
samples, but which varies depending on the electronic configuration of the radical or ion. µB is
the Bohr magneton, which is the natural unit of electronic magnetic moment.
Because the energy differences between the two spin states can be changed by varying
the magnetic field strength, there are alternative means to obtain spectra. It is possible to apply a
constant magnetic field (Figure 25) and scan the frequency of the electromagnetic radiation as
in conventional spectroscopy. Alternatively, it is possible to keep the electromagnetic radiation

37
frequency constant and scan the magnetic field. A peak in the absorption will occur when the
magnetic field tunes the two spin states so that their energy difference matches the energy of the
radiation. This field is called the field for resonance.
Figure 25. Variation of the spin state energies as a function of the applied magnetic field .
The field for resonance is not a unique fingerprint for identification of a compound
because spectra can be acquired at several different frequencies. Being independent of the
microwave frequency, the g-factor g = hν/(µBB0) is much better for that purpose.
Measurement of g-factors can give us some useful information; although it does not tell
us much about the molecular structure of our sample. However, the unpaired electron, which
gives the ESR spectrum, is very sensitive to its local surroundings. The nuclei of the atoms in a
molecule or complex often have a magnetic moment, which produces a local magnetic field at
the electron. The interaction between the electron and the nuclei is called the hyperfine
interaction. It gives us a wealth of information about our sample such as the identity and number
of atoms which make up a molecule or complex as well as their distances from the unpaired
electron.

38
Figure 26 depicts the origin of the hyperfine interaction. The magnetic moment of the nucleus
acts like a bar magnet and produces a magnetic field at the electron, B1. This magnetic field
opposes or adds to the magnetic field from the laboratory magnet, depending on the alignment of
the moment of the nucleus.
Figure 26. Local magnetic field at the electron, B1, due to a nearby nucleus .
When B1 adds to the magnetic field, we need less magnetic field from our laboratory
magnet and therefore the field for resonance is lowered by B1. The opposite is true when B1
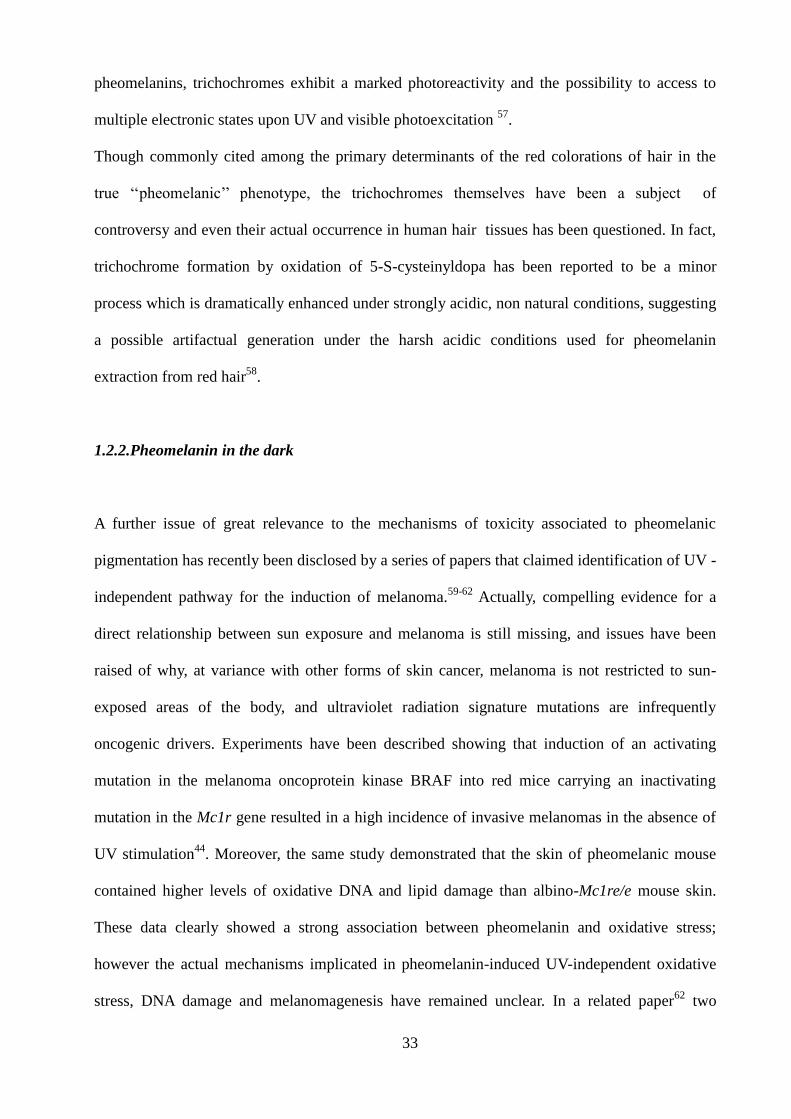
opposes the laboratory field. For a spin ½ nucleus such as a hydrogen nucleus, it is possible to
observe that the single EPR absorption signal splits into two signals which are each B1 away
from the original signal, as shown in Figure 27.
If there is a second nucleus, each of the signals is further split into a pair, resulting in four
signals. For N spin 1/2 nuclei, 2N ESR signals will be generally observed. As the number of
nuclei gets larger, the number of signals increases exponentially. Sometimes there are so many
signals that they overlap and we only observe the one broad signal.
39
Figure 27. Splitting in an ESR signal due to the local magnetic field of a nearby nucleus .
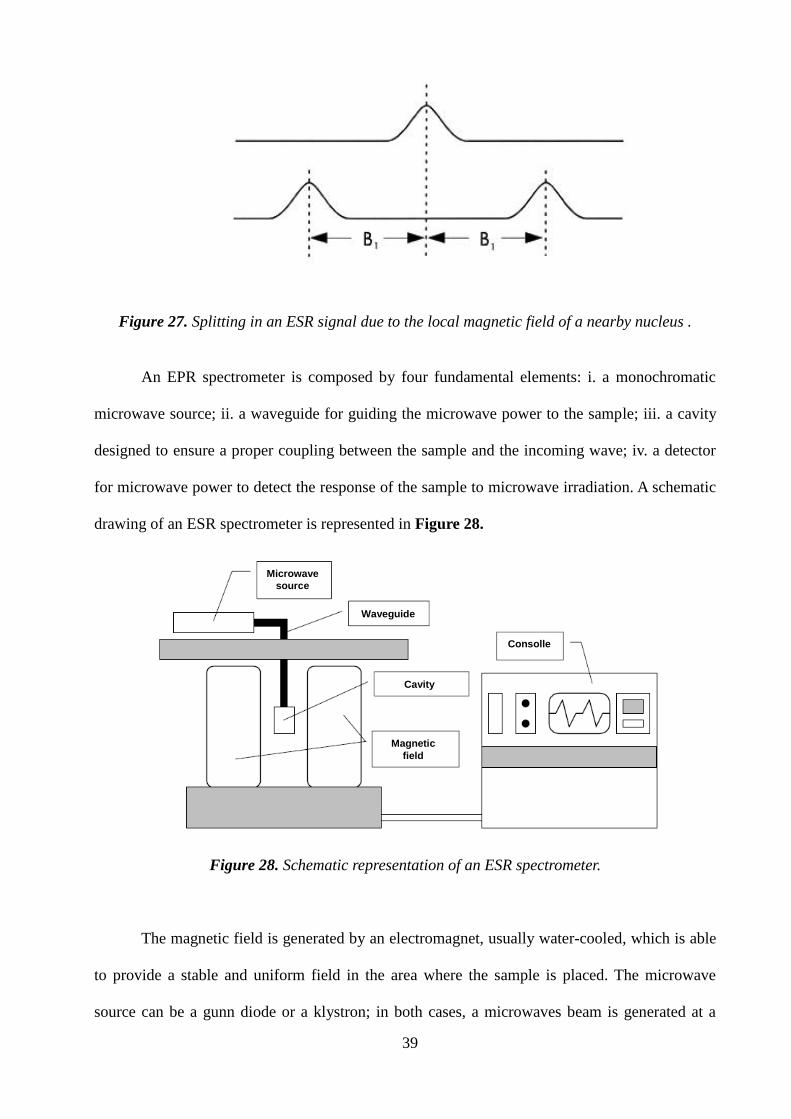
An EPR spectrometer is composed by four fundamental elements: i. a monochromatic
microwave source; ii. a waveguide for guiding the microwave power to the sample; iii. a cavity
designed to ensure a proper coupling between the sample and the incoming wave; iv. a detector
for microwave power to detect the response of the sample to microwave irradiation. A schematic
drawing of an ESR spectrometer is represented in Figure 28.
Figure 28. Schematic representation of an ESR spectrometer.
The magnetic field is generated by an electromagnet, usually water-cooled, which is able
to provide a stable and uniform field in the area where the sample is placed. The microwave
source can be a gunn diode or a klystron; in both cases, a microwaves beam is generated at a
Microwave
source
Cavity
Consolle
Waveguide
Magnetic
field

40
fixed frequency between 9 and 10 GHz (X-band). This generated microwave beam goes to the
sample and is then sent through the waveguide. The cavity, in which the sample is placed, is at
the center of the two magnetic field poles and receives the microwaves through the waveguide.
The cavity is designed in order to get inside a regular distribution of the magnetic field lines
generated by the electromagnetic radiation coming from the source and perpendicular to the
static magnetic field generated by a solenoid. Finally, the “consoles” is the interface between the
spectrometer and the user from which it is possible to make all the settings and set the
parameters for the spectra recording.
In this PhD project , some EPR measurement were needed in order to identificate radical
intermediates or to characterize radical species. These experiments were carried out in
collaboration with both Dr. Gerardino D’Errico of the Dept. of Chemical Sciences of University
of Naples “Federico II” and Dr. Luca Valgimigli of the Department of Chemistry “Ciamician”,
University of Bologna.
In detail the EPR experiments carried out in Bologna were as follows:
X-band EPR spectra were collected at 298 K in a CW spetrometer equipped with a variable
temperature unit, after mixing a solution of the sample in open (presence of atmospheric oxygen)
suprasil quartz bulbe with 1 mm i.d. To increase S/N ratio up to 8 spectra were accumulated and
digitally averaged.
Whereas the measurement performed in Neaples were recorded using a Bruker spectrometer.
The instrumental settings were as follows: sweep width, 160.0 G; resolution, 1024 points;
modulation frequency, 100.00 kHz; modulation amplitude, 5.0 G. The amplitude of the field
modulation was preventively checked to be low enough to avoid detectable signal
overmodulation. EPR spectrum was measured with a microwave power of 6.394 mW to avoid
microwave saturation of resonance absorption curve. Several scans, typically 128, w ere
accumulated to improve the signal-to-noise ratio.

41
2.3 Computational analysis
The computational analysis needed in this PhD project were performed by Professor Orlando
Crescenzi of the Dept. of Chemical Sciences of University of Naples “Federico II”. All
calculations were performed with the Gaussian package of programs.64
Geometry optimizations
were carried out at the DFT level, with a hybrid functional (PBE0)65
and a reasonably large basis
set [6-31+G(d,p)]. For each species, different tautomers/conformers were explored.
Computations were performed either in vacuo, or by adoption of a polarizable continuum
medium (PCM) 66
to account for the influence of the solution environment. In view of the faster
convergence, a scaled van der Waals cavity based on universal force field (UFF) radii67
was
used, and polarization charges were modeled by spherical Gaussian functions68
. Vibrational-
rotational contributions to the free energy were also computed. Additional energy computations
were performed for the neutral form in vacuo at the MP2 level with different basis sets, and at
the CBS-QB3 level. UV/Vis spectra of the main species were computed in vacuo or in solution
using the time-dependent density functional theory (TD-DFT) approach69
, with the PBE0
functional and the 6-311++G(2d,2p) basis set. To produce graphs, transitions below 5.6 eV were
selected, and an arbitrary Gaussian line width of 0.15 eV was imposed; the spectra were finally
converted to a wavelength scale. NMR shielding tensors were computed within the Gauge-
Including Atomic Orbitals (GIAO) ansatz70
at the PBE0/6-311+G(d,p) level. Computed isotropic
shieldings were converted into chemical shifts using as reference the values obtained at the same
level for benzene.

42
2.3 Time-resolved fluorescence
During my three month visit at the Department of Chemical Physics at Lund University in
Sweden , I carried out different experiments on a number of samples, in order to investigate
their excited state behavior. This work, in collaboration with Professor Villy Sundstrom and
Amal El-Nahhas, allowed me to learn the basic principles underlying time-resolved
fluorescence measurement and to familiarize with the advanced laser instruments of the LLC
(Lund Laser Center) .
Here are some details about the streak camera,the detector used for the time-resolved
experiments
The streak camera is an ultra high-speed detector which captures light emission phenomena
occuring in extremely shorttime periods. It measure ultra-fast light emitting phenomena and
delivers intensity vs time vs positions (or wavelength) information. No other instruments which
directly detect ultra-fast light phenomena have better temporal resolution than the streak
camera.
Since the streak camera is a two dimensional device, it can be used to detect several tens of
different light channels simultaneously. For example, used in ombination with a spectroscope,
time variation of the incident light intensity with respect to wavelength can be measured (time
resolved spectroscopy). Used in combination with proper optics, it is possible to measure time
variations of the incient light with respect to position (time and space-resolved measurement)
The operating principle of the streak camera is described in Figure 29. The light being
measured passes through a slit and is formed by the optics into a slit image on the pjhotocatode
of the streak tube.At this point , four optical pulses which vary slightly in terms of both time
and space, and which have different optical intensities, are input through thes slit and arrive at
the photocatode

43
Figure 29. The operating principle of the streak camera
The incident light on the photocatode is converted into a number of electrons proportional to the
intensity of the light, so that these four optical pulses are converted into a number of electrons
proportional to the intensity of the light, so that these foir optical pulses are converted
sequentially into electron, where they are accelerated and bombarded against a phosphor screen.
As the electrons produced from the four optical pulses pass between a pair of sweepo electrodes,
high voltage is applied to the sweep electrodes at a timing synchronized to the incident light
Figure 30 . This initiates a high-speed sweep (the electrons are swept from top to bottom).
During the high speed-sweep, the electrons, which arrive at slightly different times, are deflected
in slightly different angles in the vertical direction, and enter the MCP (micro-channel plate).
Figure 30. Operation timing at the time of sweep
As the electrons pass the MCP, they are multiplied several thousand of times, after which they

44
impact against the phosphor screen, where they are converted again into light.
On the phosphor screen, the phosphor image corresponding to the optical pulse which was the
earliest to arrive is placed in the uppermost position, with the other images being arranged in
sequential order from top to bottom, in other words, the vertical direction on the phosphor screen
serves as the time axis. Also, the brightness of the various phosphor images is proportional to the
intensity of the respective incident optical pulses. The position in the horizonthal direction of the
phosphor image corresponds to the horizontal location of the incident light.
In this way, the streak camera can be used to convert changes in the temporal and spatial light
intensity of the light being measured into an image showing the brightness distribution on the
phosphor screen. Thus, the optical intensity from the phosphor image can be found, and the time
and the incident light position from the location of the phosphor image.
The main features of a streak camera are :
1)Simultaneous measurement of light intensity on both the temporal and wavelength axis. By
positioning a multichannel spectroscope in front of the slit (for incident light ) of the streak
camera, the spatial axis is reckoned for the wavelength axis . This enables changes in the light
intensity on the various wavelengths to be measured (timeresolved spectroscopy)
2) High temporal resolution of less of 0.2 ps. Thisvalue corresponds to the time it takes for
light to advance 0.06 mm
3) A wide range of phenomena can be measured simply by replacing the modular sweep unit
4) A streak tube detector can be selected to match any wavelength range from X-rays to near
infrared rays
5) It has ultra high sensitivity. Th streak tube converts light into electrons , and then multiply it
electrically. By this , it can measure faint light phenomena not to be seen by the human eye.
This enables monitoring of extremely faint light , even single photoelectron can be detected
6 )A dedicated readout system is available which allows images recorded by the streak camera,

45
that is streak images, to be displayed on video monitor and analyzed in real time.
The basic system configuration of the streak camera is rapresented in Figure 31. To be able to
detect fast phenomena, the streak camera needs a trigger section and a readout section.
The trigger section controls the timing of the streak sweep and has to be adjusted so that the
sweep is initiated when the light being masured arrives at the streak camera. For this purpose, a
dalay unit is used which controls how long the trigger signal which initiates the streak sweep is
delayed.Also a frequency divider is used, that divides the frequency of the external trigger
signal if the repetition frequency of the trigger signal is too high. Also, in cases where the
trigger signal cannot be produced from the devices such as a laser, it has to be produced from
the light being meseaured itself, and this requires a PIN photodiode.
The readout section reads and analyzes streak images produced onn the phosphor screen ,
which is on the output side of the streak camera. Because the streak image is faint and
disappears in an instant, a high sensitivity camera is used.
In addition to the units which make up this basic configuration, there are spectroscopes, optics
and other peripheral equipments which can be used depending on each applications.
Figure 31. Basic system configuration of the streak camera

46
The experiments that were carried out at LLC in Lund university were as follws:
Time resolved fluorescence data were collected using a Hamamatsu streak camera C6860 device
coupled to a Chromex spectrograph. The temporal resolution varied between ~10 to 60 ps
depending on the investigated time range. The 266 nm laser beam used to excite the sample was
generated by frequency tripling 150 fs, 800 nm, Ti:Sa pulses at a repetition rate of 82 MHz
(Spectra-Physics, Tsunami). The laser beam was focused on the sample in a 2 mm rotating quartz
cuvette. Fluorescence was collected at magic angle using two 1-inch diameter 50 mm focal
length quartz lenses and focused on the spectrograph. All time-resolved fluorescence
measurements were performed at room temperature (20 ± 1°C), under aerated conditions.
47
3.Results and Discussion
3.1 Photochromism and acidichromism of Δ2,2
-Bi-(2H-1,4-
benzothiazine)
3.1.1 Background
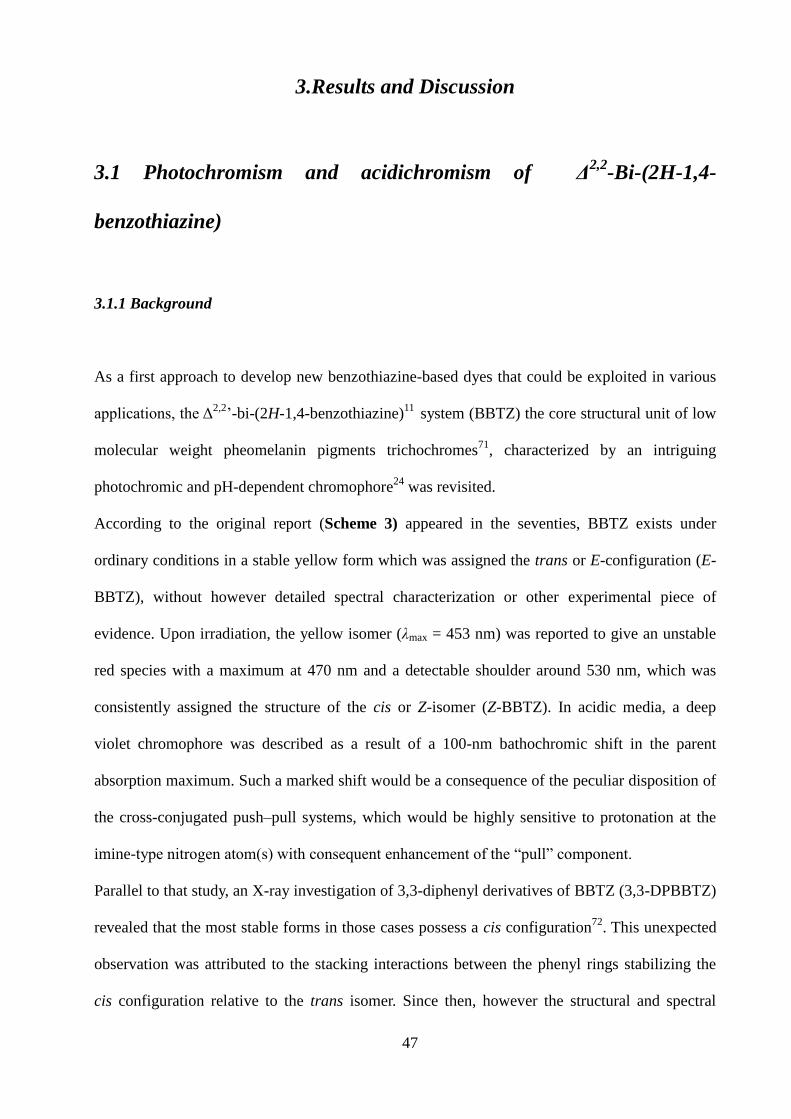
As a first approach to develop new benzothiazine-based dyes that could be exploited in various
applications, the Δ2,2
’-bi-(2H-1,4-benzothiazine)11
system (BBTZ) the core structural unit of low
molecular weight pheomelanin pigments trichochromes71
, characterized by an intriguing
photochromic and pH-dependent chromophore24
was revisited.
According to the original report (Scheme 3) appeared in the seventies, BBTZ exists under
ordinary conditions in a stable yellow form which was assigned the trans or E-configuration (E-
BBTZ), without however detailed spectral characterization or other experimental piece of
evidence. Upon irradiation, the yellow isomer (λmax = 453 nm) was reported to give an unstable
red species with a maximum at 470 nm and a detectable shoulder around 530 nm, which was
consistently assigned the structure of the cis or Z-isomer (Z-BBTZ). In acidic media, a deep
violet chromophore was described as a result of a 100-nm bathochromic shift in the parent
absorption maximum. Such a marked shift would be a consequence of the peculiar disposition of
the cross-conjugated push–pull systems, which would be highly sensitive to protonation at the
imine-type nitrogen atom(s) with consequent enhancement of the “pull” component.
Parallel to that study, an X-ray investigation of 3,3-diphenyl derivatives of BBTZ (3,3-DPBBTZ)
revealed that the most stable forms in those cases possess a cis configuration72
. This unexpected
observation was attributed to the stacking interactions between the phenyl rings stabilizing the
cis configuration relative to the trans isomer. Since then, however the structural and spectral

48
characterization of the various forms of the parent BBTZ was never addressed in detail, due also
to the failure to obtain useful crystals for X-ray analysis. This issue of conflicting configurations
of the BBTZ system was only marginally addressed in subsequent papers dealing with
trichochromes73
, remaining therefore unsettled.
Scheme 3. Early notions about BBTZ structure and chromophore.
In order to exploit the potential of BBTZ, the synthesis, structural characterization and
chromophoric properties were revisited by an integrated experimental and computational
approach
3.1.2 Synthesis and characterization of BBTZ
BBTZ was prepared following the reported synthesis24
with some modifications in order to
improve the overall procedure. An o-aminothiophenol, as an in situ generated sodium salt to
improve its nucleofilicity, reacts with bromo-acetaldehyde diethyl acetal in anhydrous DMSO at
100 °C to give 1-(2-aminophenylthio)-2,3-diethoxyethane that was isolated after a

49
chromatographic purification. (Figure 32)
Figure 32. Synthesis of BBTZ
According to the previous reported protocol, the reaction mixture had to be left for over 12 h to
reach a satisfactory yield; however, it was noted that the reaction time can be considerably
lowered to 1-2 hours and it can be carried out even at room temperature if the amount of sodium
used to form the o-aminothiophenol salt is increased.
The isolated 1-(2-aminophenylthio-)2,3-diethoxyethane is then treated with acidic methanol in
order to remove the aldehyde protective groups and immediately after the cyclization occurs a
deep violet solution is obtained. This may be interpreted considering that the intermediate
monomeric 2H-1,4-benzothiazine generated is extremely unstable and dimerizes almost
instantly. The reaction mixture is then treated with 1 M Na2CO3 and the yellow precipitate
obtained is collected by centrifugation and purified by column chromatography (diethyl
ether/hexane, 9:1). This is a really critical purification procedure because of BBTZ
photoreactivity and it must be carried out rigorously in the dark.. In order to characterize also the
other BBTZ isomer, solutions of the yellow BBTZ in benzene or dichloromethane were exposed
to sunlight in quartz vials and the conversion of the yellow to red form was followed by TLC

50
analysis. At maximum degree of conversion the solution was taken to dryness and rapidly
purified by column chromatography and then subjected to spectral characterization as quickly as
possible due to its tendency to return to its most stable isomer, especially when left in the dark.
Assignment of the proton and carbon resonances followed from analysis of 2D NMR spectra for
the yellow species and from proton and carbon spectra of the red species, are shown in Figure 33
Figure 33. Experimental proton and carbon resonances of yellow BBTZ(right) and red BBTZ
(left).For red BBTZ the quaternary carbons resonances could not be obtained
3.1.3 Computational analysis
DFT calculations employing the PBE0 functional65
[TD-PBE0/6-311++G-(2d,2p)//PBE0/6-
31+G(d,p)] were performed to characterize the BBTZ chromophore and associated electronic
transitions. Quite surprisingly, the predicted absorption maximum of the cis forms virtually
overlapped that of the stable yellow species, whereas that of the trans isomer matched the
absorption spectrum of the unstable red species generated by exposure to sunlight. This
unexpected result hinted at an incorrect assignment of the configurations of the two species.
Unfortunately, it was not possible to grow suitable crystals of the yellow stable form of BBTZ to
clarify its configuration unambiguously. However, strong suggestive evidence in support of the
structural reassignment came from complete 1H NMR and
13C NMR characterization of the
yellow and red species, which gave results that matched fairly well with the spectra of the cis

51
and trans isomers, respectively, simulated within the Gauge–Including Atomic Orbitals (GIAO)
ansatz70
at the PBE0/6-311+G(d,p).
Simple energetic consideration also lent support to this assignment, inasmuch as most
computational levels explored, including notably the PBE0/6-31+G(d,p) level adopted for
geometry optimizations, MP2 calculations with sufficiently large basis sets, as well as the high
accuracy CBS-QB3 model chemistry74
, predicted a higher stability for the cis form. More
compelling evidence supporting structural revision of the stable yellow species to the cis isomer
came from a gradient-selected X-half filtered NOESY-HSQC experiment75
(Figure 34), which
allows NOE cross-peaks to be detected between chemically equivalent protons, exploiting the
statistical mixture of different 12
C–1H and
13C–
1H isotopomers in natural abundance to break the
equivalence of the protons. To minimize the influence of any imperfect suppression of the
diagonal signals, the experiment is acquired without heteronuclear decoupling during
acquisition; therefore, the NOEs are observed in correspondence of the 13
C satellite peaks of the
proton signal. The spectrum thus obtained displayed prominent H3–H
3 NOE, which strongly
supported the cis configuration of the inter-ring double bond (the interproton distance measured
in the DFT model is 1.90 Å) and effectively ruled out the trans configuration (4.67 Å).
Figure 34..X-half filtered NOESY-HSQC spectrum (CDCl3) of the yellow form of BBTZ (selected
region).

52
The counterintuitive prevalence of the cis form can be rationalized based on the tendency of the
push–pull RS– CH=CH=NR system to adopt a trans arrangement (i.e., corresponding to the
situation in Z-BBTZ). For the cis benzothiazine isomer, the expected planar skeleton (C2v
symmetry) is found; by contrast, the trans isomer displays a Ci equilibrium structure, in which
deviations from planarity are localized in the thiazine rings, and only marginally affect the
planarity of the S–C2(C3)=C2’(C3’)–S’ system (Figure 35). The planar (C2h) trans structure
represents in fact a first-order saddle point, some 1.6 kcalmol–1
in energy above the Ci
conformer. Unfavorable non-bonded interactions between the H3 protons and the sulfur centers
on the opposite ring are relieved to some extent by distortion of the C2h structure (S–H3 distance
= 2.50 Å) to the Ci conformer (2.61 Å).
Figure 35. Geometry optimized structures of E-BBTZ (left) and ZBBTZ (right) at the PBE0/6-
31+G(d,p) level of theory.
3.1.4 Characterization of the chromophoric properties
Efficient control and regulation of chromophores is an essential requisite for practical
applications. Because a strong acid-induced shift was originally described as the most
spectacular property of BBTZ, the acidichromic behavior of this chromophore was re-examined.
Figure 36 shows the absorption profile of Z-BBTZ at neutral pH and after acidification to pH <
4. As previously reported, a violet species with an intense maximum at 556 nm developed
(Figure 37), which reversibly shifted to the original maximum upon neutralization. The reaction

53
proved to be completely reversible over at least five cycles. Under more forcing acidic
conditions, for example, in 2 M HCl, a new species became detectable that had apparently
escaped the attention of previous workers. This latter species, supposedly a diprotonated
derivative, exhibited an absorption maximum at 590 nm, and its formation was accompanied by
a distinct color change of the solution from violet to deep blue. Plots of absorbance at 556 and
453 nm vs. pH indicated a pKa value of ca. 2.5 for the protonated species, whereas it was not
possible to obtain reliable information on the acidity constant of the diprotonated species.
Figure 36. (left) Acid-dependent behavior of BBTZ chromophore: neutral, yellow species
(black), photoirradiated species (red); pH 4 (violet), 2 M HCl (blue); (right) computed spectra
for the neutral, monocation and dication species of BBTZ. Full line, neutral forms: cis, C2v
minimum (black), trans Ci minimum (red) (relative energy 1.6 kcalmol–1
). Dashed line, N-
monoprotonated forms: cis Cs minimum (black), trans C1 minimum (red) (relative energy 3.3
kcal mol–1
). Dashed-dotted, N,N-diprotonated forms: cis C2 minimum (black), trans C2
minimum (red) (relative energy, 4.8 kcalmol–1
).
Both the absorption maximum and NMR spectroscopic data of the first formed violet species in
acids were in fairly good agreement with DFT predictions for an N-protonated derivative with a
cis configuration. Attempts to characterize the blue diprotonated product by 1H NMR

54
spectroscopy were unsuccessful, because the compound could be generated only in a strongly
acidic aqueous medium where the solubility was poor.
Figure 37. Changes in the UV-Vis absorption intensity of Z-BBTZ as a function of pH
Apparently, addition of acids to DMSO or other organic solvents was insufficient to generate the
diprotonated species. Nonetheless, both chemical arguments and DFT calculations concurred to
support the structure of an N,N- diprotonated species in a cis configuration for the blue
chromophore (Figure 38 ).
Figure 38.. Geometry optimized structures of mono- (left) and diprotonated (right) derivatives of
BBTZ at the PBE0/6-31+G(d,p) level of theory.
Interestingly, DFT energy data for both the mono- and di-N-protonated species predicted a

55
greater stabilization of the cis against the trans isomers compared to the neutral forms . On the
basis of these data, a novel picture of BBTZ as a four-state system with photochromic and pH-
dependent behavior (Figure 39) is proposed (Scheme 4 ).
Figure 39. BBTZ as a four-state chromic system. From left to right: Z form; E form, protonated
form, diprotonated form.
Scheme 4. Schematic illustration of the revised four-state BBTZ system. Regulatory effects of
light and protons are highlighted.

56
3.1.5 The acidichromic behaviour of BBTZ chromophore: exploring applications
The potential of BBTZ for photo- and pH-controlled reversible writing processes was briefly
assessed in a preliminary set of experiments. A silica gel plate was dipped into a
dichloromethane solution of BBTZ and then dried. The yellow-orange plate thus obtained was
exposed to HCl vapors through a handmade mask containing the letter L to generate a well-
defined image (Figure 40 , right panel).
This image was instantaneously erased by exposure to vapors of ammonia. Conversely, exposure
of the yellow plate to HCl vapors generated a blue background on which a yellow letter L was
clearly inscribed by the above mask-aided operation using ammonia vapors (Figure , left panel).
The same write–erase–rewrite operations could be repeated several times without apparent
modification. The color on plate was fairly resistant in the absence of acidic or alkaline vapors
and in the dark or under low light intensity condition
Figure 40. Writing initials with BBTZ. Left panel: neutral background, HCl vapors through the
mask. Right panel: HCl-exposed background, NH3 vapors through the mask

57
3.2 Synthesis of 1,4-benzothiazines and investigation of their
oxidation reactivity
Based on consideration of the variety of chromophores provided by the Δ2,2’
-bibenzothiazine
systems depending on light exposure and pH conditions, the reversibility of the color changes
and the stability of the compounds, availability of a series of 1,4-benzothiazines on a large scale
is a highly desirable goal and a preliminary step to access to the different groups of
benzothiazine-based dyes as will be presented in the following chapters.
3.2.1 Synthetic approach to 1,4-benzothiazines
The main synthetic route to the 1,4-benzothiazines compounds involves treatment of an o-
aminothiophenol with a haloacetoaldehyde (in the acetal form ) / ketone followed by removal of
the protection and cyclization. Use of the aldehyde in the protected acetal form would allow to
get the 3-unsubstituted 1,4-benzothiazine. This latter however is highly unstable under the acidic
reaction conditions needed to remove the aldehyde protection and favour cyclization so that only
the dimeric 2,2’
- bibenzothiazine in the protonated form is invariably obtained as a result of the
oxidative coupling of the transiently generated 1,4-benzothiazine (Figure 41)
Figure 41. Synthesis and reactivity of the 3-unsubstituted 1,4-benzothiazine
.

58
To obtain more stable 1,4-benzothiazines monomers attention was redirected to the preparation
of 3-substituted 1,4-benzothiazines.
Using an alpha-halogenated ketone, instead of a haloacetoaldehyde, a 1,4-benzothiazine
carrying an R group of the starting ketone at 3-position can be obtained (Figure 42).
Following this latter strategy, two 3-substituted-1,4-benzothiazine monomers could be obtained,
namely 3-phenyl-2H-1,4-benzothiazine and 3-methyl-2H-1,4-benzothiazine.
3.2.2. Synthesis of 3-phenyl-2H-1,4-benzothiazine
3-phenyl-2H-1,4-benzothiazine was obtained following an improved version of a previously
reported procedure76
in which the o-aminothiophenol is reacted with phenacyl bromide in
anhydrous diethyl ether (Figure 43). In our hands the reaction proceeded rapidly leading in 2 h
to an almost complete conversion of the starting materials. The yellow solid that separated was
washed with diethyl ether affording the compound in pure form in 82% yield.
Figure 43. Synthesis of 3-phenyl-2H-1,4-benzothiazine.
This compound was subjected to a complete spectral analysis. Proton and carbon resonances
Figure 42. Synthesis of 1,4-benzothiazine carrying at 3-position the R group.

59
assignment of 3-phenyl-2H-1,4-benzothiazine is shown in Figure 44.
Figure 44. 1H and
13C NMR resonances of 3-phenyl-2H-1,4-benzothiazine.
3.2.3 Preliminary investigation of 3-phenyl-1,4-benzothiazine reactivity
3-phenyl-1,4-benzothiazine proved a highly stable product, because it can be obtained as a
intense yellow solid and stored at room temperature. It is easily dissolved in methanol,
chloroform and dichloromethane.
In organic solvents (e.g., methanol) or in a neutral aqueous medium, 3-phenyl-1,4-benzothiazine
is fairly stable to a broad range of chemical and enzymatic oxidants, remaining virtually
unchanged over prolonged periods of time up to several days.
However, in acidic media , the oxidative coupling of the monomeric 1,4-benzothiazine can take
place. In the case of the parent 1,4-benzothiazine the marked reactivity and the ease to further
oxidation of the 2,2’-coupling product hampers not only isolation but even detection of this
species. By contrast, it is known from literature that starting from 7-(2-amino-2-carboxyethyl)-3-
carboxy-5-hydroxy-2H-1,4-benzothiazine, an intermediate of pheomelanin biosynthesis, or the
model compound 3-methoxycarbonyl-5-methoxy-7-methyl-2H-1,4-benzothiazine, the 2,2’-

60
dimers can be obtained by oxidation under acidic conditions with ammonium persulphate43
(Figure 45).
Figure 45. Formation of 2,2’-bibenzothiazine by oxidation of 3-carboxysubstituted 1,4-
benzothiazines
Other oxidation conditions that have been reported for dimerization of 3-aryl substituted
benzothiazines include picric acid in ethanol under reflux, nitrobenzene, ethanol/HCl or ethanol
/sodium hydroxide at room temperature in the presence of oxygen.77
with the highest yields
(about 60%) obtained with picric acid. Moreover, in the presence of peroxides or biometals at
micromolar concentrations, and under strong acidic conditions, 3-phenyl-2H-1,4-benzothiazine
is efficiently converted into its double bond dimer (this will be illustrated in more details in
chapter 3.3).
3.2.4 Synthesis of 3-methyl-2H-1,4-benzothiazine.
The synthetic procedure followed for 3-phenyl-2H-1,4-benzothiazine synthesis, was extended
to another commercially available alpha halogen ketone, chloroacetone (Figure 46). The reaction
was carried out under similar conditions by reacting at room temperature chloroacetone with o-
aminothiophenol in anhydrous diethyl ether under vigorous stirring. The reaction was carried out
over 24 h at which time a solid was formed and separated from the reaction mixture. The solid

61
was washed repeatedly with chloroform and the remaining solid and the supernatants were
examined by TLC and then by NMR. Only the supernatant was found to contain a single
component that was identified as the desired benzothiazine while the solid proved to be a
mixture of several species. The isolation yield of the benzothiazine in the optimized procedure
was 48%.
Figure 46. Synthesis of 3-methyl -2H-1,4-benzothiazine.
Proton and carbon resonances assignment of 3-methyl-1,4-benzothiazine is shown in Figure 47.
Figure 47. 1H and
13C NMR resonances of 3-methyl-2H-1,4-benzothiazine.
3.2.5 Preliminary investigation of 3-methyl-1,4-benzothiazine reactivity
The reaction conditions developed in the case of the 3-phenyl-1,4-benzothiazine were extended
to 3-methyl-1,4-benzothiazine. When exposed to methanol in the presence of 3M HCl the
compound reacted smoothly within 24 h. After extraction of the mixture with chloroform

62
/bicarbonate solution a rather simple reaction pattern was apparent consisting of a major yellow
product at Rf 0.5 (eluant hexane-ethyl acetate 8:2 v/v ) and another minor component orange in
color at Rf 0.35 in the same eluent. After chromatographic purification, the two components
could be obtained in pure form and subjected to spectral analysis.
Mass spectrometric analysis of the orange component in the electrospray ionization mode gave a
pseudomolecular ion peak at m/z 323 as expected for Δ2,2’
-bi-(3-methyl-2H-1,4-benzothiazine).
However, the aromatic region of the 1H NMR spectrum clearly provided evidence for the
presence of resonances due to two different 1,4-benzothiazine units; moreover the aliphatic
region showed two doublets (1H each) at 2.9 ppm with J= 16 Hz, suggesting diastereotopic
methylene protons and a singlet (3H) at 1.42 ppm, significantly shielded with respect to the
methyl group of the starting benzothiazine. These latter resonances showed one bond correlation
with carbons at 48.45 and 26.72 ppm, respectively, and with a C carbons at 56.11 ppm and
164.61 ppm in the HMBC spectrum. These and other elements from comparative analysis of the
2D spectra led us to assign the compound the structure shown in Figure 48.
Figure 48. 1H and
13C NMR resonances of the condensated compound.

63
Consistent with this structural formulation was also the UV spectrum (Figure 49) showing an
absorption maximum at 414 nm ipsochromically shifted when compared to that of Δ2,2’
-bi-(2H-
1,4-benzothiazine) system (453 nm) because of the lack of one half of the doubly conjugated
cross coupled system. The absorption maximum was shifted batochromically to 501 nm on
treatment with acids as expected considering the persistence of one of the push- pull system of
the bibenzothiazine unit.
Figure 49 Uv/VIS spectra under neutral and acid conditions of the condensated compound .
As to the possible mechanism of formation of this compound, this may be envisaged as
involving in addition to the oxidative coupling leading to the formation of the double bond at 2
position an imine enamine attack as depicted in Figure 50, though the sequence of the events
could not defined based on the available evidence.

64
Figure 50. Proposed mechanism of formation of the condensated product
As to the other component of the reaction mixture, this was isolated by column fractionation and
subjected to spectral analysis. It was noticed that the compound had a marked tendency to
undergo partial decomposition when taken in solution even in the cold and in the absence of light
giving rise to a pattern of species most of which exhibiting only UV absorption. Spectral analysis
was initially attempted in methanol. The proton spectrum showed in the aliphatic region
resonances closely similar to those of the condensated compound that is two doublets at 3.11
ppm and the singlet at 1.40 ppm while analysis of the sp2 region indicated the presence of two
different benzothiazine units although the pattern of resonances that is 6.84-7.39 ppm covered a
range different with respect to that observed for the previous compound. Unfortunately, no
satisfactory carbon spectrum could be obtained in spite of several efforts and further structural
investigation was hampered by a marked instability of this compound on standing in solution
even in the cold. Further studies will be directed at exploring conditions under which this
interesting compound would be sufficiently stable to warrant running a complete NMR
characterization.
Separate experiments showed that the Rf 0.35 compound was not generated from the

65
condensated benzothianine dimer under the reaction conditions, nor was compound that was
fully characterized formed from the other suggesting that, in spite of the similarity of the proton
spectrum, the formation routes of the two components of the reaction mixture were distinct and
parallel. In addition, neither of the two components of the reaction mixture was formed when the
reaction was carried out with exclusion of air .

66
3.3 Oxidative coupling of 3-phenyl-(2H-1,4-benzothiazine) promoted
by peroxides or biometals
3.3.1 Background
The oxidation behaviour of 1,4-benzothiazines, was extensively investigated in the 70’s. Fujii et
al78
reported that oxidation of 3-phenyl-1,4-benzothiazine with picric acid in ethanol leads to a
symmetrical dimer identified as the 2,2’-bi-(3-phenyl-2H-1,4-benzothiazine). The structure of
this product was later questioned by Bottex79
that assigned to the dimer an asymmetric structure
involving the Nitrogen of one unit and the 2 position of the other. Further studies showed that
oxidation of 1,4-thiazines under the same conditions (picric acid in ethanol) gave only products
arising from a symmetrical dimerization80
. Moreover, in the case of 3-phenyl-2H-1,4-
benzothiazine the dimers were formed even under milder conditions, that is acidic ethanol in the
presence of oxygen, although with lower yields. It should be noted that the dimerization of 3-
phenyl-1,4-benzothiazine should lead to the formation of a mixture of the meso/DL pair of
diastereoisomers, however, only one stereoisomer was obtained from these reactions and X-ray
analyses showed that this stereoisomer was the meso one.
We have now re-examined this reaction with a view of obtaining the Δ2,2'
-bi-(2H-1,4-
benzothiazine) system starting from a stable benzothiazine that is the 3-phenyl-1,4-benzothiazine
that differently from the 3-unsubstituted compound can be prepared and stored. The oxidation
reaction was carried out with the aim of isolating either the 2,2’ dimer and investigating the
optimal conditions to get the corresponding Δ2,2'
-bi-(2H-1,4-benzothiazine).

67
3.3.2 The green blue chromophore of Δ2,2'
-bi-(3-phenyl-2H-1,4- benzothiazine) system
In organic solvents (e.g. methanol) or in a neutral aqueous medium, the 3-phenyl-1,4-
benzothiazine was fairly stable to a broad range of chemical and enzymatic oxidants, including
potassium ferricyanide, hydrogen peroxide, or, notably, peroxidase/ H2O2, remaining virtually
unchanged over prolonged periods of time up to several days. However, exposure of 3-phenyl-
1,4-benzothiazine to H2O2 in a strongly acidic medium (i.e. methanol/conc aq HCl 3:1 at room
temperature) resulted in a fast and efficient reaction leading to a stable blue-green chromophore
(λmax 598 nm) in a few minutes. In the absence of H2O2 no detectable chromophore formation
was observed over the time scale of 1 h. HPLC analysis of the reaction mixture revealed the very
rapid accumulation in the initial stages of the reaction of colorless intermediates that were
eventually converted to the green chromophore, with no other detectable intermediate/reaction
product.(Figure 51). This was also confirmed by proton NMR monitoring of the reaction course.
Figure 51. LC-ESI(+)MS analysis of the oxidation of 3-phenyl-1,4-benzothiazine (50 μM) by
H2O2 (100 μM) at 1 min (green plot), 5min (blue plot) and 15 min (red plot). The RT 15.2 min
species was identified as the 3-phenyl-1,4-benzothiazine, the RT 45.4 and 47.7 min were
identified as the single bond dimers and the RT 54.4 and 55.7 min were identified as the double
bond 2,2’-bibenzothiazines

68
3.3.3 Isolation and spectral characterization
Work up of the mixtures allowed isolation and spectral characterization of the colorless
intermediates as the meso/DL pair of diastereoisomers of the single-bonded dimers which were
amply investigated by computational analysis, whereas the chromophoric species proved to be a
mixture of Δ2,2'
-bi-(3-phenyl-2H-1,4- benzothiazine) Z/E isomers (Scheme 5 ) in an approximate
ratio of 3:1.
Assignment of the Z-configuration to the major component of the mixture was made possible by
comparison of the experimental and computed 1H NMR spectra . For the mixture of isomeric 3,
an overall ε598 = 5700 ± 45M1 cm
1 in methanol/36% HCl 3:1 v/vwas determined, which
suggested a potential application for colorimetric determination of H2O2.
Scheme 5. Structures of Dimeric Oxidation Products of 3-phenyl-1,4-benzothiazine

69
3.3.4 Mechanicistic studies
The mechanism by which H2O2 mediates conversion of the monomeric 3-phenyl benzothiazine
to its double bond dimer under acid conditions was then investigated. Figure 52 shows the
spectrophotometric course of the oxidation of the monomer with acidic H2O2 (left panel) leading
to formation of the green chromophore. Data showed the relatively fast conversion of 3-phenyl-
1,4.-benzothiazine to the final product following the addition of acid. The chromophore of the
single bond dimers was closely similar to that of the monomer. The conversion of single bond
dimers to the double bond ones was therefore separately followed (right panel). The pseudo-first-
order rate constant of 0.089 ± 0.005 min -1
was determined with a concentration of the monomer
at 50 μM and H2O2 at 500 μM, based on the formation of the double bond system at 598 nm and
decay of the single bond dimer at 320 nm (Figure 53).
Oxygen proved to be critical for chromophore formation from both monomer and single bond
dimers since no significant reaction occurred under an argon atmosphere.
Figure 52. Monitoring of chromophore formation by oxidation of 1 (left) and dimers 2 (right) at
50 μM in air-equilibrated methanol/ 36% HCl 3:1 v/v solutions by 500 μM H2O2 at 5 min
intervals over 30 min

70
Figure 53. Pseudo first-order fitting of the oxidation kinetics of 50 M 3,3’-diphenyl-2H,2’H-
2,2’-bi-1,4- benzothiazine with 500 M hydrogen peroxide, as monitored spectrophotometrically
at two different wavelengths
3.3.5 Formation of the Δ2,2'
-bi-(3-phenyl-2H-1,4- benzothiazine) by other oxidants and redox
active biometals.
In another series of experiments, the ability of a series of acid-compatible oxidants to bring about
conversion of 3-phenyl-1,4-benzothiazine to its final dimers was investigated. Besides H2O2 ,
other peroxides such as t-BuOOH, m-chloroperbenzoic acid (MCPBA), and benzoyl peroxide
also induced acid-dependent chromophore formation, whereas persulfate at the same
concentration proved ineffective.
In a screening aimed at identifying other oxidants capable of promoting the oxidative coupling
reaction, it was found that some redox-active transition metal ions (e.g., Fe(III), V(V), and

71
Cu(II)) were also able to generate the chromophore (Figure 54), whereas Fe(II) was inactive
even in the presence of peroxides (i.e., under Fenton-type conditions, both at neutral and acidic
pH)
Figure 54 . (a) Kinetic analysis of chromophore formation at 598 nm by reaction of 50 μM 1
with 100 μM V5+
(triangles) Fe3+
(squares), Cu2+
(circles), and H2O2 (crosses) in methanol/ 36%
HCl 3:1 v/v solutions at 25 C.
A possible mechanism accounting for the reported observations is given in Scheme 6. In this
scheme, peroxides or metal ions induce conversion of protonated monomer to the resonance-
stabilized benzothiazinyl radical 1.. This conversion may be the result of two alternative, not
mutually exclusive, routes, that is, direct H-atom abstraction and electron transfer with
concomitant/sequential proton transfer. The former path is likely to be mediated mainly by
oxygenated species on the protonated benzothiazine, while the latter would occur only on the
enamine tautomer of the monomer and would be prevalent in the presence of metal ions alone.
The equilibrium of the imine and enamine forms of 3-phenyl-1,4-benzothiazine in an acidic
medium should be considered in this regard . Further work is necessary to clarify this issue.

72
Scheme 6 . Proposed Mechanism of Formation of Blue-Green Dimers by Oxidation of 3-phenyl-
1,4-benzothiazine in Acidic Medium (All Formula Numbers Refer to Protonated Products)
Self coupling of the monomer would then give the single bond dimer , which would eventually
be converted to the double bond dimer by acid-assisted dehydrogenation. Spectrophotometric
and HPLC analyses concurred to indicate that conversion between the two dimers represents the
rate determining step of the process.

73
3.3.6 EPR experiments and computational analysis of the radical intermediates
In support of the proposed scheme, the acid-promoted (3 M HCl) oxidation of the monomer in
the presence of H2O2 and atmospheric oxygen in MeOH was monitored by electron
paramagnetic resonance (EPR) spectroscopy, which revealed the generation of a signal (Figure
55) attributed to a C/N-centered radical (g=2.0051) with hyperfine features fully consistent with
the structure of protonated radical 1•81
Assignment was unambiguously confirmed by
comparison of the experimental data with simulated EPR spectra for the neutral and protonated
radical form, using calculated (B3LYP82
/EPR-II83
//B3LYP/N07D84
) hyperfine constants further
optimized with the Monte Carlo method85
.
EPR spectra consistently gave good agreement with those calculated for protonated 1• but not
for the neutral species, for which large coupling (10 G) with (C2)H is predicted as a consequence
of the larger spin density in position 2 .
Figure 55. EPR spectrum of a solution of 1 in acidic MeOH and simulated spectra of the neutral
and protonated free-radical 1•.

74
The role of acids in triggering the H-atom abstraction from the 3-phenyl-1,4-benzothiazine was
then investigated at the PBE086
/6-31þG(d,p) level. The unrestricted formulation was used to
describe radicals, and for each species, different conformers were explored. Computations were
performed either in vacuo or adoption of a polarizable continuum medium87
. Predicted variations
in free-energy changes associated with H-atom abstraction from the monomer and, for
comparison, from the parent 2H-1,4-benzothiazine are reported in Table 1
Product/conditions rxn G°
benzothiazine, neutral form, in vacuo 0.0
benzothiazine, neutral form, MeOH 0.5
benzothiazine, monoprotonated form, MeOH -7.2
1, neutral form, in vacuo 2.5
1, neutral form, MeOH 3.1
1, neutral form, MeOH -2.8
Table 1. Computed Free Energy (kcal mol -1
) of Radical Formation from 1.
Consistent with the experimental observations, calculations predicted that protonation results in a
marked decrease in free-energy changes for H-atom abstraction from both the monomer and the
parent benzothiazine. This effect would reflect a potentiation of the push-pull stabilization of the
carbon-centered free radical at C2 induced by protonation at the imine group.
The role of oxygen in the proposed free-radical coupling/dehydrogenation scheme deserves
further investigation. Since product analysis did not reveal formation of other products besides
the dimers, and the mass balance was completely accounted for by these species, it follows that
any oxygenated intermediate, such as a peroxyl radical, must eventually be converted to the final
products with loss of oxygen.

75
3.3.7 Oxidative coupling of the 3-phenyl-1,4-benzothiazine: potential applications
Based on these results, the scope of the new chromogenic system was briefly assessed.
Interestingly, the 3-phenyl-1,4-benzothiazine proved to be useful for the visual detection of
peroxides in aged ethereal solvents such as THF, ethyl ether, dioxane (Figure 56). Typically, the
solvent to be tested was mixed with a monomer solution of 200 μM in 3:1 methanol/36% HCl
(3:1 v/v), and the absorbance at 598 nm was measured spectrophotometrically. The method can
be conveniently used for routine peroxide quantitation also on a visual basis.
As a curious aside to these experiments, it was noticed that addition of rusty iron objects to the
typical mixture promoted oxidation of as high as 6 mM in a very fast and efficient manner.
Under these conditions, the monomer was found to serve as an efficient inhibitor against
corrosion of the rusty iron objects induced by concentrated HCl (Figure 57).
Figure 56. Development of the chromophore of 3 on addition of 200 μM 3-phenyl-1,4-
benzothiazine in 3:1methanol/36% HCl to an ethyl ether sample kept 1 month in air on the
laboratory bench at a 3:1 v/v ratio before (A) and after (B) passage through a basic alumina
column.

76
Figure 57. Rusty iron nails before (bottom) and after (middle) immersion in 36% HCl overnight
and in the presence of 6 mM 1 (top)
On average, the 3-phenyl-1,4-benzothiazine could decrease weight loss from rusty iron nails or
staples immersed in concentrated HCl by 50% over 24 h. Though the mechanism by which the
monomer inhibits corrosion is at present unclear, it is conceivable that the effect is related in
some way to the reduction of Fe(III) to Fe(II), slowing down rust generation or passivating the
metal surface with Fe(II) oxides88
.
An experimental protocol was also developed for detection of peroxide or metal-containing
samples involving addition of the solutions to be tested to 200 μM 1 in methanol followed by the
immediate addition of concentrated HCl. After careful mixing, spectrophotometric reading at 598
nm after 10min at room temperature against the blank solution in the absence of added oxidant
revealed the presence of peroxides or metal salts. Minimal detection limits with this protocol, as
set by a ΔA598 of 0.05, were 50 μM for H2O2, 100μM for t-BuOOH, 100 μM for MCPBA, 20
μM for benzoylperoxide, and 30-50 μM for metal ions.
From the above data, a two-input logic gate “OR” system can be represented with the extra value
of the proton switch (Figure 58). Biologically and technologically relevant inputs such as
peroxides and redox-active biometals lead to a colorimetric output at 598 nm, completing the H+-

77
switched OR logic gate. We plot the “truth table” for the response of these inputs in which output
“1” is a ΔA598 of at least 0.05 and “0” is no change in A598 .
Figure 58. Proton switched “OR” logic gating with peroxide and biometal inputs and
colometric output based on the oxidation of 1. and truth table for the proton switched two inputs
OR logic gating based on the oxidation of 1

78
3.4 Benzothiazine based cyanine dyes: a) synthesis and
characterization of dimeric cyanines
In the search for new benzothiazine based functional dyes, further to investigation of the Δ2,2'
-
bi-(2H-1,4-benzothiazine) system, another route was explored that may allow the access to
benzothiazine-based cyanines. Two different classes of these dyes were developed that will be
illustrated in this chapter and in the following.
3.4.1 Dimeric bnenzothiazine based cyanines
The first group of benzothiazine cyanine dyes that was investigated shows an extension of the
conjugated system as =N-C=CH-CH=C-S- compared to those exhibited by Δ2,2'
-bi-(2H-1,4-
benzothiazine) system, a characteristic that should expectedly result in a larger batochromic
shift in acid.
The only report in the literature on the access to dimeric benzothiazine cyanine dyes from 2H-
1,4-benzothiazine dates back to 1975 and describes a 48 h TFA treatment89
of 1-(o-
aminophenylthio)-2,2-diethoxyethane, the same synthetic precursor of the Δ2,2'
-bi-(2H-1,4-
benzothiazine) system to obtain the 2,2'-(1,2-etandiilidene)-bis-(2H-1,4-benzothiazine) (Figure
59) as the main product . However, this reaction presents some unsettled issues regarding its
mechanisms, such as the actual origin of the C2H2 bridge connecting the two benzothiazine
units.
We have initially re-examined this intriguing reaction also in order to get some insight into the
mechanistic aspects.

79
Figure 59. Synthesis of 2,2'-(1,2-etandiilidene)bis(2H-1,4-benzothiazine.
Prolonged TFA treatment of 1-(o-aminophenylthio)-2,2-diethoxyethane gave quite a simple
pattern of products, mainly two red components with Rf=0.6 and Rf=0.4,
(dichlorometnane/methanol) 99:1) together with a more retained yellow product. All of these
compounds were isolated through a chromatographic purification on silica gel
(dichlorometane/methanol) 98:2) and characterized.
Based on 1D and 2D NMR data (Figure 60), the most abundant product (Rf=0.4) was
identified as the benzothiazine cyanine dimer, 2,2'-(1,2-etandiilidene)bis(2H-1,4-
benzothiazine).
Figure 60. 1H and
13C resonances of 2,2'-(1,2-etandiilidene)bis(2H-1,4-benzothiazine).

80
The other red product (Rf=0.6 ) showed a more complex pattern of signal and it was not further
characterized. However some proton signals would suggest an asymmetric isomer of the
dimeric cyanine. The most retained yellow compound was found the be the Δ2,2'
-bi-(2H-1,4-
benzothiazine).
Subsequent experiments were performed in order to understand the mechanism of formation of
this product. At first, the reaction was repeated under controlled atmosphere, in order to assess
whether oxygen had any role in the reaction. At the same reaction time (48 h) a minimal 1-(o-
aminophenylthio)-2,2-diethoxyethane consumption was observed and the final products were
barely formed.
In another experiment, the reaction was carried out using an excess of formaldehyde that
could act as a carbon source and favor the building up of the methylene bridge. However,
even in this case, it was not possible to see any enhancement in product formation.
These results suggest that construction of the symmetric C2H2 bridge may take place at the
expenses of an intermediate that could act as the carbon source for cyanine formation and this
could also account for the low isolation yields of 2,2'-(1,2-etandiilidene)bis(2H-1,4-
benzothiazine). (15%) .
3.4.2 Chromophoric properties of 2,2'-(1,2-etandiilidene)bis(2H-1,4-benzothiazine).
The chromophore of the cyanine presents the expected acidochromic behaviour, as shown in
Figure 61.
The neutral form shows an absorption maximum at 520 nm that undergoes a batochromic shift
to 600 nm at pH 1, likely due to the monoprotonated form. On further acidification, another
shift occurs at 650 nm , that corresponds to the diprotonated form . It should be noted that this
shift is some 50 nm higher than that observed for the simple Δ2,2’
-bi-(2H-1,4-benzothiazine).
These shifts are totally reversible under basic conditions. (Figure 62).

81
Figure 61.Absorption spectra of 2,2'-(1,2-etandiilidene)bis(2H-1,4-benzothiazine) in acidic
conditions
Figure 62. Chromophoric behavior of of 2,2'-(1,2-etandiilidene)bis(2H-1,4-benzothiazine)
3.4.3 Synthesis of the symmetric benzothiazine cyanine from 3-phenyl-1,4-2H-benzothiazine
Based on these results, the reaction with TFA was extended also to the 3-phenyl-1,4-
benzothiazine. The reaction proceeds very smoothly and again, the consumption of the starting
material was almost complete after 48 hours. After extraction with CH2Cl2, and
chromatographic purification, the red compound was obtained in pure form and subjected to a
complete spectroscopic characterization. The 1H NMR spectrum provided evidence for a highly

82
symmetric structure with a clear pattern of resonances for a single 1,4-benzothiazine moiety
and the phenyl substituent and an additional singlet (1H) at 6.85 ppm. Complete 2D NMR
characterization (COSY/ROESY/HMBC) led to assign the compound the 2,2’-(1,2-
etandiilidene)bis(3-phenyl-2H-1,4-benzothiazine) structure with assignment of the proton and
carbon resonances as shown in Figure 63. Assignment of the double bond configuration by
spectroscopic techniques like ROESY contact was not conclusive. The relative stability of the
possible isomers that is the Z,Z or the E,E in the s-cis or s-trans conformation was evaluated by
computational analysis at the DFT level. The lowest energy is associated to the Z,Z isomer in
the s-trans conformation.
Low isolation yields (25%) were observed also for this product. To investigate the mechanism
of formation of the benzothiazine cyanine the reaction was repeated in an oxygen-free
atmosphere. The mixture was worked up as usual and TLC analysis showed that the starting
benzothiazine has remained almost unaltered even after a reaction time of 48 h.
Figure 63 1H and
13C NMR resonances of compound 2,2’-(1,2-etandiilidene)bis(3-phenyl-2H-
1,4-benzothiazine).

83
At this point , a different synthetic approach was necessary in order to improve this reaction.
The most intuitive strategy would involve the addition of an external carbon source, and to
achieve this purpose, the reaction was carried out in the presence of aldehyde compounds that
may allow for the build-up of a conjugated bridge between the two benzothiazine units.
When a trifluoroacetic acid solution of 3-phenyl-1,4-benzothiazine was treated with excess
formaldehyde at rt, the solution became rapidly green, but a satisfactory consumption of the
starting compound was observed only after 48h. After removal of TFA the mixture was
extracted with CHCl3 ( Figure 64).
Figure 64. Synthesis of 2Z,2'Z-(1,2-etandiilidene)bis(3-phenyl-2H-1,4-benzothiazine).
TLC analysis showed the presence of a main product (Rf 0.4, CH2Cl2) red in color together
with a yellow product (Rf 0.7) identified again as the Δ2,2’
-bi-(2H-1,4-benzothiazine) by
comparison with the available standard. The effect of the stoichiometric ratio of the reagents
was then investigated in the range benzothiazine/formaldehyde 1:0.5, 1:1 ; 1:2.5 and 1:10.
Comparative analysis of the reaction mixtures at 48 h showed that the 1:10 ratio resulted in a
complete consumption of the starting benzothiazine and was the condition of choice to
optimize the yields which were up to 25%.
The possible effects of water and temperature on the reaction course were also explored for the
reaction mixtures at 1:1 and 1:10 stoichiometric ratios but neither of these parameters proved

84
to affect significantly the reaction course in terms of rate and product distribution with respect
to the conditions initially adopted. The reaction was then repeated in MeOH/3M HCl (Figure
65) the conditions previously used for benzothiazine oxidative dimerization using the
benzothiazine/formaldehyde at 1:10 ratio . After 4 h chloroform extraction and TLC analysis
showed a complete consumption of the starting benzothiazine and the presence of the red
component corresponding to the benzothiazine cyanine. Column chromatography purification
of the reaction mixture gave the product in 41 % yield
Figure 65. Synthesis of 2Z,2'Z-(1,2-etandiilidene)bis(3-phenyl-2H-1,4-benzothiazine) in acid
methanol with formaldehyde.
The effect of the variation of the reaction parameters on the reaction course did not allow to
draw conclusions on the mechanism of formation of the benzothiazine cyanine although the
lack of product formation in the absence of oxygen would indicate that the reaction requires an
oxidative step. Moreover the presence of a C-2 bridge between the benzothiazine units rather
than a C-1 bridge that could be expected as the result of the nucleophilic reactivity of the
benzothiazine in the enamine form onto the electrophilic formaldehyde would point to the
symmetric coupling of an intermediate formed in the reaction medium rather than a multi-step
process.
In other experiments, consideration of the structure of the benzothiazine cyanine led us to
investigate whether the same product could be obtained by reaction of 3-phenyl-1,4-
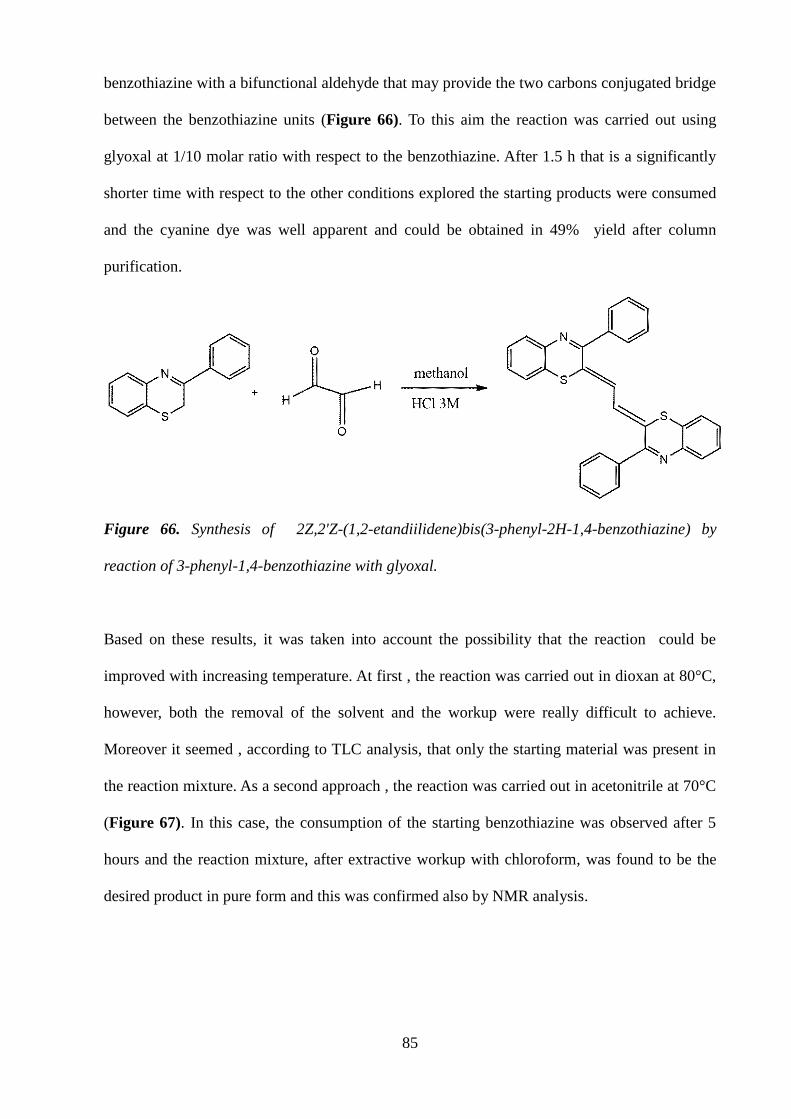
85
benzothiazine with a bifunctional aldehyde that may provide the two carbons conjugated bridge
between the benzothiazine units (Figure 66). To this aim the reaction was carried out using
glyoxal at 1/10 molar ratio with respect to the benzothiazine. After 1.5 h that is a significantly
shorter time with respect to the other conditions explored the starting products were consumed
and the cyanine dye was well apparent and could be obtained in 49% yield after column
purification.
Figure 66. Synthesis of 2Z,2'Z-(1,2-etandiilidene)bis(3-phenyl-2H-1,4-benzothiazine) by
reaction of 3-phenyl-1,4-benzothiazine with glyoxal.
Based on these results, it was taken into account the possibility that the reaction could be
improved with increasing temperature. At first , the reaction was carried out in dioxan at 80°C,
however, both the removal of the solvent and the workup were really difficult to achieve.
Moreover it seemed , according to TLC analysis, that only the starting material was present in
the reaction mixture. As a second approach , the reaction was carried out in acetonitrile at 70°C
(Figure 67). In this case, the consumption of the starting benzothiazine was observed after 5
hours and the reaction mixture, after extractive workup with chloroform, was found to be the
desired product in pure form and this was confirmed also by NMR analysis.

86
Figure 67. Synthesis of 2Z,2'Z-(1,2-etandiilidene)bis(3-phenyl-2H-1,4-benzothiazine) with
glyoxal and higher temperatures
In conclusion, the reaction in acetonitrile at 70°C , proved to be the best synthetic approach for
this compound, as it can be obtained in high yields (>60%) and without chromatographic
purification
When the reaction was carried out using malondialdehyde in place of glyoxal in methanol
solution in the presence of HCl, a dark mixture was immediately obtained with a significant
consumption of the starting materials only after 24 h. After extraction with CHCl3, TLC
analysis of the mixture showed a complex pattern of products with no predominant components
and this reaction was therefore no further investigated.
The reaction of formaldehyde in TFA was then extended to 3-methyl-2H-1,4-benzothiazine
using a 1:10 molar ratio. TLC analysis showed a very smooth reaction and only after one week
the presence of a complex pattern of products could be observed . A major component red in
color (rf 0.5 in eluanthexane-ethyl acetate 8:2) could not be identified as any of the products
obtained from the benzothiazine under the other conditions explored. In methanol/HCl the
reaction proceeded more rapidly giving a pattern of products similar to that observed from the
benzothiazine in the absence of formadehyde, but definitely more complex. The same product
pattern was also obtained when glyoxal was used in place of formaldehyde.

87
3.4.4 Chromophoric properties of 2Z,2'Z-(1,2-etandiilidene)bis(3-phenyl-2H-1,4-
benzothiazine)
The UV-vis and absorption properties of 2Z,2'Z-(1,2-etandiilidene)bis(3-phenyl-2H-1,4-
benzothiazine) was analysed under neutral and acidic conditions (Figure 68). This compound
showed an absorption maximum at 486 nm in methanol; a bathochromic shift to 617 nm was
observed in the presence of HCl at 0.1 M final concentration. A further shift to 655 nm was
obtained in 2M HCl. The molar extinction coefficients were measured for the abs at 486, 617,
655 nm as log 3.75, 3.61, 3.78, in the order. These absorption changes may be interpreted in
terms of different states of protonation of the two benzothiazine nitrogen corresponding to the
neutral, monocation and dication forms. This is in good agreement with results obtained with
the Δ2,2’
-bibenzothiazine for which absorption at 453, 556 and 590 nm were obtained for the
neutral, monocation and dication although in the case of the cyanine under investigation the
bathochromic shift observed on acidification was greater (131 nm vs 103 nm), on account of
the more extended conjugation of the monocation of the cyanine compared to that of the parent
Δ2,2’
-bibenzothiazine.
Figure 68.Uv/Vis spectra of the 2Z,2'Z-(1,2-etandiilidene)bis(3-phenyl-2H-1,4-benzothiazine)
in methanol (blue trace), methanol/0.1 M HCl (magenta trace ) methanol/2 M HCl (yellow
trace)
0
0.1
0.2
0.3
0.4
0.5
0.6
0.7
0.8
0.9
1
200 300 400 500 600 700 800
Absorb
ance
Wavelenght (nm)
neutra
dication
monocation
l

88
3.5 Benzothiazine-based cyanine dyes: b)Cyanines by condensation of
benzothiazines with aldehydes
Cyanine dyes are typically characterized by organic nitrogen centers, one of the imine and the
other of the enamine type, which may be included into an heterocyclic system, linked through a
variable number of double bonds generally in the trans configuration. In the case of the dimeric
benzothiazine cyanines seen in the previous chapter , the chromophoric system presents a
nitrogen and a sulfur center =N-C=CH-CH=C-S-.
However, it should be noted that this is not the only way to obtain a benzothiazine cyanine
system. If the 1,4-benzothiazine reacts with an aromatic para N-alkyl substituted aldehyde, the
classical cyanine chromophore could be built.
Herein, an alternative approach to the benzothiazine cyanine dyes was developed (Figure 69),
involving reaction of the available 3-substituted benzothiazine with aldehydes. Specifically,
commercially available aldehydes having in the para position an electrondonating group were
chosen in order to construct in the expected condensation product the push pull system peculiar
of cyanine dyes in which the “pull” side should be the imine function of the benzothiazine ring.
Aldehydes bearing in the para position a hydroxyl group were also selected, as this group may
act as the donor (push side) and is also expected to give rise to an additional chromophoric shift
on deprotonation under basic conditions.

89
Figure 69. General reaction scheme for the synthesis of cyanine dyes by reaction of 3-
substituted-1,4-benzothiazine with aldehydes .
At first, the typical reaction conditions for benzothiazine dyes synthesis were used, that is
acidic methanol, in the presence of a variable excess of the desired aldehyde (1:0.5, 1:1 ; 1:2.5
and 1:10.) in order to find the optimal reaction conditions, that favour reaction of the
benzothiazine with the functionalized aldehyde over self-coupling.
Further to this screening, the optimal conditions in terms of product yields involved treatment
of the methanolic solution of the benzothiazine with a 10 fold molar excess of the aldehyde,
followed by addition of HCl to a 3M final concentration. Yet, the aldehyde that remains in the
reaction mixture is really difficult to remove, also because it is not easily separated from the
condensation product by column chromatography under a variety of elution conditions.
Therefore the synthesis were preferably carried out using a 1:1 molar ratio.
Under these conditions, it was possible to synthesize a number of benzothiazine/aldehyde
condensation products (Figure 70,72,74,76) that were subjected to full spectral
characterization

90
1
Figure 70. Condensation between 3-phenyl-1,4-benzothiazine and p-
dimethylaminobenzaldehyde
The main component of the reaction was purified by column chromatography (44% yield ) and
subjected to complete structural characterization by NMR and MS analysis and formulated as
the cyanine 1. A complete assignment of the proton and carbon resonances is shown in the
Figure 71.
Figure 71. 1H and
13C NMR resonances of compound 1.

91
2
Figure 72. Condensation between 3-phenyl-1,4-benzothiazine and 4-hydroxy-3-methoxy-
benzaldehyde (vanillin)
The main product of the reaction was isolated in pure form (40% yield) by column
chromatography fractionation and subjected to complete spectral characterization leading to
formulation of structure 2. Assignment of proton and carbon resonances of the cyanine 2 is
reported in the Figure 73.
Figure 73 1H and
13C NMR resonances of compound 2.

92
3
Figure 74. Condensation between 3-phenyl-1,4-benzothiazine and
p- dimethylaminoynnamaldehyde
The mixture was extracted with CHCl3 and the main reaction product isolated by column
purification in 33% yield. A complete NMR characterization of the cyanine compound 3 is
reported in Figure 75.
Figure 75 1
H and 13
C NMR resonances of compound 3.

93
The disubstituted double bond was assigned the E configuration based on the coupling constant
of the 6.59 and 7.02 ppm protons, whereas the configuration of the other double bond could not
be definitely assessed as no diagnostic ROESY contact could be observed. Computational
analysis of the relative energy of the possible isomers in the accessible conformations, and
comparison of the computed and experimental Uv/Vis spectra suggested that the isolated
product is the Z,E isomer as shown in Figure75 .
4
Figure 76. Condensation between 3-phenyl-1,4-benzothiazine and 4-hydroxy-3-
methoxycinnamaldehyde (ferulaldehyde)
The main product of the reaction was isolated in pure form (60% yield) by column
chromatography fractionation and subjected to complete spectral characterization leading to
formulation of structure 4. Assignment of proton and carbon resonances of the cyanine 4 is
reported in the Figure 77.

94
Figure 77.
1H and
13C NMR resonances of compound 4.
A similar series of reactions was carried out using 3-methyl-1,4-benzothiazine and p-
dimethylaminobenzaldehyde, vanillin, and p-dimethylaminocinnamaldehyde as the aldehyde
reagents. The reaction mixtures were extracted in CHCl3 and sodium carbonate and the main
product isolated through column purification in 60%, 44%, 32% and 35% yields for p-
dimethylaminobenzaldehyde, vanillin, p-dimethylaminocinammaldehyde and ferulaldehyde, in
that order. All these compounds were subjected to spectroscopic analysis and formulated as the
condensation products 5-8 shown below with assignment of the proton and carbon resonances
(Figure 78-81). The configuration shown for condensation product of p-
dimethylaminocinnamaldehyde was supported by computational analysis as in the case of the
analogous product obtained with 3-phenyl-1,4-benzothiazine (see exp).
.

95
Figure 78 1H and
13C NMR resonances of compound 5, product obtained from 3-methyl-1,4-
benzothiazine and p-dimethylaminobenzaldehyde
Figure 79 1H and
13C NMR resonances of compound 6, product obtained from 3-methyl-1,4-
benzothiazine and 4-hydroxy-3-methoxy-benzaldehyde (vanillin)

96
Figure 80 1H and
13C NMR resonances of compound 7, product obtained from 3-methyl-1,4-
benzothiazine and p- dimethylaminoynnamaldehyde
Figure 81 1H and
13C NMR resonances of compound 8, product obtained from 3-methyl-1,4-
benzothiazine and 4-hydroxy-3-methoxycinnamaldehyde (ferulaldehyde)

97
3.5.2 Characterization of the Uv-Vis absorption and fluorescence emission properties of the
cyanines
As a further step of the research work the UV-vis and absorption properties of the
benzothiazine cyanine compounds isolated and characterized were analysed under neutral and
acidic conditions.
The UV/Vis spectra of the cyanines obtained by reaction of 3-substituted 1,4-benzothiazine
with para N-alkyl substituted aldehydes are reported in Table 2, while the spectra of the
compounds obtained by condensation with the vanilline ferulaldehyde having the 3-methoxy-4-
hydroxy functionalities are reported in Table 3
Compound
max (nm)
(M-1cm
-1)
Methanol
Methanol
/first shift
Methanol /
second shift
1 440
(9200)
605
(9300)
481
(5100)
3 464
(18200)
686
(19100)
520
(10700)
5 429
(7200)
581
(11700)
481
(3200)
7 458
(4500)
644
(5600)
505
(2300)
Table 2. Absorption maxima and molar extinction coefficients of the cyanines from 3-
substituted-1,4-benzothiazine with the N-dimethylamino aldehydes.

98
Compound
max (nm)
(M-1cm
-1)
Methanol / HCl Methanol NaOH
2 530
(12200)
467
(12500)
4 580
(13500)
492
(12600)
6 505
(5500)
450
(7500)
8 553
(6600)
390
(9400)
Table 3. Absorption maxima and molar extinction coefficients of the cyanines from 3-
substituted-1,4-benzothiazine with the vanilloid aldehydes.
It can be observed that all the cyanines show a batochromic shift on acidification. However,
only those obtained from the p-dimethylamino substituted aldehydes show an ipsochromic shift
on further acidification. As expected, the cyanines obtained from the aldehydes bearing a OH
group at the para position, show a chromophoric shift in alkali.
In all cases the molar extinction coefficients of the acid forms is higher than that of the species
prevailing under neutral conditions. This is also true for the alkali shifts with the compounds
obtained from vanillin and ferulaldehyde. The molar extinction coefficients of the cyanines
obtained from 3-phenyl-1,4-benzothiazine are invariably higher than those obtained from 3-
methyl-1,4-benzothiazine.
All of the absorption changes observed may well be interpreted in terms of the cyanine type
structures proposed for the compounds investigated. Thus the batochromic shift on acidification
observed for all the chromophores can be ascribed to the enhanced “pull” characteristic of the
imine C=N system in the protonated C=NH+ form. Larger batochromic shift are expected for
the cyanines obtained from p-dimethylaminocinnamaldehyde compared to those obtained from
the p–dimethylaminobenzaldehyde on account of the more extended conjugated double bonds
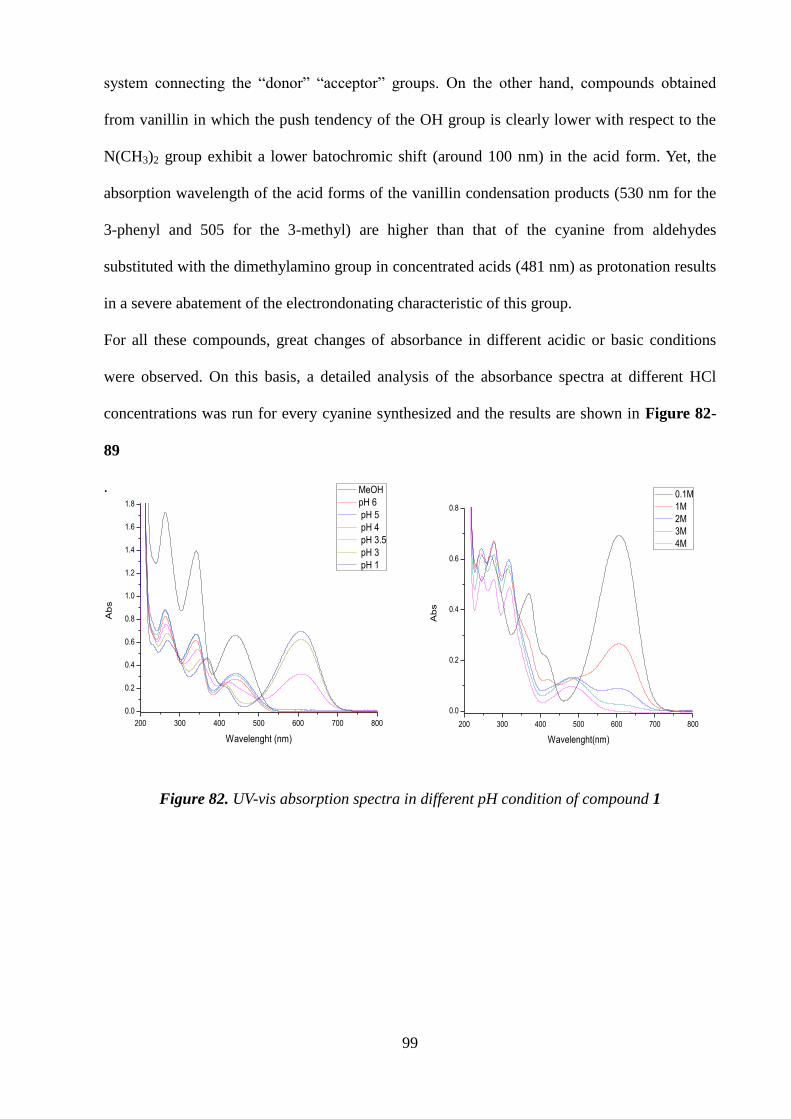
99
system connecting the “donor” “acceptor” groups. On the other hand, compounds obtained
from vanillin in which the push tendency of the OH group is clearly lower with respect to the
N(CH3)2 group exhibit a lower batochromic shift (around 100 nm) in the acid form. Yet, the
absorption wavelength of the acid forms of the vanillin condensation products (530 nm for the
3-phenyl and 505 for the 3-methyl) are higher than that of the cyanine from aldehydes
substituted with the dimethylamino group in concentrated acids (481 nm) as protonation results
in a severe abatement of the electrondonating characteristic of this group.
For all these compounds, great changes of absorbance in different acidic or basic conditions
were observed. On this basis, a detailed analysis of the absorbance spectra at different HCl
concentrations was run for every cyanine synthesized and the results are shown in Figure 82-
89
.
Figure 82. UV-vis absorption spectra in different pH condition of compound 1
200 300 400 500 600 700 800
0.0
0.2
0.4
0.6
0.8
1.0
1.2
1.4
1.6
1.8
Ab
s
Wavelenght (nm)
MeOH
pH 6
pH 5
pH 4
pH 3.5
pH 3
pH 1
200 300 400 500 600 700 800
0.0
0.2
0.4
0.6
0.8
Ab
s
Wavelenght(nm)
0.1M
1M
2M
3M
4M

100
200 300 400 500 600 700 800
0
1
Ab
s
Wavelenght (nm)
MeOH
pH 6
pH 5
pH 4
pH 3
pH 2
200 300 400 500 600 700 800
0.0
0.2
0.4
0.6
0.8
1.0
1.2
1.4
Ab
s
Wavelenght(nm)
0.1M
0.5M
1M
1.1M
1.2M
1.5M
2M
Figure 83. UV-vis absorption spectra in different pH condition of compound 2
200 300 400 500 600 700 800
0.0
0.5
1.0
1.5
Ab
s
Wavelenght(nm)
MeOH
pH 1
pH 2
pH 3
pH 4
pH 5
pH 6
200 300 400 500 600
0.0
0.5
1.0
1.5
Ab
s
Wavelenght (nm)
MeOH
pH 8
pH 9
pH 10
pH 11
pH 12
Figure 84. UV-vis absorption spectra in different pH condition of compound 3
200 300 400 500 600 700 800
-0.1
0.0
0.1
0.2
0.3
0.4
0.5
Ab
s
Wavelenght (nm)
MeOH
pH 6
pH 5
pH 4
pH 3
pH 2
pH 1
200 300 400 500 600 700 800
0.0
0.1
0.2
0.3
0.4
0.5
Ab
s
Wavelenght (nm)
MeOH
pH 8
pH 9
pH 10
pH 11
pH 12
Figure 85. UV-vis absorption spectra in different pH condition of compound 4

101
200 300 400 500 600 700
0.0
0.1
0.2
0.3
0.4
0.5
Ab
s
Wavelenght(nm)
MeOH
pH 6
pH 5
pH 4.5
pH 4
pH 3
pH 2
pH 1
200 300 400 500 600 700 800
0.0
0.1
0.2
0.3
0.4
Ab
s
Wavelenght (nm)
0.25 M
0.5 M
1M
2M
3M
4M
Figure 86. UV-vis absorption spectra in different pH condition of compound 5
300 400 500 600 700 800
0.0
0.2
0.4
0.6
0.8
1.0
Ab
s
Wavelenght (nm)
MeOH
pH 6
pH 5
pH 4
pH 3.5
pH 3
pH 2
pH 1
300 400 500 600 700 800
0.0
0.2
0.4
0.6
0.8
Ab
s
Wavelenght (nm)
pH 1
0.25 M
0.5 M
0.75M
1 M
Figure 87. UV-vis absorption spectra in different pH condition of compound 6
200 300 400 500 600 700
0.0
0.1
0.2
0.3
0.4
Ab
s
Wavelenght(nm)
MeOH
pH 1
pH 2
pH 3
pH 4
pH 5
200 300 400 500 600
0.0
0.1
0.2
0.3
0.4
0.5
Ab
s
Wavelenght(nm)
pH9
pH 10
pH11
pH12
Figure 88 UV-vis absorption spectra in different pH condition of compound 7

102
200 300 400 500 600 700
0.0
0.2
0.4
0.6
0.8
1.0
1.2
1.4
Ab
s
Wavelenght(nm)
MeOH
pH 6
pH 5
pH 4
pH 3
pH 2
pH 1
200 300 400 500 600 700 800
0.0
0.2
0.4
0.6
0.8
1.0
1.2
1.4
1.6
1.8
2.0
Ab
s
Wavelenght (nm)
MeOH
pH 8
pH 9
pH 10
pH 11
pH 12
Figure 89. UV-vis absorption spectra in different pH condition of compound 8
From this Uv-Vis spectra, it can be observed that the batochromic shift on acidification occurs
between pH 3-4 for all the compounds examined. Therefore these compounds are more easily
converted to their protonated forms compared to both the dimeric cyanines benzothiazines and
the the parent Δ2,2’
-bibenzothiazine dimer (around pH 2). Under strong acid conditions (4M
HCl) the cyanines derived from para-N-dimethylaminobenzaldehyde undergo a further
ipsochromic shift on account of the protonation of the dimethylamino group with loss of its
donor capacity. On the other hand the cyanines derived from p-N-
dimethylaminocynnamaldehyde undergo the batochromic shift under milder acidic conditions
(HCl 0.5M) Under basic conditions, the batochromic shift for the vanillin-type cyanines occurs
around pH 10. Table 4 reports all the pKa calculated from these spectra.
Compound pKa1 pKa2
1 3.5
2 2.8 10.1
3 3.8
4 3.5 9.8
5 4.2
6 4.8 9.7
7 3.4
8 3.7 10.3
Table 4. Calculated pKa for cyanines 1-8

103
Finally, the fluorescence emission properties of these compounds (Figure 90-97) were analysed
in methanol, under different acid and basic concentration conditions and in dichloromethane.
Figure 90. Fluorescence spectra of compound 1
Figure 91. Fluorescence spectra of compound 2
MeOH 440 nm exc
DCM 410 nm exc
MeOH 1st
acidic shift
610 nm exc
MeOH 2nd
acidic shift
480 nm exc
MeOH 410 nm exc
DCM
400 nm exc
MeOH acidic shift
530 nm exc
MeOH basic shift
480 nm
0 nm exc

104
Figure 92. Fluorescence spectra of compound 3
Figure 93. Fluorescence spectra of compound 4
MeOH 465 nm exc
DCM
465 nm exc
MeOH 1st
acidic shift
680 nm exc
MeOH 2nd
acidic shift
520 nm exc
MeOH 430 nm
exc
DCM
435 nm exc
MeOH acidic shift
580 nm exc
MeOH basic shift
490 nm
0 nm exc

105
Figure 94. Fluorescence spectra of compound 5
Figure 95. Fluorescence spectra of compound 6
MeOH 405 nm exc
DCM 415 nm exc
MeOH 1st
acidic shift
580 nm exc
MeOH 2nd
acidic shift
430 nm exc
MeOH 400 nm exc
DCM
400 nm exc
MeOH acidic shift
510 nm exc
MeOH basic shift
430 nm
0 nm exc

106
Figure 96. Fluorescence spectra of compound 7
Figure 97. Fluorescence spectra of compound 8
MeOH 390 nm exc
DCM
430 nm exc
MeOH acidic shift
530 nm exc
MeOH basic shift
390 nm
0 nm exc
MeOH 450 nm exc
DCM
450 nm exc
MeOH 1st
acidic shift
640 nm exc
MeOH 2nd
acidic shift
500 nm exc

107
From these spectra it can be observed that the highest fluorescence emission was exhibited by
the condensation product of 3-methyl-1,4-benzothiazine with vanillin. Also the compounds
obtained from ferulaldehyde and condensation product between 3-methyl-1,4-benzothiazine
and para-N-dimethylamino-benzaldehyde show a modest emission of fluorescence .As a
general trend, the fluorescence is almost completely switched off in acidic conditions. This
behavior is common for almost all the compounds investigated, with the only exception
represented by the product obtained from 3-methyl-1,4-benzothiazine and para-N-
dimethylamino-benzaldehyde. In this case the fluorescence is switched off where the first
protonation occurs, but switches on again under more acidic conditions when the second
protonation takes place.
To evaluate the potential of these compounds as fluorescence reporter the fluorescence
quantum yield was determined (Table 5) in comparison with the standard compound
rhodamine b, according to the equation shown below90
:
Where is the quantum yield, F is the area of the fluorescence spectrum , A is the absorbance
intensity and η the is the refractive index.

108
Table 5: Emission wavelengths and quantum yields of cyanines 1-8 compared to the
standard rhodamine b
Compound
λmax
excitation
(nm)
λmax
emission
(nm)
Quantum
yield
DCM
Quantum
yield
MeOH
1 440 547 0.001 0.00022
2 413 527 0.00049 0.00012
3 464 631 0.00089 0.00023
4 430 560 0.00033 0.00034
5 429 545 0.0021 0.0038
6 401 502 0.011 0.0018
7 458 611 0.0013 0.0023
8 400 525 0.004 0.00099
These quantum yields confirm the general trend already discussed before, that is the highest
fluorescence is associated to the 3-methyl-benzothiazine condensation products. Moreover, the
fluorescence observed in dichloromethane are higher compared to methanol, with the only
exception rapresented by the cyanine obtained from 3-methyl-1,4-benzothiazine and para-N-
dimethylaminobenzaldehyde.
Table 6, instead , shows the quantum yield for the basic shifts that occur in the cyanines
containing 4-hydroxy-3-methoxy moiety on the aromatic portion of the cyanine. Again, the
highest quantum yield is observed for the condensation product involving 3-methyl-
benzothiazine and vanillin.

109
Table 6: Emission wavelengths and quantum yields of cyanines obtained from
4-hydroxy-3-methoxy aldehydes in basic conditions compared to the standard
rhodamine b
Compound
λmax
excitation
(nm)
λmax
emission
(nm)
Quantum yield
MeOH/ NaOH
2 480 - -
4 490 520 0.00093
6 430 530 0.0011
8 390 500 0.0007
Finally , the quantum yield of the diprotonated form of 3-methyl-1,4-benzothiazine and para-
N-dimethylamino-benzaldehyde cyanine was determined and it turned out to be the same
quantum yield calculated for its neutral form (0.0038)

110
3.6 Role of benzothiazine structural units in pheomelanin properties:
UV-independent prooxidant effects of natural and model pigments.
3.6.1 Background
As already mentioned in the introduction, the positive correlation between red hair and
melanoma has been attributed to both the poor antioxidant and photoprotective properties of
pheomelanins compared with the dark eumelanins, and the capacity of pheomelanin to act as
photosensitizer inducing generation of reactive oxygen species (ROS) upon irradiation with UV
light46,91
However, the question as to how eumelanin and pheomelanin may have a direct role
in melanoma or skin cancer has remained open. Recent works have provided evidence for UV-
independent pathways of carcinogenesis in red hair phenotypes , in which pheomelanin toxicity
has been accounted for in terms of an enhanced formation of ROS which could overwhelm
cellular antioxidant reserves and cause oxidative damage to biomolecules including free
nucleobases in the cytosol62
Based on this background, with the aim of providing an interpretation at molecular level for
ROS production in red hair individuals, a series of experiments were carried out to probe the
reactivity of natural and synthetic pheomelanins toward cellular antioxidants that are critical for
maintaining the redox balance.
3.6.2 Pigments extraction and isolation
Preliminarily, red hair pheomelanin was obtained by purification from hair by enzymatic
digestion, not altering the structure of the pigment (RHP) and, for comparison, purified human
black hair eumelanin (BHE) and synthetic melanin from 5SCD (CD-mel) were prepared
according to standardized protocols92

111
Isolation of natural melanin pigments represents quite a difficult task because of the close
association of proteins and other biological components with melanin. The impact of isolation
procedure on the structural and physical properties of natural melanins has now been fully
appreciated93
.
Harsh hydrolytic treatments with boiling mineral acids or alkali largely used in the past have
been abandoned following realization that, in spite of the lack of visual changes, pigment
skeleton and functionalities are profoundly affected. Heating of melanins with or without
hydrochloric acid at reflux has been shown to lead to extensive decarboxylation94,95
and care
must be taken to avoid extremes in pH and temperature. In general, no attempt should be made
to separate melanin from these internal proteins, because such a separation would destroy the
granules. Current strategies revolve on the attack of the keratin matrix by breaking disulfide
bonds and exposure to proteolytic digestion.96
Homogenization of the finely minced hair sample is required prior to exposure to proteolytic
agents to favour their action. This can be achieved by use of a glass/glass potter such as
Tenbroeck homogenizer while other mechanical devices (grinder, ultrasonic disrupters)
currently employed for tissue homogenization prove often inappropriate. It is preferable to use
freshly collected hair samples, as photoaging induces structural modifications not only in
pheomelanins97
but also in eumelanins.98
By sequential use of proteinase K, papain and
protease type XIV, and pre-treatment of the tissue with dithiothreitol, protein removal can be
efficient. The enzymatic extraction preserves the integrity of the melanosome, removes most of
the external proteins, and therefore should be the preferred choice for isolation of melanin from
hair samples 93,95
On chemical analysis, purified RHP showed a 11-fold enrichment in melanin with respect to
the starting hair. The content of pigment in RHP was estimated as 57% based on EPR analysis
(from the ratio of the double integration of the RHP and CD-mel spectra).

112
3.6.3 RHP promotes GSH and NADH autoxidation
In an initial experiment the effect of RHP on the autoxidation of GSH, the most important
cellular antioxidant, and NADH, a central component of the respiratory chain and a critical
index of the metabolic state of the mitochondria in terms of energy production and intracellular
oxygen levels99
, was investigated. RHP proved soluble in the neutral phosphate buffer solution
at the concentrations used as was CD-mel.
Figure 98 shows the effects of RHP on the levels of GSH and NADH at physiologically
relevant concentrations after incubation in the dark in air-equilibrated metal-free buffer.
Data showed a remarkable increase in the oxidation rate of both compounds in the presence of
RHP compared to the controls, whereas less marked variations were noticed with BHE. HPLC
analysis with UV and electrochemical detection consistently indicated a rise in GSH disulfide
(GSSG) levels with GSH decrease, confirming a redox reaction.
Formation of NAD+ was similarly observed in the reaction mixture of NADH with RHP.
In other experiments using NADPH, with RHP at 1:1 w/w ratio, a complete consumption was
obtained at 24 h with concomitant formation of NADP+ (not shown). Similar effects were
observed using a model CD-mel, confirming that the pigment was the active component of the
RHP sample. Separate experiments on the effect of RHP on the autoxidation of GSH at 2 mM
concentration, using the colorimetric Ellman’s thiol assay100
,showed a similar trend with a
90% consumption of GSH after 3-h incubation with RHP 1:2 w/w versus a negligible
consumption with BHE (see Figure 99).

113
Figure 98. Residual (%) GSH (A) and NADH (B) after 1 h (GSH) or 24 h (NADH) in 0.1 M
phosphate buffer (pH 7.4) in the absence (control, n =7) or in the presence of RHP (n =5),
BHE (n =5) or CD-mel (n =5) (initial substrate concentration: 150M; substrate/ melanin=1:1
w/w). All values are expressed as the mean SD. Significant differences were determined by
independent samples two-tailed t test. P < 0.05 is considered significant; exact P-values are
shown in each plot.
Good linear correlations between RHP concentration (w/v) and GSH consumption at various
intervals of time were observed (Figure 100)

114
Figure 99. Residual (%) GSH after 3 h in 0.1 M phosphate buffer (pH 7.4) in the absence
(control, n=5) or in the presence of RHP (n=5) or BHE (n=5). (Initial substrate concentration:
2 mM; substrate/melanin=1:2 w/w). All values are expressed as the mean ± s.d. Significant
differences were determined by independent samples two-tailed t-test. P < 0.05 is considered
significant; exact P-values are shown in each plot.
No GSH or NADH depletion was observed in experiments carried out with exclusion of
oxygen (Figure 101). ROS production from RHP and CD-mel in the presence of GSH in
phosphate buffer (pH 7.4) was investigated by different methods including EPR spectroscopy
method using 5,5-dimethyl-1-pyrroline-N-oxide (DMPO) as spin trap9 and the nitroblue
tetrazolium assay8. Yet, under a variety of conditions, no significant differences with respect to
control experiments in the absence of melanin or GSH were observed. It is possible that ROS
slowly generated under these conditions are entrapped by RHP itself as previously reported19

115
Figure 100. Residual (%) GSH after 1 h (A), 2 h (B) or 3 h (C) in 0.1 M phosphate buffer (pH
7.4) in the presence of variable amounts of RHP (n=5 for each concentration) (initial
concentration of GSH: 2 mM). All values are expressed as the mean ± s.d. Trend lines and
correlation coefficients are indicated
Notably, neither superoxide dismutase (SOD) nor catalase nor a combination of the two
affected oxygen dependent GSH consumption in the presence of RHP (Figure 101).

116
Figure 101. Residual (%) GSH after 1 h in 0.1 M phosphate buffer (pH 7.4) under different
reaction conditions as indicated in the Methods section. All values are expressed as the mean ±
s.d (control, n= 7; other conditions, n= 5).
Based on the above data, it was concluded that RHP does not produce significant levels of ROS
but can induce depletion of GSH and NADH by a UV- and ROS-independent mechanism.
Whether redox- active metal ions commonly present in natural melanins101
played any role in
the observed effects is difficult to assess. Indeed, EPR analysis revealed variable Fe3+
and Cu2+
content in the melanin samples under investigation (Figure 102) that, however, did not
correlate with the extent of the observed effects. In separate experiments aimed at assessing the
effect on GSH autoxidation of Fe3+
or Cu2+
at 30 or 6 M concentration, respectively, that is at
levels comparable to those reported for purified red hair melanonosomes101
, no appreciable
enhancement of the substrate decay with respect to the control was observed, suggesting that
the effects of RHP on antioxidant depletion are not primarily due to the presence of metal ions.

117
Figure 102. EPR spectra of CD-mel (A), RHP (B) and BHE (C). The signal at low magnetic
field is due to iron ions. The intermediate signals indicate the presence of copper(II) ions. The
singlet signal is from the melanin stable radical (g=2.005). The presence of iron ions in the
CD-mel sample is likely due to contaminants from the phosphate buffer used for melanin
preparation.
3.6.4 GSH affects pheomelanin EPR signal in RHP
In subsequent experiments, the mechanism of GSH oxidation by RHP was investigated by EPR
spectroscopy. Both eumelanin and pheomelanin give characteristic EPR signals that reflect the
different p-electron properties of the two pigments. Whereas at the X-band eumelanins give a
single slightly asymmetric line 0.4–0.6 mT wide with a pH-dependent g-factor close to 2.004,
pheomelanins exhibit broader signals with the total width approximately 3 mT and g =

118
2.00581,92
Furthermore, in pheomelanin spectra, a clear hyperfine coupling of unpaired electrons with
nitrogen nuclei is detectable from the presence of a peak (or a shoulder) on both sides of the
central line.
The EPR spectrum of RHP revealed the presence of the signals for both the eumelanin and the
pheomelanin components (Figure 103). The ratio between the two components can be
estimated according the well assessed approach reported in the literature102,103
Figure 103. EPR spectrum of RHP alone [0.5 mg/ml in 0.1 M phosphate buffer (pH 7.4)] (A)
and after 24 h incubation with GSH (1: 5 w/w) (B). The height of the major peak, b, and that of
the additional peak due to nitrogen hyperfine coupling, a, are indicated.
In our sample, an initial pheomelanin/eumelanin ratio of 2.5 was estimated. Following
incubation with GSH, a detectable decrease in the pheomelanin component relative to the
eumelanin component was apparent (i.e., the pheomelanin/eumelanin ratio falls to 1.2) (Figure
103B), with a concomitant increase in signal linewidth. The origin of the signal broadening in

119
the presence of GSH was not assessed and may deserve further attention. The effect apparently
reflects an increase in the coupling constant due to a decreased spin delocalization and a
confinement of the unpaired electron closer to the nitrogen, but other effects relating, for
example, to intermolecular interactions governed by H-atom transfer from GSH could be
involved as well.
No significant changes of the EPR signal of RHP were observed in the absence of GSH over 24
h (Figure 104). A significant broadening of the EPR signal was observed also for CD-mel after
24-h incubation with GSH at 1: 5 w/w ratio (Figure 105).
Figure 105. EPR spectrum of RHP (0.5 mg/mL 0.1 M phosphate buffer (pH 7.4)) before (A)
and after (B) 24 h incubation in the absence of GSH.

120
Figure 106. EPR spectrum of CD-mel (0.5 mg/mL 0.1 M phosphate buffer (pH 7.4)) before (A)
and after 24 h incubation in the absence (B) or in the presence (C) of GSH (1: 5 w/w).
3.6.5. RHP promotes melanin formation in the absence of enzymes
The potent pro-oxidant properties of RHP toward GSH and NADH, and previous observations
of the pro-oxidant properties of synthetic CD-mel toward catechol compounds97
prompted
further experiments aimed at assessing whether the natural pigment is able to promote the
oxidation of melanin precursors, for example DOPA and 5SCD.
Figure 107 reports the effect of RHP on the rate of oxidation of DOPA and 5SCD at 1 mM
concentration in air equilibrated phosphate buffer at pH 7.4, in the dark.
As in the previous study97
, the results revealed the unexpected ability of RHP to promote the
oxidative conversion of 5SCD and DOPA to pigment polymers under conditions of complete
exclusion of light.

121
Figure 107. Residual (%) DOPA (A) and 5SCD (B) after 24 h (DOPA) or 3 h (5SCD) in 0.1 M
phosphate buffer (pH 7.4) in the absence (control, n =5) or in the presence of RHP (n =5) or
BHE (n =5) (initial concentration of substrate: 1 mM; substrate/melanin=1/2 w/w). All values
are expressed as the mean SD. Significant differences were determined by independent samples
two-tailed t test. P < 0.05 is considered significant; exact P-values are shown in each plot. (C)
Visual course of the oxidative conversion of DOPA to eumelanin promoted by RHP.
The differences in the conversion rate reflect the higher intrinsic oxidizability of 5SCD relative
to DOPA. The effect of RHP on DOPA oxidation leading to accumulation of a eumelanin-like
polymer is shown in Figure 107(C). Unlike RHP-melanin, BHE had a negligible effect on
5SCD and DOPA oxidation. Control experiments indicated moreover that oxidation of melanin
precursors is completely inhibited under an argon atmosphere, ruling out a role of adsorption
and other physical phenomena.
Little or no effect on the oxidation rates was observed n the presence of SOD, catalase or both
enzymes.

122
3.6.6 Red human hair pheomelanin is a potent pro-oxidant
The results of this study provide unambiguous evidence that RHP, but not BHE, behaves like a
unique pseudobiocatalyst, accelerating autoxidation of two important cellular antioxidants and
melanin precursors in the absence of UV stimulation. The reactions can be initiated by simple
addition of the compounds to purified RHP in aqueous buffer in the presence of air at room
temperature. This behavior is an unique characteristic of RHP, as other natural pigments or
biopolymers don't seem to induce similar effects. The origin of this effect is probably due to a
combination of factors that cause pheomelanin to play different biological roles with respect to
eumelanin, namely a greater solubility, a peculiar chemical nature reflecting the lack of the
extended, highly conjugated and tightly stacked molecular components that account for the
black and compact character of eumelanin granules and, possibly, the different ability to chelate
and retain metal ions101
. A photoelectron emission microscopy determination of the oxidation
potential of human eumelanosomes and pheomelanosomes revealed ionization thresholds of 4.6
and 3.9 eV corresponding to oxidation potentials of -0.2± 0.2 and +0.5 V ± 0.2 vs normal
hydrogen electrode, respectively104
. Moreover, studies of the effect of added melanosomes on
the reduction of Fe(III)-cytochrome showed pheomelanosomes are stronger reducing agents
than eumelanosomes, consistent with the measured oxidation potentials104
. Based on the
observed potentials and those known for some important cellular ingredients,
pheomelanosomes were predicted to induce greater oxidative stress (via reduction of O2) than
eumelanosomes. Although the above conclusions suggested a different reactivity with respect
to the results obtained so far , it is worth noting that both of them suggest a role of
pheomelanins in promoting oxidative stress. Conversely, it remains to be assessed how these
results can be reconciled with a recent report105
showing that both eumelanin and pheomelanin
lead to DNA breakage in the absence of light irradiation and that eumelanin is more harmful
than pheomelanin. In that study, however, the effects of synthetic melanin samples were

123
attributed to Fenton-type reactions mediated by copper and iron ions and inhibited by catalase,
a mechanism which does not apply to the present experiments.
Herein, data from EPR experiments suggested that RHP promotes GSH oxidation by a direct
H-atom transfer from the thiol to free radical moieties of the pigment, causing selective
decrease in the EPR response of the pheomelanin component. Notably a similar effect on the
pheomelanin signal of red hair was reported following incubation with another reducing agent
like ascorbic acid106
. Subsequent interaction of reduced RHP with oxygen would regenerate the
free radical population with concomitant formation of superoxide and other ROS, thus
sustaining a redox cycle.
It has been shown that RHP consists mainly of benzothiazolylthiazinodihydroisoquinoline
units40
which arise by oxidative coupling of two benzothiazine units. It is therefore possible
that the free radical signal of RHP reflects an o-aminophenol/o-quinoneimine= 2
semiquinoneimine equilibrium within the pigment (Figure 108) akin to the catechol/o-
quinone= 2 semiquinone comproportionation equilibrium of eumelanins81,107
and that GSH
shifts the equilibrium toward the o-aminophenol component by H-atom transfer to the
semiquinoneimine.
The decrease in the pheomelanin component in RHP in the presence of GSH evidenced by EPR
analysis would suggest that a portion of the species resulting from the reducing action of GSH
may undergo irreversible conversion into other species that cannot take part any more at the
equilibrium shown. That this is due to the action of GSH and not to a spontaneous reaction of
the pigment alone is shown by the negligible modification of the EPR spectrum of RHP after
24 h in the absence of GSH. Moreover, the similar effects observed in the case of CD-mel
would indicate that changes of the EPR signal produced by GSH are specifically associated to
the pheomelanin component of the purified RHP.

124
Figure 108. (A) Major structural component of RHP deduced from previous model studies and
chemical analysis Highlighted is a possible redox-active moiety. (B) o-aminophenol-
semiquinoneimine-o-quinoneimine conversion sequence supposedly implicated in the EPR
detectable response of RHP to GSH. Reported structures are indicative and do not intend to be
representative of the broad variety of isomers and tautomers contributing to RHP response to
GSH.
The scheme illustrated in Figure 108 is clearly an oversimplification of the actual oxidation
process that, depending on the relative concentration of the participating species, may involve
additional mechanisms. Pheomelanin pigments are generated within the melanosomes,
organelles that contain the biochemical machinery for production of pigments. Hair
pheomelanosomes are less regularly shaped than eumelanosomes, may appear as ellipsoids and
spheres showing microvescicular and proteinaceous matrices on which melanin deposition is
spotty and granular, and do not maintain structural integrity upon extraction from the keratin
matrix101,108
Once pheomelanosomes are mature, they are transferred to keratinocytes, where they are made
available to come into contact with major cellular ingredients including GSH, NADH and other
redox-active biomolecules. Thus, both in melanocytes and keratinocytes, the pigment

125
components of pheomelanosomes, which seems to be more accessible than those of the
compact eumelanosomes, can induce a depletion of cellular antioxidants at micromolar
concentrations.
DOPA or 5SCD oxidation by RHP is likely to occur by a redox exchange mechanism akin to
that proposed in Figure 108 for the oxidation of GSH and NADH. The implications of these
results are manifold and highly relevant to the mechanisms of melanogenesis in a pheomelanin-
forming environment. It can now be proposed that pheomelanin, once produced in small
quantities in active melanizing cells, can grow partly in the absence of enzymatic assistance,
with both eumelanin and pheomelanin precursors taking part in the nonenzymatic pigment
growth process. This observation would point to a much broader and general relevance of the
casing pheomelanin core/eumelanin shell model of melanogenesis than so far believed51, 109
.
It is clear, however, that such processes are much slower than those mediated by melanogenetic
enzymes, particularly in the case of DOPA, and may become relevant at high pigment to
monomer ratios. Moreover, and most importantly, these data settle a long-lasting issue of what
oxidizing system brings about pheomelanin synthesis, as it is known that the committed
enzyme of melanogenesis, tyrosinase, is unable to oxidize 5SCD and benzothiazine
intermediates thereof110
. The common practice to produce synthetic pheomelanin from 5SCD in
the presence of tyrosinase relies on the presence of catalytic amounts (5%) of DOPA that upon
oxidation by the enzyme generates dopaquinone which is able to oxidizes 5SCD53
.
Besides the relevance to melanogenesis, the observed abatement of the melanin precursor pool
may also play a contributory role in determining the pro-oxidant background of red hair/pale
skin for melanoma and skin carcinogenesis. 5SCD, such as DOPA, is a potential antioxidant
and metal chelating agent111
that is produced in response to a range of stimuli, including sun
exposure, inflammation and a number of disease states regardless of constitutive
pigmentation112,113
. Circulating 5SCD levels are also abnormally high in melanoma patients114
.
Thus, 5SCD is part of the adaptive response of melanocytes to environmental cues independent

126
of their genetic background and, as such, is not a marker of pheomelanogenesis per se.
Oxidative conversion of 5SCD to pheomelanin occurs only in the presence of an oxidizing
environment where active eumelanogenesis is lacking. In this perspective, spontaneous
pheomelanin growth may be seen as an oxidative stress-amplifying mechanism by which the
antioxidant 5SCD is consumed in a toxic pigment-forming reaction, providing a permanent
threat to a specific antioxidant defense of melanocytes. Such a chronic prooxidant condition
would be exacerbated by, but is independent of, photostimulation. The burst in the ROS levels
and particularly singlet oxygen associated to sun exposure in the absence of a defensive action
by a photoprotective/scavenging pigment like eumelanin or cellular antioxidants at proper
levels is expected to dramatically accelerate the processes that pheomelanin pigment is able to
sustain per se, thus amplifying DNA damages and lipid peroxidation that are well-known
hallmarks of photoaging and carcinogenesis115,116
The finding that purified RHP, but not BHE, is a potent pro-oxidant promoting the oxygen-
dependent, Uv-independent depletion of crucial antioxidants for cell homeostasis and
mitochondrial functions as well as of melanin precursors provides an unprecedented
background to address some major questions concerning the role of pheomelanin synthesis in
melanomagenesis45,62
First, it was hypothesized that pheomelanin generates ROS that cause DNA damage, and an
issue was raised of what about the structure of pheomelanin causes ROS production. These
results show that pheomelanin can bring about GSH and NADH autoxidation via direct H-atom
exchange. The subsequent reoxidation of reduced pheomelanin by oxygen may generate ROS.
Thus, pheomelanin-related DNA damage would be the result of a major antioxidant depletion
via a direct interaction mechanism, with a concomitant partial contribution of ROS generation,
and a reductive step would provide the necessary input to induce ROS generation by
pheomelanins.
Second, it has been proposed that pheomelanin synthesis per se leads to GSH depletion. While

127
this is certainly true, these findings show that pheomelanin may specifically contribute to GSH
depletion also by a direct UV-independent redox mechanism.
In addition, a third contributory mechanism could be suggested by which pheomelanin may
cause oxidative stress, that is, the direct oxidative conversion of circulating precursors with
antioxidant properties into new pheomelanin operating as pro-oxidant. This latter observation
settles the issue of what actually brings about pheomelanin synthesis in the absence of
enzymatic assistance.
These results may inspire new strategies to prevent and manage melanoma based on the
inhibition of the prooxidant activity of pheomelanosomes to restore the firstline antioxidant
armamentarium of melanocytes.

128
3.7. Photochemistry of pheomelanins: spectroscopic investigation of
benzothiazole building blocks
3.7.1 Background
Following several studies on the reactivity of the putative pheomelanin biosynthetic
intermediates40,41
and chemical degradation analysis of pheomelanic tissues it seems now clear
that pheomelanin structure includes in addition to benzothiazine-related units also
benzothiazole moieties. Recently evidence has been obtained that a significant portion of
benzothiazine units of pheomelanin in tissues undergoes ring contraction to benzothiazole on
exposure to UVA.97,98
It follows that characterization of the photoreactivity of benzothiazole
moieties is central for dissecting the complex mechanisms underlying pheomelanin
phototoxicity.
Despite the major role played in pheomelanin phototoxicity, the photoreactivity of these species
has so far remained unexplored.
3.7.2 Aim of the study
By combining steady state and time resolved fluorescence methodologies an investigation of
the main benzothiazole building blocks of pheomelanin, i.e. 6-(2-amino-2-carboxyethyl)-4-
hydroxy-1,3-benzothiazole (BT) and 6-(2-amino-2-carboxyethyl)-4-hydroxy-1,3-
benzothiazole-2-carboxylic acid (BTCA) was carried out in collaboration of the research unit
headed by professor Villy Sundstrom of the Department of Chemical Physics of Lund
University (Sweden). Consideration of the structure of these molecules featuring several
ionisable functional groups (heterocyclic N, aromatic OH, COOH and aminoacid

129
functionalities) would suggest that excited state proton transfer to solvent (ESPT) and excited
state intramolecular proton transfer (ESIPT) may play a crucial role. Such a behavior has been
observed also in the case of structurally related molecules like the 2-(2-hydroxyphenyl)- 1,3-
benzothiazole that has been the subject of detailed investigation.117-119
In order to help identification of the excited state processes we also investigated some model
benzothiazoles like 2-methyl-1,3-benzothiazole (MB) and 4-hydroxy-6-methyl-1,3-
benzothiazole (M-BT), having the chromophores of BT and BTCA but stripped of some of the
functional groups like the hydroxyl group at the 4-position or the alanyl side chain at 6-position
(Scheme 7).
Scheme 7. Molecular structures of pheomelanin building blocks and model chromophores.

130
While MB is commercially available, BT and BTCA were obtained by a one pot
multistep procedure starting from 5-S-cysteinyldopa.120
A similar synthetic route was
developed to obtain M-BT. All benzothiazole compounds were investigated in aqueous buffer
solutions at selected pHs in the range 1-12 (values specified below for each molecule), as well
as in methanol (MeOH). At the lowest pH studied the heterocyclic nitrogen of benzothiazole as
well as the aminoacidic amino group are mostly in the protonated form, and the aromatic and
aminoacidic COOH groups are not dissociated according to the pKa reported in Table 1.121-124
At the highest pH all groups are deprotonated and BT is in its dianionic BT2-
form and BTCA
in its trianionic form BTCA3-
(the notation used for the different protonation states is
summarized in Table 7).
Functional group (reference compound) Ground state pKa (ref)
NH+ (4-hydroxy-1,3-benzothiazole) 1.84 (121)
COOH (1,3-benzothiazole -2-carboxylic acid) 3.3 (122)
COOH (tyrosine) 2.2 (123)
NH3+(tyrosine) 9.1 (123)
OH (4-hydroxy-1,3-benzothiazole) 8.8 (124)
================================= =================
§BT Protonation state Notation
OH; NH+; NH3
+; COOH/ COO
- BTH2
2+
O-; NH
+; NH3
+; COOH/ COO
- BT
-+
OH; N; NH3+; COOH/ COO
- BT
+
O-; N; NH3
+; COO
- BT
-
O-; N; NH2; COO
- BT
2-
§Some species were combined in one disregarding their different COOH protonation states when it
was not possible to distinguish between their individual contribution to the emission spectra.
Table 7. Ground state pKa values of functional groups occurring in the benzothiazoles under
investigation, and notation used for the various protonation states of 4-hydroxy-1,3-
benzothiazole.

131
3.7.3 Steady state and time resolved fluorescence investigation of MB
Figure 109a/b displays the static absorption and fluorescence spectra of MB measured at pH 1
(in HCl solution), 2.5, 7, and 9.5 (phosphate buffer) and in MeOH. The absorption spectra of
MB are very similar under all conditions examined whereas the fluorescence spectra differ
significantly. In MeOH, the fluorescence spectrum is characterized by a small Stokes shift (max
~ 330 nm) suggesting that fluorescence originates from a position close to the Franck-Condon
geometry and that no significant photochemistry occurs. Similarly, at pH 9.5 the fluorescence
spectrum peaks at max ~ 340 nm (Figure 109b). At pH 1, the emission spectrum exhibits a red-
shifted broad band centered at 410 nm (Figure 109b). Based on the pKa= 1.84 of the
heterocyclic nitrogen121
(Table 7), at this pH the dominating ground state species is MBH+
(88 %, NH+).
Therefore we assign the 410-nm fluorescence to protonated MB, MBH+. At pH 2.5, almost the
same fluorescence spectrum is observed as at pH 1 (Figure 109b), although the ground state
species present are MBH+ (~18%) and MB (~82%) (as judged by the pKa= 1.84 of the
heterocyclic N,(Table 7). The fact that only MBH+ fluorescence is observed at pH 2.5 (with 18
% ground state population) can be understood as a result of excited state proton transfer from
the solvent to the photoexcited MB. The heterocyclic nitrogen is known to be a photobase,124
i.e. a stronger base in the excited state. A Förster cycle calculation based on the fluorescence
maxima of MB (max ~ 340 nm at pH 9.5) and MBH+ ((max ~ 410 nm) results in a ΔpKa* 10
pH units. Thus, it follows that proton transfer from the solvent to the thiazole nitrogen of the
excited MB molecule is thermodynamically strongly favored. Consequently we conclude that
the 410 nm fluorescence band at pH 2.5 originates from both the (18 %) ground state
population of MBH+ and the MBH
+ formed through ESPT from the solvent.

132
Figure 109. (a) Ground state absorption and (b) steady-state fluorescence (upon 266 nm
excitation) spectra of MB in MeOH and at pH 1, 2.5, 7 and 9.5. (c) Time resolved fluorescence
spectra of MB at pH 2.5. (d) Streak camera fluorescence kinetics of MB at pH 2.5 at several
different wavelengths together with their fits, yielding a single exponential lifetime of 140 1
ps.
The red-shifted MBH+ fluorescence is similar to that of the hydroxyphenylbenzothiazole
protonated form at 440 nm.117,118
Time resolved fluorescence spectra of MB in pH 2.5 buffer
(Figure 109c) exhibit a broad band centered at ~430 nm (in agreement with steady-state
fluorescence), characterized by single exponential kinetics (Figure 109d), and therefore a
single decay associated spectrum (DAS, Figure 110), having a decay time of 140 ps.

133
Figure 110. Decay associated spectrum of MB at pH 2.5.
This shows that MBH+ is formed within the time resolution of the experiment (<10 ps).
This and no detectable fluorescence at ~340 nm of the excited major ground state species
(neutral MB) suggest that MBH+ is formed along a N-H hydrogen bond already present in the
ground state, and therefore very fast. At intermediate pH 7 the fluorescence spectrum is
dominated by the 340-nm band observed at pH 9.5, but has also a low amplitude of the pH 2.5
band at ~430 nm (Figure 109b), supporting the picture of ESPT from the aqueous solvent to
the ring nitrogen, since at this pH the ground state population of MBH+ is negligible; the low
amplitude is of course a result of the low proton concentration at this pH.
3.7.4 Steady state and time resolved fluorescence investigation of BT
The absorption spectra of BT in sodium phosphate buffer at different pHs as well as in
MeOH are shown in Figure 110a. The spectra in buffer at pH 2.5 and in MeOH are very
similar. The absorption spectrum measured at pH 9.5 shows a shift of ~ 4 nm for all its spectral
features compared to that at pH 2.5 and exhibits an extra band centered at ~335 nm. Based on
the pKa values listed in Table 7, at this pH the majority of the BT molecules have deprotonated
(O-) form. The additional absorption band can therefore be assigned to this species.

134
A similar red-shifted absorption band of hydroxyphenylbenzothiazole in aqueous
ethanol solution, increasing in intensity with increasing pH, was attributed to the deprotonated
(O-) form, although in that structure a more extended delocalization of the anion compared to
BT is expected.125
Steady state emission spectra of BT in MeOH and aqueous buffer solutions in the pH
range 2.5-12, measured upon 266 nm excitation, are shown in Figure 110b. A small Stokes
shift is observed in MeOH (max ~390 nm) similarly to MB, suggesting no significant
photochemistry and that emission originates from BT in the OH form
Figure 110. (a) Ground state absorption and (b) steady-state fluorescence (upon 266 nm
excitation) spectra of BT in MeOH and at various pHs. (c) Time resolved fluorescence spectra
of BT in aqueous buffer at pH 2.5. (d) DAS of the three components of BT in pH 2.5 buffer with
lifetimes t1 < 10 ps, t2 = 230 3 ps, t3 = 1 0.2 ns.

135
Accordingly, the time-resolved fluorescence spectra and kinetics at selected wavelengths show
a time independent spectrum and wavelength independent kinetics with a decay time of 255 ps
(Figure 111). The static fluorescence spectra in phosphate buffer solution at different pHs all
exhibit large Stokes shifts (Figure 110b) and appear to be composed of at least two different
emitting species with pH-dependent concentrations. At pH 12 dianionic BT2-
is the dominating
ground state species with only a small (0.12 %) contribution of mono-anionic BT- (Table 7).
This sample composition gives rise to the fluorescence spectrum (Figure 110b) peaking at
~480 nm with a shoulder at ~430 nm (Figure 112 ), which we consequently assign to BT2-
(~480 nm) and BT- (~430 nm) (more below). At pH 9.5, BT
- and BT
2- are at about the same
concentrations and the static fluorescence spectrum composed of the ~430-nm BT- and ~480-
nm BT2-
emission bands.
Figure 111: (a) Time resolved fluorescence spectra and (b) fitted kinetics of BT in MeOH,
yielding a single exponential lifetime of 255 2 ps.

136
Figure 112: Experimental Steady state emission spectra of BT (red curve) together with their fit
(black curve) and the constituting components in aqueous buffer at (a) pH 2.5, (b) pH 9.5 and
at (c) pH 12, plotted in wavelength scale.
At pH 2.5 the ground state population is 82 % of BT and 18 % of the species protonated also at
the heterocyclic nitrogen (BTH22+
) based on pKa in Table 7. Nevertheless, the steady state
emission spectrum is not that of the neutral form (BT), but red-shifted by ~200 nm from the
peak of the absorption band to max ~ 490 nm (Figure 112b). In analogy with what was
observed for MB and as will be clear from the time resolved fluorescence results (below), this
emission originates mainly from BTH22+
formed through excited state proton transfer to the
heterocyclic N. At pH 7, ground state BT is in its neutral form and the static fluorescence
spectrum exhibits a double peak structure with maxima at ~430 and ~490 nm, i.e. those of BT-
and BTH22+
. The ground state concentrations of BT- and BTH2
2+ are negligible at pH 7,
suggesting that these fluorescence bands must be a result of de-protonation of the 4-OH group
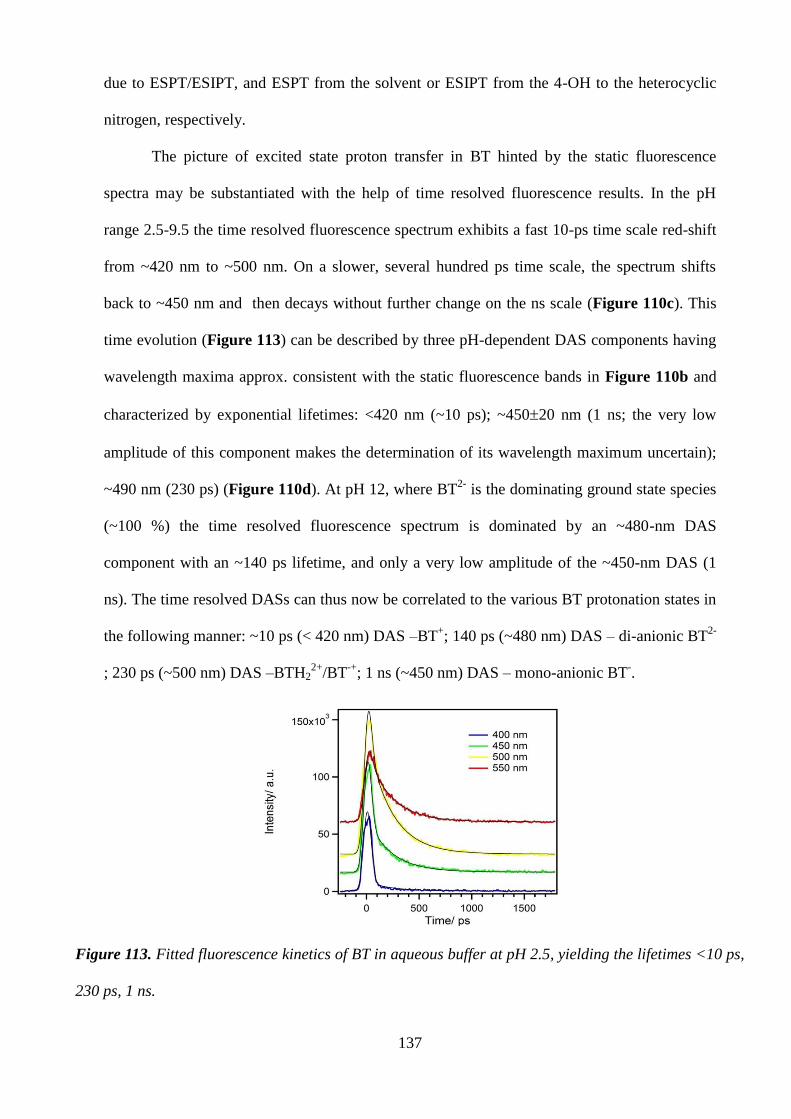
137
due to ESPT/ESIPT, and ESPT from the solvent or ESIPT from the 4-OH to the heterocyclic
nitrogen, respectively.
The picture of excited state proton transfer in BT hinted by the static fluorescence
spectra may be substantiated with the help of time resolved fluorescence results. In the pH
range 2.5-9.5 the time resolved fluorescence spectrum exhibits a fast 10-ps time scale red-shift
from ~420 nm to ~500 nm. On a slower, several hundred ps time scale, the spectrum shifts
back to ~450 nm and then decays without further change on the ns scale (Figure 110c). This
time evolution (Figure 113) can be described by three pH-dependent DAS components having
wavelength maxima approx. consistent with the static fluorescence bands in Figure 110b and
characterized by exponential lifetimes: <420 nm (~10 ps); ~45020 nm (1 ns; the very low
amplitude of this component makes the determination of its wavelength maximum uncertain);
~490 nm (230 ps) (Figure 110d). At pH 12, where BT2-
is the dominating ground state species
(~100 %) the time resolved fluorescence spectrum is dominated by an ~480-nm DAS
component with an ~140 ps lifetime, and only a very low amplitude of the ~450-nm DAS (1
ns). The time resolved DASs can thus now be correlated to the various BT protonation states in
the following manner: ~10 ps (< 420 nm) DAS –BT+; 140 ps (~480 nm) DAS – di-anionic BT
2-
; 230 ps (~500 nm) DAS –BTH22+
/BT-+
; 1 ns (~450 nm) DAS – mono-anionic BT-.
Figure 113. Fitted fluorescence kinetics of BT in aqueous buffer at pH 2.5, yielding the lifetimes <10 ps,
230 ps, 1 ns.

138
These correlations between BT protonation states, their fluorescence spectra and
associated lifetimes now allows us to suggest the following excited state reaction scheme.
(Scheme 8)
Scheme 8. Summarizing the reaction model

139
Upon photoexcitation of the neutral form of BT, the excited state decays in ~10 ps
(~400 nm fluorescence) to form the excited state BTH22+
/BT-+
and BT-, which then decay with
lifetimes of ~230 ps (490-nm fluorescence) and 1 ns (~450-nm fluorescence). The processes
responsible for this are ESPT from the 4-OH group to the solvent for formation of the anion,
and 4-OH to heterocyclic-N ESIPT to form BT-+
, or solvent to heterocyclic-N ESPT for
BTH22+
formation. Similarly to MB the latter process could significantly contribute at pH 2.5.
These processes control the fluorescence dynamics of BT at pHs where the 4-OH group is
protonated (< 9). At higher pH with this group de-protonated (4-O-) no ESIPT and thus no
significant protonation of the heterocyclic-N occurs, as is demonstrated by the much lower
amplitude of 490-nm (230-ps) fluorescence at pH 9.5 (as a matter of fact part of the ~200-ps
amplitude here must be due to BT2-
(see above)). At this pH the proton concentration in
solution is also low making ESPT from the solvent negligible. At even higher pH 12, another
red-shifted (~480 nm) fluorescence band appears, with almost the same maximum as that of
BTH22+
/BT-+
, due to the ground state concentration of BT2-
present at this pH. The fluorescence
lifetime of this species is ~140 ps.
Förster calculations using the fluorescence spectra of the correlated acid and base forms
of a proton containing molecule indicate the feasibility of an ESPT process. Similarly to MB,
such a calculation for the BT+ (max ~390 nm) and BTH2
2+ (max ~490 nm) forms suggests that
proton transfer from the solvent to the heterocyclic nitrogen is thermodynamically strongly
favored. A Förster calculation using the fluorescence spectra in Figure 110b of the BT+ and
anionic BT- forms, with maxima at ~400 and ~450 nm, respectively, the pKa change in the
excited state, ΔpKa*, can be estimated to -6.3 pH units. Since pKa of the 4-OH group is ~8.8,
this suggests that ESPT occurs if the solution pH is >2.5. This is consistent with the lower
spectral amplitude of BT-
fluorescence at pH 2.5 in both static and time resolved spectra, as
compared to pH 7 and 9.5 (Figure 110b and d). The excited state proton transfers discussed
above are schematically summarized in Scheme 8

140
3.7.5 Steady state and time resolved fluorescence investigation of M- BT
The role of the amino acid side chain in the excited state properties of BT was examined
with help of M-BT, lacking the alanyl side chain. The time resolved fluorescence spectra and
kinetics at both pH 2.5 (Figure 114) and 9.5 (not shown) exhibit the same main pattern as that
of BT – two spectral components characterized by maxima at 420-440 nm (10-20 ps) and 500-
520 nm (100-150 ps). A component corresponding to the very low amplitude ~1 ns component
of BT could not be identified with certainty due to the higher noise in these measurements.
These results support the picture obtained above that the 4-OH and heterocyclic-N groups are
the photochemical center of benzothiazole, but that the protonation state of the NH2/NH3+
group determines the excited state lifetime of the BT anion (BT- vs. BT
2-).
Figure 114.(a) Fluorescence kinetics with exponential fits and (b) DAS for M-BT at pH 2.5; t1
< 10 ps,t2 = 98 5 ps.
3.7.6 Steady state and time resolved fluorescence investigation of BTCA
The absorption spectra of BTCA in buffer solution at various pHs are shown in Figure 115a.
At wavelengths <300 nm the band structure is similar to that of BT, but with somewhat shifted
peak maxima, and peak intensities varying with pH. In addition there is absorbance extending

141
further to the red, up to ~400 nm, indicating the presence of additional low-lying transitions.
The fluorescence spectrum of BTCA in MeOH is a single broad band with max ~440 nm
(Figure 115b) and is characterized by a relatively small Stokes shift, similarly to BT. On the
other hand in buffer solution at all pHs in the range 2.5 to 9.5 the fluorescence spectrum is
broad and characterized by at least two bands at ~450 and 600 nm, with a greatly increasing
amplitude of the red band at pH 9.5 (Figure 115b).
Figure 115. (a) Absorption and (b) steady state fluorescence (upon 266 nm excitation) spectra
of BTCA.
At this pH the two COOH groups are fully deprotonated, the 4-OH is mostly
deprotonated (82 %) and the NH2/NH3+ amino acid group at a ~70/30 ratio determined by its
pKa = 9.11. The red ~600 nm shoulder of the fluorescence spectrum can consequently be
associated with tri-anionic BTCA3-
(COO-, COO
-, O
-, NH2). The corresponding fluorescence
band was also observed for BT at ~480 nm (above); the fact that it is more red-shifted for
BTCA makes it more easily distinguishable from the emission bands of the other species. As
will be evident from the time resolved measurements, the 450-nm band is a superposition of
BTCA and BTCA2-
.
In order to fully disentangle the various contributions to the fluorescence spectrum we
turn to the time resolved measurements. The time resolved fluorescence of BTCA in the pH
range 2.5-9.5 recovers DAS (Figure 116) components and lifetimes that appear to be

142
analogous to those identified for BT. A red-shifted component with a maximum at ~580 nm
and decay time of ~100 ps, spectrally coincides with the red shoulder in the static fluorescence
spectrum appearing at pH 9.5.
Figure 116. (a) Time resolved fluorescence spectra of BTCA at pH 7. (b) Preexponentiel factors
representing DAS of BTCA at pH 7. t1< 10 ps, t2 = 86 2 ps, t3 = 282 8 ps, t4 = 2.9 0.4 ns.
Therefore it is straightforward to assign this DAS to the triple-anion BTCA3-
with all
functional groups deprotonated. The consequence of this is that the anionic species (of both
BTCA and BT) with fluorescence maximum at ~450 nm and ns-lifetime belongs to the anionic
O- species with the amino acid group in its zwitterionic (NH3
+, COO
-) state. The ~400-440-nm
(~10 ps) and ~500-nm (282 ps) DAS components are assigned, analogously to BT, to the 4-OH
and cationic (heterocyclic-N protonated) BTCAH22+
forms. All these spectral assignments are
similar to those of BT in Scheme 8, and therefore not repeated.
The excited state proton transfer processes underlying the complex fluorescence
behavior of both BT and BTCA can now be summarized in a few points
. i) The neutral enol form of BT and BTCA in methanol has a fluorescence lifetime of
~250-300 ps, representing the sum of radiative and non-photochemical radiationless processes
of the benzothiazole core.

143
ii) In aqueous buffer solution the OH at 4-position and the benzothiazole nitrogen atom
control the photochemistry of both BT and BTCA via ESPT and ESIPT processes.
iii) The aminoacidic groups of the alanyl chain have a minor influence on the
photochemistry (but protonation state of the amino group determines the excited state lifetime
of anionic species).
iv) The ESPT and ESIPT produce several different excited state ionic species with
lifetimes ranging from ~100 ps to ~3 ns.
The findings here for BT and BTCA pheomelanin building blocks can now be
compared to those of 5,6-dihydroxyindole (DHI) and 2-carboxy-5,6-dihydroxyindole
(DHICA), the building blocks of eumelanin. On the monomer level there does not seem to be a
dramatic difference between the various building blocks – in buffer solution they all exhibit
ESPT or ESIPT processes (to a varying extent) and the resulting excited states decay on the
hundreds of ps to ns time scale. In alcohol solution (methanol) these processes are much
slower, or completely stops126
Dimers and larger units of DHICA have remarkably different
excited states dynamics compared to larger units of DHI – sub-ps decay of the excited states
through excited state proton transfers126
. This unique feature was correlated to the
photoprotective functions of eumelanin. How incorporation of benzothiazole in pheomelanin
backbone or its formation by benzothiazine ring contraction may change the excited state
dynamics is a question that future work is addressing.
The different fluorescence characteristics of eumelanin and pheomelanin is an issue of
interest as a possible diagnostic tool for the detection of malignant transformation in
melanocytes which is associated with a switching from eumelanin to pheomelanin
production.127
The steady state fluorescence of model synthetic pheomelanins has been
investigated in detail128
but up to now no interpretation of the species responsible for the
phenomena has been provided because of the lack of information on the behavior of the
putative building blocks inside the pigment. In this regard the present investigation provide the

144
first description of the steady state and excited state dynamics of the two main benzothiazole
units of pheomelanin under conditions of relevance to the physiological process and provide a
new groundwork for the interpretation of the photoreactivity of pheomelanin and the associated
damages of the epidermal tissues.

145
3.8 Photochemistry of pheomelanins: Spectroscopic investigation of
natural and synthetic pigments and related 1,4-benzothiazines
3.8.1.Background
Pheomelanins contain both 1,4-benzothiazines and 1,3-benzothiazole as main structural
components. In the previous chapter, a systematic investigation of the photochemistry of 1,3-
benzothiazoles occurring in the natural pigments has been presented. The study was then
extended to other putative structural elements of pheomelanins featuring the 1,4-benzothiazine
system or both benzothiazine and benzothiazole units. In addition natural pheomelanins from
red hair and model synthetic pigments were also analyzed in comparison with natural
eumelanins isolated from black hair.
The main aim of this study is to characterize the evolution pathways of these species on
photoexcitation, an issue that may help interpretation of the role of pheomelanins in the
photosensitivity and proness to skin cancer of red haired people. For all these compounds,
steady state fluorescence emission and time-resolved fluorescence measurement were
performed
3.8.2 Sample preparation
As a first step in this work, the synthesis of benzothiazine–containing oligomers and synthetic
pigments were carried out following previously reported procedures. These oligomers are the
bibenzothiazine dimers (BTZ) and isoquinoline-benzothiazole dimers (BT-TIQ), that are the
ultimate pheomelanin precursors that can prepared synthetically. (Figure 117) . As to the
isoquinoline dimers, structural markers directly related to these compounds have recently been

146
obtained from natural pheomelanin and a solid state NMR study showed convincing 2D
spectra providing evidence for the presence of these structural units in the natural pigments.
S
N
OH
S
N
OH
NH2
COOH
HOOCHOOC
NH2
COOH
S
NH
OH
N
S
N OH
NH2
O
HO2C
CO2H
BT-TIQ
BTZ dimer
Figure 117. Structure of the pheomelanin precursor containing benzothiazine units
Regarding the pigments, three different synthetic pheomelanins were synthesized and
investigated:
1)dopacys: synthetic pigment prepared from Dopa in the presence of cysteine by tyrosinase
oxidation
2-3) cysdopa with and w/o Zn2+
: pigments prepared from the major pheomelanin prescursor
cysteinyldopa in the absence or in presence of Zinc ions .
Finally, the natural red hair pheomelanin and black hair eumelanin pigments were
obtained as previously described in the chapter 3.6.
3.8.3 Steady State Emission Spectra and Time-Resolved measurement
For all benzothiazine compounds, synthetic and natural pigments SSE (Steady State Emission)
and TRE (Time-Resoled Emission) measurements were performed in aqueous buffer solutions
at selected pHs, namely pH 2.5 and 7 (in some cases the measurements were carried out also
under more acidic conditions, that is 1M HCl) .

147
BTZ-dimers
At pH 2.5, BTZ-dimer shows, both at SSE and TRE measurement, an extremely intense
emission of fluorescence peaked at around 350 nm. However, the image obtained at the streak
camera for the time-resolved experiments, shows also that this species is extremely long lived
(>2 ns) and is beyond the temporal measurement range of the instrument (from 10 ps to 2 ns).
This can be clearly seen comparing the images shown in Figure 118 and Figure 119 (right
panels). At pH 2.5 the emission at 350 nm is clear, but the image shows a continuous band that
goes all across the vertical section of the image.
300 400 500 600 700
0
500000
1000000
1500000
2000000
Int
Wavelenght(nm)
2,2'-bibenzothiazine dimer pH 2.5
Figure 118. SSE and Time-Resolved spectra of BTZ at pH 2.5
At pH 7, the TRE is quite different showing a well defined zero time (an arbitrary time, set by
the operator, that sets the starting point’s time of the measure). At this pH , the steady state
spectrum presents again the emission at 350 nm and a weak new band at around 480 nm
appears. The time-resolved measurement shows that this more red-shifted band presents a clear
signal with a lifetime in the temporal range of the instrument. A preliminary estimate the
lifetime of this species should be around 480 ps . In Time-Resolved experiments, no clear
signal was evident for the 350 nm band.

148
300 400 500 600 700
0
20000
40000
60000
80000
100000
120000
140000
160000In
t
Wavelenght(nm)
2,2'-bibenzothiazine dimer pH 7
Figure 119. SSE and Time-Resolved spectra of BTZ at pH 7
BT-TIQ
300 400 500 600 700 800
0
200000
400000
600000
800000
1000000
1200000
Int
Wavelenght(nm)
BT-TIQ pH 2.5
Figure 120. SSE and Time-Resolved spectra of BT-TIQ at pH 2.5

149
The isoquinoline-benzothiazole dimers was investigated under the same conditions as BTZ. At
pH 2.5 (Figure 120) the steady state emission spectrum is quite similar to that of BTZ, that is a
strong emission at 350 nm. In this case another weak band can be seen at 500 nm with a
estimated lifetime of almost 1 ns. Surprisingly, in the time- resolved image only the 500 nm
band can be seen and the 350 nm band is absent.
At pH 7(Figure 121), the 500 nm band is clearly the dominant band and the time-resolved
experiment shows that its lifetime is really short-lived, 280 ps .
300 400 500 600 700 800
0
20000
40000
60000
80000
100000
120000
140000
160000
Int
Wavelenght(nm)
BT-TIQ pH 7
Figure 121. SSE and Time-Resolved spectra of BT-TIQ at pH 7
Synthetic pheomelanins : a) Cysdopa
As for the synthetic pigment cysdopa, obtained from peroxidase oxidation of the main
pheomelanin precursor 5-S-cisteinyldopa, at pH 2.5 the same emission spectra exhibited by
BTZ and BT-TIQ is observed (Figure 122), with the major peak at 350 nm. In this case, the
time resolved experiment showed that this species has a lifetime >2 ns (image not shown).

150
300 400 500 600 700
0
1000000
2000000
3000000
4000000
5000000
6000000
Int
Wavelenght(nm)
Cysdopa pH 2.5
Figure 122. SSE spectrum of Cysdopa at pH 2.5
300 400 500 600 700
0
20000
40000
60000
80000
100000
120000
140000
160000
Int
Wavelenght(nm)
Cysdopa pH 7
Figure 123. SSE and Time-Resolved spectra of Cysdopa at pH 7

151
At neutral pH (Figure 123), the SSE spectrum shows the usual two bands seen so far at this
conditions, but this time with an almost 1:1 ratio. In the time-resolved measurement, a similar
behavior as in BTZ at pH 7 is observed, showing only the signal at around 500 nm.
Furthermore, in the case of Cysdopa, the time resolved image shows at least two bands with
different lifetimes (680 ps for the blue band and 1.3 ns for the red band), that may be
overlapped in the steady state spectrum.
Synthetic pheomelanin pigment: b) Cysdopa Zn
300 400 500 600 700
0
2000000
4000000
6000000
8000000
10000000
12000000
14000000
Int
Wavelenght(nm)
Cysdopa Zn pH 2.5
300 400 500 600 700
0
100000
200000
300000
400000
Int
Wavelenght(nm)
Cysdopa Zn pH 7
Figure 124 SSE spectrum of Cysdopa Zn at pH 2.5 (top left), SSE and Time-Resolved spectra of
Cysdopa Zn pH 7(top right and bottom)

152
The SSE spectra (Figure 124, top left) at pH 2.5 obtained from the other synthetic pigment
cysdopa, prepared from peroxidase oxidation of the main pheomelanin precursor 5-S-
cisteinyldopa but this time in the presence of Zinc ions, has again the same emission at 350 nm.
At pH 7 (Figure 124, top right) the 500 nm band is almost not present at all and only the 350
nm emission is observed. The time-resolved images of the pigment at this pH is somewhat
different compared to the ones seen so far (Figure 124, bottom). They appear barely emissive
and the lifetimes associated are extremely short. This may be caused by the presence of the
Zinc ions that may in some manner cause this behavior.
Dopacys
300 400 500 600 700
0
20000
40000
60000
80000
100000
120000
140000
160000
180000
Int
Wavelenght(nm)
Dopacys pH 2.5
300 400 500 600 700
0
20000
40000
60000
80000
100000
120000
Int
Wavelenght(nm)
Dopacys pH 7
Figure 125. SSE and Time-Resolved spectra of Dopacys at pH 2.5 (left), and pH 7( right)

153
The final synthetic pheomelanin pigment ( Figure 125) that was analyzed is dopacys, prepared
from L-dopa and cysteine in the presence of tyrosinase under oxygen. SSE and time-resolved
spectra show that in both pH 2.5 and pH 7 , only the band at 500 nm is observed. The lifetimes
of these species , moreover, are extremely short-lived and in the case of Dopacys at pH 2.5, it
appears that the emission is extremely faint.
Natural pigments:pheomelanin
Finally, the natural pheomelanin pigment from red human hair was examined. At pH
2.5(Figure 126) the steady state emission spectrum is quite different compared to the emissions
seen so far, as a completely new band , at 310 nm is observed, with a smaller emission at 460
nm. The time resolved image, however, did not show any sign of this extremely blue shifted
band, while the band at higher wavelengths was detected and associated to a short lived species
(250 ps).
300 350 400 450 500 550 600
0
100000
200000
300000
400000
500000
Int
Wavelenght(nm)
Pheomelanin pH 2.5
Figure 126 SSE and Time-Resolved spectra of natural pheomelanin at pH 2.5.
Surprised by this behavior, the experimental conditions were slightly changed in order to
register the spectrum in a more acidic environment. Figure 127 shows the steady state
emission and the time resolved fluorescence measurements in HCl 1M. The SSE spectrum has
the same components as in pH 2.5 (two peaks at 310 and 450 nm) , but this time, the 350 nm is
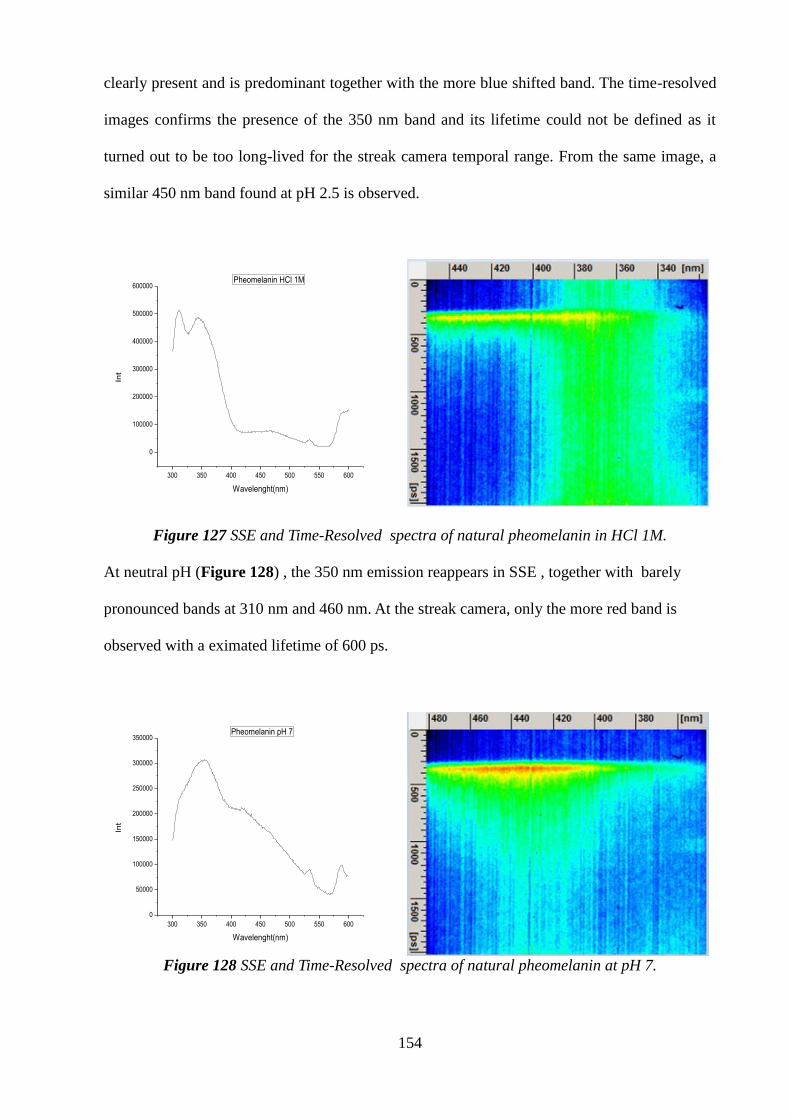
154
clearly present and is predominant together with the more blue shifted band. The time-resolved
images confirms the presence of the 350 nm band and its lifetime could not be defined as it
turned out to be too long-lived for the streak camera temporal range. From the same image, a
similar 450 nm band found at pH 2.5 is observed.
300 350 400 450 500 550 600
0
100000
200000
300000
400000
500000
600000
Int
Wavelenght(nm)
Pheomelanin HCl 1M
Figure 127 SSE and Time-Resolved spectra of natural pheomelanin in HCl 1M.
At neutral pH (Figure 128) , the 350 nm emission reappears in SSE , together with barely
pronounced bands at 310 nm and 460 nm. At the streak camera, only the more red band is
observed with a eximated lifetime of 600 ps.
300 350 400 450 500 550 600
0
50000
100000
150000
200000
250000
300000
350000
Int
Wavelenght(nm)
Pheomelanin pH 7
Figure 128 SSE and Time-Resolved spectra of natural pheomelanin at pH 7.

155
Natural pigment:eumelanin
The emission properties of the natural black human hair pigment, eumelanin, were also briefly
investigated. For comparison the measurement were made at pH 2.5, pH 7 and also in HCl 1M.
In acidic conditions, the steady state spectrum (Figure 129) at he most predominant bands are
at 3650 nm and 450 nm. It should be noted that the fluorescence exhibited by the eumelanin
pigment is much more intense compared to pheomelanins. This can be also seen in the time-
resolved spectrum, where both the bands are visible, really intense and long lived
300 350 400 450 500 550 600
0
200000
400000
600000
800000
1000000
Int
Wavelenght(nm)
Eumelanin HCl 1M
Figure 129. SSE and Time-Resolved spectra of natural eumelanin in HCl 1M
At pH 2.5 in SSE (Figure 130), the band at 350 nm is no more apparent and that at 450nm is
the predominant. The time-resolved experiment shows the same behavior found in the steady
state, that is one band at around 450nm, which is really long-lived
300 350 400 450 500 550 600
50000
100000
150000
200000
250000
300000
Int
Wavelenght(nm)
Eumelanin pH 2.5
Figure 130. SSE and Time-Resolved spectra of natural eumelanin at pH 2.5.

156
In neutral buffer solution (Figure 131), the SSE spectrum shows the same two peaks at a 1:1
ration, while in the time-resolved experiment, only the more red band is observed with a
lifetime of 500 ps.
300 350 400 450 500 550 600
40000
60000
80000
100000
120000
140000
160000
180000
200000
220000
240000
Int
Wavelenght(nm)
Eumelanin pH 7
Figure 131. SSE and Time-Resolved spectra of natural eumelanin at pH 7.
Table 8 summarizes the results obtained so far:
Sample HCl 1M pH 2.5 pH 7
Pheomelanin 350 nm- Long Lived 400 nm /250 ps 440 nm / 600 ps
Cysdopa 350 nm / Long Lived 460 nm /700 ps
540 nm / >1ns
Cysdopa/Zn 350 nm / Long Lived 350 nm / 180 ps
470 nm / 380 ps
Dopacys 450 nm (weak) / 400 ps 500 nm / 320 ps
BT-TIQ 430 nm / ~ 1 ns; 520
nm/260 ps
500 nm / 280 ps
BTZ dimers 370nm /Long Lived 470 nm/350 ps
Eumelanin 450 nm / Long Lived 450 nm / Long Lived 440 nm – 500 ps
Table 8. Lifetimes determined for the benzthiazine compounds, synthetic and natural pigments
Interpretation of these results are still underway, and it may require some time, since the
kinetics seems not to follow a multi exponential decay. However a first analysis suggests a
major role played by benzothiazine-compounds compared to the benzothiazole ones, in
determining the behavior of both the synthetic and the natural pigments

157
4.Conclusions
In this PhD project attention has been focused on 1,4-benzothiazines, the core structural unit of
pheomelanin pigments, responsible for the red hair phenotype. The chromophore exhibited by
these pigments has been associated to the presence of the Δ2,2'
-bi-(2H-1,4-benzothiazine),
occurring in a group of low molecular weight pheomelanins termed trichochromes that are
closely related to indigos, a class of chromophores of potential practical interest but so far little
explored in materials science.
As a first approach to develop new benzothiazine based functional dyes, a detailed structural
re-examination of the stable yellow isomer of 2,2’
-bibenzothiazine by an integrated 2D NMR
and theoretical approach was carried out and it was shown that the stable yellow species is in
fact the cis isomer rather than the trans isomer as previously suggested. More compelling
evidence supporting structural revision came from a gradient-selected X-half filtered NOESY-
HSQC experiment. In the same study it was also found that under strongly acidic conditions the
initially-formed violet species (max 556 nm), corresponding to the protonated derivative,
undergoes further protonation to give a blue species (max 590 nm), identified as the dication.
Based on these data, a novel picture of 2,2’
-bibenzothiazine as a four-state system with
photochromic and pH-dependent behavior could be proposed.
To extend the scope offered by the push-pull chromophoric system exhibited by 2,2’
-
bibenzothiazines, 3-substituted-1,4-benzothiazines were prepared as stable and easily handled
starting materials for access to new benzothiazine based functional dyes. The monomeric
benzothiazines, namely the 3-phenyl- and the 3-methyl-2H-1,4-benzothiazine were obtained in
50-60% average yields by improvement of previously reported procedures involving reaction
of the o-aminothiophenol with an alpha-haloketone.

158
The oxidative coupling of these monomers was investigated and the most interesting results
were obtained starting from 3-phenyl-1,4-benzothiazine. Indeed, in the presence of micromolar
peroxides or biometals (Fe(III), Cu(II), V(V) salts), and following a strong acid input, this
benzothiazine monomer is efficiently converted to a green-blue Δ2,2'
-bi-(3-phenyl-2H-1,4-
benzothiazine) via colorless intermediates identified as single-bonded dimers. In the
mechanistic scheme proposed peroxides or metal ions induce conversion of protonated 3-
phenyl-1,4-benzothiazine to a resonance-stabilized benzothiazinyl radical intermediate that
was evidenced and characterized by epr spectroscopy. Interestingly, 3-phenyl-2H-1,4-
benzothiazine proved to be useful for the visual detection of peroxides in aged etheral solvents
such as THF, ethyl ether, dioxane. Moreover, it was noticed that addition of rusty iron objects
promoted oxidation of 3-phenyl-1,4-benzothiazine to its double bond dimers in a very fast and
efficient manner. Under these conditions, 3-phenyl-2H-1,4-benzothiazine was found to serve as
an efficient inhibitor against corrosion of the rusty iron objects induced by concentrated HCl.
New benzothiazine based functional dyes were prepared based on the cyanine chromophore.
The synthesis of the benzothiazine cyanines was pursued by two different approaches, one
involving reaction with dialdehydes that may allow for the build- up of a conjugated bridge
between the two benzothiazine units and the other based on the condensation of the
benzothiazine with aromatic para N-alkyl substituted aldehydes exploiting the nucleophilicity
of the enamine tautomer form of the benzothiazine. A new cyanine was obtained from 3-
phenylbenzothiazine and excess formaldehyde or in even better yields up to 50% with glyoxal
featuring an ethanediiyldene bridge between the benzothiazine units. This product showed a
larger bathochromic shift compared to the parent Δ2,2’
-bi-(2H-1,4-benzothiazine), that is an
intense absorption at 484 nm shifted to 617 nm for the monocation and 654 nm for dication
generated in acids.
The condensation products of the 3-substituted-1,4-benzothiazines with p-
dimethylaminobenzaldehyde, vanillin, p-dimethylaminocinnamaldehyde and ferulaldehyde

159
were obtained in average to good yields in acidic methanol, purified and subjected to complete
mono and 2D NMR characterization. All these products showed a strong pH dependence of the
chromophores. In the case of the N-alkyl substituted products a marked batochromic shift upon
acidification was observed ( around 200 nm) that was partially reverted on further acidification
as the result of protonation of the N-dialkyl substituent abating the donor potential of the
cyanine push pull chromophore. High molar extinction coefficients (up to 18,000) were
associated to the phenyl-substituted benzothiazine cyanines. Likewise the strongest emission of
fluorescence was observed for the condensation products starting from 3-methyl-1,4-
benzothiazine, with complete quenching of the fluorophore with acidification. Overall the
newly synthesized cyanines offer a significant palette of colors and applications exploiting
single components or mixtures of them may be easily envisaged.
The second major issue addressed in this PhD project concerns the role of the benzothiazine
structural units in the biological function of pheomelanin pigment. Though commonly regarded
as photosensitizer agent capable of amplifying generation of reactive oxygen species following
UV radiation, recently, pheomelanin has also been implicated in UV-independent pathways of
oxidative stress. To get an insight into these processes at molecular level the reactivity of
natural and synthetic pheomelanins toward cellular antioxidants that are critical for maintaining
the redox balance was investigated and the results obtained showed a marked ability of
pheomelanin from red human hair, but not of eumelanin from black human hair, to reduce the
levels of two representative cellular targets, namely glutathione and NADH, in vitro. In the
absence of oxygen GSH and NADH depletion was not observed while the presence of enzymes
as superoxide dismutase and catalase did not modify the effect of pheomelanin suggesting a
ROS independent mechanism. Similar effects were obtained with a synthetic pigment
confirming that the prooxidant effects are due to the pheomelanic component. The mechanism
of GSH oxidation by pheomelanin was investigated by EPR spectroscopy, showing a decrease
only of the pheomelanin component of the natural pigment, after 24 hours incubation with

160
GSH. The results may be interpreted invoking a role of the benzothiazine units inside the
pigment backbone. These would be able to sustain a redox cycling in which the pigment acts
as oxidant toward GSH and NADH and is then reconverted into the oxidized form by
molecular oxygen which in turn is reduced to ROS. This mechanistic view includes ROS
generation but the antioxidant consumption is the result of a direct interaction with the pigment
and not with ROS as previously suggested.
A systematic investigation of the role of putative structural subunits of pheomelanin in the
photoreactivity and photodegradation behavior of the pigment was also addressed. To this aim
key intermediates of pheomelanogenesis, including benzothiazoles, benzothiazine dimers and
dihydroisoquinoline were synthesized and the photochemistry was investigated in collaboration
with the research unit headed by professor Sundstrom at the Department of Chemical Physics
of Lund University (Sweden). Steady state absorption and emission spectra at different pHs
showed marked differences that can be accounted for in terms of the ionization state of the
functional groups. Regarding the benzothiazole compounds model of the structural units
occurring in pheomelanin pigment, the results obtained showed that the OH at 4-position and
the benzothiazole nitrogen atom control the photochemistry of both 6-(2-amino-2-
carboxyethyl)-4-hydroxy-1,3-benzothiazole and 6-(2-amino-2-carboxyethyl)-4-hydroxy-1,3-
benzothiazole-2-carboxylic acid via intramolecular and solvent proton transfer processes.
Moreover, the aminoacidic groups of the alanyl side chain have a minor influence on the
photochemistry. The study was then extended to other putative structural elements of
pheomelanins featuring the 1,4-benzothiazine system or both benzothiazine and benzothiazole
units and on natural and synthetic pheomelanins. Analysis of data showed the major role of
benzothiazine, compared to benzothiazoles in determining the behavior of the natural pigment.
.

161
5.Materials
5.1 General Methods
Anhydrous ethyl ether, anhydrous DMSO, phenacyl bromide, chloracetone , formaldehyde ,
glyoxal, p-dimethylaminobenzaldehyde , vanillin, ferulaldehyde , Rhodamine B, o-
aminothiophenol, FeCl3 anhydrous, CuSO4 5 H2O and V2O5, dioxane , picric acid , methanol,
ethanol, sodium bisulfate, chloroform, p-dimethylaminocinnamaldehyde , o-aminothiophenol,
L-Dopa, L-glutathione (GSH), L-glutathione oxidized (GSSG), -nicotinamide adenine
dinucleotide reduced (NADH) disodium salt hydrate-nicotinamide adenine dinucleotide
(NAD+), -nicotinamide adenine dinucleotide phosphate reduced (NADPH), -nicotinamide
adenine dinucleotide phosphate (NADP+), Ellman’s reagent, hydrogen peroxide (30% v/v),
horse radish peroxidase (EC 1.11.1.7), bovine erythrocytes superoxide dismutase (SOD) (EC
1.15.1.1), bovine liver catalase (EC 1.11.1.6),methylbenzothiazole (MB) were commercially
available and were used as obtained
UV-vis spectra were UV spectra were recorded with a Jasco V-560 UV/VIS Spectrophotometer.
1H NMR spectra were recorded at 200, 400 or 500 MHz,
13C NMR spectra at 50 or 100 MHz.
1H,
1H COSY,
1H,
13C (DEPT) HSQC, and
1H,
13C HMBC experiments were run at 400 or 500
MHz, on instruments equipped with a 5 mm 1H/broadband gradient probe with inverse
geometry using standard pulse programs. The HMBC experiments used a 100 ms long-range
coupling delay. Chemical shifts are reported in values (ppm) downfield from TMS.
Analytical and preparative TLC were carried out on silica gel plates (0.25 and 0.50 mm,
respectively) from Merck. Hexane-ethyl ether 7:3 v/v (eluant A) ; petroleum ether-ethyl acetate
7:3 v/v (eluant B) ; hexane-ethyl ether 8:2 v/v (eluant C) ; hexane-ethyl acetate 8:2 v/v (eluant

162
D) ; cyclohexane-ethyl acetate 9:1 v/v (eluant E) ; dichloromethane-hexane 8:2 v/v ( eluant F) ;
hexane-ethyl acetate 9:1 v/v (eluant G) ; hexane-ethyl ether 98/2 v/v (eluent H).
HPLC. HPLC analyses were performed on a Shimadzu SCL-10AV VP instrument equipped
with a LC-10AD VP pump and a SPD-10AV VP UV-visible detector.
For Δ2,2'
-bi-(3-phenyl-2H-1,4- benzothiazine) analyses, an octyl column (15 cm x 4.6 mm, 3
micron particle size) was used. An acetonitrile/water gradient was used as follows: 0-50 min:
50%-70% acetonitrile; 50-60 min: 70% acetonitrile. Flow rate was set at of 0.7 ml/min.
For TTCA and PTCA analyses a Synergi Hydro-RP 80A column (250 x 4.60 mm, 4 m) was
used, with 1% formic acid (pH altered to 2.8 with sodium hydroxide)/methanol 97:3 (v/v) as
eluent, at a flow rate of 0.7 mL/min. Detection wavelength was set at 254 and 280 nm. 34
For GSH and GSSG analysis an EC detector set at + 500 mV vs. an Hg/Hg2Cl2 reference
electrode was used as additional detector. A Sphereclone ODS (5 micron, 4.6x250 mm) column
was used, with 0.01 M phosphate buffer (pH 3.0) containing/methanol 98:2 (v/v) as the eluent,
at a flow rate of 0.7 mL/min.
For experiment of NADH/NADPH oxidation , detection wavelength was set at 260, or 340 nm
using a Sphereclone ODS ( 250x4.6 mm, 5 m) column
Preparative HPLC was carried out on an instrument coupled with a UV detector set at 254 or
280 nm using an Econosil C18 (250x22 mm,10 m).
Semipreparative HPLC was carried out on an instrument coupled with a UV detector set at 340
nm using an Econosil C18 (250x10 mm,10 m) column.
LC-MS analysis.
LC-MS were performed with a LC/MSD VL system (Agilent) equipped with a UV-vis detector
and a quadrupole mass spectrometer with electrospray ionization source (ESI) operating in
positive ionization mode in the following conditions: nebulizer pressure 50 psi; drying gas
(nitrogen) 12 L/min, 350 °C; capillary voltage 4000 V; fragmentor voltage 50 V. A Sphereclone

163
ODS (250x4.6 mm, 5 m) column was used.
Gradient A: 1 %formic acid (eluent a)/acetonitrile (eluent b): from 5 al 90 % b, 0-45 min.
Gradient B: (0.5% trifluoroacetic acid (eluent a)/MeOH(eluent b): from 10 to 15% b, 0-15 min;
from 15 to 60% b, 15-55min; 60% b, 55-65 min; from 60 to 80% b, 65-80 min; 80% b, 80-90
min).
EPR spectroscopy.
EPR spectra were recorded using a Bruker spectrometer. The instrumental settings were as
follows: sweep width, 160.0 G; resolution, 1024 points; modulation frequency, 100.00 kHz;
modulation amplitude, 5.0 G. The amplitude of the field modulation was preventively checked
to be low enough to avoid detectable signal overmodulation. EPR spectrum was measured with
a microwave power of 6.394 mW to avoid microwave saturation of resonance absorption curve.
Several scans, typically 128, were accumulated to improve the signal-to-noise ratio.
Computational Analysis:
All calculations were performed with the Gaussian package of programs. Geometry
optimizations were carried out at the DFT level, with a hybrid functional (PBE0) and a
reasonably large basis set [6-31+G(d,p)]. For each species, different tautomers/conformers were
explored. Computations were performed either in vacuo, or by adoption of a polarizable
continuum medium (PCM) to account for the influence of the solution environment. In view of
the faster convergence, a scaled van der Waals cavity based on universal force field (UFF) radii
was used, and polarization charges were modeled by spherical Gaussian functions. Vibrational-
rotational contributions to the free energy were also computed. Additional energy computations
were performed for the neutral form in vacuo at the MP2 level with
different basis sets, and at the CBS-QB3 level. UV/Vis spectra of the main species were
computed in vacuo or in solution using the time-dependent density functional theory (TD-DFT)
164
approach,
with the PBE0 functional and the 6-311++G(2d,2p) basis set. To produce graphs, transitions
below 5.6 eV were selected, and an arbitrary Gaussian line width of 0.15 eV was imposed; the
spectra
were finally converted to a wavelength scale. NMR shielding tensors were computed within the
Gauge-Including Atomic Orbitals (GIAO) ansatz at the PBE0/6-311+G(d,p) level. Computed
isotropic shieldings were converted into chemical shifts using as reference the values obtained
at the same level for benzene.
For computation of EPR parameters, geometry optimizations were carried out at the
unrestricted DFT level, with the B3LYP functional [Becke, A.D. J. Chem. Phys. 1993, 98,
5648; Stephens, P.J.; Devlin, F.J.; Chabalowski, C.F.; Frisch, M.J. J. Phys. Chem. 1994, 98,
11623] and the N07D basis set, as optimized for B3LYP [Barone, V.; Cimino, P.; Stendardo, E.
J. Chem. Theory Comput. 2008, 4, 751], either in vacuo or by adoption of a polarizable
continuum medium. Single-point calculations were then carried out with the B3LYP functional
and specifically tailored basis sets, namely EPR-II or EPR-III [Barone, V. In Recent Advances
in Density Functional Methods, Part I, (Ed D.P. Chong), World Scientific, Singapore 1996]; the
sets were completed for the sulfur center with a 6-31+G(d) or 6-311++G(2d) basis,
respectively.

165
5.2 Photochromism and acidichromism of Δ2,2
-Bi-(2H-1,4-
benzothiazine)
Synthesis of BBTZs:
The Z-BBTZ was prepared following the reported procedure with modifications. The deep-
violet reaction mixture as obtained was treated with 1 m Na2CO3 and the yellow precipitate
was collected by centrifugation and purified by column chromatography (diethyl ether/hexane,
9:1) in the dark. The eluates taken to dryness under vacuum in an ice bath gave the product in
40% yield. UV and MS data are in agreement with those reported. Solutions of the yellow
BBTZ in benzene or dichloromethane (3–5 mm) were exposed to sunlight in quartz vials and
the conversion of the yellow to red form was followed by TLC analysis [Rf (yellow species) =
0.44, Rf (red species) = 0.66; diethyl ether/hexane, 9:1]. At maximum degree of conversion the
solution was taken to dryness and rapidly purified by column chromatography (diethyl
ether/hexane, 9:1). Back reaction of the red form was complete at room temperature after at
least 18 h, and accelerated (2 h) by heating to 40 °C, in agreement with previous report
Yellow BBTZ (cis isomer)
1H NMR (CDCl3) δ (ppm):7.22 (m, 2H), 7.25 (m, 2H), 7.28 (m, 2H), 7.55 (m, 2H), 8.83 (s, 2H)
13
C NMR (CDCl3) δ (ppm): 120.7 (C), 122.3 (C), 125.7 (CH x 2), 128.0 (CH x 2), 128.9 (CH x
2), 130.8 (CH x 2), 139.0 (C), 143.7 (CH x 2)
Red BBTZ (trans isomer)
1H NMR (CDCl3) δ (ppm):7.18 (m, 4H), 7.30 (m, 2H), 7.49 (m, 2H), 8.30 (s, 2H)
13
C NMR (CDCl3) δ (ppm): 125.1 (CH x 2), 127.4 (CH x 2), 128.5 (CH x 2), 130.4 (CH x 2),
148.2 (CH x 2)

166
NMR Experiments:
The gradient-selected X-half filtered NOESY-HSQC sequence described by Gschwind et al.
was implemented with a Bruker 600 DRX instrument equipped with a cryo probe and z axis
gradients; X-half filter delays were optimized for a 13
C–1H scalar coupling constant of 185 Hz,
which is appropriate for the 13
C3–1H3 pair. The sample contained about 5 mg of the yellow
form of the parent bibenzothiazine in 0.5 mL of CDCl3. Spectra were recorded at 298.0 K using
data sets of 4096_256 points with a mixing time of 2.0 s, 32 scans for each increment, and a
relaxation delay of 4 s, and were calibrated on the residual solvent peak. The data matrix was
zero-filled in both dimensions to give a matrix of 4K_1K points; apodization with a squared
cosine-bell in F1 and exponential multiplication in F2 was applied.

167
5.3 Synthesis of 1,4-benzothiazines and investigation of their
oxidation reactivity
Synthesis of 3-phenyl-2H-1,4-benzothiazine
A solution of o-aminothiophenol (1.068 mL) in anhydrous ethyl ether (5 mL) was treated at
room temperaturebwith phenacyl bromide (2.32 g) in anhydrous ethyl ether (25 mL) under
magnetic stirring. After 2 h the reaction mixture was filtered and the yellow solid washed with
ethyl ether and dried. On TLC analysis (eluant A) the solid proved to be pure (2.51g, 82%
yield).
ESI+MS: m/z 226 ([M+H]+); UV: λmax (CH3OH) 323 nm; 1H NMR (CDCl3) δ (ppm): 4.16 (s,
2H), 7.40-7.45 (m, 3H) , 7.48 (m, 1H) , 7.68 (t, J = 8 Hz, 2H), 7.80 (t, J = 8 Hz, 1H), 8.47 (d, J
= 8Hz, 2H). 13C NMR (CDCl3) δ (ppm): 27.86 (CH2), 125.55 (CH), 125.60 (C), 127.37 (CH),
128.28 (CH), 129.81 (CH × 2), 131.01 (CH), 131.78 (CH× 2), 134.46 (C), 137.31 (CH), 139.39
(C), 164.10 (C).
Synthesis of 3-methyl-2H-1,4-benzothiazine
A solution of o-aminothiophenol (0,171mL) in anhydrous ethyl ether (0,83mL) was treated at
room temperature with chloracetone (0,128mL) in anhydrous ethyl ether (4,17mL) under
vigorous stirring. After 24 h the reaction mixture was centrifuged, the solid washed with
chloroform and discarded . The supernatant was taken to dryness and on tlc analysis (eluant B)
was shown to contain pure 2. (57 mg, 48% yield ).

168
ESI+MS: m/z 164 ([M+H]+);
UV: λmax (CH3OH) 375 nm;
1H NMR (CDCl3) δ (ppm): 3.0 (s, 3H) , 3.71 (s, 2H) , 7.36 (m, 3H) 8.14 (d, J= 7,2 Hz, 1H )
13C NMR (CDCl3) δ (ppm): 24.19 (CH3) , 28.95 (CH2) , 124.28 (CH), 124.4 (C) , 127.58 (CH) ,
128.11 (CH) , 131.06 (CH), 132.95 (C), 172.2 (C).
Oxidation of 3-methyl-(2H-1,4-benzothiazine):
3-Methyl-2H-1,4-benzothiazine (50 mg) was dissolved in methanol (4mL) and of HCl 12M
(1mL). The mixture was taken under stirring at room temperature for 24h. The solution was
extracted with water, sodium bisulfite and chloroform. The mixture obtained was separated by
chromatographic column (eluant B). The main components was obtained at rf 0.35 (20 mg)
ESI+MS: m/z 323 ([M+H]+);
UV: λmax (CH3OH) 414 nm
1H NMR (CDCl3) δ (ppm): 1.42 (s , 1H) , 2.9 (d.d , 2H ), 6.65 (d , J = 8Hz , 1H) , 6.81 ( t , J =
8Hz , 1H) , 7.03-7.15 (m , 5H) , 7.26 (d, J = 8Hz , 1H).
13C NMR (CDCl3) δ (ppm): 26.72 (CH3) , 48.85 (CH2) , 56.11 (C) , 115.22 (C) , 117.90 (CH) ,
118.0(C), 119.40 (C) , 120.05 (CH) , 126.10 (CH) , 126.80 (CH) , 127.10 (CH) , 127.29 (CH) ,
129.91 (CH) , 139.86 (C) , 140.25 (C) , 164.61(C) .

169
5.4 Oxidative coupling of 3-phenyl-(2H-1,4-benzothiazine) promoted
by peroxides or biometals
Synthesis of 3-phenyl-2H-1,4-benzothiazine
Synthesis already reported in chapter 4.2
2,2’-Bi-(3-phenyl-2H-1,4-benzothiazine) (2a/b)
A solution of 3-phenyl-2H-1,4-benzothiazine (200 mg, 0.65 mmol) and picric acid (150 mg,
0.65 mmol) in ethanol (5 mL) was refluxed for 0.5 hours in an oil bath at 70°C. After cooling,
the precipitate was collected by filtration and washed with ethanol (130 mg, 90% yield). HPLC
analysis of the solid showed a pure component eluting at 47.6 min, while the filtrate consisted
of both the RT 45.2 and 47.6 min components.
RT 47.6 min: ESI(+)MS: m/z 449 ([M+H]+); UV: λmax (CH3OH) 259, 289, 334 (ε 13,000) nm;
1H NMR (CDCl3) δ (ppm): 4.20 (s , 1H ) , 6.92 (d , J= 7.6 Hz , 1H) , 7.16 ( t , J= 7.6 Hz , 1H )
, 7.33 ( t , J= 8 Hz , 2H) , 7.40 (m , 1H) , 7.45 ( m , 1H) , 7.66 ( d, J= 8Hz , 2H) , 7.77 ( d ,
J=8Hz , 1H). 13
C NMR (CDCl3) δ (ppm): 31.34 (CH) , 120.2 (C),127.19 (CH), 127.31 (CH ×
2) , 127.52 (CH) , 128.21 (CH x 2) , 128.49 (CH × 2 ) , 131.17 (CH) , 137.03 (CH) , 139.3 (C)
, 142.01 (C) , 156.4 (C)
2,2’-Bi-(3-phenyl-2H-1,4-benzothiazine) (3a/b)
A solution of 3-phenyl-2H-1,4-benzothiazine (50 mg) in methanol (20 mL) and 12 M HCl (5
ml) was treated with H2O2 (16 mL). The solution was left under magnetic stirring for 0.5 hours
at room temperature. The solution was extracted with water and chloroform. On addition of
methanol a solid separated that was recovered after filtration (30 mg). TLC analysis

170
(cyclohexane/ethyl acetate 90:10) showed a mixture of two components (Rf 0.68 and Rf 0.60)
that were separated by preparative TLC to give the Rf 0.68 compound in pure form while the Rf
0.60 band consisted of a major component and small but significant amounts of the Rf 0.68
compound. Purity of the Rf 0.68 compound was also confirmed by HPLC analysis under the
conditions previously described (RT 55.0 min)
Rf 0.68: ESI(+)MS: m/z 447 ([M+H]+); UV: λmax (CH3OH) 342, 470 nm;
1H and
13C NMR (CDCl3)
1H NMR (CDCl3) δ (ppm): 7.10 ( t , J= 8 Hz , 2H), 7.15 ( d, J= 8Hz , 2H) , 7.22 ( t , J= 7.6 Hz
, 1H ) , 7.28 (m, CH), 7.30 (m, CH), 7.45 (d , J= 7.6 Hz , 1H) ,7.55 ( d , J=8Hz , 1H). 13
C NMR
(CDCl3) δ (ppm): 124.26 (C), 126.13 (CH), 126.91 (CH), 127.05 (CH), 127.82 (CH x 2),
128.05 (CH x 2), 128.76 (CH), 129.19 (C), 130.03 (CH), 138.55 (C), 141.58 (C), 156.68 (C)
EPR Spectroscopy
X-band EPR spectra were collected at 298 K in a CW spetrometer equipped with a variable
temperature unit, after mixing a solution (12-25 mM) of 3-phenylbenzothiazine in methanol
containing 3M HCl, with H2O2 (0.1 – 0.4 equivalents) in open (presence of atmospheric
oxygen) suprasil quartz bulbe with 1 mm i.d. To increase S/N ratio up to 8 spectra were
accumulated and digitally averaged. Blank experiments in the absence of H2O2 did not produce
any detectable EPR signal even under continuous photolysis of the mixture in the cavity of the
spectrometer with a 500 W Hg-lamp. Measured g-factor was corrected with respect of that of
2,4,6-tri-tert-butylphenoxyl radical (g = 2.0046) [Lucarini, M.; Pedrielli, P.; Pedulli, G.F.;
Cabiddu, S.; Fattuoni, C. J. Org. Chem. 1996, 61, 9259].
Optimized hyperfine constants were obtained by interactive fitting of the experimental
spectrum with simulated ones, using the Monte Carlo method, [Amorati, R.; Pedulli, G.F.;
Valgimigli, L.; Johansson, H.; Engman, L. Org. Lett. 2010, 12, 2326]. Simulations were
performed with WINESR software developed by Prof Marco Lucarini (University of Bologna).

171
5.5 Benzothiazine based cyanine dyes: a) synthesis and
characterization of dimeric cyanines
Synthesis of 1-(o-aminophenylthio)-2,2-diethoxyethane:
1-(o-aminophenylthio)-2,2-diethoxyethane was prepared following a reported procedure. To a
1.25g solution of o-aminithiophenol in 5 mL anydrous DMSO, 0.23g sodium and 1.52 g
bromoacetoaldehyde diethylacetal. After 1 h at 100 °C, the mixture was washed with water and
axtracter with diethyl ether. The organic residue is washed 2-3-times with water and then dried
over anhydrous sodium sulphate and taken to dryness. After chromatographic purification on
silica gel (n-exane/ ethyl acetate 8/2) a pure compound was obtained in 70 % yield.
1H NMR (CDCl3) δ (ppm):
1H NMR: ( CDCl3): 1.18 (t, 6H ); 2.85 (d, 2H); 3.50(dd,4H), 3.53
(dd, 4H); 4.3 (s, 2H); 4.5 (t, 1H); 6.95 (m, 4 H)
Synthesis of 2,2'-(1,2-ethandiyliden)bis(2H-1,4-benzothiazine).
50 mg of 1-(o-aminophenylthio)-2,2-diethoxyethane was dissolved in 3mL of TFA. The
mixture was taken under stirring for 48h at room temperature. The solution was extracted with
water, sodium bisulfite and chloroform, and the organic layers were dried over anhydrous
sodium sulphate and taken to dryness (45 mg). The residue thus obtained was separated by
column chromatography ( eluant C) to give the product 12 mg, 25% yield .
Uv (MeOH) : λmax 503 nm; (MeOH)/HCl 1M λmax 609 nm; (MeOH)/HCl 3M λmax 650 nm
1H NMR (CDCl3) δ (ppm): 6.35 (s, 2H), 7.05 (d, 2H), 7.19 (m, 2 H), 7.22 (m, 2H), 7.43 (d,
2H), 7.93 (s, 2H) 13
CNMR: (CDCl3) δ: 121.6 (C); 122.1 (CH), 125.5 (CH); 127.4 (CH); 128.4
( C); 128.7 (CH); 131.1 (CH); 139.8 (C); 153.4 (C);

172
Synthesis of 2Z,2'Z-(1,2-etandiilidene)bis(3-phenyl-2H-1,4-benzothiazine).
Method A:
50 mg of 3-phenyl-2H-1,4-benzothiazine was dissolved in 3mL of TFA and then was add
100µL of formaldehyde. The mixture was taken under stirring for 48h at room temperature.
The solution was extracted with water, sodium bisulfite and chloroform, and the organic layers
were dried over anhydrous sodium sulphate and taken to dryness (45 mg). The residue thus
obtained was separated by column chromatography ( eluant C) to give the product 13 mg, 25%
yield .
Method B:
50 mg of 3-phenyl-2H-1,4-benzothiazine was dissolved in 4mL of methanol, than was add
100µL of formaldehyde and 1mL of HCl 12M. The mixture was taken under stirring at room
temperature. The solution was extracted with water and chloroform. The organic layers were
dried over anhydrous sodium sulphate and taken to dryness (43 mg). The residue thus obtained
was separated by column chromatography ( eluant D). to give the product 21.4 mg, 41 % yield.
Method C:
50 mg of 3-phenyl -2H-1,4-benzothiazine was dissolved in 4mL of methanol, than was add
102µL of glyoxal and 1mL of HCl 12M. The mixture was taken under stirring at room
temperature. The solution was extracted with water and chloroform. The organic layers were
dried over anhydrous sodium sulphate and taken to dryness (42 mg). The residue thus obtained
was separated by column chromatography ( eluant A) to give 25.5 mg of pure product, 49%
yield.

173
Method D
50 mg of 3-phenyl -2H-1,4-benzothiazine was dissolved in 4mL of acetonitrile, than was add
102µL of glyoxal and 1mL of HCl 12M. The mixture was taken under stirring and under
reflux at 60 °C. The solution was extracted with water and chloroform. The organic layers were
dried over anhydrous sodium sulphate and taken to dryness to give 64 mg of pure product,
60% yield.
2Z,2'Z-(1,2-etandiilidene)bis(3-phenyl-2H-1,4-benzothiazine):
ESI+MS: m/z 485 ([M+H]+);
UV: λmax (CH3OH) 486 nm;
1H NMR (CDCl3) δ (ppm): 6.85 (s , 1H) , 7.10 (m , 1H) , 7.12 (m 1H) , 7.19 (m , 1H) , 7.45 (m
, 1H) , 7.48 (m , 1H) , 7.52 (m , 2H) , 7.77 (m , 2H);
13C NMR (CDCl3) δ (ppm): 123.4 (C), 124.9 (CH) , 125.9 (CH ) , 126.9 (CH) , 127.8 (CH) ,
128.5 (CH × 2) , 129.1 (CH), 129.2 (CH × 2 ) , 130.1 (CH) , 132.4 (C) , 138.7 (C) , 140.8 (C) ,
160.2 (C).

174
5.6 Benzothiazine-based cyanine dyes: b)Cyanines by condensation of
benzothiazines with aldehydes
Starting from 3-phenyl-1,4-benzothiazine
p-dimethylaminobenzaldehyde
50 mg (0,22 mmol) of 3-phenyl-2H-1,4-benzothiazine was dissolved in 4mL of methanol, than
was add 33,1mg of p-dimethylaminobenzaldehyde and 1mL of HCl 12M. The mixture was
taken under stirring at room temperature. The solution was extracted with water and
chloroform. The mixture obtained was separated by chromatographic column ( eluant E) to
give pure cyanine 1 (28.5 mg, 44% yield).
Compound 1:
ESI+MS: m/z 357 ([M+H]+);
UV: λmax (CH3OH) 440 nm;
1H NMR (CDCl3) δ (ppm): 2.97 ( s, 6H ), 6.73 ( d, j= 8.8 Hz , 2H) , 6.90 ( s, 1H ) , 7.10 ( d ,
j= 7.2 Hz , 1H) , 7.14 ( m , 1H ) , 7.17 ( m , 1H) , 7.45 ( m, 6H) , 7.85 ( d , j= 7.6 Hz , 2H);
13C NMR (CDCl3) δ (ppm): 40.13 (2×CH3) , 111.39 (2×CH) , 117.19 (C) , 122.8 (C) ;
123.37 (C) , 125.06 (CH) , 126.49 (CH) , 127.15 (CH) , 128.37 (CH) , 129.22 (CH) , 129.51
(CH × 2) , 129.74 (CH) , 131.4 (CH × 2) , 134.89 (CH) , 140.2 (C) , 140.92 (C) , 150.19 (C) ,
162.48 (C).
vanillin
50 mg (0,22 mmol) of 3-phenyl-2H-1,4-benzothiazine was dissolved in 4mL of methanol, than
was add 33,8 mg of vanillin and 1mL of HCl 12M. The mixture was taken under stirring at
room temperature. The solution was extracted with water and chloroform. The mixture

175
obtained was separated by column chromatography ( eluant F) to give pure cyanine 2 (26.3 mg,
40% yield).
Compound 2:
ESI+MS: m/z 360 ([M+H]+);
UV: λmax (CH3OH) 413 nm;
1H NMR (CDCl3) δ (ppm): 3.86 (s ,3H) , 6.86 (s , 1H) , 6.90 (d , J = 8 Hz , 1H) , 6.99 (s , 1H) ,
7.01 ( m , 1H) , 7.10 – 7.13 (m , 3H) , 7.41 ( m , 3H) , 7.45 (d , J = 8 Hz , 1H) , 7.78 (m , 2H).
13C NMR (CDCl3) δ (ppm): 55.98 (CH3) , 112.04 (CH) , 114.2 (CH) ,122.69 (C) , 123.00 (C) ,
124.08 (CH) , 125.07 (CH) , 126.72 (CH) , 127.50 (CH), 128.46 (CH × 2) , 129.36 ( CH) ,
129.49 (CH × 2) ,129.73 (C) , 130.00 (CH) , 134.55 (C) , 138.6 (C) , 145.9 (C) , 146.18 (C) ,
163.30 (C).
p-dimethylaminocinnamaldehyde
50 mg (0,22 mmol) of 3-phenyl-2H-1,4-benzothiazine was dissolved in 4mL of methanol, than
was add 39 mg of p-dimethylaminocinnamaldehyde and 1mL of HCl 12M. The mixture was
taken under stirring at room temperature. The solution was extracted with water and
chloroform. The mixture obtained was separated by column chromatography ( eluant D) to give
pure cyanine 3 (23.4 mg, 33% yield).
Compound 3:
ESI+MS: m/z 383 ([M+H]+);
UV: λmax (CH3OH) 464 nm;
1H NMR (CDCl3) δ (ppm): 3.00 ( s , 6H) , 6.59 ( d , J = 16 Hz , 1H) , 6.62 (d , J= 12 Hz , 1H) ,
6.68 ( d, j = 8 Hz , 2H) , 7.02 ( d.d. , J= 12/16 Hz , 1H) , 7.13 (d , J= 8 Hz , 1H) , 7.18 ( m , 2H)

176
, 7.36 ( d , J= 8 Hz , 2H) , 7.46 ( m , 4H) , 7.77 ( m , 2H).
13C NMR (CDCl3) δ (ppm): 40.24 (CH3 × 2) , 112.1 (CH × 2) , 119.1 (CH) , 119.59 (C) ,
124.31 (C) , 124.97 (C) , 125.12 (CH) , 126.77 (CH) , 127.56 (CH) , 128.46 (CH × 2) , 128.49
(CH × 2) , 129.28 (CH × 2) , 129.6 (CH) , 129.76 (CH) , 134.1 (CH) , 138.87 (CH) , 139.31 (C)
, 141.57 (C) , 150.77 (C) , 161.84 (C).
Ferulaldehyde
50 mg (0,22 mmol) of 3-phenyl-2H-1,4-benzothiazine was dissolved in 4mL of methanol, than
was add 35 mg of ferulaldehyde and 1mL of HCl 12M. The mixture was taken under stirring at
room temperature. The solution was extracted with water and chloroform. The mixture
obtained was separated by column chromatography ( eluant D) to give pure cyanine 4 (38 mg,
60% yield).
ESI+MS: m/z 386 ([M+H]+);
UV: λmax (CH3OH) 436 nm;
1H NMR (CDCl3) δ (ppm): 3.95 ( s , 3H) , 6.59 ( d , J = 16 Hz , 1H) , 6.63 (d , J= 12 Hz , 1H) ,
7.06 ( d.d. , J= 12/16 Hz , 1H) , 7.15-7.18 (3H) , 6.97 (1H); 6.89 ( d , J= 8 Hz , 2H), 7.46 ( m ,
4H), 7.77 ( m , 2H).
13C NMR (CDCl3) δ (ppm): 55.98 (CH3 × 2) ,108.43(CH),114.70(CH), 121.42 (CH) , 124.05
(C) , 124.23 (C), 125.14 (CH), 126.73 (CH), 127.53 (CH), 128.52 (CH × 2), 129.27 (CH x
2),129.49 (C , 129.91 (CH) ,133.21 (CH), 138.23 (CH), 139.14 (C), 139.31 (C), 146.52
(C),146.72(C), 161.36 (C).

177
Starting from 3-methyl-1,4-benzothiazine
p-dimethylaminobenzaldehyde
50 mg of (0,31 mmol ) 3-methyl-2H-1,4-benzothiazine was dissolved in 4mL of methanol, than
was add 85µL of p-dimethylaminobenzaldehyde and 1mL of HCl 12M. The mixture was taken
under stirring at room temperature. The solution was extracted with water, calcium carbonate
and chloroform. The mixture obtained was separated by column chromatography (eluant G) to
give pure cyanine 5 (54.1 mg, 60% yield)
Compound 5:
ESI+MS: m/z 295 ([M+H]+);
UV: λmax (CH3OH) 429 nm;
1H NMR (CDCl3) δ (ppm): 2.54 ( s , 3H) , 3.00 (s , 6H ), 6.75 (d , J= 8 Hz, 2H) , 6.97 ( s , 1H)
, 7.09 ( m, 1H) , 7.10 (m , 1H) , 7.15 (m , 1H) , 7.32 ( d , J= 8 Hz , 1H) , 7.54 ( d , J= 8 Hz,
2H) .
13C NMR (CDCl3) δ (ppm): 25.71 (CH3) , 39.36 (CH3 × 2) , 111.31 (CH×2) , 118.82 (C) ,
122.35 (C) , 123.42 (C) , 124.90 (CH) , 125.79 (CH) , 127.23 (CH) , 129.20 (CH) , 131.18 (CH
× 2) , 134.57 (CH) , 139.04 (C) , 159.52 (C).
vanillin
50 mg (0,31 mmol ) of 3-methyl-2H-1,4-benzothiazine was dissolved in 4mL of methanol, than
was add 45mg of vanillin and 1mL of HCl 12M. The mixture was taken under stirring at room
temperature. The solution was extracted with water, calcium carbonate and chloroform. The
mixture obtained was separated by column chromatography ( eluant G) to give pure cyanine 6
(20 mg, 44% yield)

178
Compound 6:
ESI+MS: m/z 298 ([M+H]+);
UV: λmax (CH3OH) 401 nm;
1H NMR (CDCl3) δ (ppm): 2.55 (s , 3H) , 3.95 (s , 3H) , 6.98 (s ,1H) , 6.99 (m , 1H) , 7.09 (m ,
1H) , 7.11-7.14 (m , 4H) , 7.37 ( m , J= 8Hz ,1H).
13C NMR (CD3OD) δ (ppm): 25.87 (CH3) , 55.95 (CH3) , 111.70 (CH) , 114.41 (CH) , 121.4
(C) , 121.8 (C) , 123.55 (CH) , 124.80 (CH) , 126.58 (CH) , 127.42 (CH × 2) , 127.70 (CH) ,
129.18 (CH) , 138.84 (C) , 145.84 (C) , 146.25 (C) , 158.90 (C) .
p-dimethylaminocinnamaldehyde:
50 mg (0,31 mmol ) of 3-methyl-2H-1,4-benzothiazine was dissolved in 4mL of methanol, than
was add 54 mg of p-dimethylaminocinnamaldehyde and 1mL of HCl 12M. The mixture was
taken under stirring at room temperature. The solution was extracted with water, calcium
carbonate and chloroform. The mixture obtained was separated column chromatography (
eluant D) to give pure cyanine 7 ( 22 mg, 32% yield).
Compound 7:
ESI+MS: m/z 321 ([M+H]+);
UV: λmax (CH3OH) 458 nm;
1H NMR (CDCl3) δ (ppm): 2.43 (s, 3H) ; 3.00 (s , 6H ) ; 6.70 ( d , J= 8Hz , 2H) , 6.73 (d , J =
12 Hz , 1H) , 6.75 (d , J = 16 Hz , 1H) , 6.91 (d.d. , J = 12/16 Hz , 1H) , 7.10 ( m , 2H) , 7.15
(m , 1H) , 7.33 ( d , J= 8 Hz , 1H) , 7.39 ( d , J= 8 Hz , 2H ).
13C NMR (CDCl3) δ (ppm): 24.92 (CH3); 40.55 (2×CH3); 112.19 (2×CH) ; 119.38 (CH) ;
120.60 (C); 123.26 (C); 124.81 (CH) ; 125.16 (C) ; 126.4 (CH); 127.2 (CH) ; 127.62 (CH) ;
128.28 (2× CH) ; 129.41 (CH) ; 137.85 (CH) ; 140.01 (C) ; 150.59 (C) ; 158.88 (C).

179
Ferulaldehyde
50 mg (0,31 mmol ) of 3-methyl-2H-1,4-benzothiazine was dissolved in 4mL of methanol, than
was add 54 mg of ferulaldehyde and 1mL of HCl 12M. The mixture was taken under stirring at
room temperature. The solution was extracted with water, calcium carbonate and chloroform.
The mixture obtained was separated on column chromatography ( eluant D) to give pure
cyanine 8 ( 22 mg, 32% yield).
Compound 8
ESI+MS: m/z 323 ([M+H]+);
UV: λmax (CH3OH) 434 nm;
1H NMR (CDCl3) δ (ppm): 2.52 (s , 3H), 3.95 ( s , 3H) , 6.80 ( d , J = 16 Hz , 1H) , 6.83 (d , J=
12 Hz , 1H) , 7.01 ( d.d. , J= 12/16 Hz , 1H) , 7.10-7.25 (3H), 7.38 (d, 1H), 6.85 (d, 2H), 6.99
(d, 2H), 7.07 (s, 1H)
13C NMR (CDCl3) δ (ppm):25.02 (CH3), 55.98 (OCH3) , 110.33 (CH), 114.52 (CH), 120.72
(CH), 121.05 (C), 122.42 (CH), 124.59 (CH), 125.13 (C),126.12 (CH), 127.44 (CH), 128.29
(C), 129.61 (CH), 130.11 (CH), 138.09 (CH), 140.14 (C), 145.92 (C), 146.56 (C), 156.36 (C)

180
5.7 Role of benzothiazine structural units in pheomelanin properties:
UV-independent prooxidant effects of natural and model pigments
Isolation of hair melanin
Red hair pheomelanin (RHP) and black hair eumelanin (BHE) were isolated as previously
reported with modifications (Greco et al., 2009; Thureau et al., 2012). Briefly, hairs (5 g) were
washed with acetone/ dichloromethane/diethyl ether (2:1:1 v/v/v, 250 ml) and allowed to airdry
overnight. The washed hairs were finely minced with scissors and suspended by use of a
glass/glass potter in 0.1 M phosphate buffer pH 7.4 (200 ml). The resulting mixture was
incubated with proteinase K (40 mg, 13 U/mg) and dithiothreitol (600 mg) in an argon
atmosphere under vigorous stirring at 37°C. After 18 h, the mixture was centrifuged at 1258 g
for 20 min at 4°C; the resulting precipitate was washed with 1% acetic acid (3 9 5 ml), while
the supernatant was acidified to pH 3 with 2 M HCl, stored at 4°C for 1 h, and centrifuged at
1258 g for 20 min at 4°C, to give a precipitate that was washed with 1% acetic acid (3 9 5 ml).
The combined precipitates were suspended in 0.1 M phosphate buffer (pH 7.4) (25 ml) and
treated again with proteinase K (24 mg) and dithiothreitol (360 mg) as bove. After 18 h, the
mixture was treated as above, and the combined precipitates were subjected to two further
digestion treatments with proteinase K (20 mg for the first treatment and 3 mg for the second)
and dithiothreitol (8 mg for the first treatment and 13 mg for the second) as above. The final
precipitate was washed with water and lyophilized. The pellet obtained was resuspended in 0.1
M phosphate buffer (pH 7.4) at a concentration of 50 mg/ml containing Triton X-100 (200 ll for
100 mg of pellet) and taken under stirring at 37°C. After 4 h, the mixture was centrifuged at 20
124 g for 20 min at 4°C; the resulting precipitate was washed with 1% acetic acid (3 9 5 ml),
while the supernatant was acidified to pH 3 with 2 M HCl, stored at 4°C for 1 h, and
centrifuged at 20 124 g for 20 min at 4°C, to give a precipitate that was washed with ultrapure

181
water (3 9 5 ml). The combined precipitates were subjected to a further digestion treatment
with proteinase K (3 mg) and dithiothreitol (13 mg) as described above. The final precipitate
was washed with water and lyophilized to obtain 132 mg of red hair pheomelanin (RHP) and
157 mg of black hair eumelanin (BHE). 5 mg of RHP, BHE or hair samples was treated with
alkaline H2O2 and analyzed by HPLC as previously described for TTCA (in the case of
pheomelanin) and PTCA (in the case of eumelanin) (Greco et al., 2009; Panzella et al., 2007).
The yields of TTCA obtained by degradation of red human hair and purified RHP were 150
ng/mg and 1630 ng/mg, respectively; PTCA yields obtained by degradation of black hair and
purified BHE were 200 ng/mg and 4000 ng/mg, respectively.
Preparation of synthetic melanins.
CD-mel by peroxidase/H2O2 oxidation was prepared by treatment of 5SCD (150 mg, 0.32 mol)
in 0.1 M phosphate buffer, pH 6.8 (37.5 mL) with peroxidase (3.4 mg, 16.7 U/mL final
concentration) and 30% v/v H2O2 (38 L ). The oxidation mixture was allowed to stand at room
temperature under vigorous stirring for 2 h and then acidified to pH 3 with 3 M HCl. The
melanin precipitate was collected by centrifugation (7000 rpm, 20 min, 4 °C) and was washed
three times with 1% acetic acid and once with H2O (118 mg, 79% yield).
When required, the reaction was run in the presence of ZnSO4 × 7H2O (111 mg, 1.2 molar eq)
yielding 137 mg of product (52% yield).
3-S-cysteinyl-5-methylcathecol melanin was prepared by treatment of 3-S-cysteinyl-5-
methylcathecol (100 mg) in 0.1 M phosphate buffer, pH 6.8 (25 mL) with peroxidase (2.3 mg,
17.3U/ml) and 30% v/v H2O2 (25 l). The oxidation mixture was treated as above to give 28
mg of melanin (28% yield).
Chemical degradation of natural and synthetic melanins.
Finely minced hair (10 mg) or purified hair melanins (5 mg) were suspended in 1 M NaOH

182
(1mL) and treated with H2O2 (50 L, final concentration 1.5%) at room temperature and under
vigorous stirring for 24 h. The mixture was treated with 5% Na2S2O5 (200 L), taken to pH 4
with HCl 4 M, filtered through nylon membranes (13 mm, 0. 45m) and analyzed by HPLC.
GSH depletion
A solution of GSH (3.0 mg, 9.8 mol) in 0.1 M phosphate buffer (pH 7.4) (65 ml) in the
presence of RHP (3.0 mg) was allowed to stand under vigorous stirring at room temperature, in
the dark. The mixture was periodically analyzed by HPLC with UV (220 nm) and
electrochemical detection using 10 mM NaH2PO4 (pH 3.0 with phosphoric acid) at a flow rate
of 0.7 ml/min as the eluant. In control experiments, the reaction was run (i) in the absence of
melanin; (ii) in the presence of CD-mel, BHE, 30 M FeCl3 or 6 M CuSO4 x 5H2O instead of
RHP; (iii) in the presence of SOD (4 U/ ml), catalase (25 U/ml) or both of them; iv) under an
Ar atmosphere
In other experiments, GSH depletion by RHP was followed using Ellman’s reagent (Ellman,
1959). Briefly, a solution of GSH (3.0 mg, 9.8 mol) in 0.1 M phosphate buffer pH 7.4 (4.9 ml)
was allowed to stand under vigorous stirring at room temperature, in the dark, in the presence
of variable amounts of RHP (0.6–6.0 mg). 100 l of the mixture was periodically withdrawn
and added to 2.7 ml of 0.1 M phosphate buffer (pH 7.4) followed by 50 l of Ellman’s solution
[16 mg of Ellman’s reagent in 4 ml of 0.1 M phosphate buffer (pH 7.4)], and after 15 min, the
absorbance at 412 nm was recorded by use of a UV/vis spectrophotometer. In control
experiments, the reaction was run in the absence of melanin, in the presence of CDmel or in the
presence of BHE. A blank experiment without GSH was also performed in order to evaluate the
contribution of the absorption of melanin samples at the analytical wavelength.
NADH/NADPH depletion .
A solution of NADH/NADPH (3.0 mg, 4.mol) in 0.1 M phosphate buffer pH 7.4 (28 ml) in

183
the presence of RHP (3.0 mg) was allowed to stand under vigorous stirring at room
temperature, in the dark. The mixture was periodically analyzed by HPLC with UV detection
(260 and 340 nm) using 0.2 M phosphate buffer (pH 6.0)/methanol 86/14 v/v at a flow rate of
0.7 ml/min as the eluant. In control experiments, the reaction was run (i) in the absence of
melanin; (ii) in the presence of BHE; (iii) under an Ar atmosphere.
Dopa and 5SCD depletion
A solution of dopa (3.0 mg, 15 lmol) or 5SCD (4.7 mg, 15 lmol) in 0.1 M phosphate buffer pH
7.4 (15 ml) in the presence of RHP (1:2 w/w) was allowed to stand under vigorous stirring at
room temperature in the dark. The mixture was periodically analyzed by HPLC with UV
detection (254 nm) using 0.5% trifluoroacetic acid/methanol 9:1 v/v at flow rate of 0.8 ml/min
as eluant. In control experiments, the reaction was run (i) in the absence of melanin; (ii) in the
presence of BHE instead of RHP; (iii) in the presence of SOD (4 U/ml), catalase (25 U/ml) or
both of them; (iv) under an Ar atmosphere.
EPR experiments
A solution of GSH (5 mg, 16 lmol) in 0.1 M phosphate buffer (pH 7.4) (2 ml) in the presence of
RHP (1 mg) was allowed to stand under vigorous stirring at room temperature, in the dark. The
mixture was periodically analyzed by HPLC with UV and electrochemical detection and by
EPR. For the latter measurements, pheomelanin samples were transferred to flame-sealed glass
capillaries which, in turn, were coaxially inserted in a standard 4-mm quartz sample tube
containing light silicone oil for thermal stability. In other experiments, the reaction was run (i)
in the absence of GSH; (ii) in the presence of CD-mel (with or without GSH) instead of RHP.
Statistical analysis
Data sets were initially assessed for normality. Means were statistically compared using
independent samples two-tailed t tests.

184
5.8 Photochemistry of pheomelanins: spectroscopic investigation of
benzothiazole building blocks
Sample preparation.
BT and BTCA were prepared from 5-S-cysteinyldopa according to Greco et al. MB was
commercially available. M-BT was prepared by a modification of the procedure followed for
BT preparation. In brief a solution of 4-methylcathecol (1.26 g, 0.01 mol) in ice-cold water
(100 mL) was treated with sodium periodate (2.35 g, 1.1 eq) in water (100 mL) in an ice bath.
The bright red reaction mixture is extracted with cold dichloromethane and the organic phase
was dried over anhydrous sodium sulfate and evaporated to dryness. The product formed was
identified as 4-methyl-1,2-benzoquinone (700 mg, purity 64% as determined by UV taking the
molar extinction coefficient at 389 nm as 1585 M-1
cm-1
) 2
. To a stirred solution of L-cysteine
(439 mg) in 0.1 HCl (20 mL) a solution of the 4-methyl-1,2-benzoquinone (439 mg) dissolved
in ethanol (40 mL) was added dropwise over about 3 hours. The reaction mixture was
extracted with diethyl ether (180 mL) and ethyl acetate (80 mL). The aqueous phase was
recovered, dried under vacuum and washed with water in order to remove excess acid. The
identity of the product was secured by UV and LC-MS (Gradient A, detection at 254 nm, Rt 4.0
min, m/z 244 (M+H)+). UV (0.1M HCl) λmax 289 nm; 253 nm (taking the molar extinction
coefficient as = 2951 M-1
cm-1
and = 3715 M-1
cm-1
).The resulting mixture was fractionated
by preparative HPLC/UV (eluent: 1% formic acid/methanol 85:15 (v/v); flow rate: 20 mL/min;
UV: 254 nm). After concentration in a rotary evaporator the residue was lyophilized yielding
the product as pale yellow powder (362 mg, 41% yield)

185
Fluorescence experiments
The experimental conditions of the optical measurements were described previously127,129
.
Absorption spectra were recorded with an Agilent spectrophotometer, and a SPEX Fluorolog
was used to record steady state fluorescence spectra with an excitation wavelength of 266 nm.
Time resolved fluorescence data were collected using a Hamamatsu streak camera C6860
device coupled to a Chromex spectrograph. The temporal resolution varied between ~10 to 60
ps depending on the investigated time range. The 266 nm laser beam used to excite the sample
was generated by frequency tripling 150 fs, 800 nm, Ti:Sa pulses at a repetition rate of 82 MHz
(Spectra-Physics, Tsunami). The laser beam was focused on the sample in a 2 mm rotating
quartz cuvette. Fluorescence was collected at magic angle using two 1-inch diameter 50 mm
focal length quartz lenses and focused on the spectrograph. All time-resolved fluorescence
measurements were performed at room temperature (20 ± 1°C), under aerated conditions.
Data analysis
Time resolved fluorescence (TRF) data were analyzed using singular value decomposition
(SVD) and global fit (GF) procedures, as described elsewhere130-132
. Briefly, SVD is a tool that
allows us to minimize significantly the number of relevant kinetic and spectral components
required to describe the entire evolution of the system. It also suppresses the noise from the
data without losing any relevant information. It consists in decomposing the M x N data matrix
(E) into a product of three components according to:
TE USV , (1)
where U and VT stand for orthogonal matrices of M x M basis spectra and N x N basis kinetics
traces, respectively. The diagonal elements of the S matrix yield the singular values Si. A
nonlinear least square global fit (GF) to the VT traces is performed using a multiexponential
function convoluted with a Gaussian instrumental response function (IRF) as described in
equation 2,
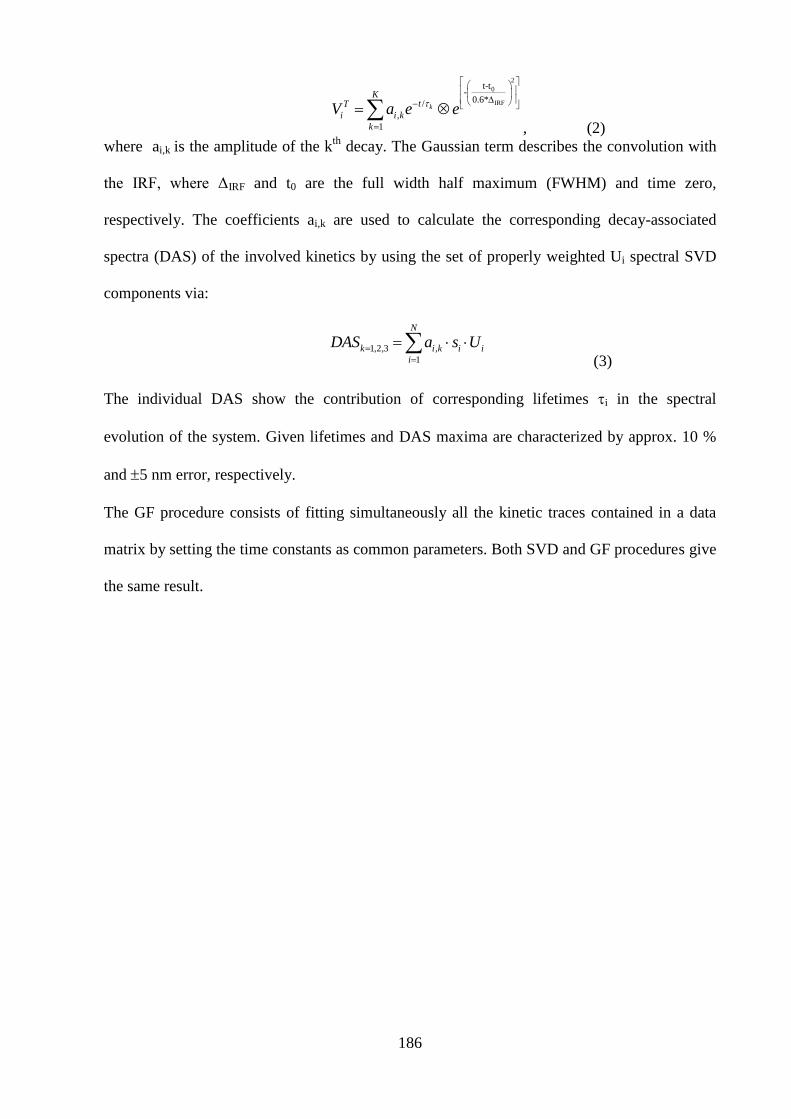
186
2
0
IRF
t-t-
0.6*/
,
1
k
KtT
i i k
k
V a e e
, (2)
where ai,k is the amplitude of the kth
decay. The Gaussian term describes the convolution with
the IRF, where ΔIRF and t0 are the full width half maximum (FWHM) and time zero,
respectively. The coefficients ai,k are used to calculate the corresponding decay-associated
spectra (DAS) of the involved kinetics by using the set of properly weighted Ui spectral SVD
components via:
1,2,3 ,
1
N
k i k i i
i
DAS a s U
(3)
The individual DAS show the contribution of corresponding lifetimes i in the spectral
evolution of the system. Given lifetimes and DAS maxima are characterized by approx. 10 %
and 5 nm error, respectively.
The GF procedure consists of fitting simultaneously all the kinetic traces contained in a data
matrix by setting the time constants as common parameters. Both SVD and GF procedures give
the same result.

187
5.9 Photochemistry of pheomelanins: Spectroscopic investigation of
natural and synthetic pigments and related 1,4-benzothiazines
Isolation of hair melanin
This procedure was already described in 4.6
Preparation of synthetic melanins.
The synthesis of these synthetic pigments was already described in 4.6
Synthesis of 10-[6-(2-amino-2-carboxyethyl)-4-hydroxybenzothiazol-2-yl]-8- carboxy-5-
hydroxy-3-oxo-3,4,7,8-tetrahydro-2H-[1,4]thiazino[5,6-h]isoquinoline
To a solution of 5SCD (30 mg, 12 mM) in 0.1 M phosphate buffer (pH 6.8)(6 mL) zinc sulfate
(1.2 molar eq.) was added. After 30 min peroxidase (50 U/mL final concentration), and 30%
v/v H2O2 up to a 38 mM final concentration were sequentially added. The mixture was
allowed to sit at room temperature under vigorous stirring for 5 h.
For preparative purposes the reaction was carried out on three aliquots of 5SCD (30 mg each),
and after 5 h the mixtures were acidified to pH 2, the solid was collected by centrifugation
(7000 rpm, 4 C°, 30 min), and purified by semipreparative HPLC (gradient B, detection at 340
nm) to afford the product eluting at tR 39.8 min (3 mg, 3% yield).
Synthesis of 2,2’-Bi[7-(2-amino-2-carboxyethyl)-3-carboxy-5-hydroxy-2H-1,4-benzothiazine]
A 2 mM solution of CD (50 mg) in 0.05 M phosphate buffer (pH 7.4, 80 mL) was allowed to
stand at room temperature under vigorous stirring in the presence of ZnSO4 (27 mg) for 10
minutes. Na2S2O8 was added (90 mg) and after 30 minutes the reaction mixture was acidified
to pH 3 with 6 M HCl. After 30 minutes the mixture was taken to pH 6 and allowed to
precipitate at 4 °C. The precipitate was collected by centrifugation (6000 g, 15 min, 4 °C),

188
washed once with H2O and lyophilized. The product was purified by preparative HPLC
(eluent: 0.5% TFA/methanol 50:50 (v/v); flow rate: 15 mL/min; UV: 254 nm).The identity of
the product was secured by LC-MS (gradient B, detection at 254, flow rate: 0.7 mL/min, Rt
42.9 min, m/z 591 [M+H]+).
Fluorescence experiments
The experimental conditions of the optical measurements were described in 4.7

189
6.References
1) L. Le Bozec, C.J. Moody, Aust. J. Chem. 2009, 62, 639–647
2) T. Fojo, M. Menefee, Ann. Oncol., 2007, 18, 3-8
3) G. Pettit, K. Yoshiaki, C.L. Herald, C. Dufresne, R.L Cerny, D.L Herald, J.M. Schimdt, H. Kizu,
J. Am. Chem. Soc., 1989, 111, 5015-5017
4) C.M. Ireland, A.R Durso Jr., R.A. Newman, M.P. Hacker, J. Org. Chem, 1982, 47, 1807-1811
5) C. Garcia-Ruiz, F. Sarabia, Mar. Drugs, 2014, 12, 1580-1622
6) R.J. Mulder, C.M. Shafer, T.F. Molinski, Bioorg. Med. Chem. Lett., 2009, 19, 2928-2930
7) S. Kapur, D. Mamo, Prog Neuropsychopharmacol Biol Psychiatry, 2003, 27, 1081-1090
8) M.J. Hughes, I.A. Coret, Am. J. Physiol, 1972, 23, 1257-1262
9) P.J. Donovick, Biotechnic and Histochemistry, 1974, 49, 49-51
10) J.L. Vennerstrom, M.T. Makler, C.K. Angerhofer, J.A. Williams, Antimicrob.Agents
Chemoter., 1995, 39, 2671-2677
11) R. H. Thomson, Angew. Chem. Intl. Ed. Engl. 1974, 13, 305-312.
12) S. Ito, K. Wakamatsu, Pigm. Cell Melanoma Res. 2011, 24, 63–74.
13) F. Rouzaud, A. Kadekaro, Z.A. Abdel-Malek, V.J. Hearing, Mutat. Res. 2005, 571, 133–152.
14) R.M. El-Shishtawy , Int. J. Photoenergy, 2009 , 1-21.
15) K. R. J. Thomas, Y.-C. Hsu , J. T. Lin et al., Chem. Mater, 2008 , 5 , 1830-1840,.
16) Y. Di Iorio, M.A. Brusa, A. Feldhoff, M.A. Grela, ChemPhysChem , 2009,10,1077-1083.
17) C. Dejoie et al , Appl Mat & Intergaces , 2010 , 2 , 2308-2316.
18) J. L. Meinershagen , T. Bein , J. Am. Chem. Soc. , 1999 , 121, 448-449.
19) S. Jockusch, N.J. Turro, and F.R. Blackburn, J. Phys. Chem, 2002, 40, 9236-9241.
20) S. Wang, M.-S. Choi, and S.-H. Kim , J. Photoc. Photobio. A, 2008 , 2-3, 150-155.
21) F. Pina, TA Hatton, Langmuir, 2008, 24, 2356-2364.
22) F. Han,L. Chi, W. Wu, X. Liang, M. Fu, J. Zhao, Photochem. Photobiol., 2008, 196, 10-23

190
23) B. L. Kaul , Helv. Chim.Acta , 1974 , 37, 2664-2678.
24) G. Prota , E. Ponsiglione and R. Ruggiero , Tetrahedron , 1974 , 30, 2781-2784.
25) J. D. Simon , M.R. Goldsmith , L. Hong , V.R. Kempf , L.E.L. McGuckin , T. Ye, G. Zuber,
Photochem. Photobiol, 2006, 82, 318-323.
26) F. Chioccara, G. Prota , R.H. Thomson , Tetrahedron Lett. 1976 ,1407-1409.
27) L. M. Zimmermann-Dimer, D. C. Reis, C. Machado, V. G. Machado, Tetrahedron, 2009 , 65,
4239–4248.
28) A. Ehret, L. Stuhl, M.T. Spitler, J. Phys. Chem. B, 2001, 105, 9960-9965
29) G. Prota, R.A. Nicolaus, W. Montagna F. Hu, Advances in Biology of Skin, vol 8. New York:
Pergamon Press; 1967. 323–328
30) P. Valverde, E. Healy, I. Jackson, J.L Rees, A.J. Thody, Nature Genetics, 1995, 11, 328-330
31) J.L. Rees, Annu. Rev. Genet. 2003, 37, 67-90.
32) N.F. Box, J.R. Wyeth, L.E. O'Gorman, N.G. Martin, R.A. Sturm, R. A. Hum. Mol. Genet. 1997,
6, 1891-1897.
33) E. Healy, S.A. Jordan, P.S. Budd, R. Suffolk, J.L. Rees, I.J. Jackson, Hum. Mo.l Genet. 2001,
10, 2397-2402.
34) Simon, J. D.; Peles, D. N.. Acc. Chem. Res. 2010, 43, 1452–1460.
35) S. Ito, K.Wakamatsu, Pigm. Cell Melanoma Res., 2011, 24, 63–74.
36) S. Ito, G. Prota, Experientia, 1977, 33, 1118–1119.
37) L. Panzella, M. De Lucia, A. Napolitano, M. d'Ischia, Tetrahedron Lett., 2007, 48, 7650–7652.
38) A. Napolitano, M. De Lucia, L. Panzella, M. d'Ischia, Photochem. Photobiol. 2008, 84, 593-599
39) S. Crescenzi, G. Misuraca, E. Novellino, G. Prota, Chim. Ind. 1975, 57, 392–393.
40) G. Greco, L. Panzella, L. Verotta, M. d'Ischia, A. Napolitano, J. Nat. Prod., 2011, 74, 675–682.
41) A. Napolitano, S. Memoli, O. Crescenzi, G. Prota, J. Org. Chem. 1996, 61, 598–604.
42) C. Costantini, O. Crescenzi, G. Prota, A. Palumbo, Tetrahedron, 1990, 46, 6831–6838.
43) A. Napolitano, P. Di Donato, G.Prota, J. Org. Chem. 2001, 66, 6958–6966.

191
44) L.N. Pho, S.A. Leachman, G. Ital. Dermatol. Venereol., 2010, 145, 37–45.
45) D. Mitra, X. Luo, A. Morgan, J. Wang, M.P. Hoang, J. Lo, C.R. Guerrero, J. Lennerz, M.C.
Mihm, J.A. Wargo, K.C. Robinson, S.P. Devi, J.C. Vanover, J.A: D'Orazio, M. McMahon,
M.W. Bosenberg, K.M. Haigis, D.A: Haber, Y. Wang, D.E. Fisher, Nature, 2012, 491, 449–453.
46) M.R. Chedekel, S.K. Smith, P.W: Post, A. Pokora, D.L. Vessell, Proc. Natl. Acad. Sci. U.S.A.
1978, 75, 5395-5399.
47) M. Brenner, V.J. Hearing, . Photochem. Photobiol. 2008, 84, 539-549.
48) J. Riesz, T. Sarna, P. Meredith, J. Phys. Chem. B. 2006, 110, 13985-13990.
49) S. Schmitz, P.D. Thomas, T.M. Allen, M.J. Poznansky, K. Jimbow, Photochem. Photobiol.
1995, 61, 650-655.
50) S. Takeuchi, W. Zhang, K. Wakamatsu, S. Ito, V.J. Hearing, K.H. Kraemer, D.E. Brash, D. E.
Proc. Natl. Acad. Sci. U.S.A. 2004, 101, 15076-15081.
51) D. N Peles, L. Hong, D. N. Hu, S. Ito, R.J. Nemanich, J.D. Simon, J. D. J. Phys. Chem. B.
2009, 113, 11346–11351.
52) S. Ito, Pigment Cell Res. 2003, 16, 230–236.
53) S. Ito, K. Wakamatsu, Photochem. Photobiol. 2008, 84, 582–592.
54) T. Ye, L. Hong, J. Garguilo, A. Pawlak, G.S. Edwards, R.J. Nemanich, T. Sarna, J.D. Simon,
Photochem. Photobiol. 2006, 82, 733-737.
55) T. Ye, J. D. Simon, Photochem. Photobiol., 2003, 77, 41–45.
56) P. Di Donato, A. Napolitano, Pigment Cell Res, 2003, 16, 532–539.
57) T. Ye, L. E. Lamb, K. Wakamatsu, S. Ito and J. D. Simon, Photochem. Photobiol, 2003, 2, 821–
823.
58) A. Napolitano, P. Di Donato ,G. Prota, J. Org. Chem, 2001, 66, 6958–6966.
59) Z.A. Abdel-Malek, S. Ito, Pigment Cell Melanoma Res. 2013, 26, 164-166.
60) C. Printz, Cancer 2013, 119, 1118.
61) C. Rodwell, Nat. Rev. Cancer 2012, 12, 79.

192
62) A.M. Morgan, J. Lo, D.E. Fisher, Bioessays , 2013, 3, 672–676.
63) G. Greco, L. Panzella, G. Gentile , M.E. Errico, C. Carfagna, A. Napolitano, M.d’Ischia, Chem.
Commun., 2011, 47, 10308–10310.
64) M. J. Frisch, G. W. Trucks, H. B. Schlegel, G. E. Scuseria, M. A. Robb, J. R. Cheeseman, G.
Scalmani, V. Barone, B. Mennucci, G. A. Petersson, H. Nakatsuji, M. Caricato, X. Li, H. P.
Hratchian, A. F. Izmaylov, J. Bloino, G. Zheng, J. L. Sonnenberg, M. Hada, M. Ehara, K. Toyota,
R. Fukuda, J. Hasegawa, M. Ishida, T. Nakajima, Y. Honda, O. Kitao, H. Nakai, T. Vreven, J. A.
Montgomery Jr., J. E. Peralta, F. Ogliaro, M. Bearpark, J. J. Heyd, E. Brothers, K. N. Kudin, V.
N. Staroverov, R. Kobayashi, J. Normand, K. Raghavachari, A. Rendell, J. C. Burant, S. S.
Iyengar, J. Tomasi, M. Cossi, N. Rega, J. M. Millam, M. Klene, J. E. Knox, J. B. Cross, V.
Bakken, C. Adamo, J. Jaramillo, R. Gomperts, R. E. Stratmann, O. Yazyev, A. J. Austin, R.
Cammi, C. Pomelli, J. W. Ochterski, R. L. Martin, K. Morokuma, V. G. Zakrzewski, G. A. Voth,
P. Salvador, J. J. Dannenberg, S. Dapprich, A. D. Daniels, Ö. Farkas, J. B. Foresman, J. V. Ortiz,
J. Cioslowski, D. J. Fox, Gaussian 09, Revision A.01, Gaussian, Inc., Wallingford, CT, 2009.
65) C. Adamo, V. Barone, J. Chem. Phys. 1999, 110, 6158–6169.
66) a) M. Cossi, G. Scalmani, N. Rega, V. Barone, J. Chem. Phys. 2002, 117, 43–54; b) G. Scalmani,
V. Barone, K. N. Kudin, C. S. Pomelli, G. E. Scuseria, M. J. Frisch, Theor. Chem. Acc. 2004,
111, 90–100.
67) A. K. Rappé, C. J. Casewit, K. S. Colwell, W. A. Goddard III, W. M. Skiff, J. Am. Chem. Soc.
1992, 114, 10024–10035.
68) a) M. Caricato, G. Scalmani, M. J. Frisch in Continuum Solvation Models in Chemical Physics
(Eds.: B. Mennucci, R. Cammi), John Wiley & Sons, Chichester, 2007, 64–81.
69) a) R. Bauernschmitt, R. Ahlrichs, Chem. Phys. Lett. 1996, 256, 454–464; b) C. Adamo, G. E.
Scuseria, V. Barone, J. Chem. Phys. 1999, 111, 2889–2899; c) G. Scalmani, M. J. Frisch, B.
Mennucci, J. Tomasi, R. Cammi, V. Barone, J. Chem. Phys. 2006, 124, 094107-1-15.

193
70) a) R. Ditchfield, Mol. Phys. 1974, 27, 789–807; b) K. Wolinski, J. F. Hilton, P. Pulay, J. Am.
Chem. Soc. 1990, 112, 8251–8260.
71) L. Minale, E. Fattorusso, G. Cimino, S. De Stefano, R. A. Nicolaus, Gazz. Chim. Ital. 1969, 99,
431–449
72) G. Prota, F. Giordano, L. Mazzarella, C. Santacroce, D. Sica, J. Chem. Soc. C 1971, 15, 2610–
2616.
73) R. S. Becker, L. V. Natarajan, Chem. Phys. Lett. 1986, 132, 141–143.
74) J. A. Montgomery Jr., M. J. Frisch, J. W. Ochterski, G. A.Petersson, J. Chem. Phys. 1999, 110,
2822–2827
75) R. M. Gschwind, X. Xie, P. R. Rajamohanan, Magn. Reson. Chem. 2004, 42, 308–312.
76) C. Santacroce, D. Sica, R. A. Nicolaus, Gazz. Chim. Ital. 1968, 98, 85–96.
77) D. Sica , C. Santacroce and G. Prota , J. Heterocyclic Chem, 1970 , 7, 1143-1147.
78) K. Fujii, Yakugaku Zasshi, 1957, 77, 347.
79) P. Bottex, B. Sillion, G. De Gaudemaris, J.J. Basselier, Compt. Rend. 1968, 267, 186.
80) D. Sica , C. Santacroce, G. Prota , J. Heterocyclic Chem, 1970 , 7, 1143-1147.
81) R.C. Sealy, J.S. Hyde, C.C. Felix, I.A. Menon, G. Prota, H.M. Swartz, S. Persad, H.F.
Haberman, Proc. Natl. Acad. Sci. U.S. 1982, 79, 2885.
82) A.D. Becke, J. Chem. Phys. 1993, 98, 5648.
83) V. Barone, In Recent Advances in Density Functional Methods, Part I; Chong, D. P., Ed.;
World Scientific: Singapore, 1996.
84) V. Barone, P. Cimino, E. Stendardo, J. Chem. Theory Comput. 2008, 4, 751.
85) R. Amorati, G.F. Pedulli, L. Valgimigli, H. Johansson, L. Engman, L. Org. Lett. 2010, 12, 2326.
86) C. Adamo, V. Barone, J. Chem. Phys. 1999, 110, 6158.
87) S. Miertus, E. Scrocco, J.Tomasi, J. Chem. Phys. 1981, 55, 117.
88) J. Nagahama, H. Yumoto, Surf. Coat. Technol. 2003, 169_170, 658–661.
89) F. Chioccara , G. Prota, R.H. Thomson , Tetrahedron Lett. 1975,811-814

194
90) F. López Arbeloa, P. Ruiz Ojeda and I. López Arbeloa, J. Luminesc., 1989, 44, 105-112
91) L. Panzella, G. Szewczyk, M. d’Ischia, A. Napolitano, T. Sarna, Photochem. Photobiol 2010, 86,
757–764.
92) M. d’Ischia, K. Wakamatsu, A. Napolitano,et al., Pigment Cell Melanoma Res, 2013, 26, 616–
633.
93) Y. Liu,J.D. Simon, Pigment Cell Res. 2003, 16: 72–80
94) S. Ito, Biochim. Biophys. Acta, 1986, 883, 155–161.
95) G. Prota, Melanins and melanogenesis, 1992
96) L. Novellino, A. Napolitano, G. Prota, Biochim. Biophys. Acta, 2000, 1475, 295-306.
97) G. Greco, K. Wakamatsu; L. Panzella, S. Ito, A. Napolitano, M. d'Ischia,. Pigment Cell
Melanoma Res. 2009, 22, 319-327.
98) K. Wakamatsu, Y. Nakanishi, N. Miyazaki,L. Kolbe, S. Ito, Pigm. Cell Melanoma Res. 2012, 25,
434–445.
99) A. Mayevsky, G.G. Rogatsky, Am. J. Physiol. Cell Physiol., 2007, 292, C615–C640.
100) G.L. Ellman, Tissue sulfhydryl groups. Arch. Biochem 1959
101) Y. Liu, L. Hong, K. Wakamatsu, S. Ito, B. Adhyaru, C.Y. Cheng, C.R. Bowers, J.D. Simon
Photochem. Photobiol., 2005, 81, 135–144.
102) E. Cesareo, L. Korkina, G. D’Errico, G. Vitiello, M. S. Aguzzi, F. Passatelli, J.Z. Pedersen, A.
Facchiano , PLoS ONE 7, 2012 , e48849.
103) E.B. Vsevolodov, S. Ito, K. Wakamatsu, I.I. Kuchina, I.F. Latypov, Pigment Cell Res., 1991, 4,
30–34.
104) A. Samokhvalov, L. Hong,Y. Liu, J. Garguilo, R.J. Nemanich, G.S. Edwards, J.D. Simon,
Photochem. Photobiol., 2005, 81, 145–148.
105) A.A.Suzukawa, A. Vieira, S.M. Winnischofer, A.C. Scalfo, P. Di Mascio, A.M. Ferriera, J.L.
Ravanat, L. Martins Dde, M.E. Rocha, G.R. Martinez, Free Radic. Biol. Med., 2012, 52, 1945–
1953.
195
106) E. Chikvaidze, I. Khachatryan, Int. J. Cosmet. Sci., 2011, 33, 322–327.
107) S. Chio, J.S. Hyde, R.C. Sealy, Arch. Biochem. Biophys., 1982, 215, 100–106.
108) K. Jimbow, O. Ispida, S. Ito, Y. Hori, C.J.Witkop Jr, R.A. King, J. Invest. Dermatol.1983, 81,
506–511.
109) S. Ito, Proc. Natl Acad. Sci. USA, 2006, 103, 14647–14648.
110) C. Hansson, H. Rorsman, E. Rosengren, Acta Derm. Venereol., 1980, 60, 399–402.
111) A. Napolitano, S. Memoli, A.J. Nappi, M. d’Ischia, G. Prota, Biochim. Biophys. Acta., 1996,
1291. 75–82.
112) K. Murakami, K. Wakamatsu, Y. Nakanishi, H.Takahashi, S.Sugiyama, S.Ito, Blood Purif.,
2007, 25, 483–489.
113) L. Panzella, K. Wakamatsu, G. Monfrecola, S. Ito, F. Ayala, A. Napolitano, Exp Dermatol,
2011, 20, 288–290.
114) K. Wakamatsu, T. Kageshita, M. Furue, et al., Melanoma Res, 2002, 12, 245–253.
115) I.M. Hadshiew, M.S. Eller, B.A. Gilchrest, B.A., Am. J. Contact Dermatol., 2000, 11, 19–25.
116) V.A. Terra, F.P.Souza-Neto, R.C. Pereira, T.N.Silva, A.C.Costa, R.C.Luiz, R. Cecchini, A.L.
Cecchini, . J. Photochem. Photobiol B, 2012, 109, 34–41.
117) R.S. Becker, C. Lenoble, A. Zein, J. Phys. Chem. 1987, 91, 3509-3511.
118) C.A.S. Potter, R.G. Brown, F. Vollmer, W. Rettig, J. Chem. Soc. Faraday Trans., 1994, 90, 59-
67.
119) S. Luber, K. Adamczyk, E.T.J. Nibbering, V.S. Batista, J. Phys. Chem. A, 2013, 117, 5269-
5279.
120) G. Greco, L. Panzella, A. Napolitano,M. d’Ischia, Tetrahedron Lett. 2009, 50, 3095-3097.
121) W.J. Catallo, T. Junk, J. Environ. Qual., 2005, 34, 1746-1754.
122) P.E. Todesco, P. Vivarelli, Gazz. Chim Ital. 1964, 94, 372-381.
123) J.M. Berg, J.L. Tymoczko, L. Stryer, Biochemistry; W. H. Freeman and company: New York,
2002.

196
124) P.K. Feng, Q. Fernando, J. Org. Chem., 1960, 82, 2115-2118
125) A. Brenlla, M. Veiga, J.L. Perez Lustres, M.C. Rios Rodriguez, F. Rodriguez-Prieto, M.
Mosquera, J. Phys. Chem. B, 2013, 117, 884-896.
126) A. Corani, A. Huijser, A. Iadonisi, A. Pezzella, V. Sundström, M. d’Ischia, J. Phys. Chem. B,
2012, 116, 13151-13158.
127) A. Corani,A. Pezzella, T. Pascher, T. Gustavsson, D. Markovitsi, A. Huijser, M. d’Ischia, V.
Sundström, V., J. Phys. Chem. Lett., 2013, 4, 1383-1388.
128) D. Leupold, M. Scholz, G. Stankovic, J. Reda, S. Buder, R. Eichhorn, G. Wessler, M. Stucker,
K. Hoffmann, J. Bauer, et al., Pigment Cell Melanoma Res., 2011, 24, 438-445.
129) A. Huijser, A. Pezzella, J. Hannestad, L. Panzella, A. Napolitano, M. d'Ischia, V. Sundstrom,
Chemphyschem, 2010, 11, 2424-2431.
130) A. Cannizzo, A. Blanco-Rodriguez, A. El Nahhas, J. Sebera, S. Zalis, A. Vlcek, M. Chergui,
Journal of the American Chemical Society, 2008, 130, 8967-8974.
131) A. El Nahhas, A. Cannizzo, F. van Mourik, A. Blanco-Rodriguez, S. Zalis, A. Vlcek, M.
Chergui, Journal of Physical Chemistry a, 2010, 114, 6361-6369.
132) A. El Nahhas, C. Consani, A. Blanco-Rodriguez, K. Lancaster, O. Braem, A. Cannizzo, M.
Towrie, I. Clark, S. Zalis, M. Chergui, A. Vlcek, Inorganic Chemistry, 2011, 50, 2932-2943.

197
Publication list
1) Matteo Adinolfi, Domenica Capasso, Sonia Di Gaetano, Alfonso Iadonisi, Loredana Leone,
Antonello Pastore “A straightforward synthetic access to symmetrical glycosyl disulfides
and biological evaluation thereof.”
Org. Biomol. Chem., 2011, 9, 6278-6283
2) Matteo Adinolfi, Marco d'Ischia, Alfonso Iadonisi, Loredana Leone, Alessandro
Pezzella, Silvia Valerio “Glycosylated Eumelanin Building Blocks by Thioglycosylation of
5,6-Diacetoxyindole with an Expedient Selenium-Based Dynamic-Mixture Methodology”
Eur. J.Org. Chem 2012, 23, 4333-4338
3) Loredana Leone, Orlando Crescenzi, Alessandra Napolitano, Vincenzo Barone and Marco
d'Ischia “The Δ2,2′
-Bi(2H-1,4-benzothiazine) Structural Motif of Red Hair Pigments
Revisited: Photochromism and Acidichromism in a Unique Four-State System “
Eur. J. Org. Chem., 2012, 27, 5136-5140
4) Alessandra Napolitano, Lucia Panzella, Loredana Leone, and Marco d’Ischia “Red Hair
Benzothiazines and Benzothiazoles: Mutation-Inspired Chemistry in the Quest for
Functionality”
Acc Chem Res. 2012, 46, 519–528
5) Loredana Leone, Orlando Crescenzi, Riccardo Amorati, Luca Valgimigli, Alessandra
Napolitano, Vincenzo Barone, and Marco d’Ischia“Red-Hair-Inspired Chromogenic System
Based on a Proton-Switched Dehydrogenative Free-Radical Coupling”
Org. Lett., 2013, 15, 4494-4497
6) Lucia Panzella, Loredana Leone, Giorgia Geeco, Giuseppe Vitiello, Gerardino D'Errico,
Alessandra Napolitano, Marco d'Ischia “Red human hair pheomelanin is a potent pro-
oxidant mediating UV-independent contributory mechanisms of melanomagenesis”
Pigment Cell Melanoma Res. 2013, 27, 244-252.

198
7) Amal El Nahhas,
Torbjörn Pascher,
Loredana Leone, Lucia Panzella, Alessandra
Napolitano, Villy Sundström “Photochemistry of pheomelanin building blocks and model
chromophores – excited state intra- and inter-molecular proton transfer.”
Submitted at J. Phys Chem. Lett.
Communications at international meetings
Matteo Adinolfi, Marco d’Ischia, Alfonso Iadonisi, Loredana Leone, Lucia Panzella,
Alessandro Pezzella, Silvia Valerio
Glycosylation as a tool for eumelanin polymers investigation.
NatPharma16th European Carbohydrate Symposium 3-7 July 2011, Sorrento
Poster communication
Matteo Adinolfi, Marco d’Ischia, Alfonso Iadonisi, Loredana Leone, Lucia Panzella,
Alessandro Pezzella, Silvia Valerio
Synthesis of thioglycosylated indoles as precursors of solubile eumelanin polymers
Poster communication
Loredana Leone, Alessandra Napolitano and Marco d’Ischia
Synthesis and Characterization of New 1,4-Benzothiazine-Based Chromophore
SISOC-IX (9th
Spanish-Italian Symphosium on Organic Chemistry) Tenerife, 10-14 February
2012
Poster communication
A. Napolitano, L. Panzella, L. Leone, M. d’Ischia
The bright and dark side of red hair pigments
17th
Meeting of the European Society for Pigment Cell Reasarch Geneva, Switzerland, 11th
-13th
September 2012

199
Loredana Leone, Orlando Crescenzi, Alessandra Napolitano, Vincenzo Barone and Marco
d’Ischia
The 2,2’-Bi(2H-1,4-benzothiazine) Structural Motif of Red Hair Pigments Revisited:
Photochromism and Acidichromism in a Unique Four-State System
XV Ischia Advanced School of Organic Chemistry (IASOC), Ischia, September 2012
Poster communication