Embed Size (px)
Citation preview

COURSE CODE:
DATE:
DURATION:
MARKS:
EXAMINERS:
MODERATOR:
POLYTECHNIC OF NAMIBIA
SCHOOL OF ECONOMICS AND FINANCE DEPARTMENT OF ECONOMICS
PRINCIPLES OF MICROECONOMICS
PMI511 S (Full Time, Part Time and Distance Education)
June 2013
2 Hours
100
Ms. Magda Gerber Mr. Eslon Ngeendepi Mr. Tafirenyika Sunde Mr. Eden Tate Shipanga Ms. Kasnath Kavezeri Ms. Florette Nakusera Ms. Annemie van Rensburg Ms. Victoria Nambinga
Mr. Pinehas Nangula
1st OPPORTUNITY EXAMINATION: QUESTION PAPER
This paper consists of 13 pages including this front page.
INSTRUCTIONS
1. Please write the name of your lecturer and your mode of study on your examination book.
2. Calculators may be used.
3. This examination paper is divided into three sections.
4. Sections A and B should be answered on the enclosed answer sheets and Section C in your
examination book.
5. All questions are compulsory.

QUESTION 4 [1 0 marks]
4.1 Suppose you are the owner of a television subscription service. Your market research shows that if
you charge N$162 per month you can get 224 000 subscribers. If you charge N$198 per month you
can get 176 000 subscribers.
(a) Calculate the price elasticity of demand for your television subscription service using the arc
elasticity (midpoint) formula . (4)
(b) Is demand relatively inelastic, unit elastic or relatively elastic? (1)
(c) Which price should you charge for your television subscription service, N$162 or N$198 per
month? Provide a reason for your answer and show your calculations. (3)
4.2 Concerning price elasticity of supply, draw diagrams depicting:
(a) perfectly inelastic supply, (1)
(b) relatively elastic supply. ( 1)
QUESTION 5 [6 marks]
As an Economics student you have been analysing the price movements of different products. You note the
following two price relationships:
(a) When there is a drought the price of maize rises. (3)
(b) When the price of potatoes increases, the price of bread also increases (bread is a substitute
for potatoes) . (3)
Use demand and supply diagrams to explain these two relationships. Please note: Two diagrams are
required , one for maize and one for bread . No explanations are required.
10

QUESTION 6 [24 marks]
Table 3 Revenue and cost conditions of Johnson Electronics (Pty) Ltd
Output Price Total Average Total cost Marginal Total
revenue (total) cost cost profit/loss
(Q) (N$) (N$) (NS) (N$) (N$) (N$)
10 10.00 20.80 -
20 10.00 12.40
30 10.00 9.90
40 10.00 9.00
50 10.00 8.80
60 10.00 9.00
(6) (6) (5) (6 X 0.5 = 3)
(a) Table 3 shows the revenue and cost conditions of a firm called Johnson Electronics (Pty) Ltd. Fill in
the gaps on Table 3. Please note: You cannot calculate the marginal cost for 10 units of
output- leave that space open. (20)
(b) In which market structure does Johnson Electronics (Pty) Ltd operate? Provide a reason for your
answer. (2)
(c) What level of output maximizes the firm 's profit? Provide a reason for your answer. (2)
TOTAL MARKS FOR PAPER: 100
11
Student number: ... ... ...... ... .................. .... ..... ... ....... . ..
Name of lecturer: ..... .. .. .. . ..... ................................... ..
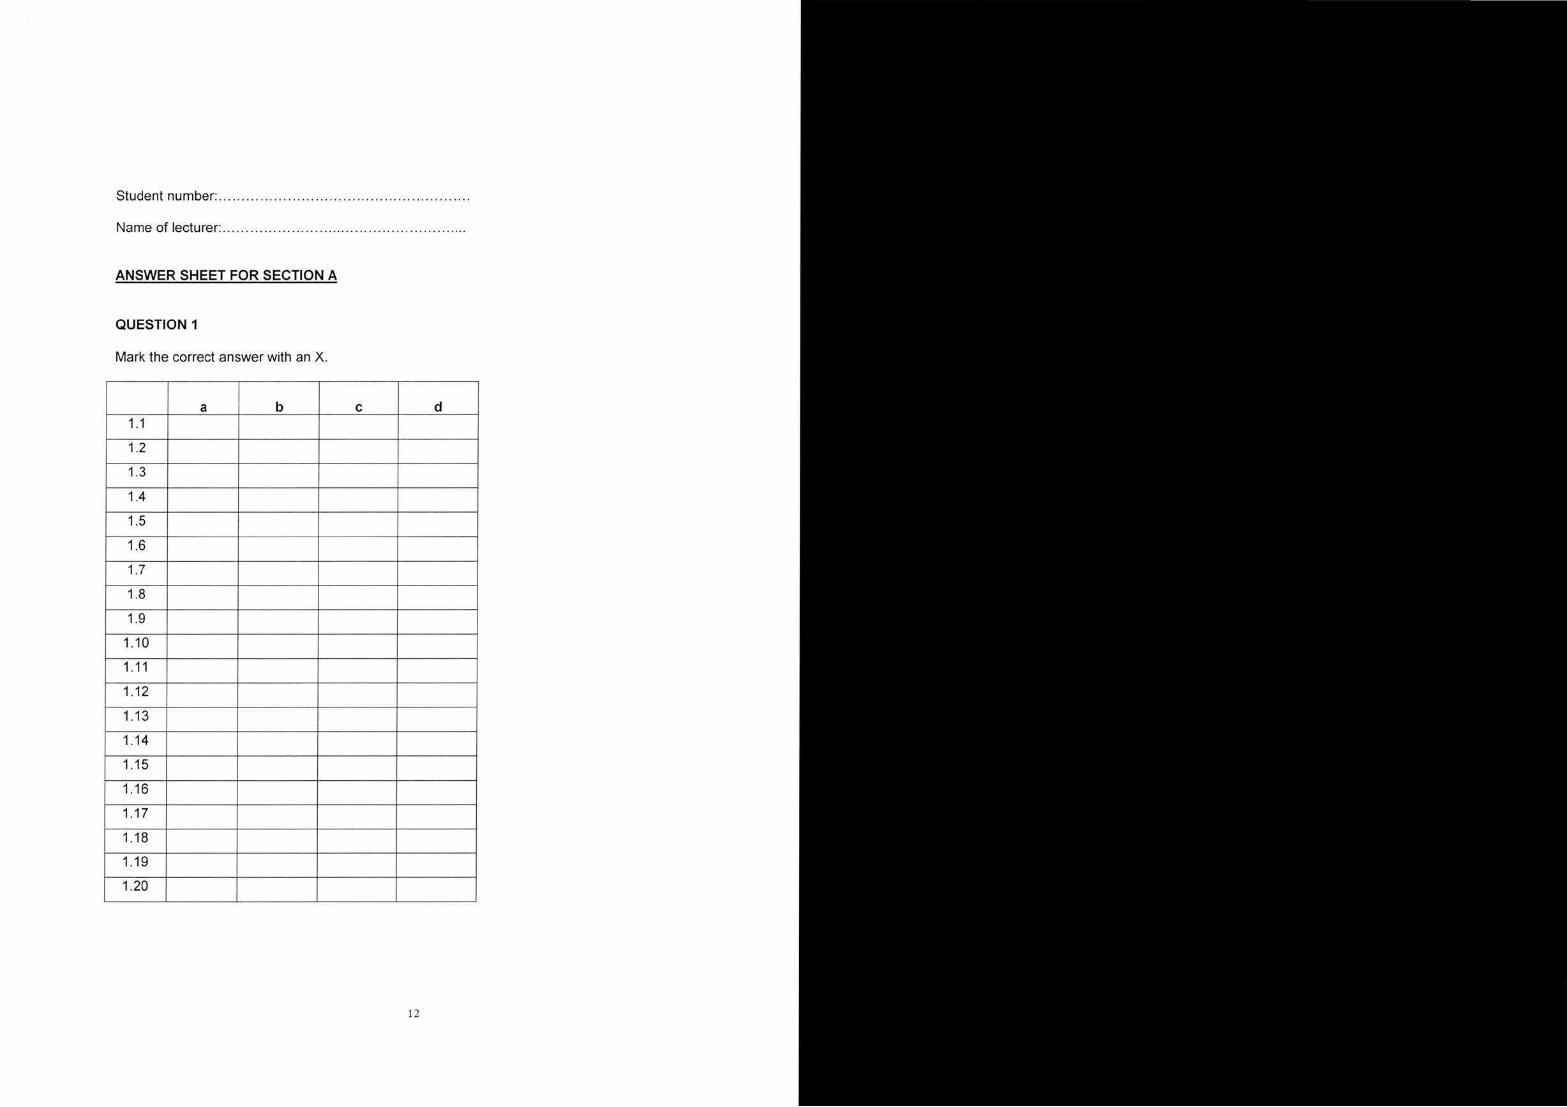
ANSWER SHEET FOR SECTION A
QUESTION 1
Mark the correct answer with an X.
a b c d 1 .1
1.2
1.3
1.4
1.5
1.6
1.7
1.8
1.9
1.10
1.11
1.12
1.13
1.14
1.15
1.16
1.17
1.18
1.19
1.20
12

SECTION A 20 Marks
Instruction: All answers should be submitted on the answer sheet provided on page 12. Tear the page off and place it inside your examination book.
QUESTION 1 [20 marks]
1.1 Which of the following would be the best definition of economics?
(a) The study of how to organise the planned economy
(b) An enquiry into why resources are scarce
(c) A study if the allocation of scarce resources among alternative uses
(d) A study to find the best possible method to help the poor
The production possibilities curve (PPC) in Figure 1 represents the production choices available to a country
that produces soya beans and wheat (assuming fixed quantity and quality of resources and fixed technology) .
Use the diagram to answer questions 1.2, 1.3, 1.4 and 1.5.
Figure 1 Production possibilities curve for soya beans and wheat
Soya beans (bushels) 400 A 350 300
100
'
' ' : D E
• ᄋᄋᄋᄋᄋᄋᄋᄋᄋᄋᄋᄋᄋ ᄋᄋᄋ ᄋᄋᄋᄋᄋᄋセᄋᄋMᄋᄋᄋtᄋᄋᄋᄋ ᄋᄋᄋ ᄋᄋᄋᄋ ᄋ ᄋᄋᄋ@
P セMM Q セ PP MMMMセ R ] P WGB P MセNNNNNNN⦅M Wheat (bushels)
1.2 Refer to Figure 1 above. If the economy is currently operating at point D, what is the
opportunity cost of moving to point A?
(a) 100 bushels of wheat
(b) 200 bushels of soya beans
(c) infinite, A cannot be produced at any cost
(d) zero
2

1.3 Refer to Figure 1 above. The opportunity cost of moving from point A to point B is :
(a) 50 bushels of soya beans
(b) 100 bushels of wheat
(c) 300 bushels of soya beans and 200 bushels of wheat
(d) 350 Bushels of soya beans and 100 bushels of wheat
1.4 Refer to Figure 1 above. For which of the following would this statement be true: To get
more wheat we have to give up soya beans, i.e. a movement from:
(a) B toE
(b) B to C
(c) D to C
(d) C toE
1.5 Refer to Figure 1 above. Which of the following would most likely cause this production
possibilities curve to shift to the left?
(a) Employing unemployed labour
(b) Shifting labour from soya beans to wheat
(c) A bubonic plague epidemic
(d) Maintaining full employment policies
1.6 Which of the following is unique to a pure market system?
(a) pure democracy
(b) unemployment
(c) inflation
(d) all of the above are correct
1.7 Which of the following will cause the demand curve for coffee to shift to the left?
(a) An increase in the price of tea
(b) A decrease in the price of tea
(c) A decrease in the price of milk
(d) A decrease in the price of coffee
1.8 A shortage can be eliminated by:
(a) government decreasing the price
(b) decreasing supply
(c) increasing the quantity demanded
(d) allowing the price to rise
3

1.9 If you observed the equilibrium price of a good decreasing and the equilibrium quantity
increasing, it would most likely be caused by:
(a) an increase in supply
(b) an increase in demand
(c) a decrease in supply
(d) a decrease in demand
1.10 The supply of potatoes will decrease if there is:
(a) an improvement in farming technology
(b) a decrease in the wages of farm workers
(c) a removal of a subsidy paid by the government to farmers
(d) a decrease in the price of potatoes
1.11 If a decrease in the price of movie tickets increases the total revenue of movie theatres, this is
evidence that demand is:
(a) price elastic
(b) price inelastic
(c) unit elastic with respect to price
(d) perfectly inelastic
Answer questions 1.12, 1.13 and 1.14 on the basis of the output data for a firm given in Table 1. Do the
necessary calculations to answer the questions.
Table 1 Production schedule
Capital Labour Total product
3 0 0
3 1 40
3 2 100
3 3 130
3 4 150
3 5 160
1.12 Refer to the data in Table 1. Diminishing marginal returns set in with the addition of the: (a) 41
h worker
(b) 3 rd worker
(c) 2 nd worker
(d) 1st worker
4

1.13 Refer to the data in Table 1. The marginal product of the 41h worker is:
(a) 60 units of output
(b) 30 units of output
(c) 20 units of output
(d) 1 0 units of output
1.14 Refer to the data in Table 1. The average product of three workers is:
(a) 43.3 units of output
(b) 40 units of output
(c) 50 units of output
(d) 37.5 units of output
Use the diagram in Figure 2 to answer questions 1.15 and 1.16
Figure 2 Perfect competitor
MC
セ ヲMMMMMMMMMMM] セMQMセ MML セ MMM MR 3
セ セMM セイM MMMMMM セ MK セ MMセMMMMMM mr R@
0 Q1 Q2Q3Q4 Qs
Quantity
1.15 Refer to the diagram in Figure 2 above. The firm will realize an economic profit if price is:
(a) P1
(b) P2
(c) P3
(d) P4
1.16 Refer to the diagram in Figure 2 above. The firm will shut down at any price less than:
(a) P1
(b) P2
(c) P3
(d) P4
5
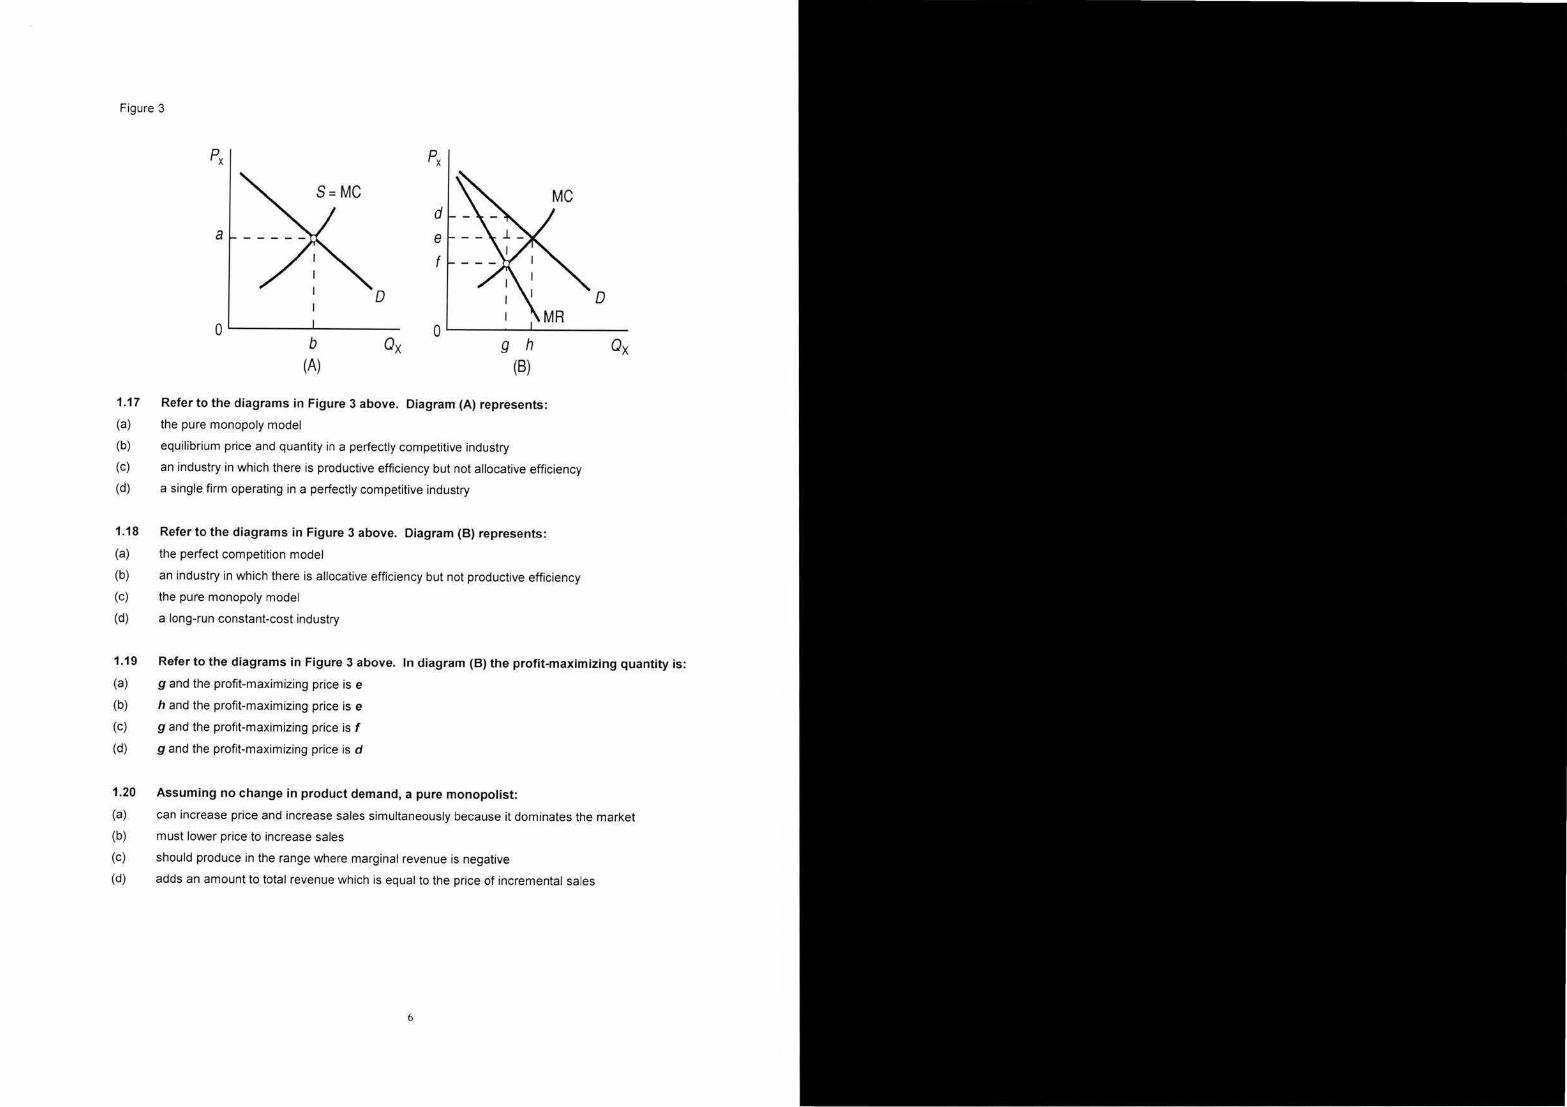
Figure 3
Px
d a e
f
0 0
0 b Ox g h Ox
ッセMMMMMMセMMMMMMM
(A) (B)
1.17 Refer to the diagrams in Figure 3 above. Diagram (A) represents:
(a) the pure monopoly model
(b) equilibrium price and quantity in a perfectly competitive industry
(c) an industry in which there is productive efficiency but not allocative efficiency
(d) a single firm operating in a perfectly competitive industry
1.18 Refer to the diagrams in Figure 3 above. Diagram (B) represents:
(a) the perfect competition model
(b) an industry in which there is allocative efficiency but not productive efficiency
(c) the pure monopoly model
(d) a long-run constant-cost industry
1.19 Refer to the diagrams in Figure 3 above. In diagram (B) the profit-maximizing quantity is:
(a) g and the profit-maximizing price is e
(b) hand the profit-maximizing price is e
(c) g and the profit-maximizing price is f
(d) g and the profit-maximizing price is d
1.20 Assuming no change in product demand, a pure monopolist:
(a) can increase price and increase sales simultaneously because it dominates the market
(b) must lower price to increase sales
(c) should produce in the range where marginal revenue is negative
(d) adds an amount to total revenue which is equal to the price of incremental sales
6

QUESTION 2 [20 marks]
Instructions:
SECTION 8 20 Marks
• All answers should be submitted on the answer sheet provided on page 13. Tear the page off and place it inside your examination book.
• Indicate whether the following statements are TRUE or FALSE.
2.1 Factors of production consist of land (natural resources) , labour (human capital , entrepreneurship)
and capital (constructed inputs such as factories) .
2.2 The three fundamental economic questions are best described by what to produce, when to produce
and for whom to produce.
2.3 A market economy is a system in which property is owned primarily by private individuals , economic
decisions are made through the market and wealth is evenly distributed by the market.
2.4 Microeconomics primarily involves the study of decision making by individual households and firms.
2.5 With an upward-sloping supply curve, an increase in price results in an increase in supply.
2.6 The law of demand is the principle that there is an inverse relationship between the price of a good
and the quantity buyers are willing to purchase in a defined time period, ceteris paribus.
2.7 If the government imposes a price ceiling of N$30 for movie tickets when the equilibrium price is
N$25 per ticket, then there will be a shortage of movie tickets.
2.8 A change in the demand for a good is caused by a change in the price of the good.
2.9 If two products , apples and bananas, are complements, then an increase in the price of apples will
decrease the demand for bananas.
2.10 A price cut will decrease the amount of money a firm receives if the demand for its product is
relatively inelastic.
2.11 If the coefficient of price elasticity of demand is 5, then a 10 percent increase in price will result in a
50 percent decrease in the quantity demanded .
7

2.12 If OPEC increases prices in order to increase their total revenue , they know that the demand for oil in
the global market is elastic.
2.13 If the marginal utilities associated with the first 4 units of consumption of good Y are 12, 10, 9 and 7,
the total utility associated with the third unit is 31.
2.14 The law of diminishing marginal utility indicates that the marginal utility curve is U-shaped.
2.15 The decreasing portion of a firm 's long-run average cost curve is attributable to economies of scale.
2.16 Total fixed cost initially decreases, but then increases.
2.17 Above the shut-down point, a perfectly competitive firm 's supply curve coincides with its marginal
cost curve.
2.18 For a monopolist, marginal revenue is less than the price charged .
2.19 One necessary condition for effective price discrimination is two or more markets with easy resale of
products between them .
2.20 Both a perfectly competitive firm and an monopolist maximise profit by setting marginal cost equal to
average total cost.
8
Instructions:
SECTION C 60 Marks
• Answer all the questions in this section in your examination book.
• Answer each question on a new, clean page.
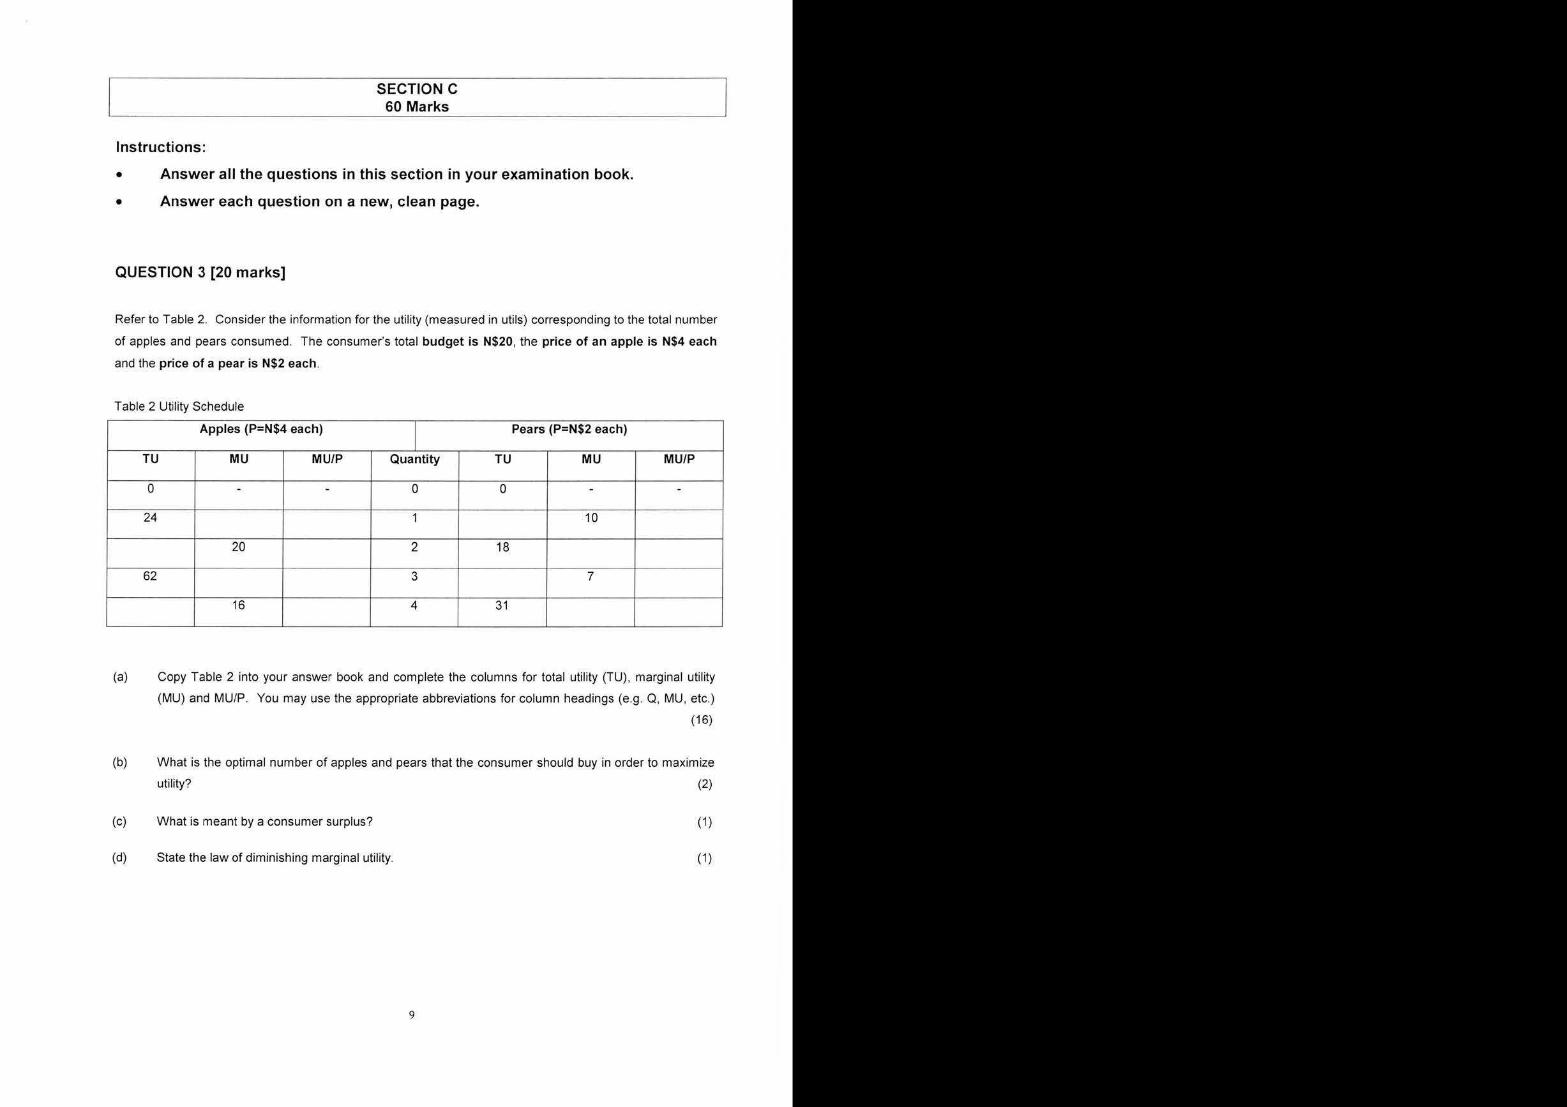
QUESTION 3 [20 marks]
Refer to Table 2. Consider the information for the utility (measured in utils) corresponding to the total number
of apples and pears consumed. The consumer's total budget is N$20, the price of an apple is N$4 each
and the price of a pear is N$2 each.
Table 2 Utility Schedule
Apples (P=N$4 each) I
Pears (P=N$2 each)
TU MU MU/P Quantity TU MU MU/P
0 - - 0 0 - -
24 1 10
20 2 18
62 3 7
16 4 31
(a) Copy Table 2 into your answer book and complete the columns for total utility (TU) , marginal utility
(MU) and MU/P. You may use the appropriate abbreviations for column headings (e.g. Q, MU , etc.)
(16)
(b) What is the optimal number of apples and pears that the consumer should buy in order to maximize
utility? (2)
(c) What is meant by a consumer surplus? (1)
(d) State the law of diminishing marginal uti lity. ( 1)
9

Student number: .. . ...... .. .... .... .. ....... . .... ... .. ..... . .. ... .. .. . .
Name of lecturer: ...... . .. ... .. .... .. .. ........ .. . .. . .. ... ...... ... ... .
ANSWER SHEET FOR SECTION 8
QUESTION 2
Mark the correct answer with an X.
TRUE FALSE
2.1
2.2
2.3
2.4
2.5
2.6
2.7
2.8
2.9
2.10
2.11
2.12
2.13
2.14
2.15
2.16
2.17
2.18
2.19
2.20
13


![FIRSTOPPORTUNITYEXAMINATIONQUESTIONPAPER Prof ...exampapers.nust.na/greenstone3/sites/localsite... · QUESTION4 [25 MARKS] Two computer firms, Aand B, are planning to market network](https://img.pdfslide.us/doc/110x75/5e799467378181679c33ab10/firstopportunityexaminationquestionpaper-prof-question4-25-marks-two-computer.jpg)


![I'lFIITHBIR UNIVERSITYexampapers.nust.na/greenstone3/sites/localsite/collect... · 2020-04-08 · 4.1.1 Using theresults from output above, calculate the regression estimate. [3]](https://img.pdfslide.us/doc/110x75/5f34c61c11c3d434fa1d4dc1/ilfiithbir-2020-04-08-411-using-theresults-from-output-above-calculate-the.jpg)


![NAMIBIA UNIVERSITY OF SCIENCE ANDTECHNOLOGYexampapers.nust.na/greenstone3/sites/localsite/collect... · 2020-04-08 · Question1 [25 marks] a) Adepartmentstoreis consideringadoptinga](https://img.pdfslide.us/doc/110x75/5f07f4777e708231d41f9914/namibia-university-of-science-and-2020-04-08-question1-25-marks-a-adepartmentstoreis.jpg)


![NAMIBIA UNIVERSITY OF SCIENCE ANDTECHNOLOGYexampapers.nust.na/greenstone3/sites/localsite... · Question6[16marks] 6.1 Quality managementisboth an organizational and an individual](https://img.pdfslide.us/doc/110x75/5e890a46a9de5e3e2c0717b2/namibia-university-of-science-and-question616marks-61-quality-managementisboth.jpg)