Embed Size (px)
Citation preview

POLYMERS AND POLYMER-CONJUGATES FOR CANCER IMMUNOTHERAPY:
FOREIGN CYTOTOXIC T LYMPHOCYTE EPITOPE DELIVERY, CYTOTOXIC T
LYMPHOCYTE ACTIVATION, AND NK92 CELL SURFACE ENGINEERING
By
Shuyao Lang
A DISSERTATION
Submitted to
Michigan State University
in partial fulfillment of the requirements
for the degree of
Chemistry—Doctor of Philosophy
2021

ABSTRACT
POLYMERS AND POLYMER-CONJUGATES FOR CANCER IMMUNOTHERAPY:
FOREIGN CYTOTOXIC T LYMPHOCYTE EPITOPE DELIVERY, CYTOTOXIC T
LYMPHOCYTE ACTIVATION, AND NK92 CELL SURFACE ENGINEERING
By
Shuyao Lang
Cancer immunotherapy is considered as the fourth pillar of anti-cancer treatment, along with
the traditional three pillars: surgery, radiotherapy, and chemotherapy. Polymers and polymer
conjugates have been widely investigated as cancer immunotherapy carriers. The polymeric
materials can not only prolong the circulation time of their small molecular cargoes, but also
enhance immune activation via multiple mechanisms such as passively or actively targeting
immune cells and specific tissue environment. With their great flexibility of monomer selection
and post-polymerization modification, polymers and polymer conjugates can satisfy the various
needs for immunotherapy. In this dissertation, three different polymer/polymer conjugates have
been investigated for facilitating different immunotherapy strategies.
pH responsive acetalated dextran microparticles were (Ac-Dex MPs) investigated for the
delivery of a high affinity foreign cytotoxic T lymphocyte (CTL) epitope, ovalbumin peptide
(OVA), to tumor tissues. Successful OVA delivery to tumor tissue was observed. Both
intratumorally and systematically administration of OVA encapsulated Ac-Dex MPs protected
mice from pre-established “antigen-loss variant” tumor models.

Ultra-pH sensitive nanoparticles (NPs) based on methoxy poly(ethylene glycol)-b-
[poly(diisopropylamino)ethyl methacrylate] have been synthesized as a platform for anti-cancer
vaccine delivery. Representative CTL antigen OVA and adjuvant imiquimod (IMQ), were
covalently conjugated to the polymer backbone through an acid responsive carboxy-
dimethylmaleic amide linker (CDM) resulting in polymer P-CDM-OVA and P-CDM-IMQ,
respectively. The P-CDM-OVA NPs greatly enhanced CTL responses in vivo compared to the free
peptide or the previously reported Ac-Dex MPs encapsulating OVA. Co-administration of P-
CDM-OVA NPs with P-CDM-IMQ NPs further improved CTL responses in vivo and effectively
reduced tumor growth in mice.
Besides serving as delivery carriers, polymers can also be used for surface engineering of
immune cells. NK92 cells are a natural killer cell line which is highly cytotoxic, but lack of
inherent selectivity toward cancer. We investigated the surface engineering of NK92 with two
different strategies: metabolic glycoengineering, and hydrophobic insertion of a polymer grafted
with multiple copies of trisaccharide CD22 ligands and a cholesterol terminal. Both methods can
successfully modify the surface of NK92 with CD22 ligand and enhance the specific lysis of
CD22+ cell lines in vitro. Further investigation of metabolic glycoengineering method showed
significant protection against CD22+ tumor in vivo.

iv
ACKNOWLEDGEMENTS
First and foremost, I would like to say thank you to my advisor Dr. Xuefei Huang, for his great
patience during my seven-year’s PhD journey. I appreciate for his professional guidance in science
and his kind support in life, which helped me getting through all difficulties during my graduate
study. He was always patient and encouraging, which allowed me to finally catch up and qualify
for graduation.
I would like to thank all my doctoral guidance committee members, Dr. Babak Borhan, Dr.
Heedeok Hong an Dr. Milton R. Smith, for reviewing this thesis and providing thoughtful
suggestions. I also thank all support staff in department of chemistry and institute of quantitative
health science and engineering, for their assists during my study. Dr. Dan Holmes has trained me
for NMR usage; Dr. Dan Jones and Anthony Schilmiller have trained me for high resolution mass
spectrometer; Anthony helped me on collecting mass spectra data during the COVID-19 pandemic;
Dr. Louis King trained me for flow cytometry usage.
I especially appreciate Dr. Herbert Kavunja and Dr. Xianwu Wang for our collaboration
projects. They have made essential contributions to these works. I enjoy the time working with the
Huang lab, and I thank all my coworkers for their assistants. Dr. Zhaojun Yin provided me helpful
guidance when I started working with animals. Xuanjun Wu, Qian Qin, Suttipun Sungsuwan,
Tianlu Li, Yuetao Zhao, Hui Li, Zibin Tan, Zahra Rashidijahanabad, Seyedmehdi Hossaini Nasr,
Jia Gao, Hunter McFall-Boegeman, provided excellent suggestions during our biological subgroup

v
meeting. And all other members in Huang lab: Weizhun Yang, Jicheng Zhang, Changxin Huo,
Peng Wang, Sherif Ramadan, Kedar Baryal, Mengxia Sun, Kunli Liu, Shivangi Chugh, Chia-wei
Yang, Po-han Lin.
I would like to thank my husband Zibin Tan for his support all the time. I am proud and happy
to have him accompany every day in my life. He has been taking care of most of the housework
and trying his best to make me healthy and happy. I thank my family for the chance of viewing
this world. And finally, to a secret person who may or may not listening: Life was perfect at 16-
years old. Life is still wonderful after that.

vi
TABLE OF CONTENTS
LIST OF TABLES ......................................................................................................................... xi
LIST OF FIGURES ...................................................................................................................... xii
LIST OF SCHEMES................................................................................................................... xxii
KEY TO ABBREVIATIONS .................................................................................................... xxiii
CHAPTER 1 Carbohydrate and Carbohydrate Conjugates in Vaccine Developments1 ................ 1 1.1 Introduction ........................................................................................................................... 1 1.2 Zwitterionic polysaccharides (ZPSs) .............................................................................. 2 1.3 MPLA ............................................................................................................................. 5 1.4 Mannan ......................................................................................................................... 11
1.4.1 Mannan-MUC1 fusion protein conjugation (M-FP) ................................................. 13 1.4.2 Mannan as a carrier for DNA vaccines ..................................................................... 17 1.4.3 Mannan as the carrier for allergy vaccine ................................................................. 18
1.5 α-Galactosylceramide (α-GalCer) ................................................................................. 20 1.6 Modified dextran ........................................................................................................... 29
1.6.1 Acetalated dextran .................................................................................................... 29 1.6.2 Reducible dextran nanogel ........................................................................................ 40 1.6.3 Oxidation sensitive dextran ....................................................................................... 42 1.6.4 pH sensitive amphiphilic galactosyl-dextran-retinal conjugates (GDR) .................. 43
1.7 β-Glucans ...................................................................................................................... 44 1.7.1 β-Glucan particles ..................................................................................................... 45 1.7.2 β-Glucan-antigen complex ........................................................................................ 48 1.7.3 β-Glucan based nanoparticles for vaccine delivery .................................................. 50
1.8 Conclusions and future outlooks ................................................................................... 52 REFERENCES ............................................................................................................................. 56
CHAPTER 2 Delivery of Foreign Cytotoxic T Lymphocyte Epitopes to Tumor Tissues for
Effective Antitumor Immunotherapy Against Pre‑established Solid Tumors in Mice1 ............. 79 2.1 Introduction ......................................................................................................................... 79 2.2 Results and discussions ....................................................................................................... 81
2.2.1 Synthesis and characterization of the CTLp‑Ace‑Dex‑MPs .................................. 81 2.2.2 CTLp delivered by the MPs could be loaded on MHC‑I of target cells and activate T
cells in vitro .......................................................................................................................... 86

vii
2.2.3 CTLp‑Ac‑Dex‑MPs protected mice from tumor‑induced death under a therapeutic
setting .................................................................................................................................... 90 2.2.4 CTLp‑Ac‑Dex‑MPs delivered the CTLp into tumor tissues .................................. 97 2.2.5 Future outlooks .......................................................................................................... 102
2.3 Conclusion ........................................................................................................................ 103 2.4 Experimental methods ...................................................................................................... 104
2.4.1 Materials and instrumentation ................................................................................... 104 2.4.2 Procedure for CTLp synthesis ................................................................................... 105 2.4.3 Preparation of CTLp-Ac-Dex-MPs ........................................................................... 106 2.4.4 Hydrolysis of CTLp-Ac-Dex-MPs and CTLp release from CTLp-Ac-Dex-MPs ..... 107 2.4.5 Animals and Cell Lines .............................................................................................. 108 2.4.6 Detection of CTLp Presentation on MHC-I of EL4 cells by FACS .......................... 108 2.4.7 B3Z T Cell Activation Assay ..................................................................................... 109 2.4.8 Tumor protection studies against EL4 and MC38 tumor .......................................... 109 2.4.9 In vivo CTL activity assay ......................................................................................... 110 2.4.10 CTLp distribution in organs and quantification of CD8+ T cell infiltration in tumor
............................................................................................................................................ 110 2.4.11 CD8+ T cell infiltration in tumor ............................................................................. 111
APPENDIX ................................................................................................................................. 112 REFERENCES ........................................................................................................................... 115
CHAPTER 3 Synthesis of Carboxy-Dimethylmaleic Amide Linked Polymer Conjugates Based
pH Ultrasensitive Nanoparticles for Enhanced T Cell Based Anti-Tumor Immunotherapy1 ..... 120 3.1 Introduction ....................................................................................................................... 120 3.2 Results and Discussions .................................................................................................... 122
3.2.1 Synthesis and characterization of mPEG-PDPAMA polymer................................... 122 3.2.2 Non-covalent OVA peptide encapsulation with mPEG-PDPAMA 3 particles ......... 127 3.2.3 Synthesis of covalent OVA-polymer conjugate P-CDM-OVA 8 and OVA release
profile .................................................................................................................................. 127 3.2.4 CTL activation by P-CDM-OVA 8 in vitro and in vivo ............................................ 135 3.2.5 Combining P-CDM-OVA 8 with an adjuvant-polymer conjugate P-CDM-IMQ 10 for
optimized immune activation .............................................................................................. 139 3.2.6 P-CDM-OVA 8 + P-CDM-IMQ 10 protected mice from EG7 tumor ...................... 145
3.3 Conclusion ........................................................................................................................ 148 3.4 Experimental methods ...................................................................................................... 149
3.4.1 Materials and equipment ..................................................................................... 149 3.4.2 Animals and cell lines ......................................................................................... 150 3.4.3 Synthesis of mPEG-Br macroinitiator 1 ............................................................. 151

viii
3.4.4 Synthesis of methoxy polyethyleneglycol-poly(diisopropylaminoethyl
methacrylate) (mPEG-PDPAMA) 3 ................................................................................... 151 3.4.5 Synthesis of Boc protected 2-aminoethylmethacylate monomer (Boc-AMA) 4 152 3.4.6 Synthesis of methoxy polyethyleneglycol-poly(diisopropylaminoethyl
methacrylate)-poly(n-butyl methacrylate) (mPEG-PDPAMA-PBMA) ............................. 152 3.4.7 Quantification of free OVA peptide and imiquimod .......................................... 153 3.4.8 Encapsulation and release of OVA peptide in mPEG-PDPAMA 3 or mPEG-
PDPAMA-b/r-PBMA nanoparticles ................................................................................... 154 3.4.9 Synthesis of methoxy polyethyleneglycol-poly(diisopropylaminoethyl
methacrylate)-poly(aminoethyl methacrylate) (mPEG-PDPAMA-PAMA) 5.................... 155 3.4.10 Synthesis of carboxy-dimethylmaleic anhydride (CDM)41 ................................ 156 3.4.11 Synthesis of mPEG-PDPAMA-PAMA-CDM 6 conjugate42 .............................. 156 3.4.12 Synthesis of P-CDM-OVA 8 and P-CDM-IMQ 10 ............................................ 157 3.4.13 Synthesis of P-ADA-OVA 9 ............................................................................... 158 3.4.14 Release profile of small molecule cargoes.......................................................... 159 3.4.15 General procedure of nanoparticle preparation ................................................... 159 3.4.16 Antigen presentation on cell surface MHC I molecules ..................................... 160 3.4.17 B3Z assay ............................................................................................................ 160 3.4.18 Quanti-Blue assay ............................................................................................... 161 3.4.19 BMDC activation study ...................................................................................... 161 3.4.20 In vivo CTL assay ............................................................................................... 162 3.4.21 Tumor challenge ................................................................................................. 163 3.4.22 The influence of BSA protein on P-CDM-OVA cleavage ................................. 163 3.4.23 Serum TNF-α detection ...................................................................................... 164
APPENDICES ............................................................................................................................ 165 APPENDIX A: TEM image of particles ................................................................................. 166 APPENDIX B: Quantification standard curves ...................................................................... 167 APPENDIX C: NMR spectra .................................................................................................. 168 APPENDIX D: GPC and HPLC traces ................................................................................... 179
REFERENCES ........................................................................................................................... 183
CHAPTER 4 Glycoengineering of Natural Killer Cells with CD22 Ligands for Enhanced
Anticancer Immunotherapy1 ....................................................................................................... 189 4.1 Introduction ....................................................................................................................... 189 4.2 Results and discussions ..................................................................................................... 191
4.2.1 Constructing NK Cells with CD22 Ligands through Glycoengineering ................... 191 4.2.2 Enhanced Killing of CD22 Positive Cells by Glycoengineered NK-92 Cells ........... 207 4.2.3 Enhanced Killing Mechanism of Glycoengineered NK-92 Cells against Raji Cells. 210 4.2.4 Evaluation of Antitumor Effect of Glycoengineered NK-92 Cells In Vivo. .............. 212

ix
4.3 Conclusion ........................................................................................................................ 214 4.4 Experimental methods ...................................................................................................... 214
4.4.1 Materials .................................................................................................................... 214 4.4.2 Mice ........................................................................................................................... 216 4.4.3 Synthesis of compound 5 ........................................................................................... 216 4.4.4 Synthesis of compound 7 ........................................................................................... 217 4.4.5 Synthesis of MPB-Sia 1 ............................................................................................. 218 4.4.6 Synthesis of MPB-Sia-Lac-N3 3 ................................................................................ 220 4.4.7 Synthesis of Chol-Br 13 ............................................................................................. 221 4.4.8 Synthesis of Chol-PAA 15 ......................................................................................... 222 4.4.9 Synthesis of Chol-PAA-yne 16 .................................................................................. 222 4.4.10 Synthesis of Chol-P-CD22L100 4 ............................................................................. 223 4.4.11 General procedure of metabolic glyco-engineering of NK-92 cells ........................ 223 4.4.12 Mass spectrum analysis of surface sialic acid and derivatives on NK92 cells after
metabolic glycoengineering ................................................................................................ 224 4.4.13 Insertion of Chol-P-CD22L100 4 onto NK-92 cells .................................................. 225 4.4.14 Dose and time dependent metabolic incorporation of MPB-Sia 1 on NK-92 cells . 225 4.4.15 The level of α2-6-sia linkage on NK-92 cell surface before and after metabolic
engineering .......................................................................................................................... 226 4.4.16 The influence of MPB-sia 1 on NK-92 cell viability ............................................... 226 4.4.17 Time dependent decrease of CD22 binding after metabolic glyco-engineering...... 226 4.4.18 Measurement of surface CD22 expression level on different cell lines .................. 227 4.4.19 Imaging analysis of NK-92 cell and Raji cell binding ............................................. 227 4.4.20 In vitro NK cytotoxicity assay against Raji cells ..................................................... 228 4.4.21 CD22 specific in vitro killing assay on CHO-WT and CHO-hCD22 cells ............. 229 4.4.22 In vitro NK cytotoxicity assay against patient-derived leukemic samples .............. 229 4.4.23 Perforin imaging ...................................................................................................... 230 4.4.24 IFN-γ release assay .................................................................................................. 230 4.4.25 Tumor challenge ...................................................................................................... 231
APPENDICES ............................................................................................................................ 233 APPENDIX A: Cell surface CD22 expression ....................................................................... 234 APPENDIX B: Attempts for synthesizing polymers with multiple cholesterol copies .......... 235 APPENDIX C: NMR Spectra ................................................................................................. 236
REFERENCES ........................................................................................................................... 252

x
LIST OF TABLES
Table 4.1 Quantification of sialic acid and derivatives from engineered NK-92 cells. Following
incubation with sialic acid, MPB-sia, and BPC-sia respectively, the corresponding NK-92 cells
(cell + Sia, cell + MPB-sia, cell + BPC-sia) were thoroughly washed and then treated with an α2-
3,6,8 neuraminidase. The supernatant was incubated with 1,2-diamino-4,5-
methylenedioxybenzene (DMB). The amounts of sialic acid, MPB-sia, BPC-sia were quantified
by comparing the MS intensities of the corresponding DMB adducts with the standard samples.
N/A indicates no significant peaks in MS. For cell + BPC-sia group, while BPC-sia-DMB adduct
was detected by MS, its amount was too small to be accurately quantified. The calibration curves
and the structures of the DMB adducts are shown below the table. ........................................... 195
xi
LIST OF FIGURES
Figure 2.1. Synthesis of acetalated dextran and CTLp encapsulated acetalated dextran
microparticles. (SEM image collected by Dr. Kavunja) ............................................................... 82
Figure 2.2 a. Synthesis scheme of CTLp SIINFEKL through solid phase peptide synthesis. b.
HPLC chromatogram of purified CTLp SIINFEKL. (Data collected by Dr. Kavunja) c. ESI
spectrum of purified CTLp SIINFEKL. (Data collected by Dr. Kavunja) ................................... 83
Figure 2.3 a. Hydrolysis of Ac-Dex-MP at pH values of 7.4, 6.5, 6.0 and 5.5 at room temperature
and 37 °C, respectively, in PBS buffer as monitored by UV–Vis at 600 nm. b. CTLp release from
CTLp-Ac-Dex-MPs at 37 °C in PBS buffer at pH 5.5, 6.0, 6.5 and 7.4 ....................................... 85
Figure 2.4 In vitro detection of CTLp presented by MHC-I of EL4 cancer cells upon incubation
with CTLp-Ac-Dex-MPs. (Data collected by Dr. Kavunja) ......................................................... 87
Figure 2.5 a. Effect of incubation time on the levels of CTLp presented by EL4 cells; b. Duration
of CTLp presented on EL4 cells after incubation with either free CTLp or CTLp-Ac-Dex-MPs for
one hour followed by removal of all unbound CTLp or MPs in the cell culture media. 54 ng of the
CTLp was used for each study (Data collected by Dr. Kavunja) ................................................. 88
Figure 2.6 In vitro CTL activation assay of B3Z cells cultured with EL4 cells following incubation
with either free CTLp or CTLp-Ac-Dex-MPs. The t-test was used for analysis, ****p < 0.0001.
Absorbance was measured at 595 nm (Data collected by Dr. Kavunja) ...................................... 90
Figure 2.7 In vivo CTL activity assay results based on the analysis of the relative viabilities of
CFSE labeled cells by FACS. a. The “before injection” sample showing a mixture of CTLp pulsed
CFSEhi and CFSElo splenic cells (the ratio of CFSEhi to CFSElo cells was 53.8 : 46.2); b. Cells
isolated from a naïve mouse 7 days after injection of the mixture of CFSEhi and CFSElo cells (the
ratio of CFSEhi to CFSElo cells obtained from this mouse was 52.6 : 47.4); c. Cells isolated from
an ovalbumin immunized mouse 7 days after injection of the mixture of CFSEhi and CFSElo cells
(the ratio of CFSEhi to CFSElo cells obtained from this mouse was 42.8 : 57.2) showing reduced
viabilities of CTLp pulsed CFSEhi cells relative to CFSElo cells without the CTLp. This suggests
the activation of CTLp specific CTLs in the immunized mice. .................................................... 91
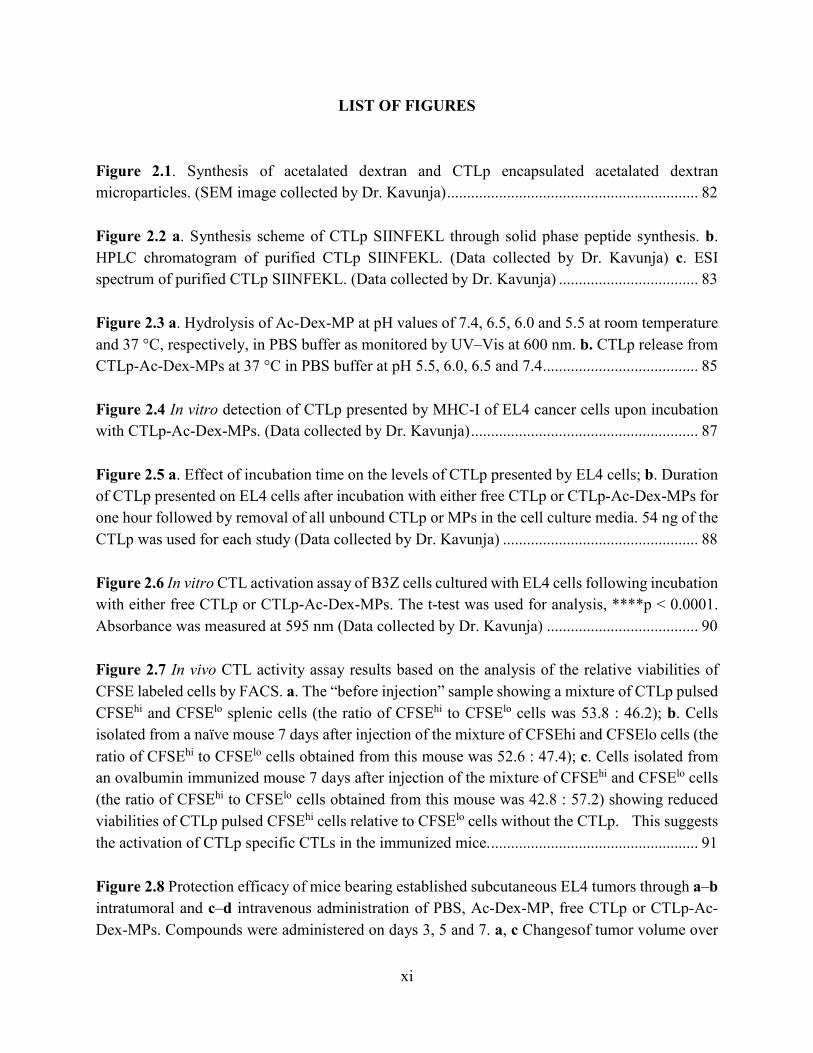
Figure 2.8 Protection efficacy of mice bearing established subcutaneous EL4 tumors through a–b
intratumoral and c–d intravenous administration of PBS, Ac-Dex-MP, free CTLp or CTLp-Ac-
Dex-MPs. Compounds were administered on days 3, 5 and 7. a, c Changesof tumor volume over

xii
time; b, d Kaplan–Meier survival curve. **p < 0.005; ****p < 0.0001 compared to the group
receiving free CTLp. The log-rank and the t-test methods were used for analysis. (Data collected
by Dr. Kavunja) ............................................................................................................................ 93
Figure 2.9 Protection efficacy of mice bearing MC38 tumor. Tumor growth in ovalbumin pre-
immunized mice bearing established subcutaneous MC38 tumors following intravenous
administration of PBS, free CTLp, empty Ac-Dex-MP, or CTLp-Ac-Dex-MPs. Administration of
CTLp-Ac-Dex-MPs significantly reduced tumor growth. Another group of mice were inoculated
with MC38 tumor without prior immunization with ovalbumin. These mice were administered
with CTLp-Ac-Dex-MPs, which also significantly slowed down tumor growth. **, p < 0.005; ****,
p < 0.0001. The Log-rank and the t-test methods were used for analysis. The results suggest that
CTLp-Ac-Dex-MPs could reduce the rates of tumor growth with or without prior immunization
with ovalbumin ............................................................................................................................. 95
Figure 2.10 Determination of percentage of CD8+ T cells present in a), b) subcutaneous EL4
tumor , and c), d) subcutaneous MC38 tumor by FACS. The tumor tissues were removed from
mice and single cell suspensions were generated. The cells were then stained with PE labeled anti
CD8 mAb (a and c), and PE labeled isotype control (b and d). In EL4 cells, 9.42% of tumor
associated cells are CD8+, while 7.23% of cells isolated from MC38 tumor are CD8+. These
indicate that there were large numbers of CD8+ T cells in tumor tissues. .................................... 96
Figure 2.11 MHC I presentation of CTLp in tumor tissue. Flow cytometry analysis of cells from
subcutaneous EL4 tumor tissues harvested from a representative mouse receiving intravenous
injection of CTLp-Ac-Dex-MPs showed much higher fluorescence intensities when stained with
mAb25-D1.16 compared to those with an isotype control mAb. This suggested successful delivery
and MHC-I cross-presentation of CTLp by cells in tumor tissues. (Data collected by Dr. Kavunja)
....................................................................................................................................................... 98
Figure 2.12 Confocal microscopy images of tumor tissues from mice receiving intravenous
injection of a–c CTLp-Ac-Dex-MPs and d–f free CTLp. a, d Red channel showing PE-labeled
mAb 25-D1.16 detecting CTLp/MHC-I H-2Kb complexes; b, e Green channel showing FITC-
labeled anti-CD11b, a marker for stromal cells; c Overlay of panels a and b; f Overlay of panels d
and e. The scale bar is 10 μm. The significantly higher intensities of red color in panel a versus d
indicate higher amounts of CTLp/MHC-I complexes in tumor tissues of mice receiving CTLp-Ac-
Dex-MPs (Data collected by Dr. Kavunja) ................................................................................... 99
Figure 2.13 CTLp distribution in different organs. Two groups of mice were prepared bearing
subcutaneous MC38 tumor. One group of these mice were administered CTLp-Ace-Dex-MPs
intravenously and the other group received PBS injection. After 9 hours, mice were sacrificed.

xiii
Their tumor, liver, spleen and lung were harvested and single cell suspensions were prepared from
these organs. The cells were stained with mAb25-D1.16 for detection of CTLp-MHC I complexes
or an isotype control mAb and subjected to flow cytometry analysis. The mean fluorescence
intensities (MFI) upon mAb25-D1.16 incubation vs those from isotype control were plotted.
Compared to mice receiving PBS only, the mice receiving CTLp-Ac-Dex-MPs gave much higher
intensities of mAb25-D1.16 staining in tumor and liver, while spleen and lung did not show much
change. T test was used for statistical analysis. .......................................................................... 100
Figure 2.14 In vivo CTL activity assays. Mice were injected with CTLp-Ac-Dex-MP, Ac-Dex-
MP mixed with CTLp or free CTLp (20 μg), respectively, every other day with a total of three
injections. The positive control is ovalbumin-immunized mice. The time indicated is the number
of days after the final injection. CFSE-labeled live CTLp pulsed cells were then injected into the
mice and isolated from lymph nodes and spleens 24 h after injection. Mice with high CTL activities
led to lower relative survival rates of CFSE-labeled live CTLp pulsed cells. Cells isolated from
lymph nodes and spleens gave similar results that CTLp-Ac-Dex-MPs could induce SIINFEKL-
specific CTLs, while Ac-Dex-MPs admixed with CTLp or free CTLp was ineffective. ........... 101
Figure 2.15 Calibration curve between the amounts of CTLp and areas of integration from HPLC
chromatograms. (Data collected by Dr. Kavunja) ...................................................................... 113
Figure 2.16 DLS analysis of Ac-Dex MPs. ............................................................................... 114
Figure 3.1 GPC data for synthetic polymers. a. mPEG-PDPAMA 3, b. mPEG-(PDPAMA-ran-
PAMA-Boc) ................................................................................................................................ 125
Figure 3.2 mPEG-PDPAMA 3 and immune cell interaction. a. Upon incubation of RAW-Blue
cells with mPEG-PDPAMA 3 for 24h, little cellular activations were observed, while RAW-Blue
cells responded well to LPS (100 ng/mL) as the positive control. b. Incubation of bone marrow
dendritic cells (BMDCs) with mPEG-PDPAMA 3 (1 mg/mL) for 48h did not lead to maturation
or activation of BMDCs, while LPS (100 ng/mL) readily led to maturation of the cells. Statistical
significance was assessed using two-tailed unpaired t-test. ns: No significant differences. ...... 126
Figure 3.3 Hydrodynamic diameters of nanoparticles formed by various polymer-antigen or
polymer-adjuvant conjugates. a. P-ADA-OVA particles at pH 7.4. b. P-CDM-OVA particles at
pH 7.4. c. P-CDM-IMQ particles at pH 7.4. d. DLS scattering count rate for P-CDM-OVA
particles at different pH values e. P-CDM-OVA/P-CDM-IMQ hybrid particles at pH 7.4. ...... 129
Figure 3.4 OVA release from P-CDM-OVA by LC-MS detection. P-CDM-OVA (1 mg/ml) was
incubated in pH 4.5, 6.0, 6.4 or 7.4 citric buffer with or without BSA (0.5 mg/ml) for different

xiv
time periods followed by LC-MS detection. a. OVA release without BSA, b. OVA release with
BSA. At pH 7.4, OVA release was not detectable in “no BSA” group at all time points. ......... 132
Figure 3.5 Presentation of OVA peptide on EL4 cells. Free OVA peptide (100 ng) or polymers
containing 100 ng OVA peptide were incubated with EL4 cells for a certain time period. The cells
were then washed and stained with PE labeled antibody D1.16 specific against anti-H2Kb bound
to SIINFEKL or anti-mouse IgG1K (isotype control) followed by fluorescence-activated cell sorter
(FACS) analysis. ......................................................................................................................... 134
Figure 3.6 B3Z assay for detecting in vitro CTL activation. a. 2x10⁴ BMDCs were co-cultured
with empty NPs or various formulations of OVA (at 0.1-1,000 ng total amounts of OVA peptide),
in 96-well plate for 12 hours. The cells were then washed and 1x10⁵ B3Z cells were added to the
plate and co-cultured for another 24h. b. To evaluate the effects of different combinations of
antigen and adjuvant, 2x10⁴ BMDCs were co-cultured with the mixture of separate particles P-
CDM-OVA 8 +P-CDM-IMQ 10 (0.1-1,000 ng OVA peptide and 0.1-1000 ng IMQ), or the hybrid
particles P-CDM-OVA 8/P-CDM-IMQ 10 (0.1-1,000 ng OVA peptide and 0.1-1000 ng IMQ).
Cells were incubated for 12 hours followed by washing and the addition of 1x10⁵ B3Z cells for
another 24 hours co-incubation. Absorbance values at 595 nm were measured and normalized
against the value at maximum B3Z cell activation. Statistical significance was assessed using two-
tailed unpaired t-test. ns: No significant difference; *p<0.05; **p<0.01; ***p<0.001. ............. 136
Figure 3.7 In vivo CTL activation assay. Mice (3 per group) were first immunized with P-CDM-
OVA subcutaneously (SC) and intravenously (IV), or Ace-Dex-OVA subcutaneously (SC).
CFSEhi labeled OVA peptide pulsed target cells were injected together with CFSElo labeled control
cells 3 days after the last immunization. Mice were euthanized 24 hours after cell injection and
spleen and lymph nodes were collected for FACS analysis. Target cell survival was calculated by
the target: control cell ratio changes before and after injection. Statistical significance was assessed
using the two-tailed unpaired t-test. * p<0.05, **p<0.01, ***p<0.001 ...................................... 138
Figure 3.8 Cumulative release rates of imiquimod from P-CDM-IMQ 10 under different pH. P-
CDM-IMQ 10 was diluted in buffer with different pH values. At each time point, an aliquot of
solution was collected followed by centrifuge filtration. The amounts of released IMQ in flow-
through were calculated from the values of UV-Vis absorbance at 318nm. .............................. 140
Figure 3.9 Macrophage cells activation by free IMQ and P-CDM-IMQ. 1x10⁵ Raw-Blue cells
were incubated with different concentration of free IMQ and P-CDM-IMQ 10, 100ng LPS
(positive control) or mPEG-PDPAMA 3 for 24 h. 20 μL cell culture supernatant was collected and
added to Quanti-Blue™ solution and incubated for another 2 h. Absorbance at 655nm was

xv
measured. Statistical significance was assessed using two-tailed unpaired t-test. ns: no significant
difference; *p<0.05; **p<0.01; ***p<0.001 .............................................................................. 141
Figure 3.10 Macrophage activation by P-CDM-IMQ with different IMQ loading indicating the
IMQ loading level per polymer did not have a significant impact on cellular activation. 1x10⁵ Raw-
Blue cells were incubated with various concentrations of free IMQ, P-CDM-IMQ L (2% IMQ), P-
CDM-IMQ M (5% IMQ), P-CDM-IMQ H (10% IMQ), 100ng LPS (positive control) or mPEG-
PDPAMA 3 for 24 h. 20 μL cell culture supernatants were collected and added to Quanti-Blue™
solution and incubated for another 2 h. Absorbance at 655nm was measured. Statistical
significance was assessed using two-tailed unpaired t-test. ns: no significant difference; **p<0.01;
***p<0.001 ................................................................................................................................. 142
Figure 3.11 In vivo CTL assay. Mice (2 per group) were first immunized with free OVA, free
OVA+IMQ, free OVA+empty NP, P-CDM-OVA 8, P-CDM-OVA 8+IMQ, P-CDM-OVA 8 and
P-CDM-IMQ 10 in separate particles (P-CDM-OVA 8+P-CDM-IMQ 10), or P-CDM-OVA 8 and
P-CDM-IMQ 10 in hybrid particle (P-CDM-OVA 8/P-CDM-IMQ 10). CFSEhi labeled OVA
peptide pulsed target cells were injected together with CFSElo labeled control cells 3 days after the
last immunization. Mice were euthanized 24 hours after cell injection and the spleens and lymph
nodes were collected for FACS analysis. Target cell survival were calculated by the target: control
cell ratio changes before and after injection. Statistical significance was assessed using two-tailed
unpaired t-test. ns: No significant differences; *p<0.05. ............................................................ 144
Figure 3.12 EG7 tumor growth under a variety of treatment conditions. C57BL/6 female mice
were injected with 1x10⁶ EG7 tumor cells. Starting from day 5, a total of 5 injections with PBS,
mixture of free OVA, IMQ and empty NPs (Free OVA+IMQ+empty NP), or P-CDM-OVA 8
combining with P-CDM-IMQ 10 were given intratumorally every other day with a dose of 25 µg
OVA and 25 μg IMQ. On days 6, 9, and 12, aPD-1 and P-CDM-OVA 8+P-CDM-IMQ 10+aPD-1
group received 100 μg anti-PD-1 antibody intraperitoneally. Tumor size were measured every
other day until the first animal reached the end point. Statistical significance was assessed using
two-tailed unpaired t-test. ns: no significant difference, **p<0.01, ****p<0.0001 ................... 146
Figure 3.13 Mouse sera TNF-α level after immunization. Mice were injected with PBS, free IMQ
(20 μg/dose), empty NPs (200 μg/dose) or P-CDM-OVA 8 +P-CDM-IMQ 10 (20 μg OVA+20 μg
IMQ/dose) and euthanized after 24 h (1 injection) or 1 week (3 injections on day 0, 3 and 6). Sera
was collected and analyzed by TNF-α ELISA kit. ..................................................................... 147
Figure 3.14 TEM images of nanoparticles formed by a. mPEG-PDPAMA, b. P-CDM-OVA, and
c. P-CDM-IMQ ........................................................................................................................... 166

xvi
Figure 3.15 Standard curve for quantification of free OVA peptide and imiquimod. a. Standard
curve between the amounts of OVA peptide and areas of integration from HPLC chromatograms.
b. Standard curve for correlation between the concentration of imiquimod and UV absorbance
value at 318nm. ........................................................................................................................... 167
Figure 3.16 1H NMR spectrum of mPEG-Br 1 (500 MHz, CDCl3) .......................................... 168
Figure 3.17 1H NMR spectrum of AMA-Boc 4 (500 MHz, CDCl3) ......................................... 169
Figure 3.18 13C NMR spectrum of AMA-Boc 4 (125 MHz, CDCl3) ........................................ 170
Figure 3.19 1H NMR spectrum of mPEG-PDPAMA 3 (500 MHz, CDCl3) .............................. 171
Figure 3.20 1H NMR spectrum of mPEG-PDPAMA-r-PBMA (500 MHz, CDCl3) ................. 172
Figure 3.21 1H NMR spectrum of mPEG-PDPAMA-b-PBMA (500 MHz, CDCl3) ................. 173
Figure 3.22 1H NMR spectrum of mPEG-PDPAMA-PAMA-Boc (500 MHz, CDCl3) ............ 174
Figure 3.23 1H NMR spectrum of mPEG-PDPAMA-PAMA 5 (500 MHz, CDCl3) ................. 175
Figure 3.24 1H NMR spectrum of CDM (500 MHz, CDCl3) .................................................... 176
Figure 3.25 13C NMR spectrum of CDM (125MHz, CDCl3) .................................................... 177
Figure 3.26 1H NMR spectrum of mPEG-PDPAMA-PAMA-CDM 6 (500 MHz, CDCl3) ...... 178
Figure 3.27 GPC trace of mPEG-PDPAMA-PAMABoc .......................................................... 179
Figure 3.28 OVA peptide standard on HPLC ............................................................................ 180
Figure 3.29 Quantification of OVA loading on P-CDM-OVA 8 .............................................. 181
Figure 3.30 Quantification of OVA loading on P-ADA-OVA 9 ............................................... 182
Figure 4.1 Modification of NK-92 with CD22 ligands through glyco-engineering. Two methods
have been developed. Method A is metabolic glycoengineering using a sialic acid derivative, e.g.,
MPB-sia 1, which could be metabolized onto the surface of NK-92 cell through the sialic acid
biosynthetic pathway. Method B uses a glyco-polymer containing MPB-sia, which could insert
xvii
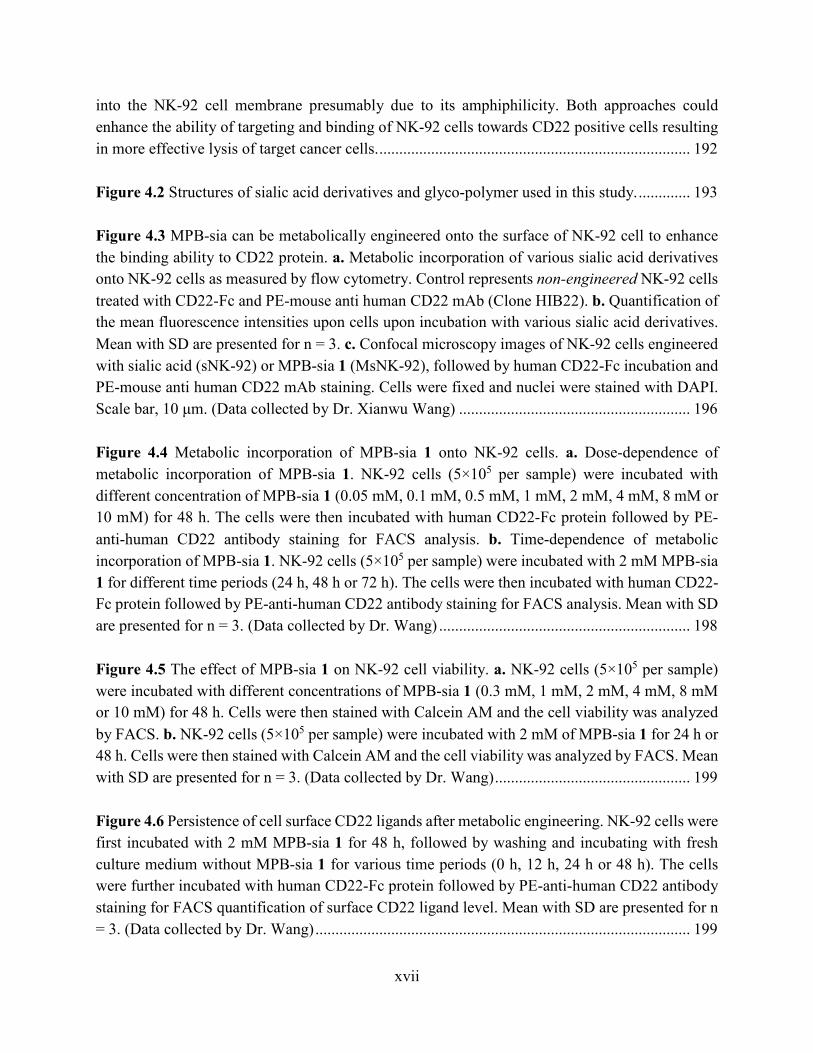
into the NK-92 cell membrane presumably due to its amphiphilicity. Both approaches could
enhance the ability of targeting and binding of NK-92 cells towards CD22 positive cells resulting
in more effective lysis of target cancer cells. .............................................................................. 192
Figure 4.2 Structures of sialic acid derivatives and glyco-polymer used in this study. ............. 193
Figure 4.3 MPB-sia can be metabolically engineered onto the surface of NK-92 cell to enhance
the binding ability to CD22 protein. a. Metabolic incorporation of various sialic acid derivatives
onto NK-92 cells as measured by flow cytometry. Control represents non-engineered NK-92 cells
treated with CD22-Fc and PE-mouse anti human CD22 mAb (Clone HIB22). b. Quantification of
the mean fluorescence intensities upon cells upon incubation with various sialic acid derivatives.
Mean with SD are presented for n = 3. c. Confocal microscopy images of NK-92 cells engineered
with sialic acid (sNK-92) or MPB-sia 1 (MsNK-92), followed by human CD22-Fc incubation and
PE-mouse anti human CD22 mAb staining. Cells were fixed and nuclei were stained with DAPI.
Scale bar, 10 μm. (Data collected by Dr. Xianwu Wang) .......................................................... 196
Figure 4.4 Metabolic incorporation of MPB-sia 1 onto NK-92 cells. a. Dose-dependence of
metabolic incorporation of MPB-sia 1. NK-92 cells (5×10⁵ per sample) were incubated with
different concentration of MPB-sia 1 (0.05 mM, 0.1 mM, 0.5 mM, 1 mM, 2 mM, 4 mM, 8 mM or
10 mM) for 48 h. The cells were then incubated with human CD22-Fc protein followed by PE-
anti-human CD22 antibody staining for FACS analysis. b. Time-dependence of metabolic
incorporation of MPB-sia 1. NK-92 cells (5×10⁵ per sample) were incubated with 2 mM MPB-sia
1 for different time periods (24 h, 48 h or 72 h). The cells were then incubated with human CD22-
Fc protein followed by PE-anti-human CD22 antibody staining for FACS analysis. Mean with SD
are presented for n = 3. (Data collected by Dr. Wang) ............................................................... 198
Figure 4.5 The effect of MPB-sia 1 on NK-92 cell viability. a. NK-92 cells (5×10⁵ per sample)
were incubated with different concentrations of MPB-sia 1 (0.3 mM, 1 mM, 2 mM, 4 mM, 8 mM
or 10 mM) for 48 h. Cells were then stained with Calcein AM and the cell viability was analyzed
by FACS. b. NK-92 cells (5×10⁵ per sample) were incubated with 2 mM of MPB-sia 1 for 24 h or
48 h. Cells were then stained with Calcein AM and the cell viability was analyzed by FACS. Mean
with SD are presented for n = 3. (Data collected by Dr. Wang) ................................................. 199
Figure 4.6 Persistence of cell surface CD22 ligands after metabolic engineering. NK-92 cells were
first incubated with 2 mM MPB-sia 1 for 48 h, followed by washing and incubating with fresh
culture medium without MPB-sia 1 for various time periods (0 h, 12 h, 24 h or 48 h). The cells
were further incubated with human CD22-Fc protein followed by PE-anti-human CD22 antibody
staining for FACS quantification of surface CD22 ligand level. Mean with SD are presented for n
= 3. (Data collected by Dr. Wang) .............................................................................................. 199

xviii
Figure 4.7 The level of α2-6-sia linkage on NK-92 cell surface before and after metabolic
engineering. Unmodified NK-92 cells and metabolic engineered NK-92 (MsNK-92) cells (5×10⁵
per sample) stained by FITC-labeled α2-6-sia binding plant lectin Sambucus nigra lectin (SNA)
followed by FACS analysis. Mean with SD are presented for n = 3. (Data collected by Dr. Wang)
..................................................................................................................................................... 200
Figure 4.8 a. Synthesis of MPB-sia 1 and MPB-sia-α2-6-Lac-N3 3; b. synthesis of Chol-P-
CD22L100 4.................................................................................................................................. 203
Figure 4.9 Incubation of Chol-P-CD22L100 4 with NK-92 cells significantly enhanced the levels
of CD22 ligands on cell surface. a. FACS analysis of Chol-P-CD22L100 4 incubated NK-92 cells.
NK-92 cells (5×10⁵ per sample) were incubated with various concentrations of Chol-P-CD22L100
4 (2.5 μM, 5 μM or 10 μM) for 1 h in PBS buffer at room temperature. After washing, the cells
were then incubated with human CD22-Fc protein followed by PE-anti-human CD22 antibody
staining for FACS analysis. b. Confocal image of Chol-P-CD22L100 4 treated NK-92 cells after
incubated with 10 μM Chol-P-CD22L100 4 for 1 h in PBS buffer at room temperature. ........... 204
Figure 4.10 Time-dependent persistence of CD22 ligands on cell surface after incubation with
Chol-P-CD22L100 4. NK92 cells were incubated with 10μM Chol-P-CD22L100 4 for 1h in PBS
under room temperature. Cells were washed and cultured in fresh medium. An aliquot of cells was
collected from the cell culture at different time points (0, 4, 8, 12, 24, 48, 72, 96 and 120 h) and
incubated with human CD22-Fc protein followed by PE-anti-human CD22 antibody staining.
FACS was used for detecting CD22 binding level. Polymer can last on cell surface for ~72h. 205
Figure 4.11 The effect of Chol-P-CD22L100 4 on NK-92 cell viability. NK-92 cells (5×10⁵ per
sample) were incubated with different concentrations of Chol-P-CD22L100 4 (6.5 μM, 12.5 μM,
25 μM or 50 μM) for a. 24 h and b. 48 h. Untreated NK-92 cells were used as control. Cell viability
was analyzed by trypan blue staining. ........................................................................................ 206
Figure 4.12 Time-dependent persistence of CD22 ligands on cell surface after incubation with
polymers containing different copies of cholesterol. NK92 cells were incubated with 10μM Chol-
P-CD22L100 4 (1 cholesterol per chain) or 40μM Chol8-P-CD22L25 (8 cholesterols per chain) for
1h in PBS under room temperature. Cells were washed and cultured in fresh medium. An aliquot
of cells was collected from the cell culture at different time points (0, 4, 24 and 48 h) and incubated
with human CD22-Fc protein followed by PE-anti-human CD22 antibody staining. FACS was
used for detecting CD22 binding level. Increasing cholesterol copies on polymer did not prolonged
the presence of CD22 ligand significantly. ................................................................................. 207
xix
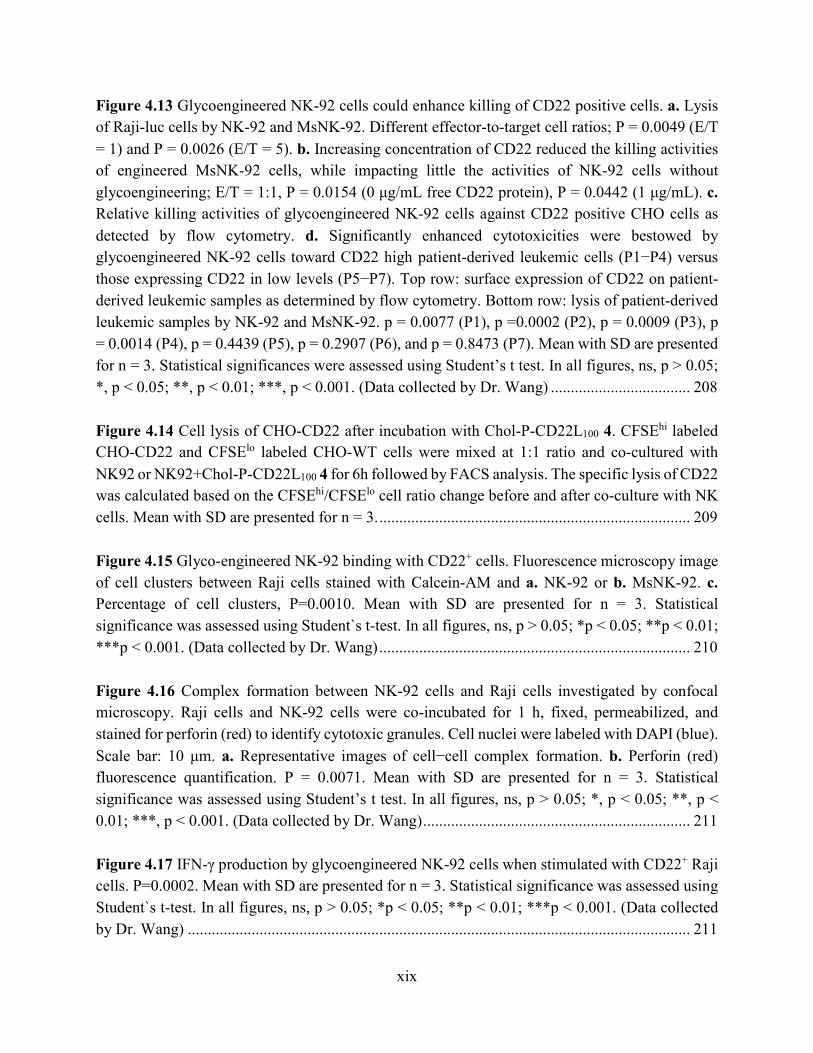
Figure 4.13 Glycoengineered NK-92 cells could enhance killing of CD22 positive cells. a. Lysis
of Raji-luc cells by NK-92 and MsNK-92. Different effector-to-target cell ratios; P = 0.0049 (E/T
= 1) and P = 0.0026 (E/T = 5). b. Increasing concentration of CD22 reduced the killing activities
of engineered MsNK-92 cells, while impacting little the activities of NK-92 cells without
glycoengineering; E/T = 1:1, P = 0.0154 (0 μg/mL free CD22 protein), P = 0.0442 (1 μg/mL). c.
Relative killing activities of glycoengineered NK-92 cells against CD22 positive CHO cells as
detected by flow cytometry. d. Significantly enhanced cytotoxicities were bestowed by
glycoengineered NK-92 cells toward CD22 high patient-derived leukemic cells (P1−P4) versus
those expressing CD22 in low levels (P5−P7). Top row: surface expression of CD22 on patient-
derived leukemic samples as determined by flow cytometry. Bottom row: lysis of patient-derived
leukemic samples by NK-92 and MsNK-92. p = 0.0077 (P1), p =0.0002 (P2), p = 0.0009 (P3), p
= 0.0014 (P4), p = 0.4439 (P5), p = 0.2907 (P6), and p = 0.8473 (P7). Mean with SD are presented
for n = 3. Statistical significances were assessed using Student’s t test. In all figures, ns, p > 0.05;
*, p < 0.05; **, p < 0.01; ***, p < 0.001. (Data collected by Dr. Wang) ................................... 208
Figure 4.14 Cell lysis of CHO-CD22 after incubation with Chol-P-CD22L100 4. CFSEhi labeled
CHO-CD22 and CFSElo labeled CHO-WT cells were mixed at 1:1 ratio and co-cultured with
NK92 or NK92+Chol-P-CD22L100 4 for 6h followed by FACS analysis. The specific lysis of CD22
was calculated based on the CFSEhi/CFSElo cell ratio change before and after co-culture with NK
cells. Mean with SD are presented for n = 3. .............................................................................. 209
Figure 4.15 Glyco-engineered NK-92 binding with CD22+ cells. Fluorescence microscopy image
of cell clusters between Raji cells stained with Calcein-AM and a. NK-92 or b. MsNK-92. c.
Percentage of cell clusters, P=0.0010. Mean with SD are presented for n = 3. Statistical
significance was assessed using Student`s t-test. In all figures, ns, p > 0.05; *p < 0.05; **p < 0.01;
***p < 0.001. (Data collected by Dr. Wang) .............................................................................. 210
Figure 4.16 Complex formation between NK-92 cells and Raji cells investigated by confocal
microscopy. Raji cells and NK-92 cells were co-incubated for 1 h, fixed, permeabilized, and
stained for perforin (red) to identify cytotoxic granules. Cell nuclei were labeled with DAPI (blue).
Scale bar: 10 μm. a. Representative images of cell−cell complex formation. b. Perforin (red)
fluorescence quantification. P = 0.0071. Mean with SD are presented for n = 3. Statistical
significance was assessed using Student’s t test. In all figures, ns, p > 0.05; *, p < 0.05; **, p <
0.01; ***, p < 0.001. (Data collected by Dr. Wang) ................................................................... 211
Figure 4.17 IFN-γ production by glycoengineered NK-92 cells when stimulated with CD22+ Raji
cells. P=0.0002. Mean with SD are presented for n = 3. Statistical significance was assessed using
Student`s t-test. In all figures, ns, p > 0.05; *p < 0.05; **p < 0.01; ***p < 0.001. (Data collected
by Dr. Wang) .............................................................................................................................. 211

xx
Figure 4.18 In vivo antitumor activity of glycoengineered NK-92 cells against Raji-luc xenograft
model. 107 Raji-luc cells were injected subcutaneously into the flanks of Balb/c nude mice. Fifteen
days later, the mice were treated with an intratumoral injection of 107 glycoengineered NK-92
cells (MsNK-92 in 50 μL PBS), unengineered NK-92 (NK-92), or PBS buffer (50 μL) once a week.
Bioluminescence images (BLI) were acquired with an IVIS Lumina II imaging system. a. Images
of mice with tumor at day 36. b. Tumor growth curve. c. Tumor weight measurements. d. BLI
images of the tumor after surgical removal from mice. e. Quantitative BLI signals of the tumor
after surgical removal from mice. Mean with SD are presented. Statistical significance was
assessed using Student’s t test. In all figures, ns, p > 0.05; *, p < 0.05; **, p < 0.01; ***, p < 0.001.
p = 0.0294 (panel B), p = 0.0003 (MsNK-92 vs PBS), p = 0.0010 (MsNK-92 vs NK-92) (panel C),
p = 0.0025 (MsNK-92 vs PBS), p = 0.0024 (MsNK-92 vs NK-92) (panel E). (Data collected by
Dr. Wang) ................................................................................................................................... 212
Figure 4.19 In vivo antitumor activity of glycoengineered NK-92 cells against Raji-luc B cell
lymphoma. 106 Raji-luc cells were injected intravenously into NOD SCID mice. On days 2, 5, 8,
12, and 15, mice received intravenous injections of 107 glycoengineered NK-92 cells (MsNK-92
in 100 μL PBS), unengineered parent NK-92 (NK-92), or PBS buffer control (100 μL) (n = 10 for
each group). (a) The body weights of all mice were continuously monitored. No significant
changes in body weight were observed, suggesting little toxicities due to administration of cells.
(b) Kaplan−Meier survival curves of mice receiving PBS, NK-92, and MsNK-92 cells. All mice
receiving PBS or NK-92 cells died by day 62, while 100% of the mice treated with MsNK-92
survived. Statistical significance was assessed using Student’s t test. **, p < 0.01; ***, p < 0.001.
(Data collected by Dr. Wang) ..................................................................................................... 213
Figure 4.21 Surface expression levels of CD22 on a. Raji-luc vs b. Hela cells as detected by flow
cytometry. Raji-luc cells have much higher expression of CD22 compared to Hela cells. ........ 234
Figure 4.22 1H NMR of 5 (500MHz, D2O)................................................................................ 236
Figure 4.23 13C NMR of 5 (500MHz, D2O) .............................................................................. 237
Figure 4.24 1H NMR of 6 (500MHz, CDCl3) ............................................................................ 238
Figure 4.25 1H NMR of 7 (500MHz, D2O)................................................................................ 239
Figure 4.26 13C NMR of 7 (500MHz, D2O) .............................................................................. 240
Figure 4.27 1H NMR of 8 (unpurified, 500MHz, D2O) ............................................................. 241

xxi
Figure 4.28 1H NMR of 9 (unpurified, 500MHz, D2O) ............................................................. 242
Figure 4.29 1H NMR of 1 (500MHz, D2O)................................................................................ 243
Figure 4.30 13C NMR of 1 (500MHz, D2O) .............................................................................. 244
Figure 4.31 1H NMR of 3 (500MHz, D2O)................................................................................ 245
Figure 4.32 1H NMR of 14 (500MHz, CDCl3) .......................................................................... 246
Figure 4.33 13C NMR of 14 (125MHz, CDCl3) ......................................................................... 247
Figure 4.34 1H NMR of 15 (500MHz, D2O).............................................................................. 248
Figure 4.35 1H NMR of 16 (500MHz, D2O).............................................................................. 249
Figure 4.36 1H NMR of 17 (500MHz, D2O).............................................................................. 250
Figure 4.37 1H NMR of 4 (500MHz, D2O)................................................................................ 251

xxii
LIST OF SCHEMES
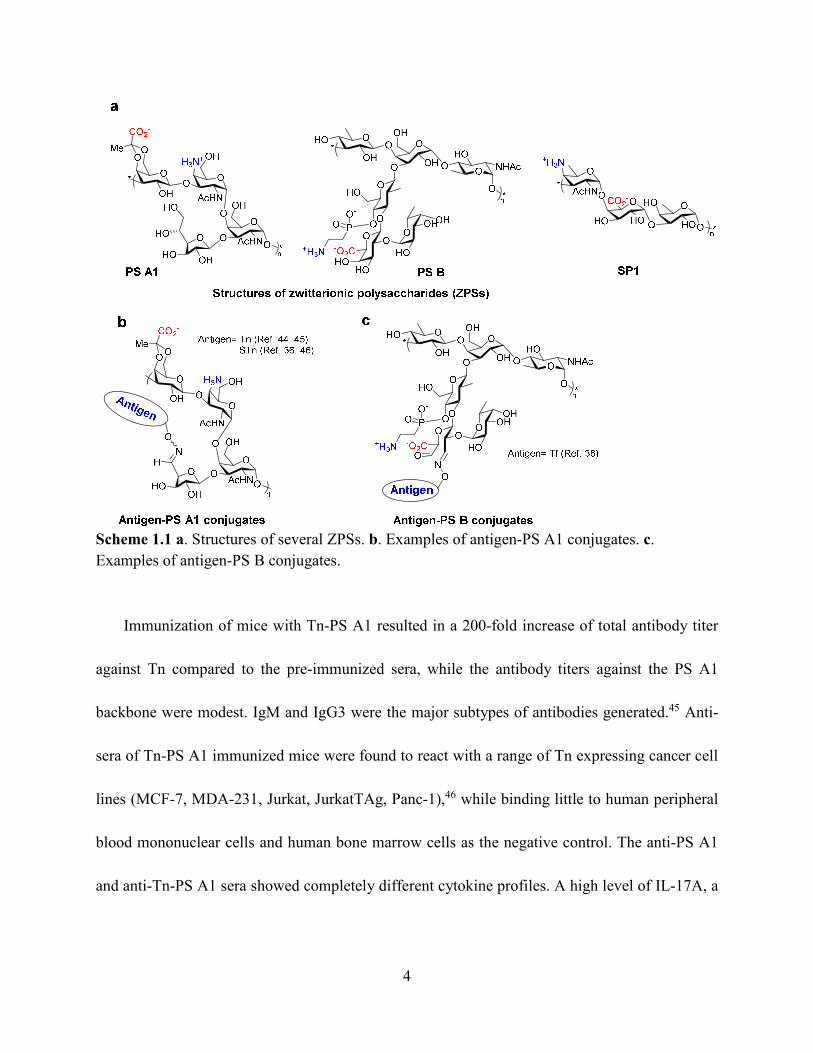
Scheme 1.1 a. Structures of several ZPSs. b. Examples of antigen-PS A1 conjugates. c. Examples
of antigen-PS B conjugates. ............................................................................................................ 4
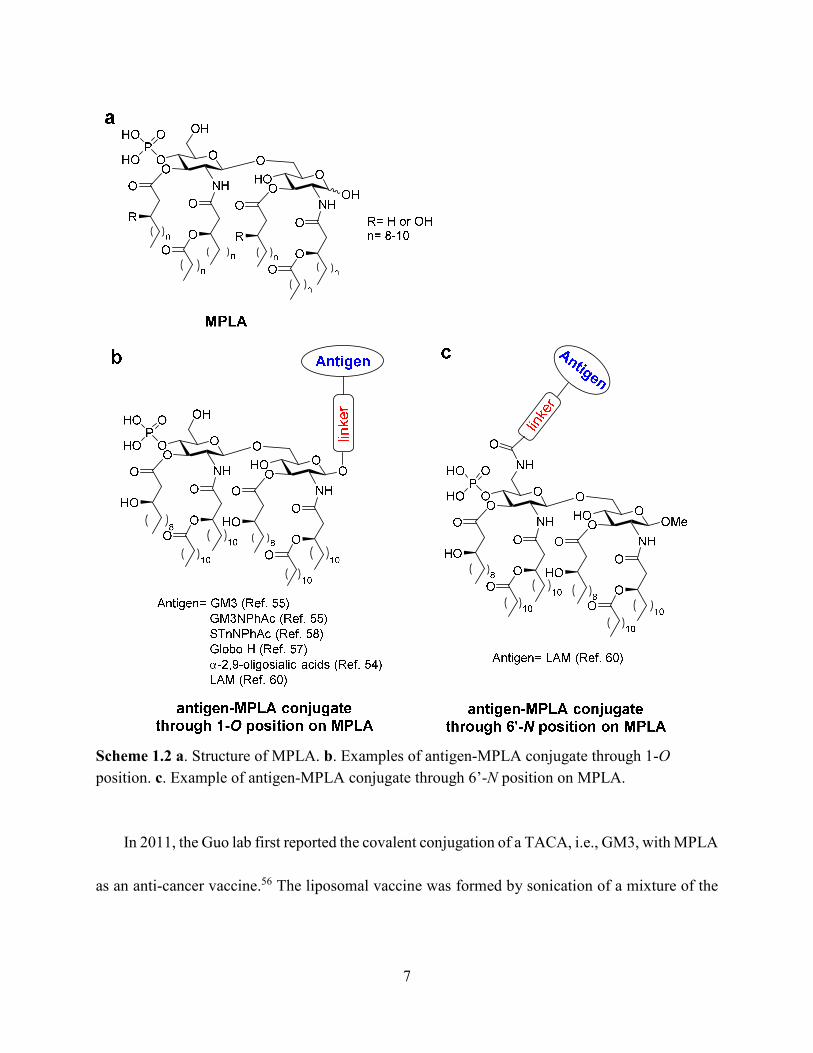
Scheme 1.2 a. Structure of MPLA. b. Examples of antigen-MPLA conjugate through 1-O position.
c. Example of antigen-MPLA conjugate through 6’-N position on MPLA. ................................... 7
Scheme 1.3 a. Structure of Mannan. b. Examples of oxidized and reduced mannan conjugates. c.
Examples of non-oxidized mannan conjugated with antigens through proteins. ......................... 16
Scheme 1.4 a. Structure of α-GalCer. b. Examples of antigen-α-GalCer prodrug conjugates
(conjugate through α-GalCer lipid chain). c. Examples of antigen-α-GalCer conjugate through 6-
OH. ................................................................................................................................................ 24
Scheme 1.5 Synthesis of antigen and/or adjuvant loaded acetalated dextran particles. ............... 33
Scheme 1.6 Synthesis of OVA-loaded reducible dextran nanogel. .............................................. 42
Scheme 1.7 Synthesis of oxidation sensitive dextran. .................................................................. 43
Scheme 1.8 Structure of SPG, Poly(dA) and SPG complex. ....................................................... 50
Scheme 3.1 Synthesis and characterization of the polymers. Synthesis of (a) polymer mPEG-
PDPAMA 3; (b) polymer-antigen and polymer-adjuvant conjugates through CDM linker (r in the
structure drawn denotes the polymers are random polymers); and (c) polymer-antigen conjugate
through ADA linker. (d) 1H-NMR and (e) pKa titration curve for mPEG-PDPAMA 3; (f)
hydrodynamic diameters and (g) pH responsive behavior of mPEG-PDPAMA 3 NPs monitored
by DLS. ....................................................................................................................................... 123
Scheme 4.1 Synthesis of polymers with multiple cholesterol copies. a. Polymerizing cholesterol
monomers via ATRP. b. Polymerizing cholesterol monomers via RAFT. c. Polymerization of
block polymer with different functional groups, followed by post-polymerization modification of
cholesterol and MPB-Sia-Lac-N3 3. ........................................................................................... 235

xxiii
KEY TO ABBREVIATIONS
7-AAD 7-Aminoactinomycin D
AC Alginate-calcium
ACC Alginate-calcium-chitosan
Ac-Dex Acetalated dextran
ADA Adipic acid
ADCC Antibody dependent cell-mediated cytotoxicity
ALV Antigen-loss variant
AMA 2-Aminoethyl methacrylate HCl salt
APC Antigen presenting cell
aPD-1 Anti-PD-1 antibody
APN Aminopeptidase N
B. Anthracis Bacillus Anthracis
BMA n-Butyl methacrylate
BMDC Bone marrow dendritic cells
Boc tert-Butyloxycarbonyl
Boc-AMA Boc protected 2-aminoethylmethacylate monomer
BSA Bovine serum albumin
CAC Cyclic acetal coverage

xxiv
CDC Complement-dependent cytotoxicity
CDM Carboxy-dimethylmaleic anhydride
CDN Cyclic dinucleotide
CFA Complete Freund's adjuvant
CFSE Carboxyfluorescein succinimidyl ester
CPRG Chlorophenol red-β-d-galactopyranoside
CPS 4 S. Pneumoniae serotype 4 capsular polysaccharides
CTL Cytotoxic T lymphocyte
CTLp CTL peptide epitope
CTP Cytidine-5'-triphosphate
CuAAC Copper catalyzed azido-alkyne coupling
DC Dendritic cell
DCM Dichloromethane
DIPEA Diisopropylethylamine
DLS Dynamic light scattering
DMAP 4-Dimethylaminopyridine
DMEM Dulbecco’s modified Eagle’s medium
DMEM/F12 Dulbecco's modified Eagle medium nutrient mixture F-12 Ham
DMF N,N-Dimethylformamide
DMSO Dimethyl sulfoxide

xxv
DPAMA Diisopropylaminoethyl methacrylate
EDC•HCl 1-Ethyl-3-(3-dimethylaminopropyl)carbodiimide hydrochloride
ELISA Enzyme-linked immuno-sorbent assay
ELISpot Enzyme-linked immune absorbent spot
EM Emulsion
ES Electrospray
FACS Fluorescence activated cell sorting
FBS Fetal bovine serum
FDA Food and Drug Administration
FITC-MAL I FITC-labeled α2,3-sialic acid binding plant lectin Maackia
Amurensis Lectin I
FITC-SNA FITC-labeled α2,6-sialic acid binding plant lectin Sambucus Nigra
Lectin
Fmoc Fluorenylmethyloxycarbonyl
GDR Galactosyl-dextran-retinal
GPC Gel-permeation chromatography
GPs β-Glucan particles
HA Hemagglutinin
HBSS Hank’s balanced salt solution
HBTU O-(Benzotriazol-1-yl)-N,N,N’,N’-tetramethyluronium
hexafluorophosphate
xxvi
HoBt Hydroxybenzotriazole
HPLC High performance liquid chromatography
IFA Incomplete Freund's adjuvant
IMQ Imiquimod
iNKT Invariant natural killer T
KLH Keyhole limpet hemocyanin
LPS Lipopolysaccharide
M2e Ectodomain of matrix protein 2
mAb Monoclonal antibody
MDP Muramyl dipeptide
MFI Mean fluorescence intensities
MGlu Methyl glutaric acid
MGlu-Dex 3-Methyl glutaryl dextran
MGlu-Man 3-Methyl glutaryl mannan
MHC I Major histocompatibility complex class I
MHC II Major histocompatibility complex class II
MP Microparticle
MPB m-Phenoxybenzoic acid
mPEG Methoxy polyethylene glycol

xxvii
mPEG-PDPAMA Methoxy polyethyleneglycol-poly(diisopropylaminoethyl
methacrylate)
mPEG-PDPAMA-PAMA Methoxy polyethyleneglycol-poly(diisopropylaminoethyl
methacrylate)-poly(aminoethyl methacrylate)
mPEG-PDPAMA-PBMA Methoxy polyethyleneglycol-poly(diisopropylaminoethyl
methacrylate)-poly(n-butyl methacrylate)
MPLA Mannan and monophosphoryl lipid A
mTOR Mammalian target of rapamycin
MUC1 Mucin 1
MWCO Molecular weight cut-off
NHS N-hydroxysuccinimide
NLRs NOD-like receptors
NmCss Neisseria meningitides
OVA Ovalbumin
OVA peptide Ovalbumin amino acid 257-264 antigen peptide
ox-Man Oxidized mannan
ox-M-FP Oxidative mannan-MUC1 fusion protein conjugate
PA Protective Antigen
PBMCs Peripheral blood mononuclear cells
PBS Phosphate-buffered saline
Pd2,6ST Photobacterium damselae α2−6-sialyltransferase

xxviii
PE Phycoerythrin
PLGA Poly(lactic-co-glycolic acid)
PLL Poly-L-lysine
PM P. Pratense pollen-non-oxidized mannan conjugate
PMDETA N,N,N′,N′′,N′′-Pentamethyldiethylenetriamine
PVA Polyvinyl alcohol
R848 Resiquimod
red-Man Reduced mannan
red-M-FP Reductive mannan-MUC1 fusion protein conjugate
ROS Reactive oxygen species
RPMI Roswell Park Memorial Institute
SAS Sigma adjuvant system
SEM Scanning electron microscopy
Siglecs Sialic acid-binding immunoglobulin-type lectins
SLP Synthetic long peptide
SPAAC Strain-promoted alkyne-azide cycloaddition
SPG Schizophyllan
STING Stimulator of interferon genes
STn Sialyl-Tn
TACAs Tumor-associated carbohydrate antigens

xxix
TAP Transporter to be associated with antigen processing
tBA α-Bromoisobutyryl bromide, t-butylacrylate
TCR T cell receptor
TD T dependent
TEA Triethylamine
TF Thomsen-Friedenreich
TFA Trifluoroacetic acid
Th1 T helper cell type 1
Th2 T helper cell type 2
THF Tetrahydrofuran
THPTA Tris(3-hydroxypropyltriazolylmethyl)amine
TIPS Triisopropylsilane
TLRs Toll-like receptors
TMG TiterMax Gold
TT Tetanus toxoid
VC-PAB Valine-citrulline-p-amino-benzyl
ZPSs Zwitterionic polysaccharides

1
CHAPTER 1 Carbohydrate and Carbohydrate Conjugates in Vaccine Developments1
1.1 Introduction
Carbohydrates are common surface molecules in the living system. With their rich structural
diversities, carbohydrate molecules play important roles in cellular recognition and signaling,
including immune recognition and activation.2-4Most of the cell surface immune receptors, such
as toll-like receptors (TLRs), NOD-like receptors (NLRs) and major histocompatibility complex
class I and class II (MHC I and MHC II), are glycoproteins. Several essential receptors for immune
cell activation, for example, TLRs, NLRs, C-type lectins and sialic acid-binding immunoglobulin-
type lectins (Siglecs), can recognize glycan containing ligands including those expressed on the
surface of many pathogenic microbes and cancer cells.3
Carbohydrates have been widely applied in vaccine development5. Vaccines containing
bacterial polysaccharides have been commercialized as anti-bacterial vaccines,6-7 and many anti-
cancer vaccines have been studied to target tumor-associated carbohydrate antigens (TACAs).6, 8-
10 Carbohydrates are also attractive immune adjuvant candidates. Various carbohydrates such as
β-glucan, mannan and monophosphoryl lipid A (MPLA) can activate the immune system and
induce T helper cell type 1 (Th1) immune responses.11-14 They may complement Alum, the Food
and Drug Administration (FDA) approved adjuvant in humans, which only induces T helper cell
type 2 (Th2) immune responses. Carbohydrates can be readily metabolized or degraded in vivo
and are less likely to generate long-term toxicity.13, 15-16 With their biocompatibility, low toxicity

2
and ease of modification, carbohydrates have been studied as carriers for antigen delivery,17-21
which can often induce immune cell targeting and provide self-adjuvanting activities for a
successful vaccination.
Although natural carbohydrates can be applied as vaccine components directly,22-24 in many
cases chemical modification of carbohydrates is necessary for enhanced efficacy. One of the
commonly used strategies in vaccine design is to prepare conjugates of antigens and/or adjuvants
with the delivery carrier.25 This can be beneficial in multiple ways, such as prolonged circulation
and controlled release, size-induced lymph node targeting, better immune recognition through
multivalency, enhanced cell uptake and immune activation. In this chapter, we would review
recent vaccine designs applying carbohydrates as vaccine delivery carriers and adjuvants. We will
discuss examples involving chemical modifications of the carbohydrates, especially the covalent
conjugates of antigens and carbohydrate-based delivery carrier or adjuvants. Vaccines that contain
carbohydrates and derivatives only as antigen components, or natural carbohydrates
encapsulated/admixed with other vaccine components, have been reviewed comprehensively,26-31
and are not discussed here.
1.2 Zwitterionic polysaccharides (ZPSs)
Many types of bacteria can produce high molecular weight polysaccharides as their capsules.
Polysaccharides have been traditionally considered as T cell independent antigens unless
conjugated to proteins or lipids.30, 32 Polysaccharides usually interact with polysaccharide-specific

3
B cells generating low-affinity IgM with little detectable IgG antibodies and little induction of T
cell responses or immune memory.33 However, a special group of polysaccharides, referred to as
ZPSs, has been found to have the ability to induce MHC II mediated T cell response specifically.34-
35 At least eight different ZPSs have been isolated from Bacteroides Fragilis, Staphylococcus
Aureus and Streptococcus Pneumoniae type 1, of which the PS A1 (isolated from Bacteroides
Fragilis) is the most studied ZPS so far (Scheme 1.1a).35-38
TACAs are saccharides aberrantly expressed on surfaces of multiple types of cancer cells.39
Like most types of carbohydrate antigens, TACAs induce only weak IgM responses when
administered alone. For successful TACA vaccines, TACAs are commonly conjugated with strong
immunogenic proteins, such as bovine serum albumin (BSA), tetanus toxoid (TT), keyhole limpet
hemocyanin (KLH), and virus like particles, in order to generate high levels of IgG responses.39-42
However, these carrier proteins can result in carrier induced suppression of antibody responses to
the desired TACA due to high antibody responses to the carrier itself.43 Furthermore, some of the
protein carriers tend to aggregate or suffer from stability issues.44 ZPSs as novel non-protein T
cell-activating carriers have been applied to cancer vaccine design by the Andreana group.45 They
first reported an “entirely carbohydrate vaccine” by conjugating a model TACA, Tn, and the most
studied type of ZPS, PS A1. PS A1 was isolated from B. Fragilis in a large scale, then subjected
to selective oxidation leading to aldehyde functioned PS A1 that reacted with aminooxy
functionalized Tn by oxime formation (Scheme 1.1b).
4
Scheme 1.1 a. Structures of several ZPSs. b. Examples of antigen-PS A1 conjugates. c.
Examples of antigen-PS B conjugates.
Immunization of mice with Tn-PS A1 resulted in a 200-fold increase of total antibody titer
against Tn compared to the pre-immunized sera, while the antibody titers against the PS A1
backbone were modest. IgM and IgG3 were the major subtypes of antibodies generated.45 Anti-
sera of Tn-PS A1 immunized mice were found to react with a range of Tn expressing cancer cell
lines (MCF-7, MDA-231, Jurkat, JurkatTAg, Panc-1),46 while binding little to human peripheral
blood mononuclear cells and human bone marrow cells as the negative control. The anti-PS A1
and anti-Tn-PS A1 sera showed completely different cytokine profiles. A high level of IL-17A, a

5
pro-inflammatory factor promoting CD4+ T cell proliferation, was detected in anti-Tn-PS A1 sera
but not in anti-PS A1 sera. Besides Tn antigen, other TACAs such as sialyl-Tn (STn)37, 47 and
Thomsen-Friedenreich (Tf)48 have been conjugated with PS A1 (Scheme 1b) and another ZPS, i.e.,
PS B (Scheme 1.1c).48 The conjugates were able to induce moderate levels of both IgM and IgG
antibodies against the target TACAs. Co-administration of an exogenous adjuvant such as Sigma
adjuvant system (SAS) and TiterMax Gold (TMG) could enhance the levels of IgG antibodies.
Post-immune sera bound with multiple types of cancer cells and were able to kill tumor cells via
complement-dependent cytotoxicities while sparing normal cells. Furthermore, the STn-PS
A1+SAS vaccine generated cellular immunity besides humoral antibody response. The enzyme-
linked immune absorbent spot (ELISpot) assay of splenocytes from mice immunized with STn-PS
A1+SAS pulsed with STn-PS A1 or BSM showed secretion of INF-γ, clearly indicating a Th1-
dominant cellular immune response.
These studies indicated that ZPSs are promising vaccine carrier/adjuvant to elicit a selective
immune response against TACAs. However, to date, the efficacy of protection in mouse tumor
models by these entirely carbohydrate vaccines have not been reported. Further studies are needed
to demonstrate the full potential of ZPS in anti-cancer vaccine development.
1.3 MPLA
MPLA is a derivative of lipopolysaccharide (LPS), a fraction isolated from cell walls of gram-
negative bacteria such as Salmonella Minnesota.49 Through a hydrolytic process reported by Edgar

6
Ribi, LPS can be converted into an acylated di-glucosamine mixture widely known as
monophosphoryl lipid.49-51 The majority of these species contains six acyl side chains, no
polysaccharide chains and one phosphoryl group (Scheme 1.2a).49, 52 Compared to LPS, MPLA is
about 0.1% as toxic as the parent LPS compound in rabbit pyrogenicity assays while maintaining
its immune-stimulating activities.50, 52 MPLA interacts with the immune system through TLR-4
and usually induces Th1 or a blended Th1 and Th2 type immune response. With its low toxicity,
MPLA has been applied as the adjuvant in several vaccines successfully in clinical trials.52-54
Vaccines containing MPLA such as FENDrix (HBV vaccine), Cervarix (HPV vaccine), Melacine
(melanoma vaccine), Pollinex Quattro (allergy vaccine) and Mosquirix (malaria vaccine for young
children) have been registered for use in many countries.53 MPLA can also serve as a vaccine
carrier and a built-in adjuvant when conjugated with antigens covalently. Herein we discuss
examples of fully synthetic vaccines containing MPLA as the carrier.55-59
7
Scheme 1.2 a. Structure of MPLA. b. Examples of antigen-MPLA conjugate through 1-O
position. c. Example of antigen-MPLA conjugate through 6’-N position on MPLA.
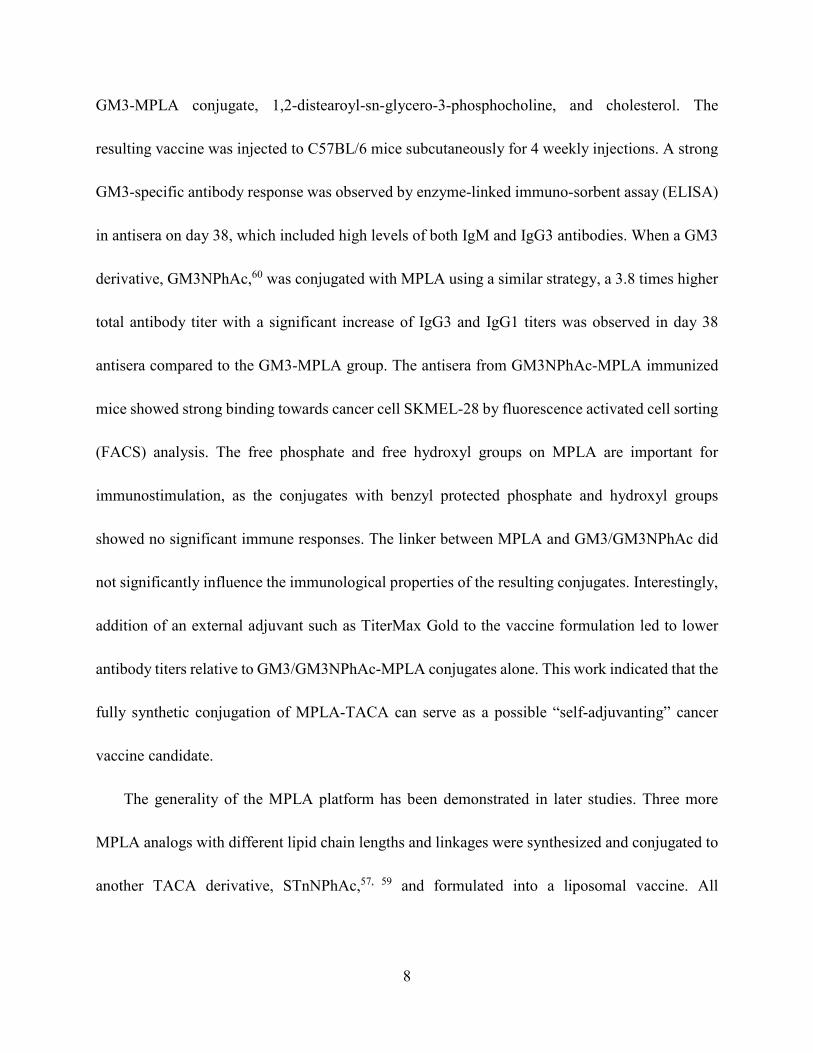
In 2011, the Guo lab first reported the covalent conjugation of a TACA, i.e., GM3, with MPLA
as an anti-cancer vaccine.56 The liposomal vaccine was formed by sonication of a mixture of the
8
GM3-MPLA conjugate, 1,2-distearoyl-sn-glycero-3-phosphocholine, and cholesterol. The
resulting vaccine was injected to C57BL/6 mice subcutaneously for 4 weekly injections. A strong
GM3-specific antibody response was observed by enzyme-linked immuno-sorbent assay (ELISA)
in antisera on day 38, which included high levels of both IgM and IgG3 antibodies. When a GM3
derivative, GM3NPhAc,60 was conjugated with MPLA using a similar strategy, a 3.8 times higher
total antibody titer with a significant increase of IgG3 and IgG1 titers was observed in day 38
antisera compared to the GM3-MPLA group. The antisera from GM3NPhAc-MPLA immunized
mice showed strong binding towards cancer cell SKMEL-28 by fluorescence activated cell sorting
(FACS) analysis. The free phosphate and free hydroxyl groups on MPLA are important for
immunostimulation, as the conjugates with benzyl protected phosphate and hydroxyl groups
showed no significant immune responses. The linker between MPLA and GM3/GM3NPhAc did
not significantly influence the immunological properties of the resulting conjugates. Interestingly,
addition of an external adjuvant such as TiterMax Gold to the vaccine formulation led to lower
antibody titers relative to GM3/GM3NPhAc-MPLA conjugates alone. This work indicated that the
fully synthetic conjugation of MPLA-TACA can serve as a possible “self-adjuvanting” cancer
vaccine candidate.
The generality of the MPLA platform has been demonstrated in later studies. Three more
MPLA analogs with different lipid chain lengths and linkages were synthesized and conjugated to
another TACA derivative, STnNPhAc,57, 59 and formulated into a liposomal vaccine. All

9
STnNPhAc-MPLA conjugates successfully generated immune responses toward STnNPhAc in
mice and the conjugate with an 8-carbon lipid chain length and free -OH groups induced the
highest antibody titers. Similar to the GM3-MPLA conjugate, when the exogenous adjuvant
TiterMax Gold was added to the formulation, the antibody titers decreased.
The optimized MPLA structure was used to conjugate with another TACA, globo H, and the
immunological properties were compared with the globo H conjugate with KLH, a gold standard
carrier commonly utilized in vaccine studies.58 Significantly higher total antibody titers as well as
IgG titers were observed in anti-sera from MPLA-globo H immunized mice compared to those
immunized with KLH-globo H, suggesting the advantage of MPLA as the carrier. Both conjugates
induced higher levels of pro-inflammatory cytokines including IL-4, IL-12, IFN-γ, and TNF-α in
mice compared to the non-immunized group. Although the KLH-globo H group showed a higher
level of cytokine secretion compared to MPLA-globo H, antisera from MPLA-globo H immunized
mice showed a stronger binding toward both MCF-7 and SKMEL-28 tumor cells by FACS
analysis and induced more cell lysis of human breast cancer cell MCF-7. The enhanced cytokine
secretion in KLH conjugate group might come from the immune response against the protein
carrier instead of the globo H antigen. This study indicated that the MPLA may serve as a good
alternative to KLH protein vaccine carrier.
In addition to the aforementioned cancer vaccines, a Group C meningitis vaccine has been
reported by conjugating MPLA and α-2,9-oligosialic acid containing di-, tri-, tetra- and penta-

10
sialic acid.55 The resulting liposomal vaccines with various MPLA-oligosialic acid conjugates
induced strong immune responses as revealed by high total antibody titers. The major antibody
subtype generated was IgG2b indicating a T cell-dependent immunity. Both oligosialic acid chain
length and MPLA structure influenced the immune responses. The shorter sialic acid chains (di-
and tri-sialic acid) were overall better immunogens than longer ones (tetra- and penta-sialic acid).
However, the antibody induced by the short sialic acid were more restricted to short sialic acid
chains. Conjugates containing tri-, tetra- or penta-sialic acid showed stronger binding toward
Group C meningitides capsule polysaccharide than the conjugate containing di-sialic acid.
Consistent with cancer vaccine studies, addition of external adjuvants such as CFA, alum and
TiterMax Gold did not lead to higher antibody responses. All conjugates showed protective effects
against Group C meningitides bacterial challenges in mice, which suggested the possibility of
applying the MPLA platform to anti-microbial vaccine development.
In the aforementioned MPLA based vaccine designs, the antigens were all conjugated with
MPLA through 1-O-position instead of 6’-O-position where the polysaccharide chain is attached
to LPS in nature.61 Guo and Gu further studied the influence of different antigen linkage positions
on immunological properties (Schemes 1.2b and 1.2c), by linking a tetrasaccharide antigen from
lipoarabinomannan (LAM), a Mycobacterium tuberculosis cell surface lipopolysaccharide, to
either 1 or 6’ position of MPLA. As the ester linkage on 6’ position was not stable, the 6’-O was
first substituted with an amino group linker in order to form a more stable amide bond. The

11
resulting conjugates were evaluated in vivo. Both conjugates showed significantly enhanced
antibody titers against LAM compared to the simple mixture of tetrasaccharide and MPLA, which
indicated the importance of covalent conjugation between the antigen and MPLA. As revealed by
ELISA, the antigen conjugated to MPLA through 6’-N position induced significantly higher IgG
titers than the corresponding conjugate through the 1-O position. The method of vaccine
administration also influenced the immune response outcome. Vaccine given through
intraperitoneal injection induced a 4-5 times higher antibody titer compared to the subcutaneous
route. This study suggested the conjugation through 6’ position of MPLA could be a more superior
strategy for MPLA based vaccine design.
As a low toxicity TLR4 stimulator, MPLA has been widely applied in many vaccines as an
add-in adjuvant.53 Guo’s work demonstrated the potential of MPLA as a good “self-adjuvating”
vaccine carrier. MPLA-antigen conjugates containing liposomal vaccines can induce strong
immune responses comparable to KLH protein. The MPLA platform showed good generality for
several carbohydrate antigens including TACAs and bacterial glycans. This platform is not
compatible with many external adjuvants and the antigen conjugation site can significantly
influence the outcome of vaccination.
1.4 Mannan
Mannan, a polysaccharide derived from the yeast cell wall, contains mostly β-1,4-linked
mannose backbone with a small number of α-1,6- linked glucose and galactose side chain

12
residues62. In addition, around 5% proteins were contained in mannan (Scheme 1.3a).63-64 As an
important component of fungal cell wall, mannan has been widely targeted as carbohydrate based
vaccines for Candidiasis.65-67 It was noticed from patients suffering from Candidiasis that the
mannan has immunomodulatory functions.68-69 Mannan can be recognized through binding with
mannose recognition lectins presented on macrophages and other immune cells, which activates
the host immune system via a non-self-recognition mechanism.70-71 The recognition initiates a set
of signal transduction events leading to cytokine secretion, complement activation and CD8+ T
cell activation.72-74 In this section, we focus on vaccines based on mannan carrier-antigen
complex/conjugations, including mannan-mucin 1 (MUC1) fusion protein conjugation for tumor
therapy, mannan-DNA vaccine and mannan-allergy vaccines.
The investigation of mannan’s potential as a vaccine carrier started in 1990s. The Steward
group conjugated mannan and dextran to hepatitis B virus (HBV) 139-147 peptide and studied the
immune response in mice towards these two constructs.75 The mannan carrier successfully induced
high IgG titers against HBV 139-147 peptide without additional adjuvants, while the
corresponding dextran conjugate failed to elicit an immune response. Although some previous
studies showed that mannan could suppress immunity,72, 76 this study opened the door for using
mannan as a “self-adjuvanting” vaccine carrier to enhance antibody production.
13
1.4.1 Mannan-MUC1 fusion protein conjugation (M-FP)
Mucins are heavily glycosylated proteins expressed on cell surface. MUC1 is a prototypical
mucin, which has been found to be over-expressed on a wide range of tumor cells. Furthermore,
tumor associated MUC1 has drastically shorter O-glycans in the tandem repeat region of MUC1
made of 20-amino acid residues (APDTRPAPGSTAPPAHGVTS),77 which leads to the exposure
of the protein core, rendering it a highly attractive antigen for anti-cancer immune-therapy.78-79
MUC1 by itself is only weakly immunogenic in humans partly due to its self-antigen nature.
Immunization of mice with MUC1 fusion protein containing 5 of the tandem repeats induced
antibodies but with little measurable cytotoxic T lymphocyte (CTL) responses and poor tumor
protection80. To enhance anti-MUC1 immunity, MUC1 has been conjugated with mannan.81
Two strategies (oxidative or reductive, Scheme 1.3b) for linking mannan to MUC1 have been
investigated, which induced drastically different types of immune responses.82 Human MUC1 FP
was conjugated to mannan oxidized with sodium periodate to provide the oxidative mannan-
MUC1 fusion protein conjugate (ox-M-FP). The reductive mannan-MUC1 fusion protein
conjugate (red-M-FP) was obtained by treating ox-M-FP with sodium borohydride. BALB/c mice
were immunized with either ox- or red- M-FP then challenged with MUC1+ 3T3 tumor cells. The
red-M-FP generated Th2 type immune responses and induced antibody secretion. However, it had
little tumor protective effects. In contrast, the ox-M-FP generated Th1 type responses and induced
a high tumor specific CTL precursor frequency providing protection in a mouse tumor model. The

14
CTL response elicited by ox-M-FP was MHC I restricted83, and the CTL precursor frequency could
be further enhanced by a combination with a chemotherapeutic drug, i.e., cyclophosphamide.84
The detailed mechanism of the entry of ox-M-FP into MHC I pathway had also been studied.85
While both aldehyde and Schiff base groups were presented on ox-M-FP, the aldehyde groups but
not the Schiff base groups were found to be important for antigen presentation through the MHC
I pathway.
The ox-M-FP had been evaluated in human clinical trials. In phase I studies, no significant
toxicities or autoimmunities were noted among >100 patients with advanced melanoma. However,
in contrast to preclinical mouse studies, the patients generated mainly antibodies rather than
cellular immunity against MUC1.86-88 The route of ox-M-FP administration influenced antibody
generation in patients. Intraperitoneal injections were significantly more effective compared to
intramuscular injections.88 Pilot phase III study of ox-M-FP was performed in early-stage breast
cancer.89 Although vaccine-induced antibody and weak cellular immunity responses showed little
benefits in advanced disease stage, ox-M-FP significantly improved survival time compared to the
placebo control group in early-stage cancer patients.89 In a 12-15 year follow-up study, the
recurrence rate of ox-M-FP group was much lower than that of the placebo group (12.5% vs.
60%).90 The mean time of recurrence in the ox-M-FP group was 52.2 months longer compared to
placebo group (118 vs. 65.8 months).90 In another study, autologous dendritic cells were chosen
as the vaccine carrier to maximize the cellular immunity in patients.91 The phase I/II clinical trial

15
showed ox-M-FP loaded monocyte derived dendritic cells were well tolerated for immunotherapy,
and vaccine-specific IFN-γ secreting CD4+ and CD8+ T cells were successfully induced in all
patients.91

16
Scheme 1.3 a. Structure of Mannan. b. Examples of oxidized and reduced mannan conjugates. c.
Examples of non-oxidized mannan conjugated with antigens through proteins.
17
1.4.2 Mannan as a carrier for DNA vaccines
Oxidized and reduced mannan (ox-Man and red-Man respectively) have been studied as DNA
vaccine carriers. Apostolopoulos and Pietersz groups conjugated ox-Man and red-Man with
polycationic linker poly-L-lysine (PLL) and then complexed them with DNA corresponding to the
protein ovalbumin (OVA).92 The conjugation with mannan reduced cytotoxicity of PLL, and the
Man-PLL-OVA DNA complex successfully induced immune responses against OVA. At a lower
dose (10 μg), red-Man-PLL-OVA DNA mainly induced CD4+ T cell responses, while ox-Man-
PLL-OVA DNA induced CD8+ T cell responses. Meanwhile, at a higher immunization dose (50
μg), both red-Man and ox-Man-PLL-OVA DNA complex generated CD4+ and CD8+ T cell
responses. Both complexes induced good tumor protection against OVA expressing EG.7 tumor
using either low (10 μg) or high (50 μg) immunization doses.
With the success of OVA DNA vaccine, Apostolopoulos and coworkers further studied
MUC1 DNA vaccine, by preparing the Man-PLL-DNA complex.93 The resulting ox-Man-PLL-
MUC1 DNA generated immune responses in C57BL/6 mice and protected mice in tumor challenge
with a low immunization dose. In addition, the vaccines generated strong immune responses in
MUC1 transgenic mice, which are tolerant towards human MUC1 as in humans. Similar to
previous reports, the ox-Man-PLL-MUC1 DNA mainly generated a Th1 response while red-Man-
PLL-MUC1 DNA generated a Th2 dominant response. A more detailed study showed the
differences between DNA alone and Man-PLL-DNA complex upon immunization.94 Man-PLL
18
protected cargo DNA against the DNase digestion. Ox-Man and red-Man induced different
cytokine secreting profiles. Compared to DNA alone, ox-Man induced higher levels of IL-2, IL-
12, IFN-γ and TNF-α while red-Man induced only IL-2. The Man-PLL-DNA complex was able
to stimulate dendritic cell (DC) maturation through a TLR2 but not a TLR4 dependent pathway.
1.4.3 Mannan as the carrier for allergy vaccine
Allergen-specific immunotherapy has attracted researchers’ attention as it may provide a long-
lasting relief from allergy for the patients. Mannan-allergen conjugates have been studied as
potential anti-allergy vaccines.95
The Weiss lab studied the conjugation between oxidized mannan and model allergens, OVA
protein and papain, for vaccination targeting dendritic cells.96 The mannan backbone here served
as not only a targeting molecule towards the C-type lectin receptor (a receptor expressing on DCs),
but also a platform to induce cross-linking for multimerization of allergen proteins for
immunogenicity enhancement.97 Sodium periodate was used for generating aldehyde groups on
mannan backbone for allergen conjugation by oxidative cleavage between C2 and C3. The
conjugation efficiency depended on antigen properties as well as the degree of oxidation. The C-
lectin binding property of mannan was not disturbed after conjugation with antigen proteins when
the oxidation degree was careful controlled. The mannan-antigen conjugate significantly increased
the number of antigen-presenting DCs in lymph nodes in vivo. Immunization successfully reduced
the enzymatic activity or IgE binding capacity of antigen proteins in vaccinated mice. Antibody

19
class-switching from allergy-promoting IgE subtype to non-allergic IgG1 subtype was noticed
indicating an anti-allergy therapeutic effect.
Palomares et. al. used another strategy to conjugate allergen proteins to non-oxidized mannan
by a simple treatment of glutaraldehyde (Scheme 1.3c).98 The conjugate took advantage of the
trace amount of mannan protein on mannan backbone. Allergens were polymerized and linked to
mannan protein through glutaryl diimine linker and the resulting conjugate significantly reduced
IgE binding activity against the allergens. Later Palomares et. al. applied this conjugation method
for preparing P pratense pollen-non-oxidized mannan conjugate (PM).99 The PM was
hypoallergenic with low IgE binding in vitro and induced fewer mast cells under the skin in an in
vivo skin-prick test. Immunization of rabbit with PM induced blocking antibodies against IgE
binding. Compared to the free allergen or the polymerized allergen, the PM can be captured more
effectively by human DCs. More anti-inflammatory cytokines IL-6 and IL-10 secretion in human
DCs were induced by PM, and Foxp3+ Treg generation through PD-L1 in human subjects was also
promoted, which indicated a down-regulation of immune responses toward the allergen.
A drawback in using oxidized mannan is that the mannose ring in the mannan backbone is
partially opened, which may impair the capture of PM by DCs in mice and human subjects.99 This
can be overcome with non-oxidized mannan.
Another important consideration in mannan based vaccine is the combination of external
adjuvant. In a recent study, the Palomares lab reported the PM induced anti-allergy Foxp3+ Treg

20
generation can be inhibited when co-administrated with Alum.100 This was because Alum
suppressed the increasing production of lactate and consumption of glucose induced by PM in
human DCs by altering the glucose metabolic fate in mitochondria and inhibiting mammalian
target of rapamycin (mTOR).
1.5 α-Galactosylceramide (α-GalCer)
The presentation of antigen fragments on antigen presenting cell (APC) surface is an important
step for activating the adaptive immune system. Besides the commonly known MHC I and MHC
II, CD1 family is a third subset of antigen presenting molecules.101 There are 4 types of CD1
(CD1a-CD1d) capable of binding and presenting glycolipids to CD1-restricted T cells. A subtype
of T cells, invariant natural killer T (iNKT) cells, is defined as a T cell lineage expressing NK cell
receptors and an additional invariant CD1d restricted αβ-T cell receptor (TCR).102 After activation
through its TCR binding with glycolipid presenting CD1d on APCs, iNKT cells can secret various
cytokines, which build a bridge between the innate and the adaptive immune system. iNKT cells
can initiate “T dependent (TD) type II response”, which needs no participation of CD4+ T cells. It
has been reported that iNKT cells play a role in protection against pathogens as well as cancer.103-
105 The first iNKT activator, α-GalCer (KRN7000, Scheme 1.4a) was a synthetic compound
discovered from a class of glycolipids originally isolated from marine sponges.106-108 Since then,
hundreds of analogs were synthesized by varying the amide side chain length and functional
groups, substitutions at galactose-6 position and galactose-ceramide linker etc. α-GalCer is by far

21
the most explored structure and the C-glycoside analog 7DW8-5 with an aryl side chain were also
attractive structures for immune studies. Many excellent reviews about α-GalCer and its analogs
have been published.28, 109-111
α-GalCer has been applied as an adjuvant in many studies,53, 111-117 including vaccines against
cancer, influenza, and malaria. To improve the delivery efficiency of α-GalCer and therefore
enhancing the activation of iNKT cells, various delivery systems have been designed, such as
liposomes, poly(lactic-co-glycolic acid) (PLGA) particles and bacteriophage particles.118-122 By
delivering covalently conjugated antigen and α-GalCer, the immune response could be stronger
due to the simultaneous delivery of the antigen and the adjuvant to the same immune cell, and we
focus on examples of covalent conjugate vaccines of α-GalCer.
The first examples of covalent conjugation of the antigen and α-GalCer were reported in
2014 .123-124 The Painter and Herman’s labs developed self-adjuvanting vaccines that suppressed
allergy by conjugating the antigen peptide to α-GalCer through a cleavable linker (Scheme
1.4b).123 Starting from α-GalCer, an N to O acyl migration occurred under acidic conditions, which
produced an α-GalCer prodrug with a free amino group for further functionalization. The amino
group was then capped with an esterase-labile acyloxymethyl carbamate group. The resulting
ketone group could be functionalized with an aminooxy peptide containing the protease cleavable
FFRK sequence following the desired antigen peptide. Under the physiological condition, the
FFRK linker would be cleaved to release the desired antigen while the acyloxymethyl carbamate

22
group would be degraded by an esterase to release the α-GalCer prodrug. After a reversed O to N
acyl migration, the active adjuvant α-GalCer would be formed in situ. In this study, two model
antigen peptides, SIINFEKL and KAVYNFATM, were selected. Both peptide-GalCer conjugates
stimulated greater CD8+ T cell proliferation compared to non-conjugated mixtures containing the
same amount of peptide and α-GalCer. By intracellular staining, large amounts of IFN-γ and TNF-
α were detected, while allergy related IL-4 cytokine was not detectable. The conjugates induced
antigen-specific cytotoxic responses in immunized animals, while the admixture of peptide and α-
GalCer failed to do so. This strong activity was CD4+ T cell independent and the covalent
conjugation was shown to be critical. The SIINFEKL-α-GalCer conjugate strongly reduced
inflammatory responses in an allergy animal model, sensitized by the OVA protein. In contrast,
the mixture of peptide and α-GalCer did not reduce the allergic response.
About the same time, the De Libero’ lab developed a semisynthetic vaccine against S.
pneumoniae by conjugating S. pneumoniae serotype 4 capsular polysaccharides (CPS 4) to 6
position of α-GalCer through a cleavable linker (Scheme 1.4c).124 Different from Painter and
Herman’s strategy, the immunogenic lipid tail was kept intact. Instead, an amino moiety was
connected to 6-OH of α-GalCer then conjugated with CPS 4 via cyanogen bromide chemistry. The
conjugates were usually a mixture of isoureas, N-substituted imidocarbonates and N-substituted
carbamates, which could release the original CPS 4 under acidic condition when taken up by APCs.
The CPS 4-GalCer conjugation generated polysaccharide-specific IgM, IgG1, IgG2a, IgG2b and

23
IgG3 antibody responses in mice, while the mixture of CPS 4 and α-GalCer and CPS 4 only
generated weak IgM responses with no IgGs. The conjugation induced germinal centers and the
resulting antibody induced S. pneumoniae opsonization. Animals vaccinated with the CPS 4-
GalCer conjugate exhibited a significant survival advantage (89%) in bacterial challenge model
compared to animals receiving CPS alone (25%). By FACS analysis of the splenocytes, CPS 4-
GalCer, but not mixture of CPS 4 and α-GalCer or CPS4 alone, induced antibody isotype switching
to IgG, generation of memory B cells and antigen secreting plasma cells. Experiments on CD1d-
/- mice indicated that iNKT cells were required to establish effective protections against S.
pneumoniae.
Both conjugation methods, i.e., conjugating antigen to lipid tail or to 6-OH on galactose
through cleavable linker, were proven to be successful. The conjugated vaccines have been
demonstrated to provide stronger immune stimulation compared to a simple mixture of antigen
and adjuvant. Several more examples using either conjugation method have been published since
then (Schemes 1.4b and 1.4c).

24
OHO
HO
HOOH
O
HN
O
OH
OH
-GalCer
24
13
OHO
HO
HOOH
O
NH2
OH
-GalCer prodrug
O13
O24
LinkerAntigen
OHO
HO
HOOH
O
HN
OH
O13
O24
Linker Antigen
Antigen- -GalCer prodrug conjugates
O
O
O
O
NO
O
O
O
NH
OHN
NHCONH2
O
NH
O
NO
O
O
O
O
O
N
O
O
NH
OHN
NHCONH2
O
NH
O
N
4 NN
O
4 NN
O
1 23
4
Linker = 1, Antigen = FFRK-SIINFEKL, FFRK-KAVYNFATM
(Ref. 122)
Linker = 1, 2, 3, 4, Antigen = FFRK-SIINFEKL (Ref. 124)
Linker = 4, Antigen = FFRK-KNLVPMVATV (Ref. 124)
Linker = 4, 5, Antigen = FFRK-KISQAVHAAHAEINEAGRESIINFEKLTEWT
(Ref. 126)
Linker = 4, Antigen = pp65495-503, HPV16 E749-57 (Ref. 127)
O
O
NH
OHN
NHCONH2
O
NH
O
O
NN
N
O
3
5
OHO
HO
HO
O
HN
O
OH
OH
24
13
Linker Antigen
Antigen = CPS 4 (Ref. 123)FFRK-SIINFEKL (Ref. 125)STn (Ref. 128)Tn (Ref. 130)
Antigen- -GalCer conjugates through 6-OH
a
b
c
H+
Scheme 1.4 a. Structure of α-GalCer. b. Examples of antigen-α-GalCer prodrug conjugates
(conjugate through α-GalCer lipid chain). c. Examples of antigen-α-GalCer conjugate through 6-
OH.
25
Painter and Herman continued the study on conjugation linkers and designed several possible
linkage methods to covalently conjugate the antigen with α-GalCer (Scheme 1.4c).125-126 They first
investigated four different linkers to link short peptide antigens on GalCer lipid tail.125 Similar to
their previous work,123 an N to O migration of the acyl group on α-GalCer was designed, resulting
in an α-GalCer prodrug with a free amino group. The amino group was further capped with an
esterase sensitive acyloxymethyl carbamate linker containing ketone (linker 1) or azido group
(linker 3), or with protease sensitive valine-citrulline-p-amino-benzyl (VC-PAB) carbamate
linkers containing ketone (linker 2) or azido group (linker 4). Short peptide antigens with a protease
cleavable FFRK sequence were conjugated to the 4 different linkers through oxime formation (for
linkers 1 and 2) or copper catalyzed azido-alkyne coupling (CuAAC) (for linkers 3 and 4). All four
conjugates showed similar levels of NKT cell activation in a melanoma challenge model. These
conjugates showed improved protection compared to unconjugated mixtures. Among the four
choices, linker 4 provided a better stability under physiological pH and eased the synthesis of
peptide payload, and therefore was considered as a lead compound for further development.
Painter and Turner applied the aforementioned conjugation strategy for the development of an
influenza vaccine. They linked a synthetic long peptide (SLP) containing an immunogenic
sequence OVA257 (amino sequence: SIINFEKL), a known CD4+ T cell epitope OVA323 (amino
acid sequence: ISQAVHAAHAEINEAGR) and a protease cleavage sequence FFRK, with the α-
GalCer prodrug with VC-PAB linker through CuAAC (linker 4) or strain-promoted alkyne-azide

26
cycloaddition (SPAAC) (linker 5).127 Though the two conjugation methods introduced slightly
different linker structures in the final α-GalCer prodrug-SLP conjugates, the two vaccines primed
NKT cells similarly in vivo. As the SPAAC strategy provided a higher yield with fewer side-
products, this form of vaccine was subjected to further studies. It has been noted that the α-GalCer
prodrug-SLP conjugate vaccine induced CD8+ T memory cell at a similar level as A/PR8-OVA
challenged group, which was known to induce OVA specific memory response. The memory T
cell response lasted for at least 60 days after immunization. The α-GalCer alone, SLP alone or α-
GalCer + SLP mixture failed to induce such memory T cell response. In vivo challenge study using
OVA modified influenza virus showed that mice vaccinated with the α-GalCer prodrug-SLP
conjugates showed a faster viral clearance and body weight recovery compared to α-GalCer alone
or α-GalCer + SLP mixture, suggesting the generation of protective immunity by vaccination.
Weinkove and Painter reported an α-GalCer prodrug conjugated with pp65495-503, an HLA-
A*02-restricted peptide from cytomegalovirus (CMV) pp65 protein, through the VC-PAB linker
using CuAAC chemistry (linker 4).128 The resulting conjugate activated human DCs and CD8+ T
cells besides NKT cells in vitro. After incubating human peripheral blood mononuclear cells
(PBMCs) with α-GalCer or α-GalCer-pp65495-503 conjugate, increased NKT proliferation and IFN-
γ secretion were observed. Human DCs can be activated by α-GalCer or α-GalCer-pp65495-503
conjugate only when co-cultured with NKT cells. The activation of NKT cells and DCs can be
blocked by anti-CD1d antibodies, which suggested α-GalCer-pp65495-503 activate human immune

27
cells through the CD1d dependent pathway. The activation of human CD8+ T cells also required
NKT cells. The conjugation between antigen peptide and α-GalCer is crucial for CD8+ T cell
activation, as the admixed components failed to induce the expression of T cell activation marker
CD137. An oncogenic viral antigen HPV16 E749-57 was conjugated to α-GalCer prodrug through
the same strategy and the resulting conjugate vaccine showed significant antitumor response
against HPV16 E7 expressing tumor in mice model, which further suggested the effectiveness of
α-GalCer prodrug-peptide antigen conjugate strategy.
Painter and Herman’s labs also investigated the conjugation of antigen to 6-OH position of α-
GalCer through a disulfide bond or a maleimido-linker.126 6’’-Deoxy-6’’-thiol-α-GalCer was first
synthesized and was proven to have similar bioactivities as α-GalCer. The thiol group may be
trapped with 2,2’-dithiodipyridine followed by reacting with Cys-peptide to form a disulfide bond
or reacting with N-propargyl bromomaleimide followed by CuAAC for conjugation with the
peptide. Both conjugates induced a stronger peptide-specific cytotoxic response in vivo relative to
a mixture of α-GalCer and the peptide.
Liu and Guo designed a fully synthetic cancer vaccine candidate by linking tumor associated
STn antigen to α-GalCer through a covalent linker at the 6-OH position.129 Previous study showed
that PEGylation on 6-OH position of α-GalCer through the amide linker retained the specificity of
CD1d receptor and the ability to activate iNKT cells.130 Therefore, the 6 position of α-GalCer was
selected as the site of conjugation via an amide bond to a non-cleavable linker consisted of a non-
28
branched aliphatic chain to link with the STn antigen. STn-β-GalCer was also synthesized as a
weak iNKT activator. The synthetic STn-α-GalCer and STn-β-GalCer were mixed with other
lipids to form liposomal vaccines respectively. Based on ELISA results, though the two vaccines
generated similar sera IgM titers against STn on BALb/c mice, STn-α-GalCer induced 23-fold
higher IgG titers compared to STn-β-GalCer. Subtype analysis indicated the IgG antibodies were
primarily IgG1 and IgG3, which were strong inducers of complement-dependent cytotoxicity
(CDC) and antibody dependent cell-mediated cytotoxicity (ADCC). In this case, α-GalCer served
as a liposomal carrier as well as an adjuvant for iNKT cell activation. In a later study from the
Seeberger lab, the liposomal form of Tn-α-GalCer conjugates showed effective activation of anti-
Tn immunity in vivo.131 Compared to Tn-CRM197, a protein carrier-based vaccine, the anti-Tn IgG
response generated by the liposomal form of Tn-α-GalCer conjugate was more consistent and more
specific. Furthermore, the liposomal form of Tn-α-GalCer conjugates also generated long-lasting
memory response against Tn, while the Tn-CRM197 only induced memory response to the carrier
protein in some of the mice but not to the glycan antigen. Liposomes formed by Tn-lipid conjugate
without the α-Gal structure could also generate anti-Tn IgG, but with a lower magnitude of
response compared to Tn-α-GalCer liposomes. The size of the liposomes was shown to be crucial
in this case. While the ~400 nm sized liposomes promoted Th1-type IgG2a antibodies, the smaller
particles (~120 nm) mainly induced the production of Th2-type IgG1 antibodies. This report
indicated the multivalent display of antigens by the antigen-α-GalCer conjugated liposome can be

29
beneficial.
The aforementioned examples have shown the promises of antigen-α-GalCer conjugates as
vaccines. The conjugates have been reported to have a stronger protective effect compared to the
antigen and α-GalCer mixture. Short peptides and carbohydrates antigens can be used and multiple
methods for conjugation were developed, which provided flexible ways for vaccine design. The
liposomal form of antigen-α-GalCer covalent conjugates can further help inducing strong and
tunable immune responses.
1.6 Modified dextran
Dextran is a branched natural polysaccharide containing α-1,6-linkage between glucoses as
the backbone with α-1,3 linked branches. It is a biocompatible, biodegradable and FDA proved
material. Dextran is water soluble and is easy to modify with other functional groups to achieve
environment responsive properties. Though crystalized dextran particles can serve as vaccine
delivery vehicle as reported,132-133 most studies have focused on modified dextran as a candidate
for vaccine design. In this section, we discuss only modified dextran.
1.6.1 Acetalated dextran
Acetalated dextran (Ac-Dex) is a pH responsive material first reported in 2008 by the
Fréchet’s group.134 It can be synthesized easily from dextran through a single step acetal formation
with 2-methoxypropene. In contrast of dextran, Ac-Dex is not soluble in water and can form
microparticles using an emulsion procedure. Under acidic conditions, the acetals get hydrolyzed

30
to unmask the parent water soluble dextran structure and therefore breaking up the hydrophobic
microparticles. In Fréchet group’s study, a model hydrophobic payload, OVA, was encapsulated
inside Ac-Dex particles via double emulsion with a loading rate of 3.6 wt%. At pH=7.4, the
particles were stable, while in pH=5.5 buffers, the particles degraded within 24h. T cell activation
assay showed that OVA loaded Ac-Dex particles significantly increased MHC I presentation of
SIINFEKL on RAW macrophages compared to free OVA group. We applied Ac-Dex to deliver
foreign antigens for anti-tumor therapy, and more details are presented in Chapter 2 of this
thesis.135
A great advantage of Ac-Dex over traditional PLGA is the ease in tuning rate of degradation,
providing the possibility to optimize the payload releasing rate for a specific application.136-137
During the acetal modification, two types of acetal, cyclic acetal which hydrolyzes more slowly
and acyclic acetal with faster degradation rates, would be formed on dextran (Scheme 1.5). As the
kinetic product acyclic acetal forms first before the more stable cyclic acetals, the ratio of
cyclic/acyclic acetal on the dextran backbone can be tuned by reaction time. The ratio of cyclic
and acyclic acetal in the final product dictates the degradation behavior of the Ac-Dex particles.
By controlling the reaction time from 2-1,500 minutes, a set of Ac-Dex with different ratios of
cyclic/acyclic acetal was prepared.136 The degradation half-life at pH=5.5 was tuned from minutes
to days. The degradation rates at pH=7.4 were usually 230-280 times slower than those at pH=5.5,
which was stable enough for delivery applications. Half-life of degradation correlated well with

31
cyclic acetal content, which indicated the hydrolysis of cyclic acetal may be the rate-limiting step
in particle degradation. The molecular weight of dextran also influenced the degradation of
particles.137 With similar cyclic acetal coverage, the Ac-Dex with higher molecular weight
degraded faster.
The degradation rate can be important for both MHC I and MHC II antigen presentation.136
OVA loaded Ac-Dex particles with degradation half-lives from 0.27h to 16h were prepared and
incubated with bone marrow dendritic cells (BMDCs) followed by T cell activation assays to
determine MHC I and MHC II presentation of OVA derived epitopes. The particles with 1.7 h
degradation half-life led to an optimal MHC I or MHC II presentation of OVA derived epitopes
compared to particles with either longer or shorter degradation half-life. These optimal particles
performed an order of magnitude better than traditional PLGA or iron oxide particles. Interestingly,
the Ac-Dex particles with 1.7 h degradation half-life did not require the transporter to be associated
with antigen processing (TAP), a protein involved in the most common MHC I antigen loading
mechanism, for antigen presentation, while the particles with 16 h degradation half-life required
TAP for antigen loading.136 The difference might be attributed to the surface chemistry difference
of the two materials due to the different degradation rate. A recent in vivo study138 showed that
OVA loaded Ac-Dex particles with 20% cyclic acetal coverage (CAC) generated stronger antibody
response during the entire experiment period compared to particles with 40% and 60% CAC.
Notably, when the particles were used for adjuvant delivery, the immune activating behavior was

32
different. The adjuvant loaded Ac-Dex particles with 20% CAC induced stronger antibody and
cytokine response at early time points (day 14), while the 40% and 60% CAC induced greater
antibody titers at later time points (days 28 and 42). This study suggested the importance of
delivery of antigen and adjuvant separately in individually optimized Ac-Dex particles.
One possible limitation for Ac-Dex is that, one of the products released from degradation is
methanol, which is known to be highly toxic. Therefore, 2-ethoxypropene was explored as an
alternative to functionalize dextran instead of 2-methoxypropene.139 No significant differences
were observed in cell viability when cells were incubated with the acetalated dextran formed with
2-ethoxypropene or Ac-Dex at concentrations below 1mg/ml. Further toxicity study is needed to
determine if the new acetalated dextran improved the biocompatibility at higher concentrations.
To date, most studies have been using Ac-Dex as the carrier material.

33
Scheme 1.5 Synthesis of antigen and/or adjuvant loaded acetalated dextran particles.
Ac-Dex has been introduced for vaccine adjuvant delivery since 2010140 for several types of
TLR agonists. Keane-Myers and co-workers first studied Ac-Dex microparticles as the delivery
platform for imiquimod, a hydrophobic TLR7/8 agonist, as an adjuvant in vitro. Imiquimod loaded
Ac-Dex microparticles were prepared with 4 wt% loading rate and 100% loading efficiency. After
incubation with imiquimod loaded particles, the gene expression level, cytokine secretion level of
inflammatory cytokines IL-1β, IL-6 and TNF-α, and the expression of two activation markers
PD1-L1 and iNOS as well as the production of downstream product NO, were significantly

34
increased in two macrophage cell lines, MH-S and RAW 264.7. The particles also significantly
increased the production of IL-1β, IL-6, IL-12p70 and MIP-1α in BMDCs. Compared to free
imiquimod, the encapsulated imiquimod induced higher amounts of cytokine at lower
concentrations of the particles. Empty Ac-Dex did not induce detectable inflammatory cytokine or
activation marker increases. This in vitro study showed the promise of Ac-Dex as a vaccine
adjuvant carrier to achieve a good immune stimulation effect.
Another method for Ac-Dex particle preparation, electrospray (ES), provided a better
encapsulation efficiency (83%) toward a less hydrophobic TLR 7/8 agonist resiquimod compared
to the standard emulsion encapsulation method (6%).141 Particles made by electrospray were larger
(1-5 μm) than those from the emulsion method (~300 nm) and had a collapsed morphology. More
spherical particles could be obtained when blending with Tween 80 during electrospray process.
The Tween 80-blended Ac-Dex particles stimulated macrophages in vitro to increase NO release
and inflammatory cytokine secretion. The in vivo study showed that these particles reduced L.
donovani amastigotes in heart and liver of mice relative to mice receiving empty nanoparticles or
PBS.
The Ainslie’s group applied Ac-Dex to deliver another two TLR agonists, i.e., poly I:C and
CpG as vaccine adjuvants.142 71kDa Ac-Dex with 5 min acetalation reaction time (Ac-Dex (5min))
was found to be the best material for the delivery of both agonists. The encapsulation efficiencies
of poly I:C and CpG in Ac-Dex (~55% and ~36% respectively) were significantly higher compared

35
to traditional PLGA particles (~33% and ~3% respectively). A significantly higher level of NO
release and cytokine secretion including IL-6, IL-12p70, IL-1β, IL-2, TNF-α and IFN-γ was
observed in RAW 264.7 macrophages with poly I:C encapsulated Ac-Dex (5min) particles
compared to poly I:C encapsulated PLGA particles and another Ac-Dex, Ac-Dex (4h), which
degraded slower. Due to the poor encapsulation of CpG in PLGA (~3%), only Ac-Dex (5min) was
tested for delivering CpG to RAW 264.7. For both NO release and cytokine profile, CpG
encapsulated in Ac-Dex was superior to free CpG.
Ting’s lab applied Ac-Dex particles for the delivery of cyclic dinucleotide (CDN) 3’3’-
cGAMP, a ligand of stimulator of interferon genes (STING), for immune cell activation143. The
cGAMP is a water-soluble adjuvant, which has poor cell penetration abilities. Liposomes and
hydrogel delivery carrier of cGAMP were associated with low encapsulation efficiency and poor
long-term stability.144-147 With the electrospray method, the Ac-Dex particles (ES Ac-Dex) loaded
up to 0.52%wt of cGAMP with 89.7% encapsulation efficiency, which is significantly higher
compared to Ac-Dex particles prepared through the emulsion method (EM Ac-Dex), PLGA
particles or liposomes. The cGAMP loaded ES Ac-Dex remained intact in pH neutral media at 37‑
for at least 28 days without losing the bioactivity of cGAMP. Strong immune activation was
observed both in vitro and in vivo without significant toxicities. When ES Ac-Dex was co-
administrated with a model antigen OVA, the level of antibody against OVA generated in vivo
was enhanced by 104 to 106 folds compared to OVA alone. Analysis of antibody subtype indicated
36
the cGAMP encapsulated ES Ac-Dex particles induced balanced Th1 and Th2 associated immune
responses, while the Alum adjuvant produced mainly Th2 polarized responses. Besides humoral
responses, the cGAMP encapsulated ES Ac-Dex also induced cellular responses against the model
antigen OVA. On a B16F10 melanoma model, the cGAMP Ac-Dex showed a better anti-tumor
effect compared to three other Ac-Dex particles encapsulating different adjuvants, Murabutide,
imiquimod and Poly I:C.148 The successful anti-cancer immunotherapy by cGAMP Ac-Dex
particles was also observed on a triple negative breast cancer cell line E0771. Systematic
administration of cGAMP Ac-Dex through intravenously injection slowed down tumor growth as
efficient as local administration through intratumoral injection. Interestingly, in the B16F10 model,
the NK cells, instead of T cells, were the major type of cells for tumor lysis. However, for E0771
tumor, both NK and T cells were important for the anti-tumor responses. These results indicated
the importance of activating both the innate immune cells (NKs) and adaptive immune cells (T
cells) for tumor immunotherapy, as the T cells may not always be the major anti-tumor responders.
Co-delivering more than one adjuvant within one Ac-Dex particle can improve the immune
activation compared to single adjuvant loaded Ac-Dex particles. For example, cGAMP ES Ac-
Dex successfully induced high levels of IFN-β, IL-6 and TNF. With the co-encapsulation of
resiquimod (R848) in the same particle, the cGAMP/R848 ES Ac-Dex elicited two more important
cytokines for adaptive immune activation, IL-1β and IL-12p70.149 Co-administration of separate
cGAMP ES Ac-Dex and R848 ES Ac-Dex particles was not as efficient as co-encapsulation of the
37
two adjuvants within the same particle based on in vitro cytokine release study. The combination
of muramyl dipeptide (MDP), a NOD2 ligand, with R848, also showed superior additive effects.150
Besides serving as an adjuvant carrier, Ac-Dex particles can deliver both the antigen and the
adjuvant as a full vaccine against various targets, such as anthrax, bacterial infection and influenza.
Anthrax caused by the infection of Bacillus Anthracis (B. Anthracis) can lead to death within
1 week, with the current vaccine Anthrax Vaccine Adsorbed requiring up to 6 doses and 18 months
to achieve protection.151 A vaccine that can generate fast immune protection against anthrax is
urgently needed. The Ainslie’ group designed an Ac-Dex based vaccine to generate a rapid
immune response against anthrax, where Ac-Dex was used to encapsulate R848, and Protective
Antigen (PA), the most important toxic component of anthrax antigen, in separate particles by
emulsion.151 Mice received both R848 Ac-Dex and PA Ac-Dex showed much stronger IgG
responses on days 14, 28 and 42 after immunization compared to PA+Alum or free PA + R848
Ac-Dex particles. All mice immunized with PA Ac-Dex +R848 Ac-Dex vaccine survived 3
challenges on days 14, 28 and 42 with both low and high doses of B. Anthracis. This Ac-Dex based
vaccine only required two injections at days 0 and 7, and effective protection against anthrax was
observed as early as 14 days. The fast generation of protective immune response by Ac-Dex based
vaccine provided a promising way fighting against fast progressing diseases. In a later study,
electrospray method was used instead of emulsion to fabricate Ac-Dex particles with PA only or
with both PA and R848.152 Three vaccine formulations were used to immunize the mice: (i) PA

38
absorbed to resiquimod microparticles; (ii) PA and resiquimod encapsulated in separate particles;
and (iii) PA and resiquimod encapsulated in same particle. Both (ii) and (iii) induced high IgG1
and IgG2a titers on day 42 after immunization similar to or higher than Anthrax Vaccine Adsorbed,
the current anthrax vaccine. The in vivo study showed that (ii) was the best vaccine, which
protected 50% mice from death during 28-day observation, while mice immunized with (iii) only
had 10% survival. BioThrax group did not survive beyond 13 days. The in vivo study indicated
that delivering PA and adjuvant in separate particles may provide a faster and stronger immune
response towards anthrax. This finding supported the idea that adjuvant and antigen should be
encapsulated in separate Ac-Dex particles optimized for each component with different CAC
percentages.138
Ac-Dex was used as carrier for a Burkholderia pseudomallei subunit vaccine and showed the
ability to generate immune responses within a short time period.153 The antigen B. pseudomallei
lysate and an adjuvant R848 were encapsulated in separate Ac-Dex particles. The rapid
immunization schedule (two injections on day 0 and 7) slowed down the death progress during 26-
day observation when mice were challenged on day 14 with a lethal dose B. pseudomallei. 12% of
the immunized mice survived the challenge on day 26 while most mice in control groups died
within 2 days of challenge and none survived beyond 20 days. The vaccinated group had higher
antibody titers, stronger cytokine secretion (IL-4, IL-5, IL-17A, IL-12, IFN-γ, GM-CSF and TNF-
α) and more cytotoxic T cells compared to the control group receiving PBS only.

39
The Ting lab applied the cGAMP encapsulated Ac-Dex with soluble hemagglutinin (HA)
protein from H1N1 influenza virus for anti-influenza vaccination.143 A strong Th1-biased antibody
response was observed in cGAMP Ac-Dex + HA group, while Alum + HA only induced weak
Th2-biased antibody response. The cGAMP Ac-Dex + HA protected 12 out of 13 mice from H1N1
influenza challenge, while >90% of untreated mice and >75% of mice immunized with free HA
only were killed during the challenge. The neutralizing antibodies generated by cGAMP Ac-Dex
+ HA remained detectable in mouse sera for more than 4 months after immunization and protected
the mice from a lethal dose of H1N1 influenza virus challenge 7 months after immunization. The
Bachelder lab investigated the co-administration of cGAMP Ac-Dex and the ectodomain of matrix
protein 2 (M2e) encapsulated Ac-Dex particles as an anti-influenza vaccine.154 The M2e and
cGAMP were encapsulated in separate Ac-Dex particles with different percentage of CAC. In
contrast to the delivery of OVA antigen where a high antibody titer was observed in Ac-Dex
particles with low CAC (20%),138 it was observed that the M2e Ac-Dex with high CAC (60%)
induced higher antibody titers compared to M2e Ac-Dex with lower CAC (40% and 20%). The
cGAMP encapsulated Ac-Dex particles with different CAC (20%, 40% or 60%) did not
significantly change the antibody titers. The M2e and cGAMP encapsulated in separate Ac-Dex
particles (60% CAC) induced significantly higher antibody titers compared to the co-encapsulation
of M2e and cGAMP in same Ac-Dex (60% CAC). Besides the antibody titer, significantly higher
levels of IFN-γ, IL-2 and IL-6 secretion were detected in mice immunized with M2e Ac-Dex (40%

40
or 60% CAC) + cGAMP Ac-Dex (60% CAC), which suggested a successful generation of cellular
immunity. Both vaccines, M2e Ac-Dex (40%) + cGAMP Ac-Dex (60%) and M2e Ac-Dex (60%)
+ cGAMP Ac-Dex (60%) showed significant improvement of survival during a lethal dose
influenza challenge in mice.
The studies discussed so far relied on passive uptake of the Ac-Dex particles by immune cells.
The Fréchet group studied mannosylated Ac-Dex particles for immunomodulation through
mannose targeting.155 “Click-able” Ac-Dex was obtained by partially modifying the hydroxyl
groups on dextran backbone with an azido-triethylene glycol linker followed by acetalation.
Microparticles were then prepared through the emulsion method with subsequent surface
mannosylation using the CuAAC reaction. These particles (referred to as Man-Ac-Dex) with high
density mannose on the surface (up to 106/particle) had high binding avidity to mannose receptors
on DC surface. Man-Ac-Dex showed 1.5-2 fold increase of DC uptake and about 5 fold increase
of MHC I presentation on DCs compared to Gal-Ac-Dex, azido-Ac-Dex or Ac-Dex particles,
suggesting more potent immune activation. However, no in vivo study was performed with
particles.
1.6.2 Reducible dextran nanogel
Besides acetalated dextran, reducible dextran nanogel is another type of modified dextran,
which has been developed for antigen delivery to DCs.156-157 A cationic dextran nanogel has been
fabricated by inverse mini-emulsion photo-polymerization with methacrylated dextran, a

41
methacrylamide functionalized disulfide linker, and a positively charged methacrylate monomer.
The nanogel was then covalently conjugated with a model antigen OVA through a disulfide linker
(Scheme 1.6). The confocal microscopy indicated the OVA conjugated nanogel enhanced the
uptake by D1 cells compared to non-covalently loaded OVA-nanogel, free OVA or empty nanogel.
The OVA-conjugated nanogel combined with poly I:C significantly slowed down the growth of
B16-OVA tumor expressing OVA antigen in a mouse tumor model compared to free OVA, non-
covalent OVA-nanogel.157 A preventive antitumor model was studied by immunizing C57BL/6
mice on days 0 and 14 with different vaccine formula followed by tumor challenge on day 28 with
B16-OVA cells. All PBS or empty nanogel treated mice died within 20 days after tumor cell
injection. Only 30% of the mice in non-covalent OVA-nanogel group were tumor-free on day 52,
while 90% of mice immunized with OVA-conjugated nanogel+poly I:C remained tumor free.
OVA-conjugated nanogel+poly I:C induced highest percentage of OVA specific CD8+ T cell and
OVA specific IgG titers. In addition to the preventive model, the efficacy of the vaccine was
investigated in a therapeutic model. Mice were injected with B16-OVA on day 0, which was
followed by two immunizations on days 6 and 16. While all other groups developed fast-growing
tumor and died within 35 days, the OVA-conjugated nanogel+poly I:C significantly slowed the
tumor growth and prolonged the survival.

42
Scheme 1.6 Synthesis of OVA-loaded reducible dextran nanogel.
These two studies showed the reducible nanogel carrier can enhance DC activation in vitro
and generate significant preventive and curative effects against tumor in vivo. It was found that the
OVA-loaded nanogel exhibited cytotoxicity at high concentrations, which may require more
chemical modifications to improve biocompatibility.156 For example, the percentage of the cationic
monomer may be lowered to reduce the level of positive surface potential to decrease cytotoxicity.
1.6.3 Oxidation sensitive dextran
Reactive oxygen species are heavily produced in the phagosomes of APCs, which are crucial
for initiating immune responses.158-159 It has been reported that the most effective APCs, DCs, may

43
have phagosomes with H2O2 concentration up to 1mM.160 Therefore oxidation sensitive dextran
was investigated as a vaccine carrier candidate.161 Free hydroxyl groups on dextran were modified
with arylboronic ester resulting in Oxi-Dex (Scheme 1.7). 100-200 nm sized particles were
prepared via the standard emulsion method. The resulting particles were stable in PBS buffer but
decomposed in 1 mM H2O2 with a half-life of 36 min. The OVA encapsulated Oxi-Dex induced a
27-fold increase of OVA presentation in DC 2.4 cells compared to OVA encapsulated PLGA
particles, while free OVA did not get presented. However, this Oxi-Dex was not further studied
after this report.
Scheme 1.7 Synthesis of oxidation sensitive dextran.
1.6.4 pH sensitive amphiphilic galactosyl-dextran-retinal conjugates (GDR)
The galactosyl-dextran-retinal (GDR) conjugates is a pH sensitive amphiphilic material
reported by the Ma group.162 All-trans retinal, the precursor of retinoic acid (active metabolite of
Vitamin A), was first conjugated to dextran through a pH-responsive hydrazone bond then further
44
modified with ethylenediamine following reaction with NHS activated lactobionic acid to obtain
the GDR conjugate. GDR was amphiphilic, which spontaneously self-assembled into nanogel with
size around 115nm and zeta-potential around 27mV. At pH=7.4, the GDR was relatively stable
with less than 10% of retinal release within 48h. However, the hydrazone bond in GDR conjugate
could be rapidly cleaved at pH 5.0 resulting in over 50% retinal release within 24h, which could
serve as an adjuvant. GDR nanogel induced BMDC maturation in vitro while free retinal failed to
do so. OVA-loaded GDR nanogel enhanced both MHC I and MHC II antigen presentation on
BMDCs. The release of retinal from GDR nanogel significantly elevated the reactive oxygen
species (ROS) generation in BMDCs by 2-3 folds relative to free all-trans retinal within 4 h due to
lysosomal disruption, and the resulting ROS significantly enhanced proteasome activity in
BMDCs. In a B16-OVA tumor model, the OVA-GDR nanogel vaccine suppressed tumor growth
and prolonged mouse survival compared to free OVA, free OVA+retinal and PBS groups. OVA-
GDR nanogel induced robust CD8+ T cell proliferation as well as high levels of IFN-γ production
and lysis of tumor cells.
1.7 β-Glucans
β-Glucans are β-1,3-linked glucose polymers with β-1,6 branches. β-Glucans can be isolated
from fungal cell wall, bacteria, seaweed, cereal, etc. Depending on the source, the polysaccharides
may have varied primary, secondary or tertiary structures, or physical properties. Though
heterogeneous, these polysaccharides can induce similar immune responses and therefore usually

45
termed as a common name “β-glucans”.163 The major β-glucan receptors in mammals are dectin-
1, and complement receptor 3 (CR3, CD11b/CD18).164 It has been reported that the stimulation
via dectin-1 primes Th1, Th17 and cytotoxic T lymphocyte responses.164-166 With their immune
stimulating properties, β-glucans have been studied in vaccine design with an established record
of safety in both preclinical and human trials.163, 167-168 As a major component of fungal cell wall,
β-glucans has been widely used as antigens for generating anti-glucan antibodies against fungal
infections.169-171 In this section, we focus on examples applying β-glucans as vaccine carriers and
built-in adjuvants.
1.7.1 β-Glucan particles
β-Glucan particles (GPs) are the most studied vaccine carriers in the β-glucan family. They
were developed in 1980s but only widely used as vaccine carriers in recent years.24, 172-173 GPs are
highly purified, hollow porous cell wall shells with 2-4 μm sizes. GPs can be derived from baker’s
yeast through a series of hot alkali and organic extractions.174-175 It contains primarily 1,3-β-
glucans along with small amounts of β-1,6-glucans and chitin.164 GPs can be recognized by dectin-
1 and upregulate cell surface presentation of MHC molecules and co-stimulation molecules as well
as inducing the production of inflammatory cytokines.176-178 The hollow GPs have been studied as
carriers for proteins, DNA, siRNA and other small molecules.179-184
Antigens can be non-covalently trapped inside GPs with the addition of polymers such as yeast
tRNA, alginate-calcium or alginate-calcium-chitosan mixture. The Levitz group used tRNA to trap

46
OVA protein inside GPs.181 These GPs were efficiently taken up and proteolyzed by DCs to induce
DC maturation. Significant T cell proliferation was observed when incubated with GP-OVA at
concentrations starting from 0.03 μg OVA /ml, while the free OVA protein needed 100 times
higher concentration to reach similar stimulation levels. The CD4+ T cells isolated from GP-OVA
immunized mice secreted significantly higher amounts of pro-inflammatory cytokines such as IL-
4, IL-17 and IFN-γ compared to Alum/OVA immunized mice. For antibody responses, the GP-
OVA vaccine successfully induced Th1 skewing antibody subtype IgG2c, while the Alum/OVA
induced only IgG1 responses. The long-term immune responses were monitored 18-20 months
after the last immunization.185 The CD4+ T cells isolated from immunized mice resumed cytokine
secretion upon ex vivo OVA stimulation, and the serum antibody titer remained detectable. Notably,
the encapsulation of OVA in GPs was found important, as the admixture of OVA and GPs was not
as effective in inducing CD4+ T cell cytokine secretion and antibody responses.185 The Levitz
group also studied polymers such as alginate-calcium (AC) or alginate-calcium-chitosan (ACC)
mixture for trapping antigens in GPs.185 The AC and ACC trapped GP-OVA showed comparable
capacities to induce antigen-specific T cell responses and antibody responses in mice as the tRNA
trapped GP-OVA. Other antigens such as BSA,186 FedF,187 could also be trapped inside GPs as
vaccine candidates.
Antigens can be loaded into GPs through covalent coupling. The Hunter group covalently
conjugated antigen BSA to GPs through amide bonds.188 The BSA-GP conjugates were

47
phagocytized by macrophages and both intradermal and oral administration of BSA-GP vaccine
induced immune responses against BSA. OVA-GP conjugates were synthesized similarly, which
induced strong BMDC, CD4+ and CD8+ T cells activation in vitro.189 The Hong group prepared
OVA loaded GPs in organic phase, which reduced GP aggregation compared to aqueous phase
conjugation, and provided more homogenous OVA-GPs.190 With this novel conjugation method,
the GPs were first dispersed in cyclohexane/Igepal CO-520 (85:15) solution followed by the
addition of aqueous solution containing the OVA antigen and glutaraldehyde cross-linker
sequentially. The hydrophilic antigen and cross-linker would be slowly soaked into GP cavity due
to the hydrophilic environment of the glucans and the conjugation primarily took place inside the
GP cores rather than on the exterior of the GPs, which may cause cross-linking between particles
and lead to aggregation. The resulting OVA-GPs successfully induced BMDC maturation and T
cell proliferation in vitro and stimulated B cell activation and germinal center formation in vivo.
High anti-OVA IgG2c titers were detected after only one immunization with the OVA-GP vaccine,
which indicated a strong Th1 biased immune response. The OVA-GPs successfully induced
antigen-specific CD8+ T cell response in vivo and provided significant protection against tumor
development to EG.7-OVA tumor bearing mice.
An interesting property of GPs is that they can be administered orally. GPs can be taken up
by human intestinal epithelial cells and induce the secretion of chemokines and the expression of
pattern recognition receptors and costimulatory molecules.186 The GP-OVA complex can be
48
delivered by M cells to mucosal lymphoid tissues and induce the proliferation of OVA specific
CD4+ T cells when given orally to mice. Surface functionalization of an immunoglobulin-binding
protein G followed by the anti-aminopeptidase N (APN, an intestinal epithelial receptor) antibody
on GPs can further enhance the passage of particles through the epithelial barrier.191 Compared to
isotype antibody conjugated GPs, the anti-APN GPs were internalized 10 times more by intestinal
epithelial cell line IPEC-J2 at a 16-fold lower concentration. In vivo study showed that orally
administrated anti-APN-coated, FedF-loaded GPs induced significantly higher titers of antibodies
compared to non-targeting FedF loaded GPs.
1.7.2 β-Glucan-antigen complex
A β-glucan member, schizophyllan (SPG), contains a β-1,3-glucan main chain with β-1,6-
glycosyl side chain every three glucose residues. It can form stoichiometric complexes with
specific homonucleiotides such as poly(C) or poly (dA) via a combination of hydrogen bonding
and hydrophobic interactions (Scheme 1.8).192-194 Unlike β-glucan particles, these SPG complexes
are nano-rod shaped with diameters around 10-20 nm.195 The complex includes two SPG chains
and one polynucleiotide chain forming a triple helix through interactions between two main-chain
glucoses and one base, and the stability of complex depends on the length of polynucleotide.193-194
The complex can be recognized by dectin-1 receptor inducing immune responses,196-197 and
therefore have been studied as vaccine adjuvants.

49
A complex of SPG with CpG-dA40, a short single stranded DNA fragment with CpG motif
and a 40-mer poly(dA) tail, has shown strong immune activating effects due to the combination
delivery of immunocytes targeting SPG and immuno-stimulative CpG.195, 198-199 This complex can
induce antigen-presenting cell activation as well as Th1 and CD8+ T cell responses.195, 200-201
Intravenous injection of CpG-SPG complex suppressed tumor growth more efficiently than SPG,
CpG or mixture of SPG and CpG on several tumor models.202 The CpG-SPG complex could be
cross-linked to form nanogels with a larger size (~150 nm) by mixing CpG-SPG and its
complementary sequence,195, 203 which may further improve the delivery efficiency toward
immune cells due to the size effect.204 Compared to CpG-SPG complex, the cross-linked CpG-
SPG nanogel induced significantly higher IL-6 secretion in mice splenocytes in vitro.195 The
fluorescence microscopy imaging indicated a 10 times higher uptake of the cross-linked CpG-SPG
nanogel than CpG-SPG complex by macrophages.203 The CpG-SPG nanogel induced more antigen
specific CD8+ T cells in vivo compared to CpG-SPG complex when co-administrated with OVA
antigen. The nanogel immunization significantly slowed down EG7 tumor growth and prolonged
survival in mice compared to free CpG or CpG-SPG complex.203
Besides CpG, peptide antigens can be conjugated with poly(dA) for preparing SPG-antigen
complexes. The Sakurai group reported an OVA-SPG complex prepared with OVA peptide-
poly(dA) conjugate and SPG.205-206 It was observed that the conjugation strategy could influence
the immune cell processing of the OVA-SPA complex.206 OVA-poly(dA) conjugated through a
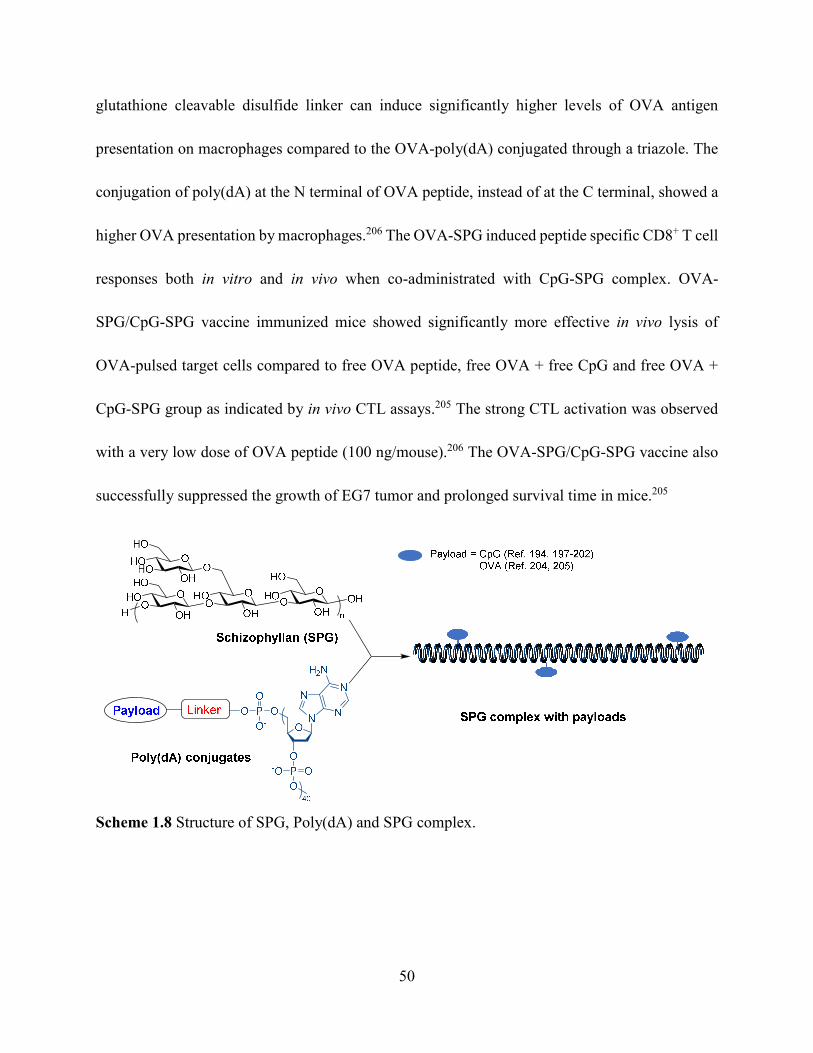
50
glutathione cleavable disulfide linker can induce significantly higher levels of OVA antigen
presentation on macrophages compared to the OVA-poly(dA) conjugated through a triazole. The
conjugation of poly(dA) at the N terminal of OVA peptide, instead of at the C terminal, showed a
higher OVA presentation by macrophages.206 The OVA-SPG induced peptide specific CD8+ T cell
responses both in vitro and in vivo when co-administrated with CpG-SPG complex. OVA-
SPG/CpG-SPG vaccine immunized mice showed significantly more effective in vivo lysis of
OVA-pulsed target cells compared to free OVA peptide, free OVA + free CpG and free OVA +
CpG-SPG group as indicated by in vivo CTL assays.205 The strong CTL activation was observed
with a very low dose of OVA peptide (100 ng/mouse).206 The OVA-SPG/CpG-SPG vaccine also
successfully suppressed the growth of EG7 tumor and prolonged survival time in mice.205
Scheme 1.8 Structure of SPG, Poly(dA) and SPG complex.
51
1.7.3 β-Glucan based nanoparticles for vaccine delivery
Beside the large-sized GPs and rod-shaped SPG complexes, β-glucan nanoparticles were
investigated for vaccine delivery. The Dong group developed a synthetic MUC1 vaccine by
conjugating MUC1 peptide with a β-glucan chain.207 The resulting MUC1-β-glucan material
formed homogenous nanoparticles sized 150 nm due to hydrophobic interactions. This MUC1-β-
glucan nanoparticle induced significantly higher serum antibody titers and IFN-γ and IL-6
cytokines. The Zhang lab prepared β-glucan nanoparticles based vaccines by mixing positively
charged aminated β-glucan with negatively charged CpG adjuvant and OVA protein antigen.208
The combination of dectin-1 activating β-glucan and TLR-9 activating CpG in one nanoparticle
showed synergistic effects in inducing both strong humoral and cellular immune responses.
The Kono lab reported a set of β-glucan based pH sensitive materials for cytoplasmic delivery
of antigen.209 Curdlan, a kind of β-glucan, was modified with methyl glutaric acid (MGlu) to
generate a pH responsive polysaccharide MGlu-Curd. Using a similar strategy, pH responsive 3-
methyl glutaryl mannan (MGlu-Man) and 3-methyl glutaryl dextran (MGlu-Dex) were prepared.
1-Aminodecane was then conjugated to these polysaccharides to anchor these pH responsive
polysaccharide chains onto membranes of OVA-loaded liposomes. All three types of liposomes
with different polysaccharides induced the release of cargo from liposome at around pH 5. The
polysaccharide backbone played an important role for obtaining liposomes with high affinity to
DC cells. Compared to MGlu-Man and MGlu-Dex coated liposomes, the liposome containing
52
MGlu-Curd with 59 MGlu groups per chain (MGlu59-Curd), induced the highest DC uptake of the
liposomes. The percentage of MGlu modification also influenced the immune activation. In
general, curdlan with higher percentage of MGlu content (MGlu71-Curd and MGlu59-Curd)
induced higher pro-inflammatory cytokines such as TNF-α and IL-12 in DC2.4 cells compared to
those with lower MGlu content (MGlu41-Curd and MGlu21-Curd). Compared to MGlu-Man and
MGlu-Dex, MGlu59-Curd elicited more IFN-γ and higher cell-mediated cytotoxicity in splenocytes
isolated from OVA-immunized mice in vitro. The tumor challenge study showed that mice
immunized with MGlu59-Curd had the smallest tumor size and longest survival time highlighting
the advantage of the curdlan backbone.
1.8 Conclusions and future outlooks
In summary, we have reviewed recent advances in vaccine development applying
carbohydrates as adjuvants and/or vaccine carriers. With their biocompatibility, ease for
modification, and the ability to interact with the immune system through multiple mechanisms,
carbohydrates provide a great variety of choices to meet the various needs for vaccine studies.
Carbohydrates can be modified through multiple methods such as amide or ester formation,
CuAAC reaction, oxidation of sugar rings followed by imine or oxime formation, which make
them flexible for various applications in vaccine designs. For example, the controlled release of
the antigen and adjuvant from the vaccine carrier is important for immune activation. A desired
carrier should not release their cargos before entering immune tissues, and should not release too

53
slow after encountering immune cells, which may fail to produce enough immune stimulation
resulting in tolerance.210-211
The optimal deliveries of antigens and adjuvants can be different, and the carriers may need
to be optimized separately.138, 154 By controlling the reaction time during the acetalation of dextran,
a carbohydrate-based vaccine carrier with fine-tuned releasing profile can be achieved, which can
serve as a great platform for vaccine optimization. Antigen-MPLA and antigen-α-GalCer
conjugates can be easily combined with other well-studied lipid molecules to form liposomal
vaccines. Taking advantage of the well-developed strategies for liposome preparation,212-213
carriers with controlled size and surface charges, another two important factors for immune
targeting,214-215 can be obtained.
Notably, although there are many examples showing that successful carbohydrate conjugate-
based vaccines can be achieved through multiple chemistry reactions and linker structures, the
small structure alteration of carbohydrate backbones due to the conjugation may significantly
influence the final immune outcomes. The carbohydrates often contain more than one position
available for chemical modification. When designing carbohydrate vaccines, the conjugation site
should be carefully chosen in order to obtain optimal immune recognition. As an example, the
antigen-MPLA conjugates through 6’-position, where the polysaccharide chain is attached to the
natural LPS, were superior in generating IgG responses compared to the antigen-MPLA conjugates
that using 1-O-position as the conjugation site,61 while the blockade of the phosphate group on

54
MPLA completely suppressed the ability for immune activation.56 The linkers between the payload
and the carbohydrate backbones also played important roles in immune tuning. For example, the
oxidative conjugation of mannan and MUC1 FP through imine linkers induced Th1 type immune
response and successfully protected mice from tumor growth, while reductive conjugation through
amines induced Th2 type immune response without successful tumor protection.82 Interestingly,
there are examples using the trace amount of mannoproteins (~5% in mannan) for allergen
conjugation as allergic vaccines.98-99 This strategy, taking advantage of other components in
polysaccharide mixtures for chemical conjugation, can maintain the intact carbohydrate structure,
which may reduce the chance of disturbing the immune activation function. However, the
disadvantage of this strategy might be the difficulty in quality control. The protein components
may vary batch-to-batch, which may influence the conjugation efficiency, the physical and
biological properties of the final materials. A recent review has summarized chemistry methods
for site-selective glycoconjugate synthesis, which provided multiple options for glycoconjugate
vaccine development.216
An attractive strategy for future vaccine design can be the combination of different adjuvants
that activates the immune system through different receptors. Adjuvants are playing crucial roles
in vaccine design, and there have been examples indicating that combining adjuvants with different
immune activating mechanisms can trigger additive effects and enhance the vaccine efficacy.149-
150 However, cautions need to be taken in combining other adjuvants with the “self-adjuvating”

55
carbohydrates. There are examples indicating the additional adjuvants have negative effects in
MPLA and mannan based vaccine conjugates.55-59, 99-100 Therefore, the external adjuvant needs to
be carefully selected. Understanding the detailed mechanism of how multiple adjuvants
collaborate with each other can guide future vaccine designs

56
REFERENCES

57
REFERENCES
1. Lang, S.; Huang, X., Carbohydrate Conjugates in Vaccine Developments. Frontiers in
Chemistry 2020, 8, 284.
2. Mahla, R.; Reddy, C.; Prasad, D.; Kumar, H., Sweeten PAMPs: Role of Sugar Complexed
PAMPs in Innate Immunity and Vaccine Biology. Front. Immunol. 2013, 4, 248.
3. Rabinovich, G. A.; Kooyk, Y. v.; Cobb, B. A., Glycobiology of Immune Responses. Ann. N.
Y. Acad. Sci. 2012, 1253, 1-15.
4. Varki, A., Biological Roles of Glycans. Glycobiology 2016, 27, 3-49.
5. Lesinski, G. B.; Westerink, J., Vaccines Against Polysaccharide Antigens. Curr. Drug Targets
Infect. Disord. 2001, 1, 325-334.
6. Astronomo, R. D.; Burton, D. R., Carbohydrate Vaccines: Developing Sweet Solutions to
Sticky Situations? Nature Reviews Drug Discovery 2010, 9, 308-324.
7. Roy, R., New Trends in Carbohydrate-based Vaccines. Drug Discovery Today: Technol. 2004,
1, 327-336.
8. Feng, D.; Shaikh, A. S.; Wang, F., Recent Advance in Tumor-associated Carbohydrate
Antigens (TACAs)-based Antitumor Vaccines. ACS Chem. Biol. 2016, 11, 850-863.
9. Guo, Z.; Wang, Q., Recent Development in Carbohydrate-based Cancer Vaccines. Curr. Opin.
Chem. Biol. 2009, 13, 608-617.
10. Yin, Z.; Huang, X., Recent Development in Carbohydrate Based Anticancer Vaccines. J.
Carbohydr. Chem. 2012, 31, 143-186.
11. Hu, X.; Liu, R.; Zhu, N., Enhancement of Humoral and Cellular Immune Responses by
Monophosphoryl Lipid A (MPLA) as an Adjuvant to the Rabies Vaccine in BALB/c Mice.
Immunobiology 2013, 218, 1524-1528.
12. Suzuki, Y.; Adachi, Y.; Ohno, N.; Yadomae, T., Th1/Th2-balancing Immunomodulating
Activity of Gel-forming (1→ 3)-β-Glucans from Fungi. Biol. Pharm. Bull. 2001, 24, 811-819.

58
13. Petrovsky, N.; Cooper, P. D., Carbohydrate-based Immune Adjuvants. Expert Rev. Vaccines
2011, 10, 523-537.
14. Stambas, J.; Pietersz, G.; McKenzie, I.; Nagabhushanam, V.; Cheers, C., Oxidised Mannan-
listeriolysin O Conjugates Induce Th1/Th2 Cytokine Responses After Intranasal Immunisation.
Vaccine 2002, 20, 1877-1886.
15. Hu, J.; Qiu, L.; Wang, X.; Zou, X.; Lu, M.; Yin, J., Carbohydrate-based Vaccine Adjuvants –
Discovery and Development. Expert Opin. Drug Discovery 2015, 10, 1133-1144.
16. Li, P.; Wang, F., Polysaccharides: Candidates of Promising Vaccine Adjuvants. Drug
Discoveries Ther. 2015, 9, 88-93.
17. Cordeiro, A. S.; Alonso, M. J.; de la Fuente, M., Nanoengineering of Vaccines Using Natural
Polysaccharides. Biotechnol. Adv. 2015, 33, 1279-1293.
18. Correia-Pinto, J. F.; Csaba, N.; Alonso, M. J., Vaccine Delivery Carriers: Insights and Future
Perspectives. Int. J. Pharm. 2013, 440, 27-38.
19. Liu, Z.; Jiao, Y.; Wang, Y.; Zhou, C.; Zhang, Z., Polysaccharides-based Nanoparticles as Drug
Delivery Systems. Adv. Drug Delivery Rev. 2008, 60, 1650-1662.
20. Pushpamalar, J.; Veeramachineni, A. K.; Owh, C.; Loh, X. J., Biodegradable Polysaccharides
for Controlled Drug Delivery. ChemPlusChem 2016, 81, 504-514.
21. Zhang, N.; Wardwell, P.; Bader, R., Polysaccharide-based Micelles for Drug Delivery.
Pharmaceutics 2013, 5, 329-352.
22. Arca, H. Ç.; Günbeyaz, M.; Şenel, S., Chitosan-based Systems for the Delivery of Vaccine
Antigens. Expert Rev. Vaccines 2009, 8, 937-953.
23. Mata-Haro, V.; Cekic, C.; Martin, M.; Chilton, P. M.; Casella, C. R.; Mitchell, T. C., The
Vaccine Adjuvant Monophosphoryl Lipid A as a TRIF-biased Agonist of TLR4. Science 2007,
316, 1628-1632.
24. Mirza, Z.; Soto, E. R.; Dikengil, F.; Levitz, S. M.; Ostroff, G. R., Beta-Glucan Particles as
Vaccine Adjuvant Carriers. In Vaccines for Invasive Fungal Infections, Springer: 2017; pp 143-
157.
59
25. Liu, H.; Irvine, D. J., Guiding Principles in the Design of Molecular Bioconjugates for Vaccine
Applications. Bioconjugate Chem. 2015, 26, 791-801.
26. Colombo, C.; Pitirollo, O.; Lay, L., Recent Advances in the Synthesis of Glycoconjugates for
Vaccine Development. Molecules 2018, 23, 1712.
27. Jin, K.-T.; Lan, H.-R.; Chen, X.-Y.; Wang, S.-B.; Ying, X.-J.; Lin, Y.; Mou, X.-Z., Recent
Advances in Carbohydrate-based Cancer Vaccines. Biotechnol. Lett. 2019, 41, 641-650.
28. Marzabadi, C. H.; Franck, R. W., Small-Molecule Carbohydrate-Based Immunostimulants.
Chem. Eur. J. 2017, 23, 1728-1742.
29. Micoli, F.; Del Bino, L.; Alfini, R.; Carboni, F.; Romano, M. R.; Adamo, R., Glycoconjugate
Vaccines: Current Approaches Towards Faster Vaccine Design. Expert Rev. Vaccines 2019, 18,
881-895.
30. Wei, M.-M.; Wang, Y.-S.; Ye, X.-S., Carbohydrate-based Vaccines for Oncotherapy. Med.
Res. Rev. 2018, 38, 1003-1026.
31. Weyant, K. B.; Mills, D. C.; DeLisa, M. P., Engineering a New Generation of Carbohydrate-
Based Vaccines. Curr. Opin. Chem. Eng. 2018, 19, 77-85.
32. Stein, K. E., Thymus-Independent and Thymus-Dependent Responses to Polysaccharide
Antigens. J. Infect. Dis. 1992, 165, S49-S52.
33. Abbas, A. K.; Lichtman, A.; Pober, J., Congenital and Acquired Immunodeficiencies. In Clin.
Exp. Immunol., 2000; pp 463-488.
34. Kalka-Moll, W. M.; Tzianabos, A. O.; Bryant, P. W.; Niemeyer, M.; Ploegh, H. L.; Kasper,
D. L., Zwitterionic Polysaccharides Stimulate T Cells by MHC Class II-Dependent Interactions.
J. Immunol. 2002, 169, 6149-6153.
35. Mazmanian, S. K.; Kasper, D. L., The Love–hate Relationship Between Bacterial
Polysaccharides and the Host Immune System. Nat. Rev. Immunol. 2006, 6, 849-858.
36. Cobb, B. A.; Kasper, D. L., Microreview: Zwitterionic Capsular Polysaccharides: the New
MHCII-dependent Antigens. Cell. Microbiol. 2005, 7, 1398-1403.
60
37. Nishat, S.; Andreana, P. R., Entirely Carbohydrate-Based Vaccines: An Emerging Field for
Specific and Selective Immune Responses. Vaccines (Basel) 2016, 4, 19.
38. Surana, N. K.; Kasper, D. L., The Yin Yang of Bacterial Polysaccharides: Lessons Learned
from B. fragilis PSA. Immunol Rev 2012, 245, 13-26.
39. Heimburg-Molinaro, J.; Lum, M.; Vijay, G.; Jain, M.; Almogren, A.; Rittenhouse-Olson, K.,
Cancer Vaccines and Carbohydrate Epitopes. Vaccine 2011, 29, 8802-8826.
40. Kaltgrad, E.; Sen Gupta, S.; Punna, S.; Huang, C.-Y.; Chang, A.; Wong, C.-H.; Finn, M. G.;
Blixt, O., Anti-Carbohydrate Antibodies Elicited by Polyvalent Display on a Viral Scaffold.
ChemBioChem 2007, 8, 1455-1462.
41. Wu, X.; McKay, C.; Pett, C.; Yu, J.; Schorlemer, M.; Ramadan, S.; Lang, S.; Behren, S.;
Westerlind, U.; Finn, M. G.; Huang, X., Synthesis and Immunological Evaluation of Disaccharide
Bearing MUC-1 Glycopeptide Conjugates with Virus-like Particles. ACS Chem. Biol. 2019, 14,
2176-2184.
42. Wu, X.; Yin, Z.; McKay, C.; Pett, C.; Yu, J.; Schorlemer, M.; Gohl, T.; Sungsuwan, S.;
Ramadan, S.; Baniel, C.; Allmon, A.; Das, R.; Westerlind, U.; Finn, M. G.; Huang, X., Protective
Epitope Discovery and Design of MUC1-based Vaccine for Effective Tumor Protections in
Immunotolerant Mice. J. Am. Chem. Soc. 2018, 140, 16596-16609.
43. Leclerc, C.; Schutze, M. P.; Deriaud, E.; Przewlocki, G., The in vivo Elimination of CD4+ T
cells Prevents the Induction but not the Expression of Carrier-induced Epitopic Suppression. J.
Immunol. 1990, 145, 1343-1349.
44. Dasgupta, S.; Erturk-Hasdemir, D.; Ochoa-Reparaz, J.; Reinecker, H.-C.; Kasper, D. L.,
Plasmacytoid Dendritic Cells Mediate Anti-inflammatory Responses to a Gut Commensal
Molecule via Both Innate and Adaptive Mechanisms. Cell Host Microbe 2014, 15, 413-423.
45. De Silva, R. A.; Wang, Q.; Chidley, T.; Appulage, D. K.; Andreana, P. R., Immunological
Response from an Entirely Carbohydrate Antigen: Design of Synthetic Vaccines Based on Tn−PS
A1 Conjugates. J. Am. Chem. Soc. 2009, 131, 9622-9623.
46. De Silva, R. A.; Appulage, D. K.; Pietraszkiewicz, H.; Bobbitt, K. R.; Media, J.; Shaw, J.;
Valeriote, F. A.; Andreana, P. R., The Entirely Carbohydrate Immunogen Tn-PS A1 Induces a
Cancer Cell Selective Immune Response and Cytokine IL-17. Cancer Immunol. Immunother. 2012,
61, 581-585.
61
47. Shi, M.; Kleski, K. A.; Trabbic, K. R.; Bourgault, J.-P.; Andreana, P. R., Sialyl-Tn
Polysaccharide A1 as an Entirely Carbohydrate Immunogen: Synthesis and Immunological
Evaluation. J. Am. Chem. Soc. 2016, 138, 14264-14272.
48. Trabbic, K. R.; Bourgault, J.-P.; Shi, M.; Clark, M.; Andreana, P. R., Immunological
Evaluation of the Entirely Carbohydrate-based Thomsen-Friedenreich – PS B Conjugate. Org.
Biomol. Chem. 2016, 14, 3350-3355.
49. Casella, C. R.; Mitchell, T. C., Putting Endotoxin to Work for Us: Monophosphoryl Lipid A
as a Safe and Effective Vaccine Adjuvant. Cell. Mol. Life. Sci. 2008, 65, 3231-3240.
50. Qureshi, N.; Takayama, K.; Ribi, E., Purification and Structural Determination of Nontoxic
Lipid A Obtained from the Lipopolysaccharide of Salmonella Typhimurium. J. Biol. Chem. 1982,
257, 11808-11815.
51. Ribi, E.; Parker, R.; Strain, S. M.; Mizuno, Y.; Nowotny, A.; Von Eschen, K. B.; Cantrell, J.
L.; McLaughlin, C. A.; Hwang, K. M.; Goren, M. B., Peptides as Requirement for Immunotherapy
of the Guinea-pig Line-10 Tumor with Endotoxins. Cancer Immunol. Immunother. 1979, 7, 43-58.
52. Evans, J. T.; Cluff, C. W.; Johnson, D. A.; Lacy, M. J.; Persing, D. H.; Baldridge, J. R.,
Enhancement of Antigen-specific Immunity via the TLR4 Ligands MPL™ Adjuvant and Ribi.529.
Expert Rev. Vaccines 2003, 2, 219-229.
53. Artiaga, B. L.; Yang, G.; Hackmann, T. J.; Liu, Q.; Richt, J. A.; Salek-Ardakani, S.; Castleman,
W. L.; Lednicky, J. A.; Driver, J. P., α-Galactosylceramide Protects Swine Against Influenza
Infection when Administered as a Vaccine Adjuvant. Sci Rep 2016, 6, 23593.
54. Cluff, C. W., Monophosphoryl Lipid A (MPL) as an Adjuvant for Anti-cancer Vaccines:
Clinical Results. In Lipid A in Cancer Therapy, Springer: 2009; pp 111-123.
55. Liao, G.; Zhou, Z.; Suryawanshi, S.; Mondal, M. A.; Guo, Z., Fully Synthetic Self-adjuvanting
α-2, 9-Oligosialic Acid Based Conjugate Vaccines Against Group C Meningitis. ACS Cent. Sci.
2016, 2, 210-218.
56. Wang, Q.; Zhou, Z.; Tang, S.; Guo, Z., Carbohydrate-Monophosphoryl Lipid A Conjugates
are Fully Synthetic Self-adjuvanting Cancer Vaccines Eliciting Robust Immune Responses in the
Mouse. ACS Chem. Biol. 2011, 7, 235-240.

62
57. Wu, J.; Guo, Z., Improving the Antigenicity of STn Antigen by Modification of Its Sialic Acid
Residue for Development of Glycoconjugate Cancer Vaccines. Bioconjugate Chem. 2006, 17,
1537-1544.
58. Zhou, Z.; Liao, G.; Mandal, S. S.; Suryawanshi, S.; Guo, Z., A Fully Synthetic Self-
Adjuvanting Globo H-Based Vaccine Elicited Strong T cell-Mediated Antitumor Immunity. Chem.
Sci. 2015, 6, 7112-7121.
59. Zhou, Z.; Mondal, M.; Liao, G.; Guo, Z., Synthesis and Evaluation of Monophosphoryl Lipid
A Derivatives as Fully Synthetic Self-adjuvanting Glycoconjugate Cancer Vaccine Carriers. Org.
Biomol. Chem. 2014, 12, 3238-3245.
60. Pan, Y.; Chefalo, P.; Nagy, N.; Harding, C.; Guo, Z., Synthesis and Immunological Properties
of N-modified GM3 Antigens as Therapeutic Cancer Vaccines. J. Med. Chem. 2005, 48, 875-883.
61. Wang, L.; Feng, S.; Wang, S.; Li, H.; Guo, Z.; Gu, G., Synthesis and Immunological
Comparison of Differently Linked Lipoarabinomannan Oligosaccharide–Monophosphoryl Lipid
A Conjugates as Antituberculosis Vaccines. J. Org. Chem. 2017, 82, 12085-12096.
62. Moreira, L. R. S.; Filho, E. X. F., An Overview of Mannan Structure and Mannan-degrading
Enzyme Systems. Appl. Microbiol. Biotechnol. 2008, 79, 165-178.
63. Nelson, R. D.; Shibata, N.; Podzorski, R. P.; Herron, M. J., Candida Mannan: Chemistry,
Suppression of Cell-mediated Immunity, and Possible Mechanisms of Action. Clin. Microbiol.
Rev. 1991, 4, 1-19.
64. Tzianabos, A. O., Polysaccharide Immunomodulators as Therapeutic Agents: Structural
Aspects and Biologic Function. Clin. Microbiol. Rev. 2000, 13, 523-533.
65. Cassone, A., Development of Vaccines for Candida albicans: Fighting a Skilled Transformer.
Nat. Rev. Microbiol. 2013, 11, 884-891.
66. Han, Y.; Rhew, K. Y., Comparison of Two Candida Mannan Vaccines: The Role of
Complement in Protection Against Disseminated Candidiasis. Arch. Pharmacal Res. 2012, 35,
2021-2027.
67. Johnson, M. A.; Bundle, D. R., Designing a New Antifungal Glycoconjugate Vaccine. Chem.
Soc. Rev. 2013, 42, 4327-4344.

63
68. Domer, J. E.; Elkins, K.; Prescott, B.; Caldes, G.; Baker, P. J., Separation of
Immunomodulatory Effects of Mannan from Candida albicans into Stimulatory and Suppressive
Components. Cell. Immunol. 1986, 101, 403-414.
69. Wang, Y.; Li, S. P.; Moser, S. A.; Bost, K. L.; Domer, J. E., Cytokine Involvement in
Immunomodulatory Activity Affected by Candida albicans Mannan. Infect. Immun. 1998, 66,
1384-1391.
70. Gadjeva, M.; Takahashi, K.; Thiel, S., Mannan-binding Lectin—A Soluble Pattern
Recognition Molecule. Mol. Immunol. 2004, 41, 113-121.
71. Vasta, G. R.; Quesenberry, M.; Ahmed, H.; O'Leary, N., C-type Lectins and Galectins Mediate
Innate and Adaptive Immune Functions: Their Roles in the Complement Activation Pathway. Dev.
Comp. Immunol. 1999, 23, 401-420.
72. Garner, R. E.; Childress, A. M.; Human, L. G.; Domer, J. E., Characterization of Candida
Albicans Mannan-induced, Mannan-Specific Delayed Hypersensitivity Suppressor Cells. Infect.
Immun. 1990, 58, 2613-2620.
73. Garner, R. E.; Hudson, J. A., Intravenous Injection of Candida-derived Mannan Results in
Elevated Tumor Necrosis Factor alpha Levels in Serum. Infect. Immun. 1996, 64, 4561-4566.
74. Tzianabos, A. O.; Finberg, R. W.; Wang, Y.; Chan, M.; Onderdonk, A. B.; Jennings, H. J.;
Kasper, D. L., T Cells Activated by Zwitterionic Molecules Prevent Abscesses Induced by
Pathogenic Bacteria. J. Biol. Chem. 2000, 275, 6733-6740.
75. Okawa, Y.; Howard, C. R.; Steward, M. W., Production of Anti-peptide Specific Antibody in
Mice Following Immunization with Peptides Conjugated to Mannan. J. Immunol. Methods 1992,
149, 127-131.
76. Podzorski, R. P.; Gray, G. R.; Nelson, R. D., Different Effects of Native Candida albicans
Mannan and Mannan-derived Oligosaccharides on Antigen-stimulated Lymphoproliferation in
vitro. J. Immunol. 1990, 144, 707-716.
77. Gendler, S. J.; Lancaster, C. A.; Taylor-Papadimitriou, J.; Duhig, T.; Peat, N.; Burchell, J.;
Pemberton, L.; Lalani, E. N.; Wilson, D., Molecular Cloning and Expression of Human Tumor-
associated Polymorphic Epithelial Mucin. J. Biol. Chem. 1990, 265, 15286-15293.

64
78. Gendler, S.; Taylor-Papadimitriou, J.; Duhig, T.; Rothbard, J.; Burchell, J., A Highly
Immunogenic Region of a Human Polymorphic Epithelial Mucin Expressed by Carcinomas is
Made up of Tandem Repeats. J. Biol. Chem. 1988, 263, 12820-12823.
79. Hanisch, F.-G.; Uhlenbruck, G.; Peter-Katalinic, J.; Egge, H.; Dabrowski, J.; Dabrowski, U.,
Structures of Neutral O-linked Polylactosaminoglycans on Human Skim Milk Mucins. A Novel
Type of Linearly Extended Poly-N-acetyllactosamine Backbones with Gal beta (1-4) GlcNAc beta
(1-6) Repeating Units. J. Biol. Chem. 1989, 264, 872-883.
80. Apostolopoulos, V.; Xing, P.-X.; McKenzie, I. F. C., Murine Immune Response to Cells
Transfected with Human MUC1: Immunization with Cellular and Synthetic Antigens. Cancer Res.
1994, 54, 5186-5193.
81. Apostolopoulos, V.; Pietersz, G. A.; McKenzie, I. F. C., Cell-mediated Immune Responses to
MUC1 Fusion Protein Coupled to Mannan. Vaccine 1996, 14, 930-938.
82. Apostolopoulos, V.; Pietersz, G. A.; Loveland, B. E.; Sandrin, M. S.; McKenzie, I. F.,
Oxidative/Reductive Conjugation of Mannan to Antigen Selects for T1 or T2 Immune Responses.
Proc. Natl. Acad. Sci. U. S. A. 1995, 92, 10128-10132.
83. Apostolopoulos, V.; Loveland, B. E.; Pietersz, G. A.; McKenzie, I. F., CTL in Mice
Immunized with Human Mucin 1 are MHC-Restricted. J. Immunol. 1995, 155, 5089-5094.
84. Apostolopoulos, V.; Popovski, V.; McKenzie, I. F., Cyclophosphamide Enhances the CTL
Precursor Frequency in Mice Immunized with MUC1-mannan Fusion Protein (M-FP). J.
Immunother. 1998, 21, 109-113.
85. Apostolopoulos, V.; Pietersz, G. A.; Gordon, S.; Martinez‑Pomares, L.; McKenzie, I. F. C.,
Aldehyde‑Mannan Antigen Complexes Target the MHC Class I Antigen‑Presentation Pathway.
Eur. J. Immunol. 2000, 30, 1714-1723.
86. Karanikas, V.; Hwang, L.-A.; Pearson, J.; Ong, C.-S.; Apostolopoulos, V.; Vaughan, H.; Xing,
P.-X.; Jamieson, G.; Pietersz, G.; Tait, B., Antibody and T Cell Responses of Patients with
Adenocarcinoma Immunized with Mannan-MUC1 Fusion Protein. J. Clin. Invest. 1997, 100,
2783-2792.
87. Karanikas, V.; Lodding, J.; Maino, V. C.; McKenzie, I. F. C., Flow Cytometric Measurement
of Intracellular Cytokines Detects Immune Responses in MUC1 Immunotherapy. Clin. Cancer
Res. 2000, 6, 829-837.

65
88. Karanikas, V.; Thynne, G.; Mitchell, P.; Ong, C.-S.; Gunawardana, D.; Blum, R.; Pearson, J.;
Lodding, J.; Pietersz, G.; Broadbent, R., Mannan Mucin-1 Peptide Immunization: Influence of
Cyclophosphamide and the Route of Injection. J. Immunother. 2001, 24, 172-183.
89. Apostolopoulos, V.; Pietersz, G. A.; Tsibanis, A.; Tsikkinis, A.; Drakaki, H.; Loveland, B. E.;
Piddlesden, S. J.; Plebanski, M.; Pouniotis, D. S.; Alexis, M. N., Pilot Phase III Immunotherapy
Study in Early-stage Breast Cancer Patients Using Oxidized Mannan-MUC1 [ISRCTN71711835].
Breast Cancer Res. 2006, 8, R27.
90. Vassilaros, S.; Tsibanis, A.; Tsikkinis, A.; Pietersz, G. A.; McKenzie, I. F. C.; Apostolopoulos,
V., Up to 15-Year Clinical Follow-up of a Pilot Phase III Immunotherapy Study in Stage II Breast
Cancer Patients Using Oxidized Mannan–MUC1. Immunotherapy 2013, 5, 1177-1182.
91. Loveland, B. E.; Zhao, A.; White, S.; Gan, H.; Hamilton, K.; Xing, P.-X.; Pietersz, G. A.;
Apostolopoulos, V.; Vaughan, H.; Karanikas, V., Mannan-MUC1–pulsed Dendritic Cell
Immunotherapy: A Phase I Trial in Patients with Adenocarcinoma. Clin. Cancer Res. 2006, 12,
869-877.
92. Tang, C. K.; Lodding, J.; Minigo, G.; Pouniotis, D. S.; Plebanski, M.; Scholzen, A.; McKenzie,
I. F. C.; Pietersz, G. A.; Apostolopoulos, V., Mannan-mediated Gene Delivery for Cancer
Immunotherapy. Immunology 2007, 120, 325-335.
93. Tang, C. K.; Sheng, K.-C.; Pouniotis, D.; Esparon, S.; Son, H.-Y.; Kim, C.-W.; Pietersz, G.
A.; Apostolopoulos, V., Oxidized and Reduced Mannan Mediated MUC1 DNA Immunization
Induce Effective Anti-tumor Responses. Vaccine 2008, 26, 3827-3834.
94. Tang, C. K.; Sheng, K.-C.; Esparon, S. E.; Proudfoot, O.; Apostolopoulos, V.; Pietersz, G. A.,
Molecular Basis of Improved Immunogenicity in DNA Vaccination Mediated by a Mannan Based
Carrier. Biomaterials 2009, 30, 1389-1400.
95. Benito-Villalvilla, C.; Soria, I.; Subiza, J. L.; Palomares, O., Novel Vaccines Targeting
Dendritic Cells by Coupling Allergoids to Mannan. Allergo J. Int. 2018, 27, 256-262.
96. Weinberger, E. E.; Himly, M.; Myschik, J.; Hauser, M.; Altmann, F.; Isakovic, A.;
Scheiblhofer, S.; Thalhamer, J.; Weiss, R., Generation of Hypoallergenic Neoglycoconjugates for
Dendritic Cell Targeted Vaccination: A Novel Tool for Specific Immunotherapy. J. Controlled
Release 2013, 165, 101-109.
66
97. Chackerian, B.; Lenz, P.; Lowy, D. R.; Schiller, J. T., Determinants of Autoantibody Induction
by Conjugated Papillomavirus Virus-like Particles. J. Immunol. 2002, 169, 6120-6126.
98. Manzano, A. I.; Cases, B.; Sirvent, S.; Soria, I.; Palomares, O.; Fernández-Caldas, E.;
Casanovas, M.; Jiménez-Barbero, J.; Subiza, J. L., Structural Studies of Novel Glycoconjugates
from Polymerized Allergens (Allergoids) and Mannans as Allergy Vaccines. Glycoconjugate J.
2016, 33, 93-101.
99. Sirvent, S.; Soria, I.; Cirauqui, C.; Cases, B.; Manzano, A. I.; Diez-Rivero, C. M.; Reche, P.
A.; López-Relaño, J.; Martínez-Naves, E.; Cañada, F. J., Novel Vaccines Targeting Dendritic Cells
by Coupling Allergoids to Nonoxidized Mannan Enhance Allergen Uptake and Induce Functional
Regulatory T Cells through Programmed Death Ligand 1. J. Allergy Clin. Immunol. 2016, 138,
558-567.
100. Benito‑Villalvilla, C.; Soria, I.; Pérez‑Diego, M.; Fernández‑Caldas, E.; Subiza, J. L.;
Palomares, O., Alum Impairs Tolerogenic Properties Induced by Allergoid‑mannan Conjugates
Inhibiting mTOR and Metabolic Reprogramming in Human DCs. Allergy 2019, 75, 648-659.
101. Zajonc, D. M., The CD1 Family: Serving Lipid Antigens to T Cells Since the Mesozoic
Era. Immunogenetics 2016, 68, 561-576.
102. Bendelac, A.; Savage, P. B.; Teyton, L., The Biology of NKT Cells. Annu. Rev. Immunol.
2007, 25, 297-336.
103. Kawano, T.; Cui, J.; Koezuka, Y.; Toura, I.; Kaneko, Y.; Motoki, K.; Ueno, H.; Nakagawa,
R.; Sato, H.; Kondo, E.; Koseki, H.; Taniguchi, M., CD1d-Restricted and TCR-Mediated
Activation of Vα14 NKT Cells by Glycosylceramides. Science 1997, 278, 1626-1629.
104. Merle, N. S.; Noe, R.; Halbwachs-Mecarelli, L.; Fremeaux-Bacchi, V.; Roumenina, L. T.,
Complement System Part II: Role in Immunity. Front. Immunol. 2015, 6, 257.
105. Metelitsa, L. S.; Naidenko, O. V.; Kant, A.; Wu, H.-W.; Loza, M. J.; Perussia, B.;
Kronenberg, M.; Seeger, R. C., Human NKT Cells Mediate Antitumor Cytotoxicity Directly by
Recognizing Target Cell CD1d with Bound Ligand or Indirectly by Producing IL-2 to Activate
NK Cells. J. Immunol. 2001, 167, 3114-3122.
106. Morita, M.; Motoki, K.; Akimoto, K.; Natori, T.; Sakai, T.; Sawa, E.; Yamaji, K.;
Koezuka, Y.; Kobayashi, E.; Fukushima, H., Structure-Activity Relationship of α-
Galactosylceramides Against B16-Bearing Mice. J. Med. Chem. 1995, 38, 2176-2187.
67
107. Natori, T.; Koezuka, Y.; Higa, T., Agelasphins, Novel α-Galactosylceramides from the
Narine Sponge Agelas Mauritianus. Tetrahedron Lett. 1993, 34, 5591-5592.
108. Shimosaka, A., Role of NKT Cells and α-Galactosyl Ceramide. Int. J. Hematol. 2002, 76,
277-279.
109. Carreño, L. J.; Kharkwal, S. S.; Porcelli, S. A., Optimizing NKT Cell Ligands as
Vaccine Adjuvants. Immunotherapy 2014, 6, 309-320.
110. Waldowska, M.; Bojarska-Junak, A.; Roliński, J., A Brief Review of Clinical Trials
Involving Manipulation of Invariant NKT Cells as a Promising Approach in Future Cancer
Therapies. Cent. Eur. J. Immunol. 2017, 42, 181-195.
111. Zhang, Y.; Springfield, R.; Chen, S.; Li, X.; Feng, X.; Moshirian, R.; Yang, R.; Yuan, W.,
α-GalCer and iNKT Cell-based Cancer Immunotherapy: Realizing the Therapeutic Potentials.
Front. Immunol. 2019, 10, 1126.
112. Faveeuw, C.; Trottein, F., Optimization of Natural Killer T Cell–Mediated
Immunotherapy in Cancer Using Cell-Based and Nanovector Vaccines. Cancer Res. 2014, 74,
1632-1638.
113. Fujii, S.-i.; Yamasaki, S.; Sato, Y.; Shimizu, K., Vaccine Designs Utilizing Invariant
NKT-Licensed Antigen-Presenting Cells Provide NKT or T Cell Help for B Cell Responses. Front.
Immunol. 2018, 9, 1267.
114. Liu, Z.; Guo, J., NKT-Cell Glycolipid Agonist as Adjuvant in Synthetic Vaccine.
Carbohydr. Res. 2017, 452, 78-90.
115. Mattarollo, S. R.; Smyth, M. J., NKT Cell Adjuvants in Therapeutic Vaccines Against
Hematological Cancers. Oncoimmunology 2013, 2, e22615.
116. Sainz, V.; Moura, L. I. F.; Peres, C.; Matos, A. I.; Viana, A. S.; Wagner, A. M.; Vela
Ramirez, J. E.; S Barata, T.; Gaspar, M.; Brocchini, S.; Zloh, M.; Peppas, N. A.; Satchi-Fainaro,
R.; F Florindo, H., α-GalactosylCeramide and Peptide-based Nano-vaccine Synergistically
Induced a Strong Tumor Suppressive Effect in Melanoma. Acta Biomater. 2018, 76, 193-207.
117. Yamashita, K.; Arimoto, A.; Nishi, M.; Tanaka, T.; Fujita, M.; Fukuoka, E.; Sugita, Y.;
Nakagawa, A.; Hasegawa, H.; Suzuki, S.; Kakeji, Y., Application of iNKT Cell-targeted Active
Immunotherapy in Cancer Treatment. Anticancer Res. 2018, 38, 4233-4239.
68
118. Dölen, Y.; Kreutz, M.; Gileadi, U.; Tel, J.; Vasaturo, A.; van Dinther, E. A. W.; van Hout-
Kuijer, M. A.; Cerundolo, V.; Figdor, C. G., Co-delivery of PLGA Encapsulated Invariant NKT
Cell Agonist with Antigenic Protein Induce Strong T Cell-mediated Antitumor Immune Responses.
Oncoimmunology 2016, 5, e1068493.
119. Ghinnagow, R.; Cruz, L. J.; Macho-Fernandez, E.; Faveeuw, C.; Trottein, F.,
Enhancement of Adjuvant Functions of Natural Killer T Cells Using Nanovector Delivery Systems:
Application in Anticancer Immune Therapy. Front. Immunol. 2017, 8, 879.
120. Ghinnagow, R.; De Meester, J.; Cruz, L. J.; Aspord, C.; Corgnac, S.; Macho-Fernandez,
E.; Soulard, D.; Fontaine, J.; Chaperot, L.; Charles, J.; Soncin, F.; Mami-Chouaib, F.; Plumas, J.;
Faveeuw, C.; Trottein, F., Co-delivery of the NKT Agonist α-Galactosylceramide and Tumor
Antigens to Cross-priming Dendritic Cells Breaks Tolerance to Self-antigens and Promotes
Antitumor Responses. Oncoimmunology 2017, 6, e1339855.
121. Macho-Fernandez, E.; Cruz, L. J.; Ghinnagow, R.; Fontaine, J.; Bialecki, E.; Frisch, B.;
Trottein, F.; Faveeuw, C., Targeted Delivery of α-Galactosylceramide to CD8α+ Dendritic Cells
Optimizes Type I NKT Cell–Based Antitumor Responses. J. Immunol. 2014, 193, 961-969.
122. Sartorius, R.; D’Apice, L.; Barba, P.; Cipria, D.; Grauso, L.; Cutignano, A.; De Berardinis,
P., Vectorized Delivery of Alpha-GalactosylCeramide and Tumor Antigen on Filamentous
Bacteriophage fd Induces Protective Immunity by Enhancing Tumor-Specific T Cell Response.
Front. Immunol. 2018, 9, 1496.
123. Anderson, R. J.; Tang, C.-W.; Daniels, N. J.; Compton, B. J.; Hayman, C. M.; Johnston,
K. A.; Knight, D. A.; Gasser, O.; Poyntz, H. C.; Ferguson, P. M.; Larsen, D. S.; Ronchese, F.;
Painter, G. F.; Hermans, I. F., A Self-adjuvanting Vaccine Induces Cytotoxic T Lymphocytes that
Suppress Allergy. Nat. Chem. Biol. 2014, 10, 943-949.
124. Cavallari, M.; Stallforth, P.; Kalinichenko, A.; Rathwell, D. C. K.; Gronewold, T. M. A.;
Adibekian, A.; Mori, L.; Landmann, R.; Seeberger, P. H.; De Libero, G., A Semisynthetic
Carbohydrate-Lipid Vaccine that Protects Against S. Pneumoniae in Mice. Nat. Chem. Biol. 2014,
10, 950-956.
125. Anderson, R. J.; Compton, B. J.; Tang, C.-W.; Authier-Hall, A.; Hayman, C. M.; Swinerd,
G. W.; Kowalczyk, R.; Harris, P.; Brimble, M. A.; Larsen, D. S., NKT Cell-dependent Glycolipid–
peptide Vaccines with Potent Anti-Tumour Activity. Chem. Sci. 2015, 6, 5120-5127.
69
126. Compton, B. J.; Tang, C.-w.; Johnston, K. A.; Osmond, T. L.; Hayman, C. M.; Larsen, D.
S.; Hermans, I. F.; Painter, G. F., Synthesis and Activity of 6 ″-Deoxy-6 ″-thio-α-GalCer and
Peptide Conjugates. Org. Lett. 2015, 17, 5954-5957.
127. Anderson, R. J.; Li, J.; Kedzierski, L.; Compton, B. J.; Hayman, C. M.; Osmond, T. L.;
Tang, C.-w.; Farrand, K. J.; Koay, H.-F.; Almeida, C. F. D. S. S. E., Augmenting Influenza-
Specific T Cell Memory Generation with a Natural Killer T Cell-Dependent Glycolipid–Peptide
Vaccine. ACS Chem. Biol. 2017, 12, 2898-2905.
128. Speir, M.; Authier-Hall, A.; Brooks, C. R.; Farrand, K. J.; Compton, B. J.; Anderson, R.
J.; Heiser, A.; Osmond, T. L.; Tang, C. W.; Berzofsky, J. A.; Terabe, M.; Painter, G. F.; Hermans,
I. F.; Weinkove, R., Glycolipid-Peptide Conjugate Vaccines Enhance CD8(+) T Cell Responses
Against Human Viral Proteins. Sci Rep 2017, 7, 14273.
129. Yin, X.-G.; Chen, X.-Z.; Sun, W.-M.; Geng, X.-S.; Zhang, X.-K.; Wang, J.; Ji, P.-P.; Zhou,
Z.-Y.; Baek, D. J.; Yang, G.-F.; Liu, Z.; Guo, J., IgG Antibody Response Elicited by a Fully
Synthetic Two-Component Carbohydrate-Based Cancer Vaccine Candidate with α-
Galactosylceramide as Built-in Adjuvant. Org. Lett. 2017, 19, 456-459.
130. Ebensen, T.; Link, C.; Riese, P.; Schulze, K.; Morr, M.; Guzmán, C. A., A Pegylated
Derivative of α-Galactosylceramide Exhibits Improved Biological Properties. J. Immunol. 2007,
179, 2065-2073.
131. Broecker, F.; Götze, S.; Hudon, J.; Rathwell, D. C. K.; Pereira, C. L.; Stallforth, P.; Anish,
C.; Seeberger, P. H., Synthesis, Liposomal Formulation, and Immunological Evaluation of a
Minimalistic Carbohydrate-α-GalCer Vaccine Candidate. J. Med. Chem. 2018, 61, 4918-4927.
132. Schröder, U.; Ståhl, A., Crystallized Dextran Nanospheres with Entrapped Antigen and
Their Use as Adjuvants. J. Immunol. Methods 1984, 70, 127-132.
133. Shen, L.; Higuchi, T.; Tubbe, I.; Voltz, N.; Krummen, M.; Pektor, S.; Montermann, E.;
Rausch, K.; Schmidt, M.; Schild, H.; Grabbe, S.; Bros, M., A Trifunctional Dextran-based
Nanovaccine Targets and Activates Murine Dendritic Cells, and Induces Potent Cellular and
Humoral Immune Responses in Vivo. PLoS One 2013, 8, e80904.
134. Bachelder, E. M.; Beaudette, T. T.; Broaders, K. E.; Dashe, J.; Fréchet, J. M. J., Acetal-
derivatized Dextran: An Acid-responsive Biodegradable Material for Therapeutic Applications. J.
Am. Chem. Soc. 2008, 130, 10494-10495.
70
135. Kavunja, H. W.; Lang, S.; Sungsuwan, S.; Yin, Z.; Huang, X., Delivery of Foreign
Cytotoxic T Lymphocyte Epitopes to Tumor Tissues for Effective Antitumor Immunotherapy
Against Pre-established Solid Tumors in Mice. Cancer Immunol. Immunother. 2017, 66, 451-460.
136. Broaders, K. E.; Cohen, J. A.; Beaudette, T. T.; Bachelder, E. M.; Fréchet, J. M. J.,
Acetalated Dextran is a Chemically and Biologically Tunable Material for Particulate
Immunotherapy. Proc. Natl. Acad. Sci. U. S. A. 2009, 106, 5497-5502.
137. Chen, N.; Collier, M. A.; Gallovic, M. D.; Collins, G. C.; Sanchez, C. C.; Fernandes, E.
Q.; Bachelder, E. M.; Ainslie, K. M., Degradation of Acetalated Dextran can be Broadly Tuned
Based on Cyclic Acetal Coverage and Molecular Weight. Int. J. Pharm. 2016, 512, 147-157.
138. Chen, N.; Johnson, M. M.; Collier, M. A.; Gallovic, M. D.; Bachelder, E. M.; Ainslie, K.
M., Tunable Degradation of Acetalated Dextran Microparticles Enables Controlled Vaccine
Adjuvant and Antigen Delivery to Modulate Adaptive Immune Responses. J. Controlled Release
2018, 273, 147-159.
139. Kauffman, K. J.; Do, C.; Sharma, S.; Gallovic, M. D.; Bachelder, E. M.; Ainslie, K. M.,
Synthesis and Characterization of Acetalated Dextran Polymer and Microparticles with Ethanol as
a Degradation Product. ACS Appl. Mater. Interfaces 2012, 4, 4149-4155.
140. Bachelder, E. M.; Beaudette, T. T.; Broaders, K. E.; Fréchet, J. M. J.; Albrecht, M. T.;
Mateczun, A. J.; Ainslie, K. M.; Pesce, J. T.; Keane-Myers, A. M., In vitro Analysis of Acetalated
Dextran Microparticles as a Potent Delivery Platform for Vaccine Adjuvants. Mol. Pharmaceutics
2010, 7, 826-835.
141. Duong, A. D.; Sharma, S.; Peine, K. J.; Gupta, G.; Satoskar, A. R.; Bachelder, E. M.;
Wyslouzil, B. E.; Ainslie, K. M., Electrospray Encapsulation of Toll-like Receptor Agonist
Resiquimod in Polymer Microparticles for the Treatment of Visceral Leishmaniasis. Mol.
Pharmaceutics 2013, 10, 1045-1055.
142. Peine, K. J.; Bachelder, E. M.; Vangundy, Z.; Papenfuss, T.; Brackman, D. J.; Gallovic,
M. D.; Schully, K.; Pesce, J.; Keane-Myers, A.; Ainslie, K. M., Efficient Delivery of the Toll-like
Receptor Agonists Polyinosinic: Polycytidylic Acid and CpG to Macrophages by Acetalated
Dextran Microparticles. Mol. Pharmaceutics 2013, 10, 2849-2857.
143. Junkins, R. D.; Gallovic, M. D.; Johnson, B. M.; Collier, M. A.; Watkins-Schulz, R.;
Cheng, N.; David, C. N.; McGee, C. E.; Sempowski, G. D.; Shterev, I., A Robust Microparticle

71
Platform for a STING-targeted Adjuvant that Enhances Both Humoral and Cellular Immunity
During Vaccination. J. Controlled Release 2018, 270, 1-13.
144. Hanson, M. C.; Crespo, M. P.; Abraham, W.; Moynihan, K. D.; Szeto, G. L.; Chen, S. H.;
Melo, M. B.; Mueller, S.; Irvine, D. J., Nanoparticulate STING Agonists are Potent Lymph Node-
Targeted Vaccine Adjuvants. J. Clin. Invest. 2015, 125, 2532-2546.
145. Irvine, D. J.; Hanson, M. C.; Rakhra, K.; Tokatlian, T., Synthetic Nanoparticles for
Vaccines and Immunotherapy. Chem. Rev. 2015, 115, 11109-11146.
146. Koshy, S. T.; Cheung, A. S.; Gu, L.; Graveline, A. R.; Mooney, D. J., Liposomal Delivery
Enhances Immune Activation by STING Agonists for Cancer Immunotherapy. Adv. Biosyst. 2017,
1, 1600013.
147. Lee, E.; Jang, H.-E.; Kang, Y. Y.; Kim, J.; Ahn, J.-H.; Mok, H., Submicron-sized
Hydrogels Incorporating Cyclic Dinucleotides for Selective Delivery and Elevated Cytokine
Release in Macrophages. Acta Biomater. 2016, 29, 271-281.
148. Watkins-Schulz, R.; Tiet, P.; Gallovic, M. D.; Junkins, R. D.; Batty, C.; Bachelder, E. M.;
Ainslie, K. M.; Ting, J. P. Y., A Microparticle Platform for STING-targeted Immunotherapy
Enhances Natural Killer Cell-and CD8+ T Cell-mediated Anti-tumor Immunity. Biomaterials
2019, 205, 94-105.
149. Collier, M. A.; Junkins, R. D.; Gallovic, M. D.; Johnson, B. M.; Johnson, M. M.;
Macintyre, A. N.; Sempowski, G. D.; Bachelder, E. M.; Ting, J. P. Y.; Ainslie, K. M., Acetalated
Dextran Microparticles for Codelivery of STING and TLR7/8 Agonists. Mol. Pharmaceutics 2018,
15, 4933-4946.
150. Paßlick, D.; Piradashvili, K.; Bamberger, D.; Li, M.; Jiang, S.; Strand, D.; Wich, P. R.;
Landfester, K.; Bros, M.; Grabbe, S., Delivering All in One: Antigen-Nanocapsule Loaded with
Dual Adjuvant Yields Superadditive Effects by DC-Directed T Cell Stimulation. J. Controlled
Release 2018, 289, 23-34.
151. Schully, K. L.; Sharma, S.; Peine, K. J.; Pesce, J.; Elberson, M. A.; Fonseca, M. E.; Prouty,
A. M.; Bell, M. G.; Borteh, H.; Gallovic, M., Rapid Vaccination Using an Acetalated Dextran
Microparticulate Subunit Vaccine Confers Protection Against Triplicate Challenge by Bacillus
Anthracis. Pharm. Res. 2013, 30, 1349-1361.

72
152. Gallovic, M. D.; Schully, K. L.; Bell, M. G.; Elberson, M. A.; Palmer, J. R.; Darko, C. A.;
Bachelder, E. M.; Wyslouzil, B. E.; Keane‑Myers, A. M.; Ainslie, K. M., Acetalated Dextran
Microparticulate Vaccine Formulated via Coaxial Electrospray Preserves Toxin Neutralization
and Enhances Murine Survival Following Inhalational Bacillus Anthracis Exposure. Adv.
Healthcare Mater. 2016, 5, 2617-2627.
153. Schully, K. L.; Bell, M. G.; Prouty, A. M.; Gallovic, M. D.; Gautam, S.; Peine, K. J.;
Sharma, S.; Bachelder, E. M.; Pesce, J. T.; Elberson, M. A., Evaluation of a Biodegradable
Microparticulate Polymer as a Carrier for Burkholderia pseudomallei Subunit Vaccines in a Mouse
Model of Melioidosis. Int. J. Pharm. 2015, 495, 849-861.
154. Chen, N.; Gallovic, M. D.; Tiet, P.; Ting, J. P. Y.; Ainslie, K. M.; Bachelder, E. M.,
Investigation of Tunable Acetalated Dextran Microparticle Platform to Optimize M2e-based
Influenza Vaccine Efficacy. J. Controlled Release 2018, 289, 114-124.
155. Cui, L.; Cohen, J. A.; Broaders, K. E.; Beaudette, T. T.; Fréchet, J. M. J., Mannosylated
Dextran Nanoparticles: A pH-Sensitive System Engineered for Immunomodulation through
Mannose Targeting. Bioconjugate Chem. 2011, 22, 949-957.
156. Li, D.; Kordalivand, N.; Fransen, M. F.; Ossendorp, F.; Raemdonck, K.; Vermonden, T.;
Hennink, W. E.; Van Nostrum, C. F., Reduction‑sensitive Dextran Nanogels Aimed for
Intracellular Delivery of Antigens. Adv. Funct. Mater. 2015, 25, 2993-3003.
157. Li, D.; Sun, F.; Bourajjaj, M.; Chen, Y.; Pieters, E. H.; Chen, J.; Van Den Dikkenberg, J.
B.; Lou, B.; Camps, M. G. M.; Ossendorp, F., Strong in vivo Antitumor Responses Induced by An
Antigen Immobilized in Nanogels via Reducible Bonds. Nanoscale 2016, 8, 19592-19604.
158. Jones, D. P., Radical-free Biology of Oxidative Stress. Am. J. Physiol. Cell Physiol. 2008,
295, C849-C868.
159. Winterbourn, C. C., Reconciling the Chemistry and Biology of Reactive Oxygen Species.
Nat. Chem. Biol. 2008, 4, 278-286.
160. Savina, A.; Peres, A.; Cebrian, I.; Carmo, N.; Moita, C.; Hacohen, N.; Moita, L. F.;
Amigorena, S., The Small GTPase Rac2 Controls Phagosomal Alkalinization and Antigen
Crosspresentation Selectively in CD8+ Dendritic Cells. Immunity 2009, 30, 544-555.
161. Broaders, K. E.; Grandhe, S.; Fréchet, J. M. J., A Biocompatible Oxidation-Triggered
Carrier Polymer with Potential in Therapeutics. J. Am. Chem. Soc. 2011, 133, 756-758.

73
162. Wang, C.; Li, P.; Liu, L.; Pan, H.; Li, H.; Cai, L.; Ma, Y., Self-adjuvanted Nanovaccine
for Cancer Immunotherapy: Role of Lysosomal Rupture-induced ROS in MHC Class I Antigen
Presentation. Biomaterials 2016, 79, 88-100.
163. Novak, M.; Vetvicka, V., β-Glucans, History, and the Present: Immunomodulatory
Aspects and Mechanisms of Action. J. Immunotoxicol. 2008, 5, 47-57.
164. Levitz, S. M.; Huang, H.; Ostroff, G. R.; Specht, C. A., Exploiting Fungal Cell Wall
Components in Vaccines. Semin. Immunopathol. 2015, 37, 199-207.
165. Geijtenbeek, T. B. H.; Gringhuis, S. I., Signalling through C-type Lectin Receptors:
Shaping Immune Responses. Nat. Rev. Immunol. 2009, 9, 465-479.
166. LeibundGut-Landmann, S.; Osorio, F.; Brown, G. D.; e Sousa, C. R., Stimulation of
Dendritic Cells via the Dectin-1/Syk Pathway Allows Priming of Cytotoxic T-cell Responses.
Blood 2008, 112, 4971-4980.
167. Weitberg, A. B., A Phase I/II Trial of Beta-(1,3)/(1,6) D-glucan in the Treatment of
Patients with Advanced Malignancies Receiving Chemotherapy. J. Exp. Clin. Cancer Res. 2008,
27, 40.
168. Williams, D. L.; Sherwood, E. R.; Browder, I. W.; McNamee, R. B.; Jones, E. L.; Di
Luzio, N. R., Pre-clinical Safety Evaluation of Soluble Glucan. Int. J. Immunopharmacol. 1988,
10, 405-414.
169. Bromuro, C.; Romano, M.; Chiani, P.; Berti, F.; Tontini, M.; Proietti, D.; Mori, E.;
Torosantucci, A.; Costantino, P.; Rappuoli, R., Beta-Glucan-CRM197 Conjugates as Candidates
Antifungal Vaccines. Vaccine 2010, 28, 2615-2623.
170. Cassone, A.; Casadevall, A., Recent Progress in Vaccines Against Fungal Diseases. Curr.
Opin. Microbiol. 2012, 15, 427-433.
171. Liao, G.; Zhou, Z.; Burgula, S.; Liao, J.; Yuan, C.; Wu, Q.; Guo, Z., Synthesis and
Immunological Studies of Linear Oligosaccharides of β-Glucan as Antigens for Antifungal
Vaccine Development. Bioconjugate Chem. 2015, 26, 466-476.
172. Abraham, A.; Ostroff, G.; Levitz, S. M.; Oyston, P. C. F., A Novel Vaccine Platform
Using Glucan Particles for Induction of Protective Responses Against Francisella tularensis and
Other Pathogens. Clinical & Experimental Immunology 2019, 198, 143-152.
74
173. Hunter Jr, K. W.; Gault, R. A.; Berner, M. D., Preparation of Microparticulate β-Glucan
from Saccharomyces cerevisiae for Use in Immune Potentiation. Lett. Appl. Microbiol. 2002, 35,
267-271.
174. Di Luzio, N. R.; Williams, D. L.; McNamee, R. B.; Edwards, B. F.; Kitahama, A.,
Comparative Tumor‑inhibitory and Anti‑bacterial Activity of Soluble and Particulate Glucan.
Int. J. Cancer 1979, 24, 773-779.
175. Williams, D. L.; Yaeger, R. G.; Pretus, H. A.; Browder, I. W.; McNamee, R. B.; Jones,
E. L., Immunization Against Trypanosoma cruzi: Adjuvant Effect of Glucan. Int. J.
Immunopharmacol. 1989, 11, 403-410.
176. Berner, M. D.; Sura, M. E.; Alves, B. N.; Hunter Jr, K. W., IFN-γ Primes Macrophages
for Enhanced TNF-α Expression in Response to Stimulatory and Non-stimulatory Amounts of
Microparticulate β-Glucan. Immunol. Lett. 2005, 98, 115-122.
177. Huang, H.; Ostroff, G. R.; Lee, C. K.; Wang, J. P.; Specht, C. A.; Levitz, S. M., Distinct
Patterns of Dendritic Cell Cytokine Release Stimulated by Fungal β-Glucans and Toll-like
Receptor Agonists. Infect. Immun. 2009, 77, 1774-1781.
178. Hunter Jr, K. W.; Redelman, D., Microparticulate β-Glucan Upregulates the Expression
of B7. 1, B7. 2, B7-H1, but not B7-DC on Cultured Murine Peritoneal Macrophages. Immunol.
Lett. 2004, 93, 71-78.
179. Aouadi, M.; Tesz, G. J.; Nicoloro, S. M.; Wang, M.; Chouinard, M.; Soto, E.; Ostroff, G.
R.; Czech, M. P., Orally Delivered siRNA Targeting Macrophage Map4k4 Suppresses Systemic
Inflammation. Nature 2009, 458, 1180-1184.
180. Huang, H.; Ostroff, G. R.; Lee, C. K.; Agarwal, S.; Ram, S.; Rice, P. A.; Specht, C. A.;
Levitz, S. M., Relative Contributions of Dectin-1 and Complement to Immune Responses to
Particulate β-Glucans. J. Immunol. 2012, 189, 312-317.
181. Huang, H.; Ostroff, G. R.; Lee, C. K.; Specht, C. A.; Levitz, S. M., Robust Stimulation of
Humoral and Cellular Immune Responses following Vaccination with Antigen-loaded β-Glucan
Particles. MBio 2010, 1, e00164-10.
182. Soto, E. R.; Caras, A. C.; Kut, L. C.; Castle, M. K.; Ostroff, G. R., Glucan Particles for
Macrophage Targeted Delivery of Nanoparticles. J. Drug. Deliv. 2012, 2012, Article ID 143524.

75
183. Soto, E. R.; Ostroff, G. R., Characterization of Multilayered Nanoparticles Encapsulated
in Yeast Cell Wall Particles for DNA Delivery. Bioconjugate Chem. 2008, 19, 840-848.
184. Tesz, G. J.; Aouadi, M.; Prot, M.; Nicoloro, S. M.; Boutet, E.; Amano, S. U.; Goller, A.;
Wang, M.; Guo, C.-A.; Salomon, W. E., Glucan Particles for Selective Delivery of siRNA to
Phagocytic Cells in Mice. Biochem. J. 2011, 436, 351-362.
185. Huang, H.; Ostroff, G. R.; Lee, C. K.; Specht, C. A.; Levitz, S. M., Characterization and
Optimization of the Glucan Particle-based Vaccine Platform. Clin. Vaccine Immunol. 2013, 20,
1585-1591.
186. De Smet, R.; Demoor, T.; Verschuere, S.; Dullaers, M.; Ostroff, G. R.; Leclercq, G.;
Allais, L.; Pilette, C.; Dierendonck, M.; De Geest, B. G., β-Glucan Microparticles are Good
Candidates for Mucosal Antigen Delivery in Oral Vaccination. J. Controlled Release 2013, 172,
671-678.
187. Baert, K.; De Geest, B. G.; De Greve, H.; Cox, E.; Devriendt, B., Duality of β-Glucan
Microparticles: Antigen Carrier and Immunostimulants. Int. J. Nanomed. 2016, 11, 2463-2469.
188. Berner, V. K.; Sura, M. E.; Hunter, K. W., Conjugation of Protein Antigen to
Microparticulate β-Glucan from Saccharomyces cerevisiae: A New Adjuvant for Intradermal and
Oral Immunizations. Appl. Microbiol. Biotechnol. 2008, 80, 1053-1061.
189. Berner, V. K.; Redelman, D.; Hunter, K. W., Microparticulate β-Glucan Vaccine
Conjugates Phagocytized by Dendritic Cells Activate Both Naive CD4 and CD8 T Cells in vitro.
Cell. Immunol. 2015, 298, 104-114.
190. Yang, Z.; Xu, M.; Jia, Z.; Zhang, Y.; Wang, L.; Zhang, H.; Wang, J.; Song, M.; Zhao, Y.;
Wu, Z., A Novel Antigen Delivery System Induces Strong Humoral and CTL Immune Responses.
Biomaterials 2017, 134, 51-63.
191. Baert, K.; De Geest, B. G.; De Rycke, R.; da Fonseca Antunes, A. B.; De Greve, H.; Cox,
E.; Devriendt, B., β-Glucan Microparticles Targeted to Epithelial APN as Oral Antigen Delivery
System. J. Controlled Release 2015, 220, 149-159.
192. Numata, M.; Matsumoto, T.; Umeda, M.; Koumoto, K.; Sakurai, K.; Shinkai, S.,
Polysaccharide–polynucleotide Complexes (15): Thermal Stability of Schizophyllan
(SPG)/poly(C) Triple Strands is Controllable by α-Amino Acid Modification. Bioorg. Chem. 2003,
31, 163-171.

76
193. Sakurai, K.; Mizu, M.; Shinkai, S., Polysaccharide− Polynucleotide Complexes. 2.
Complementary Polynucleotide Mimic Behavior of the Natural Polysaccharide Schizophyllan in
the Macromolecular Complex with Single-stranded RNA and DNA. Biomacromolecules 2001, 2,
641-650.
194. Sakurai, K.; Shinkai, S., Molecular Recognition of Adenine, Cytosine, and Uracil in a
Single-stranded RNA by a Natural Polysaccharide: Schizophyllan. J. Am. Chem. Soc. 2000, 122,
4520-4521.
195. Kobiyama, K.; Aoshi, T.; Narita, H.; Kuroda, E.; Hayashi, M.; Tetsutani, K.; Koyama, S.;
Mochizuki, S.; Sakurai, K.; Katakai, Y., Nonagonistic Dectin-1 Ligand Transforms CpG into a
Multitask Nanoparticulate TLR9 Agonist. Proc. Natl. Acad. Sci. U. S. A. 2014, 111, 3086-3091.
196. Minari, J.; Mochizuki, S.; Matsuzaki, T.; Adachi, Y.; Ohno, N.; Sakurai, K., Enhanced
Cytokine Secretion from Primary Macrophages due to Dectin-1 Mediated Uptake of CpG DNA/β-
1, 3-Glucan Complex. Bioconjugate Chem. 2010, 22, 9-15.
197. Mochizuki, S.; Sakurai, K., Dectin-1 Targeting Delivery of TNF-α Antisense ODNs
Complexed with β-1, 3-Glucan Protects Mice from LPS-induced Hepatitis. J. Controlled Release
2011, 151, 155-161.
198. Miyamoto, N.; Mochizuki, S.; Sakurai, K., Enhanced Immunostimulation with
Crosslinked CpG-DNA/β-1, 3-Glucan Nanoparticle through Hybridization. Chem. Lett. 2014, 43,
991-993.
199. Miyamoto, N.; Mochizuki, S.; Sakurai, K., Designing an Immunocyte-targeting Delivery
System by Use of Beta-Glucan. Vaccine 2018, 36, 186-189.
200. Ito, H.; Ando, T.; Nakamura, M.; Ishida, H.; Kanbe, A.; Kobiyama, K.; Yamamoto, T.;
Ishii, K. J.; Hara, A.; Seishima, M., Induction of Humoral and Cellular Immune Response to
Hepatitis B Virus (HBV) Vaccine can be Upregulated by CpG Oligonucleotides Complexed with
Dectin‑1 Ligand. J. Viral Hepatitis 2017, 24, 155-162.
201. Kobiyama, K.; Temizoz, B.; Kanuma, T.; Ozasa, K.; Momota, M.; Yamamoto, T.; Aoshi,
T.; Kuroda, E.; Ishii, K. J., Species‑dependent Role of Type I IFNs and IL‑12 in the CTL
Response Induced by Humanized CpG Complexed with β‑Glucan. Eur. J. Immunol. 2016, 46,
1142-1151.

77
202. Kitahata, Y.; Kanuma, T.; Hayashi, M.; Kobayashi, N.; Ozasa, K.; Kusakabe, T.; Temizoz,
B.; Kuroda, E.; Yamaue, H.; Coban, C., Circulating Nano-particulate TLR9 Agonist Scouts out
Tumor Microenvironment to Release Immunogenic Dead Tumor Cells. Oncotarget 2016, 7, 48860.
203. Miyamoto, N.; Mochizuki, S.; Fujii, S.; Yoshida, K.; Sakurai, K., Adjuvant Activity
Enhanced by Cross-Linked CpG-Oligonucleotides in β-Glucan Nanogel and Its Antitumor Effect.
Bioconjugate Chem. 2017, 28, 565-573.
204. Manolova, V.; Flace, A.; Bauer, M.; Schwarz, K.; Saudan, P.; Bachmann, M. F.,
Nanoparticles Target Distinct Dendritic Cell Populations According to Their Size. Eur. J. Immunol.
2008, 38, 1404-1413.
205. Mochizuki, S.; Morishita, H.; Kobiyama, K.; Aoshi, T.; Ishii, K. J.; Sakurai, K.,
Immunization with Antigenic Peptides Complexed with β-Glucan Induces Potent Cytotoxic T-
Lymphocyte Activity in Combination with CpG-ODNs. J. Controlled Release 2015, 220, 495-502.
206. Mochizuki, S.; Morishita, H.; Sakurai, K., Complex Consisting of β-Glucan and
Antigenic Peptides with Cleavage Site for Glutathione and Aminopeptidases Induces Potent
Cytotoxic T Lymphocytes. Bioconjugate Chem. 2017, 28, 2246-2253.
207. Wang, H.; Yang, B.; Wang, Y.; Liu, F.; Fernández-Tejada, A.; Dong, S., β-Glucan as an
Immune Activator and a Carrier in the Construction of a Synthetic MUC1 Vaccine. Chem.
Commun. 2019, 55, 253-256.
208. Jin, J. W.; Tang, S. Q.; Rong, M. Z.; Zhang, M. Q., Synergistic Effect of Dual Targeting
Vaccine Adjuvant with Aminated β-Glucan and CpG-Oligodeoxynucleotides for Both Humoral
and Cellular Immune Responses. Acta Biomater. 2018, 78, 211-223.
209. Yuba, E.; Yamaguchi, A.; Yoshizaki, Y.; Harada, A.; Kono, K., Bioactive
Polysaccharide-based pH-Sensitive Polymers for Cytoplasmic Delivery of Antigen and Activation
of Antigen-specific Immunity. Biomaterials 2017, 120, 32-45.
210. Lofthouse, S., Immunological Aspects of Controlled Antigen Delivery. Adv. Drug
Delivery Rev. 2002, 54, 863-870.
211. Sivakumar, S. M.; Safhi, M. M.; Kannadasan, M.; Sukumaran, N., Vaccine Adjuvants –
Current Status and Prospects on Controlled Release Adjuvancity. Saudi Pharm. J. 2011, 19, 197-
206.
78
212. Abu Lila, A. S.; Ishida, T., Liposomal Delivery Systems: Design Optimization and
Current Applications. Biol. Pharm. Bull. 2017, 40, 1-10.
213. Bulbake, U.; Doppalapudi, S.; Kommineni, N.; Khan, W., Liposomal Formulations in
Clinical Use: An Updated Review. Pharmaceutics 2017, 9, 12.
214. Bachmann, M. F.; Jennings, G. T., Vaccine Delivery: A Matter of Size, Geometry,
Kinetics and Molecular Patterns. Nat. Rev. Immunol. 2010, 10, 787-796.
215. Xiang, S. D.; Scholzen, A.; Minigo, G.; David, C.; Apostolopoulos, V.; Mottram, P. L.;
Plebanski, M., Pathogen Recognition and Development of Particulate Vaccines: Does Size Matter?
Methods 2006, 40, 1-9.
216. Lin, L.; Qiao, M.; Zhang, X.; Linhardt, R. J., Site-selective Reactions for the Synthesis of
Glycoconjugates in Polysaccharide Vaccine Development. Carbohydr. Polym. 2020, 230, 115643.

79
CHAPTER 2 Delivery of Foreign Cytotoxic T Lymphocyte Epitopes to Tumor Tissues for
Effective Antitumor Immunotherapy Against Pre‑established Solid Tumors in Mice1
Adapted by permission from Springer Nature Customer Service Centre GmbH: Springer
Cancer immunology, immunotherapy, Kavunja, H. W.; Lang, S.; Sungsuwan, S.; Yin, Z.; Huang,
X., Delivery of Foreign Cytotoxic T Lymphocyte Epitopes to Tumor Tissues for Effective
Antitumor Immunotherapy Against Pre-established Solid Tumors in Mice. Cancer Immunol.
Immunother. 2017, 66, 451-460. COPYRIGHT (2017)
2.1 Introduction
Cytotoxic T lymphocytes (CTLs) are a key component of antitumor immunity. Anticancer
immunotherapies invoking CTLs are being actively pursued.2-3 However, clinical successes have
been limited so far with multiple challenges to overcome. CTLs eliminate target cells through
binding with specific peptide epitopes presented by the major histocompatibility complex class I
(MHC-I) on the target cell surface. Since most of tumor antigens are self-antigens, it is often very
difficult to generate highly active CTLs targeting tumor-associated antigens, as these CTLs are
generally eliminated during development due to negative selection.4 In addition, with high
heterogeneities of tumor cells, subpopulations of the cells may not express the cognate tumor-
associated antigen.5 These antigen-loss variants (ALVs) are thus not subjected to the immune
surveillance bestowed by the specific CTLs and can continue to grow, resulting in failure of the
therapy. Moreover, due to the genetic instability, some tumor cells can downregulate their MHC-

80
I expression levels under the selection pressure,6-7 a phenomenon termed immune-editing.8 The
low abundance of MHC-I/antigen complexes on the cell surface may lead to insufficient tumor
recognition by CTLs and eventual tumor escape.9 To address these challenges, we report a strategy
to selectively deliver a CTL peptide epitope (CTLp) by pH-sensitive microparticles to tumor
tissues not endogenously expressing such an epitope and to effectively protect mice from pre-
established ALV solid tumor models in a therapeutic setting.
Compared to tumor-associated antigens, foreign CTLp can be advantageous as high-affinity
CTLs recognizing these epitopes are not subjected to negative selection and may be more readily
elicited via vaccination. If the high affinity CTLp can be delivered to tumor tissues in vaccinated
hosts, they can potentially outcompete endogenous epitopes for binding with the limited number
of MHC-I molecules, sensitizing tumor cells toward CTL killing. In addition, tumor stromal cells
are known to provide the critical extracellular microenvironment supporting tumor growth.10 As
stromal cells are derived from the host, they are genetically more stable and less prone to mutation.
CTLp delivered to tumor tissues can result in epitope presentation by stromal cells and their
subsequent killing by CTLs.11 The elimination of tumor stromal cells removes the favorable
microenvironment supporting tumor growth and facilitates tumor death by the bystander effect.12-
13
To achieve tumor selectivity in CTLp delivery, we resorted to pH-responsive “smart”
particles14 that are stable at neutral pH. Due to the hyperpermeability of blood vessels and the
81
defective lymphatic system in tumor tissues, nanoparticles/microparticles (MPs) can selectively
accumulate in these tissues with slow clearance due to the enhanced permeability and retention
effect.15-16 The CTLp can be released in the acidic tumor microenvironment17 or intracellularly for
MHC-I presentation by both tumor and stromal cells sensitizing them toward CTL killing.
*The work in this chapter was in collaboration with Dr. Herbert Kavunja. For a clear
demonstration of this work, Dr. Kavunja’s data has been included.
2.2 Results and discussions
2.2.1 Synthesis and characterization of the CTLp‑Ace‑Dex‑MPs
Acetalated dextran (Ac-Dex)18 was utilized to construct the pH-responsive particles due to its
high biocompatibility. The Ac-Dex was prepared by treating a mixture of dextran (MW: 9–11 kDa)
and 2-methoxypropene in DMSO with pyridinium p-toluenesulfonate (Figure 2.1). Two CTL
peptide epitopes, one from human mucin-1 with the sequence of PDTRPAP19 and the other from
ovalbumin with the sequence of SIINFEKL, were synthesized through solid-phase peptide
synthesis using fluorenylmethyloxycarbonyl (Fmoc) chemistry (Figure 2.2a). Ac-Dex was treated
with an emulsion evaporation method20 to form MPs encapsulating the peptide. Of the two peptides,
SIINFEKL was encapsulated at a much higher efficiency (40%) compared to mucin-1 (<5%) and
was used in subsequent studies. The SIINFEKL is a well-known CTLp capable of binding strongly
with MHC-I H-2Kb with a Kd value of 3 nM.21 The higher encapsulation efficiency of SIINFEKL
peptide is presumably due to its higher lipophilicity (The value of cLogP, a common measure of

82
lipophilicity of a compound, of SIINFEKL is calculated to be −2.2, while that for MUC1
PDTRPAP sequence is −5.1). The CTLp-Ac-Dex-MPs had average diameters of 597 nm by SEM
(Figure 2.1) with a zeta potential of −5.3 mV.
Figure 2.1. Synthesis of acetalated dextran and CTLp encapsulated acetalated dextran
microparticles. (SEM image collected by Dr. Kavunja)

83
Figure 2.2 a. Synthesis scheme of CTLp SIINFEKL through solid phase peptide synthesis. b.
HPLC chromatogram of purified CTLp SIINFEKL. (Data collected by Dr. Kavunja) c. ESI
spectrum of purified CTLp SIINFEKL. (Data collected by Dr. Kavunja)
aaaa
Minutes
19.2 19.4 19.6 19.8 20.0 20.2 20.4 20.6 20.8 21.0 21.2 21.4 21.6 21.8
mV
olt
s
-400
-300
-200
-100
0
100
200
300
400
500
mV
olt
s
-1000
0
1000
2000
3000
4000
5000
SPD-10Avp Ch1-220nm
100
100.dat
SPD-10Avp Ch2-260nm
100
100.dat
bbbb

84
Figure 2.2 c (cont’d)
To test the pH responsiveness, the Ac-Dex-MPs were incubated in PBS buffers with pH values
of 7.4, 6.5, 6.0 and 5.5 at room temperature and 37 °C, respectively. The scattering of light by the
MP suspension was monitored by UV–Vis at 600 nm. At pH 7.4, 6.5 and 6.0, there were very little
absorbance changes over 80 h at either room temperature or 37 °C (Figure 2.3a). At pH 5.5, the
MPs gradually dissolved in solution over 40 h due to the cleavage of acetal linkages under the
acidic condition. The rate of peptide release from the MPs was evaluated with the amounts of
CTLp discharged to solution determined by HPLC analysis. At pH 7.4, the majority of CTLp
remained within the MPs over 24 h, suggesting despite the small size of the CTLp, the spontaneous
cccc

85
release rate from the MPs was slow (Figure 2.3b). The release rate was significantly enhanced at
pH 5.5 with a half-life of about 4 h. Based on HPLC quantification (Appendix Figure 2.15), the
CTLp-Ace-Dex-MPs contained 20 μg CTLp/mg MP and 100% of the peptide could be released
from the MPs at pH 5.5.
Figure 2.3 a. Hydrolysis of Ac-Dex-MP at pH values of 7.4, 6.5, 6.0 and 5.5 at room temperature
and 37 °C, respectively, in PBS buffer as monitored by UV–Vis at 600 nm. b. CTLp release from
CTLp-Ac-Dex-MPs at 37 °C in PBS buffer at pH 5.5, 6.0, 6.5 and 7.4
86
2.2.2 CTLp delivered by the MPs could be loaded on MHC‑I of target cells and activate
T cells in vitro
In order to elicit a CTL response, the CTLp needs to be presented on MHC-I molecules of
target cells. Dr. Kavunja evaluated the abilities of the MPs to deliver CTLp to cells in vitro using
EL4 cells. EL4 cells do not naturally express the CTLp SIINFEKL, thus serving as a model of
ALV cells. CTLp-MPs were incubated with EL4 cells at 37 °C. To detect the presentation of
SIINFEKL peptide by MHC-I through flow cytometry, fluorescently labeled monoclonal antibody
(mAb) (clone 25-D1.16), which recognizes the complex formed by SIINFEKL with MHC-I but
not the free peptide itself, was utilized. A dose-dependent increase of cellular fluorescence
intensity was observed upon increasing the amounts of CTLp added (Figure 2.4). Even with a
short incubation time of 15 min with the CTLp-MPs (containing 54 ng of CTLp), significant
amounts of CTLp/MHC-I complexes were detected on cell surface (Figure 2.5a). The highest
fluorescence intensity was observed after 6 h of incubation. These results suggest that the
exogenous CTLp delivered by CTLp-MPs could compete with endogenous CTLp to be presented
by MHC-I molecules on tumor cells.
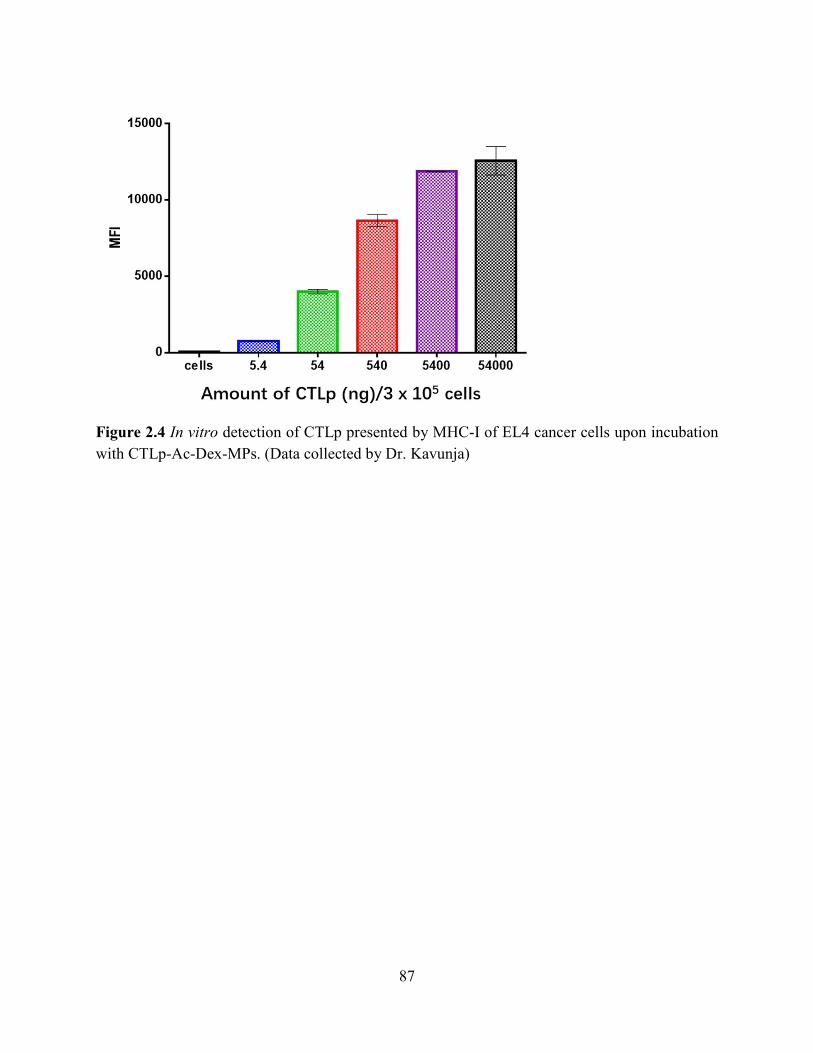
87
Figure 2.4 In vitro detection of CTLp presented by MHC-I of EL4 cancer cells upon incubation
with CTLp-Ac-Dex-MPs. (Data collected by Dr. Kavunja)
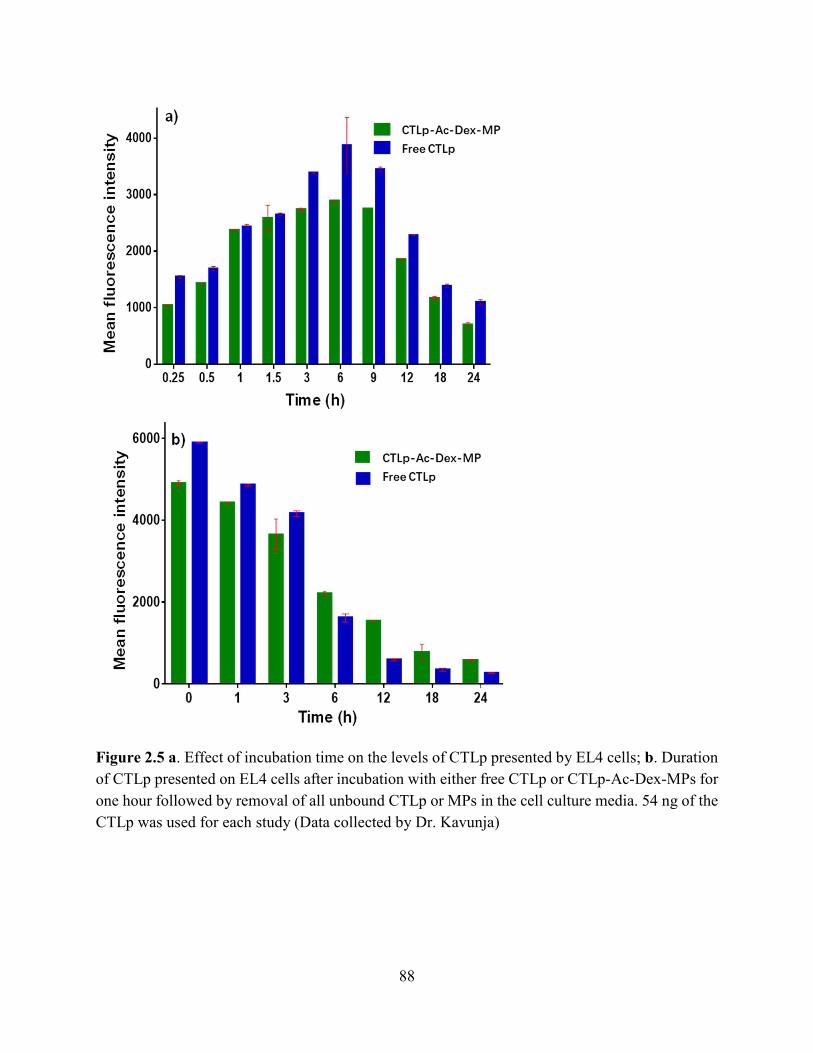
88
Figure 2.5 a. Effect of incubation time on the levels of CTLp presented by EL4 cells; b. Duration
of CTLp presented on EL4 cells after incubation with either free CTLp or CTLp-Ac-Dex-MPs for
one hour followed by removal of all unbound CTLp or MPs in the cell culture media. 54 ng of the
CTLp was used for each study (Data collected by Dr. Kavunja)

89
Dr. Kavunja further evaluated the duration of CTLp SIINFEKL presented on tumor cells.
After incubation of EL4 cells with CTLp-MP or free CTLp (54 ng) for 1 h, cells were centrifuged
to remove the culture media containing the unbound MP and peptide. Fresh media was then added
to the cells, and the amounts of CTLp/MHC-I complexes remained on cell surface were monitored.
While free CTLp was presented on cell surface quicker than encapsulated CTLp (0–3 h) (Figure
2.5b), more CTLp/MHC-I complexes were observed 6 h after cells were pulsed with CTLp-MPs,
hinting the gradual release of encapsulated CTLp inside the cells. After 24 h, there were about 15%
of CTLp/MHC-I remaining on cell surface.
To assess whether the CTLp presented by EL4 tumor cells could be recognized by CTLs, in
vitro CTL activation assay was carried out by Dr. Kavunja using B3Z CD8+ T cells.22 B3Z cells
express T cell receptors (TCR) specific to the SIINFEKL epitope presented on H-2Kb MHC-I
molecules and secret β-galactosidase upon TCR-CTLp/MHC I complex recognition, which
cleaves its substrate CPRG to yield a colorimetric readout. Incubation of EL4 tumor cells with
CTLp-MPs led to much higher activation of B3Z cells than the free peptide at the equivalent
peptide concentrations (Figure 2.6). These results suggest CTLp-Ac-Dex-MPs can potentially be
highly effective against tumors. This observation corroborated with the report from Frechet group
that a protein encapsulated by MPs could activate CTLs in vitro.18
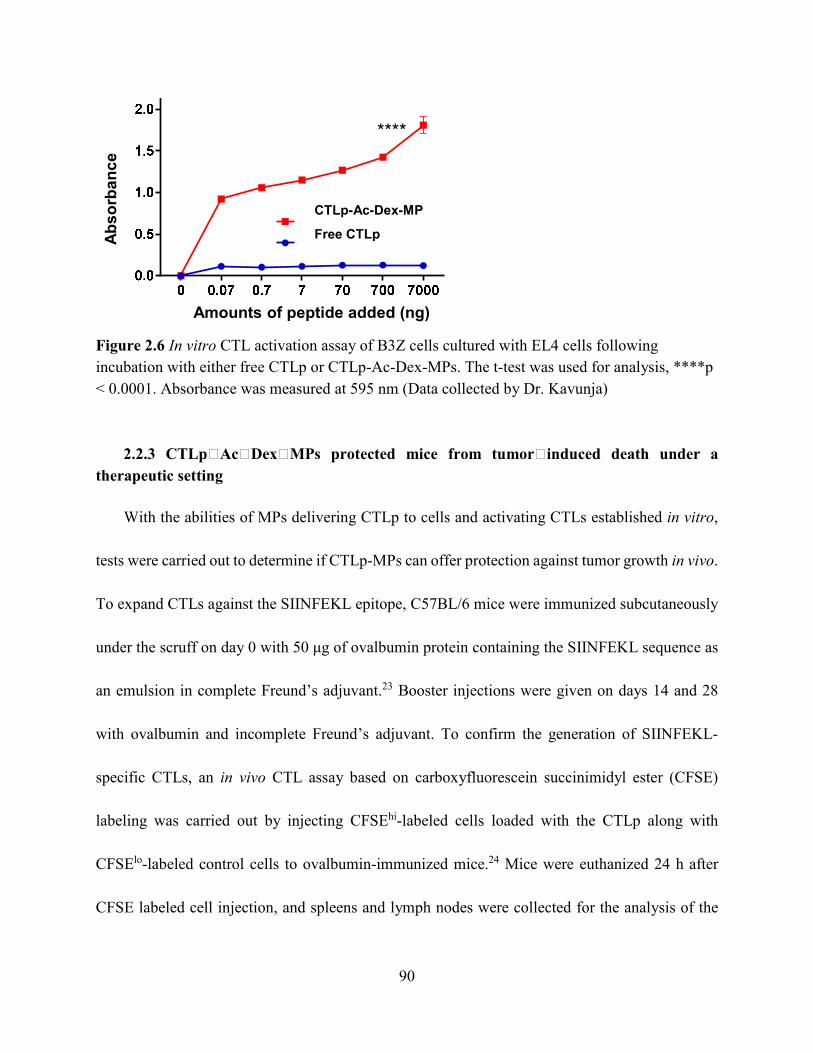
90
Figure 2.6 In vitro CTL activation assay of B3Z cells cultured with EL4 cells following
incubation with either free CTLp or CTLp-Ac-Dex-MPs. The t-test was used for analysis, ****p
< 0.0001. Absorbance was measured at 595 nm (Data collected by Dr. Kavunja)
2.2.3 CTLp‑Ac‑Dex‑MPs protected mice from tumor‑induced death under a
therapeutic setting
With the abilities of MPs delivering CTLp to cells and activating CTLs established in vitro,
tests were carried out to determine if CTLp-MPs can offer protection against tumor growth in vivo.
To expand CTLs against the SIINFEKL epitope, C57BL/6 mice were immunized subcutaneously
under the scruff on day 0 with 50 μg of ovalbumin protein containing the SIINFEKL sequence as
an emulsion in complete Freund’s adjuvant.23 Booster injections were given on days 14 and 28
with ovalbumin and incomplete Freund’s adjuvant. To confirm the generation of SIINFEKL-
specific CTLs, an in vivo CTL assay based on carboxyfluorescein succinimidyl ester (CFSE)
labeling was carried out by injecting CFSEhi-labeled cells loaded with the CTLp along with
CFSElo-labeled control cells to ovalbumin-immunized mice.24 Mice were euthanized 24 h after
CFSE labeled cell injection, and spleens and lymph nodes were collected for the analysis of the
Amounts of peptide added (ng)
Ab
so
rba
nc
e
****
CTLp-Ac-Dex-MP
Free CTLp

91
viability of CTLp loaded cells. The viabilities of cells pulsed with the CTLp were significantly
reduced compared to those not incubated with the epitope based on the ratio change of
CFSElo:CFSEhi before and after injection (Figure 2.7), suggesting the successful production of
SIINFEKL-specific CTLs in mice through immunization.
Figure 2.7 In vivo CTL activity assay results based on the analysis of the relative viabilities of
CFSE labeled cells by FACS. a. The “before injection” sample showing a mixture of CTLp pulsed
CFSEhi and CFSElo splenic cells (the ratio of CFSEhi to CFSElo cells was 53.8 : 46.2); b. Cells
isolated from a naïve mouse 7 days after injection of the mixture of CFSEhi and CFSElo cells (the
ratio of CFSEhi to CFSElo cells obtained from this mouse was 52.6 : 47.4); c. Cells isolated from
an ovalbumin immunized mouse 7 days after injection of the mixture of CFSEhi and CFSElo cells
(the ratio of CFSEhi to CFSElo cells obtained from this mouse was 42.8 : 57.2) showing reduced
viabilities of CTLp pulsed CFSEhi cells relative to CFSElo cells without the CTLp. This suggests
the activation of CTLp specific CTLs in the immunized mice.
Dr. Kavunja evaluated the protection of EL4 tumor-bearing mice with the administration of
CTLp-Ac-Dex-MPs. EL4 cells (2 × 10⁵ cells) were injected subcutaneously into the left flank of
ovalbumin-immunized mice (day 0).25 When the tumor sizes reached 90 mm3, mice were injected
intratumorally with free SIINFEKL CTLp (7 μg), CTLp-Ac-Dex-MPs (equivalent to 7 μg of

92
peptide), empty Ac-Dex-MPs or PBS, respectively, every other day for a total of three injections.
Tumor in the group receiving PBS only grew rapidly and all mice died from tumor on day 20
(Figure 2.8a, b). The group administered with empty Ac-Dex-MPs showed similar tumor growth
and mortality rates as the PBS group, suggesting empty Ac-Dex-MPs did not bestow any
protections. The injection of free peptide slowed down the growth of tumor and protected 20% of
the mice from tumor-induced death. In contrast, the group receiving CTLp-Ac-Dex-MPs showed
100% survival and the sizes of the tumor were significantly smaller (Figure 2.8a, b). The
superiority of CTLp-Ac-Dex-MPs compared to free peptide in tumor protection may be partially
due to the more efficient CTL activation by tumor cells incubated with the CTLp-MPs compared
to those with the free peptide (Figure 2.6).

93
Figure 2.8 Protection efficacy of mice bearing established subcutaneous EL4 tumors through a–b
intratumoral and c–d intravenous administration of PBS, Ac-Dex-MP, free CTLp or CTLp-Ac-
Dex-MPs. Compounds were administered on days 3, 5 and 7. a, c Changesof tumor volume over
time; b, d Kaplan–Meier survival curve. **p < 0.005; ****p < 0.0001 compared to the group
receiving free CTLp. The log-rank and the t-test methods were used for analysis. (Data collected
by Dr. Kavunja)
With the efficacy of local intratumoral delivery of CTLp-MPs established, systemic
administration was tested next by Dr. Kavunja. The subcutaneous EL4 tumor-bearing ovalbumin
immunized mice were injected intravenously via tail vein with CTLp-Ac-Dex-MPs (equivalent to
20 μg of CTLp), free CTLp (20 μg), empty Ac-Dex-MPs or PBS, respectively, on days 3, 5 and 7

94
as in the intratumoral study. All mice in the PBS and empty Ac-Dex-MP study groups died within
15 days (Figures 2.8c, d). The free CTLp had little protection as all mice died by day 18. The
CTLp-Ac-Dex-MPs, however, provided significant protection with 60% of the mice surviving the
tumor challenge (Figure 2.8d). No adverse autoimmunity complications were observed in all mice.
To test the generality of the approach, I examined another subcutaneous tumor model using
MC38 colon adenocarcinoma cells. The subcutaneous MC38 tumor-bearing ovalbumin-
immunized mice were treated with PBS, free CTLp, empty Ac-Dex-MPs or CTLp-Ac-Dex-MPs
following a similar schedule as that for the EL4 model. The tumor sizes of CTLp-Ac-Dex-MPs-
treated groups were significantly smaller than other groups (Figure 2.9).
The analysis of EL4 and MC38 tumors from untreated mice indicated there were significant
amounts of CD8+ T cells (9.4% and 7.2% respectively) presented in the tumor tissue (Figure 2.10).
However, the pre-existing CTLs did not protect mice from tumor growth, probably due to the
difficulty of tumor antigen recognition. The OVA specific CTLs induced by previous ovalbumin
immunization may not have much direct tumor killing ability, as both EL4 and MC38 cells do not
endogenously express the SIINFEKL epitope. Still, treatment of mice with SIINFEKL containing
MPs either intratumorally or systematically significantly reduced tumor growth (Figure 2.8 and
Figure 2.9). This suggests epitope delivery by MPs can be an effective approach to combat ALVs.
The MPs could release the free CTLp in the tumor microenvironment for loading onto MHC-I of
tumor and stromal cells, rendering it possible to remove both tumor cells and the cells supporting

95
tumor growth by anti-SIINFEKL CTLs. In addition, we noticed the CTLp-Ac-Dex MPs reduced
tumor growth without pre-existing anti-OVA immunity. A group of non-immunized mice was
grafted with MC38 cells and treated with CTLp-Ac-Dex-MPs under the same schedule.
Interestingly, even without prior ovalbumin immunization, these mice exhibited reduced tumor
growth rates as preimmunized mice (Figure 2.9). Possibly, immune cells in tumor tissues
including macrophages can uptake the MPs into acidic organelles such as lysosomes, which can
cleave MPs and release the encapsulated CTLp for cross-presentation on MHC-I and activation of
anti-SIINFEKL CTLs. However, the exact mechanism for such a fast CTL activation by CTLp-
Ac-Dex-MPs is not known and needs further study.
Figure 2.9 Protection efficacy of mice bearing MC38 tumor. Tumor growth in ovalbumin pre-
immunized mice bearing established subcutaneous MC38 tumors following intravenous
administration of PBS, free CTLp, empty Ac-Dex-MP, or CTLp-Ac-Dex-MPs. Administration of
CTLp-Ac-Dex-MPs significantly reduced tumor growth. Another group of mice were inoculated
with MC38 tumor without prior immunization with ovalbumin. These mice were administered

96
Figure 2.9 (cont’d) with CTLp-Ac-Dex-MPs, which also significantly slowed down tumor growth.
**, p < 0.005; ****, p < 0.0001. The Log-rank and the t-test methods were used for analysis. The
results suggest that CTLp-Ac-Dex-MPs could reduce the rates of tumor growth with or without
prior immunization with ovalbumin
Figure 2.10 Determination of percentage of CD8+ T cells present in a), b) subcutaneous EL4
tumor , and c), d) subcutaneous MC38 tumor by FACS. The tumor tissues were removed from
mice and single cell suspensions were generated. The cells were then stained with PE labeled anti
CD8 mAb (a and c), and PE labeled isotype control (b and d). In EL4 cells, 9.42% of tumor
associated cells are CD8+, while 7.23% of cells isolated from MC38 tumor are CD8+. These
indicate that there were large numbers of CD8+ T cells in tumor tissues.

97
2.2.4 CTLp‑Ac‑Dex‑MPs delivered the CTLp into tumor tissues
To better understand the protective effects of CTLp-Ac-Dex-MPs via systemic administration,
the delivery of CTLp to tumor environment was evaluated. Dr. Kavunja evaluated the presence of
CTLps in tumor tissues. Naïve mice bearing 300 mm3 EL4 tumor were administered intravenously
with CTLp-Ac-Dex-MPs via tail vein. The mice were euthanized 9 h post-injection with the tumors
harvested. Both FACS analysis of tumor cell suspension (Figure 2.11) and tumor tissue
histopathology staining (Figure 2.12a) showed a significant enhancement in cellular fluorescence,
suggesting the successful epitope delivery and MHC-I presentation by cells in tumor tissues. The
confocal images of tumor tissue histopathology staining also revealed the co-localization of the
red (CTLp/MHC-I) and green (CD11b) colors (Figure 2.12c) indicating that CTLp was presented
by tumor stromal cells as well. In contrast, tumor obtained from mice injected with free CTLp
gave little staining by the mAb 25-D1.16 (Figure 2.12d), possibly due to unfavorable
pharmacokinetics and limited half-life of the free peptide in vivo.26
I further analyzed the CTLp distribution in different organs with MC38-bearing mice (Figure
2.13). Naïve mice bearing 300 mm3 sized MC38 tumor were injected with CTLp-Ac-Dex-MPs
intravenously via tail vein. The mice were euthanized 9 h post-injection with the tumors, livers,
spleens and lungs harvested. Single cell suspensions were prepared from these organs followed by
staining with mAb25-D1.16 for detection of CTLp-MHC I complexes or an isotype control mAb
and subjected to flow cytometry analysis. The presence of CTLp in different organs was examined
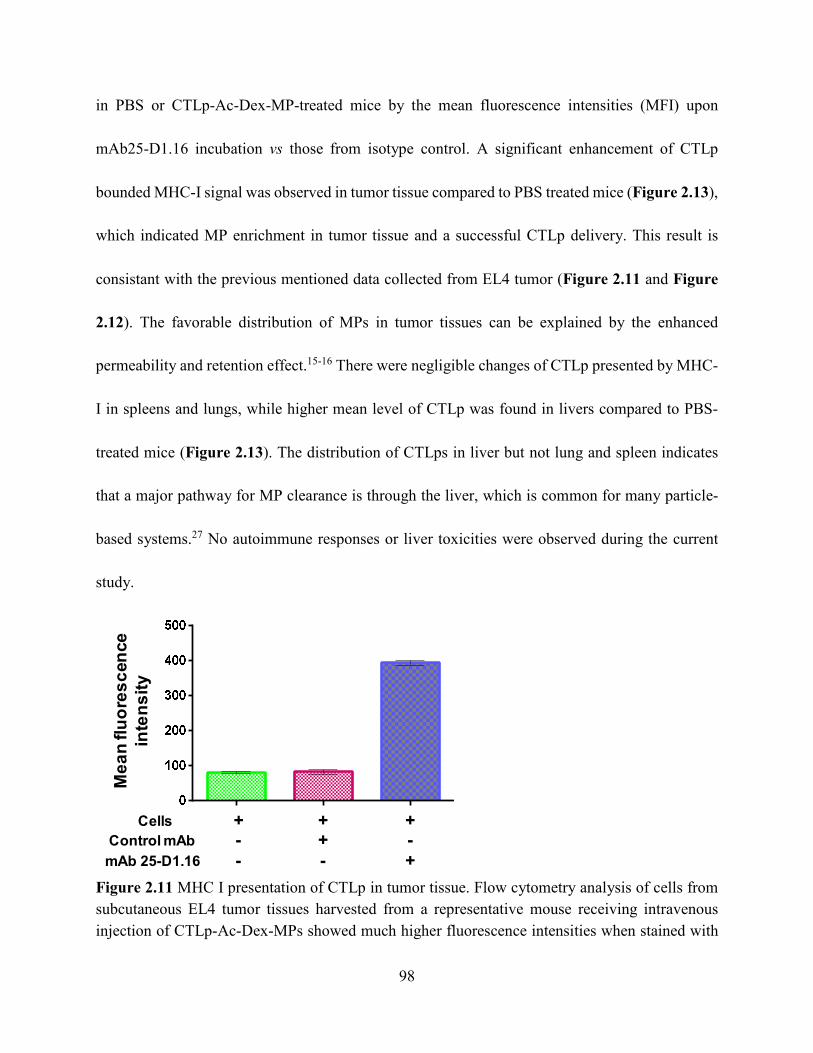
98
in PBS or CTLp-Ac-Dex-MP-treated mice by the mean fluorescence intensities (MFI) upon
mAb25-D1.16 incubation vs those from isotype control. A significant enhancement of CTLp
bounded MHC-I signal was observed in tumor tissue compared to PBS treated mice (Figure 2.13),
which indicated MP enrichment in tumor tissue and a successful CTLp delivery. This result is
consistant with the previous mentioned data collected from EL4 tumor (Figure 2.11 and Figure
2.12). The favorable distribution of MPs in tumor tissues can be explained by the enhanced
permeability and retention effect.15-16 There were negligible changes of CTLp presented by MHC-
I in spleens and lungs, while higher mean level of CTLp was found in livers compared to PBS-
treated mice (Figure 2.13). The distribution of CTLps in liver but not lung and spleen indicates
that a major pathway for MP clearance is through the liver, which is common for many particle-
based systems.27 No autoimmune responses or liver toxicities were observed during the current
study.
Figure 2.11 MHC I presentation of CTLp in tumor tissue. Flow cytometry analysis of cells from
subcutaneous EL4 tumor tissues harvested from a representative mouse receiving intravenous
injection of CTLp-Ac-Dex-MPs showed much higher fluorescence intensities when stained with
Me
an
flu
ore
sc
en
ce
inte
ns
ity
Cells
mAb 25-D1.16
Control mAb
+ ++-
-
+
-
-
+

99
Figure 2.11 (cont’d) mAb25-D1.16 compared to those with an isotype control mAb. This
suggested successful delivery and MHC-I cross-presentation of CTLp by cells in tumor tissues.
(Data collected by Dr. Kavunja)
Figure 2.12 Confocal microscopy images of tumor tissues from mice receiving intravenous
injection of a–c CTLp-Ac-Dex-MPs and d–f free CTLp. a, d Red channel showing PE-labeled
mAb 25-D1.16 detecting CTLp/MHC-I H-2Kb complexes; b, e Green channel showing FITC-
labeled anti-CD11b, a marker for stromal cells; c Overlay of panels a and b; f Overlay of panels d
and e. The scale bar is 10 μm. The significantly higher intensities of red color in panel a versus d
indicate higher amounts of CTLp/MHC-I complexes in tumor tissues of mice receiving CTLp-Ac-
Dex-MPs (Data collected by Dr. Kavunja)

100
Figure 2.13 CTLp distribution in different organs. Two groups of mice were prepared bearing
subcutaneous MC38 tumor. One group of these mice were administered CTLp-Ace-Dex-MPs
intravenously and the other group received PBS injection. After 9 hours, mice were sacrificed.
Their tumor, liver, spleen and lung were harvested and single cell suspensions were prepared from
these organs. The cells were stained with mAb25-D1.16 for detection of CTLp-MHC I complexes
or an isotype control mAb and subjected to flow cytometry analysis. The mean fluorescence
intensities (MFI) upon mAb25-D1.16 incubation vs those from isotype control were plotted.
Compared to mice receiving PBS only, the mice receiving CTLp-Ac-Dex-MPs gave much higher
intensities of mAb25-D1.16 staining in tumor and liver, while spleen and lung did not show much
change. T test was used for statistical analysis.
Besides delivery of CTLp to tumor tissues, the possibility that CTLp-MPs elicit CTL
responses directly in vivo has been investigated. To test this possibility, CTLp-MPs, free CTLp,
CTLp admixed with MPs were injected intravenously into naïve mice at equivalent amounts of 20
μg peptide. Mice immunized with ovalbumin were used as a positive control. CTL activities were

101
evaluated in these mice via the in vivo CFSE CTL assay. Interestingly, even without any exogenous
adjuvant, CTLp-MPs were able to induce SIINFEKL-specific CTL responses 7 days after
intravenous injection leading to reduced viabilities of CTLp-bearing cells to a similar extent as the
positive control (Figure 2.14). By day 14, the CTL activities waned. In comparison, mice receiving
free CTLp or empty MPs admixed with free CTLp without encapsulation did not elicit much
CTLp-specific responses. These results suggest that empty Ac-Dex-MPs do not non-specifically
boost immune responses. The superior protection bestowed by CTLp-Ac-Dex-MPs compared to
free CTLp could be attributed to enhanced CTLp delivery to tumor tissues and/or the additional
CTLp-specific CTLs generated by CTLp-Ac-Dex-MPs.
Figure 2.14 In vivo CTL activity assays. Mice were injected with CTLp-Ac-Dex-MP, Ac-Dex-
MP mixed with CTLp or free CTLp (20 μg), respectively, every other day with a total of three
injections. The positive control is ovalbumin-immunized mice. The time indicated is the number
of days after the final injection. CFSE-labeled live CTLp pulsed cells were then injected into the
mice and isolated from lymph nodes and spleens 24 h after injection. Mice with high CTL activities
led to lower relative survival rates of CFSE-labeled live CTLp pulsed cells. Cells isolated from
lymph nodes and spleens gave similar results that CTLp-Ac-Dex-MPs could induce SIINFEKL-
specific CTLs, while Ac-Dex-MPs admixed with CTLp or free CTLp was ineffective.
102
2.2.5 Future outlooks
Development of novel constructs that can provide powerful immune protection against tumor
development is of high current interests. While particle-based antitumor vaccine constructs have
been investigated,28 they have been primarily aimed at targeting professional antigen-presenting
cells. At the same time, most of the studies on introducing foreign antigenic epitopes to tumor did
not include a delivery system and therefore required administration of antigens locally to tumor.29-
31 Recently, a novel hyaluronic acid–OVA protein conjugate was shown to transport OVA epitopes
to tumor cells upon systemic administration32. In comparison, our approach delivers foreign
epitopes to tumor cells as well as stromal cells utilizing pH-responsive MPs.
Innovative studies have been performed using Ac-DEX MPs for cargo delivery.18, 33-35 Our
study is the first time that Ac-DEX-MPs were shown to be effective in delivering small peptides
to tumor microenvironment to enhance antitumor immunotherapy. Compared to intratumoral
injection, intravenous administration of CTLp-Ac-Dex-MPs did not provide complete protection
of the mice from tumor-induced death. This may be due to lower concentration of CTLp reaching
the tumor tissue upon systematic administration, which could be improved by increasing the
frequency of injections and optimization of the injection protocol. Furthermore, tumor tissue
targeting ligands can be installed onto MPs to enhance tumor selectivity and reduce the amounts
of CTLp reaching other organs such as liver.

103
SIINFEKL epitope from ovalbumin was selected as the CTLp due to its high affinity with
MHC-I H-2Kb and efficient MP encapsulation. For potential future translations to human patients,
as many people have been immunized against diseases such as papillomavirus and hepatitis B
infection, high-affinity lipophilic CTL epitopes can be selected from these viruses36-37 to match
MHC-I haplotypes of the subjects. Patients may already have memory CTLs38 against these
epitopes from prior immunizations enabling ready expansion of epitope-specific CTLs to combat
tumor. In addition, antigen delivery to tumor tissues can be combined with other promising
antitumor immunotherapy strategies to increase the protective efficiencies. For example, mAbs
capable of blocking immune regulatory checkpoints39 can enhance antitumor functions of CTLs.
Combination of CTLp delivery and immune checkpoint inhibition can provide synergistic effects
on tumor protection. These considerations suggest the potential for clinical translation using MPs
for CTLp delivery.
2.3 Conclusion
In conclusion, we have demonstrated that acid-responsive MPs can deliver foreign high-
affinity CTLp to tumor tissues and release CTLp for presentation by MHC-I on both tumor and
stromal cells. CTLp delivery by MPs to two models of ALV solid tumor led to significant reduction
of tumor growth. The simplicity and versatility of the MP system coupled with its antitumor
efficacy suggest that it can be a promising new direction to enhance the efficacy of CTL therapy
against established solid tumor.

104
2.4 Experimental methods
2.4.1 Materials and instrumentation
All chemicals were reagent grade and were used as received from the manufacturer unless
otherwise indicated. Fetal bovine serum (FBS), phosphate buffered saline (PBS), high glucose
Dulbecco's modified Eagle medium (DMEM), Dulbecco's modified Eagle medium nutrient
mixture F-12 Ham (DMEM/F12), complete Freund's adjuvant (CFA), incomplete Freund's
adjuvant (IFA), RPMI-1640, ovalbumin (OVA), chlorophenol red-β-D-galactopyranoside
(CPRG), dimethyl sulfoxide cell culture grade, pyruvate, acetonitrile HPLC grade, pyridinium
p-toluenesulfonate, triisopropylsilane (TIPS), dextran (Mw =9,000-11,000 g/mol), sodium azide
(NaN3), N,N-dimethylformamide (DMF), dichloromethane (DCM) were purchased from Sigma
Aldrich. Methoxypropene, anhydrous DMSO and N,N-diisopropylethylamine were purchased
from Acros. Hydroxybenzotriazole (HOBt), O-(benzotriazol-1-yl)-N,N,N′,N′-tetramethyluronium
hexafluorophosphate (HBTU), Fmoc protected amino acids were was purchased from Chem
Impex international. Piperidine, polyvinyl alcohol (PVA, Mw = 13,000 – 23,000 g/mol, 86-89%
hydrolyzed) was purchased from Alfa Aesar. Regular and HPLC grade trifluoroacetic acid (TFA)
was purchased from EMD millipore. L-glutamine, streptomycin, penicillin, collagenase type IV
and Hank's balanced salt solution were purchased from Gibco.
Scanning electron microscopy (SEM) images were acquired on the 7500F ultra-high
resolution scanning electron microscope. FACS data was acquired using LSR II flow cytometer

105
analyzer and analyzed by FlowJo_V10 software. Confocal microscopy images were acquired
using an Olympus FluoView 1000 LSM confocal microscope. Dynamic light scattering (DLS)
was performed on a Zetasizer Nano zs apparatus (Malvern, UK).
2.4.2 Procedure for CTLp synthesis
The CTLp was synthesized through solid phase peptide synthesis using Fmoc chemistry.
The procedures for SIINFEKL are: the Fmoc protected leucine resin in a syringe was swollen
overnight in DCM at room temperature. The DCM was discarded and Fmoc was removed by
adding 20% piperidine in DMF and keep constant rotation (20 minutes, twice). At the end of the
40 minutes the solution was discarded, and the resin was washed with DMF 4 times followed by
DCM 4 times. Lysine's free carboxylic acid was activated with HBTU, HOBt and DIPEA base in
anhydrous DMF (10 mL) for 30 minutes. The activated lysine was added to the washed resin and
the coupling reaction left to proceed for 10 h at room temperature. After the reaction, the solution
in the syringe was discarded and the resin washed 3 times with DMF followed by 3 times with
DCM. Fmoc was deprotected and the resin was washed as previous described. The next activated
amino acid was added and the procedure was repeated until all the amino acids had been coupled.
Fmoc on the final amino acid was removed as previous described. The peptide was cleaved from
the resin by a solution containing 95% TFA, 2.5% MilliQ water, and 2.5% TIPS. At this acidic
condition, all the protecting groups were cleaved. Excess TFA was removed by evaporation on a
rotavap followed by precipitation in diethylether and centrifugation until the resultant diethylether

106
supernatant was clear. The peptide was air dried in the hood overnight, dissolved in minimum
amount of DMSO and purified by HPLC using 0.1% TFA MilliQ water and acetonitrile over a
C18 column (2% acetonitrile to 100% acetonitrile in 40 minutes). Successful coupling was
confirmed by ESI mass spectrometry.
2.4.3 Preparation of CTLp-Ac-Dex-MPs
CTLp-Ac-Dex-MPs were prepared by an emulsion evaporation method.20
Ac-Dex was synthesized following a published procedure18. To a solution of dextran (MW =
9-11 kDa, 1.00 g, 0.1 mmol) in anhydrous DMSO (10 mL) under nitrogen pyridinium p-
toluenesulfonate (16 mg, 0.06 mmol) was added followed by 2-methoxypropene (3 mL, 34 mmol).
After 3 hours, the reaction was quenched with triethylamine (1 mL) and the modified dextran was
precipitated from the reaction mixture with addition of water (100 mL). The mixture was
centrifuged and the resulting pellet was washed thoroughly with water by vortexing and sonication
followed by centrifugation and removal of the supernatant. The residual water was removed by
lyophilization, yielding Ac-Dex (1.0 g) as a fine white powder.
Ac-Dex (200 mg) was dissolved in DCM (1 mL) and added to a solution of CTLp (10 mg) in
DMSO (50 µL). This mixture was emulsified by sonicating for 30 seconds on ice using a probe
sonicator (Branson Digital Sonifier 250) with a duty cycle of 20%. An aqueous solution of PVA
(2 mL, 3% w/v in PBS) was added to the emulsion and sonicated for an additional 30 seconds on
ice using the same setting except that the duty cycle was increased to 30%. The resulting emulsion

107
was immediately poured into a second PVA solution (10 ml, 0.3% w/v in PBS) and stirred for 4 h
allowing the organic solvent to evaporate. The particles were isolated by centrifugation (10,000
RPM, 20 min) and washed with PBS (30 mL) and MilliQ-H2O (2 x 30 mL, pH 8) by vortexing
and sonication followed by centrifugation and removal of the supernatant. The washed particles
were resuspended in MilliQ-H2O (2 mL, pH 8) and lyophilized to yield a white fluffy solid of
CTLp-Ac-Dex-MP. Empty particles without the peptide (Ac-Dex-MP) were prepared following
the same procedures omitting the CTLp.
2.4.4 Hydrolysis of CTLp-Ac-Dex-MPs and CTLp release from CTLp-Ac-Dex-MPs
Solutions of CTLp-Ac-Dex-MPs (4 mg/ml) were prepared in pH = 7.4, 6.5, 6 or 5.5 PBS
buffer respectively. These stock solutions were kept under room temperature or in 37 ‑ water bath.
UV-vis absorption at 600nm were measured every 1 - 4 hours over 72 hours. In order to measure
CTLp release rates, CTLp-Ac-Dex-MPs were dissolved in 4 ml of pH 7.4, 6.5, 6.0 and 5.5 PBS
buffer or RPMI-1640 cell culture media respectively. Each stock solution was divided into 4
Eppendorf tubes (1 ml each) and incubated at 37 ‑. At each time point (6, 12, 24, 48 h), one
Eppendorf tube from each group was taken out and centrifuged (10,000 rpm, 15 min). The pellets
were collected and dissolved in 0.5 ml H2O/trifluoroacetic acid (pH = 1), which were followed by
HPLC quantification using a standard curve (Appendix Figure 2.15).

108
2.4.5 Animals and Cell Lines
Pathogen free female C57BL/6 mice age 6 - 10 weeks were obtained from Charles River. EL4
cells were generously donated by Dr. Sandra Gendler (Mayo clinic). Cells were cultured in RPMI
medium 1640 supplemented with 10 % FBS, 1% L-glutamine, and 1% streptomycin penicillin.
B3Z cells was generously donated by Dr. Nilabh Shastri (University of California, Berkeley).
These cells were cultured in RPMI-1640 supplemented with 10% FBS, 1 mM pyruvate, 50 µM 2-
mercaptoethanol, 1% L-glutamine, and 1% streptomycin penicillin. MC38 cells were cultured in
DMEM medium supplement with 10% FBS, 1% L-glutamine, 1mM sodium pyruvate, 0.1mM
non-essential amino acid and 1% streptomycin penicillin. All cell lines were grown at 37 °C in a
5% CO2/air incubator.
2.4.6 Detection of CTLp Presentation on MHC-I of EL4 cells by FACS
EL4 cells were pulsed with increasing concentrations of either free CTLp or CTLp-Ac-Dex-
MPs and incubated at 37 °C in a 5% CO2/air incubator for 1 hour. Cells were washed 3 times with
FACS buffer (1 % FBS, 0.5 % NaN3 in PBS), stained with either anti-mouse H-2Kb bound to
SIINFEKL (Clone 25-D1.16) or anti-mouse IgG1K (isotype control) for 30 minutes in FACS
buffer on ice then washed with FACS buffer three times followed by FACS analysis. Control mAb
showed little cellular staining over background. In contrast, a dose dependent increase of cellular
fluorescence intensity was observed with mAb 25-D1.16 (Figure 2.4).

109
2.4.7 B3Z T Cell Activation Assay
2 x 10⁴ EL4 cells were cultured overnight in a 96 well plate and subsequently incubated with
CTLp-Ac-Dex-MPs or free CTLp at increasing concentrations. After 6 hours, the cells were
washed and 1x10⁵ B3Z cells were added to the EL4 cells and co-cultured for an additional 16
hours. The culture media was removed and 100 µL of CPRG buffer (9.1 mg of CPRG, 0.1% triton-
X and 90 mg MgCl2 in 100 mL of PBS) was added to each well. After 6 hours, the absorbance at
595 nm was measured using a microplate reader. The results were presented as a mean
quadruplicate.
2.4.8 Tumor protection studies against EL4 and MC38 tumor
C57BL/6 wild-type mice were immunized subcutaneously under the scruff on day 0 with 0.1
mL of ovalbumin (50 μg) as an emulsion in complete Freund’s adjuvant. Boosters were given on
days 14 and 28 with emulsion in incomplete Freund’s adjuvant. The mice were inoculated with
subcutaneous tumor (2 × 10⁵ EL4 or 5 × 10⁵ MC38 cells were injected) on the left flank on day
35. When the tumor size was about 70–90 mm3, intratumoral injection of either CTLp-Ac-Dex-
MPs, free CTLp, empty Ac-Dex-MPs, or PBS was performed every other day for a total of three
injections (10 mice per study group). For the groups where treatment was via intravenous injection,
mice were treated when tumor size was about 20–30 mm3 (usually on day 3 following tumor
inoculation). The amounts of injected CTLp were normalized to 7 μg for intravenous injection and
20 μg for intravenous injection. Tumor volume was determined using the formula: volume (cm)3

110
= 1/2(L ×W× H).40 Tumor growth was monitored by measuring the tumor volume every other day.
Mice were euthanized when the tumor volume was over 1.6 cm3 or ulceration of tumor was
observed.
2.4.9 In vivo CTL activity assay
To evaluate CTL activities induced by MP, naïve mice were injected intravenously through
tail vein with 1 mg CTLp-Ac-Dex-MP (with 20 μg OVA peptide encapsulated), 1 mg MP (empty)
+ 20 μg CTLp, or 20 μg CTLp, respectively, every other day with a total of three injections. On
day 7 after the final injection, a mixture of CFSElo- and CTLp pulsed CFSEhi splenic cells (0.2 ml,
2 million cells) was injected through tail vein to mice. The excess cell mixture was stored in culture
media under 37 °C as a “before injection” sample. Mice were euthanized after 24 h. Spleen cells
were collected and then suspended in 3 ml FACS buffer containing 30 μg/ml 7-aminoactinomycin
D (7-AAD). Three to four lymph nodes were collected from each mouse. Lymph nodes were set
in same Petri dish, smashed and filtered to create lymph node cell samples. Cells were washed
twice with PBS buffer and suspended in 1 ml FACS buffer containing 10 μg/ml 7-AAD. The
changes of ratio of CFSEhi to CFSElo before and after injection were determined from FITC-SSC
plot to calculate target cell viability.
2.4.10 CTLp distribution in organs and quantification of CD8+ T cell infiltration in
tumor
C57BL/6 mice with established subcutaneous MC38 tumor (~300 mm3) were injected with
CTLp-Ac-Dex-MPs (20 μg CTLp) or PBS. Animals were euthanized 9 h post-injection. Organs

111
(spleen, liver, lung and tumor) were collected from each mouse and digested into single-cell
suspension with collagenase IV (1 mg/ml in DMEM-F12 media) followed by washing with PBS
buffer twice. Cells were stained with anti-mouse H-2Kb bound to SIINFEKL (Clone 25-D1.16) or
anti-mouse IgG1K (isotype control) for 30 min in FACS buffer on ice and then washed with FACS
buffer three times followed by FACS analysis. Mean fluorescence intensity ratio of 25-D1.16
mAb-stained group versus isotype control group was recorded for each organ. In addition, single-
cell suspension of tumor from PBS group was stained with PE–anti-mouse CD8a mAb or PE–anti-
IgGa Ab (isotype control). FACS analysis was performed to determine the percentage of CD8+ T
cells in tumor.
2.4.11 CD8+ T cell infiltration in tumor
EL4 (2x10⁵) or MC38 (5x10⁵) cells were injected to C57BL/6 mice subcutaneously. Tumor
tissue was collected when tumor size reached ~300mm3. Collagenase IV (1mg/ml) in DMEM-F12
media was used to digest tumor tissue for single cell suspension preparation. The resulting cell
suspension was then washed with Hank’s Balanced Salt Solution (HBSS) supplemented with 2%
FBS twice and resuspended in FACS buffer. Cells were then stained with PE-Anti mouse CD8a
mAb or PE-Anti IgG2a,κ mAb (Isotype control) on ice in dark for 30min followed by washing
with FACS buffer twice. FACS analysis was done to determine percentage of CD8+ T cell
population.

112
APPENDIX
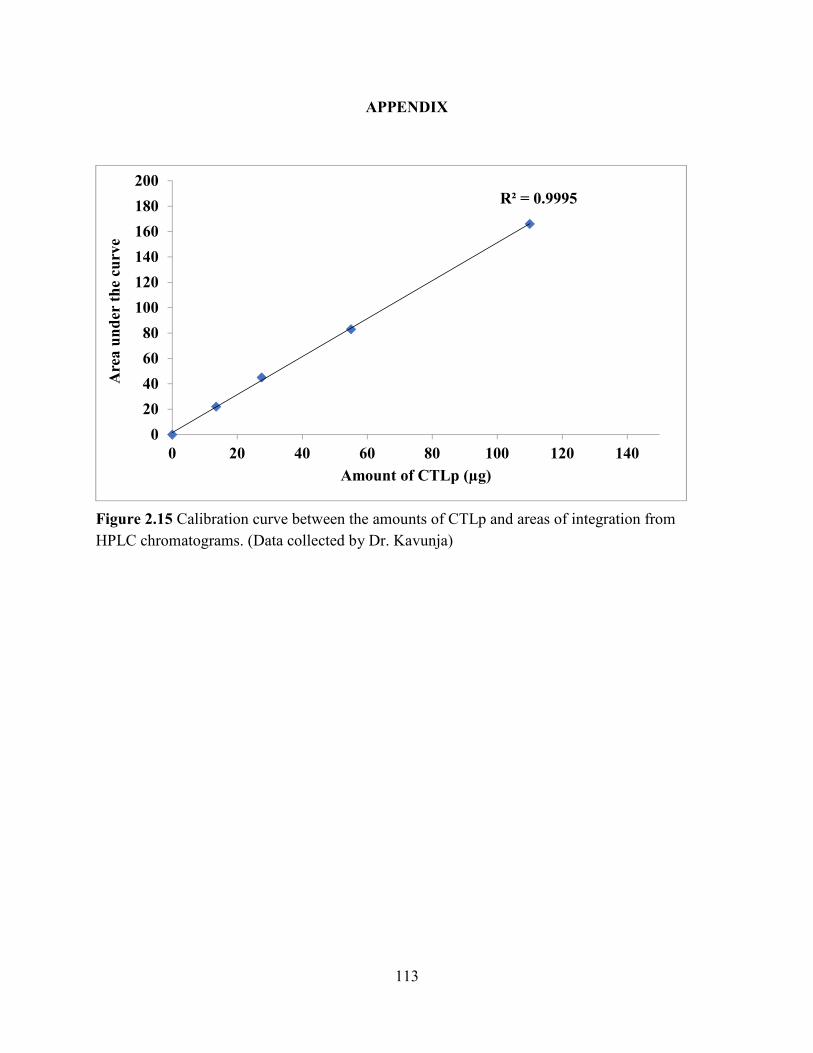
113
APPENDIX
Figure 2.15 Calibration curve between the amounts of CTLp and areas of integration from
HPLC chromatograms. (Data collected by Dr. Kavunja)
R² = 0.9995
0
20
40
60
80
100
120
140
160
180
200
0 20 40 60 80 100 120 140
Are
a u
nd
er t
he
curv
e
Amount of CTLp (µg)
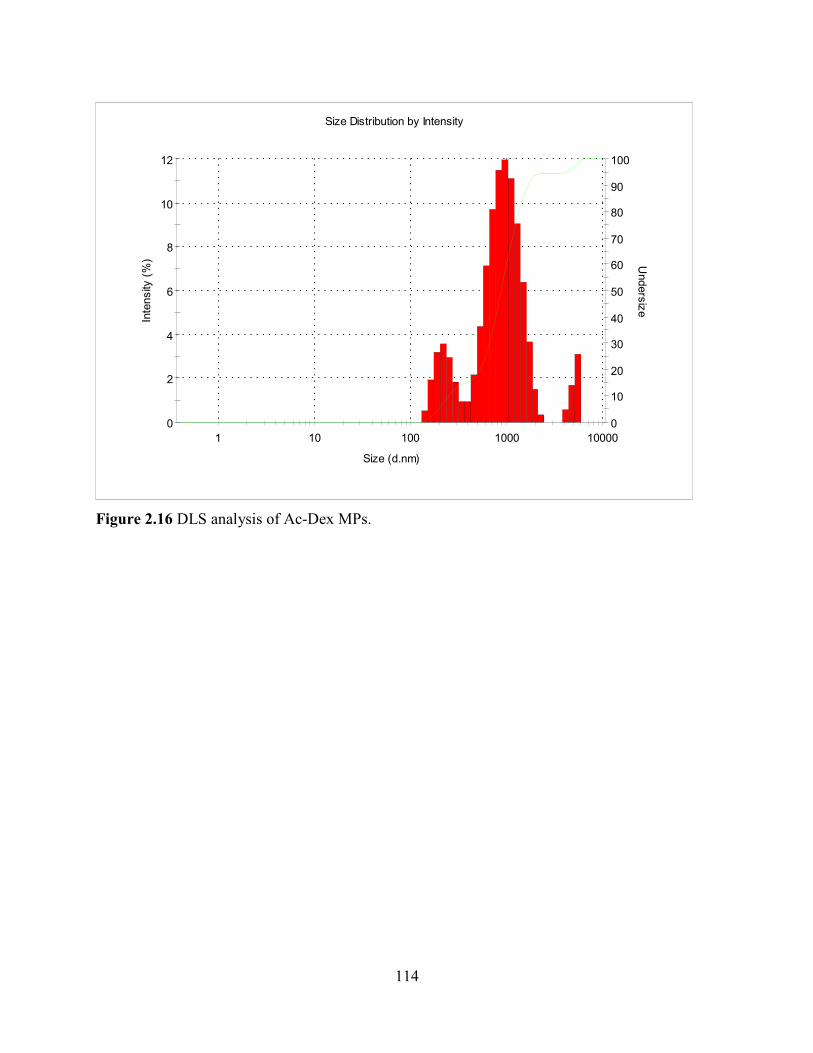
114
Figure 2.16 DLS analysis of Ac-Dex MPs.
0
2
4
6
8
10
12
1 10 100 1000 10000
Inte
nsity
(%
)
Size (d.nm)
0
10
20
30
40
50
60
70
80
90
100U
nders
ize
Size Distribution by Intensity

115
REFERENCES

116
REFERENCES
1. Kavunja, H. W.; Lang, S.; Sungsuwan, S.; Yin, Z.; Huang, X., Delivery of Foreign Cytotoxic
T Lymphocyte Epitopes to Tumor Tissues for Effective Antitumor Immunotherapy Against Pre-
established Solid Tumors in Mice. Cancer Immunol. Immunother. 2017, 66, 451-460.
2. Melero, I.; Gaudernack, G.; Gerritsen, W.; Huber, C.; Parmiani, G.; Scholl, S.; Thatcher, N.;
Wagstaff, J.; Zielinski, C.; Faulkner, I., Therapeutic Vaccines for Cancer: An Overview of Clinical
Trials. Nat. Rev. Clin. Oncol. 2014, 11, 509-524.
3. June, C. H., Adoptive T Cell Therapy for Cancer in the Clinic. J. Clin. Invest. 2007, 117, 1466-
1476.
4. Klein, L.; Kyewski, B.; Allen, P. M.; Hogquist, K. A., Positive and Negative Selection of the
T cell Repertoire: What Thymocytes See (and don't see). Nat. Rev. Immunol. 2014, 14, 377-391.
5. Uyttenhove, C.; Maryanski, J.; Boon, T., Escape of Mouse Mastocytoma P815 After Nearly
Complete Rejection is Due to Antigen-loss Variants Rather than Immunosuppression. J. Exp. Med.
1983, 157, 1040-1052.
6. Khong, H. T.; Restifo, N. P., Natural Selection of Tumor Variants in the Generation of “Tumor
Escape” Phenotypes. Nat. Immunol. 2002, 3, 999-1005.
7. Lakshminarayanan, V.; Supekar, N. T.; Wei, J.; McCurry, D. B.; Dueck, A. C.; Kosiorek, H.
E.; Trivedi, P. P.; Bradley, J. M.; Madsen, C. S.; Pathangey, L. B., MUC1 Vaccines, Comprised
of Glycosylated or Non-glycosylated Peptides or Tumor-derived MUC1, Can Circumvent
Immunoediting to Control Tumor Growth in MUC1 Transgenic Mice. PLoS One 2016, 11,
e0145920.
8. Dunn, G. P.; Bruce, A. T.; Ikeda, H.; Old, L. J.; Schreiber, R. D., Cancer Immunoediting:
From Immunosurveillance to Tumor Escape. Nat. Immunol. 2002, 3, 991-998.
9. Ward, P. L.; Koeppen, H. K.; Hurteau, T.; Rowley, D. A.; Schreiber, H., Major
histocompatibility complex class I and unique antigen expression by murine tumors that escaped
from CD8+ T-cell-dependent surveillance. Cancer Res. 1990, 50, 3851-3858.
10. Tlsty, T. D.; Coussens, L. M., Tumor Stroma and Regulation of Cancer Development. Annu.
Rev. Pathol. Mech. Dis. 2006, 1, 119-150.

117
11. Spiotto, M. T.; Schreiber, H., Rapid Destruction of the Tumor Microenvironment by CTLs
Recognizing Cancer-specific Antigens Cross-presented by Stromal Cells. Cancer Immun. 2005, 5,
8.
12. Schietinger, A.; Philip, M.; Liu, R. B.; Schreiber, K.; Schreiber, H., Bystander killing of
Cancer Requires the Cooperation of CD4+ and CD8+ T cells During the Effector Phase. J. Exp.
Med. 2010, 207, 2469-2477.
13. Spiotto, M. T.; Rowley, D. A.; Schreiber, H., Bystander Elimination of Antigen Loss Variants
in Established Tumors. Nat. Med. 2004, 10, 294-298.
14. Gao, W.; Chan, J. M.; Farokhzad, O. C., pH-Responsive Nanoparticles for Drug Delivery.
Mol. Pharmaceutics 2010, 7, 1913-1920.
15. Prabhakar, U.; Maeda, H.; Jain, R. K.; Sevick-Muraca, E. M.; Zamboni, W.; Farokhzad, O.
C.; Barry, S. T.; Gabizon, A.; Grodzinski, P.; Blakey, D. C., Challenges and Key Considerations
of the Enhanced Permeability and Retention Effect for Nanomedicine Drug Delivery in Oncology.
Cancer Res. 2013, 73, 2412-2417.
16. Maeda, H.; Bharate, G. Y.; Daruwalla, J., Polymeric Drugs for Efficient Tumor-targeted Drug
Delivery Based on EPR-effect. Eur. J. Pharm. Biopharm. 2009, 71, 409-419.
17. Tannock, I. F.; Rotin, D., Acid pH in Tumors and Its Potential for Therapeutic Exploitation.
Cancer Res. 1989, 49, 4373-4384.
18. Bachelder, E. M.; Beaudette, T. T.; Broaders, K. E.; Dashe, J.; Fréchet, J. M. J., Acetal-
derivatized Dextran: An Acid-responsive Biodegradable Material for Therapeutic Applications. J.
Am. Chem. Soc. 2008, 130, 10494-10495.
19. Apostolopoulos, V.; Haurum, J. S.; McKenzie, I. F. C., MUC1 Peptide Epitopes Associated
with Five Different H‑2 Class I Molecules. Eur. J. Immunol. 1997, 27, 2579-2587.
20. Bilati, U.; Allémann, E.; Doelker, E., Sonication Parameters for the Preparation of
Biodegradable Nanocapsulesof Controlled Size by the Double Emulsion Method. Pharm. Dev.
Technol. 2003, 8, 1-9.
21. Eisen, H. N.; Hou, X. H.; Shen, C.; Wang, K.; Tanguturi, V. K.; Smith, C.; Kozyrytska, K.;
Nambiar, L.; McKinley, C. A.; Chen, J., Promiscuous Binding of Extracellular Peptides to Cell
Surface Class I MHC Protein. Proc. Natl. Acad. Sci. U. S. A. 2012, 109, 4580-4585.

118
22. Karttunen, J.; Shastri, N., Measurement of Ligand-induced Activation in Single Viable T Cells
Using the lacZ Reporter Gene. Proc. Natl. Acad. Sci. U. S. A. 1991, 88, 3972-3976.
23. Ke, Y.; Li, Y.; Kapp, J. A., Ovalbumin Injected with Complete Freund's Adjuvant Stimulates
Cytolytic Responses. Eur. J. Immunol. 1995, 25, 549-553.
24. Durward, M.; Harms, J.; Splitter, G., Antigen Specific in vivo Killing Assay using CFSE
Labeled Target Cells. J. Vis. Exp. 2010, e2250.
25. Breart, B.; Lemaître, F.; Celli, S.; Bousso, P., Two-photon Imaging of Intratumoral CD8+ T
Cell Cytotoxic Activity During Adoptive T Cell Therapy in Mice. J. Clin. Invest. 2008, 118, 1390-
1397.
26. Fosgerau, K.; Hoffmann, T., Peptide Therapeutics: Current Status and Future Directions. Drug
Discovery Today 2015, 20, 122-128.
27. Varna, M.; Ratajczak, P.; Ferreira, I.; Leboeuf, C.; Bousquet, G.; Janin, A., In vivo Distribution
of Inorganic Nanoparticles in Preclinical Models. J. Biomater. Nanobiotechnol. 2012, 3, 269-279.
28. Shao, K.; Singha, S.; Clemente-Casares, X.; Tsai, S.; Yang, Y.; Santamaria, P., Nanoparticle-
based Immunotherapy for Cancer. ACS Nano 2015, 9, 16-30.
29. Kang, T. H.; Knoff, J.; Yang, B.; Tsai, Y.-C.; He, L.; Hung, C.-F.; Wu, T. C., Control of
Spontaneous Ovarian Tumors by CD8+ T Cells Through NKG2D-targeted Delivery of Antigenic
Peptide. Cell Biosci. 2013, 3, 48.
30. Song, L.; Yang, M.-C.; Knoff, J.; Sun, Z.-Y.; Wu, T. C.; Hung, C.-F., Cancer Immunotherapy
Using a Potent Immunodominant CTL Epitope. Vaccine 2014, 32, 6039-6048.
31. Kanzaki, M.; Okamoto, T.; Mitsui, H.; Shibagaki, N.; Shimada, S., A Novel
Immunotherapeutic Approach to Melanoma-bearing Hosts with Protein-transduction Domain-
containing Immunogenic Foreign Antigens. J. Dermatol. Sci. 2010, 60, 84-94.
32. Lee, Y.-H.; Yoon, H. Y.; Shin, J. M.; Saravanakumar, G.; Noh, K. H.; Song, K.-H.; Jeon, J.-
H.; Kim, D.-W.; Lee, K.-M.; Kim, K., A Polymeric Conjugate Foreignizing Tumor Cells for
Targeted Immunotherapy in vivo. J. Controlled Release 2015, 199, 98-105.
33. Cohen, J. A.; Beaudette, T. T.; Cohen, J. L.; Broaders, K. E.; Bachelder, E. M.; Fréchet, J. M.
J., Acetal‑modified Dextran Microparticles with Controlled Degradation Kinetics and Surface

119
Functionality for Gene Delivery in Phagocytic and Non‑phagocytic Cells. Adv. Mater. 2010, 22,
3593-3597.
34. Peine, K. J.; Guerau-de-Arellano, M.; Lee, P.; Kanthamneni, N.; Severin, M.; Probst, G. D.;
Peng, H.; Yang, Y.; Vangundy, Z.; Papenfuss, T. L., Treatment of Experimental Autoimmune
Encephalomyelitis by Codelivery of Disease Associated Peptide and Dexamethasone in Acetalated
Dextran Microparticles. Mol. Pharmaceutics 2014, 11, 828-835.
35. Suarez, S.; Grover, G. N.; Braden, R. L.; Christman, K. L.; Almutairi, A., Tunable Protein
Release from Acetalated Dextran Microparticles: A Platform for Delivery of Protein Therapeutics
to the Heart Post-MI. Biomacromolecules 2013, 14, 3927-3935.
36. Feltkamp, M. C. W.; Smits, H. L.; Vierboom, M. P. M.; Minnaar, R. P.; De Jongh, B. M.;
Drijfhout, J. W.; Schegget, J. T.; Melief, C. J. M.; Kast, W. M., Vaccination with Cytotoxic T
lymphocyte Epitope‑containing Peptide Protects Against a Tumor Induced by Human
Papillomavirus Type 16‑transformed Cells. Eur. J. Immunol. 1993, 23, 2242-2249.
37. Vitiello, A.; Ishioka, G.; Grey, H. M.; Rose, R.; Farness, P.; LaFond, R.; Yuan, L.; Chisari, F.
V.; Furze, J.; Bartholomeuz, R., Development of a Lipopeptide-based Therapeutic Vaccine to
Treat Chronic HBV Infection. I. Induction of a Primary Cytotoxic T Lymphocyte Response in
Humans. J. Clin. Invest. 1995, 95, 341-349.
38. Wherry, E. J.; Ahmed, R., Memory CD8 T-cell Differentiation During Viral Infection. J. Virol.
2004, 78, 5535-5545.
39. Pardoll, D. M., The Blockade of Immune Checkpoints in Cancer Immunotherapy. Nat. Rev.
Cancer 2012, 12, 252-264.
40. Tomayko, M. M.; Reynolds, C. P., Determination of Subcutaneous Tumor Size in Athymic
(Nude) Mice. Cancer Chemother. Pharmacol. 1989, 24, 148-154.
120
CHAPTER 3 Synthesis of Carboxy-Dimethylmaleic Amide Linked Polymer Conjugates
Based pH Ultrasensitive Nanoparticles for Enhanced T Cell Based Anti-Tumor
Immunotherapy1
Adapted with permission from (Lang, S.; Tan, Z.; Wu, X.; Huang, X., Synthesis of Carboxy-
Dimethylmaleic Amide Linked Polymer Conjugate Based Ultra-pH-sensitive Nanoparticles for
Enhanced Antitumor Immunotherapy. ACS Macro Letters 2020, 9, 1693-1699,
https://pubs.acs.org/doi/abs/10.1021/acsmacrolett.0c00755). Copyright (2020) American
Chemical Society.)
3.1 Introduction
Anti-cancer vaccines are a promising new strategy for cancer prevention and treatment.2-3
Cytotoxic T lymphocytes (CTLs) are an important component of the adaptive immune system to
fight against cancer. CTLs recognize short peptide epitopes typically between 8 and 11 amino
acids in length,4 and cancer specific CTLs are capable of killing tumor cells and protecting against
tumor development. However, direct administration of CTL peptides is often ineffective to induce
strong CTL activation.
An appealing strategy in eliciting CTLs is utilizing macromolecular carriers to deliver peptide
epitopes to immune cells or tumor tissues.5-7 For such systems, it is desirable to build in stimuli
responsive mechanisms to regenerate and release the free antigens once the vaccine reaches the
targeted sites.8-10 We hypothesize that new pH sensitive polymer-based particles capable of
responding to pH values around 6.5 can be a powerful vaccine delivery system. We chose to focus
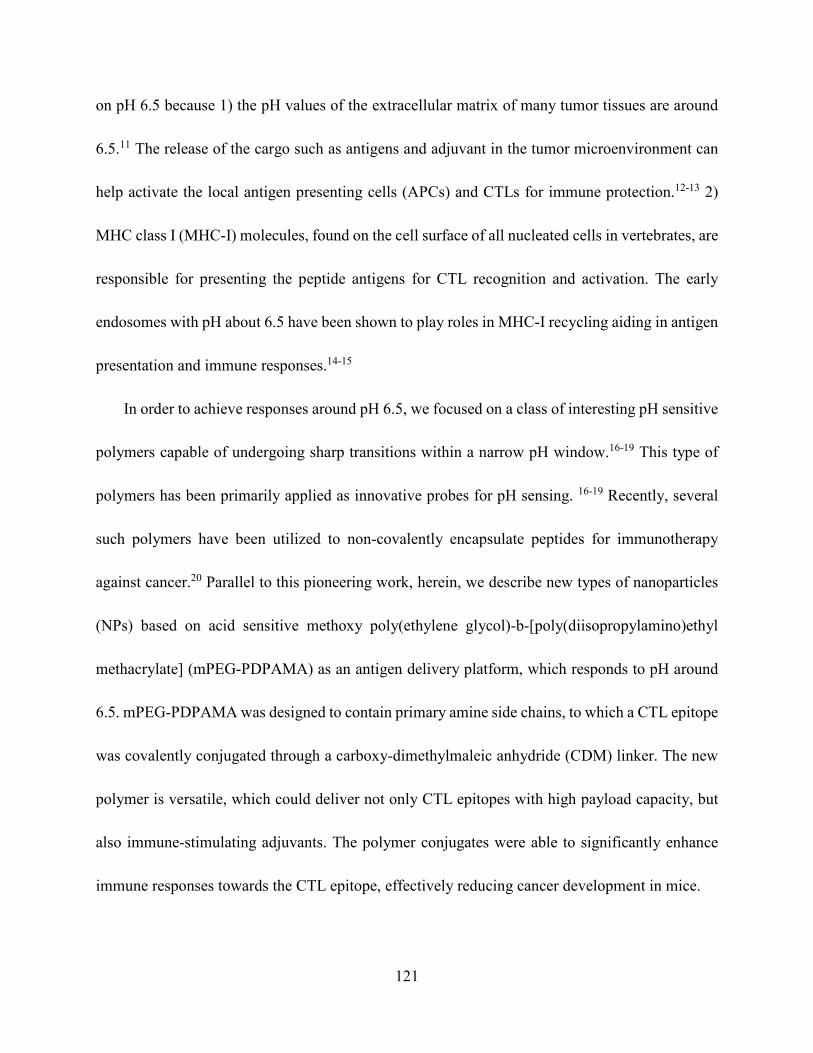
121
on pH 6.5 because 1) the pH values of the extracellular matrix of many tumor tissues are around
6.5.11 The release of the cargo such as antigens and adjuvant in the tumor microenvironment can
help activate the local antigen presenting cells (APCs) and CTLs for immune protection.12-13 2)
MHC class I (MHC-I) molecules, found on the cell surface of all nucleated cells in vertebrates, are
responsible for presenting the peptide antigens for CTL recognition and activation. The early
endosomes with pH about 6.5 have been shown to play roles in MHC-I recycling aiding in antigen
presentation and immune responses.14-15
In order to achieve responses around pH 6.5, we focused on a class of interesting pH sensitive
polymers capable of undergoing sharp transitions within a narrow pH window.16-19 This type of
polymers has been primarily applied as innovative probes for pH sensing. 16-19 Recently, several
such polymers have been utilized to non-covalently encapsulate peptides for immunotherapy
against cancer.20 Parallel to this pioneering work, herein, we describe new types of nanoparticles
(NPs) based on acid sensitive methoxy poly(ethylene glycol)-b-[poly(diisopropylamino)ethyl
methacrylate] (mPEG-PDPAMA) as an antigen delivery platform, which responds to pH around
6.5. mPEG-PDPAMA was designed to contain primary amine side chains, to which a CTL epitope
was covalently conjugated through a carboxy-dimethylmaleic anhydride (CDM) linker. The new
polymer is versatile, which could deliver not only CTL epitopes with high payload capacity, but
also immune-stimulating adjuvants. The polymer conjugates were able to significantly enhance
immune responses towards the CTL epitope, effectively reducing cancer development in mice.

122
3.2 Results and Discussions
3.2.1 Synthesis and characterization of mPEG-PDPAMA polymer
The synthesis of the mPEG-PDPAMA 3 polymer started from atom transfer radical
polymerization (ATRP) of (diisopropylamino)ethyl methacrylate monomer (DPAMA) 2 with
mPEG-Br initiator 1 (Scheme 3.1a). The resulting polymer has a number average molecular
weight (Mn) of 20,500 calculated from the ratio of 1H-NMR (Scheme 3.1d) integration values of
the terminal methyl group (proton a) vs the methylene (proton e, f) and the methine (proton g) of
the repeating units of the polymer, with a polydispersity index (PDI) below 1.2 (Figure 3.1).
Titration of the polymer solution with base showed its pKa value of 6.46 (Scheme 3.1e). The
mPEG-PDPAMA 3 formed NPs with average diameters of 109 nm when added into pH 7.4 PBS
buffer under sonication (Scheme 3.1f). The dynamic light scattering (DLS) count rate of NP
dispersion in pH 7.4 PBS buffer decreased rapidly when pH value of the solution was lowered to
6.5, reaching the background level at pH below 6.0 (Scheme 3.1g). The DLS results suggested the
disassembly of NPs at pH between 6.0 and 6.6, consistent with the pKa value of 6.46 for the
polymer.
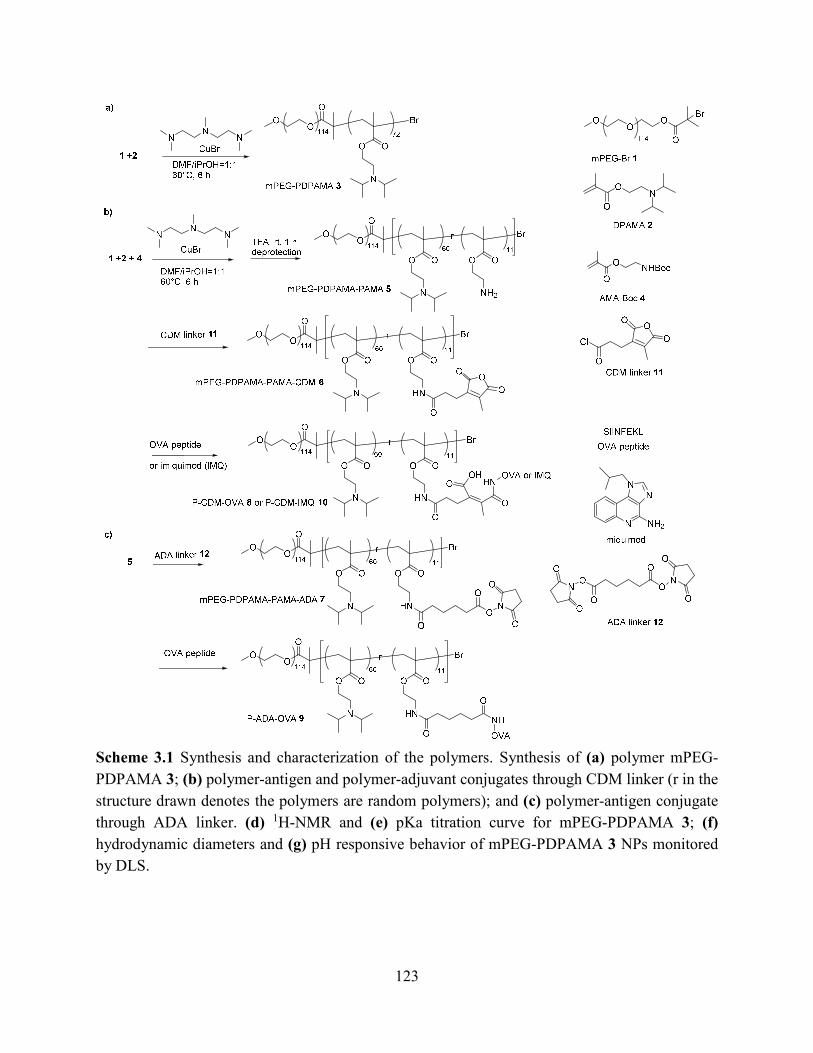
123
Scheme 3.1 Synthesis and characterization of the polymers. Synthesis of (a) polymer mPEG-
PDPAMA 3; (b) polymer-antigen and polymer-adjuvant conjugates through CDM linker (r in the
structure drawn denotes the polymers are random polymers); and (c) polymer-antigen conjugate
through ADA linker. (d) 1H-NMR and (e) pKa titration curve for mPEG-PDPAMA 3; (f)
hydrodynamic diameters and (g) pH responsive behavior of mPEG-PDPAMA 3 NPs monitored
by DLS.

124
Scheme 3.1 (cont’d)

125
Figure 3.1 GPC data for synthetic polymers. a. mPEG-PDPAMA 3, b. mPEG-(PDPAMA-ran-
PAMA-Boc)
An important criterion for designing biomaterials is that they should be biocompatible without
undesired side effects such as inflammation. The mPEG-PDPAMA polymer 3 was incubated with
macrophages or dendritic cells, which did not activate these cells (Figure 3.2) indicating the
polymer alone had little inflammatory activities.
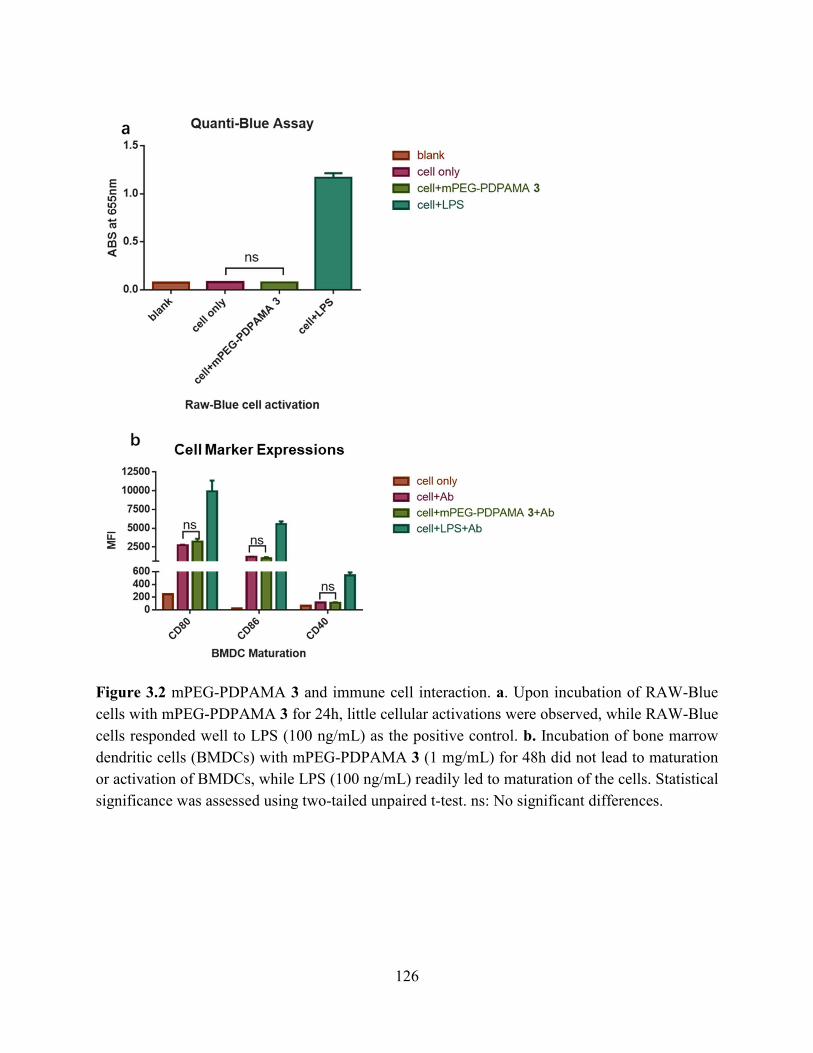
126
Figure 3.2 mPEG-PDPAMA 3 and immune cell interaction. a. Upon incubation of RAW-Blue
cells with mPEG-PDPAMA 3 for 24h, little cellular activations were observed, while RAW-Blue
cells responded well to LPS (100 ng/mL) as the positive control. b. Incubation of bone marrow
dendritic cells (BMDCs) with mPEG-PDPAMA 3 (1 mg/mL) for 48h did not lead to maturation
or activation of BMDCs, while LPS (100 ng/mL) readily led to maturation of the cells. Statistical
significance was assessed using two-tailed unpaired t-test. ns: No significant differences.
127
3.2.2 Non-covalent OVA peptide encapsulation with mPEG-PDPAMA 3 particles
With the mPEG-PDPAMA 3 polymer in hand, the non-covalent encapsulation of a
prototypical CTL antigen OVA peptide (SIINFEKL) was tested first. The OVA peptide was
dissolved together with mPEG-PDPAMA in THF/dimethylsulfoxide (DMSO) (v/v = 10: 1) and
added to pH 7.4 PBS buffer. The resulting particles (diameter ~110 nm) were passed through a
G25 size exclusion column to remove any free peptides. The peptide loading level was 2 wt%
based on HPLC quantification after dissembling the particles with 0.1% trifluoroacetic acid (TFA)
in water. However, when the NPs were kept in pH 7.4 PBS buffer for 2 h, significant amounts
(>80%) of the OVA peptide were found in solution, which suggested leakage of the peptide from
the NPs. We surmised that the undesired leakage of the cargo was due to insufficient
hydrophobicity in the NP interior. To overcome this, a new mPEG-PDPAMA polymer was
synthesized with an additional monomer, i.e., nbutyl methacrylate, either via random or block
polymerization, to potentially enhance the hydrophobic interactions between the polymer carrier
and OVA peptide. However, while the new copolymer formed NPs in pH 7.4 PBS buffer, it did
not improve much the retention of OVA peptide inside the particles.
3.2.3 Synthesis of covalent OVA-polymer conjugate P-CDM-OVA 8 and OVA release
profile
In order to reduce the undesired premature antigen release from non-covalent encapsulation,
we decided to test the covalent attachment approach, which has not been reported before with the
ultra pH sensitive NPs. We introduced protected primary amines into the polymer by co-

128
polymerizing DPAMA 2 with Boc-2-aminoethyl methacrylate (Boc-AMA) monomer 4 at 6 : 1
ratio (Scheme 3.1b). Analysis of the resulting polymer product by 1H-NMR indicated the ratio of
the repeating units from DPAMA 2 and Boc-AMA 4 was 60 : 11, suggesting similar
polymerization rates of the two monomers. The Mn of the polymer was ~20,500 based on 1H-
NMR analysis and the GPC analysis suggested a narrow PDI (Figure 3.1b). Addition of TFA to
the polymer removed the Boc moieties generating free primary amines in the mPEG-PDPAMA-
PAMA polymer 5. To conjugate the peptide to PDPAMA-PAMA 5, the carboxy-dimethylmaleic
anhydride (CDM) linker was used (Scheme 3.1b). CDM is known to readily react with a primary
amine, and the resulting maleic amide is acid sensitive and cleavable at pH below 6.5 to release
the free amine.21 As a control, adipic acid (ADA) was used as the linker to form amides, which are
not cleavable at pH around 6.5 (Scheme 3.1c). OVA peptides were conjugated with the polymer
through either CDM or ADA, forming polymer-CDM-OVA peptide conjugate (P-CDM-OVA 8)
and polymer-ADA-OVA peptide conjugate (P-ADA-OVA 9) respectively (Schemes 3.1b, c). The
conjugation reactions were highly efficient with over 90% of the peptide added covalently linked
with the polymer. The peptide loadings in both P-CDM-OVA 8 and P-ADA-OVA 9 were about
10 wt%, which were 5 times vs those achieved through the non-covalent encapsulation methods
highlighting the advantage of covalent conjugation. P-CDM-OVA 8 and P-ADA-OVA 9 polymers
both formed NPs in pH 7.4 PBS buffer with average hydrodynamic diameters of 170 nm as
determined by DLS (Figure 3.3a, b).

129
Figure 3.3 Hydrodynamic diameters of nanoparticles formed by various polymer-antigen or
polymer-adjuvant conjugates. a. P-ADA-OVA particles at pH 7.4. b. P-CDM-OVA particles at
pH 7.4. c. P-CDM-IMQ particles at pH 7.4. d. DLS scattering count rate for P-CDM-OVA
particles at different pH values e. P-CDM-OVA/P-CDM-IMQ hybrid particles at pH 7.4.

130
Figure 3.3 (cont’d)
We next tested the stability of the P-CDM-OVA 8. Interestingly, while the NPs dissembled
readily at pH below 6.4 based on DLS scattering count rate measurement (Figure 3.3d), the release
of OVA peptide was much slower. At pH 7.4, no releases were detected at all after one week.
When incubation in pH 4.5 buffer, only 17.6% OVA peptide was released from the polymer after
one week (Figure 3.4a). As a control experiment, we reacted dimethylmaleic anhydride with OVA
peptide, and the resulting derivative was completely hydrolyzed to regenerate OVA peptide at pH
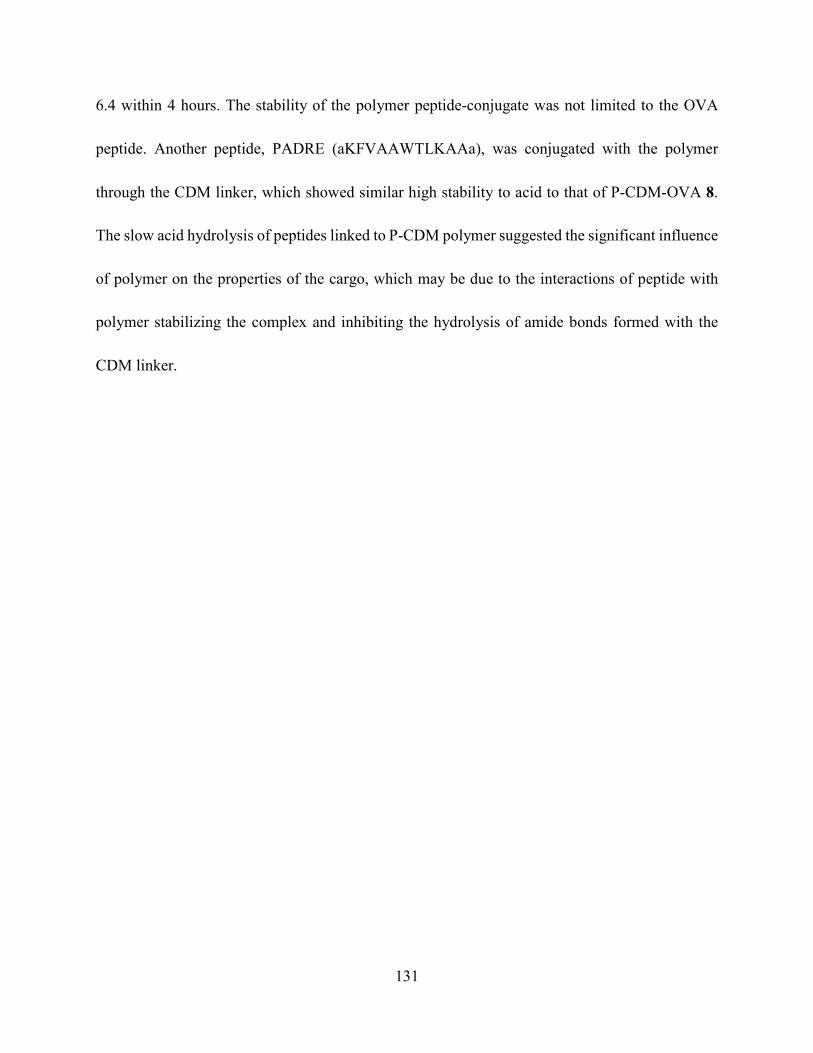
131
6.4 within 4 hours. The stability of the polymer peptide-conjugate was not limited to the OVA
peptide. Another peptide, PADRE (aKFVAAWTLKAAa), was conjugated with the polymer
through the CDM linker, which showed similar high stability to acid to that of P-CDM-OVA 8.
The slow acid hydrolysis of peptides linked to P-CDM polymer suggested the significant influence
of polymer on the properties of the cargo, which may be due to the interactions of peptide with
polymer stabilizing the complex and inhibiting the hydrolysis of amide bonds formed with the
CDM linker.
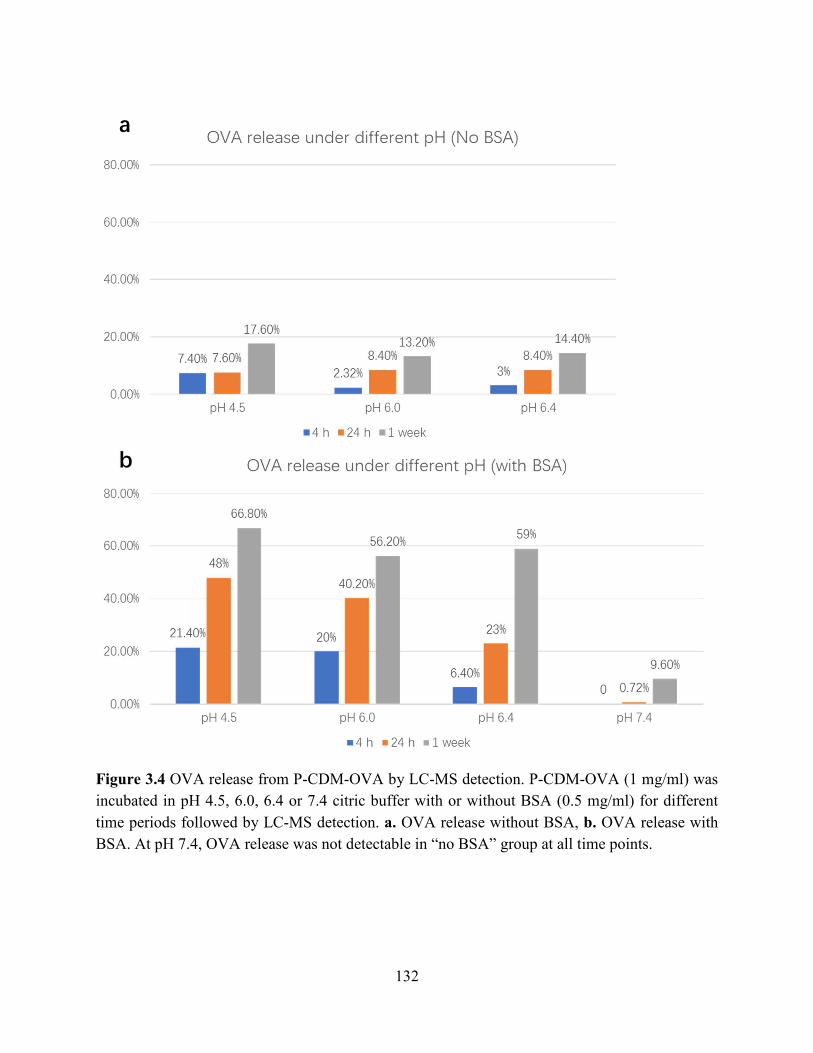
132
Figure 3.4 OVA release from P-CDM-OVA by LC-MS detection. P-CDM-OVA (1 mg/ml) was
incubated in pH 4.5, 6.0, 6.4 or 7.4 citric buffer with or without BSA (0.5 mg/ml) for different
time periods followed by LC-MS detection. a. OVA release without BSA, b. OVA release with
BSA. At pH 7.4, OVA release was not detectable in “no BSA” group at all time points.
133
To analyze whether P-CDM-OVA 8 could deliver the OVA peptide to cells, the polymer was
incubated with EL4 lymphoma cells and probed with the monoclonal antibody (mAb) D1.16,
which specifically recognizes the complex of OVA peptide with MHC-I on cell surface. The
binding of OVA by MHC-I is required for activation of OVA specific T cells. Significant amounts
of OVA bound MHC-I complexes were detected on EL4 cells by D1.16 mAb comparable to the
levels when free OVA was added to EL4 cells up to 24 hours (Figure 3.5). P-CDM-OVA 8 could
better sustain OVA release, as at 48 and 72 hours, cells incubated with P-CDM-OVA 8 presented
much higher levels of OVA vs those treated with free OVA. This suggested the successful
intracellular release, and cell surface display of OVA on MHC-I enabled by P-CDM-OVA 8. In
contrast, incubation of EL4 cells with P-ADA-OVA 9 led to little OVA displayed on cell surface
after 24 hours (Figure 3.5). These results highlight the importance of the CDM linker in P-CDM-
OVA 8 for antigen release and presentation by MHC-I.
134
Figure 3.5 Presentation of OVA peptide on EL4 cells. Free OVA peptide (100 ng) or polymers
containing 100 ng OVA peptide were incubated with EL4 cells for a certain time period. The cells
were then washed and stained with PE labeled antibody D1.16 specific against anti-H2Kb bound
to SIINFEKL or anti-mouse IgG1K (isotype control) followed by fluorescence-activated cell sorter
(FACS) analysis.
It is interesting that while the OVA peptide was released slowly from P-CDM-OVA 8 in buffer,
significant cellular presentation of OVA peptide could be observed after only 2 hour co-incubation
of P-CDM-OVA 8 and EL4 cells (Figure 3.5). To gain a better understanding of the acceleration
of OVA cleavage upon cellular incubation, we incubated P-CDM-OVA 8 in pH 4.5, 6.0 and 6.4
citrate acid buffers with bovine serum albumin (BSA) protein (P-CDM-OVA 8 : BSA = 2 : 1, w/w)
to mimic proteins NPs may encounter in the biological system. Surprisingly, in the presence of
BSA, the release of OVA peptide from P-CDM-OVA 8 was much accelerated. After 1-week
incubation with BSA, 59% of the OVA peptide was released in pH 6.4, compared to 14.4% OVA

135
release after 1-week incubation without BSA at the same pH value (Figure 3.4b). Significant
amounts of the free peptide were observed at 4 hours at pH values 6.4 or lower, providing an
explanation of the significant peptide presentation by EL4 cells after a short period. The OVA
release remained low at pH 7.4 (9.6%) after one week even with the addition of BSA, which
indicated the OVA release was facilitated by both slightly acidic pH and the presence of a protein.
Thus, a possible mechanism for the acceleration of cellular OVA release from P-CDM-OVA 8 is
that proteins present in cells culture such as BSA in the medium, or MHC-I molecules on the
surface of EL4 cells may interact with the OVA peptide. These proteins can compete with the
polymer for OVA interactions. This may reduce the interaction of the polymer with OVA,
sensitizing the maleic amide towards acid mediated cleavage and enabling the loading of OVA
onto MHC-I for cell surface presentation.
3.2.4 CTL activation by P-CDM-OVA 8 in vitro and in vivo
With its ability to deliver CTL epitopes established, P-CDM-OVA 8 was analyzed for CTL
activation. P-CDM-OVA 8, free OVA or a mixture of empty NP with OVA was incubated with
bone marrow derived dendritic cells (BMDCs) for 12 hours. BMDCs were then extensively
washed to remove unbound peptide or NPs. B3Z T cells, which can specifically recognize and be
activated by OVA peptide presented on MHC-I molecules, were then added and co-cultured for
another 24 hours. BMDCs pulsed with free OVA activated B3Z cells, and the addition of empty
mPEG-PDPAMA 3 NP with free OVA did not interfere with B3Z activation (Figure 3.6a). P-

136
CDM-OVA 8 could deliver OVA to BMDCs to activate B3Z cells in a dose dependent manner
similar to free OVA, while the empty NPs showed low B3Z activation even at 10 times the
concentration of the corresponding NP (Figure 3.6a).
Figure 3.6 B3Z assay for detecting in vitro CTL activation. a. 2x10⁴ BMDCs were co-cultured
with empty NPs or various formulations of OVA (at 0.1-1,000 ng total amounts of OVA peptide),
in 96-well plate for 12 hours. The cells were then washed and 1x10⁵ B3Z cells were added to the
plate and co-cultured for another 24h. b. To evaluate the effects of different combinations of

137
Figure 3.6 (cont’d) antigen and adjuvant, 2x10⁴ BMDCs were co-cultured with the mixture of
separate particles P-CDM-OVA 8 +P-CDM-IMQ 10 (0.1-1,000 ng OVA peptide and 0.1-1000 ng
IMQ), or the hybrid particles P-CDM-OVA 8/P-CDM-IMQ 10 (0.1-1,000 ng OVA peptide and
0.1-1000 ng IMQ). Cells were incubated for 12 hours followed by washing and the addition of
1x10⁵ B3Z cells for another 24 hours co-incubation. Absorbance values at 595 nm were measured
and normalized against the value at maximum B3Z cell activation. Statistical significance was
assessed using two-tailed unpaired t-test. ns: No significant difference; *p<0.05; **p<0.01;
***p<0.001.
CTL activation by P-CDM-OVA 8 in vivo was evaluated next. Mice were vaccinated with P-
CDM-OVA 8 by three weekly injections. To establish the best route for vaccination, P-CDM-
OVA 8 was administered either subcutaneously or intravenously, with the resulting CTL activities
of immunized animals determined by the in vivo CTL assay.22 As shown in Figure 3.7, P-CDM-
OVA 8 vaccination induced OVA specific CTL responses, as shown by specific lysis of OVA
containing target cells in both spleens and lymph nodes. Subcutaneous (SC) administration of P-
CDM-OVA 8 elicited stronger CTL activation compared to intravenous (IV) injection. Thus, the
SC route was used in further studies. While free OVA peptide could activate B3Z cells in vitro,
administration of free OVA peptide in vivo failed to generate much CTL response (vide infra). The
significant in vivo CTL activation induced by P-CDM-OVA 8 highlights the importance of using
pH responsive polymers for delivery.

138
Figure 3.7 In vivo CTL activation assay. Mice (3 per group) were first immunized with P-CDM-
OVA subcutaneously (SC) and intravenously (IV), or Ace-Dex-OVA subcutaneously (SC).
CFSEhi labeled OVA peptide pulsed target cells were injected together with CFSElo labeled control
cells 3 days after the last immunization. Mice were euthanized 24 hours after cell injection and
spleen and lymph nodes were collected for FACS analysis. Target cell survival was calculated by
the target: control cell ratio changes before and after injection. Statistical significance was assessed
using the two-tailed unpaired t-test. * p<0.05, **p<0.01, ***p<0.001
As a comparison to P-CDM-OVA 8, we prepared another pH responsive polymer, i.e.,
acetalated dextran polymer, following the previously established procedure, which formed
microparticles (Ace-Dex MPs).23 The Ace-Dex MPs could encapsulate peptide non-covalently,
with a modest loading (~ 2% w/w). The peptide could be released rapidly at pH lower than 5.5 and
taken up by antigen presenting cells (APCs) and tumor cells leading to potent CTL activation.
Mice were immunized with the Ace-Dex-OVA MPs following the same immunization protocol as
P-CDM-OVA 8. CTL assay showed that mice immunized with P-CDM-OVA 8 exhibited
significantly higher killing activities than those administered with Ace-Dex-OVA MPs (Figure

139
3.7). This demonstrates P-CDM-OVA 8 is superior to Ace-Dex-OVA in activation of OVA
specific CTLs.
3.2.5 Combining P-CDM-OVA 8 with an adjuvant-polymer conjugate P-CDM-IMQ 10
for optimized immune activation
The addition of a co-stimulatory signal to the immune system together with the vaccine can
potentially enhance CTL responses. We investigated next the possibility of incorporating a small
molecule adjuvant imiquimod (IMQ) to the vaccine formulation using the same pH responsive
polymer platform. IMQ is an agonist of Toll like receptor-7 (TLR-7) for immune potentiation. We
conjugated IMQ to mPEG-PDPAMA-AMA 5 through the CDM linker producing P-CDM-IMQ
10 with 10wt% loading of IMQ (Scheme 3.1b). Interestingly, the P-CDM-IMQ 10 pH release
profile was different from that of P-CDM-OVA 8. Within 2 h, 100% and 50% IMQ releases were
observed when P-CDM-IMQ 10 was incubated in buffers at pH=4.5 and 6.0 respectively (Figure
3.8). The more rapid release of IMQ from P-CDM-IMQ 10 supports the aforementioned idea that
the slow rate of OVA release from P-CDM-OVA 8 in buffer in the absence of BSA was due to
polymer/peptide interaction.

140
Figure 3.8 Cumulative release rates of imiquimod from P-CDM-IMQ 10 under different pH. P-
CDM-IMQ 10 was diluted in buffer with different pH values. At each time point, an aliquot of
solution was collected followed by centrifuge filtration. The amounts of released IMQ in flow-
through were calculated from the values of UV-Vis absorbance at 318nm.
To test the impact of polymer conjugation on adjuvant activities, macrophage Raw-Blue cells
were incubated with free IMQ and P-CDM-IMQ 10. Stronger Raw-Blue cell activations by P-
CDM-IMQ 10 were observed compared to that by free IMQ at IMQ concentration higher than 0.1
µg (Figure 3.9) suggesting the advantage of polymer aided adjuvant delivery. The loading levels
of IMQ on polymer did not significantly impact cellular activation when the same total amounts
of IMQ were added (Figure 3.10), and the loading level of P-CDM-IMQ 10 was controlled at 10
wt% for subsequent studies.
Cu
mu
lati
ve R
ele
ase %

141
P-C
DM
-IMQ 2
µg/m
l
IMQ 2
µg/m
l
P-C
DM
-IMQ 1
µg/m
l
IMQ 1
µg/m
l
P-CDM
-IMQ 0
.5µg/m
l
IMQ 0
.5µg/m
l
P-CDM
-IMQ 0
.1µg/m
l
IMQ 0
.1µg/m
l
LPS 100
ng/ml
cell
only
mPEG
-PDPA
MA 3
Bla
nk
0.0
0.2
0.4
0.6
0.8
Quanti-Blue Assay
AB
S a
t 655n
m
**
*** *
ns
Figure 3.9 Macrophage cells activation by free IMQ and P-CDM-IMQ. 1x10⁵ Raw-Blue cells
were incubated with different concentration of free IMQ and P-CDM-IMQ 10, 100ng LPS
(positive control) or mPEG-PDPAMA 3 for 24 h. 20 μL cell culture supernatant was collected and
added to Quanti-Blue™ solution and incubated for another 2 h. Absorbance at 655nm was
measured. Statistical significance was assessed using two-tailed unpaired t-test. ns: no significant
difference; *p<0.05; **p<0.01; ***p<0.001
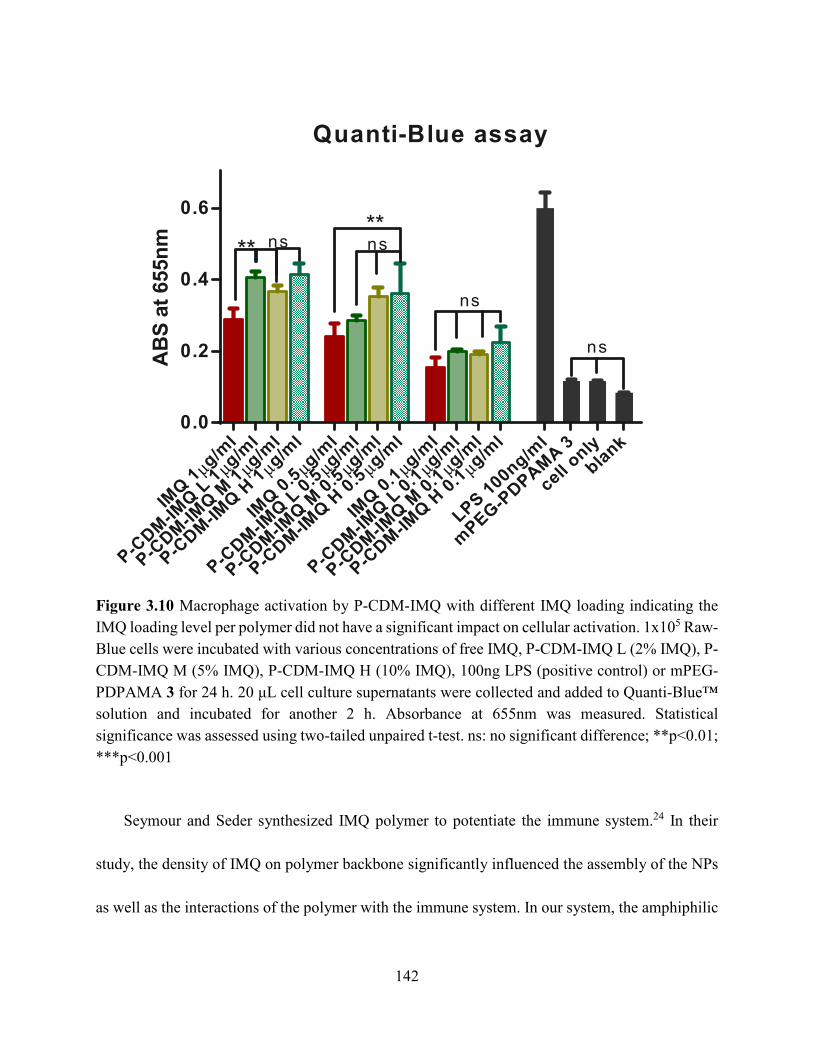
142
IMQ
1µg/m
l
P-C
DM
-IMQ
L 1
µg/m
l
P-C
DM
-IMQ
M 1
µg/m
l
P-C
DM
-IMQ
H 1
µg/m
l
IMQ
0.5
µg/m
l
P-C
DM
-IMQ
L 0
.5µg/m
l
P-C
DM
-IMQ
M 0
.5µg/m
l
P-C
DM
-IMQ
H 0
.5µg/m
l
IMQ
0.1
µg/m
l
P-C
DM
-IMQ
L 0
.1µg/m
l
P-C
DM
-IMQ
M 0
.1µg/m
l
P-C
DM
-IMQ
H 0
.1µg/m
l
LPS 1
00ng/ml
mPEG
-PD
PA
MA
3
cell only
blank
0.0
0.2
0.4
0.6
Quanti-Blue assayA
BS
at
655n
m ** ns**ns
ns
ns
Figure 3.10 Macrophage activation by P-CDM-IMQ with different IMQ loading indicating the
IMQ loading level per polymer did not have a significant impact on cellular activation. 1x10⁵ Raw-
Blue cells were incubated with various concentrations of free IMQ, P-CDM-IMQ L (2% IMQ), P-
CDM-IMQ M (5% IMQ), P-CDM-IMQ H (10% IMQ), 100ng LPS (positive control) or mPEG-
PDPAMA 3 for 24 h. 20 μL cell culture supernatants were collected and added to Quanti-Blue™
solution and incubated for another 2 h. Absorbance at 655nm was measured. Statistical
significance was assessed using two-tailed unpaired t-test. ns: no significant difference; **p<0.01;
***p<0.001
Seymour and Seder synthesized IMQ polymer to potentiate the immune system.24 In their
study, the density of IMQ on polymer backbone significantly influenced the assembly of the NPs
as well as the interactions of the polymer with the immune system. In our system, the amphiphilic

143
P-CDM-IMQ 10 polymer formed particles (hydrodynamic diameter 170 nm, Figure 3.3c)
regardless of the loading level of IMQ. Our polymer can load varying amounts of IMQ as needed
without significantly impacting particle sizes or adjuvant activities.
How antigen is formulated with the adjuvant can greatly impact immune responses.25 To
establish the best combination of antigen and IMQ, we investigated various methods for
incorporating IMQ. Besides free IMQ and the P-CDM-IMQ 8 particles, which could be directly
mixed with P-CDM-OVA 8 or free OVA for vaccination, we prepared a hybrid particle combining
P-CDM-OVA 8 and P-CDM-IMQ 10 within one particle (~190 nm diameter, Figure 3.3e). We
first performed B3Z assays with the mixture of P-CDM-OVA 8 particles and P-CDM-IMQ 10
particles (P-CDM-OVA 8 + P-CDM-IMQ 10) or P-CDM-OVA 8/P-CDM-IMQ 10 hybrid
particles (Figure 3.6b). The P-CDM-OVA 8 + P-CDM-IMQ 10 group showed significantly higher
activation of B3Z cells compared to the P-CDM-OVA 8/P-CDM-IMQ 10 hybrid particles at OVA
concentrations above 1 ng/ml.
In vivo CTL assays were performed to analyze the impacts of various forms of IMQ on P-
CDM-OVA 8 mediated CTL activation. While free OVA peptide did not activate CTL much, the
administration of P-CDM-OVA 8 induced significant CTL activities in both spleen and lymph
node analysis (Figure 3.11). This confirms the important roles of the polymer in potentiating OVA
specific CTL activities. The addition of IMQ adjuvant to P-CDM-OVA 8 enhanced cell killing, as
survival rate of OVA bearing target cells in the group treated with P-CDM-OVA 8 + IMQ (42%

144
in spleen and 28% in lymph node) was lower than that receiving P-CDM-OVA 8 only (63% in
spleen and 50% in lymph node). Lower cell survival (27% in spleen and 20% in lymph node) was
observed when P-CDM-OVA 8 and P-CDM-IMQ 10 were co-administrated in separate particles
(P-CDM-OVA 8+P-CDM-IMQ 10). Hybrid particles containing both P-CDM-OVA 8 and P-
CDM-IMQ 10 (P-CDM-OVA 8/P-CDM-IMQ 10) were not as effective in target cell killing (62%
cell survival in spleen and 31% in lymph node) compared to the mixture of two separate particles.
This trend was consistent with the B3Z assay results (Figure 3.6b).
Spleen Lymph node0
25
50
75
100
In vivo CTL assay
Targ
et
Ce
ll S
urv
iva
l %
Non-treated
Free OVA
Free OVA+IMQ
Free OVA+empty NP
P-CDM-OVA 8
P-CDM-OVA 8+IMQ
P-CDM-OVA 8+P-CDM-IMQ 10
P-CDM-OVA 8/P-CDM-IMQ 10
* *
*
ns
Figure 3.11 In vivo CTL assay. Mice (2 per group) were first immunized with free OVA, free
OVA+IMQ, free OVA+empty NP, P-CDM-OVA 8, P-CDM-OVA 8+IMQ, P-CDM-OVA 8 and
P-CDM-IMQ 10 in separate particles (P-CDM-OVA 8+P-CDM-IMQ 10), or P-CDM-OVA 8 and
P-CDM-IMQ 10 in hybrid particle (P-CDM-OVA 8/P-CDM-IMQ 10). CFSEhi labeled OVA
peptide pulsed target cells were injected together with CFSElo labeled control cells 3 days after the
last immunization. Mice were euthanized 24 hours after cell injection and the spleens and lymph
nodes were collected for FACS analysis. Target cell survival were calculated by the target: control
cell ratio changes before and after injection. Statistical significance was assessed using two-tailed
unpaired t-test. ns: No significant differences; *p<0.05.

145
Whether the co-localization of antigen and adjuvant in same delivery vehicles is important for
generating strong immune response remains unclear so far. It is believed hybrid particles are better
in stimulating the immune system, as these particles can simultaneously deliver both antigen and
adjuvant to the same APC.26-29 However, there are also reports showing that administration of
antigen and adjuvant in separate particles induce stronger immune responses.30-33 In the current
study, the separate particle strategy performed better, possibly due to the drastically different cargo
release rates associated with P-CDM-OVA 8 and P-CDM-IMQ 10. It has been reported that the
releases of antigens and adjuvants may need to be optimized individually.34 The hybrid particles
may not have the optimal releasing rates for the antigen and the adjuvant. In addition to better CTL
stimulation, another advantage for co-administration of P-CDM-OVA 8 and P-CDM-IMQ 10 in
separate particles is that it provides a convenient “mix-and-inject” method for vaccine formulation.
The relative ratio of antigen and adjuvant can be easily tuned by mixing different amounts of two
particles. Furthermore, several antigens may be readily co-administrated with adjuvant particles
as a multivalent vaccine without the need to produce multiple hybrid particles.
3.2.6 P-CDM-OVA 8 + P-CDM-IMQ 10 protected mice from EG7 tumor
With the superior CTL activation by P-CDM-OVA 8+P-CDM-IMQ 10, we evaluated their
abilities to provide tumor protection in vivo. It is known that a significant challenge in combating
cancer is the suppression of the immune system by tumor.35-37 Recently, programmed cell death 1
(PD-1) and its ligand (PD-L1) have been shown to be important inhibitory checkpoint molecules,

146
aiding the escape of tumors from immune surveillance.38-40 As anti-PD-1 mAbs can block the
functions of PD-1, we tested the combination of anti-PD-1 mAb with vaccination for tumor
protection. Mice were implanted subcutaneously with EG7 tumor cells, which express OVA on
cell surface. Five days after EG7 tumor injection, mice were injected with various vaccine
formulations every other day for a total 5 injections and the growth of tumor was monitored. As
shown in Figure 3.12, anti-PD1 antibody alone or free OVA + IMQ + empty NPs were ineffective
in slowing down tumor growth compared to the mock group receiving PBS injection. In contrast,
treatment with P-CDM-OVA 8+P-CDM-IMQ 10 at the same total dose of OVA and IMQ led to a
significant reduction in tumor sizes indicating the superiority of the polymer system. The addition
of anti-PD1 to P-CDM-OVA 8+ P-CDM-IMQ 10 slightly improved the tumor protection effect.
0 6 8 10 12 14
0
500
1000
EG7 Tumor Growth
Days after tumor injection
Tu
mo
r S
ize m
m3
PBS
Free OVA+IMQ+empty NP
aPD-1
P-CDM-OVA 8+P-CDM-IMQ 10
P-CDM-OVA 8+P-CDM-IMQ 10+aPD-1
******
ns
Figure 3.12 EG7 tumor growth under a variety of treatment conditions. C57BL/6 female mice
were injected with 1x10⁶ EG7 tumor cells. Starting from day 5, a total of 5 injections with PBS,
mixture of free OVA, IMQ and empty NPs (Free OVA+IMQ+empty NP), or P-CDM-OVA 8
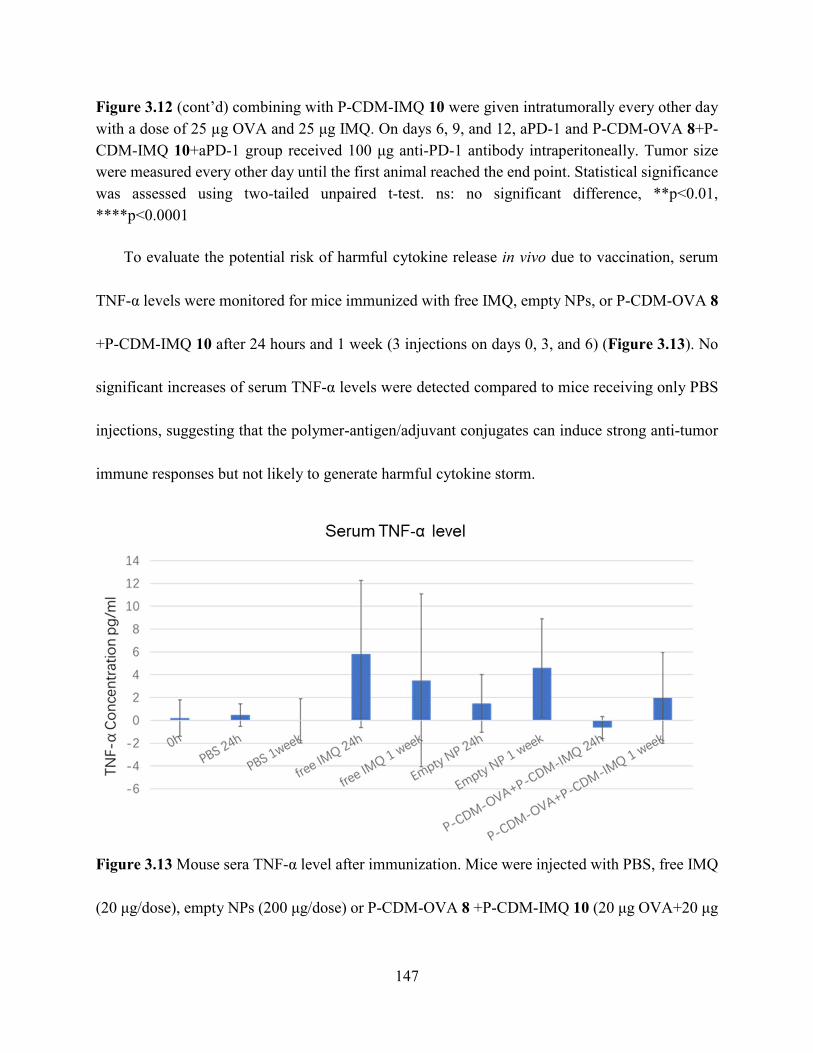
147
Figure 3.12 (cont’d) combining with P-CDM-IMQ 10 were given intratumorally every other day
with a dose of 25 µg OVA and 25 μg IMQ. On days 6, 9, and 12, aPD-1 and P-CDM-OVA 8+P-
CDM-IMQ 10+aPD-1 group received 100 μg anti-PD-1 antibody intraperitoneally. Tumor size
were measured every other day until the first animal reached the end point. Statistical significance
was assessed using two-tailed unpaired t-test. ns: no significant difference, **p<0.01,
****p<0.0001
To evaluate the potential risk of harmful cytokine release in vivo due to vaccination, serum
TNF-α levels were monitored for mice immunized with free IMQ, empty NPs, or P-CDM-OVA 8
+P-CDM-IMQ 10 after 24 hours and 1 week (3 injections on days 0, 3, and 6) (Figure 3.13). No
significant increases of serum TNF-α levels were detected compared to mice receiving only PBS
injections, suggesting that the polymer-antigen/adjuvant conjugates can induce strong anti-tumor
immune responses but not likely to generate harmful cytokine storm.
Figure 3.13 Mouse sera TNF-α level after immunization. Mice were injected with PBS, free IMQ
(20 μg/dose), empty NPs (200 μg/dose) or P-CDM-OVA 8 +P-CDM-IMQ 10 (20 μg OVA+20 μg

148
Figure 3.13 (cont’d) IMQ/dose) and euthanized after 24 h (1 injection) or 1 week (3 injections on
day 0, 3 and 6). Sera was collected and analyzed by TNF-α ELISA kit.
3.3 Conclusion
Anti-cancer immunotherapy is gaining increasing prominence for cancer treatment. As an
important type of immune cells, CTLs can kill tumor cells and protect against tumor development.
However, direct administration of CTL peptide epitope often fails to potently activate CTLs. To
enhance the efficacy of CTL based therapy, we have developed a new ultra pH sensitive NP system,
to which CTL epitope such as OVA can be conjugated with high efficiency and high loading
through a CDM linker. Interestingly, the polymer conjugation greatly enhanced the stability of
CDM with little cleavage of the incorporated OVA antigen observed in pH 6.4 buffer. On the other
hand, the presence of a protein such as BSA significantly increased the polymer cleavage rate. The
P-CDM-OVA polymer released the OVA antigen to cells under physiological conditions, enabling
sustained presentation of OVA by MHC-I on cell surface and stronger CTL activation than free
OVA underlying the advantage of the polymer assisted delivery. The polymer platform is flexible,
which was also utilized to deliver a small molecule adjuvant IMQ. The combination of P-CDM-
OVA with P-CDM-IMQ provided significant protection to tumor development, highlighting the
power of the judiciously designed polymer system.

149
3.4 Experimental methods
3.4.1 Materials and equipment
Methoxy polyethylene glycol (mPEG, average Mn=5,000), diisopropylaminoethyl
methacrylate (DPAMA) 99%, n-butyl methacrylate (BMA) 99%, N,N’,N’,N’’,N’’-
pentamethyldiethylenetriamine (PMDETA), CuBr, NaH 60%, chlorophenol red-β-D-
galactopyranoside (CPRG), N-hydroxysuccimide (NHS), adipic acid were purchased from
Milipore-Sigma-Aldrich. 2-Aminoethyl methacrylate HCl salt (AMA), 95% without inhibitor, was
purchased from Polyscience Inc. Triethyl phosphoryl propionate 98%, di-tert-butyl dicarbonate
99%, were purchased from Acros. Diethyl ketoglutarate 95% was purchased from TCI.
Carboxyfluorescein succinimidyl ester (CFSE), triethylamine (TEA), N,N-dimethylformamide
(DMF), dimethylsulfoxide (DMSO), tetrahydrofuran (THF), dichloromethane (DCM) were
purchased from Fisher Scientific. Ovalbumin257-264 antigen peptide (OVA peptide, SIINFEKL) 95%
purity was purchased from Genscript. Imiquimod (95% purity) was purchased from AK Scientific.
All antibodies were purchased from Biolegend. Quanti-blueTM and TNF-α ELISA kit were
purchased from Invivogen.
Scanning electron microscopy (SEM) images were acquired on the 7500F ultra-high
resolution scanning electron microscope. Fluorescence-activated cell sorting (FACS) data was
acquired using LSR II flow cytometer analyzer and analyzed by FlowJo_V10 software. Dynamic
light scattering (DLS) was performed on a Zetasizer Nano zs apparatus (Malvern, UK) with laser

150
set at 137° and attenuation at 7 for all samples. NMR spectrum were acquired on the Agilent DDR2
500 MHz NMR spectrometers
3.4.2 Animals and cell lines
Pathogen free female C57BL/6 mice age 6 - 10 weeks were utilized for experiments. All
animal experiments were performed in accordance with the guidelines of the Institutional Animal
Care and Use Committee (IACUC) of Michigan State University. EL4 cells were generously
donated by Dr. Sandra Gendler (Mayo clinic). Cells were cultured in RPMI medium 1640
supplemented with 10 % Fetal Bovine Serum (FBS), 1% L-glutamine, and 1% streptomycin
penicillin. B3Z cells was generously donated by Dr. Nilabh Shastri (University of California,
Berkeley). These cells were cultured in RPMI-1640 supplemented with 10% FBS, 1 mM pyruvate,
50 µM 2-mercaptoethanol, 1% L-glutamine, and 1% streptomycin penicillin. EG.7 OVA cells
were purchased from ATCC and cultured in RPMI-1640 supplemented with 10% FBS, 1%
glutamine, 10 mM HEPES, 1.0 mM sodium pyruvate, 50 µM 2-mercaptoethanol, 0.4 mg/L G418
and 1% streptomycin penicillin. Bone marrow dendritic cells (BMDCs) were collected from
C57BL/6 mice femur and cultured in RPMI-1640 supplemented with 10% FBS, 1% Streptomycin
Penicillin and 20 ng/mL GM-CSF. Equal amounts of culture media were added to the dishes
seeded with cells on day 3. The non-adherent cells were collected on day 6 and re-seeded in new
dishes and cultured for another 2 days. The non-adherent cells were collected on day 9 with >90%

151
of the population CD11c+ as determined by fluorescence-activated cell sorting (FACS) analysis.
All cell lines were grown at 37 °C in a 5% CO2/air incubator.
3.4.3 Synthesis of mPEG-Br macroinitiator 1
mPEG (average MW=5,000, 10 g, 2 mmol) and pyridine (316 mg, 4 mmol) were dissolved in
CHCl3 (100 mL) and cooled on ice in dark. 2-Bromoisobutyryl bromide (0.92 g, 4 mmol) was
added to the solution and the reaction was first incubated on ice in dark for 1 h followed by stirring
at room temperature in dark for 24 h. When reaction was completed, the solution was concentrated
to a small volume then precipitated from diethylether three times to obtain product 1 (9.92 g, yield=
96%). 1H-NMR (500MHz, CDCl3, ppm) δ 4.33-4.30 (m, 2H), 3.64 (s, 454H), 3.37 (s, 3H), 1.93
(s, 6H).
3.4.4 Synthesis of methoxy polyethyleneglycol-poly(diisopropylaminoethyl
methacrylate) (mPEG-PDPAMA) 3
Initiator mPEG-Br 1 (100 mg, 20 μmol) and monomer DPAMA 2 (365 mg, 1.7 mmol) were
dissolved in DMF: isopropanol (1: 1, 10 mL). PMDETA (3.5 mg, 20 μmol) was added to the
solution. Then three cycles of freeze-pump-thaw were performed to remove oxygen. CuBr (2.9
mg, 20 μmol) was added under N2 and the reaction mixture was kept under 60‑ for 6 h. The
reaction was quenched by diluting with equal volume of THF (10 mL) and the mixture was passed
through a short basic Al2O3 column. The solution was collected then concentrated under vacuum
followed by dialysis (MWCO 3,500 Da) against pure water for 48 h. The solution in the dialysis
tubing was collected and lyophilized to give a white solid compound (370 mg). A typical monomer

152
conversion rate is 85% based on 1H-NMR analysis of the crude reaction mixture. 1H NMR (500
MHz, CDCl3, ppm) δ 3.99 – 3.74 (m, 145H), 3.64 (s, 454H), 3.37 (s, 3H), 3.00 (s, 145H), 2.64 (s,
145H), 2.06 – 1.64 (m, 145H), 1.14 – 0.81 (m, 1087H).
3.4.5 Synthesis of Boc protected 2-aminoethylmethacylate monomer (Boc-AMA) 4
2-Aminoethylmethacylate HCl salt (1.0 g, 6 mmol) was dissolved in DCM (20 mL) and cooled
to 0°C. TEA (0.92 mL, 6.6 mmol) was added to the solution on ice and stirred for 20 min. Then,
Boc2O (1.44 g, 6.6 mmol) in DCM (5 mL) was added to the flask. The reaction mixture was
allowed to reach room temperature and stirred for 24 h. The organic phase was then washed with
water, 1M HCl, saturated NaHCO3 solution and saturated NaCl solution followed by drying over
Na2SO4. The solvent was then removed under vacuum to give a white solid product, which was
used without further purification. 1H NMR (500 MHz, CDCl3, ppm) δ 6.15 – 6.11 (m, 1H), 5.61 –
5.57 (m, 1H), 4.78 (s, 1H), 4.21 (t, J = 5.4 Hz, 2H), 3.45 (t, J = 5.4 Hz, 2H), 1.98 – 1.93 (m, 3H),
1.45 (s, 9H). 13C NMR (126 MHz, CDCl3, ppm) δ 167.30, 155.98, 136.01, 125.95, 79.60, 63.98,
39.68, 28.35, 18.31. MS: (ESI+): C11H19NO4[M+Na]+ calculated mass: 252.1206, observed mass:
252.1208.
3.4.6 Synthesis of methoxy polyethyleneglycol-poly(diisopropylaminoethyl
methacrylate)-poly(n-butyl methacrylate) (mPEG-PDPAMA-PBMA)
The polymerization procedure was similar to that for mPEG-PDPAMA 3. For random
polymer (mPEG-PDPAMA-r-PBMA), DPAMA 2 (213 mg, 1.0 mmol) and BMA (142 mg, 1.0
mmol) were dissolved together with mPEG-Br 1 (100 mg, 20 μmol) and PMDETA (3.5 mg, 20

153
μmol) in DMF: isopropanol (1: 1, 10 mL). CuBr (2.9 mg, 20 μmol) was added to the flask after
three cycles of freeze-pump-thaw. The polymerization was performed under 60‑ for 6 h. The
purification of resulting product was the same as that for mPEG-PDPAMA 3. 1H-NMR (500 MHz,
CDCl3, ppm) δ 3.94 (s, 100H), 3.82 (s, 60H), 3.64 (s, 454H), 3.38 (s, 3H), 2.99 (s, 60H), 2.62 (s,
60H), 1.97 – 1.75 (m, 160H), 1.40 (s, 100H), 1.09 – 0.80 (m, 850H).
For block polymer (mPEG-PDPAMA-b-PBMA), mPEG-PDPAMA 3 (200 mg, ~10 μmol),
BMA (142 mg, 1.0 mmol) and PMDETA (1.7 mg, 10 μmol) were dissolved in mixed solvent of
DMF: isopropanol (5 mL, 1: 1). CuBr (1.5 mg, 10 μmol) was added to the flask after three cycles
of freeze-pump-thaw. The polymerization was performed under 60 °C for 6 h. The purification of
resulting product was the same as that for mPEG-PDPAMA 3. 1H NMR (500 MHz, CDCl3, ppm)
δ 4.03 – 3.75 (m, 290H), 3.64 (s, 454H), 3.38 (s, 3H), 2.99 (s, 134H), 2.62 (s, 134H), 2.07 – 1.71
(m, 290H), 1.47 – 1.34 (m, 156H), 1.28 – 0.79 (m, 1630H).
3.4.7 Quantification of free OVA peptide and imiquimod
High performance liquid chromatography (HPLC) was used for the quantification of OVA
peptide. A standard curve between the amounts of OVA peptide and the area integration of HPLC
chromatograms were acquired first. OVA peptide standard samples (0.5 mL, containing 2 μg, 12.5
μg, 25 μg, 50 μg, 100 μg peptide) were analyzed by HPLC using 0.1% TFA MilliQ water and
acetonitrile over a C18 column (2% acetonitrile to 55% acetonitrile in 47 minutes, 220 nm UV
detector). The elution time of OVA peptide under this condition was 33 min. The standard curve
154
between the amounts of OVA peptide and the areas of integration from HPLC were plotted
(Appendix Figure 3.15a). The amount of OVA peptide in other samples were quantified based on
the standard curve.
The amount of imiquimod was quantified by UV absorption at 318 nm. The UV absorption at
318 nm of imiquimod standard samples (1 mL, containing 0.78 μg, 1.56 μg, 3.13 μg, 6.25 μg, 12.5
μg, 25 μg, 50 μg imiquimod) were acquired and the standard curve between the concentration of
imiquimod and the UV absorption were created (Appendix Figure 3.15b). The amount of
imiquimod in other samples were quantified based on the standard curve.
3.4.8 Encapsulation and release of OVA peptide in mPEG-PDPAMA 3 or mPEG-
PDPAMA-b/r-PBMA nanoparticles
The polymer (10 mg) was dissolved in THF (100 μL). OVA peptide (0.5 mg) was dissolved
in DMSO (10 μL) and added to the polymer solution. The resulting organic solution was dropped
slowly into PBS buffer (1 mL) under sonication. The mixture was then purified by passing through
a G25 column to remove free OVA peptide. The amount of OVA encapsulated was determined by
treating the nanoparticle solution with 0.1% TFA followed by HPLC quantification of free OVA
in the solution. To determine the kinetics of OVA release, the OVA encapsulated nanoparticles
were incubated in PBS buffer at room temperature for various time periods. The mixture was then
centrifuged through a membrane filter (MWCO 100 KDa) and the flow through was analyzed by
HPLC for the level of free OVA peptide.

155
3.4.9 Synthesis of methoxy polyethyleneglycol-poly(diisopropylaminoethyl
methacrylate)-poly(aminoethyl methacrylate) (mPEG-PDPAMA-PAMA) 5
Initiator mPEG-Br 1 (100 mg, 20 μmol), DPAMA 2 (320 mg, 1.5 mmol), and Boc-AMA 4
(60mg, 0.25 mmol) were dissolved in mixed solvent of DMF: isopropanol (1: 1, 10 mL). PMDETA
(3.5 mg, 20 μmol) was added to the solution. Then three cycles of freeze-pump-thaw were
performed to remove oxygen. CuBr (2.9 mg, 20 μmol) was added under N2 and the reaction
mixture was kept under 60 ‑ for 6 h. The reaction was quenched by diluting with equal volume
of THF (10 mL) and the mixture was passed through a short basic Al2O3 column. The solution was
collected then concentrated under vacuum followed by dialysis (MWCO 3,500 Da) against pure
water for 48 h. The solution in dialysis tubing was collected and lyophilized to give white solid
compound mPEG-PDPAMA-PAMA-Boc (380 mg). 1H NMR (500 MHz, CDCl3, ppm) δ 4.12 –
3.77 (m, 142H), 3.65 (s, 454H), 3.38 (s, 3H), 2.99 (s, 120H), 2.63 (s, 120H), 2.08 – 1.70 (m, 142H),
1.53 – 1.39 (m, 99H), 1.15 – 0.80 (m, 933H).
The purified mPEG-PDPAMA-PAMA-Boc polymer (380 mg) was dissolved with pure TFA
(3 mL) and stirred for 1 h for Boc deprotection. TFA was removed by a rotavapor and the residue
was dissolved in THF (~ 3 mL) and dialyzed against pure water (MWCO 3,500 Da) for 24h
followed by lyophilization to yield white powdered mPEG-PDPAMA-PAMA 5 (322 mg, yield =
92%). 1H NMR (500 MHz, CDCl3, ppm) δ 4.70 – 4.00 (m, 142H), 3.85 – 3.59 (m, 574H), 3.48 –
3.15 (m, 120H), 2.43 – 1.77 (m, 355H), 1.72 – 0.51 (s, 720H).
156
3.4.10 Synthesis of carboxy-dimethylmaleic anhydride (CDM)41
Triethyl 2-phosphonopropionate (1.8g, 7.5 mmol) was dissolved in THF (5 mL) and added to
a suspension of NaH (60% dispersion in mineral oil, 250 mg, 6.25 mmol) in THF (30 mL) on ice.
The mixture was stirred for 0.5 h on ice, followed by addition of a solution of diethyl ketoglutarate
(1 g, 5 mmol) in THF (5 mL). The stirring was continued for 30 min. The reaction was quenched
by pouring the solution into saturated aq. NH4Cl (100 mL) and then extracted with diethylether.
The organic phase was dried over Na2SO4 and concentrated. The crude product was then purified
with silica gel column chromatography using ether: hexanes = 2: 1 as the eluant. The resulting
clear oil-like triester product was then dissolved in a mixture of 2 N aq. KOH (12.5 mL) and
ethanol (50 mL) and heated to reflux for 1 h. The solution was diluted with water and ethanol was
removed by a rotavapor. The resulting aqueous solution was acidified by HCl to pH 2 and extracted
with ethyl acetate. The organic phase was dried and concentrated to give the desired product
without further purification (460 mg, yield = 50% for two steps). 1H NMR (500 MHz, CDCl3, ppm)
δ 2.77 (s, 4H), 2.13 (s, 3H). 13C NMR (126 MHz, CDCl3, ppm) δ 177.11, 165.72, 165.49, 142.42,
141.76, 30.70, 19.59, 9.69. MS: (ESI+): C8H8O5 [M+MeOH+Na]+ calculated mass: 239.0526,
observed mass: 239.0552.
3.4.11 Synthesis of mPEG-PDPAMA-PAMA-CDM 6 conjugate42
The CDM linker 11 was synthesized right before conjugation with mPEG-PDPAMA-PAMA
5. CDM (20 mg, 108 μmol) was dissolved in anhydrous DCM (1 mL) and cooled on ice for 10

157
min. Oxalyl chloride (20 μL, 233 μmol) was added followed by a catalytic amount of DMF (20
μL). The reaction was stirred on ice for 15 min then allowed to reach room temperature and stirred
for another 1 h. The reaction mixture was dried under vacuum to yield CDM linker 11 without
purification.
To conjugate CDM linker 11 with mPEG-PDPAMA-PAMA 5, mPEG-PDPAMA-PAMA 5
(100 mg, ~5 μmol) was dissolved in anhydrous DCM (5 mL) and added to CDM linker 11. Small
amount of pyridine (30 μL) was added to the reaction mixture as catalyst. The reaction was stirred
for 24h under room temperature. Then DCM was removed by a rotavapor. The residue was
dissolved in THF (~ 3 mL) and dialyzed against pure water (MWCO 3,500 Da) for 24 h. The
solution in dialysis tubing was lyophilized to yield orange color solid product (94 mg, yield = 86%).
1H NMR (500 MHz, CDCl3, ppm) δ 4.29 (s, 142H), 3.76 – 3.42 (m, 574H), 3.38 (s, 3H), 3.35 –
2.94 (s, 120H), 2.80 – 2.69 (m, 20H), 2.36 (s, 30H), 2.17 – 2.08 (m, 20H), 1.95 – 0.75 (m, 1174H).
3.4.12 Synthesis of P-CDM-OVA 8 and P-CDM-IMQ 10
With mPEG-PDPAMA-PAMA-CDM 6 in hand, we covalently conjugated antigen OVA
peptide and TLR 7 agonist IMQ with the polymer respectively. Briefly, OVA peptide or IMQ (2.2
mg, 11 wt% of polymer) and mPEG-PDPAMA-PAMA-CDM 6 (20 mg) were dissolved in DMSO
(0.5 mL) followed by addition of solid K2CO3 (50 mg). The reaction mixture was stirred under
room temperature for 24 h. Solid K2CO3 was filtered out and DMSO phase was collected and
diluted in 10x water with triethylamine (TEA, pH = 9). The resulting cloudy mixture was filtered
158
by centrifuge filtration tube (MWCO = 10 KDa) and washed twice with 5% DMSO in water with
TEA (pH = 9) and twice with water with TEA (pH = 9). The polymer product was collected and
lyophilized to give P-CDM-OVA 8 (20.3 mg) or P-CDM-IMQ 10 (19.8 mg). Yield >90%. All
washing elution was collected for HPLC (for OVA) or UV (for IMQ) analysis to determine the
wt% of OVA or IMQ conjugated to polymer. For P-CDM-OVA 8, the final loading was 10.4 wt%.
For P-CDM-IMQ 10, the loading was 9.7 wt%.
3.4.13 Synthesis of P-ADA-OVA 9
Adipic acid di-NHS ester linker 12 was prepared according to literature reports3. mPEG-
PDPAMA-PAMA 5 (20 mg, ~ 2.5 μmol) was dissolved in DMSO (1 mL) with adipic acid-di-NHS
ester linker 12 (85 mg, 0.25 mmol). The mixture was stirred under room temperature overnight.
0.1 N HCl (20 mL) was added to the reaction mixture in order to precipitate out the unreacted
linker. The supernatant was collected, and centrifuge filtration (MWCO 10 KDa) was performed
to concentrate mPEG-PDPAMA-PAMA-ADA 7. The mPEG-PDPAMA-PAMA-ADA 7 solution
was lyophilized and re-dissolved in DMSO (1 mL), then OVA peptide (2.2 mg) was added. The
reaction was carried out for 24h at room temperature. The reaction mixture was then diluted in 10x
water and filtered by 30 K cut-off centrifuge filtration tube and washed twice with 5% DMSO in
water and twice with water. The polymer product was collected and lyophilized to give P-ADA-
OVA 9. All washing elution was collected for HPLC analysis to determine the wt% of OVA
conjugated to polymer. The loading level of P-ADA-OVA 9 was 9.1 wt%.

159
3.4.14 Release profile of small molecule cargoes
P-CDM-OVA 8 or P-CDM-IMQ 10 (1 mg) was dissolved in THF (50 μL) and diluted in 1
mL buffer with different pH values. At various time points, centrifuge filtration with 10K cut-off
filter was performed to collect buffer with released small molecules. 0.5 mL of the elution was
used for HPLC or UV analysis to quantify the amount of released small molecules.
3.4.15 General procedure of nanoparticle preparation
mPEG-PDPAMA 3 or antigen/adjuvant-polymer conjugates (P-CDM-OVA 8, P-ADA-OVA
9 or P-CDM-IMQ 10, 2 mg) was dissolved in THF (0.1 mL), then the polymer solution was slowly
dropped into PBS buffer (1 mL) under sonication through a 25 G needle over 5 minutes. The
mixture was sonicated for another 2 min upon completion of polymer addition. The resulting
particles were washed with PBS buffer 3 times by centrifuge filtration (MWCO = 100 KDa). The
washed particles were then collected and adjusted to 1 mL final volume with PBS buffer (2 mg
polymer/mL, containing 200 μg OVA or IMQ/mL). These particles were used for cellular and in
vivo immunization directly.
For P-CDM-OVA 8/P-CDM-IMQ 10 hybrid particles, 1 mg of P-CDM-OVA 8 and 1 mg of
P-CDM-IMQ 10 were combined and dissolved in THF (0.1 mL) followed by the same procedure
as described above.
160
3.4.16 Antigen presentation on cell surface MHC I molecules
EL4 cells (3x10⁵ in 1 mL media) were cultured with 100 ng/mL OVA peptide, P-CDM-OVA
8 or P-ADA-OVA 9 respectively in FACS tubes for different time period (2, 12, 24, 48, 72 h).
Cells are collected and washed with FACS buffer (1% FBS, 0.5% NaN3 in PBS), then stained with
a monoclonal antibody (anti-SIINFEKL bound to H2Kb , clone 25-D1.16) or anti-mouse IgG1K
(isotype control) for 30 min on ice in dark. Cells are washed twice with FACS buffer followed by
FACS analysis.
3.4.17 B3Z assay
2 x 10⁴ BMDCs were cultured overnight in a 96 well plate and subsequently incubated with
free OVA, free OVA + IMQ, free OVA + empty particle (1 mg/mL mPEG-PDPAMA 3), P-CDM-
OVA 8, P-CDM-OVA 8 + IMQ, P-CDM-OVA 8 +P-CDM-IMQ 10 (mixture of two types of
particles) or P-CDM-OVA 8/P-CDM-IMQ 10(hybrid particles) at increasing concentrations (0.1
– 1000 ng OVA/mL). After 12 hours, the cells were washed and 1 x 10⁵ B3Z cells were added to
the BMDCs and co-cultured for an additional 24 hours. The culture media was removed and 100
µL of chlorophenol red-β-D-galactopyranoside (CPRG) buffer (9.1 mg of CPRG, 90 mg MgCl2
and 0.1% Triton-X-100 in 100 mL of PBS) was added to each well. After 4 hours, the absorbance
at 595 nm was measured using a microplate reader. The results were presented as a mean of
triplicate.

161
3.4.18 Quanti-Blue assay
Solutions of various stimulators (free IMQ or P-CDM-IMQ 10 at various IMQ concentrations,
100 ng/mL LPS, 1mg/mL PEG-PDPAMA 3) were added to 96-well plate respectively (adjusted
to 20 µL total volume), each as a triplicate. 1 x 10⁵ RAW-Blue cells in cell culture media (180 µL)
were then seeded to the wells with the stimulators and cultured for 24 h. After the 24 h incubation,
20 µL/well of cell supernatant was transferred to a new 96 well plate. Then 180 µL/well Quanti-
BlueTM solution (pre-warmed to 37 ‑) was added to the cell supernatant in the new 96 well plate.
The mixture was incubated under 37 °C for 2 h then the absorbance values were read under 655
nm by a plate reader. The results were presented as a mean of triplicate.
3.4.19 BMDC activation study
BMDCs (3 x 10⁵ cells per sample) were incubated with culture medium only, PEG-PDPAMA
3 (1 mg/mL) or LPS (100ng/mL) for 48 h at 37 °C. The cells were washed twice after incubation
followed by staining with APC-anti-mouse CD11c mAb (clone N418), PE-anti-mouse CD80 mAb
(clone 16-10A1), APC/Cy7-anti-mouse CD86 mAb (clone GL-1), and FITC-anti-mouse CD40
mAb (clone 3/23) on ice in dark for 30 min. The stained cells were washed for 3 times with FACS
buffer followed by FACS analysis. Non-stained cells (cell only) were used as a negative control.
The CD11c+ cells were gated and the mean fluorescence intensity (MFI) of PE channel (for CD80),
APC/Cy7 channel (for CD86) and FITC channel (for CD40) were reported. The results were
presented as a mean of triplicate.

162
3.4.20 In vivo CTL assay
P-CDM-OVA 8, P-CDM-IMQ 10 and P-CDM-OVA 8/P-CDM-IMQ 10 hybrid nanoparticles
were prepared as described above. OVA encapsulated Ac-Dex MPs were prepared as previously
reported43. These particles were used for vaccine immunization.
8-week-old C57BL/6 female mice were immunized with different vaccine formulations once
a week for a total of 3 injections. For comparing the CTL activation effect of P-CDM-OVA 8 and
Ac-Dex-OVA, P-CDM-OVA 8 or Ac-Dex-OVA was used for subcutaneous or intravenous
immunization (20 µg OVA per dose) without any additional adjuvants. For evaluating the adjuvant
efficiency, free OVA/P-CDM-OVA 8 and free IMQ/P-CDM-IMQ 10 were used for subcutaneous
immunization at a dose of 20 μg OVA and 20 μg IMQ per mouse.
On day 3 after the final immunization, a mixture of non-treated CFSElo and OVA pulsed
CFSEhi splenic cells (0.2 mL, 4 million cells) was injected through the tail vein to the immunized
mice. The excess cell mixture was stored in culture media under 37 °C as a “before injection”
sample. Mice were sacrificed after 24 hours. Spleen cells were collected, washed with PBS twice
and then fixed in 10 mL 10% formalin in PBS. 3-4 lymph nodes were collected from each mouse.
Lymph nodes were set in same Petri dish, smashed and filtered to create lymph node cell samples.
Cells were washed twice with PBS buffer and fixed in 4 mL 10% formalin in PBS. The spleen and
lymph node samples were analyzed by FACS. The changes of ratio of CFSEhi: CFSElo before and
after injection were achieved from FITC-SSC plot to calculate target cell viability.

163
3.4.21 Tumor challenge
Eight week old C57BL/6 mice were subcutaneously injected 1 million EG7 cells on the right
flank and divided into 5 groups (PBS, free OVA + IMQ + empty NP, aPD-1, P-CDM-OVA 8 + P-
CDM-IMQ 10 and P-CDM-OVA 8 + P-CDM-IMQ 10+aPD-1) with 10 mice in each group. On
days 5, 7, 9, 11 and 13, mice received the treatments intratumorally (the doses correspond to 25
µg OVA and 25 µg IMQ). On days 6, 9, and 12, the aPD-1 and P-CDM-OVA 8 +P-CDM-IMQ
10 +aPD-1 group received 100 μg aPD-1 treatment intraperitoneally. Tumor growth was
monitored every other day and tumor sizes were calculated using the formula: 1/2(L x W x H).
Data was recorded before first animal’s tumor size reached 1600mm3.
3.4.22 The influence of BSA protein on P-CDM-OVA cleavage
P-CDM-OVA 8 (1 mg/ml final concentration, 0.5 ml volume) in pH = 6.4 or 7.4 citric buffer
were incubated at room temperature with or without the addition of BSA protein in the buffer (0.5
mg/ml final concentration) for 4h, 24h and 1 week. Cold ethanol (10 ml) was added to each sample
to precipitate out most part of the BSA protein and salts in the buffer. The mixture was centrifuged,
and the supernatant was collected and dried for LC-MS analysis. For quantification standard,
different amounts of OVA peptide were dissolved in citric buffer with or without the addition of
BSA protein (0.5 mg/ml), followed by ethanol precipitation and centrifuge. The supernatants were
collected and dried for LC-MS analysis standards. The OVA release from samples with and
without BSA addition were quantified with the corelated OVA standard curve.

164
3.4.23 Serum TNF-α detection
Eight-week-old C57BL/6 mice were subcutaneously injected with PBS, free IMQ (20
µg/dose), empty NPs (200 µg/dose) or P-CDM-OVA 8 +P-CDM-IMQ 10 (20 µg OVA and 20 µg
IMQ/dose). Two mice from each group were euthanized 24 h after injection for sera collection.
Another two mice from each group were euthanized on day 7 after received 3 injections on day 0,
3 and 6 for sera collection. Sera samples were analyzed with TNF-α ELISA kit without dilution.
TNF-α level in each sample was quantified with the standard curve of TNF-α protein.

165
APPENDICES

166
APPENDIX A: TEM image of particles
Figure 3.14 TEM images of nanoparticles formed by a. mPEG-PDPAMA, b. P-CDM-OVA, and
c. P-CDM-IMQ

167
APPENDIX B: Quantification standard curves
Figure 3.15 Standard curve for quantification of free OVA peptide and imiquimod. a. Standard
curve between the amounts of OVA peptide and areas of integration from HPLC chromatograms.
b. Standard curve for correlation between the concentration of imiquimod and UV absorbance
value at 318nm.

168
APPENDIX C: NMR spectra
Figure 3.16 1H NMR spectrum of mPEG-Br 1 (500 MHz, CDCl3)

169
Figure 3.17 1H NMR spectrum of AMA-Boc 4 (500 MHz, CDCl3)

170
Figure 3.18 13C NMR spectrum of AMA-Boc 4 (125 MHz, CDCl3)
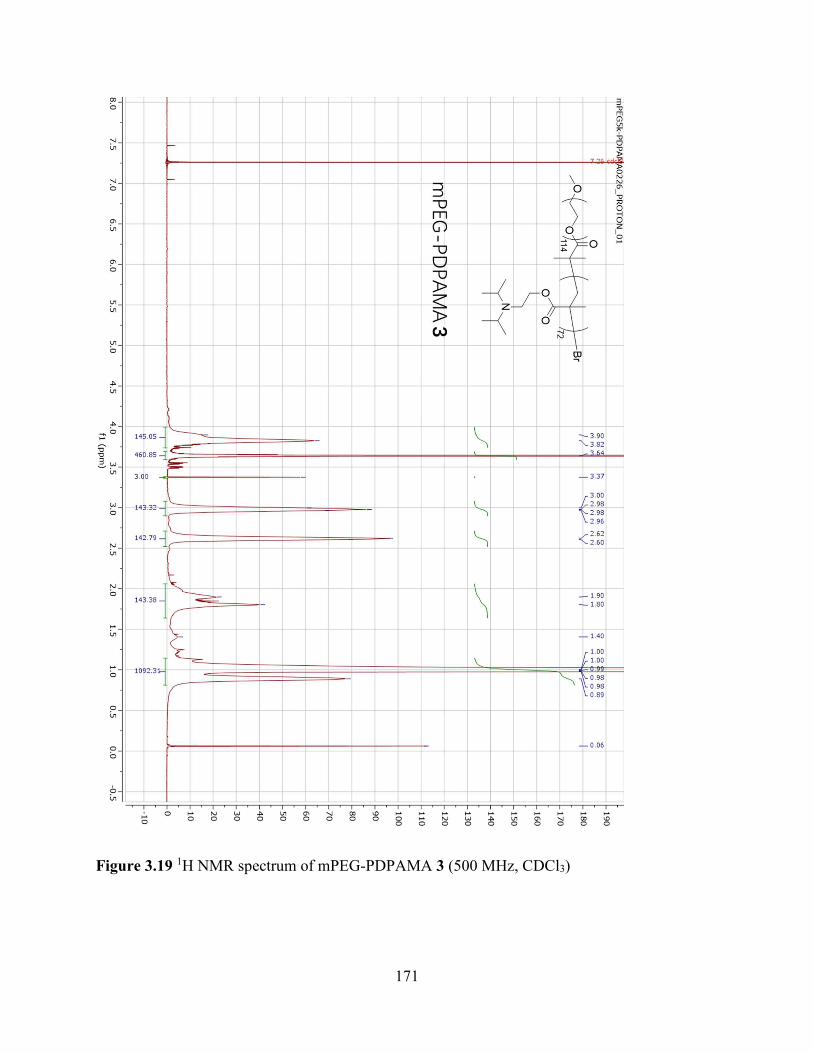
171
Figure 3.19 1H NMR spectrum of mPEG-PDPAMA 3 (500 MHz, CDCl3)

172
Figure 3.20 1H NMR spectrum of mPEG-PDPAMA-r-PBMA (500 MHz, CDCl3)

173
Figure 3.21 1H NMR spectrum of mPEG-PDPAMA-b-PBMA (500 MHz, CDCl3)

174
Figure 3.22 1H NMR spectrum of mPEG-PDPAMA-PAMA-Boc (500 MHz, CDCl3)

175
Figure 3.23 1H NMR spectrum of mPEG-PDPAMA-PAMA 5 (500 MHz, CDCl3)

176
Figure 3.24 1H NMR spectrum of CDM (500 MHz, CDCl3)
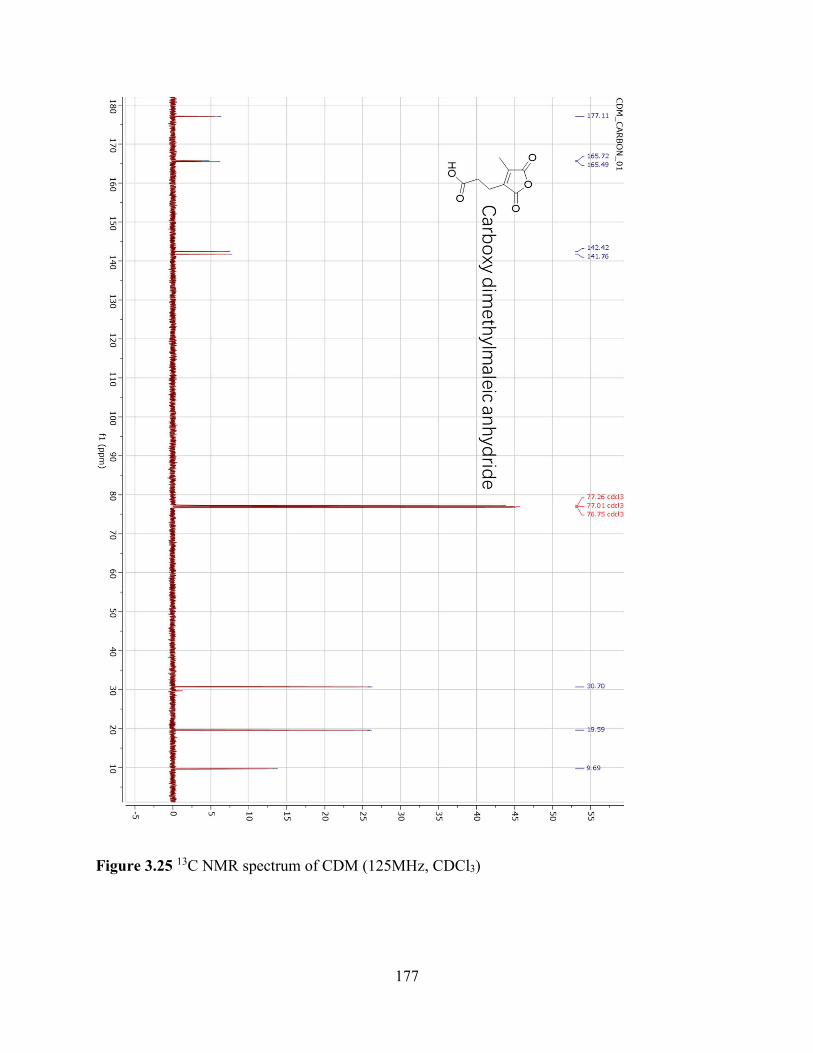
177
Figure 3.25 13C NMR spectrum of CDM (125MHz, CDCl3)
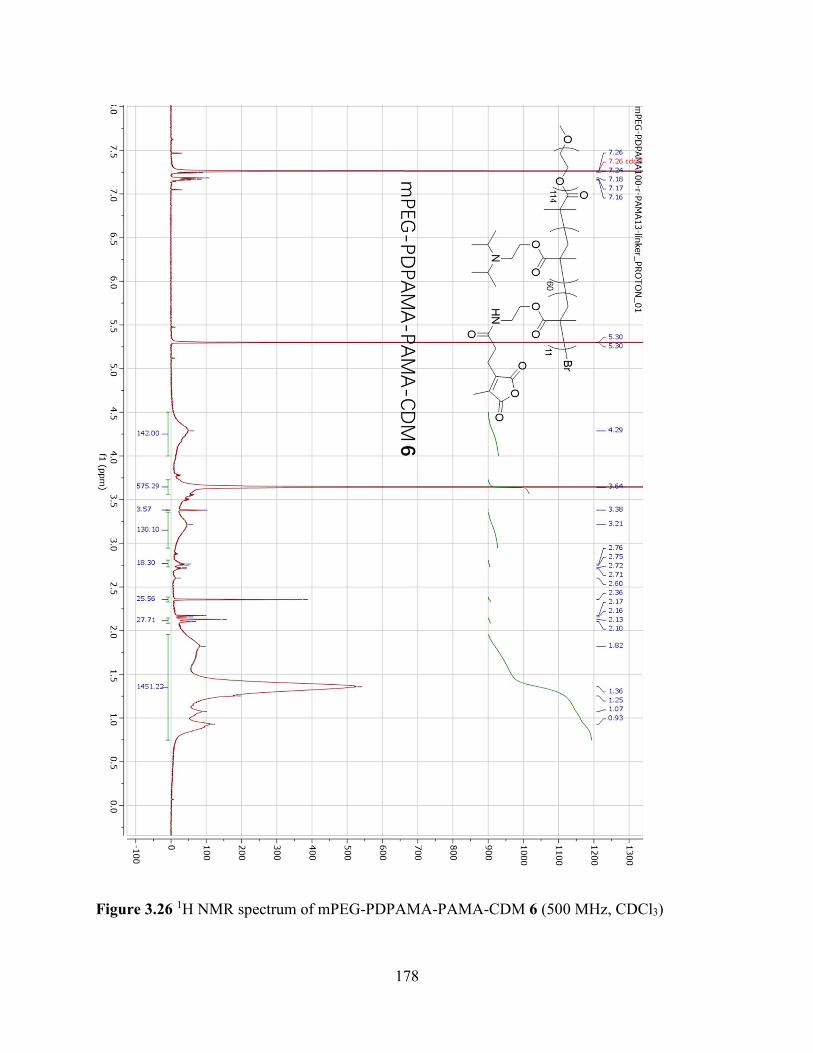
178
Figure 3.26 1H NMR spectrum of mPEG-PDPAMA-PAMA-CDM 6 (500 MHz, CDCl3)

179
APPENDIX D: GPC and HPLC traces
Figure 3.27 GPC trace of mPEG-PDPAMA-PAMABoc

180
Figure 3.28 OVA peptide standard on HPLC

181
Figure 3.29 Quantification of OVA loading on P-CDM-OVA 8

182
Figure 3.30 Quantification of OVA loading on P-ADA-OVA 9

183
REFERENCES
184
REFERENCES
1. Lang, S.; Tan, Z.; Wu, X.; Huang, X., Synthesis of Carboxy-Dimethylmaleic Amide Linked
Polymer Conjugate Based Ultra-pH-sensitive Nanoparticles for Enhanced Antitumor
Immunotherapy. ACS Macro Letters 2020, 9, 1693-1699.
2. Romero, P.; Banchereau, J.; Bhardwaj, N.; Cockett, M.; Disis, M. L.; Dranoff, G.; Gilboa, E.;
Hammond, S. A.; Hershberg, R.; Korman, A. J.; Kvistborg, P.; Melief, C.; Mellman, I.; Palucka,
A. K.; Redchenko, I.; Robins, H.; Sallusto, F.; Schenkelberg, T.; Schoenberger, S.; Sosman, J.;
Türeci, Ö.; Van den Eynde, B.; Koff, W.; Coukos, G., The Human Vaccines Project: A roadmap
for cancer vaccine development. Sci. Transl. Med. 2016, 8, 334PS9.
3. Van der Burg, S. H.; Arens, R.; Ossendorp, F.; Van Hall, T.; Melief, C. J. M., Vaccines for
Established Cancer: Overcoming the Challenges Posed by Immune Evasion. Nat. Rev. Cancer
2016, 16, 219-233.
4. Pamer, E.; Cresswell, P., Mechanisms of MHC Class I–Restricted Antigen Processing. Annu.
Rev. Immunol. 1998, 16, 323-358.
5. Liu, J.; Miao, L.; Sui, J.; Hao, Y.; Huang, G., Nanoparticle Cancer Vaccines: Design
Considerations and Recent Advances. Asian J. Pharm. Sci. 2020, 15, 576-590.
6. Lung, P.; Yang, J.; Li, Q., Nanoparticle Formulated Vaccines: Opportunities and Challenges.
Nanoscale 2020, 12, 5746-5763.
7. Fan, Y.; Moon, J. J., Nanoparticle Drug Delivery Systems Designed to Improve Cancer
Vaccines and Immunotherapy. Vaccines (Basel) 2015, 3, 662-685.
8. Li, L.; Yang, Z.; Chen, X., Recent Advances in Stimuli-Responsive Platforms for Cancer
Immunotherapy. Acc. Chem. Res. 2020, 53, 2044-2054.
9. Alsuraifi, A.; Curtis, A.; Lamprou, D. A.; Hoskins, C., Stimuli Responsive Polymeric Systems
for Cancer Therapy. Pharmaceutics 2018, 10, 136.
10. Pacifici, N.; Bolandparvaz, A.; Lewis, J. S., Stimuli-Responsive Biomaterials for Vaccines
and Immunotherapeutic Applications. Advanced Therapeutics 2020, 3, 2000129.

185
11. Du, J.-Z.; Mao, C.-Q.; Yuan, Y.-Y.; Yang, X.-Z.; Wang, J., Tumor Extracellular Acidity-
activated Nanoparticles as Drug Delivery Systems for Enhanced Cancer Therapy. Biotechnol. Adv.
2014, 32, 789-803.
12. Muraoka, D.; Seo, N.; Hayashi, T.; Tahara, Y.; Fujii, K.; Tawara, I.; Miyahara, Y.; Okamori,
K.; Yagita, H.; Imoto, S.; Yamaguchi, R.; Komura, M.; Miyano, S.; Goto, M.; Sawada, S.-i.; Asai,
A.; Ikeda, H.; Akiyoshi, K.; Harada, N.; Shiku, H., Antigen Delivery Targeted to Tumor-associated
Macrophages Overcomes Tumor Immune Resistance. J. Clin. Invest. 2019, 129, 1278-1294.
13. Hammerich, L.; Binder, A.; Brody, J. D., In situ Vaccination: Cancer Immunotherapy both
Personalized and Off-the-shelf. Molecular Oncology 2015, 9, 1966-1981.
14. Montealegre, S.; van Endert, P. M., Endocytic Recycling of MHC Class I Molecules in Non-
professional Antigen Presenting and Dendritic Cells. Front. Immunol. 2019, 9, 3098.
15. Basha, G.; Lizée, G.; Reinicke, A. T.; Seipp, R. P.; Omilusik, K. D.; Jefferies, W. A., MHC
Class I Endosomal and Lysosomal Trafficking Coincides with Exogenous Antigen Loading in
Dendritic Cells. PLoS One 2008, 3, e3247.
16. Ma, X.; Wang, Y.; Zhao, T.; Li, Y.; Su, L.-C.; Wang, Z.; Huang, G.; Sumer, B. D.; Gao, J.,
Ultra-pH-Sensitive Nanoprobe Library with Broad pH Tunability and Fluorescence Emissions. J.
Am. Chem. Soc. 2014, 136, 11085-11092.
17. Wang, Y.; Zhou, K.; Huang, G.; Hensley, C.; Huang, X.; Ma, X.; Zhao, T.; Sumer, B. D.;
DeBerardinis, R. J.; Gao, J., A Nanoparticle-based Strategy for the Imaging of a Broad Range of
Tumours by Nonlinear Amplification of Microenvironment Signals. Nat. Mater. 2013, 13, 204-
212.
18. Zhou, K.; Wang, Y.; Huang, X.; Luby-Phelps, K.; Sumer, B. D.; Gao, J., Tunable,
Ultrasensitive pH-Responsive Nanoparticles Targeting Specific Endocytic Organelles in Living
Cells. Angew. Chem., Int. Ed. 2011, 50, 6109-6114.
19. Zhou, K.; Liu, H.; Zhang, S.; Huang, X.; Wang, Y.; Huang, G.; Sumer, B. D.; Gao, J.,
Multicolored pH-Tunable and Activatable Fluorescence Nanoplatform Responsive to Physiologic
pH Stimuli. J. Am. Chem. Soc. 2012, 134, 7803-7811.
20. Luo, M.; Wang, H.; Wang, Z.; Cai, H.; Lu, Z.; Li, Y.; Du, M.; Huang, G.; Wang, C.; Chen,
X.; Porembka, M. R.; Lea, J.; Frankel, A. E.; Fu, Y.-X.; Chen, Z. J.; Gao, J., A STING-activating
Nanovaccine for Cancer Immunotherapy. Nat. Nanotechnol. 2017, 12, 648-654.

186
21. Du, J.-Z.; Li, H.-J.; Wang, J., Tumor-Acidity-Cleavable Maleic Acid Amide (TACMAA): A
Powerful Tool for Designing Smart Nanoparticles To Overcome Delivery Barriers in Cancer
Nanomedicine. Acc. Chem. Res. 2018, 51, 2848-2856.
22. Clemente, T.; Dominguez, M. R.; Vieira, N. J.; Rodrigues, M. M.; Amarante-Mendes, G. P.,
In vivo Assessment of Specific Cytotoxic T Lymphocyte Killing. Methods 2013, 61, 105-109.
23. Kavunja, H. W.; Lang, S.; Sungsuwan, S.; Yin, Z.; Huang, X., Delivery of Foreign Cytotoxic
T Lymphocyte Epitopes to Tumor Tissues for Effective Antitumor Immunotherapy Against Pre-
established Solid Tumors in Mice. Cancer Immunol. Immunother. 2017, 66, 451-460.
24. Lynn, G. M.; Laga, R.; Darrah, P. A.; Ishizuka, A. S.; Balaci, A. J.; Dulcey, A. E.; Pechar, M.;
Pola, R.; Gerner, M. Y.; Yamamoto, A.; Buechler, C. R.; Quinn, K. M.; Smelkinson, M. G.; Vanek,
O.; Cawood, R.; Hills, T.; Vasalatiy, O.; Kastenmüller, K.; Francica, J. R.; Stutts, L.; Tom, J. K.;
Ryu, K. A.; Esser-Kahn, A. P.; Etrych, T.; Fisher, K. D.; Seymour, L. W.; Seder, R. A., In vivo
Characterization of the Physicochemical Properties of Polymer-linked TLR Agonists that Enhance
Vaccine Immunogenicity. Nat. Biotechnol. 2015, 33, 1201-1210.
25. Moyer, T. J.; Zmolek, A. C.; Irvine, D. J., Beyond Antigens and Adjuvants: Formulating
Future Vaccines. J. Clin. Invest. 2016, 126, 799-808.
26. Liu, J.; Liu, X.; Han, Y.; Zhang, J.; Liu, D.; Ma, G.; Li, C.; Liu, L.; Kong, D., Nanovaccine
Incorporated with Hydroxychloroquine Enhances Antigen Cross-Presentation and Promotes
Antitumor Immune Responses. ACS Appl. Mater. Interfaces 2018, 10, 30983-30993.
27. Bal, S. M.; Hortensius, S.; Ding, Z.; Jiskoot, W.; Bouwstra, J. A., Co-encapsulation of Antigen
and Toll-like Receptor Ligand in Cationic Liposomes Affects the Quality of the Immune Response
in Mice After Intradermal Caccination. Vaccine 2011, 29, 1045-1052.
28. Dölen, Y.; Kreutz, M.; Gileadi, U.; Tel, J.; Vasaturo, A.; van Dinther, E. A. W.; van Hout-
Kuijer, M. A.; Cerundolo, V.; Figdor, C. G., Co-delivery of PLGA Encapsulated Invariant NKT
Cell Agonist with Antigenic Protein Induce Strong T Cell-mediated Antitumor Immune Responses.
Oncoimmunology 2016, 5, e1068493.
29. Fischer, N. O.; Rasley, A.; Corzett, M.; Hwang, M. H.; Hoeprich, P. D.; Blanchette, C. D.,
Colocalized Delivery of Adjuvant and Antigen Using Nanolipoprotein Particles Enhances the
Immune Response to Recombinant Antigens. J. Am. Chem. Soc. 2013, 135, 2044-2047.
187
30. Ilyinskii, P. O.; Roy, C. J.; O’Neil, C. P.; Browning, E. A.; Pittet, L. A.; Altreuter, D. H.;
Alexis, F.; Tonti, E.; Shi, J.; Basto, P. A.; Iannacone, M.; Radovic-Moreno, A. F.; Langer, R. S.;
Farokhzad, O. C.; von Andrian, U. H.; Johnston, L. P. M.; Kishimoto, T. K., Adjuvant-carrying
Synthetic Vaccine Particles Augment the Immune Response to Encapsulated Antigen and Exhibit
Strong Local Immune Activation without Inducing Systemic Cytokine Release. Vaccine 2014, 32,
2882-2895.
31. Mohsen, M. O.; Gomes, A. C.; Cabral-Miranda, G.; Krueger, C. C.; Leoratti, F. M. S.; Stein,
J. V.; Bachmann, M. F., Delivering Adjuvants and Antigens in Separate Nanoparticles Eliminates
the Need of Physical Linkage for Effective Vaccination. J. Controlled Release 2017, 251, 92-100.
32. Kasturi, S. P.; Skountzou, I.; Albrecht, R. A.; Koutsonanos, D.; Hua, T.; Nakaya, H. I.;
Ravindran, R.; Stewart, S.; Alam, M.; Kwissa, M.; Villinger, F.; Murthy, N.; Steel, J.; Jacob, J.;
Hogan, R. J.; García-Sastre, A.; Compans, R.; Pulendran, B., Programming the Magnitude and
Persistence of Antibody Responses with Innate Immunity. Nature 2011, 470, 543-547.
33. Hanson, M. C.; Crespo, M. P.; Abraham, W.; Moynihan, K. D.; Szeto, G. L.; Chen, S. H.;
Melo, M. B.; Mueller, S.; Irvine, D. J., Nanoparticulate STING Agonists are Potent Lymph Node-
Targeted Vaccine Adjuvants. J. Clin. Invest. 2015, 125, 2532-2546.
34. Chen, N.; Johnson, M. M.; Collier, M. A.; Gallovic, M. D.; Bachelder, E. M.; Ainslie, K. M.,
Tunable Degradation of Acetalated Dextran Microparticles Enables Controlled Vaccine Adjuvant
and Antigen Delivery to Modulate Adaptive Immune Responses. J. Controlled Release 2018, 273,
147-159.
35. Whiteside, T. L., Immune Suppression in Cancer: Effects on Immune Cells, Mechanisms and
Future Therapeutic Intervention. Semin. Cancer Biol. 2006, 16, 3-15.
36. Stewart, T. J.; Smyth, M. J., Improving Cancer Immunotherapy by Targeting Tumor-induced
Immune Suppression. Cancer Metastasis Rev. 2011, 30, 125-140.
37. Munn, D. H.; Bronte, V., Immune Suppressive Mechanisms in the Tumor Microenvironment.
Curr. Opin. Immunol. 2016, 39, 1-6.
38. Meng, X.; Huang, Z.; Teng, F.; Xing, L.; Yu, J., Predictive Biomarkers in PD-1/PD-L1
Checkpoint Blockade Immunotherapy. Cancer Treat. Rev. 2015, 41, 868-876.
39. Ribas, A.; Wolchok, J. D., Cancer Immunotherapy Using Checkpoint Blockade. Science 2018,
359, 1350-1355.

188
40. Pardoll, D. M., The Blockade of Immune Checkpoints in Cancer Immunotherapy. Nat. Rev.
Cancer 2012, 12, 252-264.
41. Naganawa, A.; Ichikawa, Y.; Isobe, M., Synthetic Studies on Tautomycin: Synthesis of 2,3-
Disubstituted Maleic Anhydride Segment. Tetrahedron 1994, 50, 8969-8982.
42. Sun, C.-Y.; Shen, S.; Xu, C.-F.; Li, H.-J.; Liu, Y.; Cao, Z.-T.; Yang, X.-Z.; Xia, J.-X.; Wang,
J., Tumor Acidity-Sensitive Polymeric Vector for Active Targeted siRNA Delivery. J. Am. Chem.
Soc. 2015, 137, 15217-15224.
43. Bachelder, E. M.; Beaudette, T. T.; Broaders, K. E.; Dashe, J.; Fréchet, J. M. J., Acetal-
derivatized Dextran: An Acid-responsive Biodegradable Material for Therapeutic Applications. J.
Am. Chem. Soc. 2008, 130, 10494-10495.

189
CHAPTER 4 Glycoengineering of Natural Killer Cells with CD22 Ligands for Enhanced
Anticancer Immunotherapy1
Adapted with permission from (Wang, X.; Lang, S.; Tian, Y.; Zhang, J.; Yan, X.; Fang, Z.;
Weng, J.; Lu, N.; Wu, X.; Li, T.; Cao, H.; Li, Z.; Huang, X., Glycoengineering of Natural Killer
Cells with CD22 Ligands for Enhanced Anticancer Immunotherapy. ACS Cent. Sci. 2020, 6, 382-
389, https://pubs.acs.org/doi/abs/10.1021/acscentsci.9b00956). Copyright (2020) American
Chemical Society. Further permissions related to the material excerpted should be directed to the
ACS.
4.1 Introduction
The chimeric antigen receptor T cells (CAR-T) are breakthrough anticancer therapies with
two types of CAR-T cells approved by the FDA for cancer treatment.2-3 However, despite great
promise, CAR-T therapies have several limitations.4 Because of the potential immune responses
by the host against the foreign major histocompatibility complex (MHC) molecules expressed on
the surface of nonautologous T cells,5 the patient’s own T cells need to be extracted, genetically
engineered with a chimeric antigen receptor for tumor recognition, expanded into a larger number,
and reinfused back to the patient. Such a process is time and resource intensive, which is reflected
by the high costs of CAR-T therapy ($475,000).6 In addition, for patients who have been heavily
pretreated with chemotherapy and/or radiation, it can be difficult to acquire sufficient numbers of

190
autologous T cells for CAR-T generation. CAR-T may not be produced in time for patients with
rapidly developing diseases.
Natural killer (NK) cells are another type of cytotoxic immune cells that are capable of killing
tumor cells, providing an attractive alternative to T cell-based therapy.4 NK cells do not express
MHC class I molecules on the cell surface. As a result, they can be potentially used as an off-the-
shelf cellular therapy with clinical evidence showing that adoptive transfer of allogeneic NK cells
is safe to patients.7-9 NK cells can be prepared in a large scale and readily available to patients. On
the other hand, NK cells do not have inherent targeting abilities toward cancer cells. To overcome
this drawback, NK cells have been genetically engineered with chimeric antigen receptors (CAR-
NK).4, 10 However, NK cells are known to be notoriously adverse to endogenous gene uptake,
resulting in low transgene expression.11 Therefore, new methods need to be developed to enhance
the abilities of NK cells to recognize tumor cells.
We have begun to investigate strategies to engineer NK cells and bestow de novo abilities for
NK cells to recognize cancer, such as B cell lymphoma. Each year, approximately 70,000 people
are diagnosed with B-cell lymphoma in the United States alone. While the anti-CD20 antibody
rituximab can be effective,12-13 it does not provide a cure, especially for the indolent lymphoma
with annual deaths reaching 20,000.13-16 As native NK cells lack intrinsic affinities toward B cell
lymphoma, we envision that if NK cells can be engineered to better recognize lymphoma cells,
better therapeutic efficacy may be achieved.

191
Herein, we report for the first time that glycoengineering of NK cells with 9-O modified sialic
acid-based CD22 ligands can significantly improve their abilities to bind and kill CD22+
lymphoma cells. CD22, also known as siglec-2, is a B-cell restricted antigen, which can serve as
a selective target for B cell lymphoma.17-20 The natural ligand on the cell for CD22 is the
trisaccharide Neu-5Acα-2-6-Galβ1-4GlcNAc that terminates glycans on the cell surface.21-23
Ground-breaking studies18, 22-24 by the Paulson and Nitschke groups showed that the installation
of a modified benzoate amide at the C-9 position of sialic acid in CD22 ligands can significantly
enhance the binding affinity toward CD22. Furthermore, these compounds are highly selective
toward CD22 with little crossreactivities to other siglecs, such as siglec-7, which is an inhibitory
receptor on NK cells.22 Glycan engineering of NK cells with CD22 ligands is an exciting new
strategy for anticancer immunotherapy.
*The work in this chapter was in collaboration with Dr. Xianwu Wang. For a clear
demonstration of this work, Dr. Wang’s data has been included.
4.2 Results and discussions
4.2.1 Constructing NK Cells with CD22 Ligands through Glycoengineering
As a proof-of-concept, we selected NK-92 cells, which are a well-established NK cell line25-
27 readily expandable to reach clinically useful doses. Furthermore, NK-92 cells have been tested
in phase I clinical trials for cancer treatment, exhibiting good safety profiles.28-29

192
Two glycoengineering approaches to introduce CD22 ligands onto NK-92 cells have been
tested. In the first method, the possibilities of cells to take up exogenous sialic acids and
metabolically incorporate the sialic acid into endogenous glycoproteins on the surface of cells.
While glycan metabolic engineering has been applied to cells such as cancer,30-31 it is unclear
whether NK cells can uptake modified sialic acid (sia) derivatives such as MPB-sia 1 and BPC-sia
2 as precursors and transform them into CD22 ligands through the cellular biosynthesis machinery
(Figure 4.1, Method A). In the second approach, we synthesized an amphiphilic polymer bearing
multiple CD22 ligand trisaccharide 3 (Figure 4.2). This glyco-polymer may directly insert into
NK-92 membrane, bestowing CD22 targeting abilities to NK-92 cells (Figure 4.1, Method B).
Figure 4.1 Modification of NK-92 with CD22 ligands through glyco-engineering. Two methods
have been developed. Method A is metabolic glycoengineering using a sialic acid derivative, e.g.,
MPB-sia 1, which could be metabolized onto the surface of NK-92 cell through the sialic acid
biosynthetic pathway. Method B uses a glyco-polymer containing MPB-sia, which could insert
into the NK-92 cell membrane presumably due to its amphiphilicity. Both approaches could

193
Figure 4.1 (cont’d) enhance the ability of targeting and binding of NK-92 cells towards CD22
positive cells resulting in more effective lysis of target cancer cells.
Figure 4.2 Structures of sialic acid derivatives and glyco-polymer used in this study.
MPB-Sia 1 was synthesized from Neu5Ac (Figure 4.8a). The carboxylic acid group was first
protected by methyl ester, followed by activation of 9-OH for azide substitution. After reducing 9-
N3 to amino group with H2, MPB-NHS 10 was used for introducing the MPB moiety to 9 position
MPB-Sia 1 BPC-Sia 2
MPB-Sia-Lac-N3 3
O
COOH
OH
HO
AcHN
HN
OHOH
O O
COOH
OH
HO
AcHN
HN
OHOH
O
O
O
OHO
OHO
OHO
OH
O N3HO
OH
O
COOH
HO
AcHN
HN
OHOH
O
O
CholO
Br
O
400
OO
H
100
OHN
NN
N
R
H
H
HChol =
R =
Chol-P-CD22L100 4
O
OHO
OHO
OHO
OH
OHO
OH
O
COOH
HO
AcHN
HN
OHOH
O
O

194
of Neu5Ac. Final produce MPB-Sia 1 was achieved after deprotection of methyl ester by LiOH.
To test metabolic glycoengineering, NK-92 cells were incubated with MPB-sia 1 or BPC-sia 2
supplemented medium as well as that with equal amount of unmodified free sialic acid as a control.
Upon removing all free sialic acid or derivatives by thorough washing, the cells were treated with
an α2-3,6,8 neuraminidase that can cleave α2-3, α2-6, and α2-8 sialyl linkages. The amounts of
free sialic acid and derivatives released were functionalized with 1,2-diamino-4,5-
methylenedioxybenzene (DMB)32-33 and quantified by mass spectrometry through comparison
with standard compounds. As shown in Table 4.1, while no MPB-sia 1 was detected in parent
cells, incubation of NK-92 cells with MPB-sia 1 led to the detection of significant amounts of
MPB-sia (5.2 × 10⁶ molecules/cell) from cells. DMB functionalized BPC-sia was also detected
from BPC-sia 2 treated cells. However, the amount of BPC-sia 2 was too small to be accurately
quantified, suggesting MPB-sia 1 was more efficiently incorporated into cells.
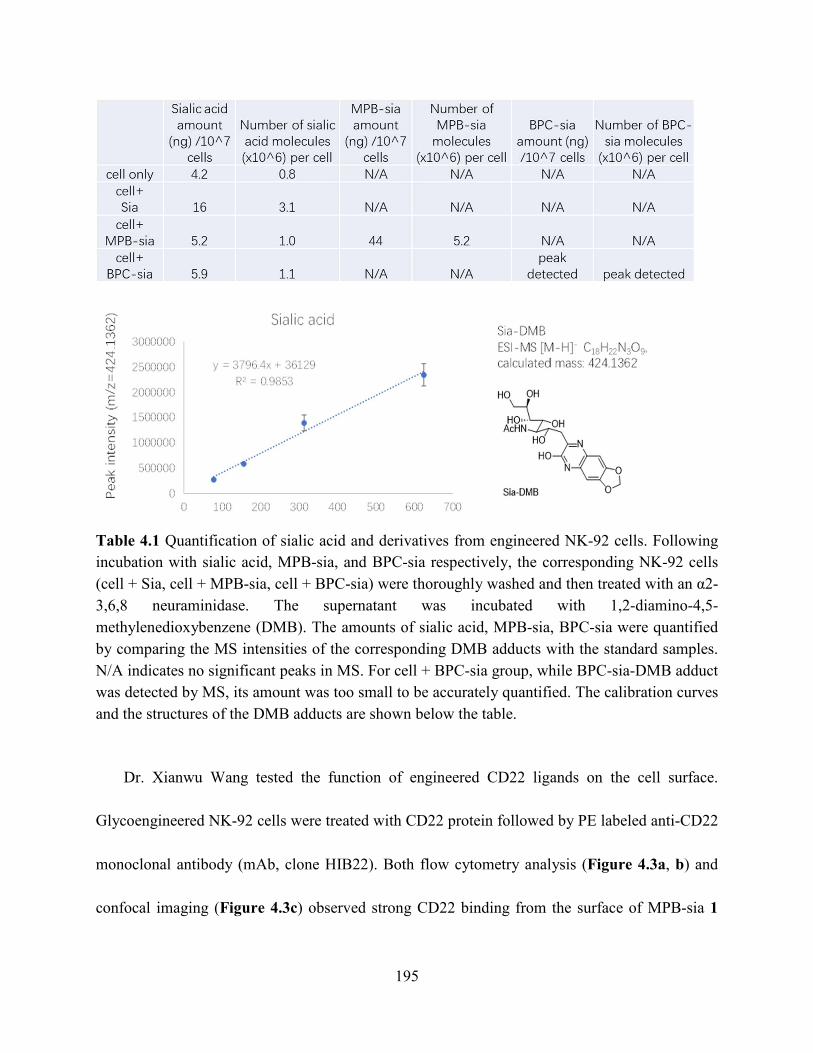
195
Table 4.1 Quantification of sialic acid and derivatives from engineered NK-92 cells. Following
incubation with sialic acid, MPB-sia, and BPC-sia respectively, the corresponding NK-92 cells
(cell + Sia, cell + MPB-sia, cell + BPC-sia) were thoroughly washed and then treated with an α2-
3,6,8 neuraminidase. The supernatant was incubated with 1,2-diamino-4,5-
methylenedioxybenzene (DMB). The amounts of sialic acid, MPB-sia, BPC-sia were quantified
by comparing the MS intensities of the corresponding DMB adducts with the standard samples.
N/A indicates no significant peaks in MS. For cell + BPC-sia group, while BPC-sia-DMB adduct
was detected by MS, its amount was too small to be accurately quantified. The calibration curves
and the structures of the DMB adducts are shown below the table.
Dr. Xianwu Wang tested the function of engineered CD22 ligands on the cell surface.
Glycoengineered NK-92 cells were treated with CD22 protein followed by PE labeled anti-CD22
monoclonal antibody (mAb, clone HIB22). Both flow cytometry analysis (Figure 4.3a, b) and
confocal imaging (Figure 4.3c) observed strong CD22 binding from the surface of MPB-sia 1

196
treated cells (MsNK-92) but not native NK-92 or free sialic acid treated NK-92 (sNK-92), which
suggest that NK-92 cells could be metabolically glycoengineered with sialic acid derivatives such
as MPB-sia 1 to install CD22 ligands on the cell surface. These results can be explained by the
higher affinity of MPB functionalized CD22 ligand with CD2222 and/or the more ready
incorporation of MPB-sia 1 onto the cells (Table 4.1).
Figure 4.3 MPB-sia can be metabolically engineered onto the surface of NK-92 cell to enhance
the binding ability to CD22 protein. a. Metabolic incorporation of various sialic acid derivatives
onto NK-92 cells as measured by flow cytometry. Control represents non-engineered NK-92 cells
treated with CD22-Fc and PE-mouse anti human CD22 mAb (Clone HIB22). b. Quantification of
the mean fluorescence intensities upon cells upon incubation with various sialic acid derivatives.
Mean with SD are presented for n = 3. c. Confocal microscopy images of NK-92 cells engineered
with sialic acid (sNK-92) or MPB-sia 1 (MsNK-92), followed by human CD22-Fc incubation and
PE-mouse anti human CD22 mAb staining. Cells were fixed and nuclei were stained with DAPI.
Scale bar, 10 μm. (Data collected by Dr. Xianwu Wang)

197
Dr. Wang also investigated the kinetic of metabolic engineering. A dose- and time-dependent
manner of CD22 ligand level on NK-92 was detected (Figure 4.4). Cell viability studies showed
slight decreases of cell viability when concentrations of MPB-sia 1 were over 4 mM (Figure 4.5).
Thus, 2 mM MPB-sia 1 was selected for further study. Upon removal of MPB-sia 1 from cell
culture medium, 50% of CD22 binding remained on NK-92 cells after 48 h (Figure 4.6). Little
influence on the overall amounts of α2-6-sia linkages by MPB-sia 1 incubation was detected when
staining NK-92 with FITC-labeled α2-6-sia binding plant lectin Sambucus nigra lectin (SNA)
before and after metabolic engineering (Figure 4.7).
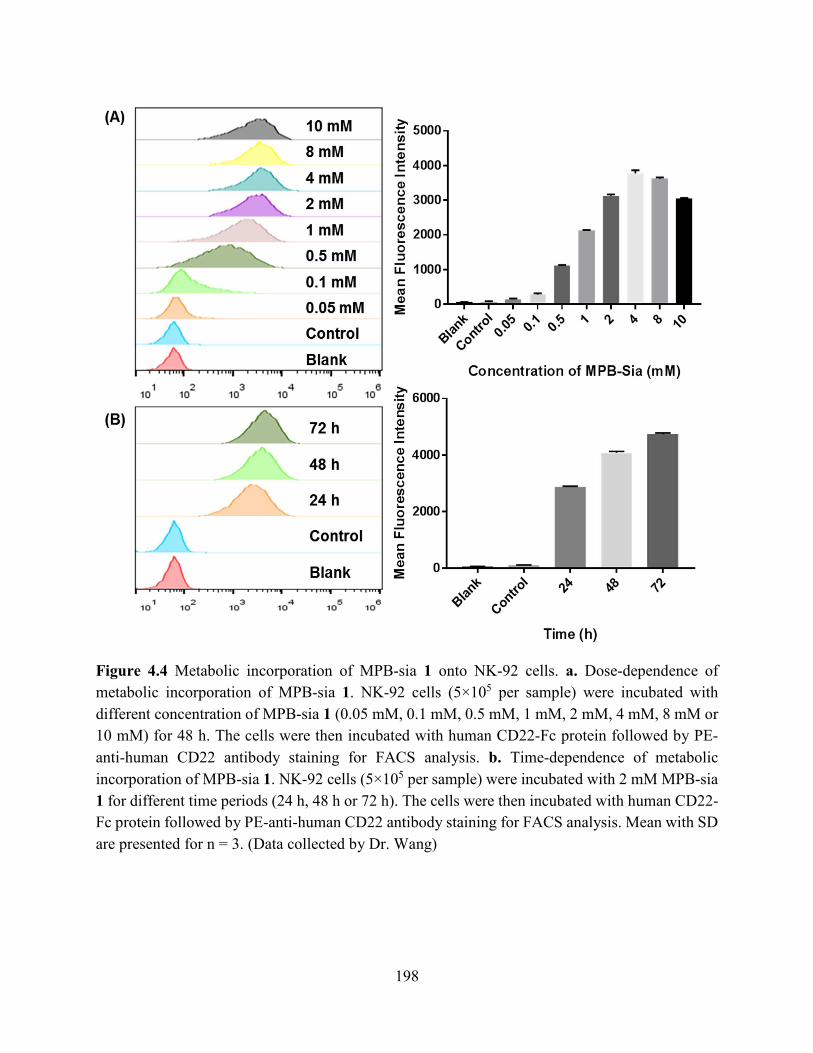
198
Figure 4.4 Metabolic incorporation of MPB-sia 1 onto NK-92 cells. a. Dose-dependence of
metabolic incorporation of MPB-sia 1. NK-92 cells (5×10⁵ per sample) were incubated with
different concentration of MPB-sia 1 (0.05 mM, 0.1 mM, 0.5 mM, 1 mM, 2 mM, 4 mM, 8 mM or
10 mM) for 48 h. The cells were then incubated with human CD22-Fc protein followed by PE-
anti-human CD22 antibody staining for FACS analysis. b. Time-dependence of metabolic
incorporation of MPB-sia 1. NK-92 cells (5×10⁵ per sample) were incubated with 2 mM MPB-sia
1 for different time periods (24 h, 48 h or 72 h). The cells were then incubated with human CD22-
Fc protein followed by PE-anti-human CD22 antibody staining for FACS analysis. Mean with SD
are presented for n = 3. (Data collected by Dr. Wang)

199
Figure 4.5 The effect of MPB-sia 1 on NK-92 cell viability. a. NK-92 cells (5×10⁵ per sample)
were incubated with different concentrations of MPB-sia 1 (0.3 mM, 1 mM, 2 mM, 4 mM, 8 mM
or 10 mM) for 48 h. Cells were then stained with Calcein AM and the cell viability was analyzed
by FACS. b. NK-92 cells (5×10⁵ per sample) were incubated with 2 mM of MPB-sia 1 for 24 h or
48 h. Cells were then stained with Calcein AM and the cell viability was analyzed by FACS. Mean
with SD are presented for n = 3. (Data collected by Dr. Wang)
Figure 4.6 Persistence of cell surface CD22 ligands after metabolic engineering. NK-92 cells were
first incubated with 2 mM MPB-sia 1 for 48 h, followed by washing and incubating with fresh
culture medium without MPB-sia 1 for various time periods (0 h, 12 h, 24 h or 48 h). The cells
were further incubated with human CD22-Fc protein followed by PE-anti-human CD22 antibody
staining for FACS quantification of surface CD22 ligand level. Mean with SD are presented for n
= 3. (Data collected by Dr. Wang)
0 12 24 480
50
100
Time (h)

200
Figure 4.7 The level of α2-6-sia linkage on NK-92 cell surface before and after metabolic
engineering. Unmodified NK-92 cells and metabolic engineered NK-92 (MsNK-92) cells (5×10⁵
per sample) stained by FITC-labeled α2-6-sia binding plant lectin Sambucus nigra lectin (SNA)
followed by FACS analysis. Mean with SD are presented for n = 3. (Data collected by Dr. Wang)
As an alternative to metabolic glycoengineering, I investigated the possibility of directly
inserting CD22 ligands onto the surface of NK-92 cells (Figure 4.1, Method B). In order to
accomplish this, a cholesterol-terminated poly(acrylic acid) polymer was synthesized by atom-
transfer radical-polymerization (ATRP) from a cholesterol initiator with an average molecular
weight of 30 kDa (Figure 4.8b). The carboxylic acid side chain of the polymer was partially
modified with alkynes. The trisaccharide CD22 ligand with an azide handle, MPB-sia-α2-6-Lac-
N3 3, was synthesized by enzymatic glycosylation between MPB-Sia 1 and Lac-N3 11. The
polymer and trisaccharide CD22 ligands were conjugated through the copper catalyzed
azide−alkyne cycloaddition reaction with an average of 100 trisaccharides per polymer chain
producing glyco-polymer Chol-P-CD22L100 4 (Figure 4.2). Upon incubation of NK-92 cells with

201
the Chol-P-CD22L100 4, the cholesterol end of the polymer could insert into the cellular membrane
through hydrophobic−hydrophobic interactions, anchoring the polymer onto the cell surface. After
1 h of incubation, the cells were washed followed by treatment with human CD22 and the PE-
labeled anti-CD22 mAb. Strong CD22 binding was detected with 2.5 μM polymer (equivalent to
250 μM MPB-sia 1) (Figure 4.9a). A dose dependent manner of hydrophobic insertion
engineering was observed and with higher polymer concentration (5 μM and 10 μM, equivalent to
500 μM and 1mM MPB-Sia 1 respectively), a stronger CD 22 binding can be detected (Figure
4.9a). The success of surface modification was confirmed by confocal imaging as well (Figure
4.9b). With the glycopolymer, while the surface CD22 ligand level decreased rapidly (∼85% loss)
during the first 24 h after removal of polymer-containing medium, CD22 binding remained
detectable for at least 72 h by FACS analysis (Figure 4.10). No significant cytotoxicities were
noticed when NK-92 cells were co-incubated with Chol-P-CD22L100 4 for up to 48 h at
concentrations lower than 12.5 μM (Figure 4.11). Compared to metabolically engineered NK cells
(Figure 4.6), the polymer approach was associated with much faster drops in surface CD22 ligand
levels. This may be because through metabolic glycoengineering, MPB-sia 1 taken up inside the
cells could be continuously modified into CD22 ligands over time.
I also studied whether a polymer containing multiple copies of cholesterol can help prolong
the retention of polymer on NK-92 surface. Multiple attempts for synthesizing cholesterol grafted
polymers have been made (Appendix Scheme 4.1). Direct polymerization of cholesterol

202
monomers via either ATRP or RAFT failed to produce reasonable monomer conversion and only
short oligomers containing no more than 4 cholesterols were obtained. Besides, the product
typically suffering from poor solubility in both water and organic solvents, which made the
following reactions extremely difficult. Instead, by first synthesizing a hydrophilic di-block
polymer via ATRP, followed by post-polymerization modification of cholesterol and the CD22
ligand, MPB-Sia-Lac-N3 3, a polymer containing 8 copies of cholesterol on one block and 25
copies of CD22 ligand on the other block can be obtained. However, the 8 cholesterol molecules
did not help prolong the retention of polymer on NK-92 surfaces (Figure 4.12).
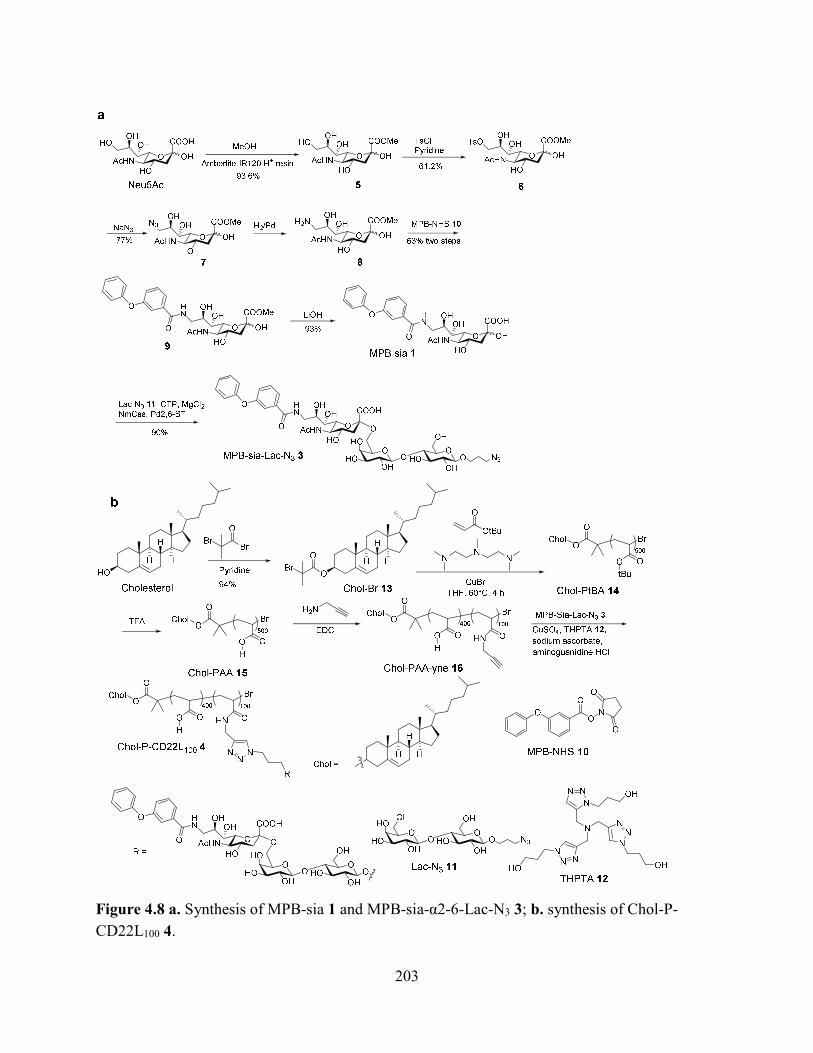
203
Figure 4.8 a. Synthesis of MPB-sia 1 and MPB-sia-α2-6-Lac-N3 3; b. synthesis of Chol-P-
CD22L100 4.
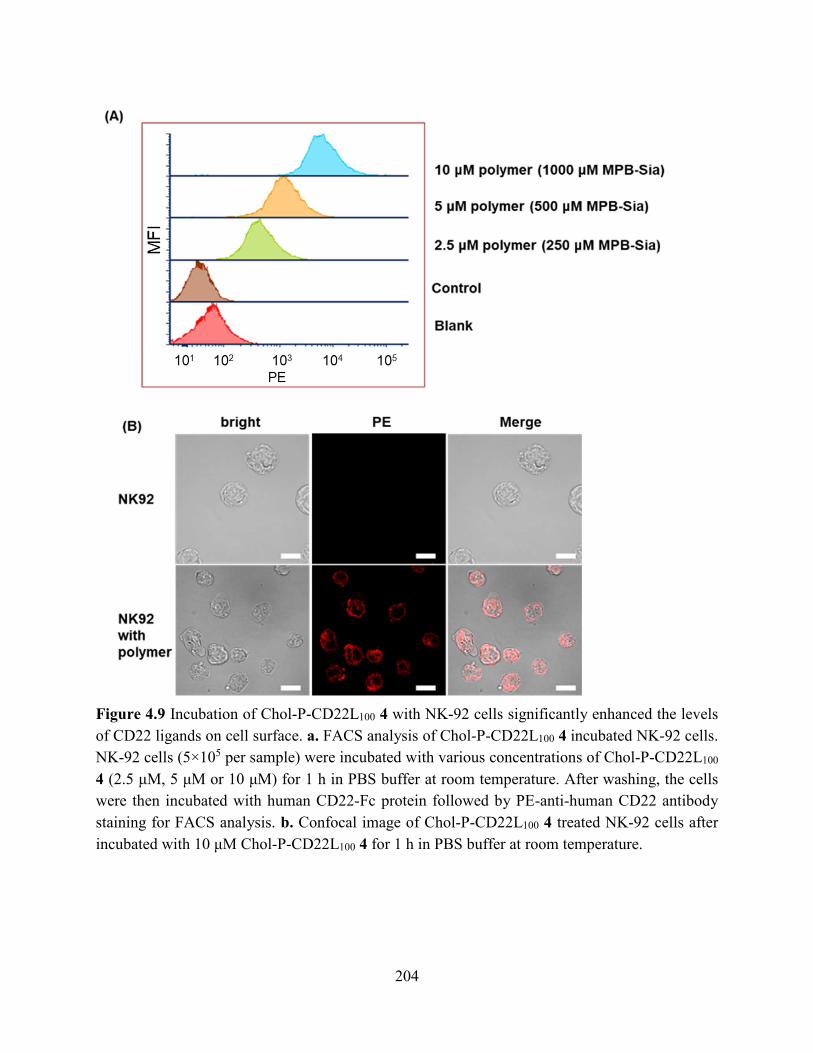
204
Figure 4.9 Incubation of Chol-P-CD22L100 4 with NK-92 cells significantly enhanced the levels
of CD22 ligands on cell surface. a. FACS analysis of Chol-P-CD22L100 4 incubated NK-92 cells.
NK-92 cells (5×10⁵ per sample) were incubated with various concentrations of Chol-P-CD22L100
4 (2.5 μM, 5 μM or 10 μM) for 1 h in PBS buffer at room temperature. After washing, the cells
were then incubated with human CD22-Fc protein followed by PE-anti-human CD22 antibody
staining for FACS analysis. b. Confocal image of Chol-P-CD22L100 4 treated NK-92 cells after
incubated with 10 μM Chol-P-CD22L100 4 for 1 h in PBS buffer at room temperature.

205
Figure 4.10 Time-dependent persistence of CD22 ligands on cell surface after incubation with
Chol-P-CD22L100 4. NK92 cells were incubated with 10μM Chol-P-CD22L100 4 for 1h in PBS
under room temperature. Cells were washed and cultured in fresh medium. An aliquot of cells was
collected from the cell culture at different time points (0, 4, 8, 12, 24, 48, 72, 96 and 120 h) and
incubated with human CD22-Fc protein followed by PE-anti-human CD22 antibody staining.
FACS was used for detecting CD22 binding level. Polymer can last on cell surface for ~72h.
Unst
ained
Cel
ls 0 h
1 h
4 h
8 h
24 h
48 h
72 h
96 h
120
h
050
100150200250
1000
2000
3000
4000
5000

206
Figure 4.11 The effect of Chol-P-CD22L100 4 on NK-92 cell viability. NK-92 cells (5×10⁵ per
sample) were incubated with different concentrations of Chol-P-CD22L100 4 (6.5 μM, 12.5 μM,
25 μM or 50 μM) for a. 24 h and b. 48 h. Untreated NK-92 cells were used as control. Cell viability
was analyzed by trypan blue staining.

207
Figure 4.12 Time-dependent persistence of CD22 ligands on cell surface after incubation with
polymers containing different copies of cholesterol. NK92 cells were incubated with 10μM Chol-
P-CD22L100 4 (1 cholesterol per chain) or 40μM Chol8-P-CD22L25 (8 cholesterols per chain) for
1h in PBS under room temperature. Cells were washed and cultured in fresh medium. An aliquot
of cells was collected from the cell culture at different time points (0, 4, 24 and 48 h) and incubated
with human CD22-Fc protein followed by PE-anti-human CD22 antibody staining. FACS was
used for detecting CD22 binding level. Increasing cholesterol copies on polymer did not prolonged
the presence of CD22 ligand significantly.
4.2.2 Enhanced Killing of CD22 Positive Cells by Glycoengineered NK-92 Cells
With the increased affinity of glycoengineered NK-92 cells for CD22, their cytotoxicities
toward CD22+ cancer cells were evaluated. Dr. Wang observed that the metabolic glycoengineered
NK-92 cells significantly enhanced lysis of CD22+ Raji compared to unmodified NK-92 at
effector/target cell ratio 1 or greater (Figure 4.13a). The killing of Raji cells is CD22 dependent,
as the addition of free CD22 to Raji-engineered NK-92 mixture decreased Raji lysis significantly
(Figure 4.13b). The reduced cytotoxicities in the presence of free CD22 are presumably due to

208
competitive binding of free CD22 protein to engineered NK-92 cells, suggesting CD22 plays an
important role in cytotoxicities of engineered NK-92 cells toward CD22+ cancer cells.
Figure 4.13 Glycoengineered NK-92 cells could enhance killing of CD22 positive cells. a. Lysis
of Raji-luc cells by NK-92 and MsNK-92. Different effector-to-target cell ratios; P = 0.0049 (E/T
= 1) and P = 0.0026 (E/T = 5). b. Increasing concentration of CD22 reduced the killing activities
of engineered MsNK-92 cells, while impacting little the activities of NK-92 cells without
glycoengineering; E/T = 1:1, P = 0.0154 (0 μg/mL free CD22 protein), P = 0.0442 (1 μg/mL). c.
Relative killing activities of glycoengineered NK-92 cells against CD22 positive CHO cells as
detected by flow cytometry. d. Significantly enhanced cytotoxicities were bestowed by
glycoengineered NK-92 cells toward CD22 high patient-derived leukemic cells (P1−P4) versus
those expressing CD22 in low levels (P5−P7). Top row: surface expression of CD22 on patient-
derived leukemic samples as determined by flow cytometry. Bottom row: lysis of patient-derived
leukemic samples by NK-92 and MsNK-92. p = 0.0077 (P1), p =0.0002 (P2), p = 0.0009 (P3), p
= 0.0014 (P4), p = 0.4439 (P5), p = 0.2907 (P6), and p = 0.8473 (P7). Mean with SD are presented
for n = 3. Statistical significances were assessed using Student’s t test. In all figures, ns, p > 0.05;
*, p < 0.05; **, p < 0.01; ***, p < 0.001. (Data collected by Dr. Wang)
To further confirm the role of CD22 in cytotoxicities of glycoengineered NK-92 cell, Chinese
Hamster Ovarian (CHO) cells were genetically engineered to express human CD22 on the cell

209
surface (CHO-hCD22), which were subjected to cytotoxicity assay by glycoengineered NK-92
cells34-35 with wild-type CHO cells (CHO-WT) as the control. Both metabolic glycoengineered
and glycopolymer-modified NK-92 cells showed enhanced cytotoxicity toward CHO-hCD22 cells
compared to CHO-WT cells (Figure 4.13c and Figure 4.14), confirming the importance of CD22
in cytotoxicities of engineered NK-92. As the killing activities of both types of NK cells were
similar and metabolic engineering requires only the monosaccharide MPB-sia 1 without the need
to synthesize trisaccharide 3 and the polymer 4, further investigation was focused on the metabolic
glycoengineering approach.
Figure 4.14 Cell lysis of CHO-CD22 after incubation with Chol-P-CD22L100 4. CFSEhi labeled
CHO-CD22 and CFSElo labeled CHO-WT cells were mixed at 1:1 ratio and co-cultured with
NK92 or NK92+Chol-P-CD22L100 4 for 6h followed by FACS analysis. The specific lysis of
CD22 was calculated based on the CFSEhi/CFSElo cell ratio change before and after co-culture
with NK cells. Mean with SD are presented for n = 3.
To establish the potential translatability of the glycoengineering strategy, Dr. Wang analyzed
the lysing ability of NK-92 cells toward primary lymphoma cells obtained from lymphoma patients
sp
ec
ific
ly
sis
(%
)

210
(Figure 4.13d). Significantly enhanced cytotoxicities by glycoengineered NK-92 compared to
unmodified NK-92 were observed in patient-derived lymphoma cells expressing high levels of
CD22 (P1−P4 in Figure 4.13d), but not in cells with low levels of CD22 expression (P5−P7 in
Figure 4.13d). These results suggested glycoengineering of NK-92 cells with MPB-sia 1 can be a
promising strategy to treat patients with CD22 positive B cell lymphoma.
4.2.3 Enhanced Killing Mechanism of Glycoengineered NK-92 Cells against Raji Cells
Dr. Wang observed significantly higher percentages of glycoengineered NK-92 cells were
found clustered with Raji cells compared with native NK-92 cells and Raji cells (Figure 4.15),
which could be attributed to the CD22 ligands on the glycoengineered NK-92 increasing the
binding affinity with Raji. When bound with Raji cells, increased number of cytotoxic granules
(Figure 4.16), as well as increased secretion of pro-inflammatory cytokine IFN-γ (Figure 4.17),
were observed in metabolic glycoengineered NK-92 cells.
Figure 4.15 Glyco-engineered NK-92 binding with CD22+ cells. Fluorescence microscopy image
of cell clusters between Raji cells stained with Calcein-AM and a. NK-92 or b. MsNK-92. c.
Percentage of cell clusters, P=0.0010. Mean with SD are presented for n = 3. Statistical
significance was assessed using Student`s t-test. In all figures, ns, p > 0.05; *p < 0.05; **p < 0.01;
***p < 0.001. (Data collected by Dr. Wang)

211
Figure 4.16 Complex formation between NK-92 cells and Raji cells investigated by confocal
microscopy. Raji cells and NK-92 cells were co-incubated for 1 h, fixed, permeabilized, and
stained for perforin (red) to identify cytotoxic granules. Cell nuclei were labeled with DAPI (blue).
Scale bar: 10 μm. a. Representative images of cell−cell complex formation. b. Perforin (red)
fluorescence quantification. P = 0.0071. Mean with SD are presented for n = 3. Statistical
significance was assessed using Student’s t test. In all figures, ns, p > 0.05; *, p < 0.05; **, p <
0.01; ***, p < 0.001. (Data collected by Dr. Wang)
Figure 4.17 IFN-γ production by glycoengineered NK-92 cells when stimulated with CD22+ Raji
cells. P=0.0002. Mean with SD are presented for n = 3. Statistical significance was assessed using
Student`s t-test. In all figures, ns, p > 0.05; *p < 0.05; **p < 0.01; ***p < 0.001. (Data collected
by Dr. Wang)
Raj
i
NK92
NK92
+Raj
i
MsN
K92
+Raj
i0
10
20
30
40
***

212
4.2.4 Evaluation of Antitumor Effect of Glycoengineered NK-92 Cells In Vivo.
With the promising in vitro results, we analyzed the antitumor effect of glycoengineering in
vivo. Dr. Wang has observed the metabolic glycoengineered MsNK-92 cells significantly slowed
down the growth of subcutaneously implanted luciferase engineered Raji (Raji-luc) tumor
compared to PBS or unmodified Nk-92 treated group (Figure 4.18).
Figure 4.18 In vivo antitumor activity of glycoengineered NK-92 cells against Raji-luc xenograft
model. 107 Raji-luc cells were injected subcutaneously into the flanks of Balb/c nude mice. Fifteen
days later, the mice were treated with an intratumoral injection of 107 glycoengineered NK-92
cells (MsNK-92 in 50 μL PBS), unengineered NK-92 (NK-92), or PBS buffer (50 μL) once a week.
Bioluminescence images (BLI) were acquired with an IVIS Lumina II imaging system. a. Images
of mice with tumor at day 36. b. Tumor growth curve. c. Tumor weight measurements. d. BLI
images of the tumor after surgical removal from mice. e. Quantitative BLI signals of the tumor
after surgical removal from mice. Mean with SD are presented. Statistical significance was
assessed using Student’s t test. In all figures, ns, p > 0.05; *, p < 0.05; **, p < 0.01; ***, p < 0.001.
p = 0.0294 (panel B), p = 0.0003 (MsNK-92 vs PBS), p = 0.0010 (MsNK-92 vs NK-92) (panel C),
p = 0.0025 (MsNK-92 vs PBS), p = 0.0024 (MsNK-92 vs NK-92) (panel E). (Data collected by
Dr. Wang)
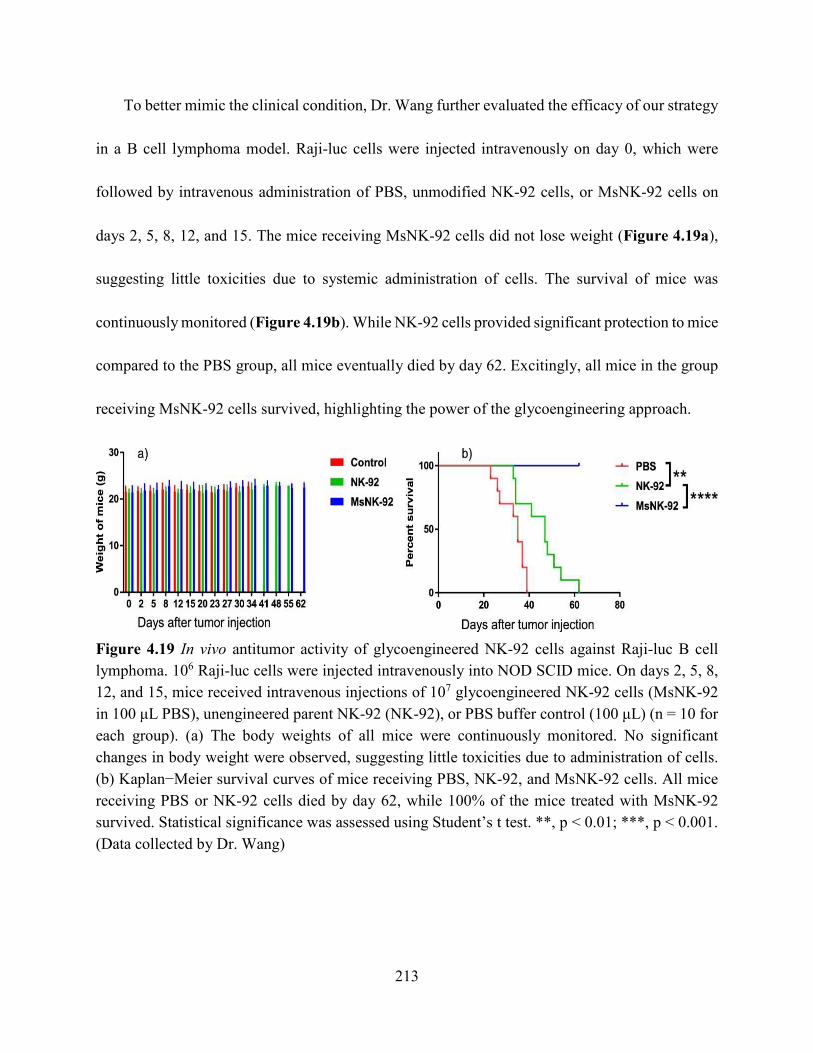
213
To better mimic the clinical condition, Dr. Wang further evaluated the efficacy of our strategy
in a B cell lymphoma model. Raji-luc cells were injected intravenously on day 0, which were
followed by intravenous administration of PBS, unmodified NK-92 cells, or MsNK-92 cells on
days 2, 5, 8, 12, and 15. The mice receiving MsNK-92 cells did not lose weight (Figure 4.19a),
suggesting little toxicities due to systemic administration of cells. The survival of mice was
continuously monitored (Figure 4.19b). While NK-92 cells provided significant protection to mice
compared to the PBS group, all mice eventually died by day 62. Excitingly, all mice in the group
receiving MsNK-92 cells survived, highlighting the power of the glycoengineering approach.
Figure 4.19 In vivo antitumor activity of glycoengineered NK-92 cells against Raji-luc B cell
lymphoma. 106 Raji-luc cells were injected intravenously into NOD SCID mice. On days 2, 5, 8,
12, and 15, mice received intravenous injections of 107 glycoengineered NK-92 cells (MsNK-92
in 100 μL PBS), unengineered parent NK-92 (NK-92), or PBS buffer control (100 μL) (n = 10 for
each group). (a) The body weights of all mice were continuously monitored. No significant
changes in body weight were observed, suggesting little toxicities due to administration of cells.
(b) Kaplan−Meier survival curves of mice receiving PBS, NK-92, and MsNK-92 cells. All mice
receiving PBS or NK-92 cells died by day 62, while 100% of the mice treated with MsNK-92
survived. Statistical significance was assessed using Student’s t test. **, p < 0.01; ***, p < 0.001.
(Data collected by Dr. Wang)

214
4.3 Conclusion
While NK cells can potentially be cytotoxic against cancer cells, their lack of inherent affinity
toward cancer cells is a significant drawback for NK-based therapy. To overcome this, we
chemically engineered NK cells to gain novel targeting abilities. Among various strategies and
reagents examined, the metabolic glycoengineering with MPB-sia monosaccharide successfully
introduced CD22 ligand on NK-92 cells through the sialic acid biosynthetic pathway for B cell
lymphoma targeting. The introduced MPB group greatly enhanced the binding ability and killing
activity of NK-92 cells against CD22 positive cells in vitro and in mouse tumor models. Moreover,
the glycoengineered NK-92 cells exhibited CD22-dependent cytotoxicity against primary
lymphoma cells isolated from patients, which highlights its translational potential. The NK cell
metabolic glycoengineering approach is simple and effective and can complement well the genetic
engineering strategy of chimeric antigen receptors. Although the CD22 ligands on the NK cell
surface would eventually become undetectable, the patients can be infused with multiple rounds
of engineered NK cells to treat cancer. Studies are underway to further develop the
glycoengineering method to enhance the efficacy of NK cell-based immunotherapy.
4.4 Experimental methods
4.4.1 Materials
Sialic acid, Amberlite IR 120 H+ resin, m-phenoxybenzoic acid (MPB), cytidine-5'-
triphosphate (CTP), propargyl amine, tris(3-hydroxypropyltriazolylmethyl)amine (THPTA), 4%

215
paraformaldehyde were purchased from Millipore-Sigma. Toluenesulfonyl chloride, sodium azide,
Pd(OH)2/C (10-15% loading), 1-ethyl-3-(3-dimethylaminopropyl)carbodiimide hydrochloride
(EDC•HCl), N-hydroxysuccinimide (NHS), lithium hydroxide, α-bromoisobutyryl bromide, t-
butylacrylate (tBA), N,N,N′,N′′,N′′-pentamethyldiethylenetriamine (PMDETA), CuBr, sodium
ascorbate, amino guanidine were purchased from Acros Organics. Cholesterol, 4-
dimethylaminopyridine (DMAP) were purchased from Alfa Aesar. Anhydrous methanol,
anhydrous ethanol, diethyl ether, dichloromethane (DCM), anhydrous pyridine, acetic acid,
dimethylformamide (DMF), diisopropylethylamine (DIPEA), magnesium chloride, triethylamine
(TEA), sodium chloride, sodium sulfate, tetrahydrofuran (THF), trifluoroacetic acid (TFA) were
purchased from Fisher Scientific. E. coli Recombinant CMP-Sialic acid synthetase from Neisseria
meningitides (NmCss), Photobacterium damselae α2−6-sialyltransferase (Pd2,6ST) were
purchased from Chemily Glycoscience. Human CD22-Fc Chimera protein was purchased from
R&D Systems. PE-mouse anti-human CD22 monoclonal antibody (Clone HIB22) was purchased
from BD Pharmingen™. FITC-labeled α2,3-sialic acid binding plant lectin Maackia Amurensis
Lectin I (FITC-MAL I) and FITC-labeled α2,6-sialic acid binding plant lectin Sambucus Nigra
Lectin (FITC-SNA) were purchased from Vector Laboratories. Firefly luciferase reporter gene
assay kit, Immunostaining permeabilization buffer with Triton X-100, DAPI were purchased from
Beyotime Biotechnology. BPC-Sia 2 was purchased from Xiamen Nuokangde Biological
Technology Co. Ltd. Perforin-specific antibody δG9 was purchased from Santa Cruz

216
Biotechnology. Alexa Fluor 594-coupled anti-mouse antibody was purchased from Life
Technologies.
No unexpected or unusually high safety hazards were encountered.
4.4.2 Mice
Pathogen free female NSG mice age 6 - 10 weeks were obtained from Charles River. BALB/c
nude mice and NOD SCID mcie (female, 6-8 weeks) were purchased from model animal research
center of Nanjing university (Nanjing, China) and all animal experiments were conducted under
the animal use and care regulations approved by Institutional Animal Care and Use Committee at
Michigan State University and Xiamen University.
4.4.3 Synthesis of compound 5
Sialic acid (20 g, 64.7 mmol) and Amberlite IR 120 H+ resin (15 g) were suspended in
anhydrous methanol (300 ml). The reaction mixture was stirred under room temperature for 72 h.
After filtering off the resin, the solvent was concentrated by rotavapor to around 30 ml. Then
diethyl ether (300 ml) was added to precipitate out the product. The resulting solid product 5 (19.63
g, yield = 93.6 %) was collected by filtration and dried under nitrogen gas overnight. The product
was used without further purification. 1H NMR (500 MHz, Methanol-d4) δ 4.08 – 3.96 (m, 2H),
3.86 – 3.76 (m, 2H), 3.77 (s, 3H), 3.70 (ddd, J = 9.3, 5.7, 2.9 Hz, 1H), 3.61 (dd, J = 11.4, 5.7 Hz,
1H), 3.47 (dd, J = 9.3, 1.5 Hz, 1H), 2.21 (dd, J = 12.9, 4.9 Hz, 1H), 2.01 (s, 3H), 1.89 (dd, J = 12.9,
11.4 Hz, 1H). 13C NMR (126 MHz, Methanol-d4) δ 175.29, 171.94, 96.82, 72.20, 71.78, 70.31,

217
68.00, 64.97, 54.45, 53.34, 40.84, 22.83. ESI-MS: [M+Na]+ C12H21NaNO9 calculated 346.1109;
observed: 346.1120. The NMR data matched previously reported data36.
4.4.4 Synthesis of compound 7
The synthesis of compound 7 followed literature report with modifications37. Compound 5
(3.23 g, 10 mmol) was dissolved in anhydrous pyridine (20 ml) and cooled on ice for 10 min. Tosyl
chloride (2.5 g, 13 mmol) was dissolved in anhydrous pyridine (10 ml) and added to the solution
of compound 5 dropwise. The reaction mixture was allowed to reach room temperature after
addition of tosyl chloride was completed followed by stirring overnight. After reaction, the solvent
was removed by rotavapor and the residue was collected and purified by silica gel column with
DCM: MeOH = 10: 1 elution to obtain product 6 (2.92 g, yield = 61.2 %). 1H NMR (500 MHz,
Chloroform-d) δ 7.75 (d, J = 8.3 Hz, 2H), 7.33 (d, J = 8.3 Hz, 2H), 7.17 – 6.98 (m, 1H), 4.38 –
4.18 (m, 1H), 4.18 – 4.04 (m, 3H), 4.03 – 3.91 (m, 1H), 3.89 – 3.79 (m, 1H), 3.76 (s, 3H), 3.48 (s,
1H), 2.42 (s, 3H), 2.31 – 2.16 (m, 1H), 2.04 (s, 3H), 2.00 – 1.92 (m, 1H).
Compound 6 (2.92 g. 6.1 mmol) was dissolved in methanol (50 ml). NaN3 (2 g, 30.8 mmol)
was added to the reaction. Then the reaction mixture was heated to reflux and stirred until
compound 6 was completely consumed (monitored by TLC, DCM: MeOH = 10: 1). After the
reaction mixture was cooled down to room temperature, the unreacted NaN3 was carefully filtered
off. The filtrate was collected and concentrated by rotavapor followed by silica gel column
purification (DCM: MeOH = 10: 1) to yield pure compound 7 (1.64 g, yield = 77%).1H NMR (500

218
MHz, Methanol-d4) δ 3.92 (ddd, J = 11.4, 10.1, 4.9 Hz, 1H), 3.87 – 3.79 (m, 2H), 3.73 (s, 3H),
3.73 – 3.65 (m, 1H), 3.51 (dd, J = 12.8, 2.8 Hz, 1H), 3.38 – 3.29 (m, 2H), 2.21 (dd, J = 13.0, 4.9
Hz, 1H), 1.98 (s, 3H), 1.90 (dd, J = 13.0, 11.4 Hz, 1H). 13C NMR (126 MHz, Methanol-d4) δ
178.11, 174.36, 99.29, 74.42, 73.23, 72.95, 70.34, 58.24, 57.14, 56.63, 43.01, 26.11. ESI-MS:
[M+Na] + C12H10NaN4O8 calculated: 371.1179, observed: 371.1178.
4.4.5 Synthesis of MPB-Sia 1
Compound 7 (1.5 g, 4.3 mmol) was dissolved in methanol (20 ml), Pd(OH)2/C (10-15%
loading, 200 mg) and acetic acid (1 ml) were added to the flask. The reaction mixture was then
stirred under H2 atmosphere until the compound 7 was completely consumed (monitored by TLC,
DCM: MeOH = 10: 1). The reaction mixture was then filtered to remove the Pd(OH)2/C. The
resulting filtrate was collected and concentrated to yield compound 8 (1.26 g, 91.3 %). The product
was used without further purification. 1H NMR (500 MHz, Methanol-d4) δ 4.06 (ddd, J = 11.4,
10.1, 5.0 Hz, 1H), 3.97 – 3.89 (m, 2H), 3.84 – 3.73 (m, 4H), 3.55 – 3.47 (m, 1H), 3.25 (dd, J =
12.8, 3.9 Hz, 1H), 3.03 (dd, J = 12.8, 7.5 Hz, 1H), 2.27 (dd, J = 13.0, 5.0 Hz, 1H), 2.03 (s, 3H),
1.88 (dd, J = 13.0, 11.3 Hz, 1H).
MPB-NHS 10 was synthesized by the following procedure: MPB (2.14 g, 10 mmol) was
dissolved in DMF (20 ml), followed by adding EDC•HCl (2 g, 10.5 mmol) and NHS (1.2 g, 10.5
mmol). The reaction mixture was stirred under room temperature overnight. After the reaction, the
solvent was removed by rotavapor and the residue was purified by silica gel column (hexane: ethyl

219
acetate =3: 1 to 2: 1) to yield MPB-NHS 10 (2.56 g, 82.3 %).1H NMR (500 MHz, Chloroform-d)
δ 7.88 (ddd, J = 8.0, 1.5, 0.9 Hz, 1H), 7.73 (dd, J = 2.5, 1.5 Hz, 1H), 7.48 (t, J = 8.0 Hz, 1H), 7.41
– 7.36 (m, 2H), 7.32 (ddd, J = 8.0, 2.5, 0.9 Hz, 1H), 7.19 – 7.13 (m, 1H), 7.06 – 7.00 (m, 2H), 2.89
(s, 4H). 13C NMR (126 MHz, Chloroform-d) δ 169.18, 161.41, 157.92, 156.13, 130.34, 130.11,
130.09, 126.66, 125.09, 124.22, 120.01, 119.42, 25.68.
Compound 8 (1.26 g, 3.9 mmol) was dissolved in DMF (20 ml) followed by the addition of
DIPEA (1.1 ml, 0.81 g, 6.3 mmol) and MPB-NHS 10 (1.8 g, 5.8 mmol). The reaction mixture was
stirred overnight under room temperature. After removal of solvent by rotavapor, the residue was
purified by silica gel column (DCM: MeOH= 10: 1 to 2: 1) to yield compound 9 (1.40 g, yield =
69.5 %). 1H NMR (500 MHz, Methanol-d4) δ 7.56 (ddd, J = 7.7, 1.7, 0.9 Hz, 1H), 7.50 – 7.41 (m,
2H), 7.41 – 7.34 (m, 2H), 7.18 – 7.11 (m, 2H), 7.04 – 6.98 (m, 2H), 4.07 – 3.96 (m, 2H), 3.89 –
3.77 (m, 3H), 3.76 (s, 3H), 3.57 – 3.36 (m, 2H), 2.20 (dd, J = 12.9, 4.9 Hz, 1H), 1.97 (s, 3H), 1.91
– 1.81 (dd, J = 12.9, 11.5 Hz, 1H).
An aqueous solution of LiOH (324 mg, 13.5 mmol in 20 ml DI water) was added to the flask
containing compound 9 (1.40 g, 2.7 mmol). The reaction was stirred under room temperature for
2 h. The reaction mixture was neutralized with Amberlite IR 120 H+ resin to pH 5. After removal
of resin by filtration, the solution was collected and lyophilized to yield MPB-Sia 1 without further
purification (1.26 g, yield = 93 %). 1H NMR (500 MHz, Deuterium Oxide) δ 7.54 – 7.46 (m, 2H),
7.46 – 7.39 (t, J = 8.5 Hz, 2H), 7.42 – 7.30 (m, 1H), 7.27 – 7.18 (m, 2H), 7.11 – 7.05 (d, J = 8.5
220
Hz, 2H), 4.07 – 3.95 (m, 2H), 3.95 – 3.78 (m, 2H) 3.72 (dd, J = 14.2, 3.1 Hz, 1H), 3.53 – 3.38 (m,
2H), 2.25 (dd, J = 12.9, 4.9 Hz, 1H), 1.97 (s, 3H), 1.81 (dd, J = 12.9, 11.6 Hz, 1H). 13C NMR (126
MHz, Deuterium Oxide) δ 174.62, 173.91, 170.48, 156.96, 156.19, 135.42, 130.34, 130.08, 124.11,
122.07, 119.00, 117.11, 95.40, 70.10, 69.42, 68.73, 66.69, 53.73, 52.01, 43.19, 38.84, 21.93. ESI-
MS: [M-H]- C24H27N2O10 Calculated: 503.1671 Found: 503.1671. The NMR data matched
previously reported data.23
4.4.6 Synthesis of MPB-Sia-Lac-N3 3
Lac-N3 1138 (1.06 mg, 2.5 μmol), MPB-Sia 1 (5.0 mg, 10 μmol), CTP (7.25 mg, 15 μmol),
MgCl2 (3.5 mg, 37.5 μmol), Tris buffer (pH = 8.8, 150 μl of 1.5 M stock solution), E. coli
Recombinant CMP-Sialic acid synthetase from Neisseria meningitides (NmCss, 0.2 U) and
Photobacterium damselae α2−6-sialyltransferase (Pd2,6ST, 0.08 U) were mixed in a vial and Milli
Q water was added to a total volume of 750 μl. The reaction mixture was kept under 37 ‑ for 1 h.
Then ice-cold ethanol (750 μl) was added to the reaction mixture, followed by centrifuge at 5000
rpm for 5 min to remove enzyme precipitates. The supernatant was collected and passed through
Bio-gel P2 column to obtain the product MPB-Sia-Lac-N3 3 in 90% yield. 1H NMR (500 MHz,
Deuterium Oxide) δ 7.47 – 7.33 (m, 2H), 7.32 – 7.22 (m, 3H), 7.15 – 7.05 (m, 2H), 7.00 – 6.88
(m, 2H), 4.25 (dd, J = 12.9, 7.9 Hz, 2H), 3.88 (ddd, J = 8.9, 7.3, 3.3 Hz, 1H), 3.84 – 3.75 (m, 4H),
3.72 – 3.67 (m, 1H), 3.66 – 3.55 (m, 5H), 3.52 – 3.33 (m, 9H), 3.29 (t, J = 6.7 Hz, 2H), 3.16 – 3.11
(m, 1H), 2.54 (dd, J = 12.4, 4.7 Hz, 1H), 1.82 (s, 3H), 1.79 – 1.70 (m, 2H), 1.57 (t, J = 12.2 Hz,

221
1H). 13C NMR (126 MHz, Deuterium Oxide) δ 174.74, 173.36, 170.26, 156.99, 156.24, 135.56,
130.36, 130.12, 124.13, 122.17, 122.04, 119.05, 117.26, 103.09, 101.88, 100.25, 79.54, 74.53,
73.60, 72.59, 72.31, 72.26, 70.66, 70.08, 69.96, 68.43, 68.21, 67.18, 63.58, 60.19, 51.67, 47.76,
42.79, 39.99, 29.48, 28.14, 21.92. ESI-MS: [M-H]- C39H52N5O20 calculated: 910.3211, observed:
910.3220.
4.4.7 Synthesis of Chol-Br 13
Cholesterol (1 g, 2.6 mmol), DMAP (0.93 g, 7.6 mmol) and trimethylamine (0.73 ml, 0.53 g,
5.3 mmol) were dissolved in DCM (20 ml) and cooled on ice for 15 min. α-Bromoisobutyryl
bromide (1.6 ml, 2.98 g, 12.9 mmol) in DCM (5 ml) was then added dropwise. Subsequently, the
reaction was stirred on ice for 1 h under room temperature for another 12 h. The reaction mixture
was diluted with DCM (50 ml) and washed 3 times with saturated NaCl aqueous solution. The
organic phase was collected and dried with Na2SO4, then concentrated by rotavapor to ~ 3 ml.
Ethanol (50 ml) was used to precipitate out the desired product Chol-Br 13. The product was
collected by filtration and dried under N2 overnight (1.02 g, yield = 74 %).1H NMR (500 MHz,
Chloroform-d) δ 5.45 – 5.32 (m, 1H), 4.73 – 4.60 (m, 1H), 2.44 – 2.32 (m, 2H), 2.05 – 1.80 (m,
11H), 1.73 – 1.28 (m, 12H), 1.22 – 0.94 (m, 12H), 0.93 – 0.84 (m, 9H), 0.69 (s, 3H). 13C NMR
(126 MHz, Chloroform-d) δ 171.04, 139.34, 122.91, 75.59, 56.66, 56.32, 56.11, 49.97, 42.30,
39.70, 39.51, 37.55, 36.86, 36.59, 36.17, 35.79, 31.91, 31.83, 30.70, 28.23, 28.01, 27.27, 24.28,
23.82, 22.83, 22.57, 21.03, 19.35, 18.71, 11.85.

222
4.4.8 Synthesis of Chol-PAA 15
Chol-Br 13 (5 mg, 9.4 μmol) and tbutyl acrylate (0.75 g, 5.86 mmol) were dissolved in THF
(5 ml). PMDETA (2 μl, 1.6 μg, 9.4 μmol) was added, followed by three freeze-pump-thaw cycles
to remove oxygen. CuBr (1.4 mg, 9.4 μmol) was then added under N2 protection. The reaction was
kept under 60 ‑ for 3 h. After polymerization, 50 μl of the reaction mixture was taken for NMR
analysis (Monomer conversion= 95% based on NMR analysis). The remaining solvent was
concentrated to ~2 ml by rotavapor after the reaction and H2O: MeOH = 1: 1 (20 ml) was added.
The precipitate was collected and re-dissolved in THF (2 ml). The precipitation process was
repeated 3 times to yield crude Chol-PtBA 14 (0.58 g).
Chol-PtBA 14 (0.58 g) was dissolved in TFA: DCM = 1: 1 (2 ml) and stirred under room
temperature for 1 h. The solvent was then removed by rotavapor and the residue was re-dissolved
in water and dialyzed against pure water (MWCO = 3500 Da) for 24 h followed by lyophilization
to yield Chol-PAA 15 (0.29 g, yield = 68% (two steps)). 1H NMR (500 MHz, Deuterium Oxide)
δ 4.98 – 4.96 (m, 1H), 2.42 – 2.11 (m, 500H), 1.88 – 1.37 (m, 1000H), 0.95 – 0.94 (m, 3H), 0.73
– 0.69 (m, 3H).
4.4.9 Synthesis of Chol-PAA-yne 16
Chol-PAA 15 (0.1 g, ~2.8 μmol) was dissolved in water (5 ml) followed by the addition of
EDC•HCl (100 mg, 0.52 mmol) and propargyl amine (18 mg, 0.33 mmol). The reaction was stirred
under room temperature for 24 h. The reaction mixture was then collected and dialyzed against

223
0.1x PBS buffer for 48 h then in pure water for another 24 h (MWCO = 3500). The solution in
dialysis tubing was collected and lyophilized to yield Chol-PAA-yne 16 (87 mg, yield= 74%). 1H
NMR (500 MHz, Deuterium Oxide) δ 4.03 – 3.82 (m, 200H), 2.71 – 2.49 (m, 100H), 2.35 – 1.15
(m, 1500H), 0.67 (s, 3H).
4.4.10 Synthesis of Chol-P-CD22L100 4
MPB-Sia-Lac-N3 3 (6 mg, 6.5 μmol), CuSO4 (0.5 mg, 3.25 μmol), THPTA 12 (5 mg, 13
μmol), sodium ascorbate (11 mg, 52 μmol), amino guanidine (6 mg, 52 μmol), Chol-PAA-yne 16
(2 mg, containing 6.5 μmol alkyne) were dissolved in water (1 ml) in a sealed vial and stirred under
room temperature for 24 h. The reaction mixture was passed through G25 column to yield purified
4. 1H NMR (500 MHz, Deuterium Oxide) δ 7.31 (s, 900H), 4.41 – 4.09 (m, 100H), 4.09 – 3.20 (m,
2300H), 3.11 – 2.87 (m, 100H), 2.80 – 0.63 (m, 2000H).
4.4.11 General procedure of metabolic glyco-engineering of NK-92 cells
NK-92 cells (5×10⁵ cells/mL) were incubated with culture medium supplemented with MPB-
sia 1, BPC-sia 2 or free sialic acid at different final concentrations for various time periods. In this
study, “MsNK-92” refers the NK-92 cells incubated with 2 mM MPB-sia 1 for 48 h if not specified.
After incubation, the cells were washed three times with PBS buffer. These cells were collected
and used in this study. The binding ability of these engineered NK-92 cells toward human CD22
protein was studied by FACS and confocal imaging. 5×10⁵ of cells were suspended in 0.1 ml PBS
buffer and incubated with 0.5 μg human CD22-Fc on ice for 30 min. The cells were washed twice
224
with PBS buffer after incubation followed by PE mouse anti-human CD22 mAb (clone HIB22)
staining on ice in dark for another 30 min. The cells were washed twice with PBS buffer and
analyzed by FACS directly. For confocal imaging study, the cells were fixed by 4%
paraformaldehyde after mAb staining and washing, then stained by DAPI before imaging.
4.4.12 Mass spectrum analysis of surface sialic acid and derivatives on NK92 cells after
metabolic glycoengineering
NK92 cells (1 x 10⁷ cells) were incubated with medium only (10 mL), or medium (10 mL)
containing 2 mM sialic acid, 2 mM MPB-sia 1, 2 mM BPC-sia 2 respectively for 24 h followed
by thorough washing with PBS buffer for 3 times to remove all free ligands. 1x10⁷ of NK92 cells
from each group were collected and resuspended in 200 μl PBS buffer.
1 μl enzyme stock solution containing 50 units of α-2-3,6,8 neuraminidase (New England
Biolabs) was added to each group and the resulting cell-enzyme mixtures were kept under 37‑ on
a shaker for 1 h. After the incubation, the enzyme was deactivated by heating to 65 ‑ for 15 min.
The samples were centrifuged at 5,000 rpm for 5 min and the supernatants were collected and
lyophilized. On the same day of mass spectrum analysis, the lyophilized samples were dissolved
in 50 μl DI water followed by addition of 50 μl of DMB reagent stock (3.5 mg DMB hydrochloride,
172 μl acetic acid, 112 μl 2-mercaptoethanol and 4.9 mg sodium hydrosulfite dissolved in 1.5 ml
DI water, prepared right before use). For standard curve measurement, 50 μl of sialic acid, MPB-
sia 1 and BPC-sia 2 (1 mg/ml in DI water) were mixed with 50 μl of the DMB reagent stock. All
reaction mixtures were kept in dark in 60 ‑ water bath for 2 h. The samples were then cooled on

225
ice and diluted with acetonitrile : water (1:1) for mass spectrum analysis. For standard curves and
sialic acid quantification results, see Table 4.1.
4.4.13 Insertion of Chol-P-CD22L100 4 onto NK-92 cells
NK-92 cells (1×10⁷ cells/ml) were incubated with Chol-P-CD22L100 4 in PBS buffer at various
final concentrations (2.5 μM, 5 μM or 10 μM) for 1 h under room temperature. After incubation,
the cells were washed three times with PBS buffer. These cells were collected and used for further
study.
4.4.14 Dose and time dependent metabolic incorporation of MPB-Sia 1 on NK-92 cells
To study the dose dependence of MPB-Sia 1 metabolic incorporation, NK-92 cells (5×10⁵ per
sample) were incubated with NK-92 medium (1 ml) supplemented with different concentrations
of MPB-sia 1 for 48 h. After incubation, the cells were collected and washed three times with PBS
buffer. The cells were then incubated with human CD22-Fc followed by PE-mouse anti-human
CD22 mAb staining and FACS analysis as described above. The data represent the mean of
triplicate samples.
To study the metabolic incorporation of MPB-Sia 1 during different time periods, NK-92 cells
(5×10⁵ per sample) were incubated with NK-92 medium (1 ml) supplemented with 2 mM MPB-
sia 1 for 24 h, 48 h or 72 h. After incubation, the cells were collected and washed three times with
PBS buffer. The cells were then incubated with human CD22-Fc followed by PE-mouse anti-
226
human CD22 mAb staining and FACS analysis as described above. The data represent the mean
of triplicate samples.
4.4.15 The level of α2-6-sia linkage on NK-92 cell surface before and after metabolic
engineering
NK-92 cells (5×10⁵ per sample) were suspended in 100 μl Hanks buffer containing 4% BSA
and 0.1% NaN3. 1 μg FITC-labeled α2,6-SA binding plant lectin Sambucus Nigra Lectin (SNA)
was added to each sample. After incubation on ice in dark for 30 min, the cells were collected and
washed 3 times with Hanks buffer. Unmodified NK-92 cells were stained by the same procedure.
An unstained NK-92 sample was included as the negative control for analysis. The samples were
analyzed by FACS. The data represent the mean of triplicate samples.
4.4.16 The influence of MPB-sia 1 on NK-92 cell viability
NK-92 cells (5×10⁵ per sample) were incubated with different concentrations of MPB-Sia 1
for 48 h, or with 2 mM MPB-Sia 1 for different time periods (24 h, 48 h or 72 h). After incubation,
the cells were collected and washed twice with PBS buffer. The cells were resuspended in 1 ml of
PBS buffer containing 1μM Calcein AM and were incubated under 37‑ for 15 min. The samples
were analyzed by FACS and the cell viability was calculated based on fluorescent cell counts per
100 μl sample.
4.4.17 Time dependent decrease of CD22 binding after metabolic glyco-engineering
Metabolic engineered or polymer engineered NK-92 cells (5×10⁵ cells per sample) were
collected and washed 3 times with PBS buffer to remove free MPB-Sia 1 or Chol-P-CD22L100 4.

227
The CD22 binding at 0 h was obtained by incubating 5 x 10⁵ cells with human CD22-Fc followed
by PE-mouse anti-human CD22 mAb staining and FACS analysis immediately after the removal
of MPB-Sia 1 or Chol-P-CD22L100 4. Other cells were re-suspended in fresh culture medium
without MPB-Sia 1 or Chol-P-CD22L100 4 and incubated at 37 ºC for another 12 h, 24 h or 48 h.
At each time point, 5×10⁵ cells were collected, stained and analyzed by FACS. An unmodified
NK-92 sample was incubated with CD22 protein and stained with PE-mouse anti-human CD22
mAb as the negative control. The mean fluorescence intensities of PE were normalized to 0 h
(100%).
4.4.18 Measurement of surface CD22 expression level on different cell lines
Raji or Hela cells (1×10⁶ cells per sample) were collected and washed with PBS for three
times. The cells were re-suspended in 100 μl PBS buffer and stained with PE mouse anti-human
CD22 on ice in dark for 30 min, followed by FACS analysis. An unstained cell sample was
included as the negative control.
4.4.19 Imaging analysis of NK-92 cell and Raji cell binding
Raji cells (1×10⁶/ml) were incubated with 1μM Calcein AM for 15 min at 37‑ and then
washed three times with 1640 medium containing FBS, followed by incubation with NK-92 cells
or MsNK-92 cells at a 1: 1 ratio. Two hours later, the cells mixture was imaged by fluorescent
microscope. The percentages of cell complexes were calculated as the proportion of the Raji cells
228
attached to the NK-92 cells over the total number of Raji cells. The data represent the mean of
triplicate samples.
4.4.20 In vitro NK cytotoxicity assay against Raji cells
Raji cells stably transfected with firefly luciferase (Raji-luc, 1×10⁴ per well) were co-
incubated with unmodified NK-92 or MsNK-92 at different effector to target cell ratios (E/T = 0.5,
1, 5) at 37 ºC in 200 μL of mixture medium (RPMI-1640 : NK-92 medium = 1: 1). After 5 h
incubation, the cells were centrifuged, and the supernatant was discarded. The cells were lysed,
and bioluminescence was detected by firefly luciferase reporter gene assay kit according to
manufacturer’s instruction. The luminescence intensity of Raji-luc cells was recorded. The cell
lysis of each sample was normalized to the luminescence intensity of Raji-luc only (100 %) and
buffer only (0 %) samples. The data represent the mean of triplicate samples. To study the
influence of CD22 binding on specific killing against Raji, a competition experiment was
performed. NK-92 or MsNK-92 (1×10⁴ per well) were first incubated with various amounts of
human CD22-Fc (0 μg/mL, 1 μg/mL, 5 μg/mL) on ice for 30 min. Then Raji-luc cells (1×10⁴ per
well) were added to NK-92 or MsNK-92 to reach E/T = 1: 1. After 5 h incubation under 37 ºC, the
cells were centrifuged, and the supernatant was discarded. The cells were lysed, and
bioluminescence was detected by firefly luciferase reporter gene assay kit according to
manufacturer’s instruction. The luminescence intensity of Raji-luc cells was recorded. The cell

229
lysis of each sample was normalized to the luminescence intensity of Raji-luc only (100 %) and
buffer only (0 %) samples. The data represent the mean of triplicate samples.
4.4.21 CD22 specific in vitro killing assay on CHO-WT and CHO-hCD22 cells
CHO WT cells and CHO hCD22 cells were incubated with 0.5 μM and 5 μM CFSE
respectively in 1 mL of PBS buffer containing 0.1% BSA under 37 ºC for 10 min. After incubation,
10 mL of complete culture medium were added to each tube respectively and the cells were
incubated under room temperature for another 10 min. The cells were collected respectively and
washed once with complete culture medium. The cell densities of both CFSElo-CHO WT cells and
CFSEhi-CHO hCD22 cells were adjusted to 1×10⁵/mL. The two type of cells were mixed at a 1:1
ratio, and co-incubated with NK-92 or MsNK-92 cells at different effector to target ratios (E/T =
5: 1, 10: 1, 25: 1, and 50: 1) under 37 ºC for 5 h. The cell mixtures were analyzed by FACS after
co-incubation. The percentages of lysis of CHO-hCD22 cells were calculated based on the
CFSEhi/CFSElo cell ratio changes before and after incubating with NK-92 or MsNK-92.
4.4.22 In vitro NK cytotoxicity assay against patient-derived leukemic samples
Patient-derived leukemic samples were from to be discarded samples following routine
diagnostic procedures. The white blood cells were enriched by density gradient centrifugation and
then treated with red blood cell lysis buffer. The purified cells were treated with 5 μL PE mouse
anti-human CD22 in 0.1 mL volume on ice for 30 min to identify the CD22 expression levels. For
the cell-mediated cytotoxicity assay, the purified cells were labeled with 1 μM Calcein AM and

230
incubated with NK-92 cells or MsNK-92 cells for 5h at E/T=5:1 under 37 ºC. The samples were
analyzed by FACS and the cell viability was calculated based on fluorescent cell counts per 100
μL sample.
4.4.23 Perforin imaging
Cell-cell complex formation and redistribution of cytotoxic granules containing perforin were
analyzed by confocal microscopy. NK (5×10⁵) cells and Raji cells (5 × 10⁵) were co-incubated at
a 1: 1 ratio for 1 h at 37 ºC, then fixed for 10 min with 4% polyformaldehyde solution.
Immunostaining permeabilization buffer with Triton X-100 was added for cell permeabilization.
Cells were washed and blocked for 30 min with 10% FBS in PBS to avoid unspecific binding. The
cells were incubated for 75 min at room temperature with perforin-specific antibody δG9, followed
by Alexa Fluor 594-coupled anti-mouse antibody. Cell nuclei were counterstained with DAPI.
Cells were wash twice with PBS, then dropped onto the slide to make microscopic slides and
analyzed with Olympus FV1000MPE-B.
4.4.24 IFN-γ release assay
IFN-γ release by NK-92 cells was determined by using BD Cytometric Bead Array Flex Set
for Human IFN-γ according to the manufacturer`s protocol. Briefly, 2×10⁴ Raji cells were
incubated with equal numbers of NK-92 cells in the wells of 96-well V-bottom plates for 5 h at
37 ºC. IFN-γ concentrations in supernatants were measured using BD Cytometric Bead Array
Flex Set for Human IFN-γ.

231
4.4.25 Tumor challenge
For intratumoral administration of NK cells
BALB/c nude mice (female, 6-8 weeks) were purchased from model animal research center
of Nanjing University (Nanjing, China). Prior to tumor implantation, mice received
cyclophosphamide (2 mg in 0.1 mL PBS) intraperitoneally for three days. 1×10⁷ Raji-luc cells in
0.2 mL were injected subcutaneously in the right flank of the mice on day 0. Mice were treated on
day 15, 22 and 29 with intratumoral injections of 1×10⁷ NK-92 cells or MsNK-92 cells (n =3 per
group) in 50 μL PBS. The tumor size was measured before intratumoral injections with Vernier
caliper and the tumor volumes were calculated by the formula length×width×width×0.5. Animals
were sacrificed at day 36 and xenografts were surgically excised and weighed. For in vivo imaging,
the mice were injected with 100 μL D-luciferin (30 mg/mL) intraperitoneally and the
bioluminescence signal in mice was measured using IVIS® Lumina II system. For ex vivo imaging,
the excised tumor was immersed in 10 mL D-luciferin (3 mg/mL) for about 5 min, then the
bioluminescence signal was measured using IVIS® Lumina II system. These experiments were
repeated with n=5 mice per group. The results from the repeat experiments were similar to those
in Figure 4.17.
For intravenous administration of NK cells
NOD SCID mice (female, 6-10 weeks) were purchased from model animal research center of
Nanjing University (Nanjing, China). 1×10⁶ Raji-luc cells were injected intravenously on day 0.

232
At days 2, 5, 8, 12, 15, animals were administrated with 1×10⁷ NK-92 cells or MsNK-92 cells via
the tail vein (each group n = 10). The control group received PBS only. The body weight and
survival of the mice were continuously monitored. Mice that developed hind-limb paralysis in the
course of the experiments were euthanized. Kaplain-Meier curves were constructed.

233
APPENDICES

234
APPENDIX A: Cell surface CD22 expression
Figure 4.20 Surface expression levels of CD22 on a. Raji-luc vs b. Hela cells as detected by
flow cytometry. Raji-luc cells have much higher expression of CD22 compared to Hela cells.

235
APPENDIX B: Attempts for synthesizing polymers with multiple cholesterol copies
Scheme 4.1 Synthesis of polymers with multiple cholesterol copies. a. Polymerizing cholesterol
monomers via ATRP. b. Polymerizing cholesterol monomers via RAFT. c. Polymerization of
block polymer with different functional groups, followed by post-polymerization modification of
cholesterol and MPB-Sia-Lac-N3 3.

236
APPENDIX C: NMR Spectra
Figure 4.21 1H NMR of 5 (500MHz, D2O)
55 55

237
Figure 4.22 13C NMR of 5 (500MHz, D2O)
55 55

238
Figure 4.23 1H NMR of 6 (500MHz, CDCl3)
66 66

239
Figure 4.24 1H NMR of 7 (500MHz, D2O)
77 77

240
Figure 4.25 13C NMR of 7 (500MHz, D2O)
77 77
241
Figure 4.26 1H NMR of 8 (unpurified, 500MHz, D2O)
MeO
H
AcOH
88 88

242
Figure 4.27 1H NMR of 9 (unpurified, 500MHz, D2O)
99 99
243
Figure 4.28 1H NMR of 1 (500MHz, D2O)
11 11
244
Figure 4.29 13C NMR of 1 (500MHz, D2O)
11 11

245
Figure 4.30 1H NMR of 3 (500MHz, D2O)
33 33
246
Figure 4.31 1H NMR of 14 (500MHz, CDCl3)
1414 1414
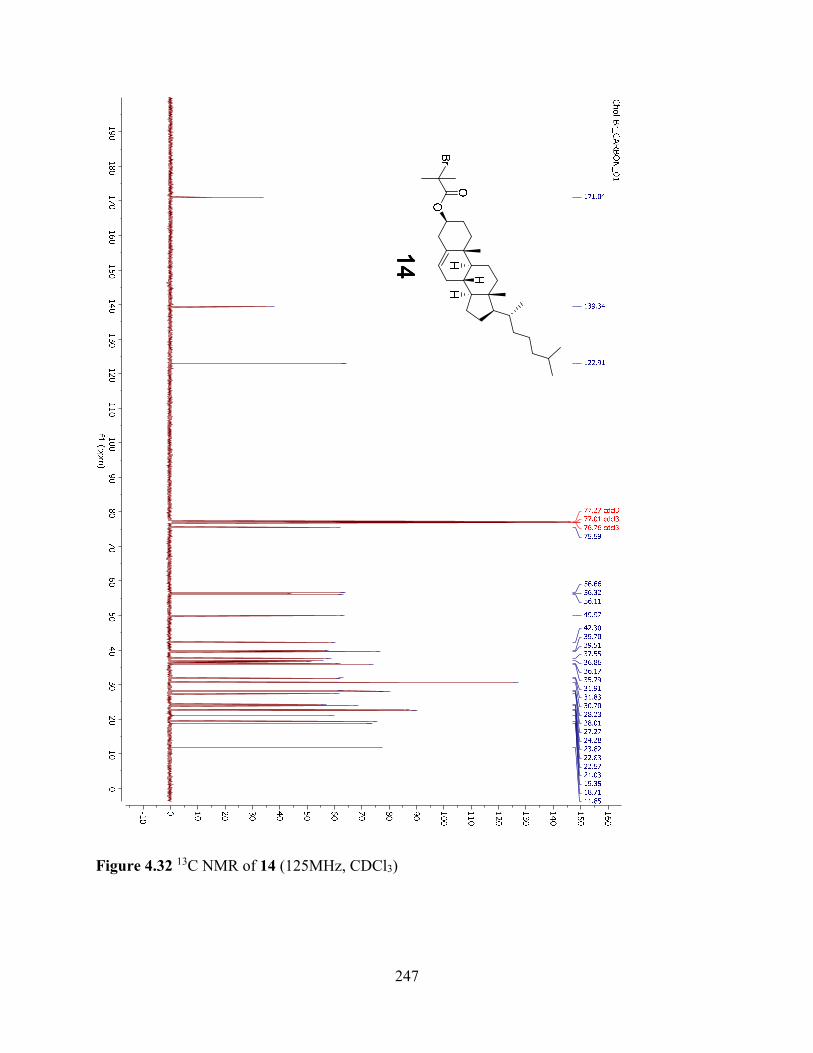
247
Figure 4.32 13C NMR of 14 (125MHz, CDCl3)
1414 1414

248
Figure 4.33 1H NMR of 15 (500MHz, D2O)
Unpurified,
for monom
er conversion calculation.
Monom
er region
Polymer region
1515 1515
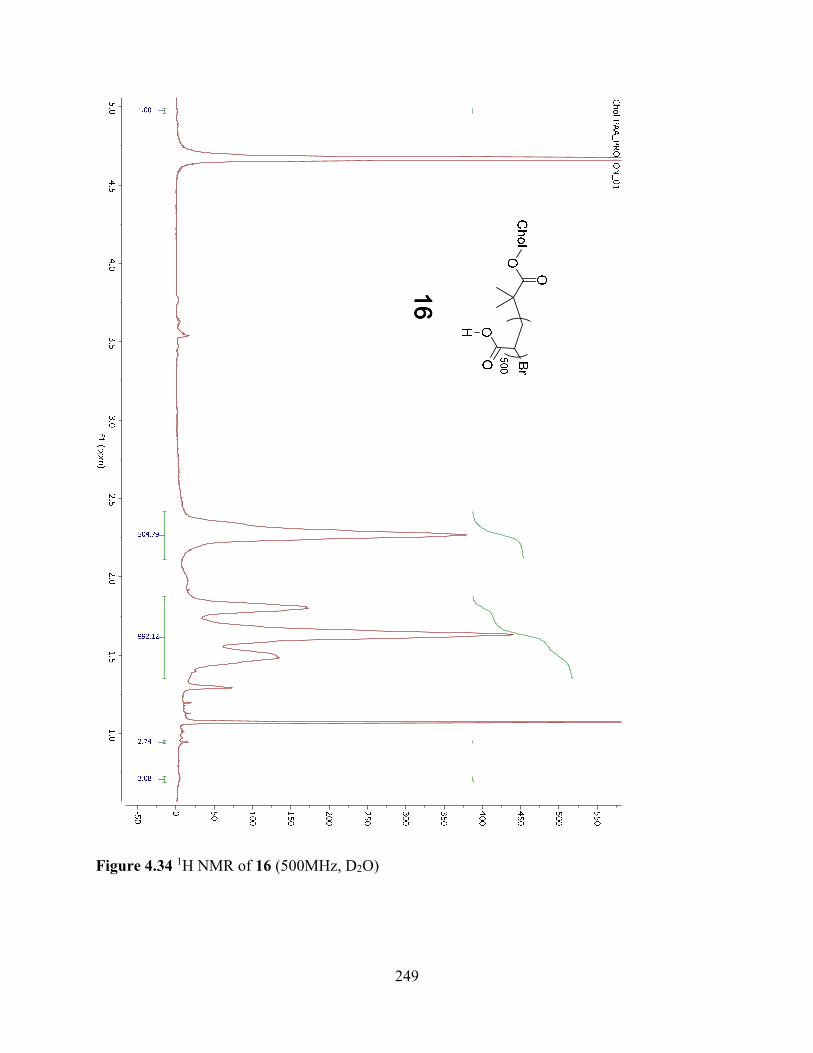
249
Figure 4.34 1H NMR of 16 (500MHz, D2O)
1616 1616
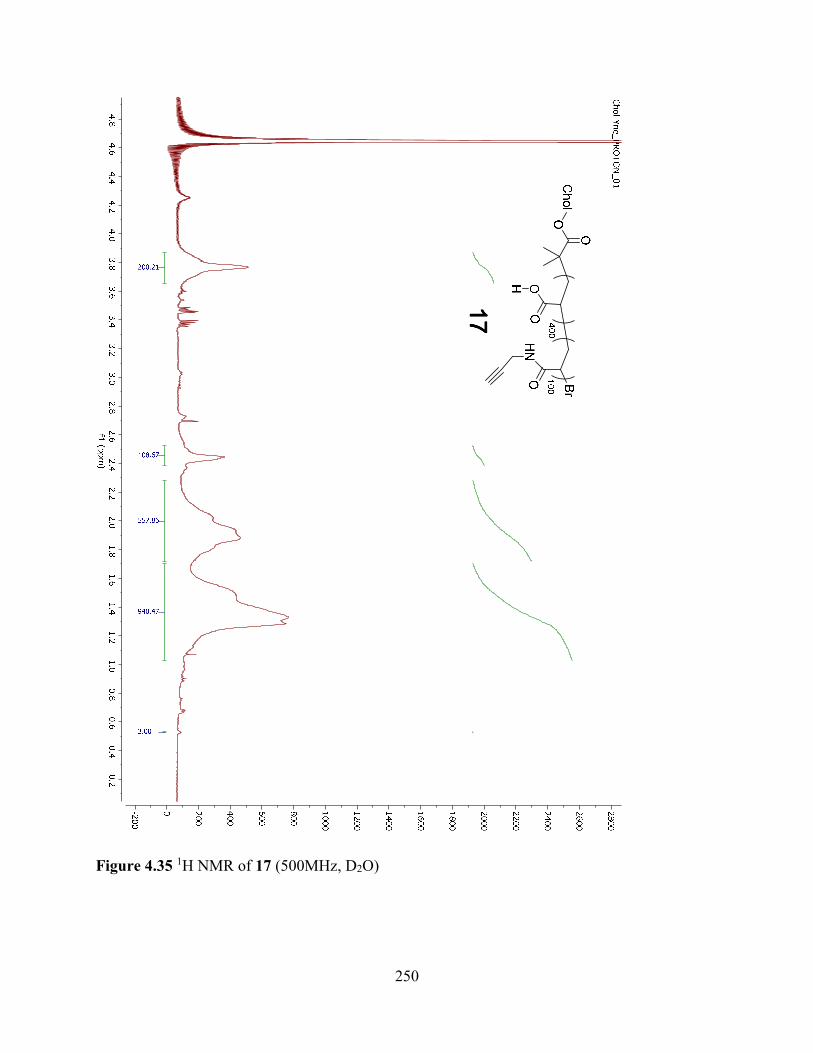
250
Figure 4.35 1H NMR of 17 (500MHz, D2O)
1717 1717
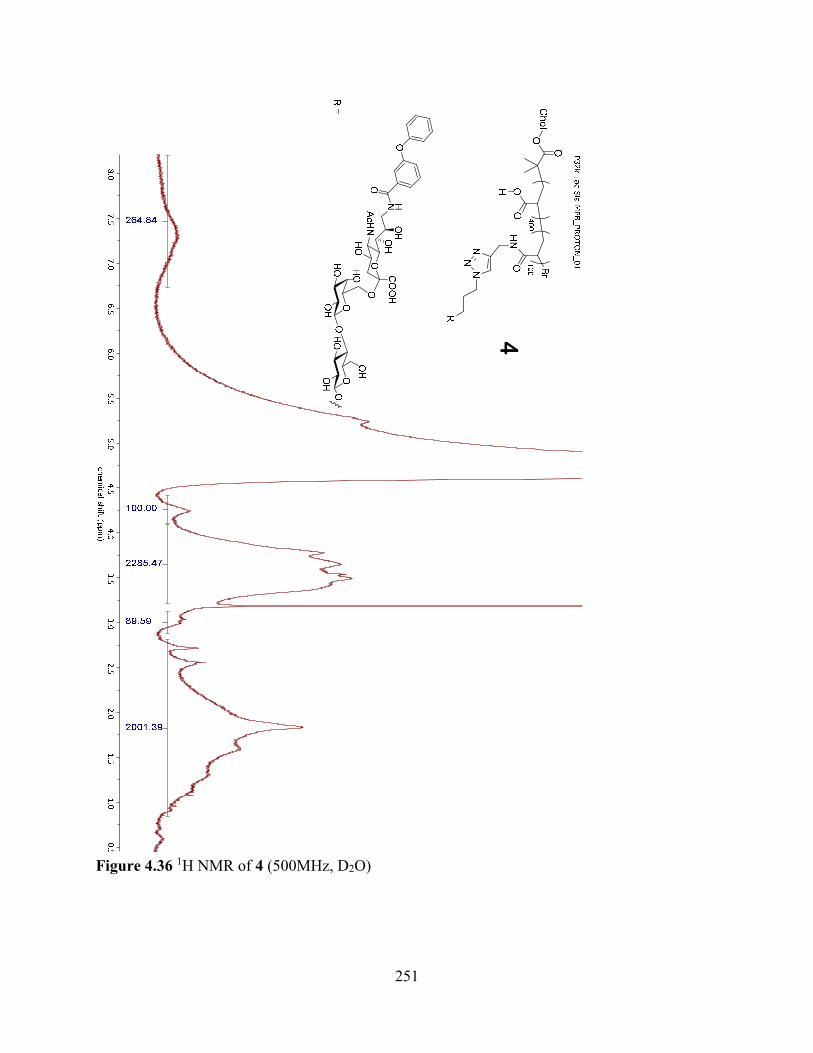
251
Figure 4.36 1H NMR of 4 (500MHz, D2O)
44 44

252
REFERENCES

253
REFERENCES
1. Wang, X.; Lang, S.; Tian, Y.; Zhang, J.; Yan, X.; Fang, Z.; Weng, J.; Lu, N.; Wu, X.; Li, T.;
Cao, H.; Li, Z.; Huang, X., Glycoengineering of Natural Killer Cells with CD22 Ligands for
Enhanced Anticancer Immunotherapy. ACS Cent. Sci. 2020, 6, 382-389.
2. Fesnak, A. D.; June, C. H.; Levine, B. L., Engineered T cells: The Promise and Challenges of
Cancer Immunotherapy. Nat. Rev. Cancer 2016, 16, 566-581.
3. June, C. H.; O’Connor, R. S.; Kawalekar, O. U.; Ghassemi, S.; Milone, M. C., CAR T Cell
Immunotherapy for Human Cancer. Science 2018, 359, 1361-1365.
4. Mehta, R. S.; Rezvani, K., Chimeric Antigen Receptor Expressing Natural Killer Cells for the
Immunotherapy of Cancer. Front. Immunol. 2018, 9, 283.
5. Zeiser, R.; Blazar, B. R., Acute Graft-versus-Host Disease — Biologic Process, Prevention,
and Therapy. N. Engl. J. Med. 2017, 377, 2167-2179.
6. Hay, A. E.; Cheung, M. C., CAR T-cells: Costs, Comparisons, and Commentary. J. Med. Econ.
2019, 22, 613-615.
7. Olson, J. A.; Leveson-Gower, D. B.; Gill, S.; Baker, J.; Beilhack, A.; Negrin, R. S., NK Cells
Mediate Reduction of GVHD by Inhibiting Activated, Alloreactive T Cells While Retaining GVT
Effects. Blood 2010, 115, 4293-4301.
8. Miller, J. S.; Soignier, Y.; Panoskaltsis-Mortari, A.; McNearney, S. A.; Yun, G. H.; Fautsch,
S. K.; McKenna, D.; Le, C.; Defor, T. E.; Burns, L. J.; Orchard, P. J.; Blazar, B. R.; Wagner, J. E.;
Slungaard, A.; Weisdorf, D. J.; Okazaki, I. J.; McGlave, P. B., Successful Adoptive Transfer and
in vivo Expansion of Human Haploidentical NK Cells in Patients with Cancer. Blood 2005, 105,
3051-3057.
9. Curti, A.; Ruggeri, L.; Addio, A.; Bontadini, A.; Dan, E.; Motta, M. R.; Trabanelli, S.; Giudice,
V.; Urbani, E.; Martinelli, G.; Paolini, S.; Fruet, F.; Isidori, A.; Parisi, S.; Bandini, G.; Baccarani,
M.; Velardi, A.; Lemoli, R. M., Successful Transfer of Alloreactive Haploidentical KIR Ligand-
Mismatched Natural Killer Cells After Infusion in Elderly High Risk Acute Myeloid Leukemia
Patients. Blood 2011, 118, 3273-3279.

254
10. Tang, X.; Yang, L.; Li, Z.; Nalin, A. P.; Dai, H.; Xu, T.; Yin, J.; You, F.; Zhu, M.; Shen, W.;
Chen, G.; Zhu, X.; Wu, D.; Yu, J., First-in-man Clinical Trial of CAR NK-92 Cells: Safety Test
of CD33-CAR NK-92 Cells in Patients with Relapsed and Refractory Acute Myeloid Leukemia.
Am. J. Cancer. Res. 2018, 8, 1083-1089.
11. Matosevic, S., Viral and Nonviral Engineering of Natural Killer Cells as Emerging Adoptive
Cancer Immunotherapies. J Immunol Res 2018, 2018, 4054815.
12. Dotan, E.; Aggarwal, C.; Smith, M. R., Impact of Rituximab (Rituxan) on the Treatment of
B-Cell Non-Hodgkin's Lymphoma. Pharm. Ther. 2010, 35, 148-157.
13. Bello, C.; Sotomayor, E. M., Monoclonal Antibodies for B-Cell Lymphomas: Rituximab and
Beyond. Hematology Am Soc Hematol Educ Program 2007, 1, 233-242.
14. Castillo, J.; Winer, E.; Quesenberry, P., Newer Monoclonal Antibodies for hematological
Malignancies. Exp. Hematol. 2008, 36, 755-768.
15. Molina, A., A Decade of Rituximab: Improving Survival Outcomes in Non-Hodgkin's
Lymphoma. Annu. Rev. Med. 2008, 59, 237-250.
16. Evans, L. S.; Hancock, B. W., Non-Hodgkin Lymphoma. Lancet 2003, 362, 139-146.
17. Ereño-Orbea, J.; Sicard, T.; Cui, H.; Mazhab-Jafari, M. T.; Benlekbir, S.; Guarné, A.;
Rubinstein, J. L.; Julien, J.-P., Molecular Basis of Human CD22 Function and Therapeutic
Targeting. Nat. Commun. 2017, 8, 764.
18. Chen, W. C.; Completo, G. C.; Sigal, D. S.; Crocker, P. R.; Saven, A.; Paulson, J. C., In vivo
Targeting of B-cell Lymphoma with Glycan Ligands of CD22. Blood 2010, 115, 4778-4786.
19. Haso, W.; Lee, D. W.; Shah, N. N.; Stetler-Stevenson, M.; Yuan, C. M.; Pastan, I. H.;
Dimitrov, D. S.; Morgan, R. A.; FitzGerald, D. J.; Barrett, D. M., Anti-CD22–chimeric Antigen
Receptors Targeting B-cell Precursor Acute Lymphoblastic Leukemia. Blood 2013, 121, 1165-
1174.
20. Fry, T. J.; Shah, N. N.; Orentas, R. J.; Stetler-Stevenson, M.; Yuan, C. M.; Ramakrishna, S.;
Wolters, P.; Martin, S.; Delbrook, C.; Yates, B., CD22-targeted CAR T Cells Induce Remission in
B-ALL that is Naive or Resistant to CD19-targeted CAR Immunotherapy. Nat. Med. 2018, 24, 20-
28.

255
21. Powell, L. D.; Sgroi, D.; Sjoberg, E. R.; Stamenkovic, I.; Varki, A., Natural Ligands of the B
Cell Adhesion Molecule CD22 Beta Carry N-linked Oligosaccharides with Alpha-2,6-linked Sialic
Acids that are Required for Recognition. J. Biol. Chem. 1993, 268, 7019-7027.
22. Rillahan, C. D.; Macauley, M. S.; Schwartz, E.; He, Y.; McBride, R.; Arlian, B. M.;
Rangarajan, J.; Fokin, V. V.; Paulson, J. C., Disubstituted Sialic Acid Ligands Targeting Siglecs
CD33 and CD22 Associated with Myeloid Leukaemias and B Cell Lymphomas. Chem. Sci. 2014,
5, 2398-2406.
23. Peng, W.; Paulson, J. C., CD22 Ligands on a Natural N-Glycan Scaffold Efficiently Deliver
Toxins to B-Lymphoma Cells. J. Am. Chem. Soc. 2017, 139, 12450-12458.
24. Kelm, S.; Gerlach, J.; Brossmer, R.; Danzer, C.-P.; Nitschke, L., The Ligand-binding Domain
of CD22 is Needed for Inhibition of the B Cell Receptor Signal, as Demonstrated by a Novel
Human CD22-Specific Inhibitor Compound. J. Exp. Med. 2002, 195, 1207-1213.
25. Zhang, C.; Oberoi, P.; Oelsner, S.; Waldmann, A.; Lindner, A.; Tonn, T., Chimeric Antigen
Receptor-engineered NK-92 Cells: An Off-the-shelf Cellular Therapeutic for Targeted
Elimination of Cancer Cells and Induction of Protective Antitumor Immunity. Front. Immunol.
2017, 8, 533.
26. Klingemann, H.; Boissel, L.; Toneguzzo, F., Natural Killer Cells for Immunotherapy-
Advantages of the NK-92 Cell Line over Blood NK Cells. Front. Immunol. 2016, 7, 91.
27. Suck, G.; Odendahl, M.; Nowakowska, P.; Seidl, C.; Wels, W. S.; Klingemann, H. G.; Tonn,
T., NK-92: An ‘Off-the-shelf Therapeutic’for Adoptive Natural Killer Cell-based Cancer
Immunotherapy. Cancer Immunol. Immunother. 2016, 65, 485-492.
28. Arai, S.; Meagher, R.; Swearingen, M.; Myint, H.; Rich, E.; Martinson, J.; Klingemann, H.,
Infusion of the Allogeneic Cell line NK-92 in Patients with Advanced Renal Cell Cancer or
Melanoma: a Phase I Trial. Cytotherapy 2008, 10, 625-632.
29. Tonn, T.; Schwabe, D.; Klingemann, H. G.; Becker, S.; Esser, R.; Koehl, U.; Suttorp, M.;
Seifried, E.; Ottmann, O. G.; Bug, G., Treatment of Patients with Advanced Cancer with the
Natural Killer Cell Line NK-92. Cytotherapy 2013, 15, 1563-1570.
30. Du, J.; Meledeo, M. A.; Wang, Z.; Khanna, H. S.; Paruchuri, V. D. P.; Yarema, K. J.,
Metabolic Glycoengineering: Sialic Acid and Beyond. Glycobiology 2009, 19, 1382-1401.

256
31. Feng, L.; Hong, S.; Rong, J.; You, Q.; Dai, P.; Huang, R.; Tan, Y.; Hong, W.; Xie, C.; Zhao,
J., Bifunctional Unatural Sialic Acids for Dual Metabolic Labeling of Cell-surface Sialylated
Glycans. J. Am. Chem. Soc. 2013, 135, 9244-9247.
32. Lewis, A. L.; Nizet, V.; Varki, A., Discovery and characterization of sialic acid O-acetylation
in group B Streptococcus. Proc. Natl. Acad. Sci. U. S. A. 2004, 101, 11123-11128.
33. Cavdarli, S.; Yamakawa, N.; Clarisse, C.; Aoki, K.; Brysbaert, G.; Le Doussal, J.-M.;
Delannoy, P.; Guérardel, Y.; Groux-Degroote, S., Profiling of O-acetylated Gangliosides
Expressed in Neuroectoderm Derived Cells. Int. J. Mol. Sci. 2020, 21, 370.
34. Durward, M.; Harms, J.; Splitter, G., Antigen Specific in vivo Killing Assay using CFSE
Labeled Target Cells. J. Vis. Exp. 2010, e2250.
35. Smith, L. K.; Boukhaled, G. M.; Condotta, S. A.; Mazouz, S.; Guthmiller, J. J.; Vijay, R.;
Butler, N. S.; Bruneau, J.; Shoukry, N. H.; Krawczyk, C. M., Interleukin-10 Directly Inhibits CD8+
T Cell Function by Enhancing N-glycan Branching to Decrease Antigen Sensitivity. Immunity
2018, 48, 299-312.
36. Buchini, S.; Buschiazzo, A.; Withers, S. G., A New Generation of Specific Trypanosoma
Cruzi trans-Sialidase Inhibitors. Angew. Chem., Int. Ed. 2008, 47, 2700-2703.
37. Han, S.; Collins, B. E.; Bengtson, P.; Paulson, J. C., Homomultimeric Complexes of CD22 in
B Cells Revealed by Protein-glycan Cross-linking. Nat. Chem. Biol. 2005, 1, 93-97.
38. Wang, Z.; Zhou, L.; El-Boubbou, K.; Ye, X.-s.; Huang, X., Multi-Component One-Pot
Synthesis of the Tumor-Associated Carbohydrate Antigen Globo-H Based on Preactivation of
Thioglycosyl Donors. J. Org. Chem. 2007, 72, 6409-6420.