Embed Size (px)
Citation preview

Polymerization in Confined Space
Roland E. Stefandl
Submitted in partial fulfillment of the requirements for the degree of Doctor of Philosophy
in the Graduate School of Arts and Sciences
COLUMBIA UNIVERSITY
2011

© 2011
Roland E. Stefandl All rights reserved

ABSTRACT
Polymerization in Confined Space
Roland E. Stefandl
Polymerization of acrylamide in confined space was studied. The system used for the
polymerization was a colloid of water/SDS/dodecane/pentanol. The colloidal was stable through the
polymerization process only at specific compositions. The system revealed a lamellar water structure
which housed the gamma initiated reaction prior and after polymerization the lamellar was birefringent.
The polymer was characterized for its size and distribution. SANS, which was employed to measure the
colloidal system for swelling of the lamellar phase during all sections of the polymerization process,
showed a consistent lamellar thickest through all multicomponent transitions. The system was also
observed under high shear showing thinning viscosity for synthesized polyacrylamide and a yield
viscosity for very high molecular weight linear polyacrylamide.

i
Table of Contents CHAPTER 1 INTRODUCTION..................................................................................................................7 SURFACTANTS AT THE OIL-WATER INTERFACES................................................9 EFFECTS OF ALCOHOL ON A OIL-WATER-SURFACTANT SYSTEM..................19 WATER-DODECANE-SDS-PENTANOL-THE PHASE DIAGRAM........................... 25 LAMELLAR PHASES – THE LYPOTROPIC PHAS……………………….………....28 REFERENCES..................................................................................................................33 CHAPTER 2 Phase Study...........................................................................................................................58 ABSTRACT…………………………………………………………………………….58 INTRODUCTION............................................................................................................60 EXPERIMENTAL............................................................................................................62 RESULTS AND DISCUSSION.......................................................................................63 CONCLUSIONS...............................................................................................................64 CHAPTER 3 Synthesis of PolyAcrylamide in Lamellar Phase Space.........................................................65 ABSTRACT…………………………………...……..………………………………….65 INTRODUCTION.............................................................................................................66 EXPERIMENTAL.............................................................................................................66 RESULTS AND DISCUSSION........................................................................................69 CONCLUSIONS................................................................................................................70 CHAPTER 4 Small Angle Neutron Scattering of Lamellar Phase in Multi Component MicroEmulsion........................................................................................................................72 ABSTRACT……………………….……………………………………………………..72 INTRODUCTION..............................................................................................................73
EXPERIMENTAL….....................,....................................................................................77 RESULTS AND DISCUSSION….....................................................................................79
ii
CONCLUSIONS...............................................................................................................80 REFERENCES..................................................................................................................81 CHAPTER 5 Rheology of a Multicomponent Lamellar System.………………………………….……...82
ABSTRACT…………………………………………………………………………….82 INTRODUCTION............................................................................................................83 EXPERIMENTAL............................................................................................................84 RESULTS AND DISCUSSION.......................................................................................85 CONCLUSIONS...............................................................................................................86 REFERENCES..................................................................................................................87 CHAPTER 6 Characterization of PolyAcrylamide produced in confined Lamellar Phase……………….93 ABSTRACT……………………………………………………………………………..93 INTRODUCTION.............................................................................................................93 EXPERIMENTAL.............................................................................................................95 RESULTS AND DISCUSSION........................................................................................96 CONCLUSIONS................................................................................................................97 CHAPTER 7 CONCLUSIONS.....................................................................................................................98

iii
Acknowledgements This work would not have been possible without the tremendous help and guidance provided by my
advisor Carl C. Gryte. I would like to add a special thanks to Alan West for lending that extra support
during some difficult times. I also would like to thank Ben O’Shaughnessy, Christopher Durning, and
Richard Wilk for the many insightful discussions concerning emulsion polymerization in confined space.
I need to thank John Huang and James Sung of Exxon-Mobil Research for their insights and resource
support which allowed for the production and analyzing of the polymer synthesized in my experiments.
The funding for this work primarily came directly from the generous gift of Exxon Mobil. Additionally, I
would like to send a special thanks to Mrs. Carol Gryte, Professor Carl Gryte’s wife, her endless patience
allowed me many hours in the presence of their home to review and openly discuss with Professor Gryte
the fascinating results of this experimental research.
Finally, I would like to thank my daughters, Jenna Stefandl and Michelle Stefandl, for they have taught
me by example that the greatest lessons to ever be learned are those from our children.

1
Chapter 1
Introduction
Liquid crystals provide attractive media for specific reactions such as polymerization. The
polymerization reaction can be achieved in two ways. One consists of polymerizing a mesomorphic
monomer, leading to a product with a 'locked-in' mesomorphic structure. These systems have the great
advantage of consisting of a single component; they have been the subject of numerous studies(1-6) The
second possibility is to polymerize a monomer inserted in a lyotropic liquid-crystalline structure. The
complexity of these multicomponent systems explains the scarcity of research papers in the literature. The
attempts have usually met with limited success; the initial mesomorphic structure was not retained(6-8) or a
rearrangement of the microstructure occurred through polymerization.(9) The conformational loss of
entropy during polymerization, as well as incompatibility between the matrix and polymer, were the
factors usually invoked to explain the results. In previous research study of the polymerization of
acrylamide in non-ionic microemulsions.(10-12) The latter are disordered and thermodynamically stable
dispersions of oil and water stabilized by the addition of suitable surfactants or cosurfactants.(13) Their
optical transparency is a consequence of the small size of the oil (or water) regions. The non-ionic
microemulsions used in many studies were formulated with the help of the cohesive energy ratio (CER)
concept.(11) It was shown that additives such as alcohols or electrolytes induced the formation of
bicontinuous microemulsions.(12) In this case, the micro- emulsions were not closed structures (such as
water or oil droplets dispersed in oil or water, respectively) but had the oil and water regions connected
over greater distances and separated by a surfactant monolayer film. These isotropic bicontinuous
microemulsions were characterized by very low interfacial tensions (10~3 dyn cm-1) and they result after
polymerization to very stable and clear microlatices of polyacrylamide particles dispersed in oil-water
emulsion. Liquid-crystalline phases showing long-range smectic order and containing higher surfactant
concentrations were also observed in the phase diagram close to the microemulsion domains.

2
Surprisingly, polymerization of acrylamide in these lamellar microemulsions gave very stable latices
similar to those prepared in inverse microemulsions.
In order to gain further insight into the polymerization mechanism occurring in these structures, we
have followed their development during polymerization. For this purpose, we have used methods
providing information on the macroscopic properties of the systems: rheology, electrical conductivity,
differential scanning calorimetry, gel permeation chromotography, and compositions of the phases at
equilibrium. In addition, small-angle neutron scattering and light scattering allowed us to characterize
their microscopic structures.
The systems was analyzed in five types of structures, in the first just the system at phase
equilibrium, the second the system with the introduction of monomer and the third with the system’s
monomer being polymerized, the fourth just the extracted purified polymer and fifth a system with added
polymer as a standard.
SURFACTANTS AT THE OIL-WATER INTERFACES
Surfactants (or surface active agents) are special molecules that are made up of two sections: the
hydrophilic part (usually ionic or nonionic) which likes water and the hydrophobic part (usually a
hydrocarbon chain) which likes oil. It is this dual nature which causes these molecules to adsorb at the
interfaces between two immiscible liquids, like oil and water. The interfacial layer formed as a result of
this is usually a monolayer and is responsible for allowing oil and water to mix. These monolayers play
an important role in a number of industrial areas involving surfactants, for example, in pharmaceutical,
agrochemical and food preparations, in the detergent industry as well as in numerous processes
encountered in the oil business.
Microemulsions are dispersions of oil and water made with surfactant molecules. They have a
microstructure which consists of small areas of oil and water separated by surfactant monolayers. The

3
typical size of these areas (or domains) is about 1OOA. The most common microstructure is that of
droplets, either water or oil, surrounded by a surfactant layer, and dispersed in oil or water respectively. In
some respects, they are small-scale versions of (macro)emulsions. In emulsions however, the droplet size
is much larger, typically about one micron. For this reason, emulsions are optically turbid while micro-
emulsions are much more transparent; light of wave length comparable to the size of the emulsion drops
is strongly scattered by the medium, reducing the transmitted light intensity. In addition, emulsions are
not thermodynamically stable but can be kinetically stable. Microemulsions, however, are
thermodynamically stable - in other words, they form spontaneously when the components are mixed.
An example will serve to explain the stability of microemulsions. Imagine a vessel containing 1cm3 of
water and 1cm3 of oil which form two distinct phases in contact. For a vessel with dimensions of about
1cm, the area of the oil-water interface is roughly 1cm3. The formation of an emulsion with drops having
a radius of lµm would require the surface area of contact to increase to around 1m2 - 10,000 times the
original area. To obtain a microemulsion, this new area would need to be increased even further by a
factor of 100 (equal to the ratio of the radii of the droplets).
To create an oil-water interface of whatever type, a certain amount of energy is needed which is
proportional to the area of interface formed. The coefficient of proportionality is known as the interfacial
tension, γ, and is the work of forming a unit area of interface (dimensionally equivalent to force per unit
length, mN/m). The energy needed to emulsify oil and water in the above example is 10,000 times greater
than the initial energy. Taking this into account, it is easy to see why the emulsion is unstable and the
system tends to minimize its energy by opting for two separate phases. The situation is at first sight even
worse for microemulsions: the energy required appears to be a million times the initial surface energy.
When a surfactant is added to the oil and water system, the adsorption to the interface that occurs is
always accompanied by a lowering in the interfacial tension, γ. Thus the tension of a bare alkane-water
interface (about 50mN/m) can be reduced by at least a factor often by surfactant monolayer adsorption.
The energy needed to emulsify (or microemulsify) oil and water is thus lowered by a factor of the order of
4
ten, but it is still 10,000 (or 1,000,000 respectively) times the initial surface energy lowered itself by a
similar magnitude. This apparent paradox is resolved by taking into account the entropy change occurring
in the system.(14)
The entropy of a system measures in some way its amount of disorder. Unlike energy which must be
at a minimum for a stable system, entropy must be at a maximum. Thus the thermodynamic stability of
microemulsions arises from the fact that the surface energy (equal to the product of the interfacial tension
and the total area between the oil and water) can be compensated by the dispersion entropy (roughly
proportional to the number of droplets) when the interfacial tension is sufficiently small (less than 0.l
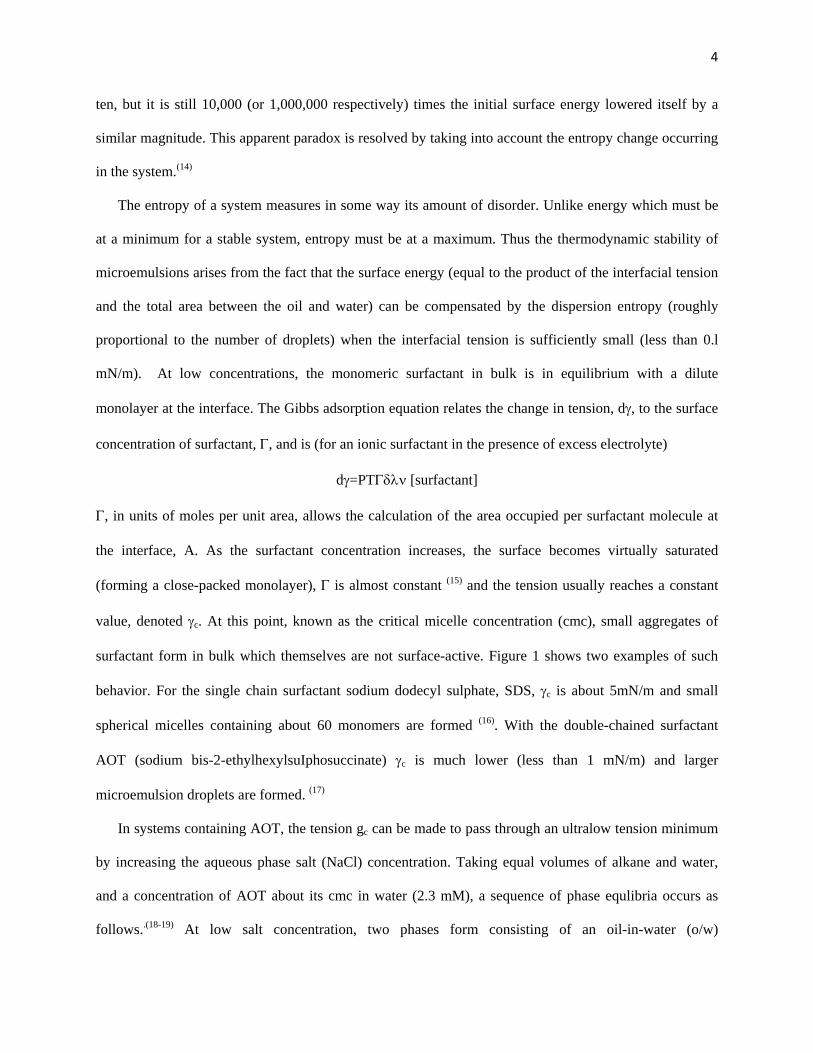
mN/m). At low concentrations, the monomeric surfactant in bulk is in equilibrium with a dilute
monolayer at the interface. The Gibbs adsorption equation relates the change in tension, dγ, to the surface
concentration of surfactant, Γ, and is (for an ionic surfactant in the presence of excess electrolyte)
dγ=PTΓδλν [surfactant]
Γ, in units of moles per unit area, allows the calculation of the area occupied per surfactant molecule at
the interface, A. As the surfactant concentration increases, the surface becomes virtually saturated
(forming a close-packed monolayer), Γ is almost constant (15) and the tension usually reaches a constant
value, denoted γc. At this point, known as the critical micelle concentration (cmc), small aggregates of
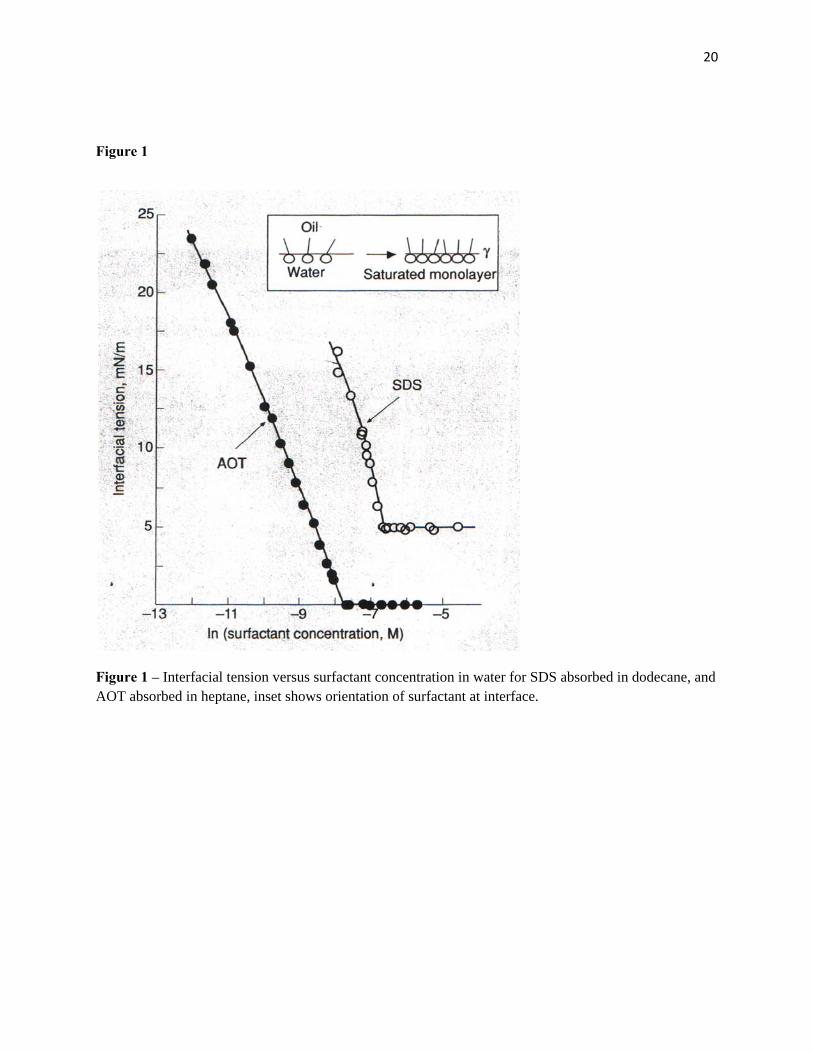
surfactant form in bulk which themselves are not surface-active. Figure 1 shows two examples of such
behavior. For the single chain surfactant sodium dodecyl sulphate, SDS, γc is about 5mN/m and small
spherical micelles containing about 60 monomers are formed (16). With the double-chained surfactant
AOT (sodium bis-2-ethylhexylsuIphosuccinate) γc is much lower (less than 1 mN/m) and larger
microemulsion droplets are formed. (17)
In systems containing AOT, the tension gc can be made to pass through an ultralow tension minimum
by increasing the aqueous phase salt (NaCl) concentration. Taking equal volumes of alkane and water,
and a concentration of AOT about its cmc in water (2.3 mM), a sequence of phase equlibria occurs as
follows..(18-19) At low salt concentration, two phases form consisting of an oil-in-water (o/w)

5
microemulsion plus excess oil (known as a Winsor I system). At high salt concentrations, two phases also
form; a water-in-oil (w/o) microemulsion plus excess water (a Winsor II system). At intermediate salt
concentrations, a three phase system (Winsor III) appears made up of a surfactant-rich third phase plus
excess oil and water. As seen in Figure 2 for heptane, gc falls from about l mN/m in water to less than 10 -
3 mN/m at 0.045M NaCl and then rises again. The lowest tensions form in the three phase region and arise
solely because of the adsorbed surfactant monolayer at the oil-water interface.(19) Analysis of coexisting
phases shows that aggregated surfactant transfers from water to oil via a third phase as the salt
concentration increases. For different alkanes, both the lowest tension and the salt concentration required
to achieve it increase with chain length.
For Monolayer curvature and solubilization the concentration's effect on inverting the type of
microemulsion can be understood in terms of the geometry of the surfactant in situ at the oil-water
interface. The cross-sectional areas of the head group and tail group are denoted Ah and Ac respectively.
Ah will depend on, the repulsion between head groups and their solvation. Ac will depend on the number
and type of surfactant chains as well as the degree of oil penetration into them. Adding salt to the AOT
systems or Alcohol to a SDS system has been rationalized in terms of these two areas (20). At low alcohol
concentration, Ah is higher than Ac and the monolayer has a tendency to curve so that the head groups are
on the outside. This is known as positive or normal curvature and results in oil-in- water microemulsions.
As more alcohol is added, Ah is reduced because of the screening of the repulsions between like charged
head groups, until at high alcohol concentrations, Ac is greater than Ah and the monolayer curves so that
the chains are now on the outside. This is negative or reverse curvature and gives water-in-oil
microemulsions. For intermediate salt concentrations, Ah is about the same as Ac and the monolayer has
no net curvature.
In the two-phase systems, the microemulsion droplet radius, r, can be predicted using an equation
relating φ, the dispersed phase volume fraction (oil or water), c the number of surfactant molecules per
unit volume and Σ the area per surfactant molecule at the curved surface (21).

6
r = 3φ / cΣ
Clearly, the droplet size and interfacial tension are inversely related. Why is this? At equilibrium, the
chemical potential of the surfactant is the same in the planar monolayer and the droplet surface, and the
chemical potential in the droplet depends on curvature. At low and high alcohol concentrations the
monolayer constrained to lie at the flat interface has a preferred tendency to curve and so the tension is
high. At intermediate concentrations the flat monolayer has no tendency to curve and so the tension is
least.
For dilute droplet microemulsion systems, where effects arising from droplet interactions and droplet
dispersion can be neglected, gc contains a contribution from the work of extending the surface by a unit
amount and the work of bending the surface to the required curvature. A simple relationship exists
between gc and r, where (22):
gc = 2K/r2
K is the bending elasticity constant or monolayer rigidity and has units of energy. It is the energy needed
to bend a unit area of interface by a unit amount of curvature. (23)
At alcohol concentrations close to the minimum tension, the curvature of the surfactant monolayer is
nearly zero and the layers tend to become planar. They are, however, subject to strong thermal
fluctuations. These fluctuations may become the dominant factor in determining the characteristic size of
the dispersion in the third phase. This size will be determined by the persistence length εκ of the interface.
At scales smaller than εκ the interface is essentially flat, whereas at scales larger than εκ it is strongly
wrinkled. The maximum average distance ε between two oil or water domains in the third phase is close
to the persistence length of the layer:
εκ = a exp (2πΚ/κΤ)
7
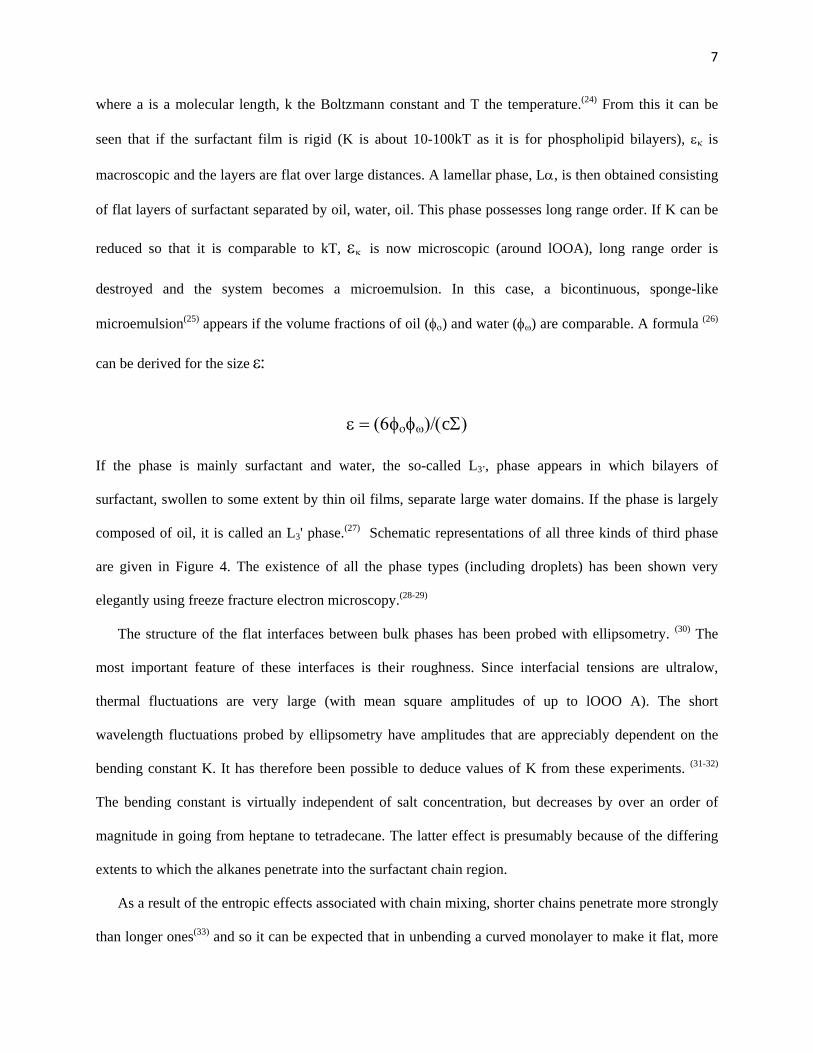
where a is a molecular length, k the Boltzmann constant and T the temperature.(24) From this it can be
seen that if the surfactant film is rigid (K is about 10-100kT as it is for phospholipid bilayers), εκ is
macroscopic and the layers are flat over large distances. A lamellar phase, Lα, is then obtained consisting
of flat layers of surfactant separated by oil, water, oil. This phase possesses long range order. If K can be
reduced so that it is comparable to kT, εκ is now microscopic (around lOOA), long range order is
destroyed and the system becomes a microemulsion. In this case, a bicontinuous, sponge-like
microemulsion(25) appears if the volume fractions of oil (φο) and water (φω) are comparable. A formula (26)
can be derived for the size ε:
ε = (6φοφω)/(cΣ)
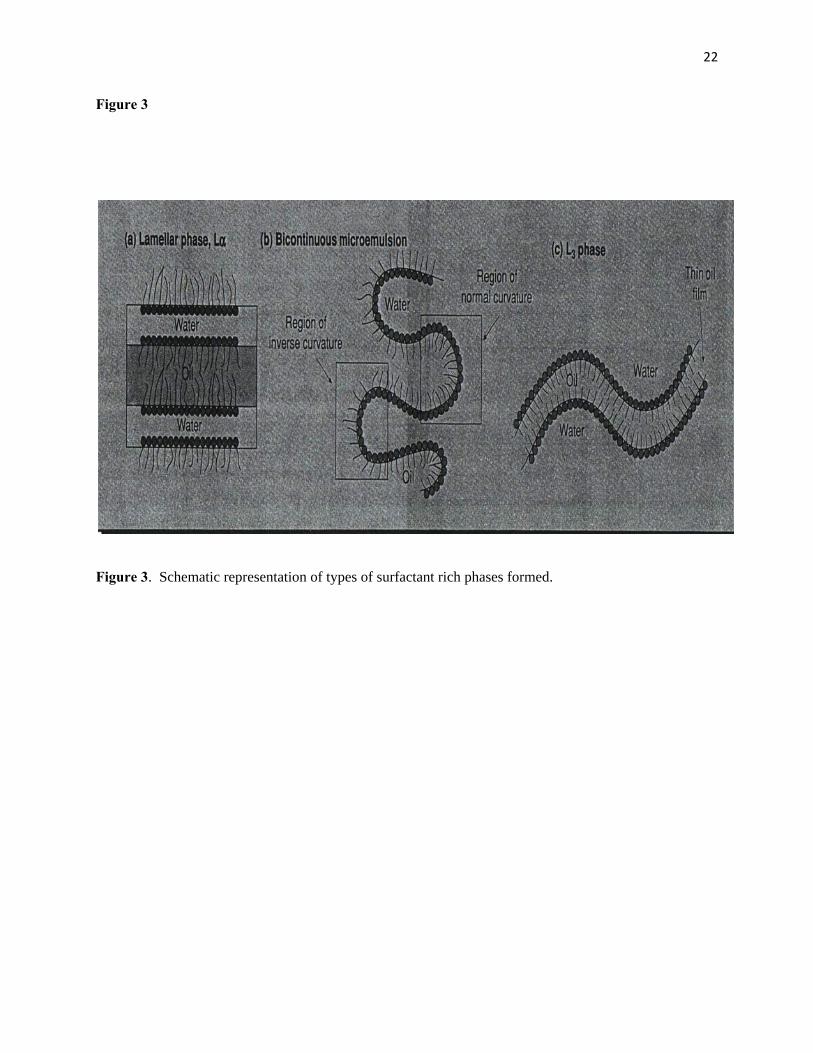
If the phase is mainly surfactant and water, the so-called L3’, phase appears in which bilayers of
surfactant, swollen to some extent by thin oil films, separate large water domains. If the phase is largely
composed of oil, it is called an L3' phase.(27) Schematic representations of all three kinds of third phase
are given in Figure 4. The existence of all the phase types (including droplets) has been shown very
elegantly using freeze fracture electron microscopy.(28-29)
The structure of the flat interfaces between bulk phases has been probed with ellipsometry. (30) The
most important feature of these interfaces is their roughness. Since interfacial tensions are ultralow,
thermal fluctuations are very large (with mean square amplitudes of up to lOOO A). The short
wavelength fluctuations probed by ellipsometry have amplitudes that are appreciably dependent on the
bending constant K. It has therefore been possible to deduce values of K from these experiments. (31-32)
The bending constant is virtually independent of salt concentration, but decreases by over an order of
magnitude in going from heptane to tetradecane. The latter effect is presumably because of the differing
extents to which the alkanes penetrate into the surfactant chain region.
As a result of the entropic effects associated with chain mixing, shorter chains penetrate more strongly
than longer ones(33) and so it can be expected that in unbending a curved monolayer to make it flat, more
8
energy would be required to desolvate the chains in the former than in the latter.(34) It has been argued
theoretically that the main contribution to K arises from the chains, in line with the experiments.(35) For
the above systems, it has been shown using neutron scattering that for short alkanes the third phase is
lamellar, while for long alkanes it is an L3 phase.(36)
In understanding the link between microemulsions and macroemulsions, it is frequently seen that
the type of emulsion (o/w, w/o or intermediate) formed by homogenization of the Winsor system is the
same as that of the equilibrium microemulsion.(37) For example, emulsification of an o/w microemulsion
plus excess oil generally gives an o/w emulsion, the continuous phase of which itself is an o/w
microemulsion. It is not obvious why this should be so, since in the case of microemulsions, the behavior
is determined in part by the curvature of the mono¬ layer stabilizing the nm-sized droplets. For
emulsions, the radii of curvature of pjn-sized drops are about one thousand times the molecular
dimensions making it difficult to see how curvature effects are implicated. Nonetheless it has also been
shown that the long term stability (to flocculation and coalescence) of emulsions is significantly affected
by the presence of microemulsions in the continuous phase,(38) and so our understanding of the emulsion
properties may significantly improve in the light of our knowledge of microemulsions.
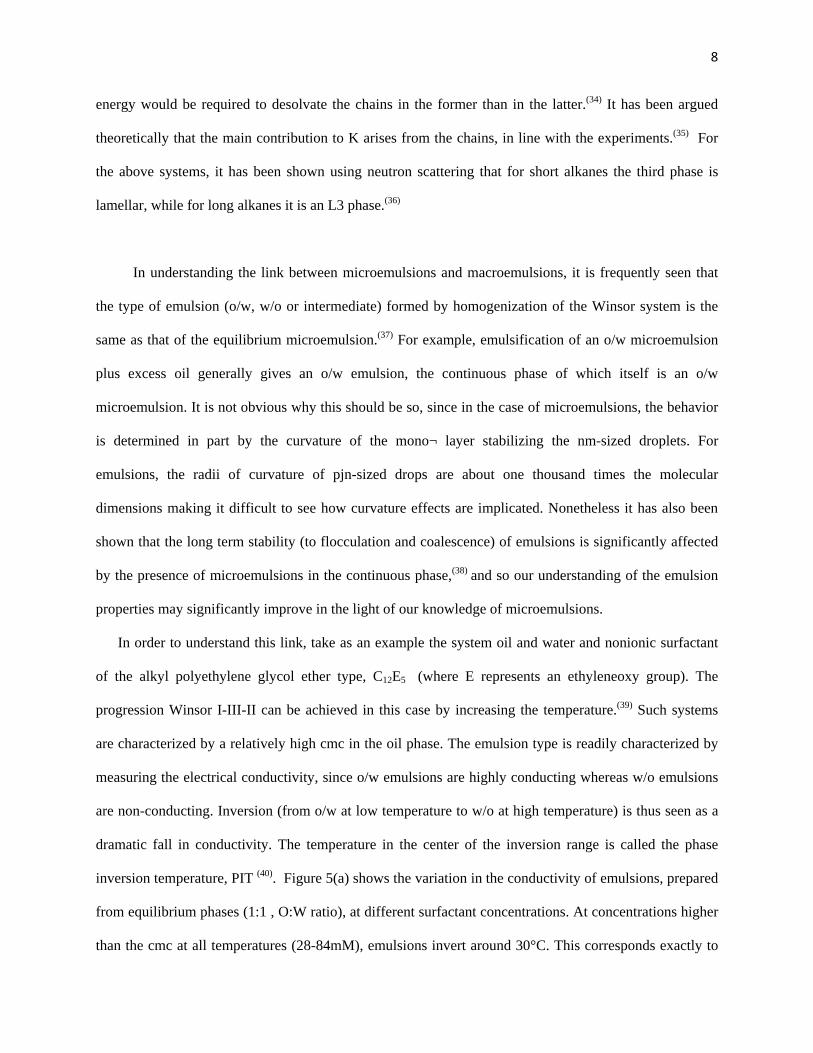
In order to understand this link, take as an example the system oil and water and nonionic surfactant
of the alkyl polyethylene glycol ether type, C12E5 (where E represents an ethyleneoxy group). The
progression Winsor I-III-II can be achieved in this case by increasing the temperature.(39) Such systems
are characterized by a relatively high cmc in the oil phase. The emulsion type is readily characterized by
measuring the electrical conductivity, since o/w emulsions are highly conducting whereas w/o emulsions
are non-conducting. Inversion (from o/w at low temperature to w/o at high temperature) is thus seen as a
dramatic fall in conductivity. The temperature in the center of the inversion range is called the phase
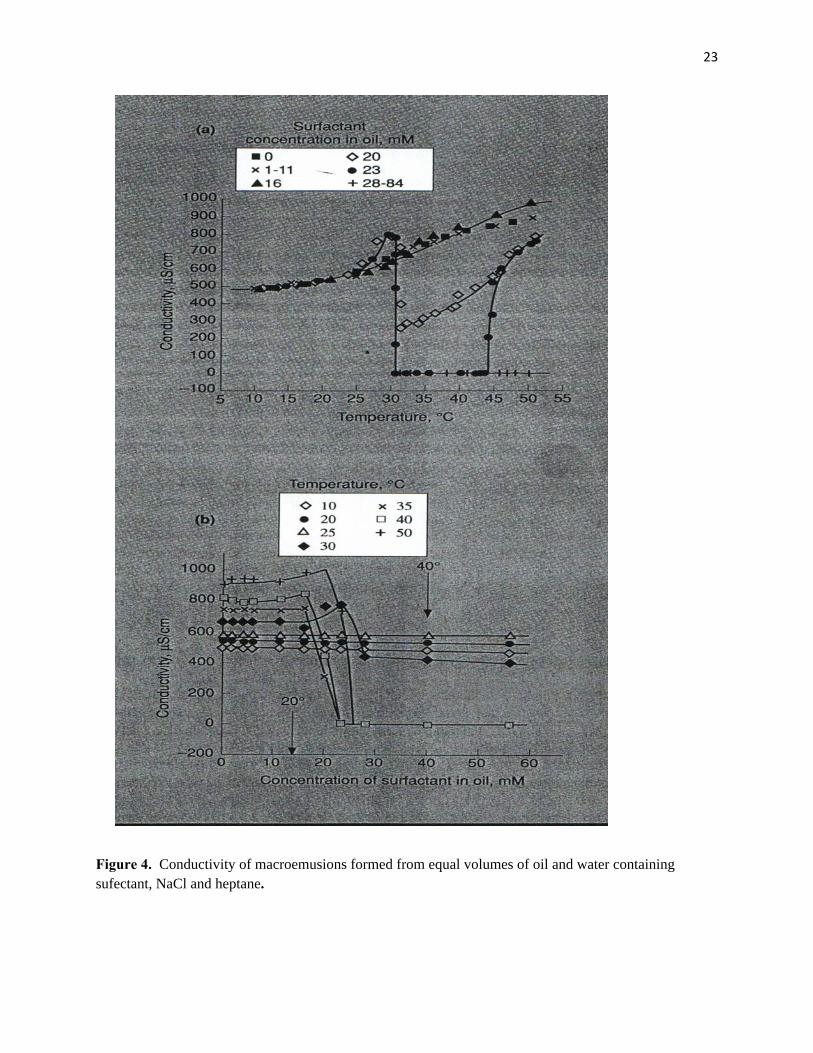
inversion temperature, PIT (40). Figure 5(a) shows the variation in the conductivity of emulsions, prepared
from equilibrium phases (1:1 , O:W ratio), at different surfactant concentrations. At concentrations higher
than the cmc at all temperatures (28-84mM), emulsions invert around 30°C. This corresponds exactly to
9
the middle of the Winsor III microemulsion temperature range where γc is at a minimum. At low
concentrations (less than 16mM) emulsions remain conducting even above the PIT.
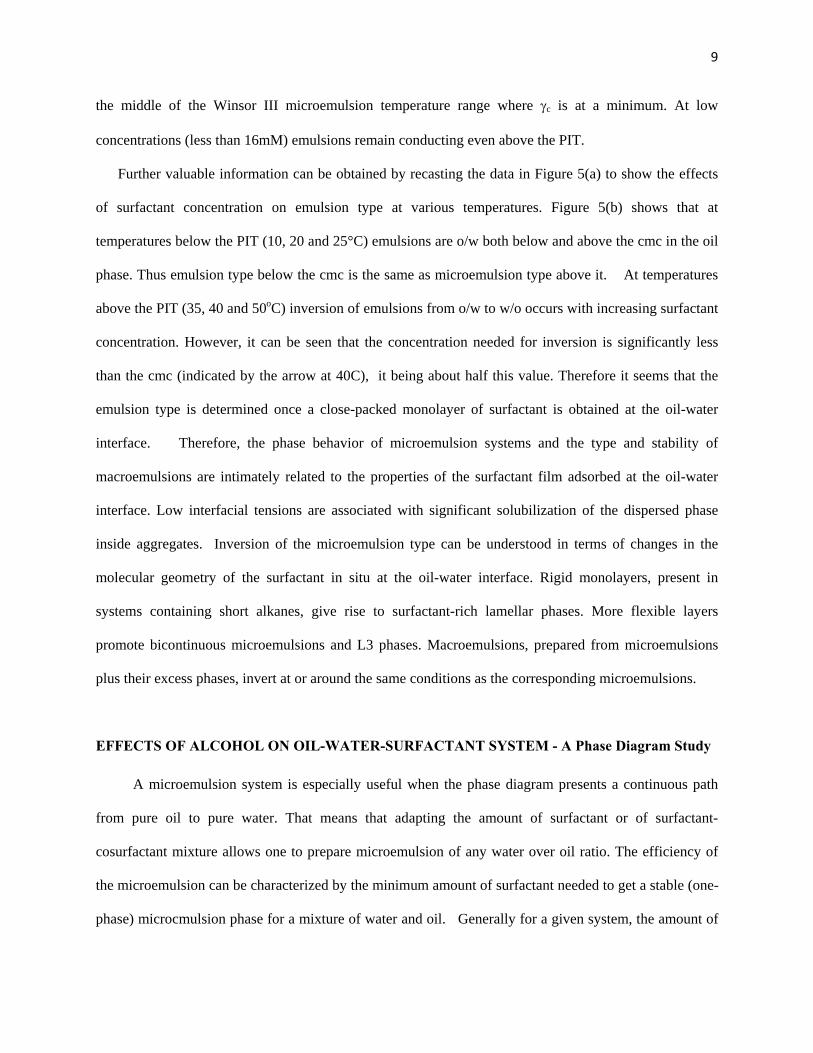
Further valuable information can be obtained by recasting the data in Figure 5(a) to show the effects
of surfactant concentration on emulsion type at various temperatures. Figure 5(b) shows that at
temperatures below the PIT (10, 20 and 25°C) emulsions are o/w both below and above the cmc in the oil
phase. Thus emulsion type below the cmc is the same as microemulsion type above it. At temperatures
above the PIT (35, 40 and 50oC) inversion of emulsions from o/w to w/o occurs with increasing surfactant
concentration. However, it can be seen that the concentration needed for inversion is significantly less
than the cmc (indicated by the arrow at 40C), it being about half this value. Therefore it seems that the
emulsion type is determined once a close-packed monolayer of surfactant is obtained at the oil-water
interface. Therefore, the phase behavior of microemulsion systems and the type and stability of
macroemulsions are intimately related to the properties of the surfactant film adsorbed at the oil-water
interface. Low interfacial tensions are associated with significant solubilization of the dispersed phase
inside aggregates. Inversion of the microemulsion type can be understood in terms of changes in the
molecular geometry of the surfactant in situ at the oil-water interface. Rigid monolayers, present in
systems containing short alkanes, give rise to surfactant-rich lamellar phases. More flexible layers
promote bicontinuous microemulsions and L3 phases. Macroemulsions, prepared from microemulsions
plus their excess phases, invert at or around the same conditions as the corresponding microemulsions.
EFFECTS OF ALCOHOL ON OIL-WATER-SURFACTANT SYSTEM - A Phase Diagram Study
A microemulsion system is especially useful when the phase diagram presents a continuous path
from pure oil to pure water. That means that adapting the amount of surfactant or of surfactant-
cosurfactant mixture allows one to prepare microemulsion of any water over oil ratio. The efficiency of
the microemulsion can be characterized by the minimum amount of surfactant needed to get a stable (one-
phase) microcmulsion phase for a mixture of water and oil. Generally for a given system, the amount of

10
surfactant is optimized when the phase diagram is symmetrical in oil and water, the microcmulsion is then
called balanced. In order to achieve this balance lets first review the addition of alcohol as a co surfactant
on the phase diagram of the system we are studying. The boundaries of the microemulsion domains in
isothermal triangular diagrams (see Figs. 5 and 6) were determined, for different values of the
surfactant/alcohol mass ratio k, by progressive titration of four-component mixtures. Usually, the
experimental paths followed in the triangular diagrams (see Fig. 6), water being the titration component.
The ratio km being chosen, a mixture of surfactant, alkanol, and hydrocarbon, characterized by a certain
value of Rh, was progressively enriched in water (added drop by drop) while being submitted to gentle
agitation by means of a magnetic stirrer. The concentrations of water at which turbidity-to-transparency
and transparency-to-turbidity transitions occurred were derived from precise weight measurements. By
repeating this experimental routine for other values of Rh, the boundaries of the microemulsion domain
corresponding to the chosen value of km were determined. The entire process was further repeated for
other values of km. In some difficult cases, it was necessary to carry out "static" titration experiments.
Series of samples, whose compositions were close to the transition composition determined
approximately through "dynamic" titration experiments of the kind previously described, were prepared
and stored at T = 25 ± 0.1°C in a temperature- controlled chamber. The phase behavior of these samples
was checked at regular intervals until no evolution was observed. Samples that still appeared
monophasic at the end of a storage period of 3 months or so were considered as being stable monophasic
microemulsion-type media. It was thus possible to pinpoint transition compositions that could not be
properly determined through "dynamic" titration experiments. It may be estimated that, on an average,
the relative uncertainty on the components' mass fractions corresponding to transition points is less than
2%.
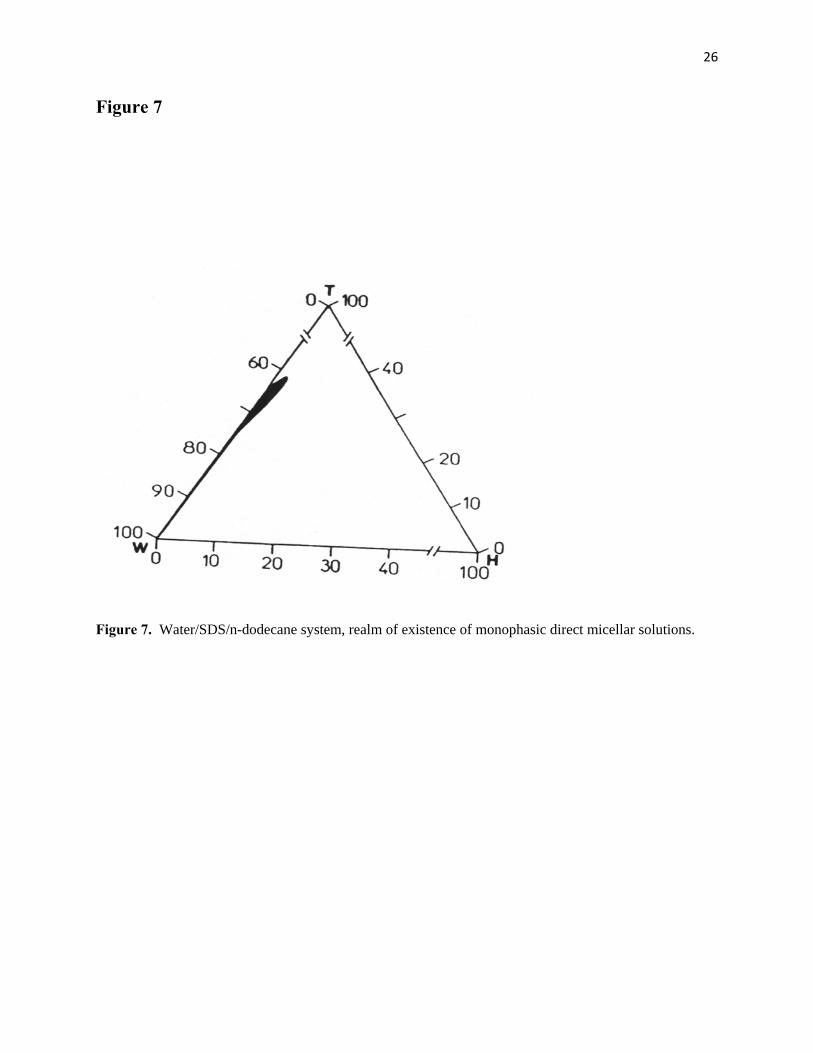
The isothermal pseudo-ternary phase diagrams reported in Figs. 7 through 9 clearly exemplify the
differences that exist between simple micellization or molecular solubilization, on the one hand, and
"microemulsification," on the other hand. From Figs. 7 and 8, it is evident that neither the addition of an
11
ionic surfactant such as sodium dodecylsulfate alone, nor the addition of an alkanol alone, can efficiently
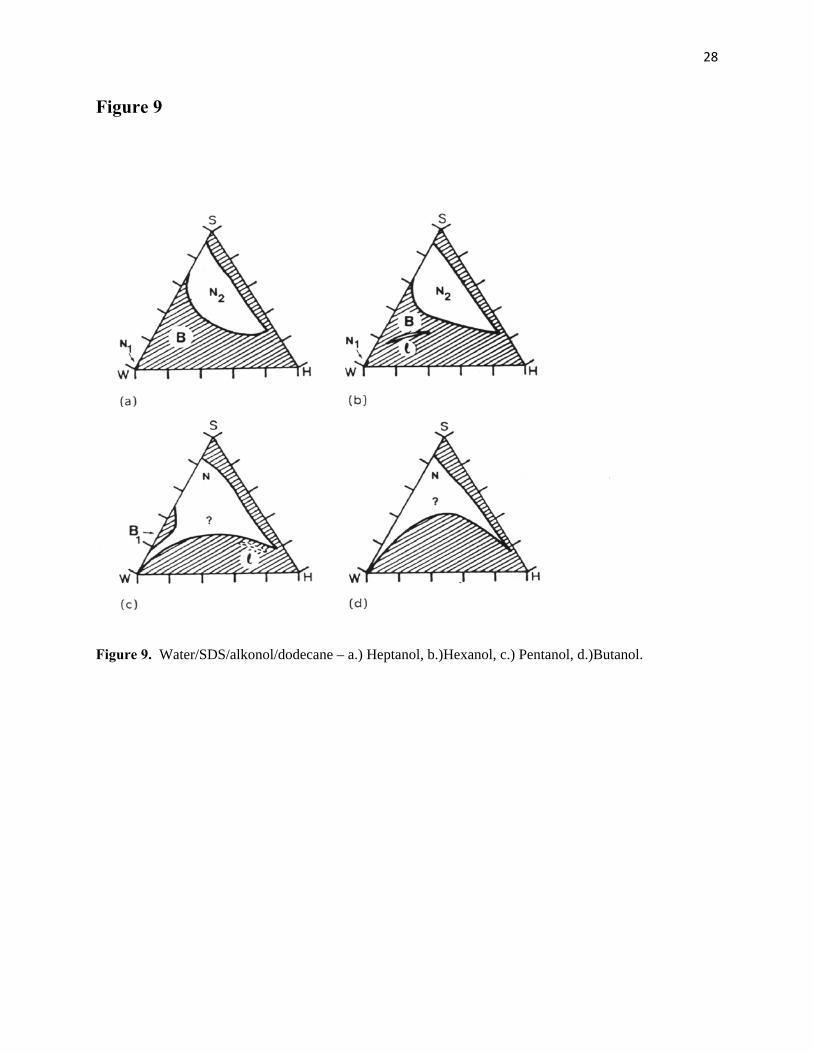
promote the "mutual solubilization" of water and n-dodecane. Figure 9, in contrast, shows that, upon
adequately combining, sodium dodecylsulfate with an alkanol ("cosurfactant"), it is possible to enhance
considerably this "mutual solubilization" and consequently induce the formation and secure the existence
of stable single-phased fluid media ("monophasic" microemulsions), which may simultaneously
incorporate large amounts of water and n-dodecane.
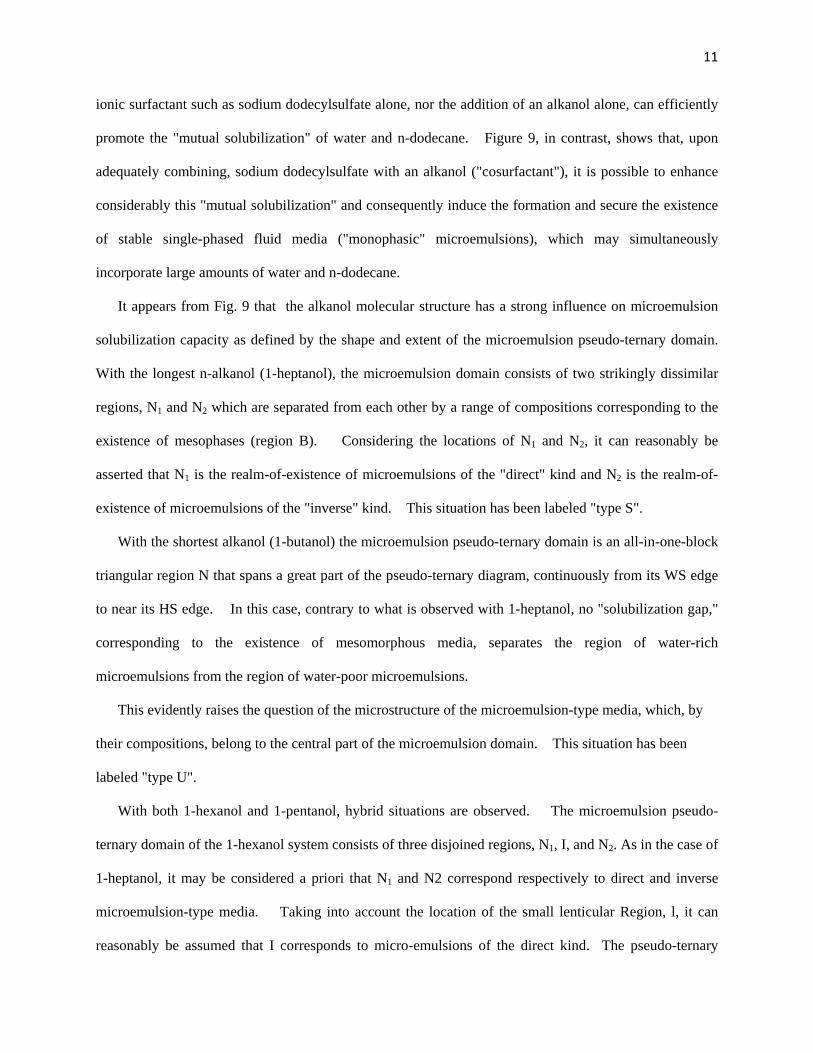
It appears from Fig. 9 that the alkanol molecular structure has a strong influence on microemulsion
solubilization capacity as defined by the shape and extent of the microemulsion pseudo-ternary domain.
With the longest n-alkanol (1-heptanol), the microemulsion domain consists of two strikingly dissimilar
regions, N1 and N2 which are separated from each other by a range of compositions corresponding to the
existence of mesophases (region B). Considering the locations of N1 and N2, it can reasonably be
asserted that N1 is the realm-of-existence of microemulsions of the "direct" kind and N2 is the realm-of-
existence of microemulsions of the "inverse" kind. This situation has been labeled "type S".
With the shortest alkanol (1-butanol) the microemulsion pseudo-ternary domain is an all-in-one-block
triangular region N that spans a great part of the pseudo-ternary diagram, continuously from its WS edge
to near its HS edge. In this case, contrary to what is observed with 1-heptanol, no "solubilization gap,"
corresponding to the existence of mesomorphous media, separates the region of water-rich
microemulsions from the region of water-poor microemulsions.
This evidently raises the question of the microstructure of the microemulsion-type media, which, by
their compositions, belong to the central part of the microemulsion domain. This situation has been
labeled "type U".
With both 1-hexanol and 1-pentanol, hybrid situations are observed. The microemulsion pseudo-
ternary domain of the 1-hexanol system consists of three disjoined regions, N1, I, and N2. As in the case of
1-heptanol, it may be considered a priori that N1 and N2 correspond respectively to direct and inverse
microemulsion-type media. Taking into account the location of the small lenticular Region, l, it can
reasonably be assumed that I corresponds to micro-emulsions of the direct kind. The pseudo-ternary

12
microemulsion domain of the 1-pentanol system consists of a large triangular region N, which by shape
and extent is roughly similar to the region N delimited in the case of 1-butanol, and of a tiny lenticular
region that lies close to the main region N but is completely inserted in the part of the phase diagram
corresponding to hydrocarbon-rich polyphasic media. It will be proved that in spite of its strange
location in the phase diagram, this lenticular region l defines a range of compositions that probably
correspond to water-external microemulsion-type media.
The influence of alkanol nature on microemulsion pseudo-ternary domain configuration becomes
clearer, especially with regard to the cases of the 1-hexanol and 1-pentanol systems, if one considers the
ternary diagrams shown in Fig. 10. These diagrams show that two types of water/sodium
dodecylsulfate/alkanol systems may be defined. With the longer alkanols (1-heptanol and 1-hexanol), the
realm-of- existence of the monophasic ternary solutions consists of two disjoined regions; L1 is the region
corresponding to alkanol solubilization in water ("direct" solubilization), and L2 is the region
corresponding to water solubilization in alkanol ("inverse" solubilization). Between the L1 and L2 regions,
there is a broad range of compositions that correspond to the existence of monophasic mesomorphous
media or of polyphasic media of different kinds. With 1-butanol (the shortest of the alkanols
considered), the L1 and L2 regions merge so as to form a wide solubilization area, L, which extends in the
ternary diagram continuously from the W apex (100% water) to the C apex (100% alkanol). In the case
of 1-pentanol, the situation is rather similar, but for the fact that the L1 and L2 regions are connected via a
very narrow channel CL. Since it is possible to obtain quaternary microemulsion-type media by adding
hydrocarbon to water/ ionic surfactant/alkanol monophasic solutions, it can reasonably be assumed that
the configuration of the microemulsion domain in the phase tetrahedron is determined primarily by the
configuration of the water/ionic surfactant/alkanol solubilization area. Since this solubilization area
consists of two disjoined regions, L1 and L2, or forms a vast region L, the microemulsion domain consists
of two disjoined volumes, V1 and V2, that spring respectively from the L1 or L2 region (type S), or forms
an all-in-one-block volume V whose : basis is the L region (type U). The validity of this conjecture,
shows that the configuration of the water/ionic surfactant/alkanol mutual solubilization area is indeed a
13
good criterion for determining whether a water/ionic surfactant/alkanol/hydrocarbon system belongs to
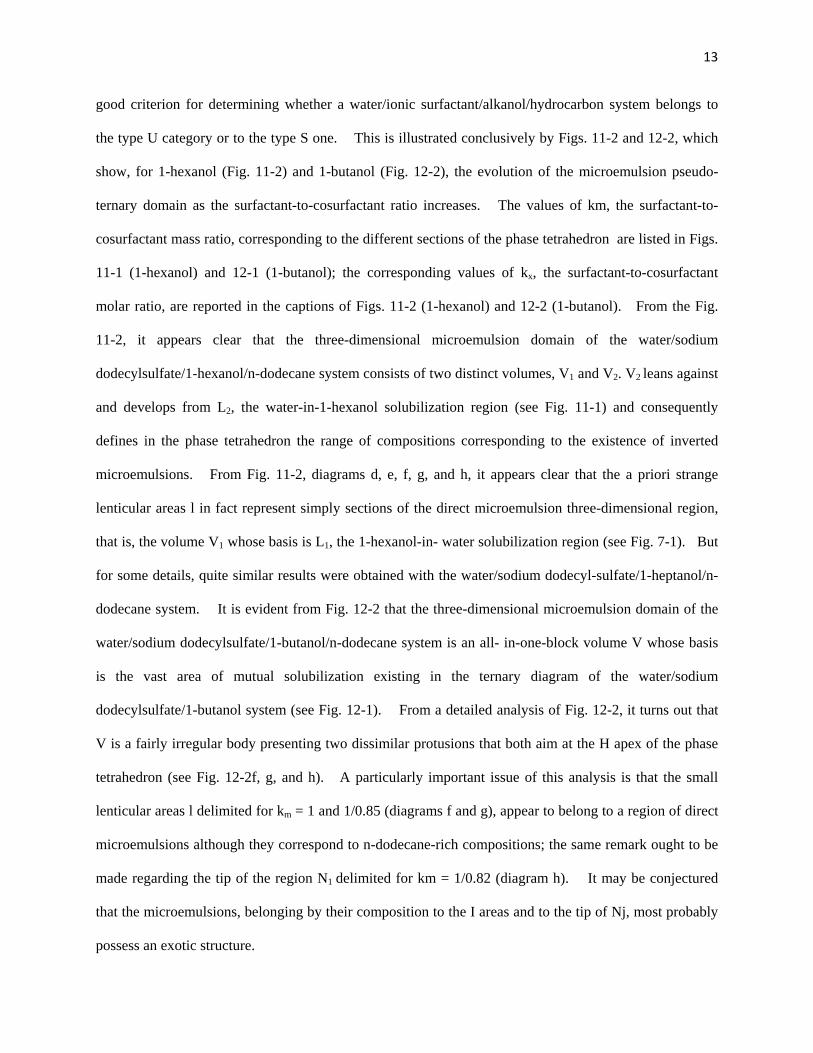
the type U category or to the type S one. This is illustrated conclusively by Figs. 11-2 and 12-2, which
show, for 1-hexanol (Fig. 11-2) and 1-butanol (Fig. 12-2), the evolution of the microemulsion pseudo-
ternary domain as the surfactant-to-cosurfactant ratio increases. The values of km, the surfactant-to-
cosurfactant mass ratio, corresponding to the different sections of the phase tetrahedron are listed in Figs.
11-1 (1-hexanol) and 12-1 (1-butanol); the corresponding values of kx, the surfactant-to-cosurfactant
molar ratio, are reported in the captions of Figs. 11-2 (1-hexanol) and 12-2 (1-butanol). From the Fig.
11-2, it appears clear that the three-dimensional microemulsion domain of the water/sodium
dodecylsulfate/1-hexanol/n-dodecane system consists of two distinct volumes, V1 and V2. V2 leans against
and develops from L2, the water-in-1-hexanol solubilization region (see Fig. 11-1) and consequently
defines in the phase tetrahedron the range of compositions corresponding to the existence of inverted
microemulsions. From Fig. 11-2, diagrams d, e, f, g, and h, it appears clear that the a priori strange
lenticular areas l in fact represent simply sections of the direct microemulsion three-dimensional region,
that is, the volume V1 whose basis is L1, the 1-hexanol-in- water solubilization region (see Fig. 7-1). But
for some details, quite similar results were obtained with the water/sodium dodecyl-sulfate/1-heptanol/n-
dodecane system. It is evident from Fig. 12-2 that the three-dimensional microemulsion domain of the
water/sodium dodecylsulfate/1-butanol/n-dodecane system is an all- in-one-block volume V whose basis
is the vast area of mutual solubilization existing in the ternary diagram of the water/sodium
dodecylsulfate/1-butanol system (see Fig. 12-1). From a detailed analysis of Fig. 12-2, it turns out that
V is a fairly irregular body presenting two dissimilar protusions that both aim at the H apex of the phase
tetrahedron (see Fig. 12-2f, g, and h). A particularly important issue of this analysis is that the small
lenticular areas l delimited for km = 1 and 1/0.85 (diagrams f and g), appear to belong to a region of direct
microemulsions although they correspond to n-dodecane-rich compositions; the same remark ought to be
made regarding the tip of the region N1 delimited for km = 1/0.82 (diagram h). It may be conjectured
that the microemulsions, belonging by their composition to the I areas and to the tip of Nj, most probably
possess an exotic structure.
14
It follows from the preceding developments that isolated studies of the pseudo-ternary microemulsion
domain may be insufficient to ascertain whether a water/ionic surfactant/cosurfactant/hydrocarbon system
belongs to the type S category or the type U one; the only unbiased criterion is the configuration of the
water/surfactant/co-surfactant mutual solubilization area. It shows that the type (U or S) of a water/ionic
surfactant/cosurfactant/hydrocarbon system may be determined quite simply, by using the correlations
existing between system type and microemulsion electroconductive behavior.
Water-DoDecane-SDS-Pentanol: Interpretation of the Phase Diagram
The most important parameter of a Water –Dodecane-SDS-alcohol system is the alcohol chain length.
The interactions between micelles are all the more attractive as the alcohol is shorter. Besides, in some
systems a critical behavior is evidenced. It seems to be related to strong attractive interactions. Then, for
example, in the series of systems: water-dodecane -SDS—pentanol or hexanol or heptanol a critical
behavior is best observed with pentanol. It appears therefore of particular interest to investigate the phase
diagrams of the water—dodecane—SDS—pentanol (A) as compared to a water-dodecane-SDS-hexanol
(B) systems.
One of the main objectives is to compare the phase diagrams of systems A and B and to give a
quantitative interpretation of these diagrams. For this purpose, let us examine not only the classical one-
phase region but also the polyphasic regions around it. This study allows us to locate the critical point in
system A and also to evidence in both systems a great variety of new domains including one- and three-

15
phase regions. Let us describe in detail two pseudoternary diagrams and show that a model of droplets in
interaction allows us to interpret the existence of a critical point in the oil-rich region. Similarly, we can
show that the consideration of interaction between oil domains can explain the well known effect of
alcohol or salt on the water-rich side of the phase diagram.
The phase diagrams of quaternary mixtures can be represented in a three-dimensional space. It is
useful to present pseudoternary sections of this diagram. The W/S representation (which keeps constant
the water surfactant ratio) gives a good description of the oil-rich side of the phase diagram. In Fig. 13 are
shown the experimental pseudoternary phase diagrams obtained with hexanol (a) and pentanol (b). The
W/S volume ratio has been fixed at 1.8. This value corresponds to the microemulsions previously studied
by light scattering. Both diagrams present a great variety of one-, two- or three-phase domains. The
sequence of phases observed along the paths AA and BB' is described. The variable along AA' is the
alcohol concentration. The path BB' follows the de-mixing line. Two points can be noticed:
(i) Both systems exhibit similar phase diagrams; especially, two one-phase regions are
observed below the demixing line: in region II the microemulsions are birefringent and in
region III, which is poor in alcohol, microemulsions are isotropic.
(ii) The main difference between the two diagrams is the existence, in the case of
pentanol, of a critical point (Pc) and a liquid-liquid isotropic region (V) around Pc. Near
Pc, the two phases in equilibrium have very close compositions. The L/L region (V) is
separated from the two-phase liquid-liquid birefringent region (VI) by a very narrow
three-phase zone (X). In these equilibria the middle phase is birefringent and the two
others are isotropic. The two regions V and X do not exist in the phase diagram with
hexanol.
The hexanol system does not present a critical point in the oil-rich region, the system separates along
BB' with an organized biregringent layer. This is true along the demixing line in the oil-rich region. The
pentanol system, which presents a critical point the system exhibits an isotropic microemulsion

16
equilibrium. In several theoretical models of microemulsion stability, the free energy includes an entropic
term mainly due to dispersion of water and oil domains and two types of enthalpic contributions: a term
of interfacial tension and terms of interactions between domains of the same nature (water—water or
oil—oil). These interactions result from coulombic and van der Waals forces. In this case, demixing
occurs similarly to a liquid-gas transition. Additionally it can be shown that a balance between entropy
and interfacial tension could interpret the phase transition. Also that three-phase equilibria can be
obtained by addition in the free energy of a curvature term of the interface between the water and oil
domains. In these models the interaction terms are neglected; however the authors point out that they
could play a role. The curvature term is not sufficient to reproduce three-phase equilibria and conclude
that more complex effects involving strong attractive interactions are required to explain the three-phase
equilibria.
In the following, we show that the L-L zone V observed in the oil-rich region of the phase diagram of
system A can be interpreted as a liquid-gas transition due to interactions between inverse lamellar
micelles. In this region of the phase diagram several studies have shown that the system can be described
as a dispersion of lamellar droplets in interaction. The quantitative interpretation of the phase diagram is
based on such a model of interacting particles.
Lamellar Region - La� - the Lyotropic Phase
As previous reviewed, surfactants in solution lead to a large number of fascinating structures, among
which are the lyotropic liquid crystal phases [41]. Liquid crystals exhibit long range order: orientational
nematics and positional (lamellar, hexagonal or cubic). The lamellar phases consist of stacks of surfactant
bilayers separated by solvent, usually water. We are concerned only with the lamellar La phase. Figure
14 shows a schematic representation of such a structure. There is quasi-long-range positional solid-like
order along the direction perpendicular to the layers (which we label as the z-direction): the surfactant

17
density is modulated along the z-direction with a well-defined period, the repeat distance d. In the two
other, in-plane, directions (x and y) the system is liquid-like and the solvent and surfactant molecules are
free to move in this plane. In general, at lower temperatures the La phase may undergo a phase transition
to the phases where the surfactant molecules exhibit various degrees of in-plane positional and
orientational order [42]. The lamellar La phase has the symmetry of the smectic A phase encountered in
thermotropic liquid crystals [43]; there are nevertheless important reasons for specifically studying such
lyotropic smectics. First, their most striking property is that the repeat distance d can be varied
continuously, upon addition of an appropriate solvent. In favorable cases, this swelling goes from
molecular sizes {d ~20 A) to extremely large values (100-1000 A) [44,45]: this opens the "experimental
window," for studying very "soft" smectics with vanishing bulk elasticities as d increases over two orders
of magnitude. In a few extreme cases, the smectic period reaches values of the order of optical
wavelengths, so Bragg peaks are observed with light scattering [45-47], analogous to the irridescence of
colloidal crystals [48]. Second, the La phase which consists of multilayer fluid surfaces (although
confined between neighboring walls) provide experimental models for studies of the statistical mechanics
of fluctuating random surfaces, an area of active current research [49]. Third, the relevance of lamellar
phases to the understanding of cell membranes, which are composed mainly of lipids, a biological
surfactant [50], was recognized early on [51].
For a long time, the most investigated surfactant/solvent systems have been "simple" binary
surfactant/water systems. The surfactant bilayer is then very often a "rigid" object: its well-defined shape
is not sensitive to thermal fluctuations on a length scale comparable to the lamellar spacing. The ability to
swell the smectic structure with water was realized early on [51] and was associated with strong
electrostatic repulsions. The more recent studies of microemulsions—surfactant/water/oil systems, with
specially designed surfactants or, more commonly, with mixtures of surfactants highlighted the relevance
of flexible, thermally fluctuating, surfactant sheets [52]. In such systems thermal fluctuations have to be
large, since they are, in fact, responsible for the very existence of the microemulsion structure. Easily
noticed is the presence of a large lamellar domain in the phase diagram of microemulsion-forming
18
systems. This lamellar phase can be swollen either with oil-like solvents [53], or with water [54-56],
resulting in "direct" or "inverted" bilayers as sketched in Fig. 14. The large swelling exhibited by such
systems stems from long range repulsive interactions between bilayers, which have a non-electrostatic
origin (swelling observed with non-ionic surfactants, a polar solvents or high ionic strength water). The
interaction originates in the high flexibility of the surfactant sheets, through a mechanism of entropy
reduction proposed by Helfrich [57], the undulation interaction.
For historical reasons, studied surfactant-solvent systems are more complex than the ideal binary
mixture. They involve usually three or more components and the complete description of the phase
diagram may be quite intricate. In what follows, we review a quaternary system consisting of water,
sodium dodecyl sulphate (SDS), dodecane and pentanol. The phase diagram at constant temperature and
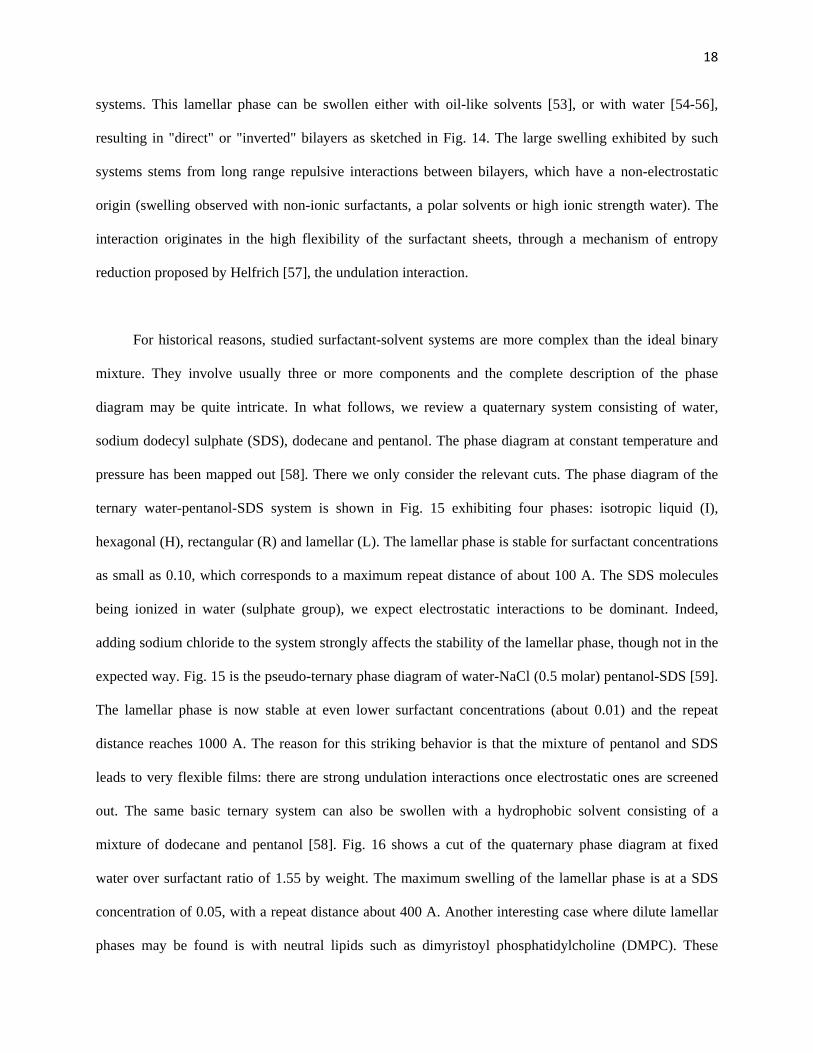
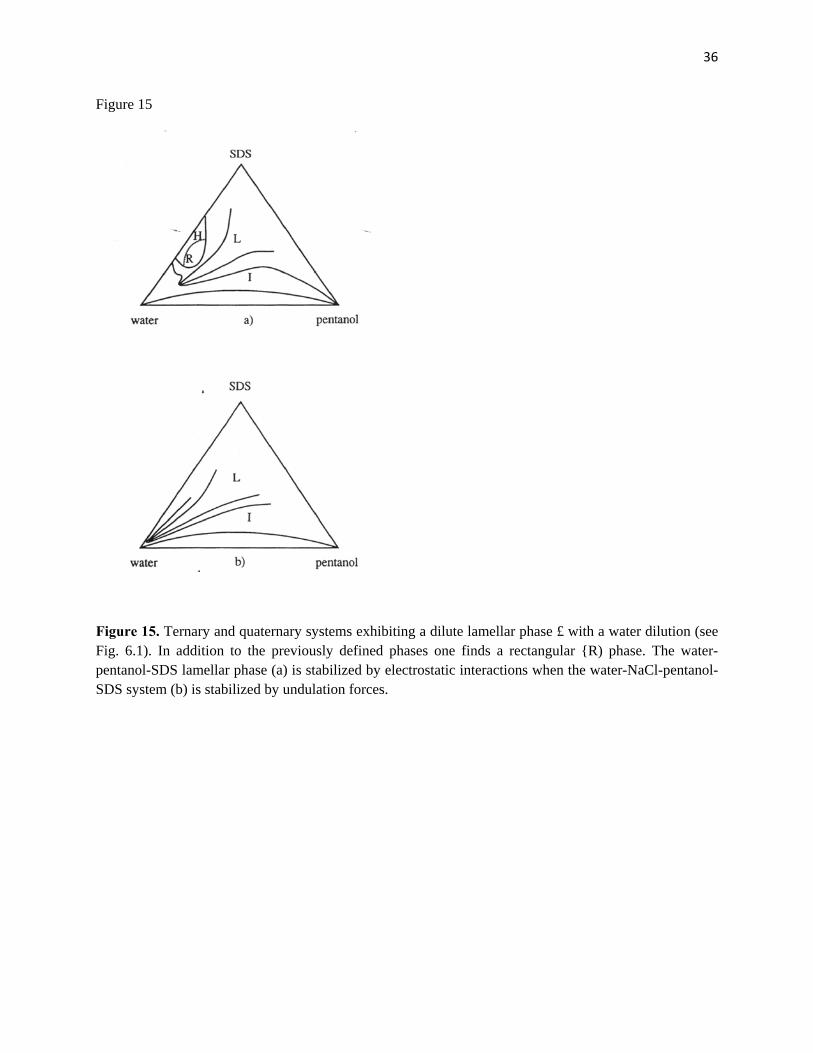
pressure has been mapped out [58]. There we only consider the relevant cuts. The phase diagram of the
ternary water-pentanol-SDS system is shown in Fig. 15 exhibiting four phases: isotropic liquid (I),
hexagonal (H), rectangular (R) and lamellar (L). The lamellar phase is stable for surfactant concentrations
as small as 0.10, which corresponds to a maximum repeat distance of about 100 A. The SDS molecules
being ionized in water (sulphate group), we expect electrostatic interactions to be dominant. Indeed,
adding sodium chloride to the system strongly affects the stability of the lamellar phase, though not in the
expected way. Fig. 15 is the pseudo-ternary phase diagram of water-NaCl (0.5 molar) pentanol-SDS [59].
The lamellar phase is now stable at even lower surfactant concentrations (about 0.01) and the repeat
distance reaches 1000 A. The reason for this striking behavior is that the mixture of pentanol and SDS
leads to very flexible films: there are strong undulation interactions once electrostatic ones are screened
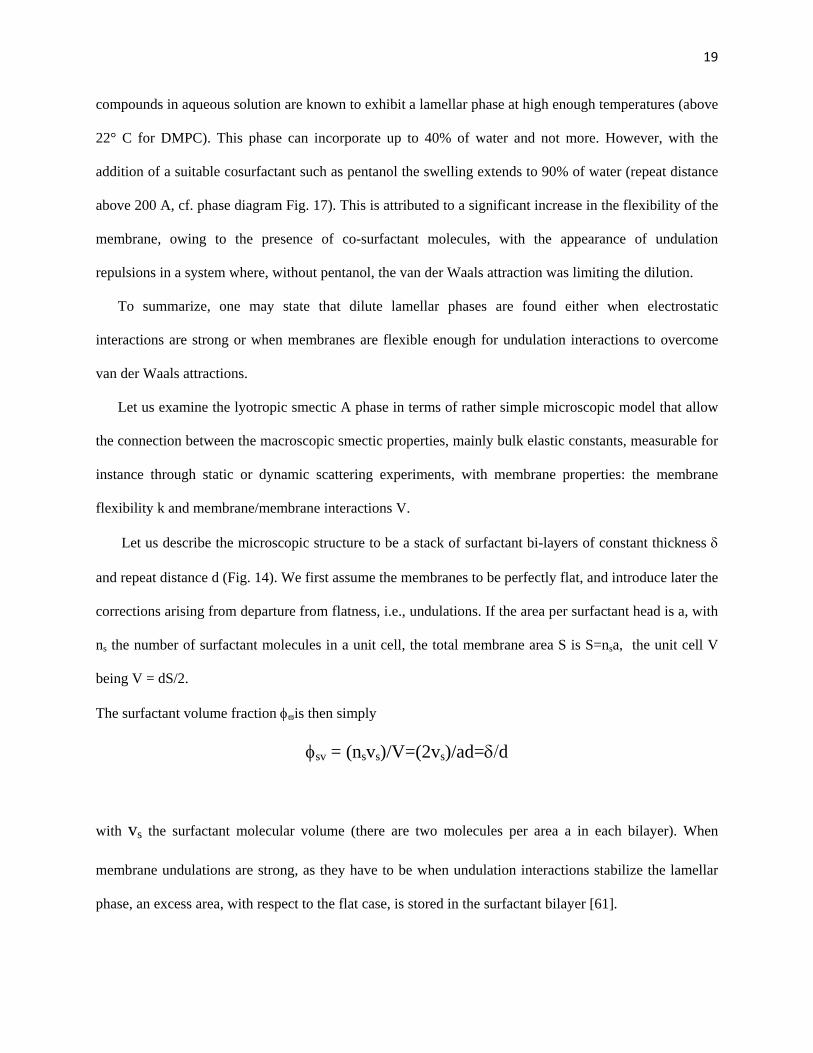
out. The same basic ternary system can also be swollen with a hydrophobic solvent consisting of a
mixture of dodecane and pentanol [58]. Fig. 16 shows a cut of the quaternary phase diagram at fixed
water over surfactant ratio of 1.55 by weight. The maximum swelling of the lamellar phase is at a SDS
concentration of 0.05, with a repeat distance about 400 A. Another interesting case where dilute lamellar
phases may be found is with neutral lipids such as dimyristoyl phosphatidylcholine (DMPC). These
19
compounds in aqueous solution are known to exhibit a lamellar phase at high enough temperatures (above
22° C for DMPC). This phase can incorporate up to 40% of water and not more. However, with the
addition of a suitable cosurfactant such as pentanol the swelling extends to 90% of water (repeat distance
above 200 A, cf. phase diagram Fig. 17). This is attributed to a significant increase in the flexibility of the
membrane, owing to the presence of co-surfactant molecules, with the appearance of undulation
repulsions in a system where, without pentanol, the van der Waals attraction was limiting the dilution.
To summarize, one may state that dilute lamellar phases are found either when electrostatic
interactions are strong or when membranes are flexible enough for undulation interactions to overcome
van der Waals attractions.
Let us examine the lyotropic smectic A phase in terms of rather simple microscopic model that allow
the connection between the macroscopic smectic properties, mainly bulk elastic constants, measurable for
instance through static or dynamic scattering experiments, with membrane properties: the membrane
flexibility k and membrane/membrane interactions V.
Let us describe the microscopic structure to be a stack of surfactant bi-layers of constant thickness δ
and repeat distance d (Fig. 14). We first assume the membranes to be perfectly flat, and introduce later the
corrections arising from departure from flatness, i.e., undulations. If the area per surfactant head is a, with
ns the number of surfactant molecules in a unit cell, the total membrane area S is S=nsa, the unit cell V
being V = dS/2.
The surfactant volume fraction φϖis then simply
φsv = (nsvs)/V=(2vs)/ad=δ/d
with vs the surfactant molecular volume (there are two molecules per area a in each bilayer). When
membrane undulations are strong, as they have to be when undulation interactions stabilize the lamellar
phase, an excess area, with respect to the flat case, is stored in the surfactant bilayer [61].
20
Figure 1
Figure 1 – Interfacial tension versus surfactant concentration in water for SDS absorbed in dodecane, and AOT absorbed in heptane, inset shows orientation of surfactant at interface.
25
20
Ez
15
I 10CO
Saturated monolayer
-13 -11 -9
In (surfactant concentration, M)

21
Figure 2
Figure 2 – Variations of cmc interfacial tension with aqueous phase salt concentration in the system AOT + aqueous NaCl + n-alkanes.
-0.5
BzB
a -1.5CO•c
Bc
-3.5
oil
—>
oil
o/wthird
water
w/o
water
-o- Heptane....+.. Nonane
--A- Undecane- TridecaneHexadecane
0.05 0.1 0.15 0.2 0.25 0.3 0.35NaCl concentration, M
22
Figure 3
Figure 3. Schematic representation of types of surfactant rich phases formed.
23
Figure 4. Conductivity of macroemusions formed from equal volumes of oil and water containing sufectant, NaCl and heptane.
___ |
10 15 20 25 30 35 40 45 50 55
Temperature, °C
Tempe
-20010 20 30 40 50 60
Concentration of surfactant in oil, mM

24
Figure 5
Figure 5. Phase diagram tetrahedron water/ionic/cosurfactant/hydrocarbon system. Pw ,Ph , Pc ,mass fraction of water, hydrocarbon, and cosurfactant respectfully. The shaded section corresponds to an area of fixed surfactant to co surfactant ratio.
Ph

25
Figure 6
Figure 6. Composition paths inside pseudo-ternanry phase diagrams,W-water, H hydrocarbon, S surfactant, (a) mass fraction of one component is constant, (b) the mass fraction of two components is constant.
26
Figure 7
Figure 7. Water/SDS/n-dodecane system, realm of existence of monophasic direct micellar solutions.

27
Figure 8
Figure 8. Water/alkanol/n-dodecane system, a.) Heptanol, b.) Hexanol, c.) Pentanol, d.) Butanol.
(a) (b)
(c) (d)
28
Figure 9
Figure 9. Water/SDS/alkonol/dodecane – a.) Heptanol, b.)Hexanol, c.) Pentanol, d.)Butanol.
S .S.
(a) (b)
NT
FIG 5 Water/sodium dodecylsulfate/n alkanol/n dodecane systems

29
Figure 10
Figure 10. Water/sodium dodecylsulfate/alkanol – a.)Heptanol, b.)Hexanol, c.)Pentanol, d.) Butanol.
S .S.
(a) (b)
NT
FIG 5 Water/sodium dodecylsulfate/n alkanol/n dodecane systems

30
Figure 11-1
Figure 11-1. Water/sodium dodecylsulfate/1-hexanol system (T = 25°C). Sections of the phase diagram corresponding to different values of the surfactant-cosurfactant mass ratio km.
S .S.
(a) (b)
NT
FIG 5 Water/sodium dodecylsulfate/n alkanol/n dodecane systems

31
Figure 11-2
Figure 11-2 . Water/sodium dodecylsulfate/1-hexanol-n-dodecane system. Influence of the surfactant-to-cosurfactant ratio on the configuration of the microemulsion pseudo-ternary domain (blank areas), (a) km = 0, kx = 0; (b) km = 1/9, kx = 1/25.40; (c) km = 1/4, kx = 1/11.29; (d) km = 1/3.03, kx = 1/8.55; (e) km = 1/2.32, kx = 1/6.54; (f) km = 1/2, kx = 1/5.64; (g) km = 1/1.76; kx = 4.97; (h) km = 1/1.50, kx = 1/4.23; (i) km = 1/1, kx = 1/2.82.
(d) (e) Cf)
(9) (h) (i)FIG 7-2 Water /sodium dodecylsulfate/1-hexanol-n-dodecane system°

32
Figure 12-1
Figure 12-1. Water/SDS/Butanol, sections of the phase diagram corresponding to different values of surfactant-to-cosurfactant mass ratio.
km = 1/0,82-'km = 1/0,85
: 1/1,68
,..-' km = 1/2
---" km = 1/4
km = 1/9
"m = 0

33
Figure 12-2
Figure 12-2. Water /sodium dodecylsulfate/1-butanol/n-dodecane system. Influence of the surfactant-to-cosurfactant ratio on the configuration of the microemulsion pseudo-ternary domain,(a) km = 0, kx = 0; (b) km = 1/9, kx = 1/35.02; (c) km = 1/4, kx = 1/15.56; (d) km = 1/2, kx = 1/7.78; (e) km = 1/1.68, kx = 1/6.54; (f) km = 1/1, kx = 1/3.89; (g) km = 1/0.85, kx = 1/3.31; (h) km = 1/0.82, kx = 3.19.
s s s

34
Figure 13
Figure 13. (a)Water/SDS/Dodecane/Hexanol, (b) Water/SDS/Dodecane/PentanolThe dark regions correspond to birefringent phases.
\HEXAN0l
WATER/SDS-,1,8 ®'®^DODECANE
* B 9 0 0 B 1 B 0 ''xn xi vm in to n vi i
b B'VI
PENTANOL
WATER /SOS - 1.8 000ECANE
'5DB1B8BD''vm i w n- m x v i
6 8 8 5VI X V

35
Figure 14
Figure 14. Schematic drawing of the membrane structure of lyotropic lamellar phases: the lamellar phase can be swollen either with water (hydrophilic solvent) or oil (hydrophobic solvent), leading to direct or inverted bilayers. The membrane thickness is d; d is the smectic repeating distance.
water dilution
oil dilution
oil
FIGURE 6.1. Schematic drawing of the membrane structure of lyotropic lamellarh th l ll h b ll ith ith t (h d hili l t)
36
Figure 15
Figure 15. Ternary and quaternary systems exhibiting a dilute lamellar phase £ with a water dilution (see Fig. 6.1). In addition to the previously defined phases one finds a rectangular {R) phase. The water-pentanol-SDS lamellar phase (a) is stabilized by electrostatic interactions when the water-NaCl-pentanol-SDS system (b) is stabilized by undulation forces.
SDS
water a) pentanol
SDS
water b) pentanol+ N CI (0 5 l 1"1 )

37
Figure 16
Figure 16. Cut of the quaternary phase diagram water-pentanol-SDS-dode- cane. The water over surfactant ratio is kept fixed at 1.55 (mass fraction). The lamellar phase L is swollen with a hydrophobic solvent (a mixture of dodecane and pentanol).
pentanol
W/S - 1.55 dodecane

38
Figure 17
Figure 17. Ternary phase diagram of an uncharged lipid (DMPC) with pen¬ tanol and water. The dilute lamellar phase is stabilized by undulation interactions which are magnified by the pentanol-induced increase of the membrane flexibility.
DMPC
water pentanol

39
Chapter 2
A Phase Study of Water- Dodecane- SDS – Pentanol
Abstract
The experimental behavior and theory Water/SDS/Dodecane/Pentanol were reviewed and studied. In
previous investigation the system is stable. In the present investigation we search for the region in the
phase system that remains stable with introduction of a fifth component – acrylamide monomer. This
section also searches for the thinnest lamellar water layer that remains stable with the introduction of
mononer. The lamellar section with greatest stability with acrylamide mononer is
Water – 29.10%, Dodecane- 38.0%, SDS-18.81%, and Pentanol 14.0%.
This composition exhibited stability with mononer added to the aqueous component. The polarization
microscope confirmed strong birefringence at this composition confirming an order lamellar structure.
Introduction
Recently, a lot of interest has been focused on phases made of very flexible surfactant films. These
systems have a low bending constant (x~kT) and can make either isotropic liquid phases
(microemulsions) or lamellar phases (lyotropic smectics)with characteristic distances ((100 - 1000)
Angstroms). Thermal fluctuations have been demonstrated to be essential for explaining the stability of
these phases. In the interesting case of dilute lamellar phases experimental results have demonstrated that
the very large dilutions that can be obtained are due to repulsive interactions entropically driven. On a
theoretical basis, the dilute lamellar phases can only be stable when the repeating distance between

40
membranes remains less than the persistence length of the film. For large dilutions the lamellar phase is
expected to melt in a phase of connected random surfaces stabilized by entropy. In a random mixing
approximation, the structure of this phase is that of a sponge: a random surface made of a bilayer film
separates two identical continuous phases made of the solvent. This phase has to be related to the regular
bicontinuous microemulsion phase which is made of a mixing of water and oil separated with a random
monolayer film. The main difference is that the sponge phase is composed of only one type of solvent
water or oil instead of water and oil. This phase has a different symmetry than the regular isotropic liquid
micellar phase. In this phase, the average mean curvature at the bilayers is equal to zero and the two
continuous phases are identical.
In experimental phase diagrams there exists what has been called an anomalous isotropic phase in the
vicinity of dilute lamellar phases. It suggests that for nonionic surfactants the phase could be made of
very large discs or plates.
The mixtures studied here are made of water-dodecane-pentanol-SDS (Sytems I) . Two systems
have been produced:
System I: Water – dodecane- pentanol- SDS
System II: Water- Dodecane- Pentanol- SDS – Acrylamide mononer
All systems have a ratio of Water:SDS of 1.55.
Experimental
We carried out detailed studies for the creation of a ternary phase diagramming the systems we
constructed using the babsis of Water/SDS ratio at 1.55. We varied the concentration of each component.
We varied only one component at a time holding the others constant.
For System I – Water-dodecane-pentanol- SDS,
For System II – Acylamide was pre-dissolved in water and then the system was produced.
The components used were of the highest purity and supplied through Sigma-Aldrich, the SDS was

41
further purified and dried. The Acrylamide monomer was stored in a dark refrigerated unit as instructed
from its original manufacturer – Cytec (formerly American Cyanamid) to ensure its reactivity and purity.
Once the samples were produced they were visually inspected under a polarized film microscope visually
inspecting for phase separation. All samples were then characterized and the data was compiled
confirming previous studies as outlined in Chapter I – Introduction.
The formulation of System II was more sensitive. The addition of acrylamide monomers was
explored through the entire range of the lamellae phase. Not all, but many compositions proved unstable
as phase separation occurred. This separation was evident in a complete multiple phase distortion of oil -
water – pentanol. In a rare few specific composition systems, even the acrylamide monomer would
precipitate out of the unbalanced systems. In making many of these specific composition systems in the
lamellae region, an area of stability for the inclusion of mononer within the system proved stable in the
high oil composition of the lamellae area of the phase composition of the multicomponent system of
water- dodecane-pentanol – SDS – acrylamide monomer. Both systems I and II were then duplicated
using deuterated water in place of standard water to be used late for small angle neutron scanning
characterization studies.
Results and Discussion
To summarize the results, let us incorporate the understanding of the multi component phase
system as described in Chapter I and focus on the area of key interest, the lamellar region of component
composition phase system. The system is best displayed in ternary phase diagram Figure 1. Figure 1
shows a cut of the system on a standard triangular ternary phase diagram in the plane with water/SDS
weight equal to 1.55, oil being dodecane, alcohol as pentanol, being the co-surfactant.
The diagrams is sectioned into four distinct regions:
a.) Microemulsion phases - με1 and με2
b.) Hexagonal – Liquid crystalline region (E)
c.) Liguid – orthogonal area (R)

42
d.) Lamellar Phase (Lα )
The Lamellar phase consists of water layers embedded in oil; this is shown schematically in Figure 1 with
the fluid surfactants at the interface of the oil and water. The system is stable in this region with the
addition of monomer into the water component of the multi component system. This affords great
advantages for studies of the lamellar and its intermembrane interactions. The system was also duplicated
and remained stable using deuterated water in place of normal water.
The Lamellar region at high oil concentrations exhibits monophasics mesophases of diplasic media
whose upper and lower phases are mesophases. This is confirmed from polarized microscopy. This
suggests that this region is a lamellar liquid of a woven multi component liquid type. Since this Lamellar
region covers an extended range of oil compositions it is stable while studying higher and higher
concentrations of oil lending to a thinner water layer.
Conclusion
It is experimentally demonstrated that, as shown in Chapter I, the nature of the
water/dodecane/SDS/Pentanol system is a microemulsion of three dimensional domain in an all-in-one
block volume that spans a wide range of compositions. It has been shown to be stable with the
introduction of acrylamide mononer in the water component. Likewise it remains stable if deuterated
water is used to replace normal water.
Additionally, we can enhance the oil component significantly minimizing the water thickness layer
and create a define space for executing our polymerization of acrylamide into polyacrylamide.

43
Figure 1
Figure 1. A cut of the phase diagram of the system Water/SDS/Dodecane/Pentanol with a constant water/SDS ratio of 1.55, Note the L, lamellar phase section.
W/S = 1,552
I A t f th h di f th t i

44
Chapter 3
Synthesis of PolyAcrylamide in Lamellar Phase Space
Abstract
Polymerization of acrylamide mononer in the liquid-crystalline region of a
water/SDS/dodecane/pentanol colloid was investigated. The initiation source for the free radical
polymerization was γ-radiation. The system was polymerized with 3% acrylamide monomer pre-mixed
into the water component of the multicomponent system. The system prior to and after polymerization
exhibited strong birefringent patterns confirming the integrity of the lamellar phase. The processes
yielded a polymer that after purification was clean white flaky granular polymer.
Introduction
In this chapter the synthesis of polyacrylamide in the lamellar phase is described. The literature on
polyacrylamide and their differences from linear polymers have been described exhaustively. Both PAM
as microgels and high molecular weight linear PAM can be made by the γ-ray initiated polymerization of
AM in inverse microemulsion formulations. Unlike conventional inverse emulsion polymerization (which
yield large micron sized particles having broad size distributions) inverse microemulsions are shown to
have smaller domain size and can exist in a variety of morphologies. In the following experiment, the
original monomer containing microemulsions and polymerized multi component systems are transparent
but do show evidence of its lamellar structure under polarized microscopy, the systems are stable and

45
show evidence of liquid crystalline behavior.
Experimental
Acrylamide (p = 1.12 g/cm3) (AM) (Electrophoresis grade, Sigma Aldrich Chemical Co.) was
recrystallized from anhydrous chloroform, dried under vacuum and kept under refrigeration. N,N'-
methylenebisacrylamide (p = 1.33 g/cm3) (BIS) (Sigma Chemical Co.) was used as received. Acetone
(Fisher Scientific), petroleum ether (bp 65-80 C) (Fluka Chemical), were all reagent grade materials and
used as supplied. Methanol (Fisher Scientific) was dried over molecular sieves (Davison Type A) for 48
hours and double distilled immediately prior to use. Distilled water was purified by a Mill-Q water
purification system (Millipore Corp.) (Conductance < 1 x 10⁻⁷ mhos/cm). Dodecane (p=0.87 g/cm3)
HPLC grade (Sigma Aldrich Chemical Co.) was used as received. SDS – Sodium Dodecyl Sulfate, (p =
l.ll g/cm3) (Fisher Scientific) was purified. The dried purified material was stored in vacuum desicator
over anhydrous CaS04.
Acrylamide monomer at the compositions were prepared to stratify the phase system previously
described. Identification of the individual species at various stages in the synthesis of polyacrylamide.
Multicomponent systems were prepared by dissolving carefully weighed quantities of water, dodecane,
pentanol, SDS and acrylic monomer. The acrylamide mononer was dissolved in deionized water (pH 7) or
a mixture of deionized water and added to the system. The components were added to a glass bottle of
100 mL sealed with flow control adapters fitted with rubber septa. The contents were mixed with a vortex
mixer to produce the final solutions. High purity nitrogen (HP Grade,Matheson Gas Products) was
bubbled through the system for 15 minutes to minimize solvent loss. The multi component systems in its
glass container (100 mL) with water (15°C) and the entire container promptly irradiated (Cs137 source,
600 rad/min) at room temperature. The total dose ranged from 3 to 20 krads depending upon the
composition of the initial microemulsions. The system was checked prior to radiation and after radiation
46
to confirm no phase separation and viewed under polarized microscope to re-confirm the lamellar phase
was stable.
Following the radiation initiation of the acrylamide in the multi component system – the
polyacrlyamide wash removed from the other components of the system and washed using the following
outlined steps for a washing the final polymer:
Step 1. Weight total amount T of emulsion mixture and put into a open
container.
Step 2. Add gently about same volume (T) of methanol onto the emulsion.
Do not disturb.
(Expect) phase separation, oil floating on top
(Avoid) large wax on top
Step 3. Take oil out of mixture. Small amount of methanol can be added to
get as much oil as possible. It is crucial step in whole washing procedure.
(Expect) Take out as least T/3 of oil.
(Avoid) Take out less than 30% of total weight.
Step 4. Wash the rest of the mixture with excessive volume of methanol.
Repeat the washing scheme at least four times. Use conductivity as an
indicator of the amount of SDS taken out by each wash.
(Expect) Resistance of washing fluids increases about 20 times each successive
wash.
Step 5. Stop when resistance of fluids is higher than 300 Kohms. Slowly
47
drain solvent. Let solutes dry over night.
(Expect) Solids sink at the bottom. Linear polymer has large grains than cross-
linked polymer.
(Avoid) Cloudy mixture drains out. Cloudy mixture which dissolves in water and
methanol contains oil, water and solutes, and will remarkably reduce yield.
Step 6. Take out dry solute. Residues can be dissolve into small amount of
water and drain out.
Note:
(Expect) Dry, flaky, clean solid contains mainly polymer.
(Avoid) Dissolving most solids in water. It is hard to recover polymer from aqueous
solution.
Results and Discussions
The composition for the system which yielded the greatest amount of polymer by weight percent was:
Water – 29.19%
Dodecane – 38.0%
Pentanol – 14.0%
SDS (Sodium Lauryl Sulfate) 18.81%
The maximum amount of monomer acrylic the water layer could hold was 3%, therefore each batch yield
of polymer before purification was 0.8757% of the total system. With this small yield many batches were
polymerized under identical conditions to yield enough polymer in order to completely characterize the
polyacrylamide that was produced in the lamellar region of the phase diagram. This process was repeated
using Bis-acrylamide monomer in order to crosslink the structure to aid in determining the polymer shape.
The yielding polymer after purifying was white, very clean, flaky and dry. The final polymer did dissolve
48
back into water with great ease and like all polyacrylamide did not dissolve in either dodecane, pentanol
or any combination of the two.
Conclusion
In making the polymer it is critical to use exceptionally clean, dry and highly pure components. The
multi component system shows great stability and the final product exhibited high purity. The use of a
high energy source and employing radiation as the initiator of the polymer process allows for fast free
radical polymerization. By simple visual polarized microscopy the lamellar structure is consistent in the
before polymerization as with the after polymerization.

49
Chapter 4
Small Angle Neutron Scattering of Lamellar Phase
in Multi Component Microemulsions
Abstract
Liquid crystals exhibit long range order: orientational and interpositional (spheres, lamellar, rods,
hexagonals and others). A series of small angele neutron scattering measurements are best to understand
the dimensional characteristcs of the water/SDS/dodecaane/pentanol system with polymer. By using
deuterated water as the aqueous component of the system the thickness of the lamellar repeat distance can
be measured. The thickness was studied for multicomponent systems containing – reacted linear poly
acrylamide, reacted crosslinked poly acrylamide and a stuffed lamellar with know linear polyacrylamide
standards. The measured thickness measured was the same for all systems; 7.391 nanometers. The
experiment also confirmed the polyacrylamide was housed in the water (deuterium) lamellar layer.
Introduction
Although the size of microemulsions, microlatexes, polymers and colloids can be determined by quasi-
elastic light scattering, certain information, namely the location of the individual components in
multicomponent systems, is only obtainable by small-angle neutron scattering (SANS). For this reason,
SANS is becoming an increasingly important technique for studying the structure of polymers and
polymeric colloids. Materials which have been investigated include polymers 237, 247, latexes 237, 240,
block copolymers 238 (micelles) and colloids with adsorbed polymeric layer 237. Numerous studies have
also been performed on both direct and inverse microemulsions 244, 245. SANS studies of inverse
microemulsions have shown that the systems consist of spherical droplets of water surrounded by a
monolayer of surfactant molecules dispersed in a continuous oil phase 93. Most microemulsion systems

50
containing equal parts of oil and water are believed to be bicontinuous. Huang and co-workers (94) have
studied the structure of dodecane/AOT/H20 systems, including their critical behavior. However, in these
systems the reverse micellar structure of the systems was preserved even at a 50 / 50 (wt. / wt.) oil / water
ratio. Candau et al. 239 investigated the effect of AM on a toluene / AOT / H20 microemulsion. In the
absence of AM, hard sphere behavior was observed. Addition of AM to the water swollen reverse
micelles caused an increase in the attractive force between droplets. This behavior was resulted in a
change in the scattering profiles from a peak (representing hard sphere repulsion) to a to linear profile
(indicating attractive interactions).
Among the first polymeric colloids to be studied by SANS were polystyrene and poly(methyl
methacrylate) latexes including particles to which polymers were adsorbed 237, 241. The structure of the
particle and adsorbed polymeric layer was observed by enhancing the contrast between the layers using
selective deuterated components. The theory of SANS from microemulsions and colloidal dispersions is
described in terms of an extension of light scattering theory. In SANS the incident neutrons behave as
waves and interact with and are scattered by atomic nuclei. The quantity analogous to the refractive index
gradient (dn/dc) in a light scattering experiment is the coherent scattering length, b. The scattering theory
of neutrons is the subject of many reviews (237, 244, 246). A brief summary of the basic principles and
application of SANS to the characterization of linear polymers, multi component systems and polymeric
colloids is presented in the following section.
Review of Neutron Scattering. In SANS246 experiments a sample is illuminated with a neutron beam of
intensity Ii and wave vector ki. The scattered wave vector is observed at an angle 20 with respect to the
incident beam. The change in the wave vector ki upon scattering from a particle is given by the scattering
vector Q,
Q = ki- ks
For elastic scattering, | ki | = | k | = 2 π/λ, where λ is the wavelength of the incident radiation, typically
on the order of several Angstroms. The magnitude of the scattering wavevector Q is given by
q=| Q |=4 π / λ sin (θ/2)

51
The scattering length, b, which provides a measure of the magnitude of interaction between the radiation
and the scatterer, are determined experimentally. Each isotope of an element has a different scattering
length. Values of scattering length for some nuclei common in polymers and surfactants are listed in
Table 6.1. The scattering lengths of hydrogen and deuterium are of opposite sign, a characteristic which
can be utilized to create contrast in multi component systems.
Scattering length densities for the various components of microlatexes can be calculated from
ρMolecule = ΣbiNA / Mv
where bi is the scattering length of the i-th nucleus, M is the molar mass, v is the specific volume and NA
is Avogadro's number. Scattering length densities can be calculated for the solvent, surfactant or
polymers. Calculated values for various molecular components of are listed in Table 6.2.
The size and shape of the particle can be obtained from analysis of the scattering
distribution with Q. The intensity of neutrons scattered from a collection of identical
spherical particles is given by
I(Q) = A (ρp− ρm )2 Vp2 NpP(Q)S(Q)
where Vp is the volume of the particle, Np the number of particles and ρp and ρm are the scattering length
densities of the particle and medium respectively. P(Q) is the form factor of a single particle and
S(Q) is the structure factor.
Under very dilute conditions the particles do not interact:
S(Q) = 1,
P(Q) is determined by particle geometry. For a sphere P(Q) is given by
P(Q) =[3(sinQR-QRcosQR)/(QR)3]2 (6-8)
The intensity, I(Q), of neutrons scattered by a system of monodispersed noninteracting spherical particles
is given by
I(Q) =A9 (ρp− ρm )2 Vp2 Np (sinQR - QR(cosQR)(/(Q3R3) (6-7)

52
At = 0 ( Q = 0 ), P(Q) = 1, and the above reduces to
I(Q) = (ρp− ρm )2 Vp2 Np
at QR < 1, where the polymeric colloids or polymer coils are well separated from each other the Guinier
approximation242 is valid and the size of the particles can be obtained from
I(Q) = I(0)exp(-Q2 RG2 /3)2 (6-9)
Under these conditions a plot of lnl(Q) versus Q2 is linear with a slope of - RG2 /3. The hard sphere radius
R can then be obtained from
R2 = 5/3 RG2
In the intermediate Q range, that is, for values of the scattering vector QRg > 1, information on the shape
and structure of the scatter object can be obtained 243. It is
possible to determine whether the particle is spherical, rod-like and if the scattering is from a fractal
object.
Measurements of the scattered intensity in the intermediate and high Q ranges provide information
about the shape of the particles and the conformation of chain segments at short distances. The exponents
are obtained directly from the power-law relationship
I(Q) = Q-a
The scattering from complex multicomponent systems like microemulsions (direct or inverse) or
microlatexes consists of the sum of contributions from all of the components. In order to investigate the
location and distribution of one of the components it is necessary to highlight the species so that its
contribution to the total scattering makes it dominate over all others. In polymers and colloids this can be
achieved by selective deuteration. The technique is known as contrast variation. Whenever a complex
scatterer like a microlatex consists of several components with scattering length densities of oil, alcohol,
surfactant or polyacrylamide it is possible to selectively highlight a part of particle by simultaneously
creating contrast in one component and annulling contrast between all others. This latter technique is
called contrast matching and has been widely used to study the structure of micelles, microemulsions and
polymer surfactant interactions. The desired average scattering length density can be achieved by mixing

53
isotopes in different proportions. The basic assumption of this technique is that the substitution of a
nucleus by one of its isotopes, for example replacing hydrogen (H) by deuterium (D) does not introduce a
significant perturbation in the molecule. Although the physical properties of deuterated compounds are
not identical to their protonated counterparts, the effects are usually negligible provided the region
investigated is not close to a phase boundary. Care must be taken not to introduce artifacts by labeling.
Isotope exchange must be considered especially in compounds where labile hydrogens are present such as
carboxylic acids and amides.
Experimental
Acrylamide,dodecane, pentanol, SDS_Sodium dodecylsulfate and deuterated water deuterium oxide
(D20) (99.8%) Cambridge Isotope Laboratories were used as received. Acrylamide (99.9%) and N.N-
methylenebisacrylamide (99.9%) both electrophoresis were used as received. Destilled deionized water
was from a Millipore MilliQ water purification system. Additionally, standards of pre-measured
molecular weight polyacrylamide were supplied from Sigma Aldrich.
Scattering experiments were performed on the 30 meter SANS spectrometer neutron facility at the
National Institute for Standards and Technology (N1ST) (Gaithersburg, MD). All experiments were
conducted at room temperature. Measurements were performed with X = 5 A (Δλ/λ = 0.14). Quartz
sample cells with 0.50 mm path lengths were used. Measurement time was on the order of hours for all
samples tested. Scattering length densities were calculated from the above questions. The net intensities
were converted to an absolute differential cross sections (cm-1) by comparison with precalibrated
secondary standards.
Samples for Small Angle Neutron Scattering were prepared as outlined in the Synthesis section:
Water – 29.19%
Dodecane – 38.0%
Pentanol – 14.0%
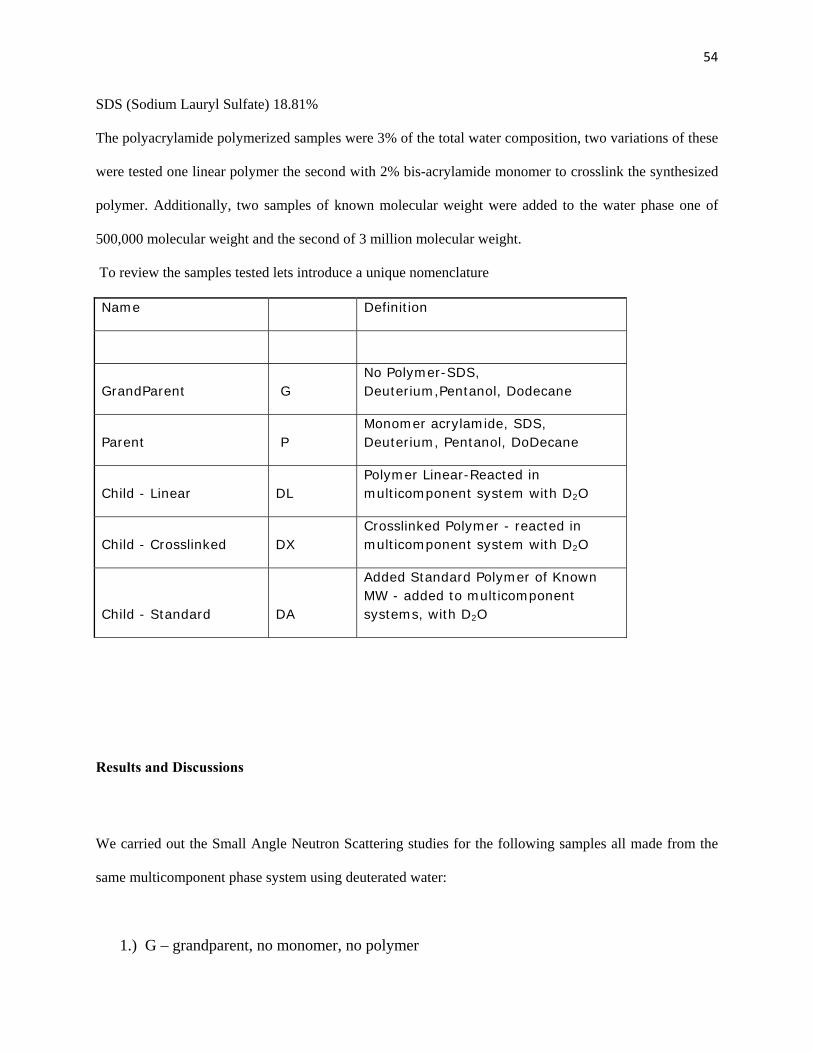
54
SDS (Sodium Lauryl Sulfate) 18.81%
The polyacrylamide polymerized samples were 3% of the total water composition, two variations of these
were tested one linear polymer the second with 2% bis-acrylamide monomer to crosslink the synthesized
polymer. Additionally, two samples of known molecular weight were added to the water phase one of
500,000 molecular weight and the second of 3 million molecular weight.
To review the samples tested lets introduce a unique nomenclature
Name Definition
GrandParent G No Polymer-SDS, Deuterium,Pentanol, Dodecane
Parent P Monomer acrylamide, SDS, Deuterium, Pentanol, DoDecane
Child - Linear DL Polymer Linear-Reacted in multicomponent system with D2O
Child - Crosslinked DX Crosslinked Polymer - reacted in multicomponent system with D2O
Child - Standard DA
Added Standard Polymer of Known MW - added to multicomponent systems, with D2O
Results and Discussions
We carried out the Small Angle Neutron Scattering studies for the following samples all made from the
same multicomponent phase system using deuterated water:
1.) G – grandparent, no monomer, no polymer

55
2.) P – parent – monomer acrylamide
3.) DL – daughter – polymerized acrylamide, no bis scrylamide
4.) DX – daughter crosslinked – polymerized, with bis acrylamide
5.) DA5 – daughter- added known linear PAM standard of 500,000 MW
6.) DA30 – daughter – added known linear PAM standard of 3,000,000 MW
We show in Figure 1, a typical scattering profile for scans of the first harmonic for oil component of 38%
where x=0.38 in the Lamellar Lα phase where the spacing of d=2π/qo yields a layer spacing of 7.391
nanometers.
It is interesting to observe that all the systems measured by small angle neutron scattering have a peak
at the same position and measure the same spacing. This data revealed the addition of monomer, polymer
or polymerizing within the system did not cause the lamellar layer to swell or contract.
Conclusions
We measured the thickness of the lamellar layer in a water, dodecane, pentanol, SDS system used to
polymerized acrylamide monomer using gamma radiation as an initiation source. In order to best
understand the resulting data a standard sample of no monomer was analyzed and two samples of known
monomer molecular weight were studies. When one may expect a swelling of the lamellar layer our
results show that the lamellar thickness is stable and remains at a constant layer thickness for all prepared
samples.
This unique finding expresses the energy distribution along the lamellar surface of the multi
component system. It shows the stability of the micro emulsion multi component system.

56
Figure 1
Figure 1. Intensity plotted vs Momentum Transfer q [A -1 ] from SANS, solid-grandparent, dashed parent, dotted LAM reacted, dash-dot XAM rated, (o) is standard 3.0MM MW, (+) is standard of 0.5 MM MW.
7n
SANS of microemulsion: 21 C
60 + Oi
i i i i i i I
50 -
1 A \
-
+ 1 V\40 - O /' A -
V,
30 • "-W kef id -
\ 'CK. h1 \420 -
^. ^^<OLC^^g35V> • %^^Htet
10
n i i i i i i i i
0.02 0.04 0.06 0.08 0.1 0.12 0.14 0.16 0.18 0.2
G (solid), P(dashed), DL (dotted), DX(dash-dot), DA30(o), DA5(+)

57
Chapter 5
Rheology of a Multicomponent Lamellar Systems
Abstract
To better understand the stability of colloids in a flow field a series of rheological measures were
performed on the multicomponent systems. The tests reveal shearing thinning behavior for the systems of
– polyacrylamide in water, reacted systems of acrylamide within the lamellar layer of the system. The
high molecular weight standards of linear polyacrlyamide in the system show a unique shear thickening
pattern forming a distinct yield viscosity at a defined shear rate. This data shows the inter and intra
relationship of the actual colloidal cells and the interaction of polyacrylamide within the system.
Introduction
At one time or another, virtually everyone who has tried to synthesize, fabricate or utilize polymeric
materials has encountered the peculiar flow properties of polymeric complex fluids. Depending on the
nature of the encounter, it may have been intellectually challenging or totally frustrating. This holds true
to describe the relationship between a polymer and a complex multi component micro emulsion colloidal
system. The study of the flow properties of polymer liquids in complex polymer fluids is an extremely
incisive tool in elucidating various levels of system structure. By the same token, accurate description,
measurement, and classification of the flow behavior of complex polymer fluids is directly useful in
polymer processing and has been a tremendous stimulus to the science of rheology.
Experimental
The samples studied for rheological shear characteristics are the same as previous reviewed in Small
Angel Neutron Scattering:

58
1. G – grandparent, no monomer, no polymer
2. P – parent – monomer acrylamide
3. DL – daughter – polymerized acrylamide, no bis scrylamide
4. DX – daughter crosslinked – polymerized, with bis acrylamide
5. DA5 – daughter- added known linear PAM standard of 500,000 MW
6. DA30 – daughter – added known linear PAM standard of 3,000,000 MW
7. Water and Linear Polyacrylamide standard of 3 million MW
Procedure. All measurements were made with a Bohlin VOR Melt Rheometer (Bohlin Rheologi, Inc.).
Steady shear experiments were conducted with a concentric cylinder geometry C25 (cup diameter 27.5
mm, bob diameter 25 mm, bob height 37.5, depth 12.4 mm, cone angle 150°). A sample volume of 13 mL
was required. Torsion bars were selected according to sample requirements. Oscillatory measurements on
bulk gel disks were made using the parallel plate PP15 (plate diameter 15 mm) geometry at strain
amplitude of 5 % over the frequency range 10 to 100 s"1. All measurements were made at 25°C. Data
analyses were performed by standard techniques using the VOR-M (Bohlin Rheologi, Inc.) series
software.
Results and discussions
Figures 1 – 7 show individual flow curves of the rheology of the defined system. Subjecting the
system to a high shear force and studying the viscosity curve reveals an interesting result that can help
explain the extent of the polymer and its behavior in the lamellar phase of the multicomponent system.
Figure 1 – 3% Polymer (Polyacrylamide and water), this is to show a standard and confirms a simple

59
shear thinning flow behavior of a dilute water soluble polymer under shear stress.
Figure 2- The Grandparent system – the multi component system with NO polymer and No monomer,
just a system of Water, SDS, Dodecane, and pentanol.
Figure 3 – The Daughter, DL – polymerized system linear polyacrylamide from our radiation initiation
technique.
Figure 4 – The daughter Crosslinked , DX – Polymerized with bis- acrylamide mononer,
Figure 5 – The daughter, DA5 – the system with added polyacrylamide of 500000 moleculare weight.
Figure 6 – the daughter DA30 – the system with added polyacrylamide of 3 million moleculare weight.
After careful review, you can determine from Figure 1 and 2 that the system behaves as one would expect
in a normal shearing thinning pattern of flow behavior. In Figures 2 through 4 a similar pattern of shear
thinning is shown for multi component system without polymer, with reacted linear polymer and with
reacted crosslinked polymer. The interesting effect is relieved in Figures 5 and 6, as it becomes evident
from these rheological flow curves that adding a high molecular weight linear polyacrylamide standard to
the multicomponent system exhibited a sharp yield viscosity, and at a critical shear a rapid drop in the
viscosity of the system.
Conclusions
The rheology data shows a very important characteristic of the lamellar structure and its relationship with
the soluble polyacrylamide.
In the reacted polymer systems, either linear or crosslinked, it becomes evident the polymer is housed
within the lamellar as an inter-lamellar polymer, nested comfortably in the water layer of the system with
the lamellar.
In the systems with the standards of linear polyacrylamide of known high molecular weight the
polymer exhibits an intra lamellar diffusion, seeking a higher entropy arrangement finding the water
layers in a multiple of random adjacent liquid crystals. This is exhibited by the sharp yield viscosity in

60
Figures 5 and 6.

61
Figure 1
Figure 1. Flow Curve for Water and Polyacrylamide.
10' -i
io3-
mex
210^-
101
-"___J„„L„ J-J. J:
-r--i
-J.--_^._»J_-L-J»J_J.t
TtHtttt
ROLHl.RSD
nmmrrm^mmvmm*
------------1---------1------1----1 | | | | |--------------|--------1------1-----1 I | | | |--------------1---------1------1----1 || I I |--------------1--------1-----1----1 I I I I |10"1 10° 101 102 IO3
r El's] ~

62
Figure 2
Figure 2. Flow Curve for Systems containing, Water/SDS/Dodecane/Pentanol.
n. C
mPas
]
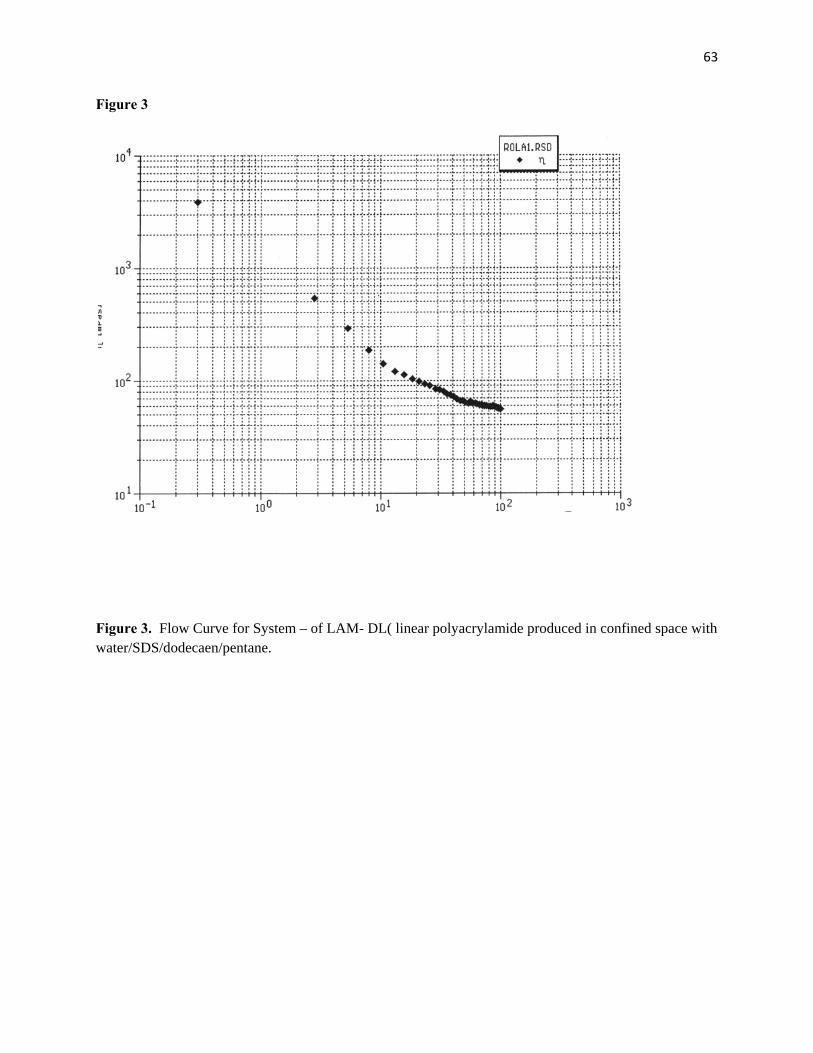
63
Figure 3
Figure 3. Flow Curve for System – of LAM- DL( linear polyacrylamide produced in confined space with water/SDS/dodecaen/pentane.
CD
a.£
v—4
<n
_i
CD
a.
1-"V
TV
"TV
» - - " v
• i-----1vr
"IT
•-i-r
•vr
-v*r
r-----r-
r---r-
r"--r-
ro
r2
.....J.........J_ o
i i i i i—i-----1-------1------------1 i i i i i—i-----1-------1------------1 I i i i i—i-----1-------r00 CM
D CD CD
CM
CD
. CD
ICD
[seuui]"U
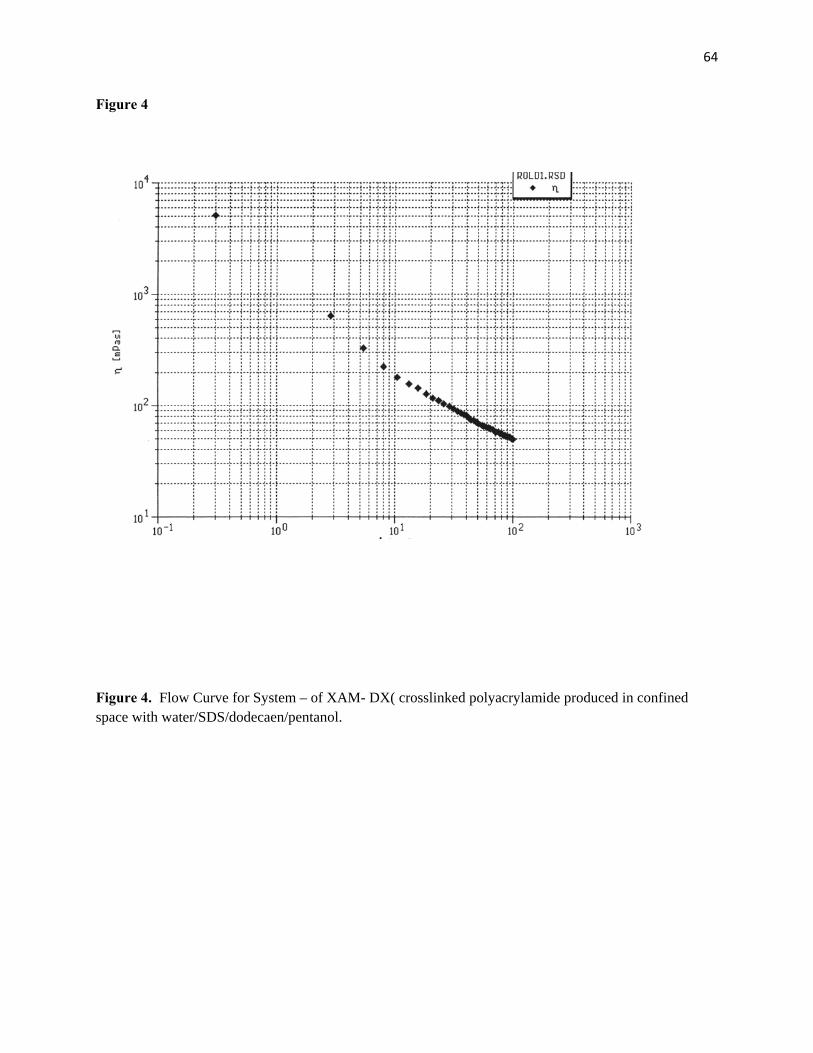
64
Figure 4
Figure 4. Flow Curve for System – of XAM- DX( crosslinked polyacrylamide produced in confined space with water/SDS/dodecaen/pentanol.
ioS
103
nj
£
2NT'
10'
-r- v
-f" V
-J--------- ------J._L_J. J. 4-1..........'--------------J---------'------J--1- J.
IT -
IT-
«___J. _L _ _»._".
R0LD1.RSD
n.mwnHPnH
.J_.-I.__L.J.
1-------1-----1 I I 1 I I-----------------1----------1-------1-----1 I I I I I-----------------1----------1-------1-----1 I I I I I-----------------1----------1------1-----1 I I I I_j-----------------,----------,-------1—| | | | | [-----------------(----------1-------1—| | | | | [10""1 10° 101 102 103

65
Figure 5
Figure 5. Flow Curve for System – of DA5 (standard polyacrylamide of 500,000 MW with water/SDS/dodecaen/pentanol.
ioS
310 J
ex
W2-.
10»
r-v
.L.J
R0LF1.RSD
n.wmmmimmmmmt
.?.****?
:
----------1--------1-----1—I I Ml |-------------1--------1-----1—i I I I I |-------------1--------1-----1—I I I II |-------------1-------1-----1—I I I I I |10"1 10° 101 102 103
r LVs]
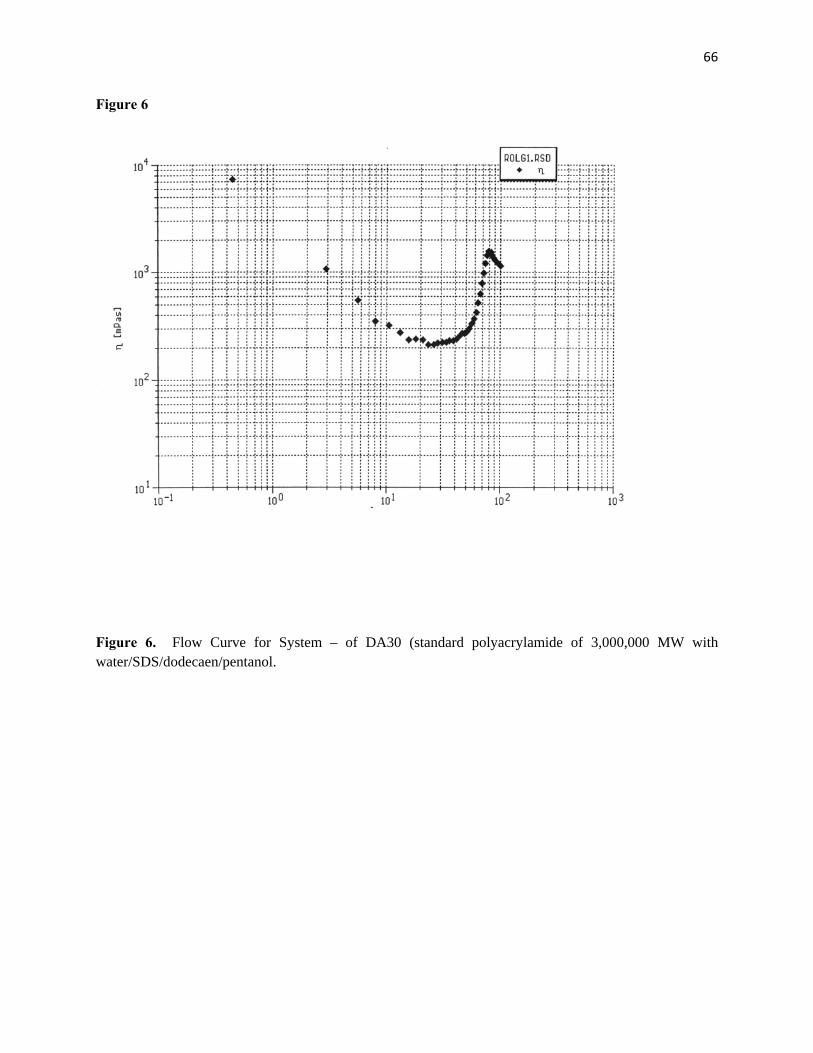
66
Figure 6
Figure 6. Flow Curve for System – of DA30 (standard polyacrylamide of 3,000,000 MW with water/SDS/dodecaen/pentanol.
ioS
103
ft)
ex
ia2-.
10' -----------1--------1-----1—| | l.....I I |-------------1-------1-----1—II I l I |-------------1-------1-----1—I l I t l|-------------1--------1—l—li II I |10"1 10° ( 101 102 103Y Cl/s]
67
Chapter 6
Characterization of PolyAcrylamide Produced in Confined Lamellar Phase
To best understand the structure of the polyacrylamide produced in the confines of a water phase
lamellar space locked with in a colloid using a gamma energy radiation source to initiate the fee radical
polymerization, we must measure its size after we extract the polymer from the multi component system.
In order to measure the polymer size dynamic light scattering will be used.
Elastic light scattering (also called Raleigh scattering) occurs when the scattered light has the same
frequency as the incident light. Light scattered from large particles such as micron sized emulsion
droplets or latex particles can be observed visually and is called the Tyndall effect. The appearance of a
liquid-liquid or colloidal dispersion is controlled by particle size and differences in the refractive index of
the phases or particles and solvent respectively.
The Rayleigh ratio Rθ is defined as
Rθ= ir2 / IoV
The Rayleigh ratio for polarized light at
ΔRθ=Rθσουτιον - Rθ
solvent
The quantity called the refractive index, cm3/g increment at infinite dilution is a constant for a given
polymer, solvent and temperature. The value the refractive index is obtained experimentally using a
differential refractometer. Equations form the basis for evaluating the second virial coefficient A2 weight
average molecular weight Mw and the radius of gyration Rq can all be found from this data using a
technique developed by Zimm and referred to as a Zimm Plott or Zimm Method.
The intensity of light scattered from a polymer solution or a dispersion of colloidal particles fluctuates

68
with time. The fluctuations are a consequence of the Brownian motion of the macromolecules or colloidal
particles. The technique called quasi-elastic light scattering (QELS) is also known as dynamic light
scattering (DLS) or photon correlation spectroscopy (PCS).
The technique provides information about the Brownian motion in a sample by analyzing fluctuations
of the scattered light intensity. There is a continual fluctuation in the amount of polymer (colloid) due to
its migration by Brownian motion inside and outside the control volume. The Brownian motion of the
molecule is a diffusion process, (it increases and decreases in intensity) because of the diffusion of
species into or out of the control volume. Thus the rate of intensity increase (or decrease) within this
fluctuating intensity is a measure of molecular diffusion. The autocorrelation function of the scattered
intensity as a function of time is known from experimental data. Then by applying the Stokes-Einstein
relationship a diffusion coefficient can be determined.
The most widely application is to the determination of particle size. The technique has been used to
measure the size of polymer coils, micelles and colloidal particles (latexes).
Experimental
Static and quasi-elastic light scattering measurements were conducted with a Brookhaven Instruments
BI-200S Goniometer and BI-2030AT correlator. Corp. photon correlation spectrometer was conducted
with a BI-2030 digital correlator and a Spectra Physics 120 helium/neon laser (\=632.8 nm). The
instrument is located in the laboratory of Dr. John S. Huang, EXXON Research and Engineering Co. The
light source was a spectra physics Model laser operating at 6322 A. Static intensities were measured over
the range of 30 to 140 degrees . All measurements were made at 25°C. The refractive index increment
dn/dc was measured on a CHROMATIX differential refractomer yielding values of 0.209 cm3/g.
Prior to light scattering measurements, the final polyacrlyamide wash form was removed from the
other components of the system and washed using the following outlined steps for a washing the final
polymer:

69
Step 1. Weight total amount T of emulsion mixture and put into an open container.
Step 2. Add gently about same volume (T) of methanol onto the emulsion.
Do not disturb.
(Expect) phase separation, oil floating on top
(Avoid) large wax on top
Step 3. Take oil out of mixture. Small amount of methanol can be added to
get as much oil as possible. It is crucial step in whole washing procedure.
(Expect) Take out as least T/3 of oil.
(Avoid) Take out less than 30% of total weight.
Step 4. Wash the rest of the mixture with excessive volume of methanol.
Repeat the washing scheme at least four times. Use conductivity as an
indicator of the amount of SDS taken out by each wash.
(Expect) Resistance of washing fluids increases about 20 times each successive
wash.
Step 5. Stop when resistance of fluids is higher than 300 Kohms. Slowly
drain solvent. Let solutes dry over night.
(Expect) Solids sink at the bottom. Linear polymer has large grains than cross-
linked polymer.
(Avoid) Cloudy mixture drains out. Cloudy mixture which dissolves in water and
methanol contains oil, water and solutes, and will remarkably reduce yield.

70
Step 6. Take out dry solute. Residues can be dissolved into small amount of
water and drained out.
Once the polymer is cleaned and dried it can be weighted and the testing samples can produced to
perform the light scattering measurements.
Results and Discussions
The Polymer produced in the lamellar phase of the system was purified and measured for its Molecular
weight, (MW), Radius of Gyrations Rg Hydrodynamic Radius Rh Weight average Molecular weight M
and its Number average Molecular Weight.
MW Rg Rh Rg/Rh MWW MWn
LightScattering
DL 169000 33.0nm 19.1nm 1.72775
DX 232000 46.9nm 21.15nm 2.21749 217989 192674
In the above chart DL – is for linear polymer produced in the lamellar region,
DX is for the crosslinked polymer produced in the lamellar region.
These samples could not be studies by neutron scattering since the neutron detector has a wavelength of 5
Angstroms, and the Rg of the produced samples are far too large 330 Angstroms and 469 Angstroms
respectfully.

71
Conclusions
To study the morphology of any polymer it is critical to examine its size and dimensions. The use of light
scattering experiments has been successfully carried out to determine the molecular weight, radius of
gyration, hydrodynamic radius. The molecular weight distribution was measured using HPLC. The ratio
of Rg/Rh is for linear case 1.72775 and for the crosslinked case 2.21749. A more revealing result is the
narrow molecular weight distribution of the crosslinked system; this narrow distribution confirms many
similar sized polymers produced by the reaction in confined space yielding a specific consistent size and
shape of the final polymer.

72
Chapter 7
Conclusions
The polymerization of polyacrylamide in the confined lamellar space of the colloidal system of
components water/SDS/dodecane/pentanol was synthesized and studies. Using gamma radiation as an
initiator the final polymer yielded for the linear polyacrylamide case a molecular weight of 169,000 and
for the crosslinked polymer a molecular weight of 232,000. For the crosslinked polymer data showed a
narrow molecular weight distributionwith a ratio of Rg/Rh of 2.21749. The linear polymer had an Rg/Rh
of 1.72775.
The polymer induced multicomponent colloid showed some interesting results. The multi component
remained stable with the introduction of acrylamide monomer, and was able to react into a high polymer
within such a confined system.
The lamellar consistency in layer thickness exhibited no swelling behavior, the lamellar thickness was
consistent with monomer, polymer, and adding a known polymer. This displays the tremendous energy
effect of the system’s surfaces. Linear polyacrylamide would normally search for a large random coil
dispersion effect representing its entropy. The multicomponent system had a large enough enthalpic
energy effect to contain the polymer molecular within the water section of the system That water
component was confirmed to be totally in the lamellar phase.
The effect of shear on the polymer colloidal system showed for the synthesized polymer a normal
shear thinning flow curve. This data suggest the polymer must be integral to the lamellar and flows in the
confined water layer of the lamellar with in the structure. The added linear polyacrylamde standards are
of higher molecular weight and show an intra-lamellar effect. This system reveals that the polymer seeks
water layers from adjacent water cell in random lamellar spacing. It was shown that at higher shear rates
the system has a yield viscosity and its viscosity sharply breaks down.

73
This polymer shows potential commercial usage in the area of enhanced oil recovery in allowing the
drastic viscosity changes while removing oil from coal shale.
74
References
1. Barrall, E. M. and Johnson, J. F. J. Macromol. Sci., Rev. Macromol. Chem. (C) 1979, 17(1), 137. 2. Blumstein, A. (Ed.), 'Liquid Crystalline Order in Polymers', Academic Press, New York, 1978. 3. Blumstein, A., Clough, S. B., Patel, L., Blumstein, R. B. and Hsu, E. C. Macromolecules 1976, 9, 243. 4. Finkelmann, H., Happ, M., Portugal, M. and Ringsdorf. H. Makromol. Chem. 1978, 179, 2541. 5. Finkelmann. H., Koldehoff. J. and Ringsdorf, H. Angew. Chem. 1978, 90, 992. 6. Herz, J., Reiss-Husson. F., Rempp, P. and Luzatti, V. J. Polvm.Sci. 1963,4, 1275. 7. Finberg, S. E., Thundatil, R. and Staffer, J. O. Science 1979. 205, 607. 8. Thundatil, R., Staffer, J. O. and Friberg, S. E. J. Polvm. Sci.. Polym. Chem. Edn. 1980, 18. 2629. 9. Tsutui, T. and Tanaka, T. J. Polvm. Sci., Polvm. Lett. Edn. 1977, 15, 475. 10 . Holtzscherer, C, Durand. J. P. and Candau, F. Colloid Polvm.Sci. 1987, 265, 1067. 11. Holtzscherer, C. and Candau. F. Colloids Surf. 1988. 29, 411. 12. Holtzscherer, C. and Candau. F. ./. Colloid Interface Sci. 1988. 125. 97. 13. See, for example. Bellocq, A. M., Biais, J., Bothorel. P., Clin, B., ., Lalanne, P., Lemaire, B., Lemanceau, B. and Roux, D. Adv. Colloid Interface Sci. 1984, 20, 167. 14. Ruckenstein, E., & Chi, J., J. Chem. Soc, Faraday Trans. II, 1975,71, 1690-707.
15. Simister, E.A., et al, J. Phys. Chem., 1992, 96,1383-8 3 Aveyard, R., Binks, B.P., & Mead, J., J. Chem. Soc, Faraday Trans. I, 1987,83,2347-57. 16. Aveyard, R., Binks, B.P., Clark, S., & Mead, J., ibid 1986,82,125-42. 17. Aveyard, R., Binks, B.P., & Mead, J., J. Chem. Soc, Faraday Trans. I, 1987,83,2342-57. 18. Winsor, P.A., 'Solvent properties of amphiphilic compounds', London: Butterworths, 1954 6 Aveyard, R., Binks, B.P., Lawless, T.A., & Mead, J., Can. J. Chem., 1988, 66,3031-7. 19. Israelachvili, J.N., Mitchell, D.J., & Ninham, B.W., /. Chem. Soc, Faraday Trans. II, 1976, 72,1525-68.
75
20. Aveyard, R., Binks, B.P., & Mead, J., J. Chem. Soc, Faraday Trans. I, 1986,82,1755-70 21. Abillon, 0., Binks, B.P., Otero, C, Langevin, D., & Ober, R., /. Phys. Chem., 1988,92,4411-16. 22. de Gennes, P.G., & Taupin, C, ibid, 1982, 81,2294-304. 23. Helfrich, W., Z. Naturforsch, 1973,28c, 693-703. 24. Binks, B.P., Meunier, J., & Langevin, D., Progr. Colloid Polym. Sci., 1989,79,208-13. 25. Scriven, L.E., Nature, 1976,263, 123-5 . 26. Talmon, Y., & Prager, S., J. Chem. Phys., 1978, 69, 2984-91. 27. Gazeau, D., Bellocq, A.M., Roux, D., & Zemb, T., Europhys. Lett., 1989, 9,447-52. 28. Jahn, W., & Strey, R., /. Phys. Chem., 1988,92, 2294-301. 29. Strey, R., Jahn, W., Porte, G., & Bassereau, P., Langmuir, 1990,6,1635- 39. 30. Meunier, J., /. Physique Lett., 1985, 46, L-1005-14. 31. Binks, B.P., Meunier, J., Abillon, O., & Langevin, D., Langmuir, 1989,5, 415-21. 32. Meunier, J., & Binks, B.P., Progr. Colloid Polym. Sci., 1989, 79,178-83. 33. Mukherjee, S., Miller, C.A., & Fort, T., /. Colloid Interface Sci., 1983, 91,223-43. 34. Binks, B.P., Kellay, H., & Meunier, J., Europhys. Lett., 1991,16,53-8. 35. Szleifer, I., Kramer, D., Ben-Shaul, I., Gelbart, W.M., & Safran, S.A., /. Chem. Phys., 1990,92,6800-17. 36. Kellay, H., Meunier J., & Binks, B.P., Phys. Rev. Lett., 1993,70,1485-8. 37. Aveyard, R., Binks, B.P., Lawless, T.A., & Mead, J., /. Chem. Soc, Faraday Trans. 1,1985,81,2155-68. 38. Binks, B.P., Fletcher, P.D.I., & Horsup, D.I., Colloids & Surfaces, 1991, 61,291-315. 39. Binks, B.P., Langmuir, 1993,9,25-8. 40. Shinoda, K, & Friberg, S., 'Emulsions & solubilisation', New York: Wiley, 1986.
76
41. P. Ekwall, in Advances in Liquid Crystals, G. M. Brown, ed. (Academic Press, New York, 1975). 42. G. S. Smith, E. B. Sirota, C. R. Safinya and N. A. Clark, Phys.Rev. Lett. 60, 813 (1988); b) G. S. Smith, E. B. Sirota, C. R. Safinya, R. J. Piano and N. A. Clark, J. Chem. Phys. 92, 4519 (1990). 43. P.-G. de Gennes, The Physics of Liquid Crystals (Clarendon, Oxford, 1974). 44. F. Candau and J.~C. Wittmann, Mol. Cryst. Liq. Cryst. 56, 171 (1980); b) W. J. Benton and C. A. Miller, J. Phys. Chem. 87, 4981 (1983); c) M. Dvolaitzky, R. Ober, J. Billard, C. Taupin, J. Charvolin and Y. Hendrikx, C. R. Hebd. Acad. Sci. 1145, 295 (1981); d) A.-M. Bellocq and D. Roux, Microemulsions: Stucture and Dynamics, S. Friberg and P. Bothorel, eds. (CRC Press, Boca Raton, 1986); e) J.- M. Di Meglio, M. Dvolaitzky and C. Taupin, J. Phys. Chem. 89, 871 (1985). 45. F. Larche, J. Appell, G. Porte, P. Bassereau and J . Marignan, Phys. Rev. Lett. 56, 1700 (1985). 46. R. Strey, R. Schomacker, D. Roux, F. Nallet and U. Olsson, J. Chem. Soc. Faraday Trans. 86, 2253 (1990). 47. N. Satoh and K. Tsujii, J. Phys. Chem. 91, 6629 (1987); b)*C. Thunig, H. Hoffmann and G. Platz, Progr. Colloid Polym. Sci. 79, 297 (1989). 48. P. Pieranski, Contemp. Phys. 24, 25 (1983). 49. D. R. Nelson, in Statistical Mechanics of Surf aces and Membranes, D. R. Nelson, T. Piran and S. Weinberg, eds. (World Scientific, 1989); b) F. David, ibid.; c) S. Leibler, ibid.; d) R. Lipowsky, in Random Fluctuations and Pattern Growth: Experiments and Models, H. E. Stanley and N. Ostrowsky, eds. (Kluwer Academic Publishers, Dordrecht, Boston and London, 1988); e) L. Peliti, ibid.; f) D. Roux, ibid.; h) F. Pincus, in Phase Transitions in Soft Condensed Matter,T. Riste and D. Sherrington, eds. (Plenum Press, New York and Lon¬ don, 1989); i) C. R. Safinya, ibid.; j) M. E. Cates, ibid.. 50. S. J. Singer and G. L. Nicolson, Science 175, 720 (1972). 51. V. Luzzati, in Biological Membranes, D. Chapman, ed. (Academic Press, London and New York, 1968). 52. P.-G. de Gennes and C. Taupin, J. Phys. Chem. 86, 2294 (1982)
53. Clark and A.-M. Bellocq, Phys. Rev. Lett. 57, 2718 (1986).
54. G. Porte, R. Gomati, O. El Haitamy, J. Appell and J . Marignan, J. Phys. Chem. 90, 5746 (1986). 55. P. Bassereau, J. Marignan and G. Porte, J. de Physique 48, 673 (1987).

77
56. D Roux and C. R. Safinya, J. de Physique 49, 307 (1988). 57. W. Helfrich, Z. Naturforsch 33a, 305 (1978). 58. D. Roux and A.-M. Bellocq, in Physics of Amphiphiles: Micelles, Vesicles and Microemulsions, V. Degiorgio and M. Corti, eds. (North-Holland, Amsterdam, 1985). 59. G. Guerin and A.-M. Bellocq, J. Phys. Chem. 92, 2550 (1988). 60. C. R.Safinya, E. Sirota, D. Roux and G. S. Smith, Phys. Rev. Lett. 62, 1134 (1989). 61. W. Helfrich and R. M. Servuss, II Nuovo Cimento 3, 137 (1984).


![Combined with Hydrophilic Alcohol Ethoxylates Fuel ...cerol esters and the different kinds of sugar surfactants.[8,9] In order to reduce the amount of surfactant needed to formulate](https://img.pdfslide.us/doc/110x75/6107aea7ef110302d66255ec/combined-with-hydrophilic-alcohol-ethoxylates-fuel-cerol-esters-and-the-different.jpg)


![Structural Modifications of Surfactant-Assisted Alumina ...€¦ · Moreover, the surfactants [17] have an amphiphilic nature, they contain both hydrophilic and oleophilic ends in](https://img.pdfslide.us/doc/110x75/604258cc55629d5f807f16d4/structural-modifications-of-surfactant-assisted-alumina-moreover-the-surfactants.jpg)