Embed Size (px)
Citation preview
Thesis for the Degree of Master in Science with a major in Textile Engineering
The Swedish School of Textiles 2020-09-04 Report no. 2020.14.09
Polymer rejuvenation of PET
textile waste
Sabrina Kopf
ii
ABSTRACT
Thermomechanical recycling of polyethylene terephthalate (PET) typically includes
a decrease in the polymer´s intrinsic viscosity and therefore a reduction of the
molecular weight. Consequently, thermomechanical recycling is usually a
downcycling of the product. However current methods to increase the molecular
weight such as solid-state polymerization or the usage of chain extenders are time
consuming or introduce foreign molecules into the PET´s molecular chain. Thus, the
aim of this work was to try to increase the molecular weight in the molten state in an
extruder, to decrease the processing times. The processing times are reduced
compared to the solid-state polymerization because in the molten state the movability
of the polymer chain is increased. Moreover, no supplementary substances are added
for the processing so that no foreign structures are introduced during reprocessing.
Virgin PET pellets were extruded at 285°C, 290°C and 295°C set temperature and
2rpm, 4rpm, and 7rpm screw rotation rate. Afterwards the PET´s properties were
investigated by measuring their intrinsic viscosities, conducting a 1H NMR and a
DSC measurement. Additionally, pre-experiments were conducted to explore the
possibilities of feeding industrial scrap polyester fabrics into the extruder.
The polymer characterization showed that the intrinsic viscosity and therefore the
molecular weight of the processed samples decreased with the parameters chosen for
this experiment. Samples processed at 285°C and 7 rpm showed in the average the
highest intrinsic viscosities and therefore the highest molecular weight of all
processed samples. Additionally, the results of the 1H NMR and the DSC indicated
degradation reactions such as thermal degradation and hydrolysis. Thus, further
research is necessary to find an easily accessible recycling method for polyester
textiles and reduce the amount of polyester textile waste. However, it is possible to
feed long textile stripes into the twin screw extruder and reprocess it to a strand
which is an important step for further recycling.
iii
POPULAR ABSTRACT
Polyester fibres consist of polyethylene terephthalate (PET) and have extraordinary
materials properties. Therefore, they are broadly used in the textile industry. PET is
not degradable under normal environmental conditions so that textiles discarded on
landfills cause land pollution. However, PET is a thermoplastic material, thus it can
be melted and reshaped into another product. Thermomechanical recycling comes
along with one problem, the reprocessing und heat and shear forces additionally
shortens the molecular chains of the PET. The reduction of the polymer chain leads
to inferior material properties so that it is usually not possible to use the recycled
material for the same applications than virgin material. Therefore, it was tired in this
thesis to recouple the polymer chains in the molten state, in common plastic
processing machines without the usage of additional chemicals.
The polymer processing machine used for this work is a twin screw extruder which
is a heated, horizontal barrel with two rotating screws inside. The machine
continuously melts the PET and conveys the molten plastic outside in form of a
strand. The strand is usually solidified in a water bath and led to a granulator where
it is chopped in small granulates that can be used for the processing of the intended
product. While the PET is molten in the extruder it is tried to facilitate chain coupling
reactions as longer chains increase the material properties which is necessary for a
product to product recycling. The experiments tried to identify the right temperatures
and screw rotation rates of the machine. The screw rotation determines the residence
time of the PET in the machine and therefore one influencing factor if a chain
coupling or scission reaction occur. The temperature is also important as high
temperatures can lead to chain scissions. After reprocessing in the extruder, the PET
was characterized to see if the length of the molecular chains increased. An
additional pre-experiment is conducted to investigate whether it is possible to feed
polyester fabrics into an extruder as most of the polyester fibres are used in fabrics.
The characterization of the processed PET showed that the length of the PET chain
could not be increased so that a product to product recycling is not feasible yet and
future research is necessary to develop this method and enable a more environmental
friendly recycling of PET textiles. Albeit it is not possible yet to facilitate chain
growing reactions in an extruder, polyester fabrics can be fed into the machine,
which is also an important step for the later recycling.
iv
ACKNOWLEDGEMENTS
At first, I want to thank my two supervisors Anders Persson and Amrei Becker for
initiating the topic and the collaboration of the Swedish School of Textiles and the
Institut für Textiltechnik (ITA) of the RWTH Aachen University. I very much
appreciated that Anders took the risk of handling the chemicals of the intrinsic
viscosity measurements for me and Amrei patiently helped me to overcome the
troubles during the experimental phase. Additionally, I want to thank my examiner
Prof. Mikael Skrifvars for encouraging me to complete this work after my computer
got stolen and I lost many parts of my work. Also, I am extremely grateful that Prof.
Luisa Medina and Prof. Jens Schuster of the University of Applied Sciences
Kaiserslautern enabled me to use their lab equipment for the polymer
characterization and the extrusion of textiles. So that I could continue my work
during the lockdown due to the Corona crisis. I would like to extend my sincere
thanks to David Müller and Jürgen Dully for their valuable practical support and
discussions about polymer processing and extrusion. Special thanks to Eva
Bäckström and Karin Odelius at the Royal Institute of Technology, Department of
Fiber and Polymertechnology for giving me an introduction and conducting the
NMR measurements.
I also had great pleasure working with the lab technicians Ville Skrifvars and Jonas
Hansson of the Polymer lab, Department of Resource Recovery and Building
Technology at the University of Borås and the lab technicians of ITA. All of them
supported me with helpful advices and practical suggestions.
Additionally, I would like to acknowledge Karl Otto Braun GmbH for providing
industrial scrap textiles and I would like to thank Textile & Fashion 2030 and
Erasmus + for the financial support of this thesis.
Last but not least I want to thank my parents for enabling me to study in Sweden,
always believing in me and endure all my positive and negative moods throughout
this thesis. Furthermore, I want to thank all my friends for almost endless discussions
about the thesis and the collectively activities to cheer each other up.
Sabrina Kopf
v
TABLE OF CONTENTS
Abstract ................................................................................................................. ii
Popular Abstract................................................................................................... iii
Acknowledgements .............................................................................................. iv
List of abbreviations .......................................................................................... viii
1. Introduction ................................................................................................... 10
1.1 Recycling of PET .......................................................................................... 12
1.2 Common thermomechanical recycling methods to increase the molecular
weight of PET ..................................................................................................... 14
1.3 Scope and research question ......................................................................... 15
2. Literature review .......................................................................................... 16
2.1 Poly (ethylene terephthalate) ........................................................................ 16
2.2 Molecular weight .......................................................................................... 17
2.3 Determination of the molecular weight/ intrinsic viscosity .......................... 18
2.3.1 Influence of the molecular weight on polymer properties ..................... 20
2.4 Polymer ageing ............................................................................................. 21
2.5 Polymer rejuvenation .................................................................................... 23
2.6 Prerequisites for the recycling of PET .......................................................... 24
2.7 Contaminations ............................................................................................. 25
2.8 Thermomechanical polymer recycling in the industry .................................. 27
2.9 Extrusion ....................................................................................................... 30
2.9.1 Feeding ................................................................................................... 30
2.9.2 Temperature settings .............................................................................. 30
2.9.3 Screw rotation rate ................................................................................. 31
2.9.4 Screws of parallel twin screw extruder .................................................. 31
2.9.5 Devolatilization ...................................................................................... 32
2.9.6 Die pressure ........................................................................................... 32
2.10 Problem description .................................................................................... 32
2.11 Limitations .................................................................................................. 33
3. Materials and Methods ................................................................................. 33
3.1 Materials ....................................................................................................... 33
3.1.1 Drying of the material ............................................................................ 34
3.2 Extrusion ....................................................................................................... 34
3.2.1 Feeding ................................................................................................... 35
3.2.2 Temperature Settings ............................................................................. 35
3.2.3 Screw rotation rate ................................................................................. 36
vi
3.2.4 Parallel twin-screw extruders - Screws .................................................. 37
3.2.5 Devolatilization ...................................................................................... 38
3.3 Polymer characterization .............................................................................. 38
3.3.1 Molecular weight/Intrinsic viscosity ...................................................... 38
3.3.2 Statistical analysis of the intrinsic viscosity ........................................... 39
3.3.3 Nuclear magnetic resonance (1H NMR) ................................................ 40
3.3.4 Differential scanning calorimetry (DSC) ............................................... 41
3.4 Pre-Experiment for the feeding of textiles .................................................... 42
4. Results ............................................................................................................ 43
4.1 Extrusion ....................................................................................................... 43
4.1.1 Feeding of PET pellets ........................................................................... 43
4.1.2 Pre-experiment to determine the residence time .................................... 44
4.1.3 Extrusion process ................................................................................... 44
4.2 Results of the intrinsic viscosity measurements............................................ 45
4.2.1 Statistical analysis of the intrinsic viscosity measurements ................... 46
4.3 Results of the 1H NMR ................................................................................. 49
4.4 Results of the differential scanning calorimetry ........................................... 52
4.5 Pre-Experiments for feeding the textiles ....................................................... 58
5. Discussion....................................................................................................... 59
5.1 Extrusion process .......................................................................................... 59
5.1.1 Feeding of the extruder .......................................................................... 59
5.1.2 Pre-Experiment to determine the residence time ................................... 60
5.1.3 Extrusion process ................................................................................... 60
5.2 Intrinsic viscosities statistical analysis .......................................................... 61
5.3 1H NMR analysis .......................................................................................... 62
5.4 DSC analysis ................................................................................................. 64
5.5 Pre-Experiment for feeding the textiles ........................................................ 66
5.6 Sustainability issues ...................................................................................... 66
6. Conclusions .................................................................................................... 67
7. Future research ............................................................................................. 68
8. References ...................................................................................................... 69
9. Appendix ........................................................................................................ 75
Appendix I – Results of the leven´s test of equality of error variance ................ 75
Appendix II – Descriptive statistics of the intrinsic viscosity measurement ...... 75
Appendix III – 1H NMR spectra of all samples .................................................. 76
Appendix IV – DSC curves of the first cooling cycle ........................................ 80

vii
Appendix V – Overlaid DSC curves of the second heating cycles ..................... 84
viii
LIST OF ABBREVIATIONS
DP /𝑥𝑛 Degree of polymerisation the first abbreviation is usually used in the
written text whereas the second one is used in equations
DEG Diethylene glycol
DSC Differential scanning calorimetry
EFSA European Food Safety Authority
EG Ethylene glycol
EVA Ethylene vinyl acetate
FDA U.S. Food and Drug Administration
IV Intrinsic viscosity [η]
KOB Karl Otto Braun GmbH & Co. KG, Wolfstein, Germany
LSP Liquid state polymerization
MW Molecular weight
MFR Mold flow rate
𝑀𝑁 Number average molecular weight
𝑀𝑊 Weight average molecular weight
NMR Nuclear magnetic resonance
OVC Organic volatile compound
t Flow time of a polymer solution in a U-tube viscometer like the
Ubbelohde viscometer
t0 Flow time of a pure solvent in a U-tube viscometer such as the
Ubbelohde viscometer
TA Terephthalic acid
TCE 1,1,2,2 Tetrachloroethane
TFA Trifluoroacetic acid
Tg Glass transition temperature
TiO2 Titanium dioxide
Tm Melting temperature
ix
PES Polyester, as this is the common denomination in the textile industry
for PET, when referring to polyester PET is meant
PET Poly(ethylene terephthalate)
PTA Purified terephthalic acid
PVDC Polyvinylidene chloride
PVC Polyvinylchloride
rPET Recycled PET
SSP Solid-state-polymerization
Wt. % Weight percent
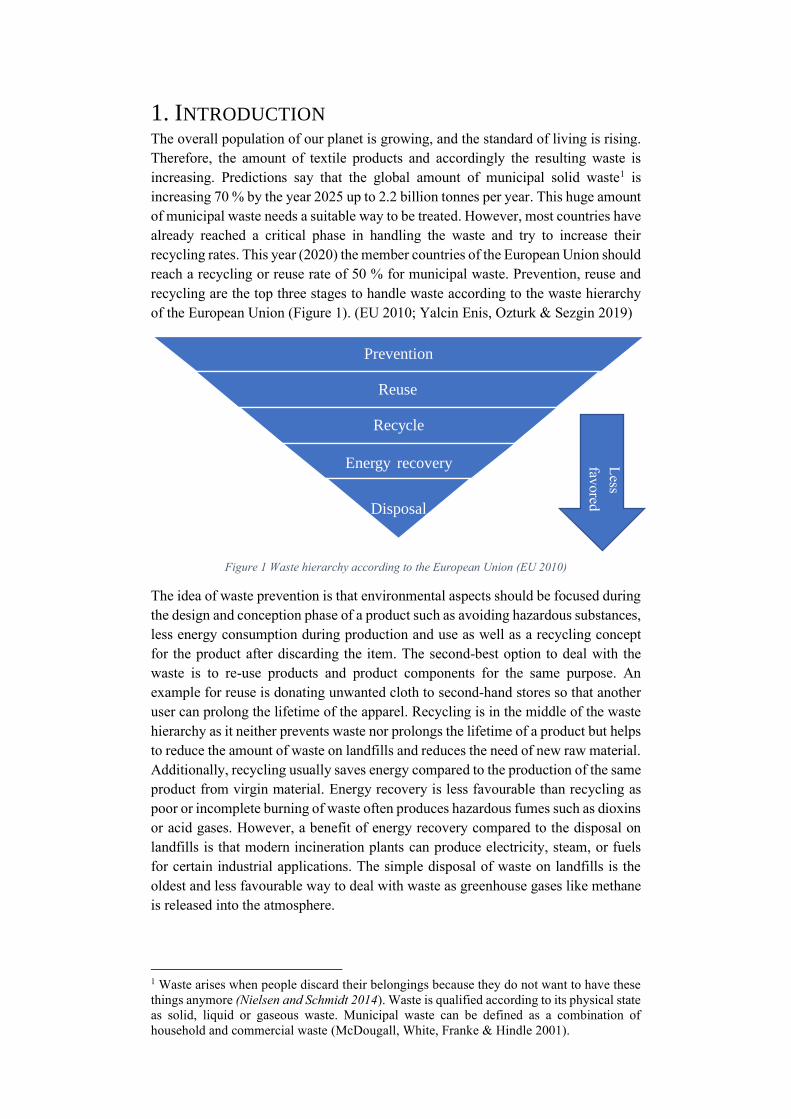
1. INTRODUCTION The overall population of our planet is growing, and the standard of living is rising.
Therefore, the amount of textile products and accordingly the resulting waste is
increasing. Predictions say that the global amount of municipal solid waste1 is
increasing 70 % by the year 2025 up to 2.2 billion tonnes per year. This huge amount
of municipal waste needs a suitable way to be treated. However, most countries have
already reached a critical phase in handling the waste and try to increase their
recycling rates. This year (2020) the member countries of the European Union should
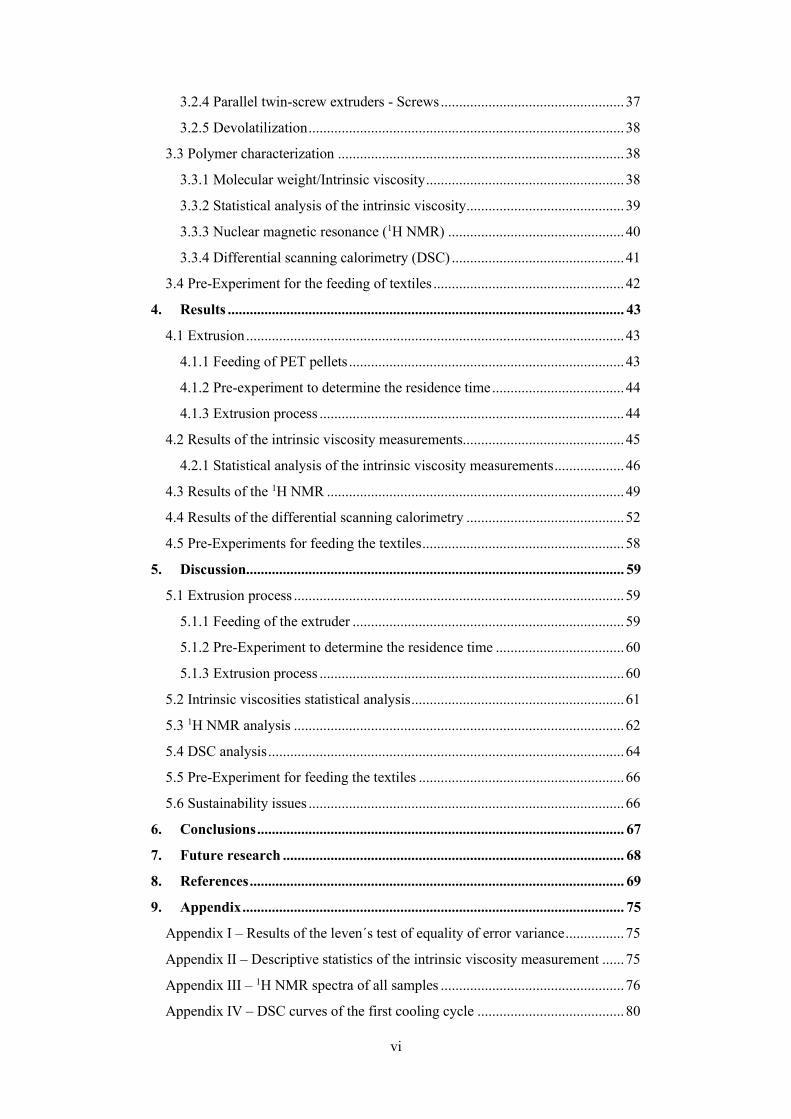
reach a recycling or reuse rate of 50 % for municipal waste. Prevention, reuse and
recycling are the top three stages to handle waste according to the waste hierarchy
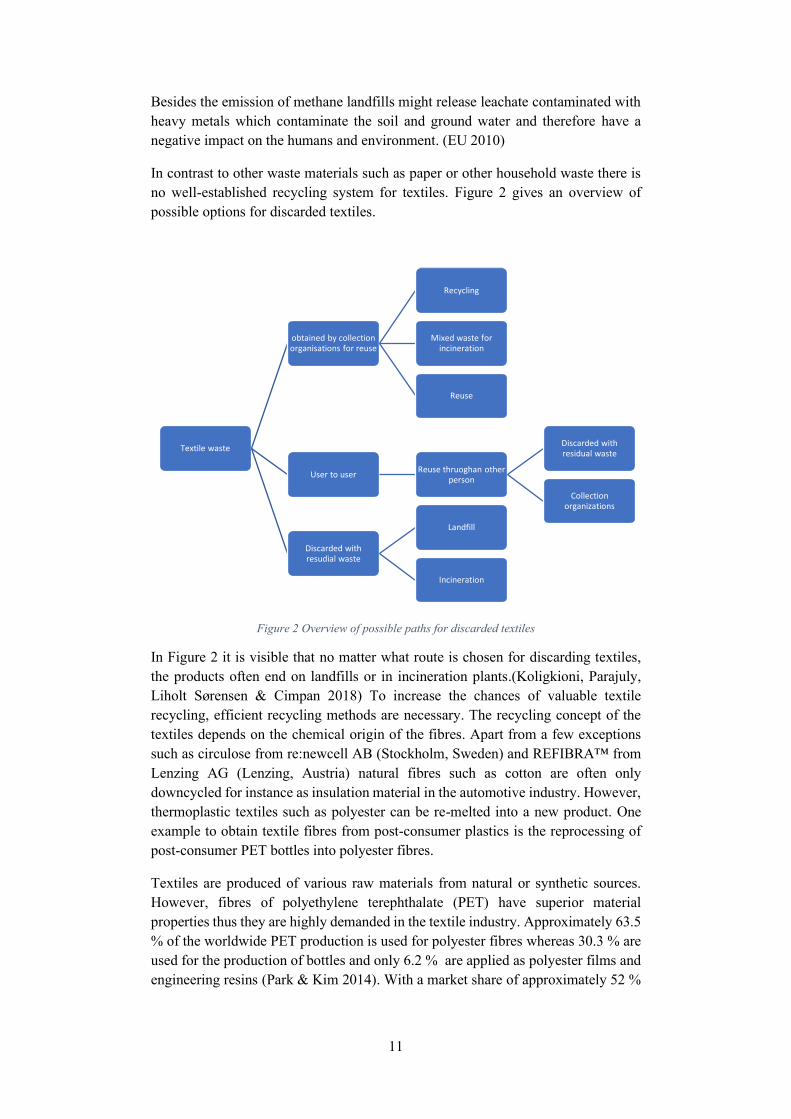
of the European Union (Figure 1). (EU 2010; Yalcin Enis, Ozturk & Sezgin 2019)
Figure 1 Waste hierarchy according to the European Union (EU 2010)
The idea of waste prevention is that environmental aspects should be focused during
the design and conception phase of a product such as avoiding hazardous substances,
less energy consumption during production and use as well as a recycling concept
for the product after discarding the item. The second-best option to deal with the
waste is to re-use products and product components for the same purpose. An
example for reuse is donating unwanted cloth to second-hand stores so that another
user can prolong the lifetime of the apparel. Recycling is in the middle of the waste
hierarchy as it neither prevents waste nor prolongs the lifetime of a product but helps
to reduce the amount of waste on landfills and reduces the need of new raw material.
Additionally, recycling usually saves energy compared to the production of the same
product from virgin material. Energy recovery is less favourable than recycling as
poor or incomplete burning of waste often produces hazardous fumes such as dioxins
or acid gases. However, a benefit of energy recovery compared to the disposal on
landfills is that modern incineration plants can produce electricity, steam, or fuels
for certain industrial applications. The simple disposal of waste on landfills is the
oldest and less favourable way to deal with waste as greenhouse gases like methane
is released into the atmosphere.
1 Waste arises when people discard their belongings because they do not want to have these
things anymore (Nielsen and Schmidt 2014). Waste is qualified according to its physical state
as solid, liquid or gaseous waste. Municipal waste can be defined as a combination of
household and commercial waste (McDougall, White, Franke & Hindle 2001).
Prevention
Reuse
Recycle
Energy recovery
Disposal
Less
favored
optio
nn
11
Besides the emission of methane landfills might release leachate contaminated with
heavy metals which contaminate the soil and ground water and therefore have a
negative impact on the humans and environment. (EU 2010)
In contrast to other waste materials such as paper or other household waste there is
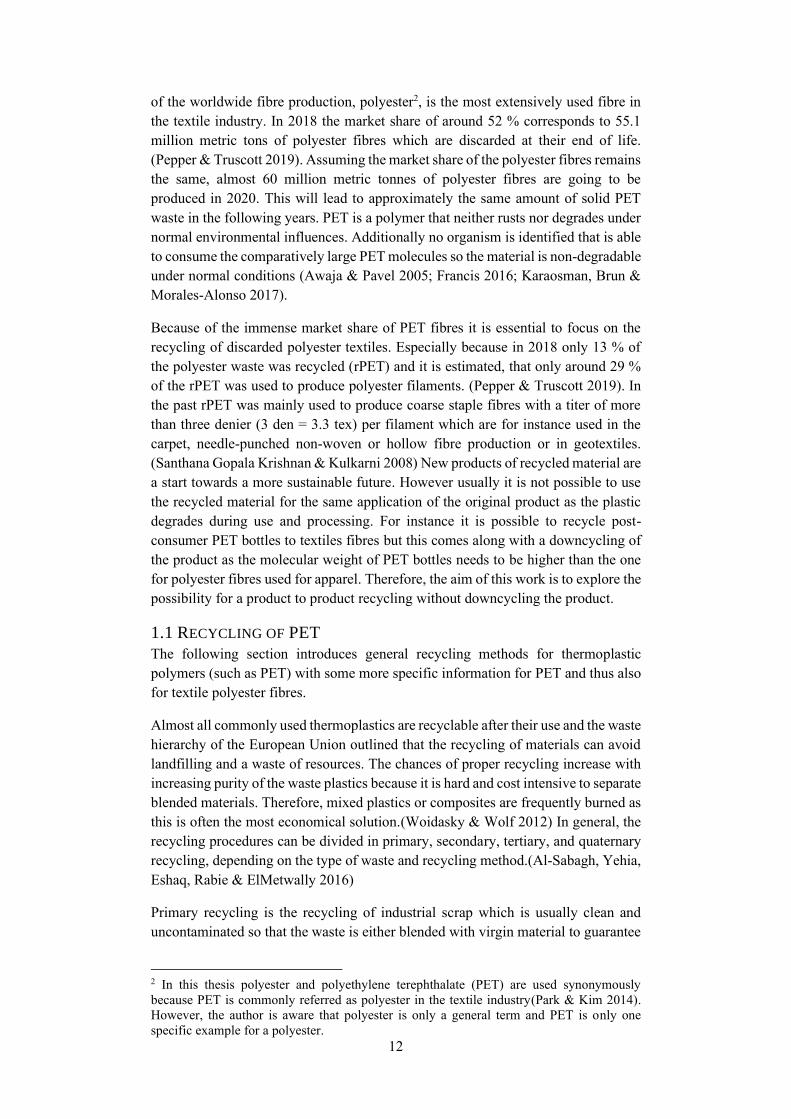
no well-established recycling system for textiles. Figure 2 gives an overview of
possible options for discarded textiles.
Figure 2 Overview of possible paths for discarded textiles
In Figure 2 it is visible that no matter what route is chosen for discarding textiles,
the products often end on landfills or in incineration plants.(Koligkioni, Parajuly,
Liholt Sørensen & Cimpan 2018) To increase the chances of valuable textile
recycling, efficient recycling methods are necessary. The recycling concept of the
textiles depends on the chemical origin of the fibres. Apart from a few exceptions
such as circulose from re:newcell AB (Stockholm, Sweden) and REFIBRA™ from
Lenzing AG (Lenzing, Austria) natural fibres such as cotton are often only
downcycled for instance as insulation material in the automotive industry. However,
thermoplastic textiles such as polyester can be re-melted into a new product. One
example to obtain textile fibres from post-consumer plastics is the reprocessing of
post-consumer PET bottles into polyester fibres.
Textiles are produced of various raw materials from natural or synthetic sources.
However, fibres of polyethylene terephthalate (PET) have superior material
properties thus they are highly demanded in the textile industry. Approximately 63.5
% of the worldwide PET production is used for polyester fibres whereas 30.3 % are
used for the production of bottles and only 6.2 % are applied as polyester films and
engineering resins (Park & Kim 2014). With a market share of approximately 52 %
Textile waste
obtained by collection organisations for reuse
Recycling
Mixed waste for incineration
Reuse
User to userReuse thruoghan other
person
Discarded with residual waste
Collection organizations
Discarded with resudial waste
Landfill
Incineration
12
of the worldwide fibre production, polyester2, is the most extensively used fibre in
the textile industry. In 2018 the market share of around 52 % corresponds to 55.1
million metric tons of polyester fibres which are discarded at their end of life.
(Pepper & Truscott 2019). Assuming the market share of the polyester fibres remains
the same, almost 60 million metric tonnes of polyester fibres are going to be
produced in 2020. This will lead to approximately the same amount of solid PET
waste in the following years. PET is a polymer that neither rusts nor degrades under
normal environmental influences. Additionally no organism is identified that is able
to consume the comparatively large PET molecules so the material is non-degradable
under normal conditions (Awaja & Pavel 2005; Francis 2016; Karaosman, Brun &
Morales-Alonso 2017).
Because of the immense market share of PET fibres it is essential to focus on the
recycling of discarded polyester textiles. Especially because in 2018 only 13 % of
the polyester waste was recycled (rPET) and it is estimated, that only around 29 %
of the rPET was used to produce polyester filaments. (Pepper & Truscott 2019). In
the past rPET was mainly used to produce coarse staple fibres with a titer of more
than three denier (3 den = 3.3 tex) per filament which are for instance used in the
carpet, needle-punched non-woven or hollow fibre production or in geotextiles.
(Santhana Gopala Krishnan & Kulkarni 2008) New products of recycled material are
a start towards a more sustainable future. However usually it is not possible to use
the recycled material for the same application of the original product as the plastic
degrades during use and processing. For instance it is possible to recycle post-
consumer PET bottles to textiles fibres but this comes along with a downcycling of
the product as the molecular weight of PET bottles needs to be higher than the one
for polyester fibres used for apparel. Therefore, the aim of this work is to explore the
possibility for a product to product recycling without downcycling the product.
1.1 RECYCLING OF PET
The following section introduces general recycling methods for thermoplastic
polymers (such as PET) with some more specific information for PET and thus also
for textile polyester fibres.
Almost all commonly used thermoplastics are recyclable after their use and the waste
hierarchy of the European Union outlined that the recycling of materials can avoid
landfilling and a waste of resources. The chances of proper recycling increase with
increasing purity of the waste plastics because it is hard and cost intensive to separate
blended materials. Therefore, mixed plastics or composites are frequently burned as
this is often the most economical solution.(Woidasky & Wolf 2012) In general, the
recycling procedures can be divided in primary, secondary, tertiary, and quaternary
recycling, depending on the type of waste and recycling method.(Al-Sabagh, Yehia,
Eshaq, Rabie & ElMetwally 2016)
Primary recycling is the recycling of industrial scrap which is usually clean and
uncontaminated so that the waste is either blended with virgin material to guarantee
2 In this thesis polyester and polyethylene terephthalate (PET) are used synonymously
because PET is commonly referred as polyester in the textile industry(Park & Kim 2014).
However, the author is aware that polyester is only a general term and PET is only one
specific example for a polyester.
13
the product quality or it is used as second grade material for inferior products.(Al-
Sabagh et al. 2016)
A physically reprocessing of the polymers, without changing the chemical structure
is called secondary recycling. Thermomechanical reprocessing of post-consumer
waste such as the recycling of used PET bottles to fibres belongs in this category.
High temperatures and shear forces which are applied during the reprocessing
enhance the product degradation because the plastic is sorted, purged, dried, chopped
and melt processed, for instance in an extruder, to obtain recycling granulates which
can be used for further plastic processing. Besides the reprocessing of the material,
the chemical ageing, and contaminations such as incompatible polymers, prints,
glues, or other contaminations e.g. stains have a negative impact on the material
properties. Thus, the purity of the recycled material is crucial for the recycling
process as small amounts of incompatible polymers or contaminations can
tremendously reduce the quality of the recycled material as they typically initiate
degradation processes. The degradation processes are linked to a decrease of the
molecular weight because degradation processes initiate chain scission reactions.
Lower molecular weight is usually associated with inferior product properties so that
chain scission reactions are highly undesired. Fibres with a higher molecular weight
are desired as they are stronger and tougher compared to low molecular weight
fibres. (East 2009) However, a huge benefit of the thermomechanical reprocessing
is the low investment costs as established equipment can be used, also with small
batches, and compared to the chemical recycling it is environmentally friendly
because no solvents are necessary to reprocess the polymer (Al-Sabagh et al. 2016;
Awaja & Pavel 2005; Santhana Gopala Krishnan & Kulkarni 2008) To overcome
the drawbacks of inferior products due to degraded polymers, recycling material is
often modified for instance by blending 30 % of recycled material with virgin
material to enhance the plastic´s properties.(Woidasky & Wolf 2012)
Tertiary recycling of PET involves the change of the materials chemical structure by
depolymerization such as hydrolysis, methanolysis, or glycolysis. So that the
polymer chains are split under controlled conditions. Monomers such as purified
terephthalic acid (PTA), ethylene glycol (EG), diethylene glycol (DEG) or oligomers
are obtained from these controlled depolymerization processes. The monomers and
oligomers are isolated and reconverted into PET by a polycondensation reaction so
that they renter the manufacturing process. (Francis 2016) However the usage and
disposal of harsh solvents in this process have a negative environmental impact and
the process is only cost effective when run in an industrial scale because the capital
investment to implement such a process are quite high as well as the operational and
energy costs. A benefit of this recycling route is that it is less prone to contaminants
because a purification process enables to remove the contaminations which are
bound to the polymer chain (Koo, Chang, Kim, Hahm & Park 2013).
Finally, quaternary recycling can be used to recover the energy content of the plastic
by incinerate the waste. This is the least favourable way as toxic fumes are produced
and neither the monomers nor the material can be reused albeit energy can be
produced.(Al-Sabagh et al. 2016; Francis 2016)
To sum it up, even though thermomechanical recycling of thermoplastic polymers
has some drawbacks for instance that it usually includes a further polymer
14
degradation due to high temperatures and shear forces, it offers many benefits such
as the absence of solvents or other harsh chemicals that are harmful for the
environment and used in chemical recycling. Therefore, this thesis is focused on the
thermomechanical recycling approach.
1.2 COMMON THERMOMECHANICAL RECYCLING METHODS TO
INCREASE THE MOLECULAR WEIGHT OF PET
A common way to overcome the molecular weight reductions of thermomechanical
recycling is a solid-state-polymerization (SSP). The SSP performed by keeping the
polymer for several hours, often more than 10 h, in a reactor above the glass
transition temperature (Tg)3 but below the melt temperature (Tm). For PET this is
usually between 200°C and 240°C (Qiu, Huang, Tang & Gerking 1997; Scheirs &
Long 2003). At this temperature range the amorphous parts of the polymer can move
and reconnect the polymer chains while the crystalline parts are still unable to move.
The temperature range is below the thermal degradation temperature so that chain
coupling dominates over the chain scission reactions. This works because the
activation energies of chain-growing and chain-scission reactions are different (East
2009b). Moreover, the SSP is used for virgin material to produce high tenacity PET
filaments. As the increase of molar mass raises the PET´s tenacity and Young´s
modulus. The main drawback of this method is the substantial time consumption.
In contrast to that a chain extension during reactive extrusion, another established
method, is quite fast. Chain extenders are di- or polyfunctional compounds which
react with the carboxyl and/or hydroxyl end groups of the PET to reconnect the
broken PET chain. One type of chain extenders reduces the carboxyl end groups
which improves the hydrolytic and thermo-oxidative stability of the PET so that the
molecular weight (MW) is maintained during melt processing. Whereas the second
type of chain extender, usually applied for melt polycondensated low molecular
weight PET, connects the hydroxyl groups of two PET chains. Consequently, these
coupling reactions increase the molecular weight considerably fast. (Inata &
Matsumura 1986) Compared to the SSP this process is fast however chain extenders
can cause undesired side reactions which lead to product discolouration, an increased
branching or crosslinking. Crosslinking also increases the molecular weight but it
should be avoided to a large extend as it leads to gel formation which has a negative
impact on the mechanical properties and thermal stability of the polymer. (Awaja &
Pavel 2005) As the chain extenders permanently modify the chemical structure of
the PET, the recycling of these material becomes more challenging as new PET
grades are introduced into the market which complicates the waste sorting in a
circular economy.
In general, these recycling methods can be used for PET and thus also polyester
fibres/textiles. However, textiles usually have a low bulk density for which reason it
might be necessary to modify the material feeding of the machines or increase the
bulk density of the textiles prior processing the material in the common way.
3 The glass transition temperature of PET usually is between 70°C and 80°C (Ehrenstein
2011b). This is the temperature where the PET softens and becomes rubber like but does not
melt. (Cowie & Arrighi 2007)
15
Previous research for recycling PET concentrated on the enhancements of the
established methods such as the SSP or the improvement of chain extenders.
However, the possibilities of polymer rejuvenation in an extruder in the molten state
without the usage of any further chemicals like chain extenders are not know by the
author. Thermomechanical recycling of PET in an extruder with chain coupling
reactions (for instance polycondensations or (trans)esterifications) and an increase
of the PETs molecular weight, would be a way towards a more circular economy.
Therefore, it is tried in this thesis to facilitate chain coupling reactions of PET in an
extruder to increase its molecular weight so that high quality products could be
produced from recycled material. Consequently, the current drawback of
thermomechanical recycling in an extruder, the decreasing molecular weight and
therefore inferior material properties, could be overcome. Another benefit would be
that extruders are well established and broadly available machines that can process
small batches. The processing avoids the usage of any additional and potentially
harmful chemicals that might have a negative influence on humans and/or the
environment.
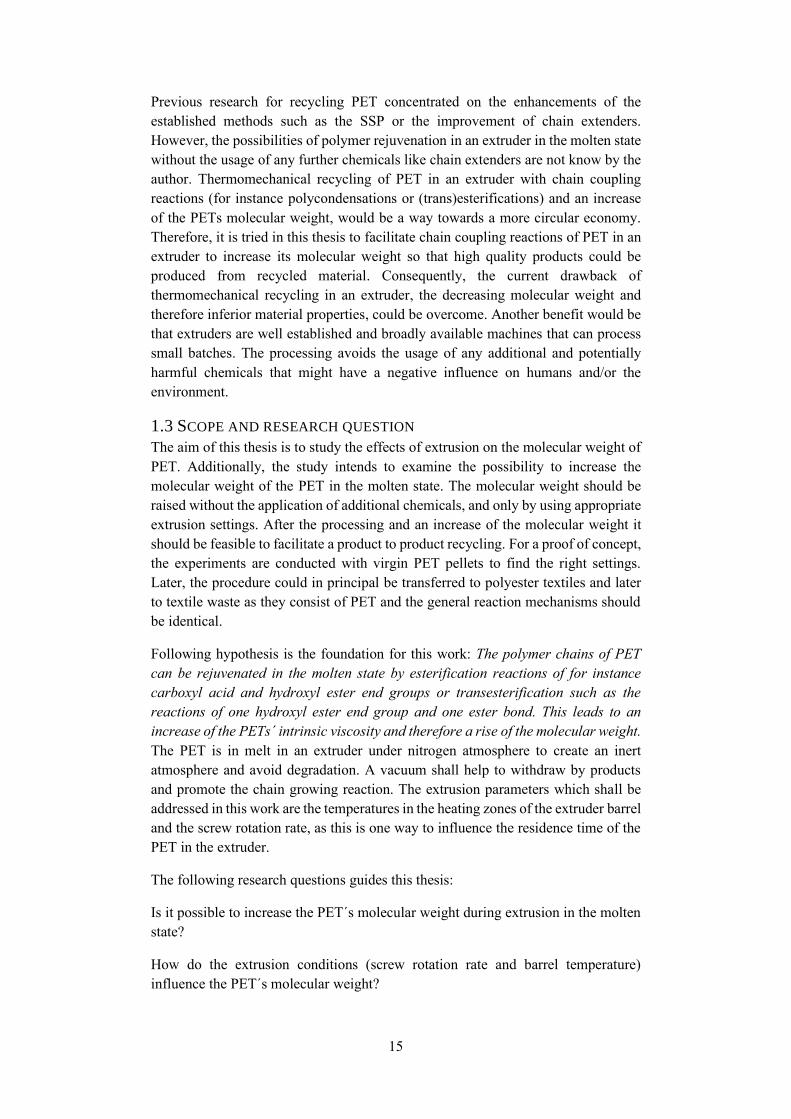
1.3 SCOPE AND RESEARCH QUESTION
The aim of this thesis is to study the effects of extrusion on the molecular weight of
PET. Additionally, the study intends to examine the possibility to increase the
molecular weight of the PET in the molten state. The molecular weight should be
raised without the application of additional chemicals, and only by using appropriate
extrusion settings. After the processing and an increase of the molecular weight it
should be feasible to facilitate a product to product recycling. For a proof of concept,
the experiments are conducted with virgin PET pellets to find the right settings.
Later, the procedure could in principal be transferred to polyester textiles and later
to textile waste as they consist of PET and the general reaction mechanisms should
be identical.
Following hypothesis is the foundation for this work: The polymer chains of PET
can be rejuvenated in the molten state by esterification reactions of for instance
carboxyl acid and hydroxyl ester end groups or transesterification such as the
reactions of one hydroxyl ester end group and one ester bond. This leads to an
increase of the PETs´ intrinsic viscosity and therefore a rise of the molecular weight.
The PET is in melt in an extruder under nitrogen atmosphere to create an inert
atmosphere and avoid degradation. A vacuum shall help to withdraw by products
and promote the chain growing reaction. The extrusion parameters which shall be
addressed in this work are the temperatures in the heating zones of the extruder barrel
and the screw rotation rate, as this is one way to influence the residence time of the
PET in the extruder.
The following research questions guides this thesis:
Is it possible to increase the PET´s molecular weight during extrusion in the molten
state?
How do the extrusion conditions (screw rotation rate and barrel temperature)
influence the PET´s molecular weight?
16
2. LITERATURE REVIEW This part begins by briefly explaining the synthesis mechanisms of PET as well as
the molecular weight and its influence on the polyester. The ageing procedure and
possibilities to rejuvenate the PET chains are explained. Additionally, the the
prerequisites for the recycling of PET as well as the sources and impact of
contaminations in the recycling process are reviewed. Then this abstract moves on
to outline current methods to increase the molecular weight of polymers and the state
of the art in industrial plastic recycling.
2.1 POLY (ETHYLENE TEREPHTHALATE)
Poly (ethylene terephthalate) belongs to the group of polyesters and is a
thermoplastic, semi-crystalline and linear polymer. The repeating ester groups (-CO-
O-) are characteristic for this organic compound. (Lin 2008) PET is usually produced
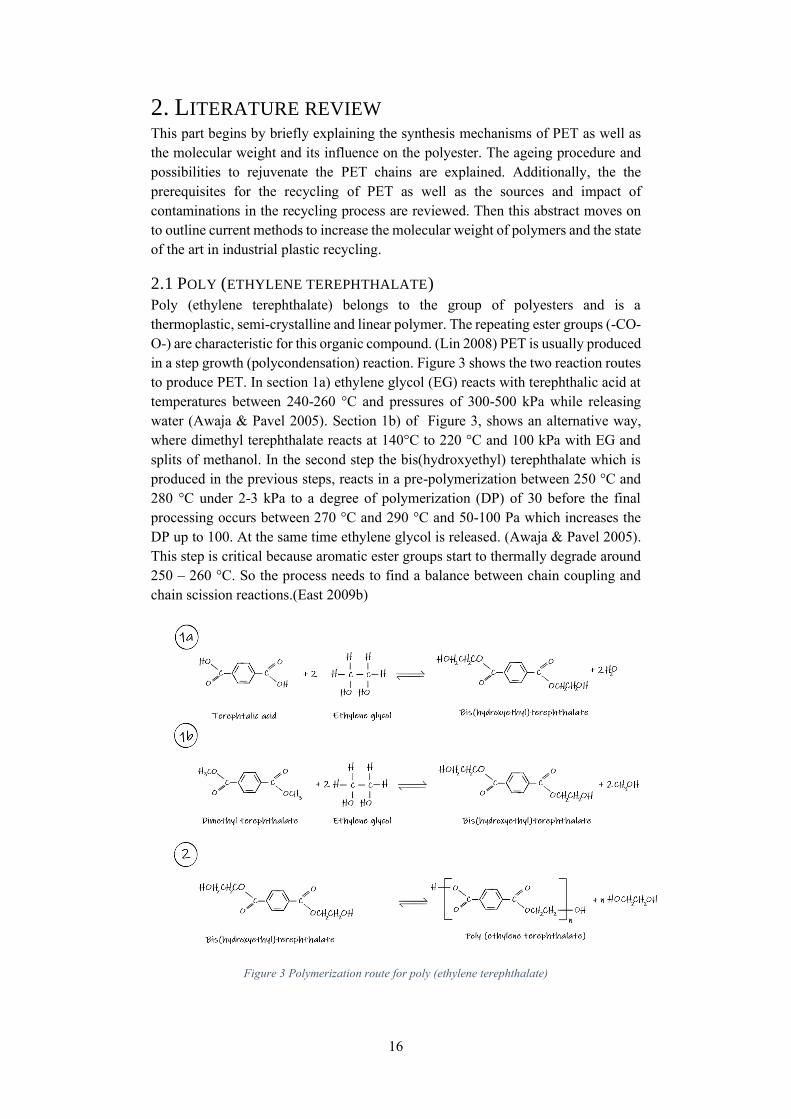
in a step growth (polycondensation) reaction. Figure 3 shows the two reaction routes
to produce PET. In section 1a) ethylene glycol (EG) reacts with terephthalic acid at
temperatures between 240-260 °C and pressures of 300-500 kPa while releasing
water (Awaja & Pavel 2005). Section 1b) of Figure 3, shows an alternative way,
where dimethyl terephthalate reacts at 140°C to 220 °C and 100 kPa with EG and
splits of methanol. In the second step the bis(hydroxyethyl) terephthalate which is
produced in the previous steps, reacts in a pre-polymerization between 250 °C and
280 °C under 2-3 kPa to a degree of polymerization (DP) of 30 before the final
processing occurs between 270 °C and 290 °C and 50-100 Pa which increases the
DP up to 100. At the same time ethylene glycol is released. (Awaja & Pavel 2005).
This step is critical because aromatic ester groups start to thermally degrade around
250 – 260 °C. So the process needs to find a balance between chain coupling and
chain scission reactions.(East 2009b)
Figure 3 Polymerization route for poly (ethylene terephthalate)
17
The Carothers´ law states that the molecular weight (MW) of a polymer approaches
infinity when the yield of polymerization approaches 100 %. In a step growth
polymerisation, the Carothers´ law predicts the degree of polymerization (𝑥𝑛)
according to Equation 1. In Equation 1, p represents the quantity describing the
extend of a linear polycondensation and 𝑥𝑛 can be expressed as 𝑁0
𝑁 . 𝑁0 is the
“original number of molecules present in an A-B monomer system” (Cowie &
Arrighi 2007) whereas N stands for the “number of all molecules remaining after
time t” (Cowie & Arrighi 2007).
Equation 1 Carothers´ law (Cowie & Arrighi 2007)
𝑥𝑛 =1
(1 − 𝑝)
Therefore, it is important to withdraw the reaction by-products to obtain long
polymer chains. As the reaction equilibrium is then shifted more towards the chain
growing reaction. (Cowie & Arrighi 2007) Commonly, long polymer chains are
preferred for the fibre formation as longer polymer chains usually produce stronger
and tougher fibres.(East 2009b)
2.2 MOLECULAR WEIGHT
The molecular weight is a dimensionless quantity which is defined as the “average
mass of the molecule divided by one twelfth the mass of an atom of the nuclide 12C”
(Cowie & Arrighi 2007) p.229. Therefore, the molecular weight indicates how much
the mass of an atom is bigger than the mass of a carbon isotope 12C. Low molecular
weight compounds have an explicit molecular weight which is unusual for polymers.
Polymers are macromolecules, usually built of several thousands of atoms, therefore
their properties remain the same no matter if for instance 1000 or 1010 atoms are
chemically bond together. Not all polymers from the same material show the same
molecular weight and as the macromolecules differ in length, side groups or length
of side groups, based on the polymerization. Thus, the term molecular weight
distribution is more commonly used. The broadness of the molecular weight
distribution, the polydispersity index, is calculated by the ratio of the weight average
and number average molecular weight. Thus the polydispersity index is a measure
for the broadness of the molecular weight distribution and can also be used, together
with the molecular weight, to measure the polymer degradation.(Shrivastava 2018;
Wypych 2015) The molecular weight distribution range depends on the
polymerization route such as polycondensation, polyaddition or radical
polymerization. Additionally, it can be influenced during the reaction for instance
by changing the monomer concentration, temperature, or pressure. In general, it is
assumed that a narrow molecular weight distribution leads to more uniform
characteristics for instance regarding the thermal softening range or a better chemical
resistance whereas a broad distribution is exemplary associated with a decreased
brittleness because low molecular weight compounds act as a plasticizer in between
the macromolecules. (Ehrenstein 2011b)
The molecular weight distribution is characterized by the ratio of the number average
molecular weight and the mass average of the molecular weight 𝑀𝑊 / 𝑀𝑁
. “The
number average molecular weight (𝑀𝑁 ) is defined as the total weight of the polymer
divided by the total number of molecules”(Wilson & Gwynne 2010). The total
18
weight of the polymer is calculated according to the following term, where Ni
represents the number of molecules with the weight Mi: ∑ 𝑁𝑖𝑀𝑖∞𝑖=1 , the total number
of molecules is written as: ∑ 𝑁𝑖∞𝑖=1 (Wilson & Gwynne 2010). The resulting number
average molecular weight is represented in Equation 2.
Equation 2 Number average molecular weight (Wilson & Gwynne 2010)
𝑀𝑁 =
∑ 𝑁𝑖𝑀𝑖∞𝑖=1
∑ 𝑁𝑖∞𝑖=1
In contrast to 𝑀𝑁 , the weight average molecular weight (𝑀𝑊
) more strongly
emphasises the weight of each molecule. To this end the Ni of Equation 2 is replaced
by NiMi in Equation 3 for the calculation of the weight average molecular weight.
(Wilson & Gwynne 2010)
Equation 3 Weight average molecular weight (Wilson & Gwynne 2010)
𝑀𝑊 =
∑ 𝑁𝑖𝑀𝑖2∞
𝑖=1
∑ 𝑁𝑖𝑀𝑖∞𝑖=1
The number and weight average molecular weights are defined physical dimensions
and can for instance be determined by measuring the intrinsic viscosity (IV). In 1930
Staudinger found an empirical relation between the molar mass of a polymer and the
relative magnitude of an increase in viscosity, thus the IV is a common method for
the determination of the molecular weight of polymers (Cowie & Arrighi 2007).
Changes of the IV within one product are noticeable. A PET with a lower IV is for
instance usually stiffer than a product with a higher IV (Molnar & Ronkay 2019).
The morphological changes in PET with increased IV lead to changes in the
rheological and mechanical properties of the polymer such as an improvement of the
impact resistance, modulus, and strength. (Molnar & Ronkay 2019)
The intrinsic viscosity of the PET used in the textile industry usually ranges between
0.40 and 0.98 dL/g, depending on the field of application. Fibres with a lower IV are
more often used in apparel as low pill staple fibres, wool, or cotton type fibres (IV =
0.40 – 0.64 dL/g) whereas fibres with higher IVs are used in carpets (IV = 0.60 dL/g),
technical yarns (IV = 0.72-0.90 dL/g) or tyre-cords (IV = 0.85 – 0.98 dL/g).
Additionally, 0.03 – 0.4 wt. % titanium dioxide (TiO2) is often added in fibre grade
PET as a delustering agent. (Santhana Gopala Krishnan & Kulkarni 2008)
2.3 DETERMINATION OF THE MOLECULAR WEIGHT/ INTRINSIC
VISCOSITY
The intrinsic viscosity is determined by comparing the flow time of the polymer
solution (t) with the flow time of a pure solvent mixture (t0). The solvent mixture
and the polymer solution are separately running through the capillary of an
Ubbelohde viscometer as shown in Figure 4.
19
Figure 4 Ubbelohde viscometer
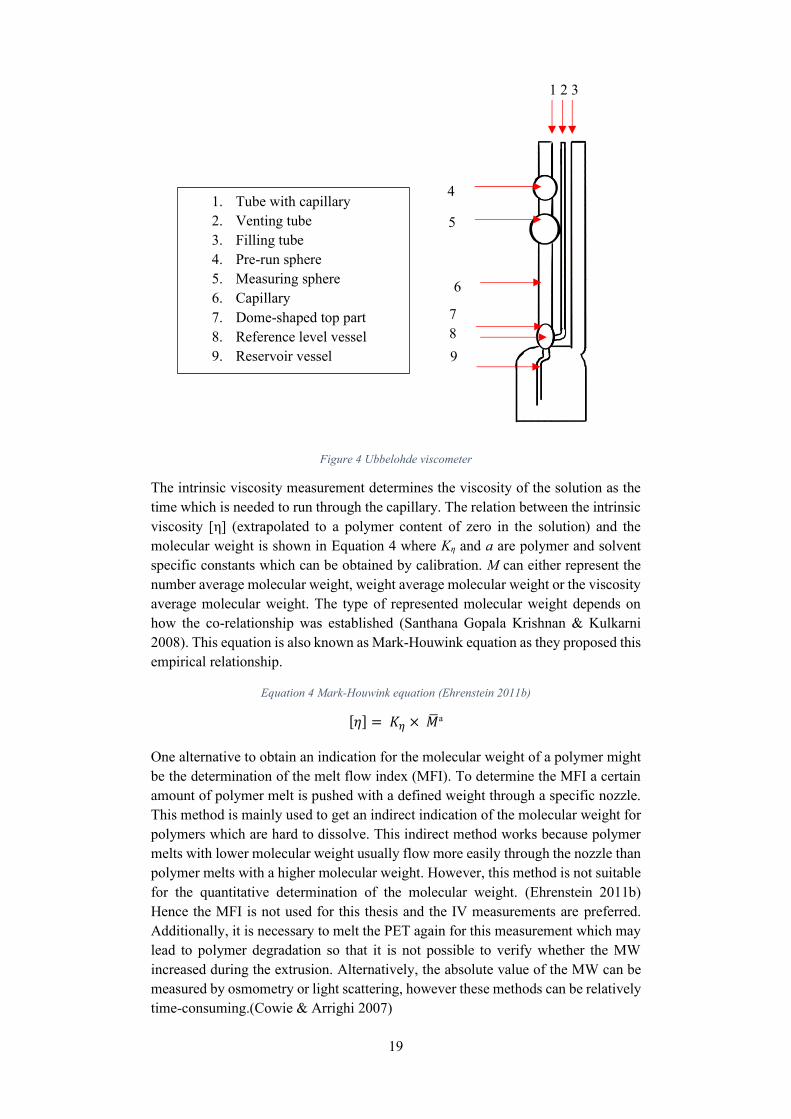
The intrinsic viscosity measurement determines the viscosity of the solution as the
time which is needed to run through the capillary. The relation between the intrinsic
viscosity [η] (extrapolated to a polymer content of zero in the solution) and the
molecular weight is shown in Equation 4 where Kη and a are polymer and solvent
specific constants which can be obtained by calibration. M can either represent the
number average molecular weight, weight average molecular weight or the viscosity
average molecular weight. The type of represented molecular weight depends on
how the co-relationship was established (Santhana Gopala Krishnan & Kulkarni
2008). This equation is also known as Mark-Houwink equation as they proposed this
empirical relationship.
Equation 4 Mark-Houwink equation (Ehrenstein 2011b)
[𝜂] = 𝐾𝜂 × ��a
One alternative to obtain an indication for the molecular weight of a polymer might
be the determination of the melt flow index (MFI). To determine the MFI a certain
amount of polymer melt is pushed with a defined weight through a specific nozzle.
This method is mainly used to get an indirect indication of the molecular weight for
polymers which are hard to dissolve. This indirect method works because polymer
melts with lower molecular weight usually flow more easily through the nozzle than
polymer melts with a higher molecular weight. However, this method is not suitable
for the quantitative determination of the molecular weight. (Ehrenstein 2011b)
Hence the MFI is not used for this thesis and the IV measurements are preferred.
Additionally, it is necessary to melt the PET again for this measurement which may
lead to polymer degradation so that it is not possible to verify whether the MW
increased during the extrusion. Alternatively, the absolute value of the MW can be
measured by osmometry or light scattering, however these methods can be relatively
time-consuming.(Cowie & Arrighi 2007)
1 2 3
4
5
6
7
8
9
1. Tube with capillary
2. Venting tube
3. Filling tube
4. Pre-run sphere
5. Measuring sphere
6. Capillary
7. Dome-shaped top part
8. Reference level vessel
9. Reservoir vessel
20
2.3.1 INFLUENCE OF THE MOLECULAR WEIGHT ON POLYMER PROPERTIES
The producers of plastics are aiming for a special pre-determined average molecular
weight during the polymer synthesis. However, the production is always a
compromise between different material properties which needs to be balanced. On
the one hand it is essential that the polymer melt is easy to process, on the other hand
good mechanical properties are aimed such as a high Young´s modulus, strength,
and sturdiness. The adjustment of mechanical properties within one material and the
predetermined chemical structure is only feasible for thermoplastic materials
because of a variation in the polymer´s molecular weight. (Ehrenstein 2011b)
Material properties of thermoplastic materials are influenced by the molecular
weight and the molecular weight distribution. A higher molecular weight of the
polymer comes along with a longer polymer chain. In contrast to short molecular
chains, the number of entanglements of the macromolecules with each other is
increasing. This influences the movement of the polymer chains in the melt as the
slippage in between the macromolecules is hampered. Thus, the melt viscosity
increases with increasing molecular weight which influences the choice of the
processing method. Polymers with a higher melt viscosity are less suitable for
injection molding processes while extrusion and blow molding need a high melt
viscosity and cohesion of the polymer chains. (Ehrenstein 2011b)
The increasing entanglements hinder the movement of the polymer chains which can
restrain the formation of crystals and lead to a reduction of crystallinity. Hence the
amorphous parts can be increased in high molecular polymers. However, the
crystallinity is also strongly influenced by the molecular structure of the polymer
main chain. Regular molecular chains and small symmetrical side groups have a
positive influence on crystallization so that also high molecular weight polymers can
be highly semi-crystalline. (Whisnant 2020) Crystalline phases are a state with a
remarkably high packing density for which reason materials with more amorphous
parts have a reduced density compared to the same material with more crystalline
portions. The crystallinity of the polymer also influences the mechanical properties
such as the young´s modulus and the wear as intermolecular secondary valence
forces cannot deploy their full potential in less crystalline materials. (Ehrenstein
2011b)
Also, the elongation at break is influenced by the length of the molecular chain and
therefore the molecular weight plays an important role. The elongation at break is
increased with increasing chain length as the polymer chains have a longer slipping
distance among each other which increases the elongation of break of the plastic if
the breaking strength of the single polymer chains is not reached. As the number of
short polymer chains is reduced with higher molecular weight, there are less
molecular chains that slip off. Eventually the applied forces are getting so high that
the strength of the primary valence bonds is reached which leads to chain ruptures
so that the elongation at break is reduced. (Ehrenstein 2011b)
21
2.4 POLYMER AGEING
Over the time and during usage the material ages and degrades. In general ageing is
defined as time dependent, irreversible physical and chemical changes. Material
ageing changes the properties and appearance of the polymers during a specific time
span. Usually material ageing is associated with negative influences on the material´s
properties and especially for thermoplastic polymers the polymer´s chain length is
crucial. Processing and ageing of the material impairs the chain length which leads
to a deterioration of the material properties. (Eyerer 2012a)
Ageing can be distinct between inner and outer ageing. According to Ehrenstein
(2011a) inner ageing occurs because of thermodynamically instable states of the
material, for instance due to incomplete polymer synthesis or residual stresses.
Environmentally physical or chemical influences which lead for example to thermo-
oxidative degradation, fatigue or stress cracks are categorized as outer ageing. Outer
ageing is induced because of energy input, changes in temperature, chemical
influences, mechanical stresses or combined stresses.(Eyerer 2012a)
During usage of the polymeric products outer ageing is induced due to the
environmental conditions such as UV-light, ozone or high and/or long temperature
influences which can lead to chain scissions and depolymerisation reactions in the
polymer. The type and extend of the ageing mainly depend on the chemical structure
and ambience conditions of the material and express themselves in changes of
material properties such as mechanical, electrical, and thermal properties,
crystallinity, or colour. (Ehrenstein 2011a). Polymer degradation can not only occur
during the usage and ageing of the plastics but also during processing for instance in
an extruder. Therefore, recycling of polymers, especially thermomechanical
recycling is challenging as the material degrades thermally or thermo-oxidative, so
that it usually is not possible to reuse the recycled material for the same application.
Ageing due to oxygen
The presence of oxygen combined with the influence of heat and maybe also
mechanical stresses often result in thermo-oxidative degradation as radicals are
formed under these conditions which lead to a change of the polymer´s chemical
composition. The radical chain mechanism is initiated by the decomposition of the
hydroperoxide group. Hydroperoxides are formed by the reaction of an alkyl radical
of the polymer chain with oxygen. The alkyl radical is formed during the thermal
oxidation of the polymer. Hydroperoxides can decompose to alkoxyl radicals which
can abstract hydrogen form the polymer chain so that another alkyl radical is
produced. This leads to the formation of various carbonyl species within the
polymer. (Yang, Liu, Yu & Wang 2006) Temperature increase, metallic
contaminations or additives usually accelerate the thermo-oxidative degradation.
Changes, typically a decline in material properties such as viscosity, elongation or
tensile strength are consequences of the oxidation.(Eyerer 2012a)
Ageing due to thermal influence
Elevated temperatures lead to an increased movement of molecules and molecular
groups in polymers. Increasing temperatures and times can result in irreversible
changes of the polymer. The changes might be irreversible because they base on
22
chemical changes that split chemicals bonds within the polymer. Examples for
changes because of thermal influences can be the volatilization of low molecular
substances (e.g. additives), chain scissions, secessions of atoms/molecular segments,
or an accelerated degradation due to oxidation. (Eyerer 2012a)
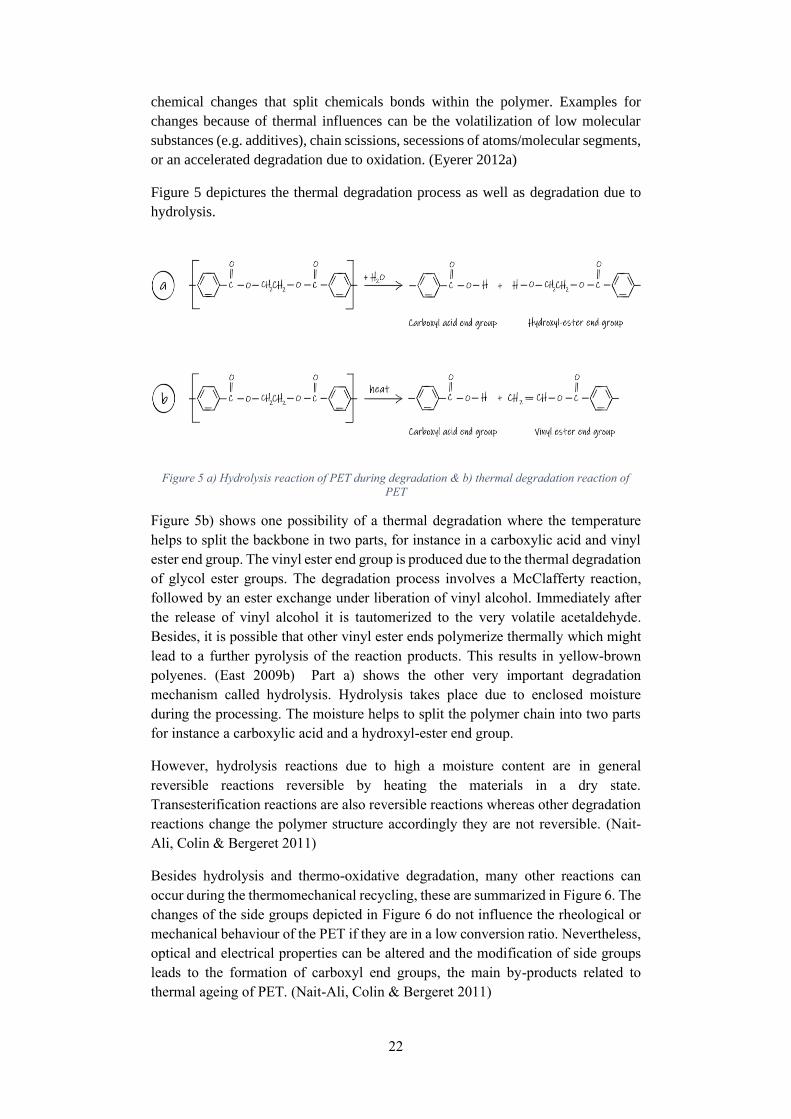
Figure 5 depictures the thermal degradation process as well as degradation due to
hydrolysis.
Figure 5 a) Hydrolysis reaction of PET during degradation & b) thermal degradation reaction of
PET
Figure 5b) shows one possibility of a thermal degradation where the temperature
helps to split the backbone in two parts, for instance in a carboxylic acid and vinyl
ester end group. The vinyl ester end group is produced due to the thermal degradation
of glycol ester groups. The degradation process involves a McClafferty reaction,
followed by an ester exchange under liberation of vinyl alcohol. Immediately after
the release of vinyl alcohol it is tautomerized to the very volatile acetaldehyde.
Besides, it is possible that other vinyl ester ends polymerize thermally which might
lead to a further pyrolysis of the reaction products. This results in yellow-brown
polyenes. (East 2009b) Part a) shows the other very important degradation
mechanism called hydrolysis. Hydrolysis takes place due to enclosed moisture
during the processing. The moisture helps to split the polymer chain into two parts
for instance a carboxylic acid and a hydroxyl-ester end group.
However, hydrolysis reactions due to high a moisture content are in general
reversible reactions reversible by heating the materials in a dry state.
Transesterification reactions are also reversible reactions whereas other degradation
reactions change the polymer structure accordingly they are not reversible. (Nait-
Ali, Colin & Bergeret 2011)
Besides hydrolysis and thermo-oxidative degradation, many other reactions can
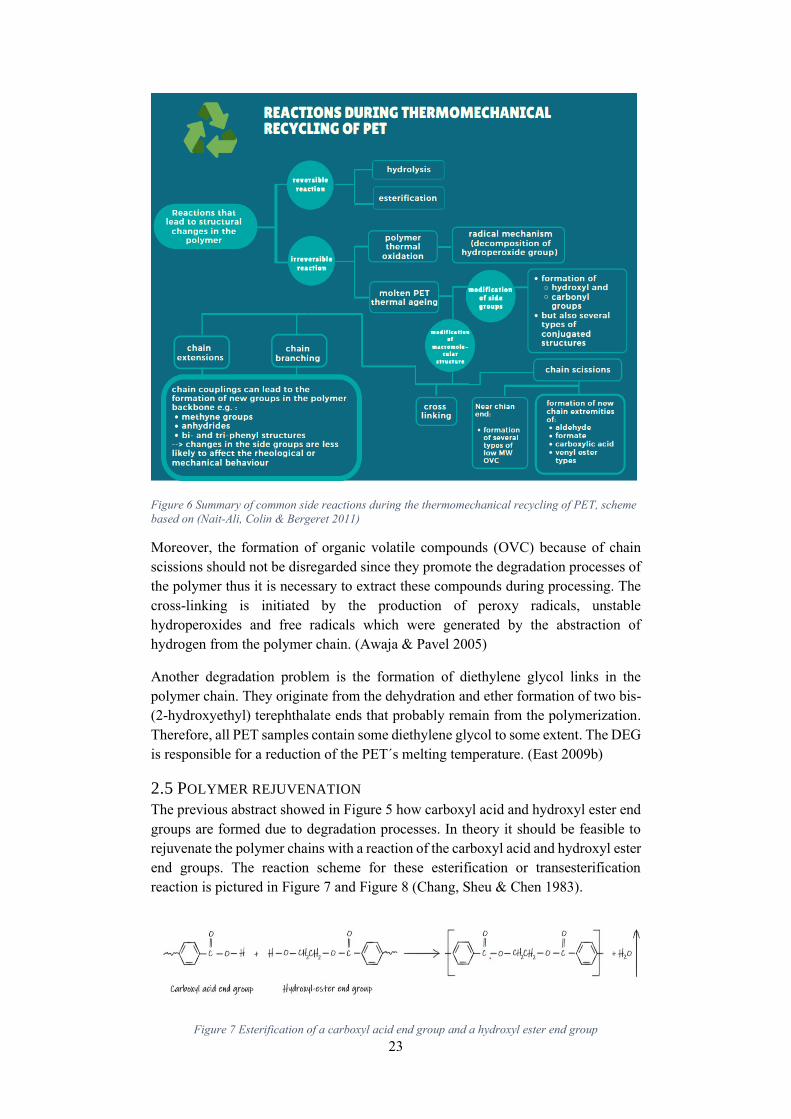
occur during the thermomechanical recycling, these are summarized in Figure 6. The
changes of the side groups depicted in Figure 6 do not influence the rheological or
mechanical behaviour of the PET if they are in a low conversion ratio. Nevertheless,
optical and electrical properties can be altered and the modification of side groups
leads to the formation of carboxyl end groups, the main by-products related to
thermal ageing of PET. (Nait-Ali, Colin & Bergeret 2011)
23
Figure 6 Summary of common side reactions during the thermomechanical recycling of PET, scheme
based on (Nait-Ali, Colin & Bergeret 2011)
Moreover, the formation of organic volatile compounds (OVC) because of chain
scissions should not be disregarded since they promote the degradation processes of
the polymer thus it is necessary to extract these compounds during processing. The
cross-linking is initiated by the production of peroxy radicals, unstable
hydroperoxides and free radicals which were generated by the abstraction of
hydrogen from the polymer chain. (Awaja & Pavel 2005)
Another degradation problem is the formation of diethylene glycol links in the
polymer chain. They originate from the dehydration and ether formation of two bis-
(2-hydroxyethyl) terephthalate ends that probably remain from the polymerization.
Therefore, all PET samples contain some diethylene glycol to some extent. The DEG
is responsible for a reduction of the PET´s melting temperature. (East 2009b)
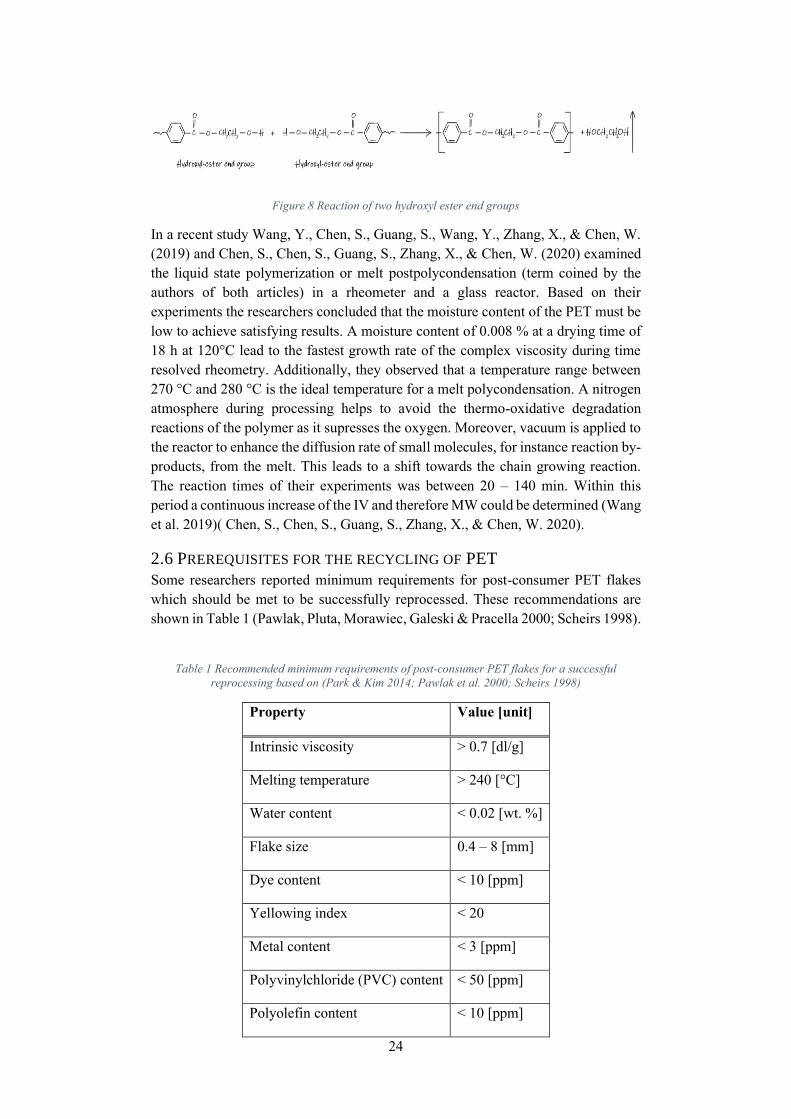
2.5 POLYMER REJUVENATION
The previous abstract showed in Figure 5 how carboxyl acid and hydroxyl ester end
groups are formed due to degradation processes. In theory it should be feasible to
rejuvenate the polymer chains with a reaction of the carboxyl acid and hydroxyl ester
end groups. The reaction scheme for these esterification or transesterification
reaction is pictured in Figure 7 and Figure 8 (Chang, Sheu & Chen 1983).
Figure 7 Esterification of a carboxyl acid end group and a hydroxyl ester end group
24
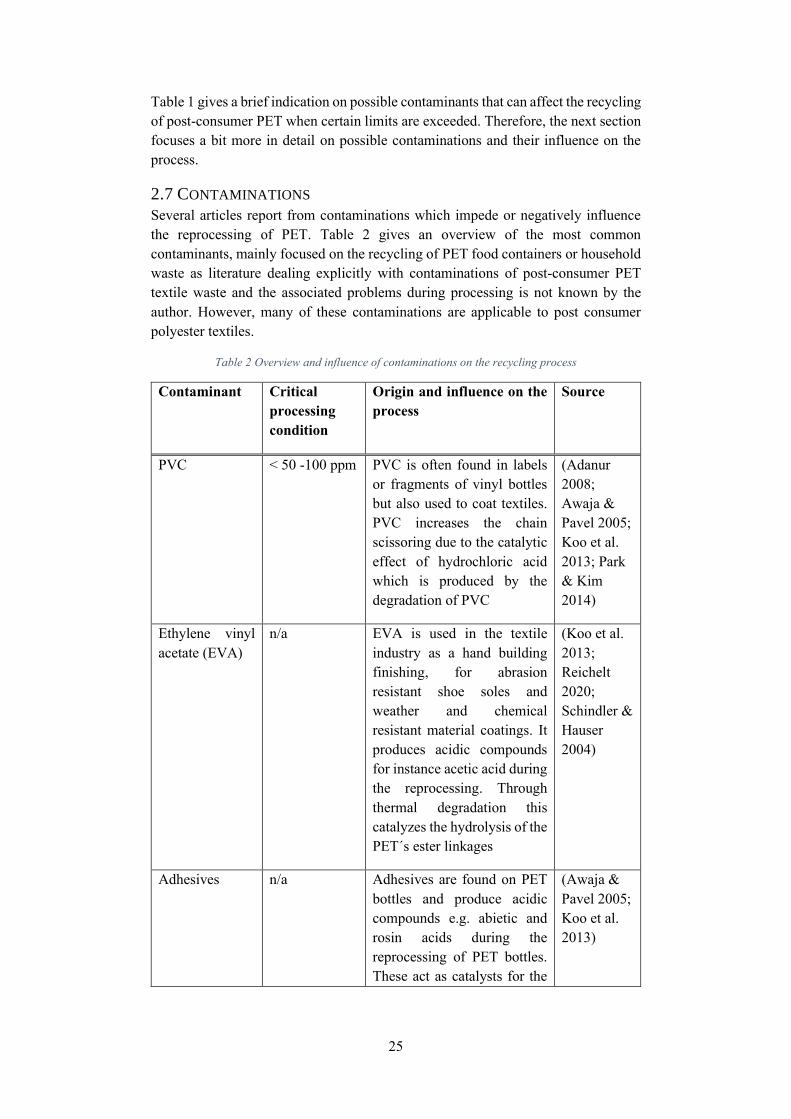
Figure 8 Reaction of two hydroxyl ester end groups
In a recent study Wang, Y., Chen, S., Guang, S., Wang, Y., Zhang, X., & Chen, W.
(2019) and Chen, S., Chen, S., Guang, S., Zhang, X., & Chen, W. (2020) examined
the liquid state polymerization or melt postpolycondensation (term coined by the
authors of both articles) in a rheometer and a glass reactor. Based on their
experiments the researchers concluded that the moisture content of the PET must be
low to achieve satisfying results. A moisture content of 0.008 % at a drying time of
18 h at 120°C lead to the fastest growth rate of the complex viscosity during time
resolved rheometry. Additionally, they observed that a temperature range between
270 °C and 280 °C is the ideal temperature for a melt polycondensation. A nitrogen
atmosphere during processing helps to avoid the thermo-oxidative degradation
reactions of the polymer as it supresses the oxygen. Moreover, vacuum is applied to
the reactor to enhance the diffusion rate of small molecules, for instance reaction by-
products, from the melt. This leads to a shift towards the chain growing reaction.
The reaction times of their experiments was between 20 – 140 min. Within this
period a continuous increase of the IV and therefore MW could be determined (Wang
et al. 2019)( Chen, S., Chen, S., Guang, S., Zhang, X., & Chen, W. 2020).
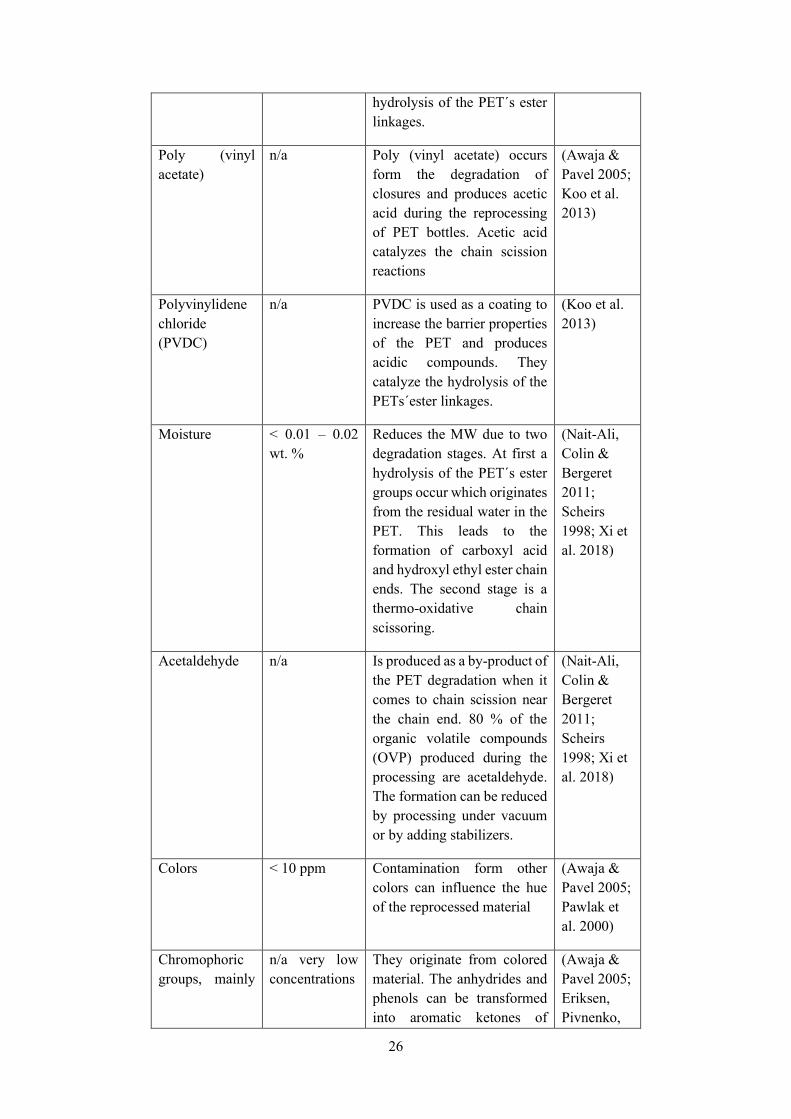
2.6 PREREQUISITES FOR THE RECYCLING OF PET
Some researchers reported minimum requirements for post-consumer PET flakes
which should be met to be successfully reprocessed. These recommendations are
shown in Table 1 (Pawlak, Pluta, Morawiec, Galeski & Pracella 2000; Scheirs 1998).
Table 1 Recommended minimum requirements of post-consumer PET flakes for a successful
reprocessing based on (Park & Kim 2014; Pawlak et al. 2000; Scheirs 1998)
Property Value [unit]
Intrinsic viscosity > 0.7 [dl/g]
Melting temperature > 240 [°C]
Water content < 0.02 [wt. %]
Flake size 0.4 – 8 [mm]
Dye content < 10 [ppm]
Yellowing index < 20
Metal content < 3 [ppm]
Polyvinylchloride (PVC) content < 50 [ppm]
Polyolefin content < 10 [ppm]
25
Table 1 gives a brief indication on possible contaminants that can affect the recycling
of post-consumer PET when certain limits are exceeded. Therefore, the next section
focuses a bit more in detail on possible contaminations and their influence on the
process.
2.7 CONTAMINATIONS
Several articles report from contaminations which impede or negatively influence
the reprocessing of PET. Table 2 gives an overview of the most common
contaminants, mainly focused on the recycling of PET food containers or household
waste as literature dealing explicitly with contaminations of post-consumer PET
textile waste and the associated problems during processing is not known by the
author. However, many of these contaminations are applicable to post consumer
polyester textiles.
Table 2 Overview and influence of contaminations on the recycling process
Contaminant Critical
processing
condition
Origin and influence on the
process
Source
PVC < 50 -100 ppm PVC is often found in labels
or fragments of vinyl bottles
but also used to coat textiles.
PVC increases the chain
scissoring due to the catalytic
effect of hydrochloric acid
which is produced by the
degradation of PVC
(Adanur
2008;
Awaja &
Pavel 2005;
Koo et al.
2013; Park
& Kim
2014)
Ethylene vinyl
acetate (EVA)
n/a EVA is used in the textile
industry as a hand building
finishing, for abrasion
resistant shoe soles and
weather and chemical
resistant material coatings. It
produces acidic compounds
for instance acetic acid during
the reprocessing. Through
thermal degradation this
catalyzes the hydrolysis of the
PET´s ester linkages
(Koo et al.
2013;
Reichelt
2020;
Schindler &
Hauser
2004)
Adhesives n/a Adhesives are found on PET
bottles and produce acidic
compounds e.g. abietic and
rosin acids during the
reprocessing of PET bottles.
These act as catalysts for the
(Awaja &
Pavel 2005;
Koo et al.
2013)
26
hydrolysis of the PET´s ester
linkages.
Poly (vinyl
acetate)
n/a Poly (vinyl acetate) occurs
form the degradation of
closures and produces acetic
acid during the reprocessing
of PET bottles. Acetic acid
catalyzes the chain scission
reactions
(Awaja &
Pavel 2005;
Koo et al.
2013)
Polyvinylidene
chloride
(PVDC)
n/a PVDC is used as a coating to
increase the barrier properties
of the PET and produces
acidic compounds. They
catalyze the hydrolysis of the
PETs´ester linkages.
(Koo et al.
2013)
Moisture < 0.01 – 0.02
wt. %
Reduces the MW due to two
degradation stages. At first a
hydrolysis of the PET´s ester
groups occur which originates
from the residual water in the
PET. This leads to the
formation of carboxyl acid
and hydroxyl ethyl ester chain
ends. The second stage is a
thermo-oxidative chain
scissoring.
(Nait-Ali,
Colin &
Bergeret
2011;
Scheirs
1998; Xi et
al. 2018)
Acetaldehyde n/a Is produced as a by-product of
the PET degradation when it
comes to chain scission near
the chain end. 80 % of the
organic volatile compounds
(OVP) produced during the
processing are acetaldehyde.
The formation can be reduced
by processing under vacuum
or by adding stabilizers.
(Nait-Ali,
Colin &
Bergeret
2011;
Scheirs
1998; Xi et
al. 2018)
Colors < 10 ppm Contamination form other
colors can influence the hue
of the reprocessed material
(Awaja &
Pavel 2005;
Pawlak et
al. 2000)
Chromophoric
groups, mainly
n/a very low
concentrations
They originate from colored
material. The anhydrides and
phenols can be transformed
into aromatic ketones of
(Awaja &
Pavel 2005;
Eriksen,
Pivnenko,
27
anhydrides and
phenols
quinone type, conjugated
ketoesters, various
conjugated aromatic
structures and polydiene
sequences which leads to the
discoloration of the recycled
material.
Olsson &
Astrup
2018)
Metals e.g. As,
Cd, Cr, Hg, Pb,
Sb, Ti
< 3 ppm Metals are used in polymers
as additives, catalysts or
fillers to enhance the
polymers´ properties.
Nevertheless, they can
promote transesterification
and polycondensation
reactions which affect the
melt rheological behavior of
the recycled PET as the
unwished side reactions lead
to chemical heterogeneity of
the polymer. In addition, the
metal content should be
monitored to not cause health
issues.
(Eriksen et
al. 2018;
Richard,
Boon,
Martin-
Shultz &
Sisson
1992)
Other
contaminants
n/a Contamination which occurs
intentionally like residues
from washing in apparel or
unintentionally e.g. stains
during usage or discharge of
the product
(Awaja &
Pavel 2005;
Eriksen et
al. 2018)
2.8 THERMOMECHANICAL POLYMER RECYCLING IN THE INDUSTRY
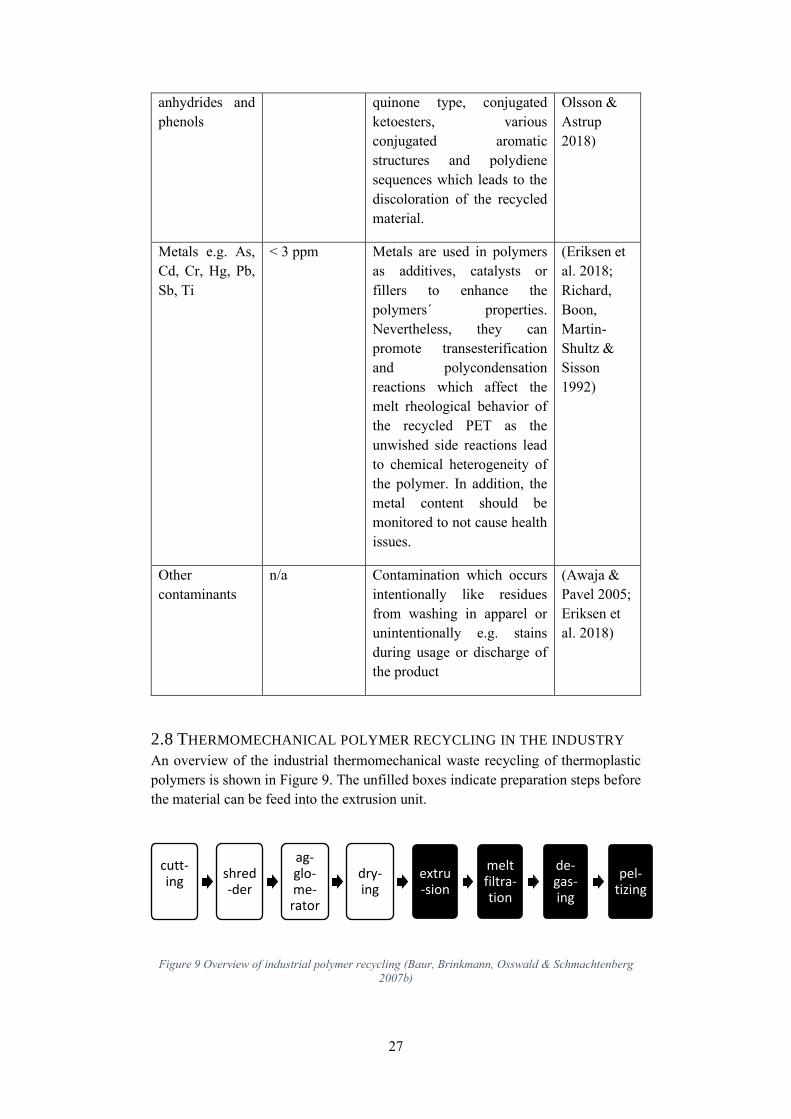
An overview of the industrial thermomechanical waste recycling of thermoplastic
polymers is shown in Figure 9. The unfilled boxes indicate preparation steps before
the material can be feed into the extrusion unit.
Figure 9 Overview of industrial polymer recycling (Baur, Brinkmann, Osswald & Schmachtenberg
2007b)
cutt-ingmill
shred-der
ag-glo-me-rator
dry-ing
extru-sion
meltfiltra-tion
de-gas-ing
pel-tizing
28
The drying procedure is crucial for the recycling of PET as absorbs moisture form
the air. Moist material can have a huge impact on the processing, not only regarding
the process stability but also the product quality. Moist polymers can lead to
foaming, demoulding problems, or variable process parameters due to viscosity
changes and hydrolysis. During processing undried polymers often generate product
defects such as bubbles, or cavities. Additionally, mechanical properties can be
decreased or the subsequent processing such as galvanizing or painting can be
problematic. Galvanizing or painting is more important for general plastic products
and less for textile material.(Eyerer 2012b)
In general textiles can be reprocessed like other PET materials but they have an
extremely low bulk density. This can be problematic when feeding the machines,
thus it is necessary to cut and densify the material before the textiles can be feed into
an extruder. The informal denomination of the prepared textiles is “textile popcorn”
as the cut pieces are densified with an (plate) agglomerator to increase the material´s
bulk density and the final product looks like popcorn after the processing. As a
comparison, the bulk density of textile popcorn is usually around 50-70 g/cm3,
whereas common polymer pellets have a bulk density of approximately 500 g/cm3.
A bulk density of at least 100 g/cm3 are desirable to process the material in an
extruder. Therefore, the agglomeration and raise of bulk density is very important
when recycling textiles. (Baur et al. 2007b)
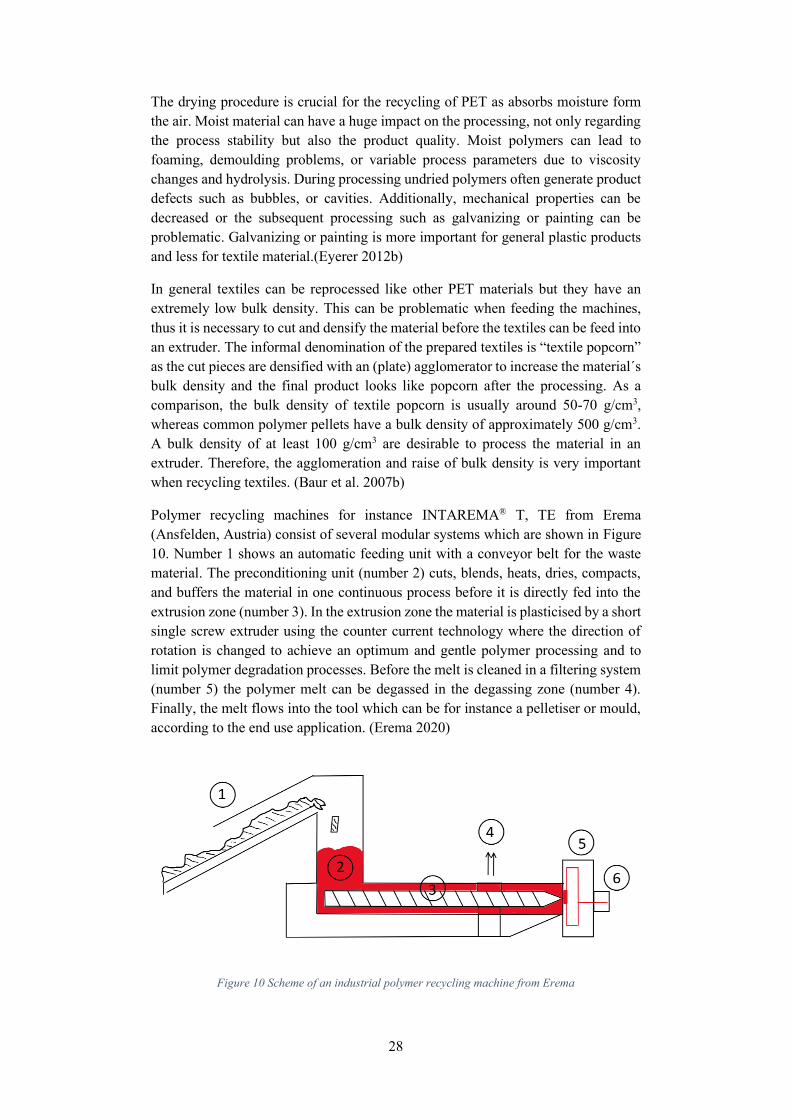
Polymer recycling machines for instance INTAREMA® T, TE from Erema
(Ansfelden, Austria) consist of several modular systems which are shown in Figure
10. Number 1 shows an automatic feeding unit with a conveyor belt for the waste
material. The preconditioning unit (number 2) cuts, blends, heats, dries, compacts,
and buffers the material in one continuous process before it is directly fed into the
extrusion zone (number 3). In the extrusion zone the material is plasticised by a short
single screw extruder using the counter current technology where the direction of
rotation is changed to achieve an optimum and gentle polymer processing and to
limit polymer degradation processes. Before the melt is cleaned in a filtering system
(number 5) the polymer melt can be degassed in the degassing zone (number 4).
Finally, the melt flows into the tool which can be for instance a pelletiser or mould,
according to the end use application. (Erema 2020)
Figure 10 Scheme of an industrial polymer recycling machine from Erema
29
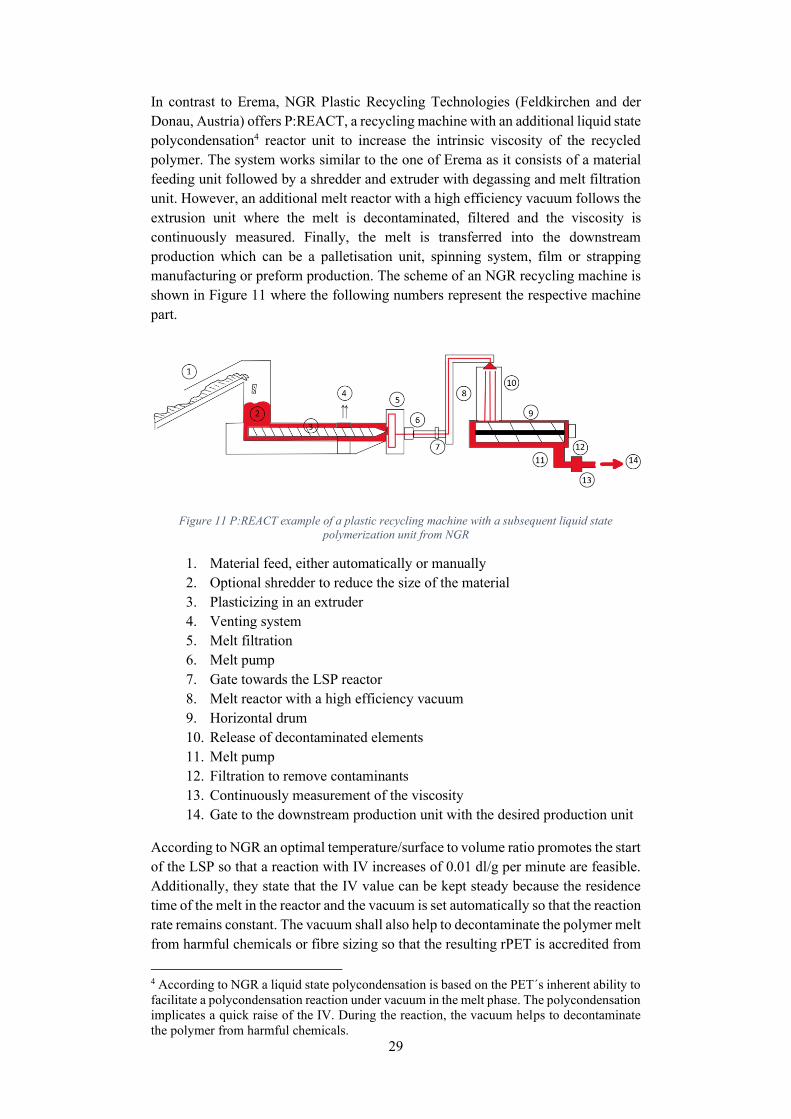
In contrast to Erema, NGR Plastic Recycling Technologies (Feldkirchen and der
Donau, Austria) offers P:REACT, a recycling machine with an additional liquid state
polycondensation4 reactor unit to increase the intrinsic viscosity of the recycled
polymer. The system works similar to the one of Erema as it consists of a material
feeding unit followed by a shredder and extruder with degassing and melt filtration
unit. However, an additional melt reactor with a high efficiency vacuum follows the
extrusion unit where the melt is decontaminated, filtered and the viscosity is
continuously measured. Finally, the melt is transferred into the downstream
production which can be a palletisation unit, spinning system, film or strapping
manufacturing or preform production. The scheme of an NGR recycling machine is
shown in Figure 11 where the following numbers represent the respective machine
part.
Figure 11 P:REACT example of a plastic recycling machine with a subsequent liquid state
polymerization unit from NGR
1. Material feed, either automatically or manually
2. Optional shredder to reduce the size of the material
3. Plasticizing in an extruder
4. Venting system
5. Melt filtration
6. Melt pump
7. Gate towards the LSP reactor
8. Melt reactor with a high efficiency vacuum
9. Horizontal drum
10. Release of decontaminated elements
11. Melt pump
12. Filtration to remove contaminants
13. Continuously measurement of the viscosity
14. Gate to the downstream production unit with the desired production unit
According to NGR an optimal temperature/surface to volume ratio promotes the start
of the LSP so that a reaction with IV increases of 0.01 dl/g per minute are feasible.
Additionally, they state that the IV value can be kept steady because the residence
time of the melt in the reactor and the vacuum is set automatically so that the reaction
rate remains constant. The vacuum shall also help to decontaminate the polymer melt
from harmful chemicals or fibre sizing so that the resulting rPET is accredited from
4 According to NGR a liquid state polycondensation is based on the PET´s inherent ability to
facilitate a polycondensation reaction under vacuum in the melt phase. The polycondensation
implicates a quick raise of the IV. During the reaction, the vacuum helps to decontaminate
the polymer from harmful chemicals.
30
the U.S. Food and Drug Administration (FDA) and European Food Safety Authority
EFSA for 100 % food contact. (NGR 2020)
2.9 EXTRUSION
In this work it is tried to facilitate chain coupling reactions in an extruder. The
extrusion process is known and designed for continuous production of thermoplastic
polymeric artefacts such as pipes or profiles because the machine provides consistent
polymer melts at high production rates. (Wagner, Mount & Giles 2014c)
Extruders are a great possibility to produce uniform polymer melts because polymers
have a low thermal conductivity and a high viscosity. Thus, it is hard to achieve an
equable melt in vessels like a stirred tank where the portions next to the heating
elements would melt while the other portions remain cold and solid. To avoid this
large and inhomogeneous temperature gradients, long heating times and degradation
of the portions next to the heating, which would occur in a stirred tank, the extruder
uses external heat and shear forces to melt the polymer. The fast melting in an
extruder is possible because the polymer only melts in a thin film which is
continuously removed and restocked with solid material.
During extrusion, the melt is automatically conveyed forward, for the further
processing, and new solid material is drawn into the machine so that a continuous
process is established. Therefore this device is an efficient and inexpensive machine
to produce polymer melts. (Mount 2017) There are different machine types such as
a planetary roller extruder but the two most commonly types for the processing of
virgin polymers are single and twin-screw extruders. A twin-screw extruder is
chosen for this work because it has a better polymer mixing than single screw
extruders and better possibilities to control the process parameters studied in this
work. Additionally, twin-screw extruders are commonly used for reactive extrusions
which is in principle similar to the chain coupling reactions that should be conducted
in this thesis. (Mount 2017)
2.9.1 FEEDING
Twin-screw extruders are normally starve fed. Starve feeding means that the feeder
deposits the polymer directly on the extruder screw and no material is built up as the
screw conveys the material faster than it is deposited in the extruder. Consequently,
the extruder´s throughput rate is determined by the feeding rate and not the screw
rotation rate. Typical feeding problems such as bridging are usually eliminated when
starve feeding an extruder. (Wagner, Mount & Giles 2014c) Bridging can have
several origins for instance material softening in the feed hopper and adhering to its
walls so that a melt bridge hinders material to enter the feeding zone. However
bridging can also occur due to low bulk density materials such as fibre fluff.
(Wagner, Mount & Giles 2014a)
2.9.2 TEMPERATURE SETTINGS
The extruder temperature profile depends on different variables like the raw material
or screw design. To deliver a well melted and homogeneously blended polymer melt
with an adequate die pressure, the temperature setting is crucial. In general, there are
different options for the temperature profiles. The temperature can either increase
from the feeding to the die or vice versa. However, a flat or humped profile, where
the temperature increases from the feed hopper to the middle and then decreases
31
towards the die, is also possible. (Wagner, Mount & Giles 2014b) The most suitable
temperature profile depends on the given resin and its viscosity linked with the screw
design and throughput rate of the extruder. Normally it is central to optimize the
temperature to achieve the maximum output at minimized polymer degradation
while considering the screw design. However, the extruder throughput is not
important for this thesis as the aim is not to achieve a high productivity
2.9.3 SCREW ROTATION RATE
In a starve fed extruder, the screw rotation rate controls the mixing, melting, pressure
generation and the melt temperature and affects the fill of the screw flights, the
residence time in the extruder as well as the torque level. (Wagner, Mount & Giles
2014f)
The extrusion process is an equilibrium process. Therefore, it takes some time after
starting or changing parameters until the polymer melt reaches the steady state
conditions and produces a constant extrudate. The time necessary to reach the steady
state depends on the extruder size. Small extruders (up to 6.35 cm) need
approximately 20 min to 40 min to reach the equilibrium. Within this time, it should
also be avoided to change the process conditions. This applies also for changes in
the screw rotation rate as these changes are not instantaneous. Screw rotation rate
modifications alter the generation of viscous heat5 due to shear forces. Therefore, the
temperature control system of the extruder needs time to react on the changed
temperature of the metal barrel which is influenced due to the shear heat caused by
the screw rotation. (Wagner, Mount & Giles 2014b)
2.9.4 SCREWS OF PARALLEL TWIN SCREW EXTRUDER
In general (parallel) twin-screw extruders can be divided in co- and counterrotating
machines, depending on the rotation of the screws. When both extruder screws rotate
in the same direction, they are called corotating, while in counterrotating extruders
one screw rotates clockwise while the other one is rotating counterclockwise, so the
screws rotate in different directions. Additionally, the distance between the two
screws can be varied. The screw diameter of intermeshing screws is bigger than the
centerline distance between the shafts whereas screws are called non-intermeshing
when the distance between the screw shafts is equal to the diameter of the screw.
Non-intermeshing corotating twin-screw extruders are not in practical use in contrast
to intermeshing corotating twin-screw extruders. The degree of intermeshing
determines the generated shear and the material flow. Based on the screw design the
material flow can be open or closed. The screw is defined as open in the longitudinal
direction when the material can flow form the feeding zone to the die in an axial or
longitudinal direction. (Wagner, Mount & Giles 2014d) For compounding (e.g.
colorants, fillers, or stabilizers) and devolatilization (to remove solvents or
byproducts which develop for instance due to reactive extrusions conducted in the
extruder) of resins corotating and intermeshing high-speed extruders are usually
used. Profiles and pipes are usually produced with low speed corotating as well as
counterrotating and intermeshing extruders. In contrast, counterrotating and non-
intermeshing twin-screw extruders are used for devolatilization and chemical
5 Viscous heating is the generation of heat due to the shear forces of a fluid on adjacent layers.
(Morini 2013)
32
reactions such as polycondensations, polyadditions, controlled crosslinking and
grafting reactions as well as functionalization. (Wagner, Mount & Giles 2014d)
2.9.5 DEVOLATILIZATION
Devolatilization is used to remove volatile compounds from the extruder melt. This
can assist to increase the molecular weight of condensation polymers such as PET
because the polymer melt is dewatered and volatile degradation products which
develop during the process can be removed. Additionally, the venting, no matter if
it is an open barrel vent port at atmospheric pressure or a vacuum, subtracts air
moisture and/or volatiles prior the melt exits the die. Nevertheless, to prevent a
backing up and expulsion of the pressurized polymer melt in the die section, the vent
port is usually at least one barrel section before the extruder end. (Wagner, Mount &
Giles 2014e) Depending on the number of by-products the vacuum level can be
adjusted. The polymer melt must be exposed to the venting area for a sufficient
amount of time so that the volatiles can diffuse in the open vent and be removed.
(Wagner, Mount & Giles 2014c)
2.9.6 DIE PRESSURE
The die is responsible to shape the polymer melt into the desired form while it
influences the physical properties of the product as it controls the molecular
orientation in the product. Additionally, it controls the products surface esthetics. In
general dies can be divided in three zones, the entrance, transition or distribution and
the final land section. The final land section secures the final characteristics and the
product shape before the polymer melt leaves the die. The die controls to a certain
extent the extrudate swell6 and the back or head pressure. (Wagner, Mount & Giles
2014a) The die pressure ensures together with the temperature a reproducible
product (assuming a constant melt viscosity).
In contrast to counterrotating twin screw extruders, which are run at lower speeds
and generate brilliant die pressures, corotating twin screw extruder have excellent
mixing properties and produce very homogeneous products at higher speeds, but
they do not generate high die pressures. The processing conditions of counterrotating
twin screw extruders produce less shear compared to the conditions that apply for
the processing in corotating twin screw extruders. (Wagner, Mount & Giles 2014d)
2.10 PROBLEM DESCRIPTION
Until now the thermomechanical recycling of polymers often come along with
polymer degradation and inferior material properties. The polymer degrades during
usage and exposition to harsh environments such as heat and shear forces during the
reprocessing which promotes chain scission so that the molecular weight and the
intrinsic viscosity are decreased.
The recycling of post-consumer waste without polymer degradation would have
beneficial environmental impacts as new resources are saved, waste is reduced and
less emissions are produced. An additional increase of the polymers´ molecular
weight while recycling would pave the way for, a product to product recycling.
6 Wagner, Mount and Giles state that the word extrudate swell should be preferred instead of
die swell because extrudate swell is the more precise term. As the die cannot swell, in contrast
to the extrudate. (Wagner, Mount & Giles 2014e)
33
Moreover, facilitating this process on well-established machines with low
investment costs, like an extruder would enable everyone the way towards a more
sustainable and circular economy. As new products of high quality could be
produced from discarded instead of virgin material.
To increase the molecular weight of the recycled PET, many researchers work on
the improvement of well-established methods like the solid-state-polymerization or
chain extenders. So far little attention has been paid to the potential of
polycondensation or (trans)esterification reactions of PET in the molten state. In a
recent study, Wang et al (2019) and Chen et al (2020) examined melt post-
polycondensation reactions of PET. However, they facilitated the increase of the
molecular weight in a rheometer and a glass reactor but not in an extruder which
could produce/recycle appropriate amounts in a suitable time.
2.11 LIMITATIONS
This work emphasises only on synthetic materials, especially PET, all other (textile)
materials, and blends are disregarded. Additionally, the materials which are going to
be used are virgin PET pellets and textile industrial scrap to avoid contaminations
and simplify the experiments. This work is only focused on thermomechanical
recycling in an extruder as a reaction vessel, all other recycling methods are
excluded. Other methods to increase the molecular weight of a polymer like a solid-
state-polymerization or the use of chain extenders are not within the scope of this
work as it is tried to facilitate chain coupling reactions without any additional
substances.
3. MATERIALS AND METHODS The following sections describe and explain the materials and methods used for the
experiments.
3.1 MATERIALS
Contaminations have a huge influence on the thermomechanical recyclability of PET
and can negatively influence the process. To investigate the concept, the
experimental conditions are simplified by using virgin material instead of post-
consumer waste. Accordingly, possible failure causes such as additive
contaminations are eliminated. Additionally, the type of contaminations can neither
be classified nor quantified in post-consumer waste easily.
Virgin PET pellets T49H from Indorama (Bangkok, Thailand) were used.
Additionally, undyed and unfinished industrial scrap textiles form Karl Otto Braun
GmbH & Co. KG (Wolfstein, Germany) were used for pre-experiments. The woven
fabric consists of 100 % polyester with one viscose filament in the leno selvedge.
The selvedge is cut off and discarded to have a 100 % polyester fabric.
Black PET with a 10 % carbon nano tube content was used for pre-experiments to
approximately determine the residence time of the polymer in the extruder. The
carbon nano tubes are not necessary for the experiment, but they provide a black
color which indicates the end of the residual timing.
34
3.1.1 DRYING OF THE MATERIAL
During polymerization, the final molecular weight of condensation polymers, such
as PET, is determined by the equilibrium water content in the molten polymer.
Consequently the MW is related to the removal of the produced by products, as
explained in section 2.1 Poly (ethylene terephthalate). (Wagner, Mount & Giles
2014c)
It is necessary to firmly dry the PET to prevent hydrolysis during processing. Within
different scientific papers, disagreements in the drying time and temperature of PET
appear. The time span ranged from 1 to 18 h where the temperatures varied between
110 °C and 170 °C. Additionally, some researchers used a normal and some a
vacuum oven to dry the pellets. (Assadi, Colin & Verdu 2004; Awaja & Pavel 2005;
Chen et al. 2016; Duh 2002; Karayannidis, Kokkalas & Bikiaris 1993; Pawlak et al.
2000; Po et al. 1992; Qiu et al. 1997; Scheirs 1998; Wang et al. 2019)
For this thesis, a vacuum oven from Fourné (Alfter-Impekoven, Konstanz, Germany)
was used. In total at least 15 kg virgin PET granulate was dried at 120°C over night
(approximately 14 h) and under vacuum in the oven for all experiments. These
settings were chosen as drying overnight is from practical use and comparably low
temperatures are gentler for the material when exposing it for a long time to the heat
in the oven. After drying, the pellets were stored in a plastic barrel with lid to avoid
air contact. This is crucial as moist-sensitive materials pick up ambient moisture
when released from the oven, especially while cooling from the drying to ambient
temperature (Wagner, Mount & Giles 2014c). Thus, it is recommended to let the
polymer cool down in the oven after drying. Samples were taken to measure the
water content of the PET granulates with a Karl-Fischer titration directly after
releasing the material from the oven. The samples had an average water content of
115.6 ppm. According to Table 1 on page 24, the recommendations for reprocessing,
the moisture content should be below 0.02 wt. % which corresponds to 200 ppm. As
the measured water content was with an average of 115.6 ppm significantly below
200 ppm, the PET was considered as dry even though it is higher than the 0.008%
suggested by Chen et al (2020).
Additionally, moisture can lead to surface imperfections of the extrudate (e.g. splay,
holes or foamy products). The imperfections arise because moisture is converted into
steam due to the high temperatures during the extrusion. The extent of flaws depends
on the moisture quantity present in the polymer. Furthermore, over drying of the
granulate should be avoided as this leads to a decline of material properties and/or
undesired color changes. (Wagner, Mount & Giles 2014c)
3.2 EXTRUSION
The granulate can also be blended with additives such as stabilizers (e.g. for heat or
UV light), colorants or fillers before processing (Wagner, Mount & Giles 2014c).
However, for this experiments no additives are added to the PET pellets.
After feeding the polymer through a hopper the formulation enters the feeding zone
of the extruder. Afterwards the screw conveys the material through the melting and
melt pumping zone through the extruder where the formulation is melted, mixed,
maybe degassed and delivered to the die. While exiting the extruder, the polymer
melt is pulled with a constant velocity to draw the artefact in the specified
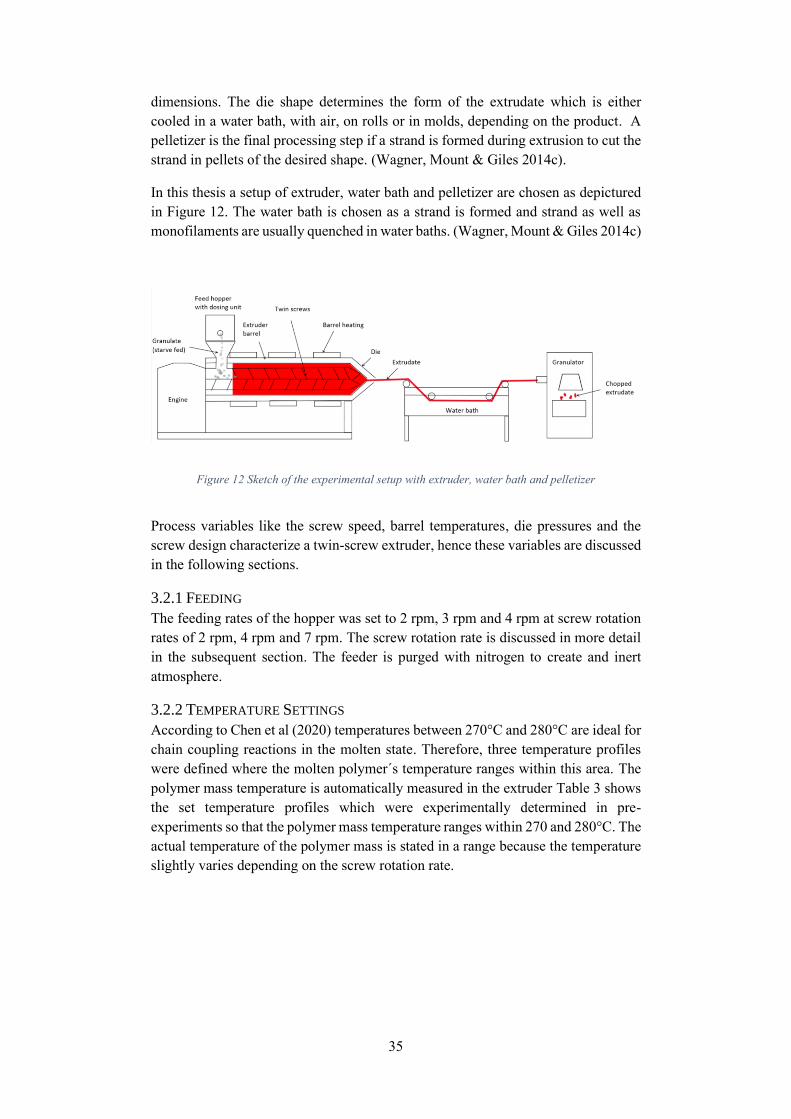
35
dimensions. The die shape determines the form of the extrudate which is either
cooled in a water bath, with air, on rolls or in molds, depending on the product. A
pelletizer is the final processing step if a strand is formed during extrusion to cut the
strand in pellets of the desired shape. (Wagner, Mount & Giles 2014c).
In this thesis a setup of extruder, water bath and pelletizer are chosen as depictured
in Figure 12. The water bath is chosen as a strand is formed and strand as well as
monofilaments are usually quenched in water baths. (Wagner, Mount & Giles 2014c)
Figure 12 Sketch of the experimental setup with extruder, water bath and pelletizer
Process variables like the screw speed, barrel temperatures, die pressures and the
screw design characterize a twin-screw extruder, hence these variables are discussed
in the following sections.
3.2.1 FEEDING
The feeding rates of the hopper was set to 2 rpm, 3 rpm and 4 rpm at screw rotation
rates of 2 rpm, 4 rpm and 7 rpm. The screw rotation rate is discussed in more detail
in the subsequent section. The feeder is purged with nitrogen to create and inert
atmosphere.
3.2.2 TEMPERATURE SETTINGS
According to Chen et al (2020) temperatures between 270°C and 280°C are ideal for
chain coupling reactions in the molten state. Therefore, three temperature profiles
were defined where the molten polymer´s temperature ranges within this area. The
polymer mass temperature is automatically measured in the extruder Table 3 shows
the set temperature profiles which were experimentally determined in pre-
experiments so that the polymer mass temperature ranges within 270 and 280°C. The
actual temperature of the polymer mass is stated in a range because the temperature
slightly varies depending on the screw rotation rate.
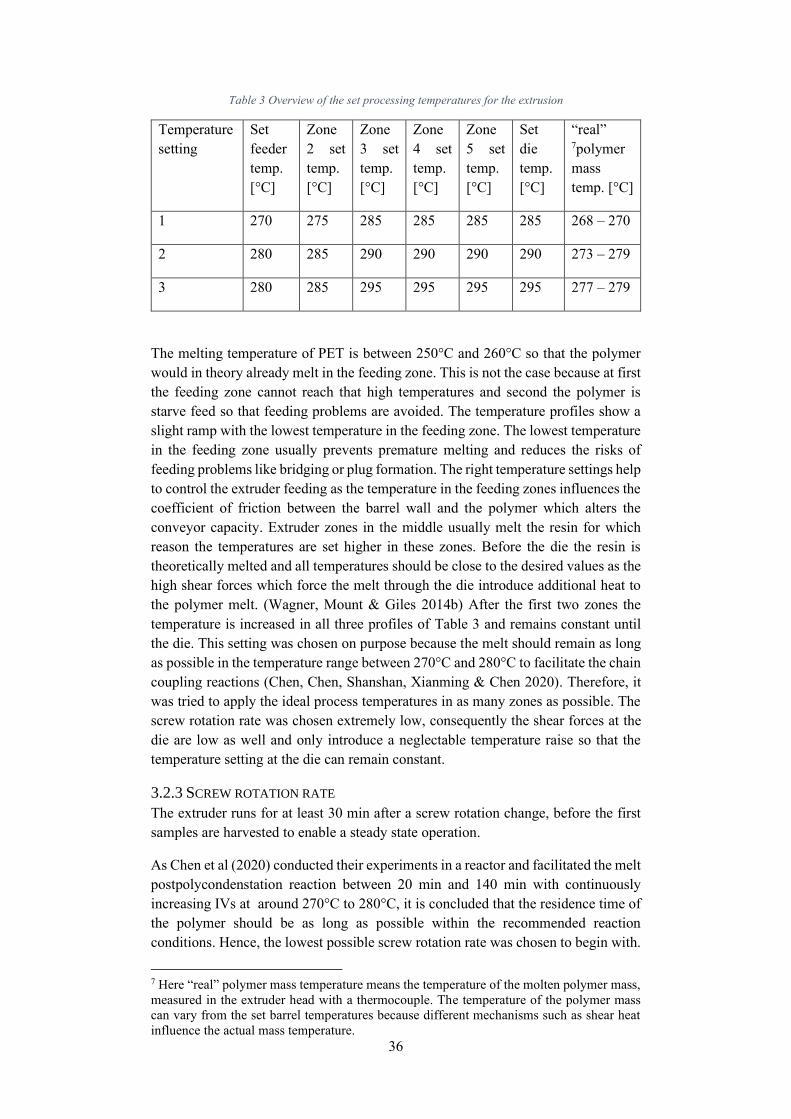
36
Table 3 Overview of the set processing temperatures for the extrusion
Temperature
setting
Set
feeder
temp.
[°C]
Zone
2 set
temp.
[°C]
Zone
3 set
temp.
[°C]
Zone
4 set
temp.
[°C]
Zone
5 set
temp.
[°C]
Set
die
temp.
[°C]
“real” 7polymer
mass
temp. [°C]
1 270 275 285 285 285 285 268 – 270
2 280 285 290 290 290 290 273 – 279
3 280 285 295 295 295 295 277 – 279
The melting temperature of PET is between 250°C and 260°C so that the polymer
would in theory already melt in the feeding zone. This is not the case because at first
the feeding zone cannot reach that high temperatures and second the polymer is
starve feed so that feeding problems are avoided. The temperature profiles show a
slight ramp with the lowest temperature in the feeding zone. The lowest temperature
in the feeding zone usually prevents premature melting and reduces the risks of
feeding problems like bridging or plug formation. The right temperature settings help
to control the extruder feeding as the temperature in the feeding zones influences the
coefficient of friction between the barrel wall and the polymer which alters the
conveyor capacity. Extruder zones in the middle usually melt the resin for which
reason the temperatures are set higher in these zones. Before the die the resin is
theoretically melted and all temperatures should be close to the desired values as the
high shear forces which force the melt through the die introduce additional heat to
the polymer melt. (Wagner, Mount & Giles 2014b) After the first two zones the
temperature is increased in all three profiles of Table 3 and remains constant until
the die. This setting was chosen on purpose because the melt should remain as long
as possible in the temperature range between 270°C and 280°C to facilitate the chain
coupling reactions (Chen, Chen, Shanshan, Xianming & Chen 2020). Therefore, it
was tried to apply the ideal process temperatures in as many zones as possible. The
screw rotation rate was chosen extremely low, consequently the shear forces at the
die are low as well and only introduce a neglectable temperature raise so that the
temperature setting at the die can remain constant.
3.2.3 SCREW ROTATION RATE
The extruder runs for at least 30 min after a screw rotation change, before the first
samples are harvested to enable a steady state operation.
As Chen et al (2020) conducted their experiments in a reactor and facilitated the melt
postpolycondenstation reaction between 20 min and 140 min with continuously
increasing IVs at around 270°C to 280°C, it is concluded that the residence time of
the polymer should be as long as possible within the recommended reaction
conditions. Hence, the lowest possible screw rotation rate was chosen to begin with.
7 Here “real” polymer mass temperature means the temperature of the molten polymer mass,
measured in the extruder head with a thermocouple. The temperature of the polymer mass
can vary from the set barrel temperatures because different mechanisms such as shear heat
influence the actual mass temperature.
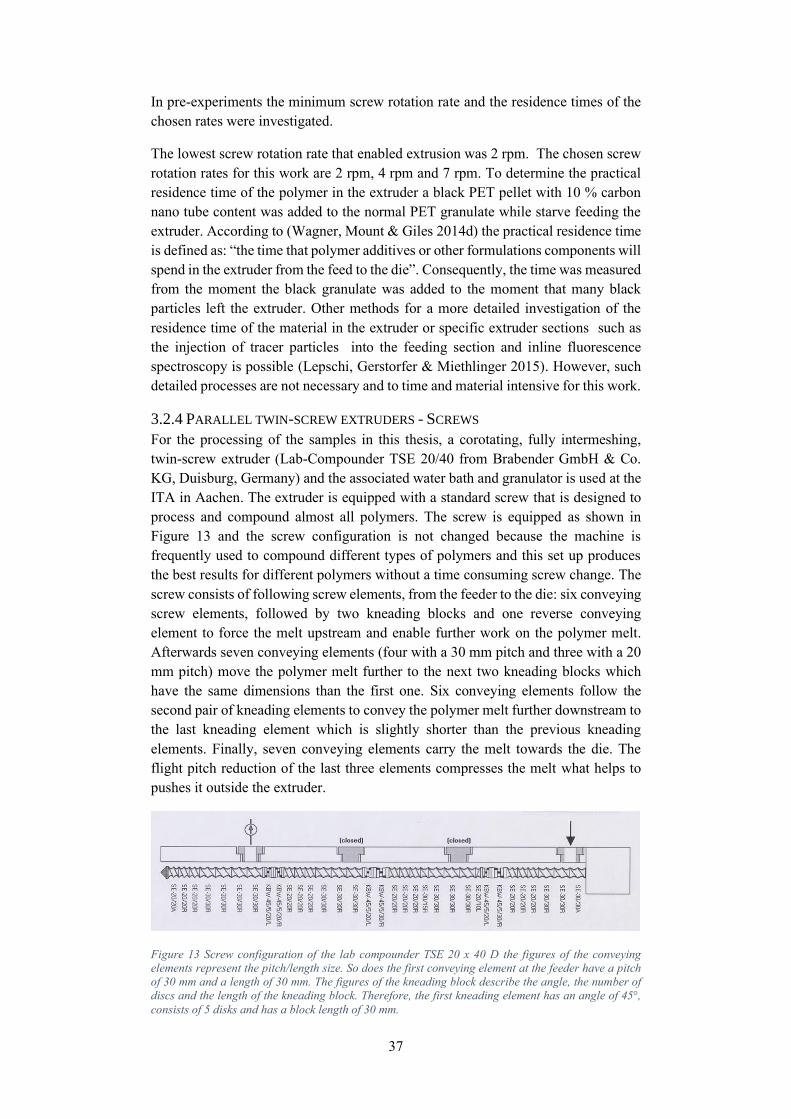
37
In pre-experiments the minimum screw rotation rate and the residence times of the
chosen rates were investigated.
The lowest screw rotation rate that enabled extrusion was 2 rpm. The chosen screw
rotation rates for this work are 2 rpm, 4 rpm and 7 rpm. To determine the practical
residence time of the polymer in the extruder a black PET pellet with 10 % carbon
nano tube content was added to the normal PET granulate while starve feeding the
extruder. According to (Wagner, Mount & Giles 2014d) the practical residence time
is defined as: “the time that polymer additives or other formulations components will
spend in the extruder from the feed to the die”. Consequently, the time was measured
from the moment the black granulate was added to the moment that many black
particles left the extruder. Other methods for a more detailed investigation of the
residence time of the material in the extruder or specific extruder sections such as
the injection of tracer particles into the feeding section and inline fluorescence
spectroscopy is possible (Lepschi, Gerstorfer & Miethlinger 2015). However, such
detailed processes are not necessary and to time and material intensive for this work.
3.2.4 PARALLEL TWIN-SCREW EXTRUDERS - SCREWS
For the processing of the samples in this thesis, a corotating, fully intermeshing,
twin-screw extruder (Lab-Compounder TSE 20/40 from Brabender GmbH & Co.
KG, Duisburg, Germany) and the associated water bath and granulator is used at the
ITA in Aachen. The extruder is equipped with a standard screw that is designed to
process and compound almost all polymers. The screw is equipped as shown in
Figure 13 and the screw configuration is not changed because the machine is
frequently used to compound different types of polymers and this set up produces
the best results for different polymers without a time consuming screw change. The
screw consists of following screw elements, from the feeder to the die: six conveying
screw elements, followed by two kneading blocks and one reverse conveying
element to force the melt upstream and enable further work on the polymer melt.
Afterwards seven conveying elements (four with a 30 mm pitch and three with a 20
mm pitch) move the polymer melt further to the next two kneading blocks which
have the same dimensions than the first one. Six conveying elements follow the
second pair of kneading elements to convey the polymer melt further downstream to
the last kneading element which is slightly shorter than the previous kneading
elements. Finally, seven conveying elements carry the melt towards the die. The
flight pitch reduction of the last three elements compresses the melt what helps to
pushes it outside the extruder.
Figure 13 Screw configuration of the lab compounder TSE 20 x 40 D the figures of the conveying
elements represent the pitch/length size. So does the first conveying element at the feeder have a pitch
of 30 mm and a length of 30 mm. The figures of the kneading block describe the angle, the number of
discs and the length of the kneading block. Therefore, the first kneading element has an angle of 45°,
consists of 5 disks and has a block length of 30 mm.
38
3.2.5 DEVOLATILIZATION
In this thesis it is also planned to connect a Festo vacuum system (Festo SE & Co.
KG, Esslingen am Neckar, Germany) to extruder zone 4 to remove the volatile
compounds and by products that arise from possible chain coupling reactions.
3.3 POLYMER CHARACTERIZATION
This section considers and explains the different characterization methods used, to
investigate how the polymer changed during the processing.
3.3.1 MOLECULAR WEIGHT/INTRINSIC VISCOSITY
The polymer´s intrinsic viscosity was determined at the University of Borås in
accordance with ISO 1628-1:2009, where the material was dissolved in a suitable
solvent. For PET following solvents mixtures can be used: Phenol and 1,2
Dichlorobenzene (50/50), Phenol and 1,1,2,2-Tetrachloroethane (50/50 or 60/40), o-
chlorophenol or dichloroacetic acid.
A stock solution with a mixture of 60 wt. % Phenol and 40 wt. % 1,1,2,2-
Tetrachloroethane (TCE) was used because it is proposed in the standard and Chen
et al (2020) used this solvent as well for their IV measurements. To prepare the stock
solution, 160.5 g of solid phenol was dissolved in 107g 1,1,2,2-Tetracholoroethane.
For the preparation of the PET solution, 100 mg PET (100 mg PET correlate to a
concentration of 0.5 g/dL) was dissolved in approximately 20 ml of the Phenol/TCE
stock solution and heated in an oil bath at 130 °C. The solution was stirred with a
magnetic stirrer, to enhance the dissolution of the PET.
In general, it is indispensable to use a suitable capillary size according to the sample
that is going to be characterized. For this measurement, a 501 13 capillary with
capillary number 1c according to ISO 1628-1:2009 from SI Analytics (Mainz,
Germany) was used. The standard recommends filtering the solution with a glass
filter before an aliquot solution of 15 ml is pipetted into the filling tube to remove
contaminations or undissolved particles which could block the capillary. However,
the solution was not filtered before filled into the Ubbelohde viscometer and
remained there for at least 5 min to settle before the first measurement. Afterwards
a vacuum pump sucked the sample into the measuring sphere of the tube with the
capillary.
First the running time of the neat solvent was measured to determine 𝑡0.
Subsequently the other samples were measured. Each sample was tested at least four
times. After the measurement of one sample, the capillary was emptied and flushed
with 5 ml of pure solvent before the next sample was tested. The intrinsic viscosity
(𝜂) was calculated from the specific viscosity (𝜂𝑠𝑝) according to Equation 5. In
Equation 5, c [g/dl] represents the concentration of the solution and 𝜂𝑠𝑝 the specific
viscosity which was calculated as shown in Equation 6 where 𝑡0 is the flow time of
the pure solvent through the capillary tube and 𝑡1 is the running time of the polymer
solution through the capillary. 𝜂𝑟 is the relative viscosity which is calculated by
dividing 𝑡1through 𝑡0. (Chen et al. 2020)
39
Equation 5 Calculation of the intrinsic viscosity from the dilute viscosity measurement (Chen et al.
2020)
[𝜂] =√1 + (1.4𝜂𝑠𝑝) − 1
0.7𝑐
Equation 6 Calculation of the specific viscosity from the running times of the dilute viscosity
measurement (Chen et al. 2020)
𝜂𝑠𝑝 =𝑡1 − 𝑡0
𝑡0= 𝜂𝑟 − 1
3.3.2 STATISTICAL ANALYSIS OF THE INTRINSIC VISCOSITY
It is investigated if the two extrusion parameters (temperature and screw rotation
rate) and their interaction have a statistically significant effect on the intrinsic
viscosity/molecular weight of the PET.
As the temperature and the screw rotation rate are two independent variables with
three levels each, and the intrinsic viscosity of the PET is the dependent variable, a
two-way ANOVA with a 95 % confidence interval is chosen. The statistical analysis
is conducted by using the IBM SPSS statistics 27 software from IBM.
A two-way ANOVA (analysis of variance) is selected as the effect of two factors on
the intrinsic viscosity shall be investigated. For this statistical method it is necessary
to propose three null hypotheses (𝐻0) and the related alternate hypotheses (H1) that
are accepted if the null hypothesis is rejected.
𝐻01: There is no influence of the temperature on the intrinsic viscosity of the PET.
𝐻11: The temperature decreases the intrinsic viscosity of the PET.
𝐻02: There is no influence of the screw rotation rate on the intrinsic viscosity of the
PET.
𝐻12: The screw rotation rate decreases the intrinsic viscosity of the PET.
𝐻03: There are no interaction effects between the first and second factor.
𝐻13: The interaction of the temperature and screw rotation decreases the intrinsic
viscosity of the PET
Factor one, the temperature, ranges between 285°C, 290 °C and 295 °C as the set
temperature. The screw rotation rate is the second factor, which has values of 2 rpm,
4 rpm and 7 rpm. Three samples of each extrusion combination were taken, and their
intrinsic viscosity was determined by using an Ubbelohde capillary viscometer and
a 60/40 wt. % solvent mixture of phenol and 1,1,2,2 – tetrachloroethane. Table 4
gives an overview of the processing conditions of the samples as well as their
measured intrinsic viscosities. This builds the fundament for the statistical analysis.
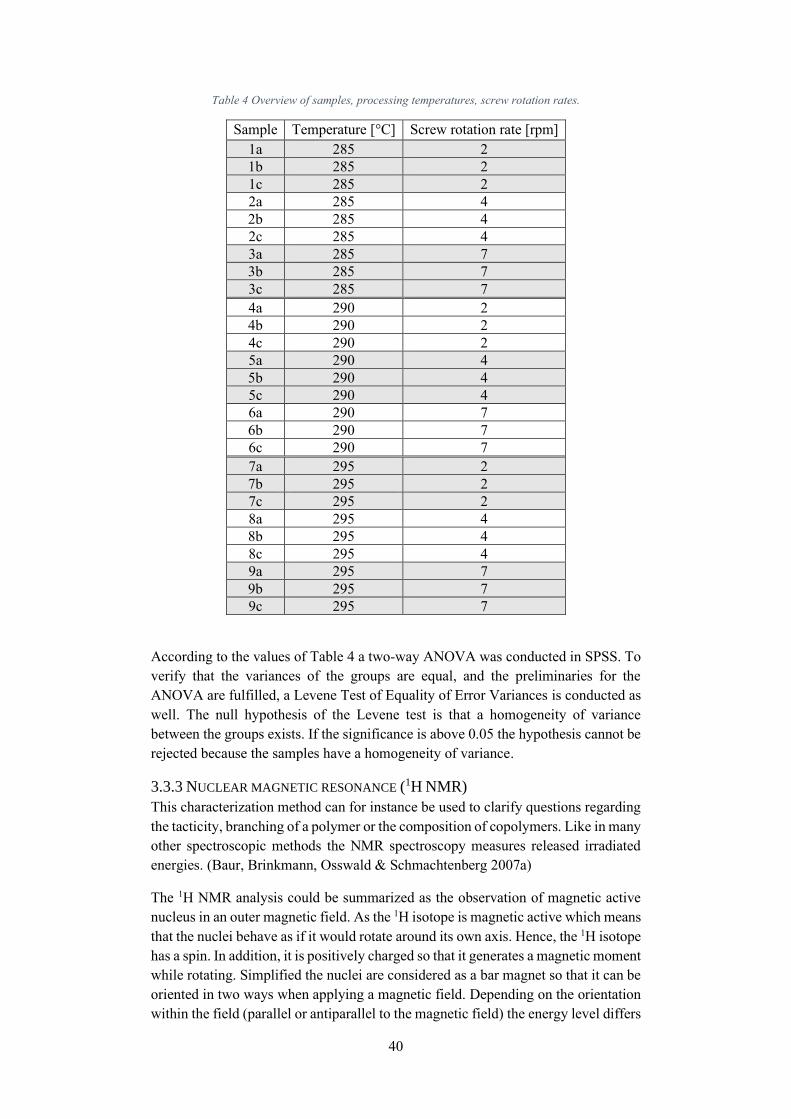
40
Table 4 Overview of samples, processing temperatures, screw rotation rates.
Sample Temperature [°C] Screw rotation rate [rpm]
1a 285 2
1b 285 2
1c 285 2
2a 285 4
2b 285 4
2c 285 4
3a 285 7
3b 285 7
3c 285 7
4a 290 2
4b 290 2
4c 290 2
5a 290 4
5b 290 4
5c 290 4
6a 290 7
6b 290 7
6c 290 7
7a 295 2
7b 295 2
7c 295 2
8a 295 4
8b 295 4
8c 295 4
9a 295 7
9b 295 7
9c 295 7
According to the values of Table 4 a two-way ANOVA was conducted in SPSS. To
verify that the variances of the groups are equal, and the preliminaries for the
ANOVA are fulfilled, a Levene Test of Equality of Error Variances is conducted as
well. The null hypothesis of the Levene test is that a homogeneity of variance
between the groups exists. If the significance is above 0.05 the hypothesis cannot be
rejected because the samples have a homogeneity of variance.
3.3.3 NUCLEAR MAGNETIC RESONANCE (1H NMR)
This characterization method can for instance be used to clarify questions regarding
the tacticity, branching of a polymer or the composition of copolymers. Like in many
other spectroscopic methods the NMR spectroscopy measures released irradiated
energies. (Baur, Brinkmann, Osswald & Schmachtenberg 2007a)
The 1H NMR analysis could be summarized as the observation of magnetic active
nucleus in an outer magnetic field. As the 1H isotope is magnetic active which means
that the nuclei behave as if it would rotate around its own axis. Hence, the 1H isotope
has a spin. In addition, it is positively charged so that it generates a magnetic moment
while rotating. Simplified the nuclei are considered as a bar magnet so that it can be
oriented in two ways when applying a magnetic field. Depending on the orientation
within the field (parallel or antiparallel to the magnetic field) the energy level differs
41
so that two different energy level arise for the 1H nucleus. Most of the nuclei are in
the lower energy level so that they need to be exposed to a certain frequency to be
promoted into the next higher energy level. A suitable irradiation leads to a
resonance, so the spin is inverted, and the introduced energy is absorbed. The
absorbed energy is measured in NMR. After promotion, the nuclei falls back to the
lower energy level and release the absorbed energy as heat. (Schläger n/a)
The 1H NMR analysis is conducted at the KTH, Skolan för kemi, bioteknologi och
hälsa, Fiber och Polymerteknologi in Stockholm. The samples are investigated with
a Bruker Avance 400 Fourier-transform nuclear magnetic resonance spectrometer
(FT NMR) operating at 400 MHz with the associated software. The PET is dissolved
in a mixture of trifluoroacetic acid (TFA) and deuterated chloroform (1:10). The scan
runs for 10 min, the obtained spectrum is shifted accordingly the solvent.
3.3.4 DIFFERENTIAL SCANNING CALORIMETRY (DSC)
DSC is used to identify endo- or exothermal processes which are based on
crystallization, glass transition or disorientation processes. Therefore, it is used in
practice to determine the melting, glass transition and crystallization temperature.
Additionally, the degree of crystallinity can be determined. (Baur et al. 2007a)
For the measurement two pans, are equally and constantly heated in an oven so that
a constant mean temperature input is retained. One pan contains 8 to 12 mg of the
processed PET sample while the other pan is empty. The obtained thermograms
show the change in enthalpy that occurred as the areas under the peaks are
proportional to the amount of heat energy which was used to maintain both samples
at the same temperature. With a calibration of the instrument the heat capacity can
be calculated in a quantitative manner.
The DSC is conducted at the University of Applied Sciences Kaiserslautern and used
to determine and compare the Tm and Tg as well as the degree of crystallinity of the
sample prior and subsequent the processing. For the evaluation of the melting
temperature, the graph of the second heating cycle is used whereas the first cooling
cycle of each run is used to determine the degree of crystallinity. A DSC 7 from
Perkin Elmer and the associated aluminum pans (pan: Perkin-Elmer DSC part no
BO14-3019, pans with 50μL, 0.1 x 2.1 with holes) and lids (Perkin-Elmer DSC part
no. BO14-3004 cover 0.15) were used to conduct the measurement. The
measurement started with an isothermal condition at 25°C for 1 min. Afterwards the
pans are heated from 25°C to 300°C at a heating rate of 10°C/ min, cooled form
300°C to 25°C and heated again from 25°C to 300°C, both at a heating rate of
10°C/min. Finally, the pans are cooled from 300°C to 25°C at a heating rate of
50°C/min as this cooling cycle is not important for the measurements. The samples
1a,b,c to 9 a,b, and c were tested as well as the virgin, unprocessed PET pellet as a
reference material.
The Pyris software form Pekin Elmer was used for the data analysis. Intervals for
the data analysis were taken from one visible inflection point of the curve to the
other. In the case of overlapping peaks, the values for ΔH were added to obtain the
total ΔH.
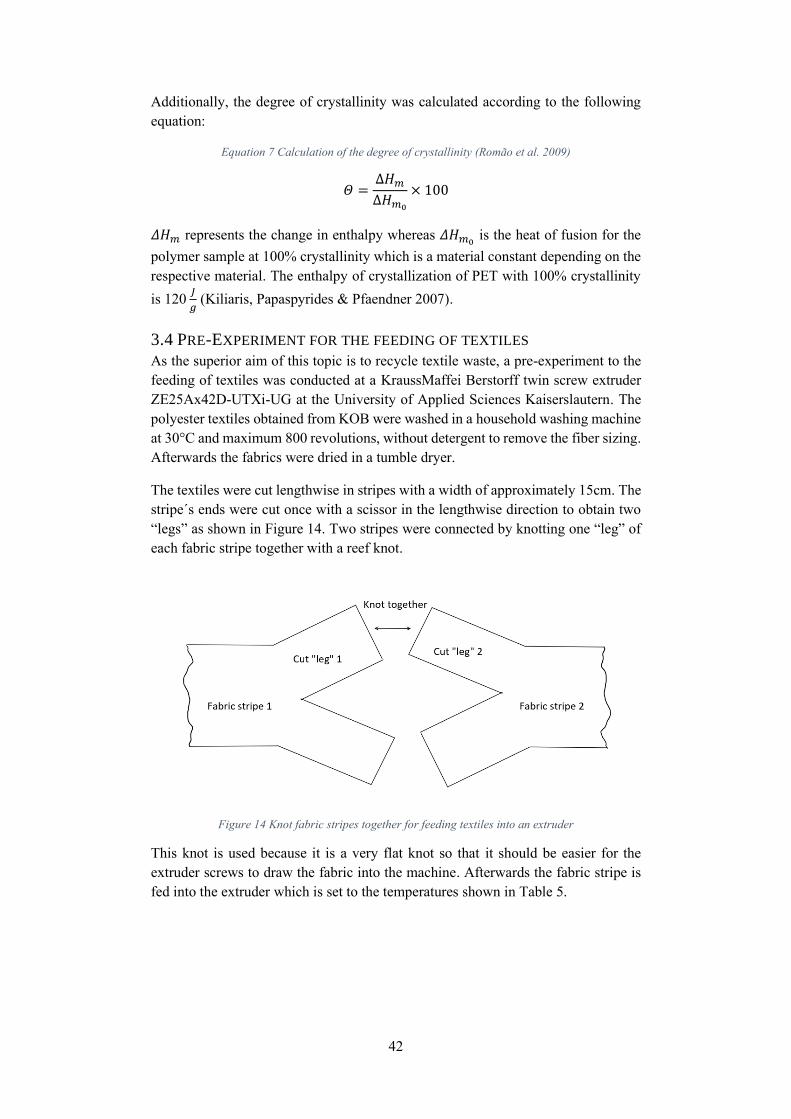
42
Additionally, the degree of crystallinity was calculated according to the following
equation:
Equation 7 Calculation of the degree of crystallinity (Romão et al. 2009)
𝛩 =∆𝐻𝑚
∆𝐻𝑚0
× 100
𝛥𝐻𝑚 represents the change in enthalpy whereas 𝛥𝐻𝑚0 is the heat of fusion for the
polymer sample at 100% crystallinity which is a material constant depending on the
respective material. The enthalpy of crystallization of PET with 100% crystallinity
is 120 𝐽
𝑔 (Kiliaris, Papaspyrides & Pfaendner 2007).
3.4 PRE-EXPERIMENT FOR THE FEEDING OF TEXTILES
As the superior aim of this topic is to recycle textile waste, a pre-experiment to the
feeding of textiles was conducted at a KraussMaffei Berstorff twin screw extruder
ZE25Ax42D-UTXi-UG at the University of Applied Sciences Kaiserslautern. The
polyester textiles obtained from KOB were washed in a household washing machine
at 30°C and maximum 800 revolutions, without detergent to remove the fiber sizing.
Afterwards the fabrics were dried in a tumble dryer.
The textiles were cut lengthwise in stripes with a width of approximately 15cm. The
stripe´s ends were cut once with a scissor in the lengthwise direction to obtain two
“legs” as shown in Figure 14. Two stripes were connected by knotting one “leg” of
each fabric stripe together with a reef knot.
Figure 14 Knot fabric stripes together for feeding textiles into an extruder
This knot is used because it is a very flat knot so that it should be easier for the
extruder screws to draw the fabric into the machine. Afterwards the fabric stripe is
fed into the extruder which is set to the temperatures shown in Table 5.
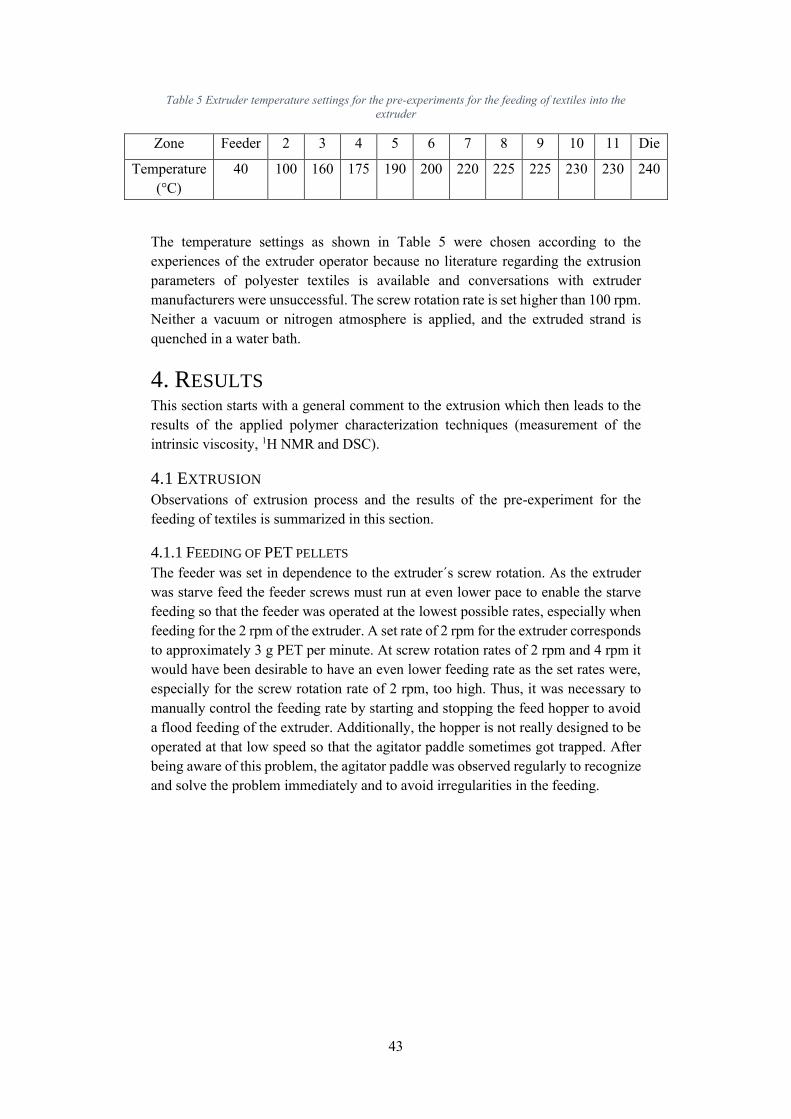
43
Table 5 Extruder temperature settings for the pre-experiments for the feeding of textiles into the
extruder
Zone Feeder 2 3 4 5 6 7 8 9 10 11 Die
Temperature
(°C)
40 100 160 175 190 200 220 225 225 230 230 240
The temperature settings as shown in Table 5 were chosen according to the
experiences of the extruder operator because no literature regarding the extrusion
parameters of polyester textiles is available and conversations with extruder
manufacturers were unsuccessful. The screw rotation rate is set higher than 100 rpm.
Neither a vacuum or nitrogen atmosphere is applied, and the extruded strand is
quenched in a water bath.
4. RESULTS This section starts with a general comment to the extrusion which then leads to the
results of the applied polymer characterization techniques (measurement of the
intrinsic viscosity, 1H NMR and DSC).
4.1 EXTRUSION
Observations of extrusion process and the results of the pre-experiment for the
feeding of textiles is summarized in this section.
4.1.1 FEEDING OF PET PELLETS
The feeder was set in dependence to the extruder´s screw rotation. As the extruder
was starve feed the feeder screws must run at even lower pace to enable the starve
feeding so that the feeder was operated at the lowest possible rates, especially when
feeding for the 2 rpm of the extruder. A set rate of 2 rpm for the extruder corresponds
to approximately 3 g PET per minute. At screw rotation rates of 2 rpm and 4 rpm it
would have been desirable to have an even lower feeding rate as the set rates were,
especially for the screw rotation rate of 2 rpm, too high. Thus, it was necessary to
manually control the feeding rate by starting and stopping the feed hopper to avoid
a flood feeding of the extruder. Additionally, the hopper is not really designed to be
operated at that low speed so that the agitator paddle sometimes got trapped. After
being aware of this problem, the agitator paddle was observed regularly to recognize
and solve the problem immediately and to avoid irregularities in the feeding.
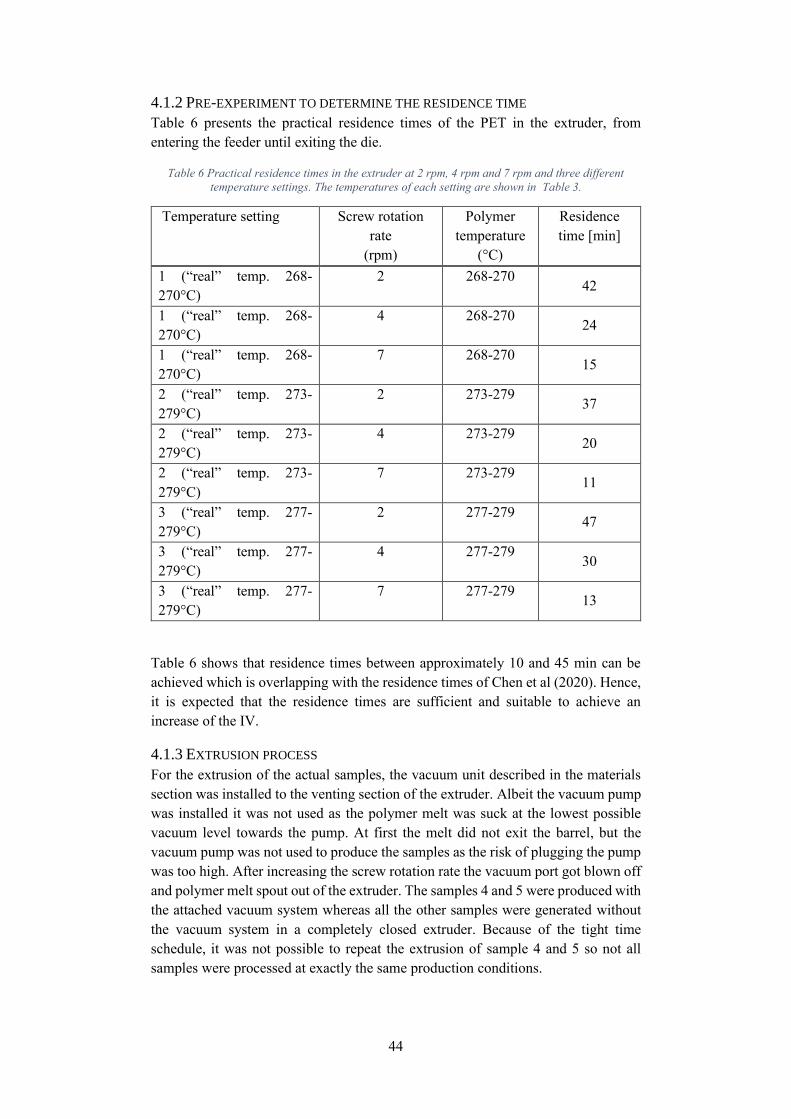
44
4.1.2 PRE-EXPERIMENT TO DETERMINE THE RESIDENCE TIME
Table 6 presents the practical residence times of the PET in the extruder, from
entering the feeder until exiting the die.
Table 6 Practical residence times in the extruder at 2 rpm, 4 rpm and 7 rpm and three different
temperature settings. The temperatures of each setting are shown in Table 3.
Temperature setting Screw rotation
rate
(rpm)
Polymer
temperature
(°C)
Residence
time [min]
1 (“real” temp. 268-
270°C)
2 268-270 42
1 (“real” temp. 268-
270°C)
4 268-270 24
1 (“real” temp. 268-
270°C)
7 268-270 15
2 (“real” temp. 273-
279°C)
2 273-279 37
2 (“real” temp. 273-
279°C)
4 273-279 20
2 (“real” temp. 273-
279°C)
7 273-279 11
3 (“real” temp. 277-
279°C)
2 277-279 47
3 (“real” temp. 277-
279°C)
4 277-279 30
3 (“real” temp. 277-
279°C)
7 277-279 13
Table 6 shows that residence times between approximately 10 and 45 min can be
achieved which is overlapping with the residence times of Chen et al (2020). Hence,
it is expected that the residence times are sufficient and suitable to achieve an
increase of the IV.
4.1.3 EXTRUSION PROCESS
For the extrusion of the actual samples, the vacuum unit described in the materials
section was installed to the venting section of the extruder. Albeit the vacuum pump
was installed it was not used as the polymer melt was suck at the lowest possible
vacuum level towards the pump. At first the melt did not exit the barrel, but the
vacuum pump was not used to produce the samples as the risk of plugging the pump
was too high. After increasing the screw rotation rate the vacuum port got blown off
and polymer melt spout out of the extruder. The samples 4 and 5 were produced with
the attached vacuum system whereas all the other samples were generated without
the vacuum system in a completely closed extruder. Because of the tight time
schedule, it was not possible to repeat the extrusion of sample 4 and 5 so not all
samples were processed at exactly the same production conditions.
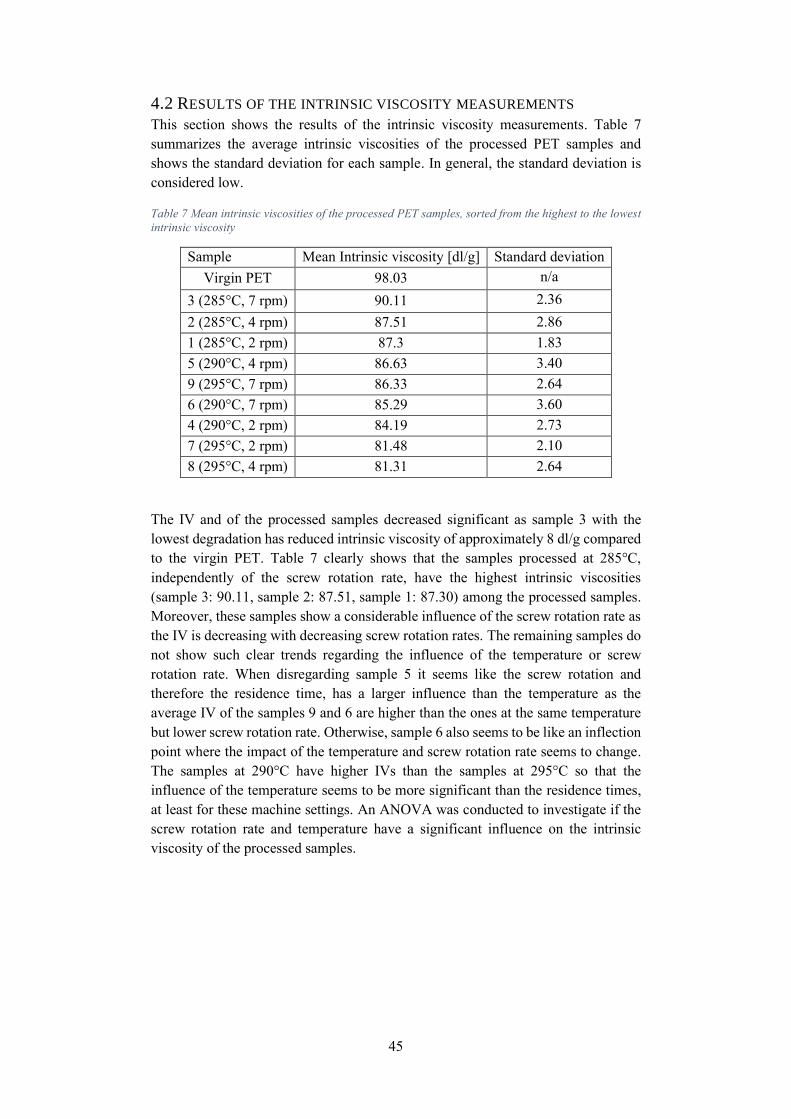
45
4.2 RESULTS OF THE INTRINSIC VISCOSITY MEASUREMENTS
This section shows the results of the intrinsic viscosity measurements. Table 7
summarizes the average intrinsic viscosities of the processed PET samples and
shows the standard deviation for each sample. In general, the standard deviation is
considered low.
Table 7 Mean intrinsic viscosities of the processed PET samples, sorted from the highest to the lowest
intrinsic viscosity
Sample Mean Intrinsic viscosity [dl/g] Standard deviation
Virgin PET 98.03 n/a
3 (285°C, 7 rpm) 90.11 2.36
2 (285°C, 4 rpm) 87.51 2.86
1 (285°C, 2 rpm) 87.3 1.83
5 (290°C, 4 rpm) 86.63 3.40
9 (295°C, 7 rpm) 86.33 2.64
6 (290°C, 7 rpm) 85.29 3.60
4 (290°C, 2 rpm) 84.19 2.73
7 (295°C, 2 rpm) 81.48 2.10
8 (295°C, 4 rpm) 81.31 2.64
The IV and of the processed samples decreased significant as sample 3 with the
lowest degradation has reduced intrinsic viscosity of approximately 8 dl/g compared
to the virgin PET. Table 7 clearly shows that the samples processed at 285°C,
independently of the screw rotation rate, have the highest intrinsic viscosities
(sample 3: 90.11, sample 2: 87.51, sample 1: 87.30) among the processed samples.
Moreover, these samples show a considerable influence of the screw rotation rate as
the IV is decreasing with decreasing screw rotation rates. The remaining samples do
not show such clear trends regarding the influence of the temperature or screw
rotation rate. When disregarding sample 5 it seems like the screw rotation and
therefore the residence time, has a larger influence than the temperature as the
average IV of the samples 9 and 6 are higher than the ones at the same temperature
but lower screw rotation rate. Otherwise, sample 6 also seems to be like an inflection
point where the impact of the temperature and screw rotation rate seems to change.
The samples at 290°C have higher IVs than the samples at 295°C so that the
influence of the temperature seems to be more significant than the residence times,
at least for these machine settings. An ANOVA was conducted to investigate if the
screw rotation rate and temperature have a significant influence on the intrinsic
viscosity of the processed samples.
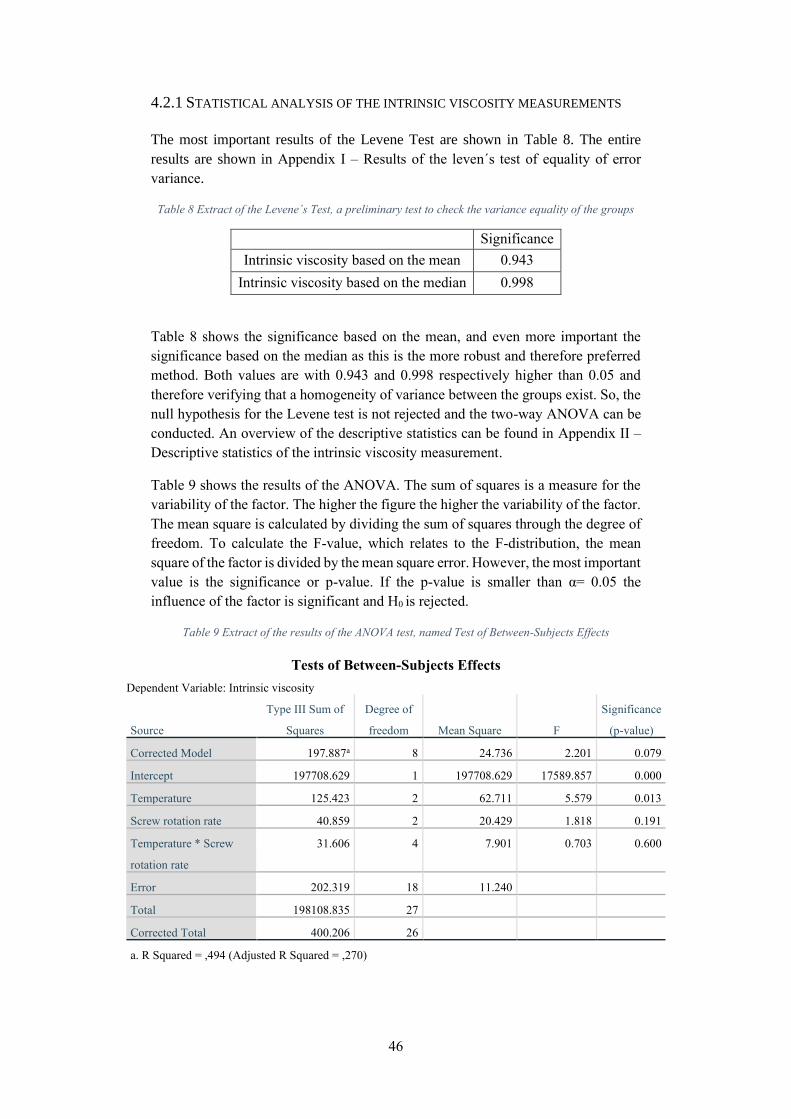
46
4.2.1 STATISTICAL ANALYSIS OF THE INTRINSIC VISCOSITY MEASUREMENTS
The most important results of the Levene Test are shown in Table 8. The entire
results are shown in Appendix I – Results of the leven´s test of equality of error
variance.
Table 8 Extract of the Levene´s Test, a preliminary test to check the variance equality of the groups
Significance
Intrinsic viscosity based on the mean 0.943
Intrinsic viscosity based on the median 0.998
Table 8 shows the significance based on the mean, and even more important the
significance based on the median as this is the more robust and therefore preferred
method. Both values are with 0.943 and 0.998 respectively higher than 0.05 and
therefore verifying that a homogeneity of variance between the groups exist. So, the
null hypothesis for the Levene test is not rejected and the two-way ANOVA can be
conducted. An overview of the descriptive statistics can be found in Appendix II –
Descriptive statistics of the intrinsic viscosity measurement.
Table 9 shows the results of the ANOVA. The sum of squares is a measure for the
variability of the factor. The higher the figure the higher the variability of the factor.
The mean square is calculated by dividing the sum of squares through the degree of
freedom. To calculate the F-value, which relates to the F-distribution, the mean
square of the factor is divided by the mean square error. However, the most important
value is the significance or p-value. If the p-value is smaller than α= 0.05 the
influence of the factor is significant and H0 is rejected.
Table 9 Extract of the results of the ANOVA test, named Test of Between-Subjects Effects
Tests of Between-Subjects Effects
Dependent Variable: Intrinsic viscosity
Source
Type III Sum of
Squares
Degree of
freedom Mean Square F
Significance
(p-value)
Corrected Model 197.887a 8 24.736 2.201 0.079
Intercept 197708.629 1 197708.629 17589.857 0.000
Temperature 125.423 2 62.711 5.579 0.013
Screw rotation rate 40.859 2 20.429 1.818 0.191
Temperature * Screw
rotation rate
31.606 4 7.901 0.703 0.600
Error 202.319 18 11.240
Total 198108.835 27
Corrected Total 400.206 26
a. R Squared = ,494 (Adjusted R Squared = ,270)
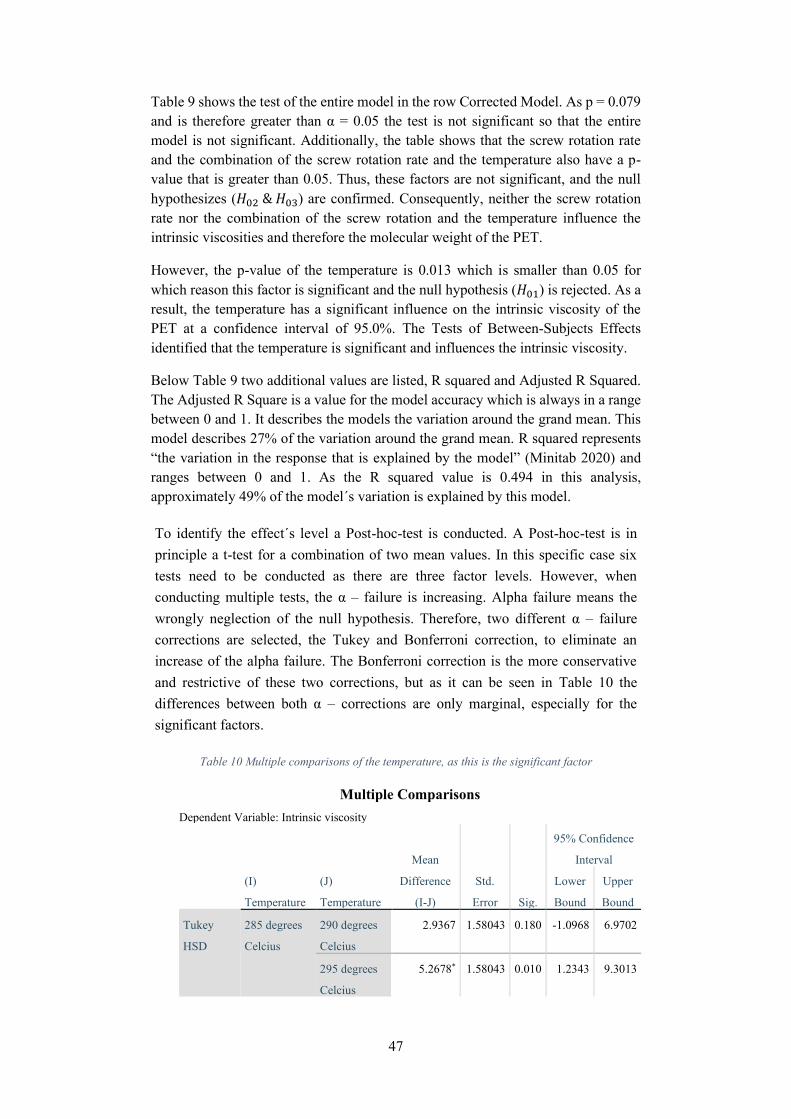
47
Table 9 shows the test of the entire model in the row Corrected Model. As p = 0.079
and is therefore greater than α = 0.05 the test is not significant so that the entire
model is not significant. Additionally, the table shows that the screw rotation rate
and the combination of the screw rotation rate and the temperature also have a p-
value that is greater than 0.05. Thus, these factors are not significant, and the null
hypothesizes (𝐻02 & 𝐻03) are confirmed. Consequently, neither the screw rotation
rate nor the combination of the screw rotation and the temperature influence the
intrinsic viscosities and therefore the molecular weight of the PET.
However, the p-value of the temperature is 0.013 which is smaller than 0.05 for
which reason this factor is significant and the null hypothesis (𝐻01) is rejected. As a
result, the temperature has a significant influence on the intrinsic viscosity of the
PET at a confidence interval of 95.0%. The Tests of Between-Subjects Effects
identified that the temperature is significant and influences the intrinsic viscosity.
Below Table 9 two additional values are listed, R squared and Adjusted R Squared.
The Adjusted R Square is a value for the model accuracy which is always in a range
between 0 and 1. It describes the models the variation around the grand mean. This
model describes 27% of the variation around the grand mean. R squared represents
“the variation in the response that is explained by the model” (Minitab 2020) and
ranges between 0 and 1. As the R squared value is 0.494 in this analysis,
approximately 49% of the model´s variation is explained by this model.
To identify the effect´s level a Post-hoc-test is conducted. A Post-hoc-test is in
principle a t-test for a combination of two mean values. In this specific case six
tests need to be conducted as there are three factor levels. However, when
conducting multiple tests, the α – failure is increasing. Alpha failure means the
wrongly neglection of the null hypothesis. Therefore, two different α – failure
corrections are selected, the Tukey and Bonferroni correction, to eliminate an
increase of the alpha failure. The Bonferroni correction is the more conservative
and restrictive of these two corrections, but as it can be seen in Table 10 the
differences between both α – corrections are only marginal, especially for the
significant factors.
Table 10 Multiple comparisons of the temperature, as this is the significant factor
Multiple Comparisons
Dependent Variable: Intrinsic viscosity
(I)
Temperature
(J)
Temperature
Mean
Difference
(I-J)
Std.
Error Sig.
95% Confidence
Interval
Lower
Bound
Upper
Bound
Tukey
HSD
285 degrees
Celcius
290 degrees
Celcius
2.9367 1.58043 0.180 -1.0968 6.9702
295 degrees
Celcius
5.2678* 1.58043 0.010 1.2343 9.3013
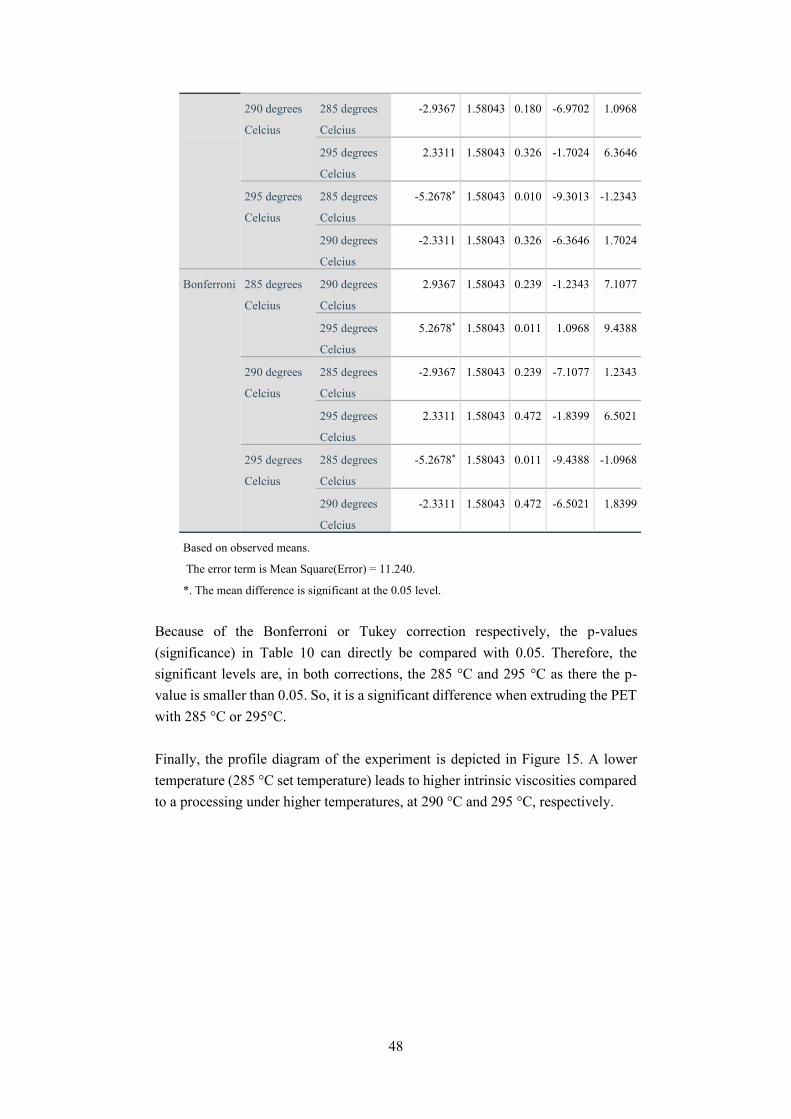
48
290 degrees
Celcius
285 degrees
Celcius
-2.9367 1.58043 0.180 -6.9702 1.0968
295 degrees
Celcius
2.3311 1.58043 0.326 -1.7024 6.3646
295 degrees
Celcius
285 degrees
Celcius
-5.2678* 1.58043 0.010 -9.3013 -1.2343
290 degrees
Celcius
-2.3311 1.58043 0.326 -6.3646 1.7024
Bonferroni 285 degrees
Celcius
290 degrees
Celcius
2.9367 1.58043 0.239 -1.2343 7.1077
295 degrees
Celcius
5.2678* 1.58043 0.011 1.0968 9.4388
290 degrees
Celcius
285 degrees
Celcius
-2.9367 1.58043 0.239 -7.1077 1.2343
295 degrees
Celcius
2.3311 1.58043 0.472 -1.8399 6.5021
295 degrees
Celcius
285 degrees
Celcius
-5.2678* 1.58043 0.011 -9.4388 -1.0968
290 degrees
Celcius
-2.3311 1.58043 0.472 -6.5021 1.8399
Based on observed means.
The error term is Mean Square(Error) = 11.240.
*. The mean difference is significant at the 0.05 level.
Because of the Bonferroni or Tukey correction respectively, the p-values
(significance) in Table 10 can directly be compared with 0.05. Therefore, the
significant levels are, in both corrections, the 285 °C and 295 °C as there the p-
value is smaller than 0.05. So, it is a significant difference when extruding the PET
with 285 °C or 295°C.
Finally, the profile diagram of the experiment is depicted in Figure 15. A lower
temperature (285 °C set temperature) leads to higher intrinsic viscosities compared
to a processing under higher temperatures, at 290 °C and 295 °C, respectively.
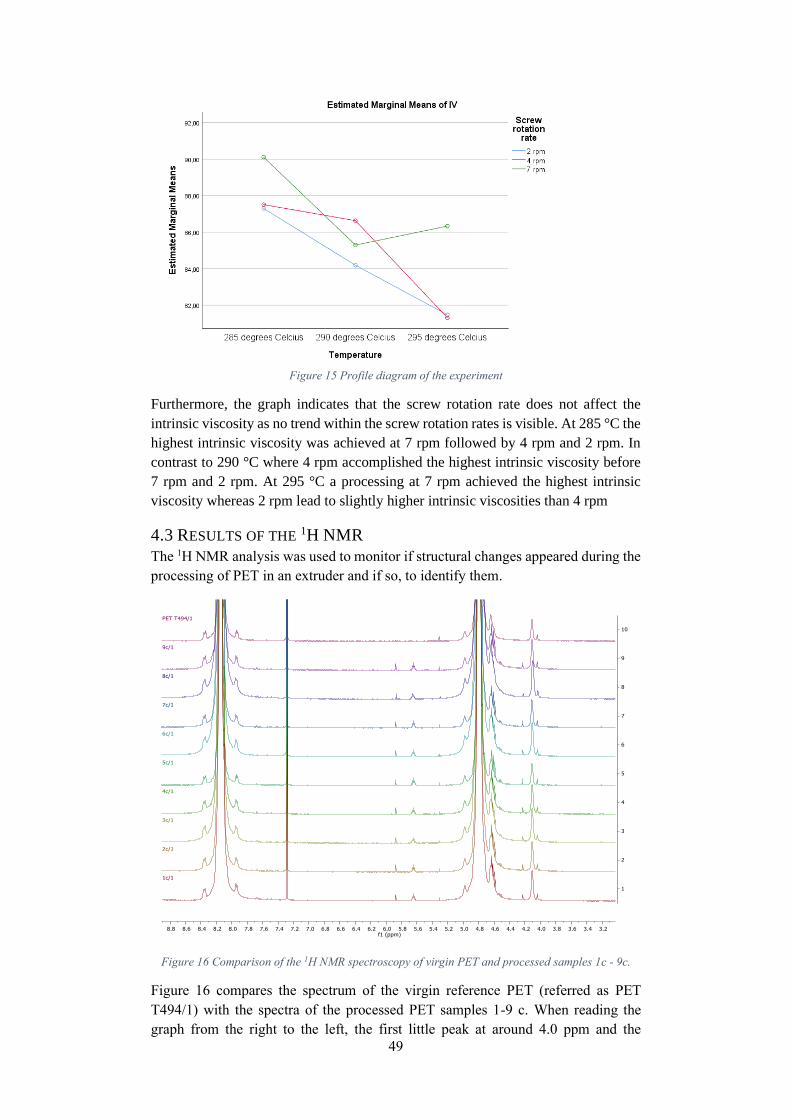
49
Figure 15 Profile diagram of the experiment
Furthermore, the graph indicates that the screw rotation rate does not affect the
intrinsic viscosity as no trend within the screw rotation rates is visible. At 285 °C the
highest intrinsic viscosity was achieved at 7 rpm followed by 4 rpm and 2 rpm. In
contrast to 290 °C where 4 rpm accomplished the highest intrinsic viscosity before
7 rpm and 2 rpm. At 295 °C a processing at 7 rpm achieved the highest intrinsic
viscosity whereas 2 rpm lead to slightly higher intrinsic viscosities than 4 rpm
4.3 RESULTS OF THE 1H NMR
The 1H NMR analysis was used to monitor if structural changes appeared during the
processing of PET in an extruder and if so, to identify them.
Figure 16 Comparison of the 1H NMR spectroscopy of virgin PET and processed samples 1c - 9c.
Figure 16 compares the spectrum of the virgin reference PET (referred as PET
T494/1) with the spectra of the processed PET samples 1-9 c. When reading the
graph from the right to the left, the first little peak at around 4.0 ppm and the
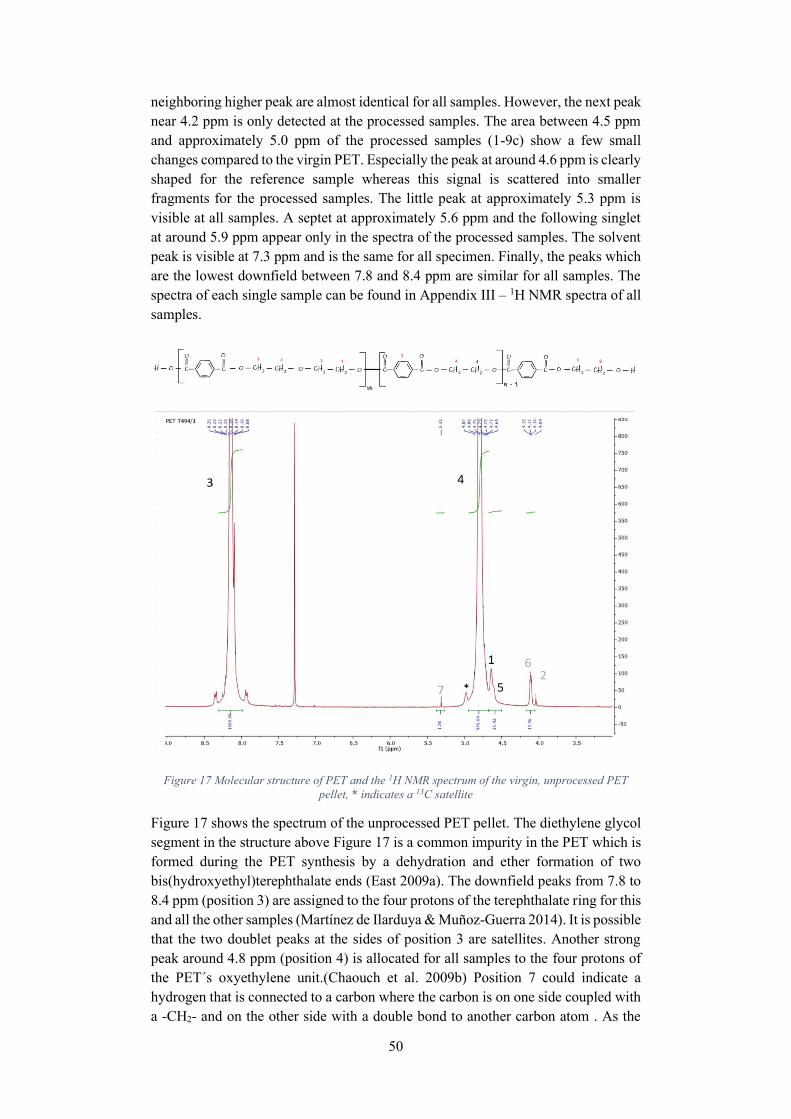
50
neighboring higher peak are almost identical for all samples. However, the next peak
near 4.2 ppm is only detected at the processed samples. The area between 4.5 ppm
and approximately 5.0 ppm of the processed samples (1-9c) show a few small
changes compared to the virgin PET. Especially the peak at around 4.6 ppm is clearly
shaped for the reference sample whereas this signal is scattered into smaller
fragments for the processed samples. The little peak at approximately 5.3 ppm is
visible at all samples. A septet at approximately 5.6 ppm and the following singlet
at around 5.9 ppm appear only in the spectra of the processed samples. The solvent
peak is visible at 7.3 ppm and is the same for all specimen. Finally, the peaks which
are the lowest downfield between 7.8 and 8.4 ppm are similar for all samples. The
spectra of each single sample can be found in Appendix III – 1H NMR spectra of all
samples.
Figure 17 Molecular structure of PET and the 1H NMR spectrum of the virgin, unprocessed PET
pellet, * indicates a 13C satellite
Figure 17 shows the spectrum of the unprocessed PET pellet. The diethylene glycol
segment in the structure above Figure 17 is a common impurity in the PET which is
formed during the PET synthesis by a dehydration and ether formation of two
bis(hydroxyethyl)terephthalate ends (East 2009a). The downfield peaks from 7.8 to
8.4 ppm (position 3) are assigned to the four protons of the terephthalate ring for this
and all the other samples (Martínez de Ilarduya & Muñoz-Guerra 2014). It is possible
that the two doublet peaks at the sides of position 3 are satellites. Another strong
peak around 4.8 ppm (position 4) is allocated for all samples to the four protons of
the PET´s oxyethylene unit.(Chaouch et al. 2009b) Position 7 could indicate a
hydrogen that is connected to a carbon where the carbon is on one side coupled with
a -CH2- and on the other side with a double bond to another carbon atom . As the
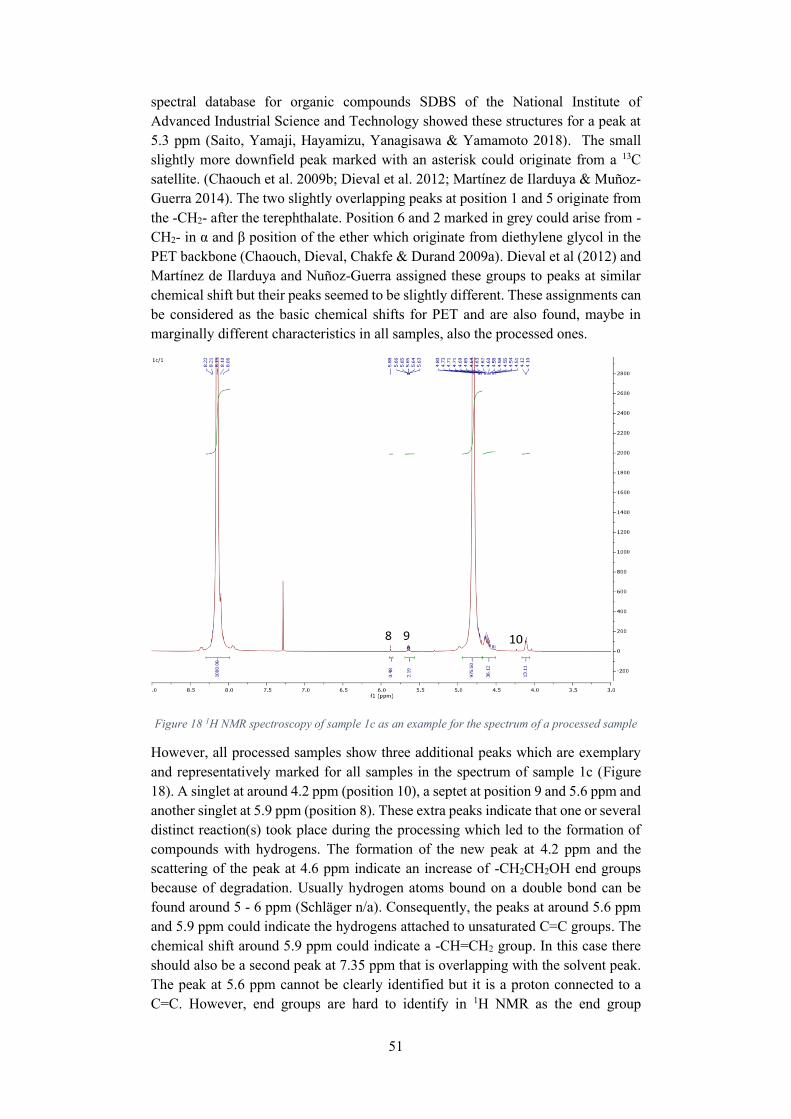
51
spectral database for organic compounds SDBS of the National Institute of
Advanced Industrial Science and Technology showed these structures for a peak at
5.3 ppm (Saito, Yamaji, Hayamizu, Yanagisawa & Yamamoto 2018). The small
slightly more downfield peak marked with an asterisk could originate from a 13C
satellite. (Chaouch et al. 2009b; Dieval et al. 2012; Martínez de Ilarduya & Muñoz-
Guerra 2014). The two slightly overlapping peaks at position 1 and 5 originate from
the -CH2- after the terephthalate. Position 6 and 2 marked in grey could arise from -
CH2- in α and β position of the ether which originate from diethylene glycol in the
PET backbone (Chaouch, Dieval, Chakfe & Durand 2009a). Dieval et al (2012) and
Martínez de Ilarduya and Nuñoz-Guerra assigned these groups to peaks at similar
chemical shift but their peaks seemed to be slightly different. These assignments can
be considered as the basic chemical shifts for PET and are also found, maybe in
marginally different characteristics in all samples, also the processed ones.
Figure 18 1H NMR spectroscopy of sample 1c as an example for the spectrum of a processed sample
However, all processed samples show three additional peaks which are exemplary
and representatively marked for all samples in the spectrum of sample 1c (Figure
18). A singlet at around 4.2 ppm (position 10), a septet at position 9 and 5.6 ppm and
another singlet at 5.9 ppm (position 8). These extra peaks indicate that one or several
distinct reaction(s) took place during the processing which led to the formation of
compounds with hydrogens. The formation of the new peak at 4.2 ppm and the
scattering of the peak at 4.6 ppm indicate an increase of -CH2CH2OH end groups
because of degradation. Usually hydrogen atoms bound on a double bond can be
found around 5 - 6 ppm (Schläger n/a). Consequently, the peaks at around 5.6 ppm
and 5.9 ppm could indicate the hydrogens attached to unsaturated C=C groups. The
chemical shift around 5.9 ppm could indicate a -CH=CH2 group. In this case there
should also be a second peak at 7.35 ppm that is overlapping with the solvent peak.
The peak at 5.6 ppm cannot be clearly identified but it is a proton connected to a
C=C. However, end groups are hard to identify in 1H NMR as the end group
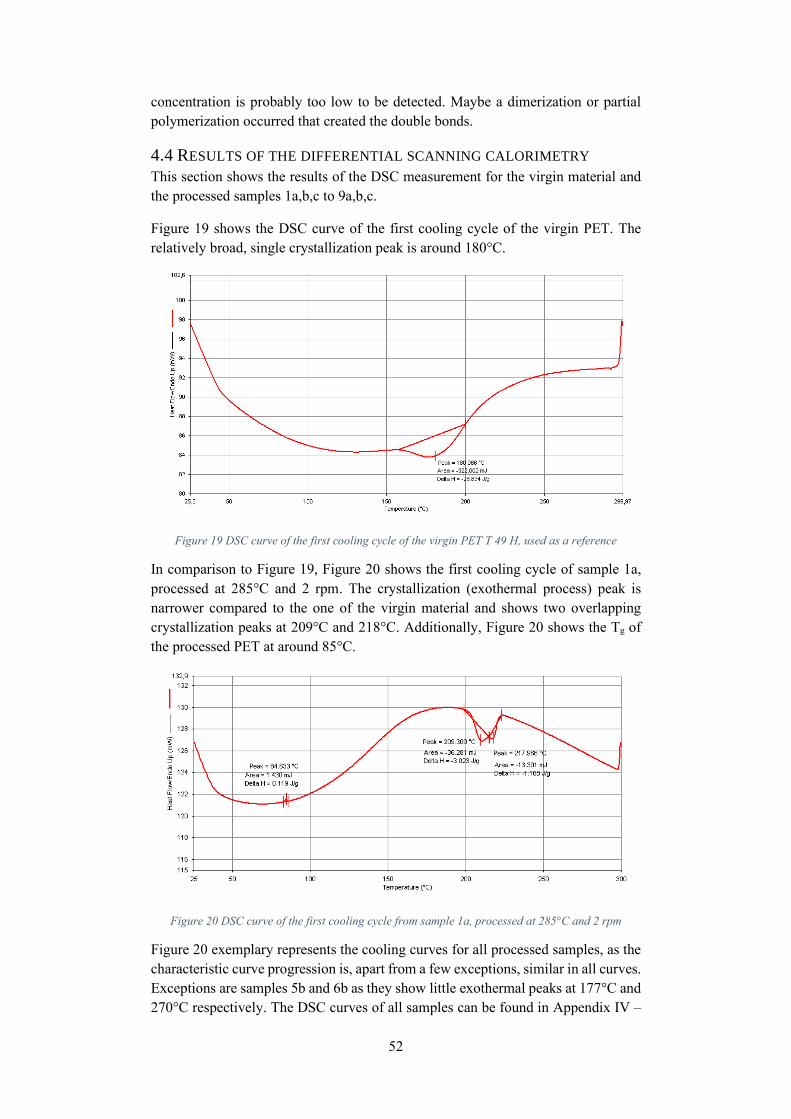
52
concentration is probably too low to be detected. Maybe a dimerization or partial
polymerization occurred that created the double bonds.
4.4 RESULTS OF THE DIFFERENTIAL SCANNING CALORIMETRY
This section shows the results of the DSC measurement for the virgin material and
the processed samples 1a,b,c to 9a,b,c.
Figure 19 shows the DSC curve of the first cooling cycle of the virgin PET. The
relatively broad, single crystallization peak is around 180°C.
Figure 19 DSC curve of the first cooling cycle of the virgin PET T 49 H, used as a reference
In comparison to Figure 19, Figure 20 shows the first cooling cycle of sample 1a,
processed at 285°C and 2 rpm. The crystallization (exothermal process) peak is
narrower compared to the one of the virgin material and shows two overlapping
crystallization peaks at 209°C and 218°C. Additionally, Figure 20 shows the Tg of
the processed PET at around 85°C.
Figure 20 DSC curve of the first cooling cycle from sample 1a, processed at 285°C and 2 rpm
Figure 20 exemplary represents the cooling curves for all processed samples, as the
characteristic curve progression is, apart from a few exceptions, similar in all curves.
Exceptions are samples 5b and 6b as they show little exothermal peaks at 177°C and
270°C respectively. The DSC curves of all samples can be found in Appendix IV –
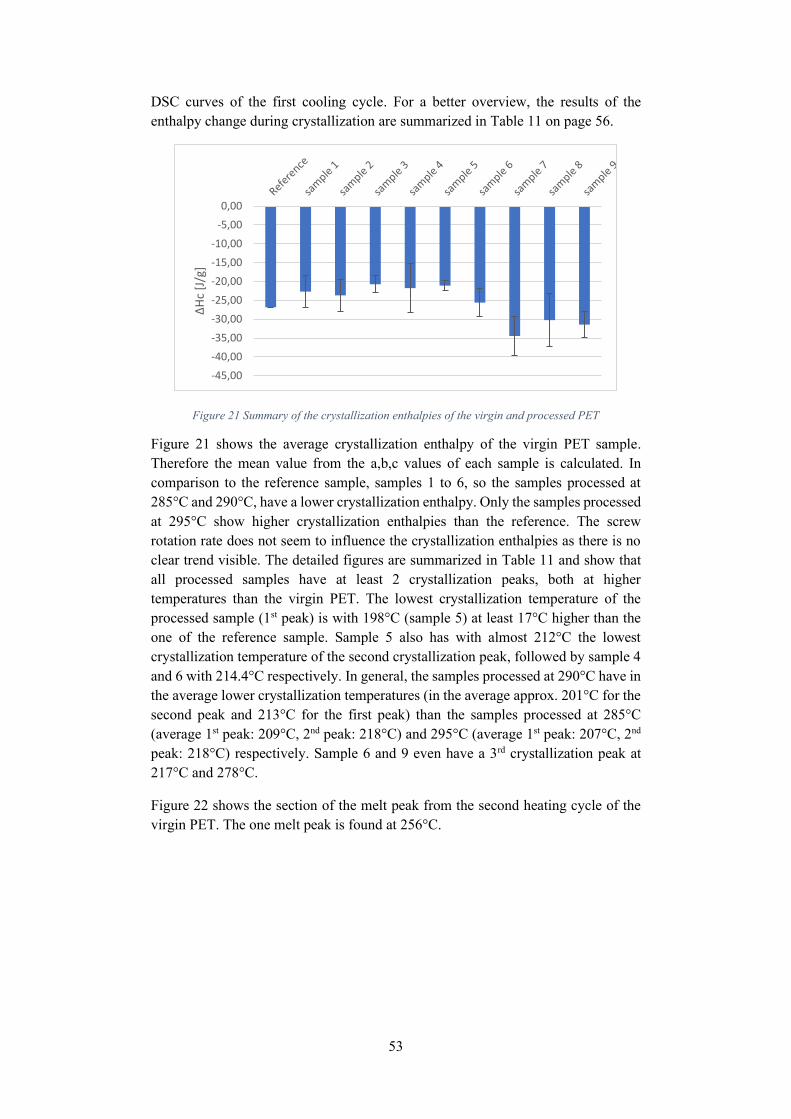
53
DSC curves of the first cooling cycle. For a better overview, the results of the
enthalpy change during crystallization are summarized in Table 11 on page 56.
Figure 21 Summary of the crystallization enthalpies of the virgin and processed PET
Figure 21 shows the average crystallization enthalpy of the virgin PET sample.
Therefore the mean value from the a,b,c values of each sample is calculated. In
comparison to the reference sample, samples 1 to 6, so the samples processed at
285°C and 290°C, have a lower crystallization enthalpy. Only the samples processed
at 295°C show higher crystallization enthalpies than the reference. The screw
rotation rate does not seem to influence the crystallization enthalpies as there is no
clear trend visible. The detailed figures are summarized in Table 11 and show that
all processed samples have at least 2 crystallization peaks, both at higher
temperatures than the virgin PET. The lowest crystallization temperature of the
processed sample (1st peak) is with 198°C (sample 5) at least 17°C higher than the
one of the reference sample. Sample 5 also has with almost 212°C the lowest
crystallization temperature of the second crystallization peak, followed by sample 4
and 6 with 214.4°C respectively. In general, the samples processed at 290°C have in
the average lower crystallization temperatures (in the average approx. 201°C for the
second peak and 213°C for the first peak) than the samples processed at 285°C
(average 1st peak: 209°C, 2nd peak: 218°C) and 295°C (average 1st peak: 207°C, 2nd
peak: 218°C) respectively. Sample 6 and 9 even have a 3rd crystallization peak at
217°C and 278°C.
Figure 22 shows the section of the melt peak from the second heating cycle of the
virgin PET. The one melt peak is found at 256°C.
-45,00
-40,00
-35,00
-30,00
-25,00
-20,00
-15,00
-10,00
-5,00
0,00Δ
Hc
[J/g
]
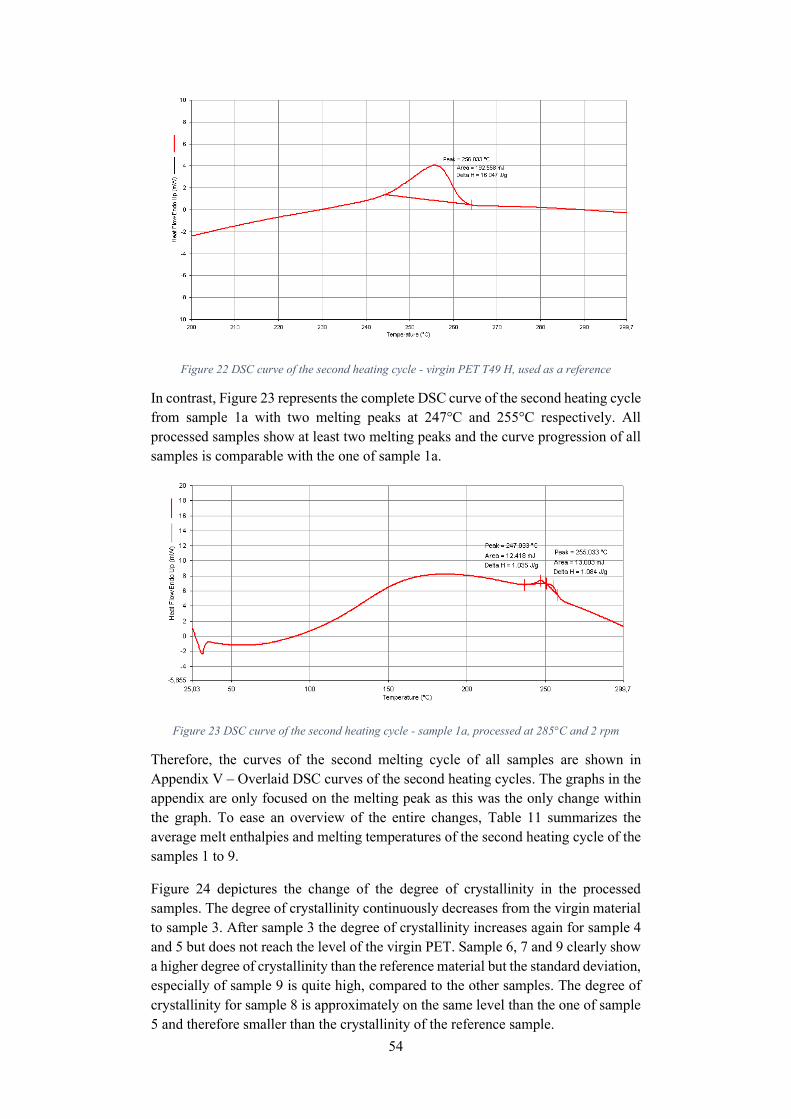
54
Figure 22 DSC curve of the second heating cycle - virgin PET T49 H, used as a reference
In contrast, Figure 23 represents the complete DSC curve of the second heating cycle
from sample 1a with two melting peaks at 247°C and 255°C respectively. All
processed samples show at least two melting peaks and the curve progression of all
samples is comparable with the one of sample 1a.
Figure 23 DSC curve of the second heating cycle - sample 1a, processed at 285°C and 2 rpm
Therefore, the curves of the second melting cycle of all samples are shown in
Appendix V – Overlaid DSC curves of the second heating cycles. The graphs in the
appendix are only focused on the melting peak as this was the only change within
the graph. To ease an overview of the entire changes, Table 11 summarizes the
average melt enthalpies and melting temperatures of the second heating cycle of the
samples 1 to 9.
Figure 24 depictures the change of the degree of crystallinity in the processed
samples. The degree of crystallinity continuously decreases from the virgin material
to sample 3. After sample 3 the degree of crystallinity increases again for sample 4
and 5 but does not reach the level of the virgin PET. Sample 6, 7 and 9 clearly show
a higher degree of crystallinity than the reference material but the standard deviation,
especially of sample 9 is quite high, compared to the other samples. The degree of
crystallinity for sample 8 is approximately on the same level than the one of sample
5 and therefore smaller than the crystallinity of the reference sample.
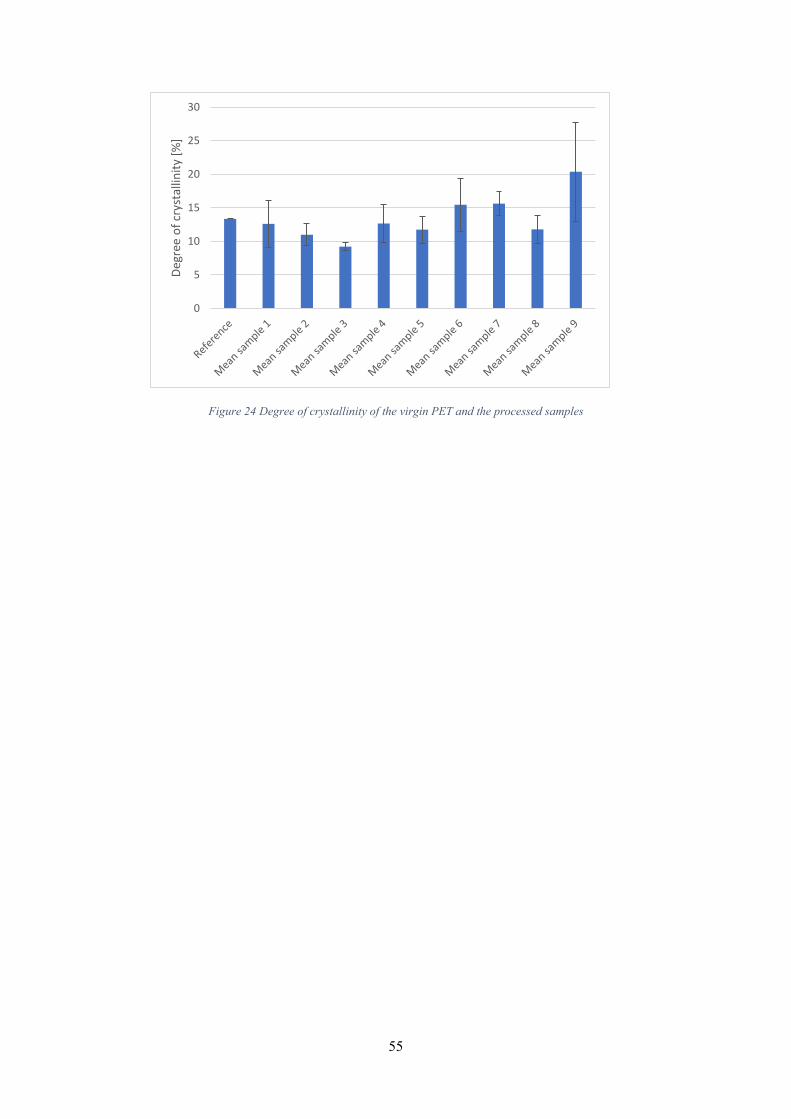
55
Figure 24 Degree of crystallinity of the virgin PET and the processed samples
0
5
10
15
20
25
30
Deg
ree
of
crys
talli
nit
y [%
]
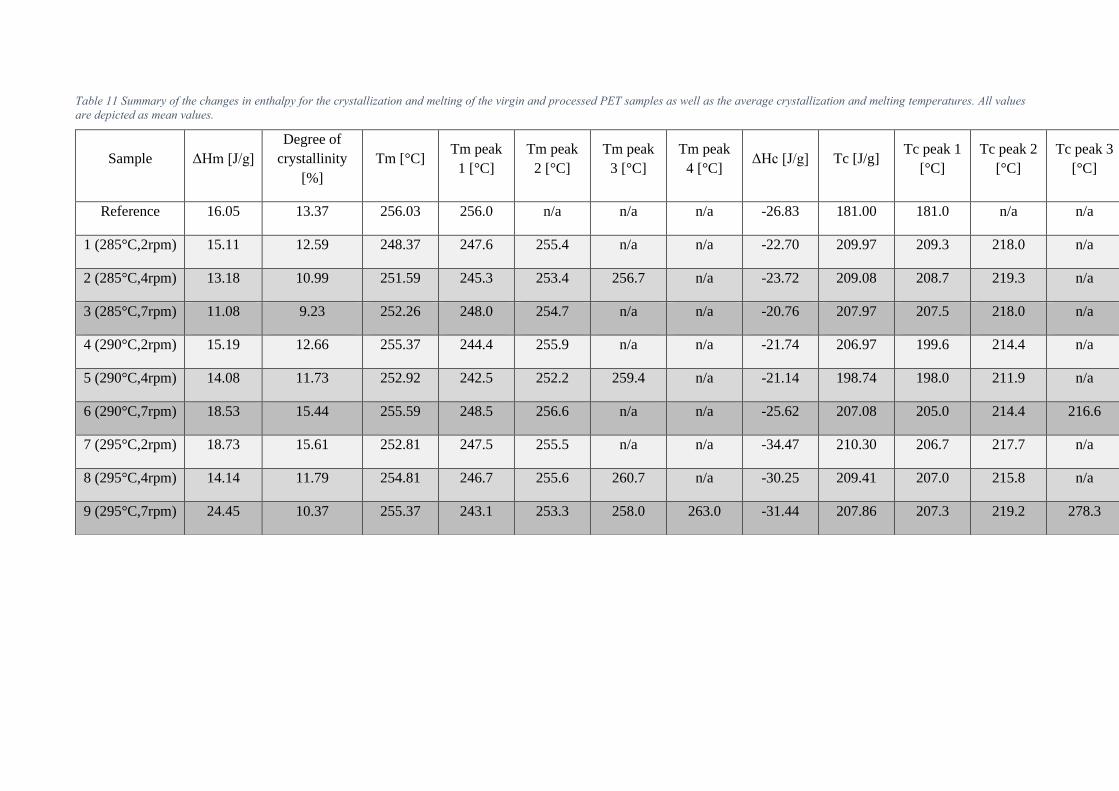
Table 11 Summary of the changes in enthalpy for the crystallization and melting of the virgin and processed PET samples as well as the average crystallization and melting temperatures. All values
are depicted as mean values.
Sample ΔHm [J/g]
Degree of
crystallinity
[%]
Tm [°C] Tm peak
1 [°C]
Tm peak
2 [°C]
Tm peak
3 [°C]
Tm peak
4 [°C] ΔHc [J/g] Tc [J/g]
Tc peak 1
[°C]
Tc peak 2
[°C]
Tc peak 3
[°C]
Reference 16.05 13.37 256.03 256.0 n/a n/a n/a -26.83 181.00 181.0 n/a n/a
1 (285°C,2rpm) 15.11 12.59 248.37 247.6 255.4 n/a n/a -22.70 209.97 209.3 218.0 n/a
2 (285°C,4rpm) 13.18 10.99 251.59 245.3 253.4 256.7 n/a -23.72 209.08 208.7 219.3 n/a
3 (285°C,7rpm) 11.08 9.23 252.26 248.0 254.7 n/a n/a -20.76 207.97 207.5 218.0 n/a
4 (290°C,2rpm) 15.19 12.66 255.37 244.4 255.9 n/a n/a -21.74 206.97 199.6 214.4 n/a
5 (290°C,4rpm) 14.08 11.73 252.92 242.5 252.2 259.4 n/a -21.14 198.74 198.0 211.9 n/a
6 (290°C,7rpm) 18.53 15.44 255.59 248.5 256.6 n/a n/a -25.62 207.08 205.0 214.4 216.6
7 (295°C,2rpm) 18.73 15.61 252.81 247.5 255.5 n/a n/a -34.47 210.30 206.7 217.7 n/a
8 (295°C,4rpm) 14.14 11.79 254.81 246.7 255.6 260.7 n/a -30.25 209.41 207.0 215.8 n/a
9 (295°C,7rpm) 24.45 10.37 255.37 243.1 253.3 258.0 263.0 -31.44 207.86 207.3 219.2 278.3
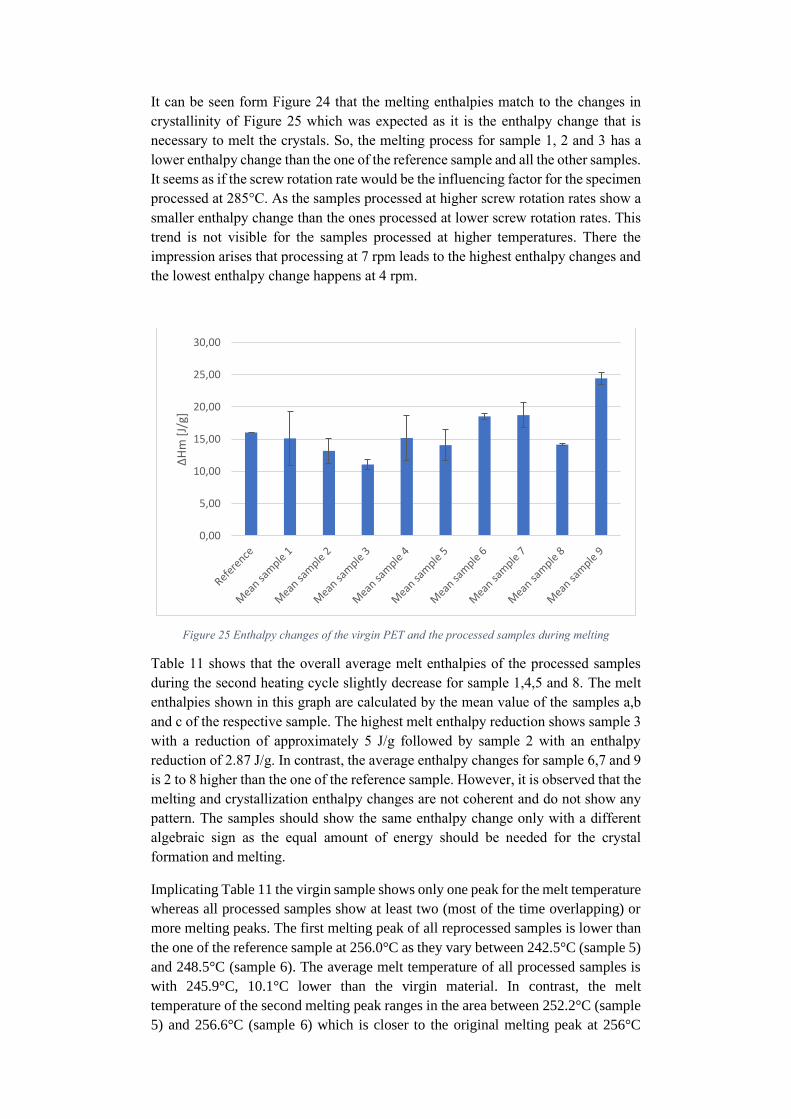
It can be seen form Figure 24 that the melting enthalpies match to the changes in
crystallinity of Figure 25 which was expected as it is the enthalpy change that is
necessary to melt the crystals. So, the melting process for sample 1, 2 and 3 has a
lower enthalpy change than the one of the reference sample and all the other samples.
It seems as if the screw rotation rate would be the influencing factor for the specimen
processed at 285°C. As the samples processed at higher screw rotation rates show a
smaller enthalpy change than the ones processed at lower screw rotation rates. This
trend is not visible for the samples processed at higher temperatures. There the
impression arises that processing at 7 rpm leads to the highest enthalpy changes and
the lowest enthalpy change happens at 4 rpm.
Figure 25 Enthalpy changes of the virgin PET and the processed samples during melting
Table 11 shows that the overall average melt enthalpies of the processed samples
during the second heating cycle slightly decrease for sample 1,4,5 and 8. The melt
enthalpies shown in this graph are calculated by the mean value of the samples a,b
and c of the respective sample. The highest melt enthalpy reduction shows sample 3
with a reduction of approximately 5 J/g followed by sample 2 with an enthalpy
reduction of 2.87 J/g. In contrast, the average enthalpy changes for sample 6,7 and 9
is 2 to 8 higher than the one of the reference sample. However, it is observed that the
melting and crystallization enthalpy changes are not coherent and do not show any
pattern. The samples should show the same enthalpy change only with a different
algebraic sign as the equal amount of energy should be needed for the crystal
formation and melting.
Implicating Table 11 the virgin sample shows only one peak for the melt temperature
whereas all processed samples show at least two (most of the time overlapping) or
more melting peaks. The first melting peak of all reprocessed samples is lower than
the one of the reference sample at 256.0°C as they vary between 242.5°C (sample 5)
and 248.5°C (sample 6). The average melt temperature of all processed samples is
with 245.9°C, 10.1°C lower than the virgin material. In contrast, the melt
temperature of the second melting peak ranges in the area between 252.2°C (sample
5) and 256.6°C (sample 6) which is closer to the original melting peak at 256°C
0,00
5,00
10,00
15,00
20,00
25,00
30,00
ΔH
m [
J/g]
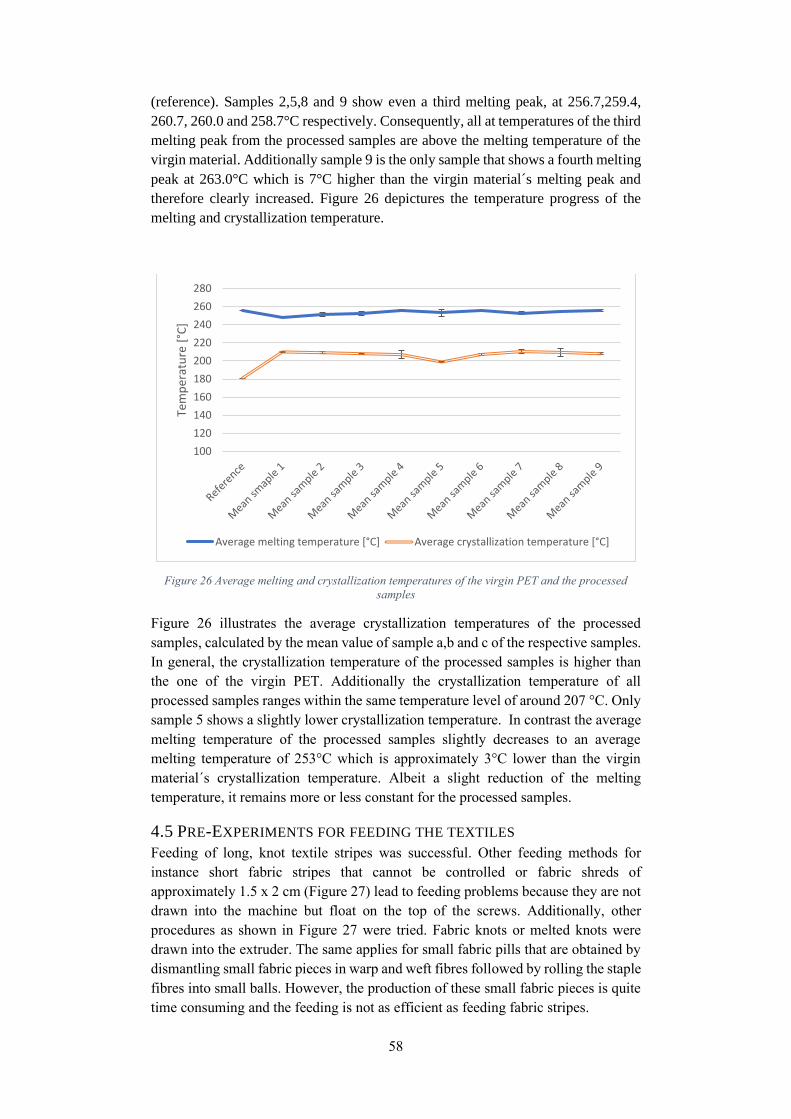
58
(reference). Samples 2,5,8 and 9 show even a third melting peak, at 256.7,259.4,
260.7, 260.0 and 258.7°C respectively. Consequently, all at temperatures of the third
melting peak from the processed samples are above the melting temperature of the
virgin material. Additionally sample 9 is the only sample that shows a fourth melting
peak at 263.0°C which is 7°C higher than the virgin material´s melting peak and
therefore clearly increased. Figure 26 depictures the temperature progress of the
melting and crystallization temperature.
Figure 26 Average melting and crystallization temperatures of the virgin PET and the processed
samples
Figure 26 illustrates the average crystallization temperatures of the processed
samples, calculated by the mean value of sample a,b and c of the respective samples.
In general, the crystallization temperature of the processed samples is higher than
the one of the virgin PET. Additionally the crystallization temperature of all
processed samples ranges within the same temperature level of around 207 °C. Only
sample 5 shows a slightly lower crystallization temperature. In contrast the average
melting temperature of the processed samples slightly decreases to an average
melting temperature of 253°C which is approximately 3°C lower than the virgin
material´s crystallization temperature. Albeit a slight reduction of the melting
temperature, it remains more or less constant for the processed samples.
4.5 PRE-EXPERIMENTS FOR FEEDING THE TEXTILES
Feeding of long, knot textile stripes was successful. Other feeding methods for
instance short fabric stripes that cannot be controlled or fabric shreds of
approximately 1.5 x 2 cm (Figure 27) lead to feeding problems because they are not
drawn into the machine but float on the top of the screws. Additionally, other
procedures as shown in Figure 27 were tried. Fabric knots or melted knots were
drawn into the extruder. The same applies for small fabric pills that are obtained by
dismantling small fabric pieces in warp and weft fibres followed by rolling the staple
fibres into small balls. However, the production of these small fabric pieces is quite
time consuming and the feeding is not as efficient as feeding fabric stripes.
100
120
140
160
180
200
220
240
260
280
Tem
per
atu
re [
°C]
Average melting temperature [°C] Average crystallization temperature [°C]
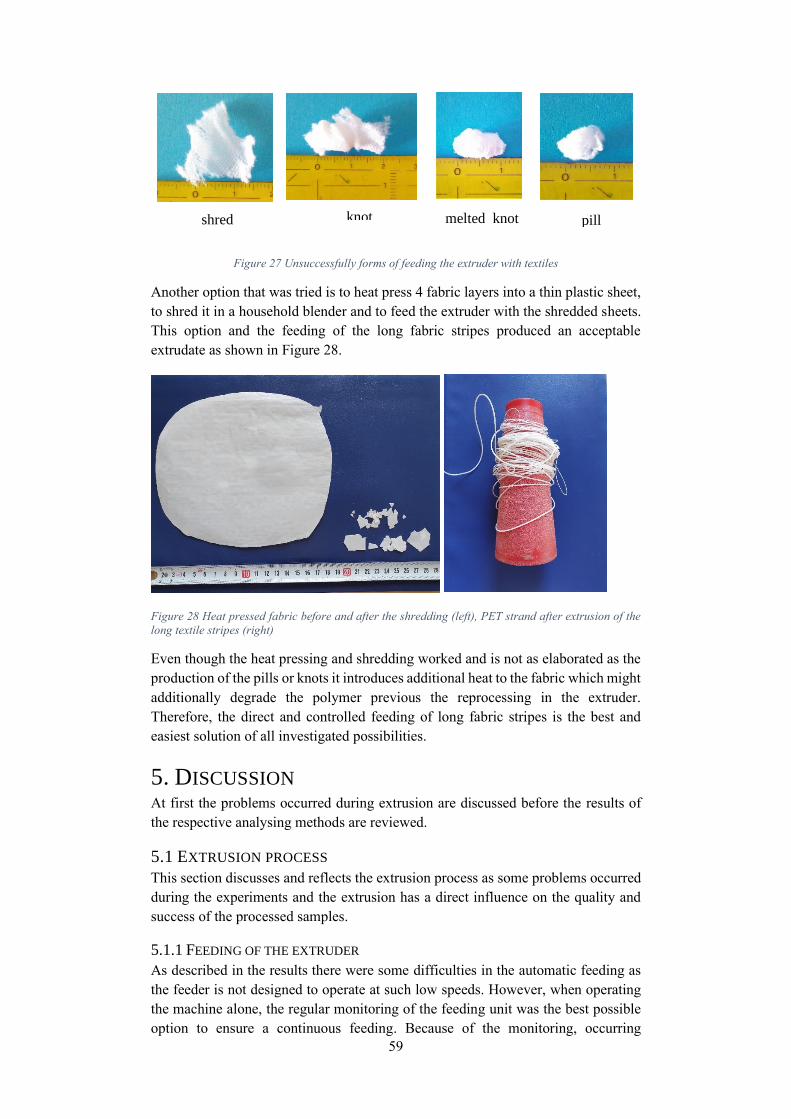
59
Figure 27 Unsuccessfully forms of feeding the extruder with textiles
Another option that was tried is to heat press 4 fabric layers into a thin plastic sheet,
to shred it in a household blender and to feed the extruder with the shredded sheets.
This option and the feeding of the long fabric stripes produced an acceptable
extrudate as shown in Figure 28.
Figure 28 Heat pressed fabric before and after the shredding (left), PET strand after extrusion of the
long textile stripes (right)
Even though the heat pressing and shredding worked and is not as elaborated as the
production of the pills or knots it introduces additional heat to the fabric which might
additionally degrade the polymer previous the reprocessing in the extruder.
Therefore, the direct and controlled feeding of long fabric stripes is the best and
easiest solution of all investigated possibilities.
5. DISCUSSION At first the problems occurred during extrusion are discussed before the results of
the respective analysing methods are reviewed.
5.1 EXTRUSION PROCESS
This section discusses and reflects the extrusion process as some problems occurred
during the experiments and the extrusion has a direct influence on the quality and
success of the processed samples.
5.1.1 FEEDING OF THE EXTRUDER
As described in the results there were some difficulties in the automatic feeding as
the feeder is not designed to operate at such low speeds. However, when operating
the machine alone, the regular monitoring of the feeding unit was the best possible
option to ensure a continuous feeding. Because of the monitoring, occurring
shred knot melted knot pill
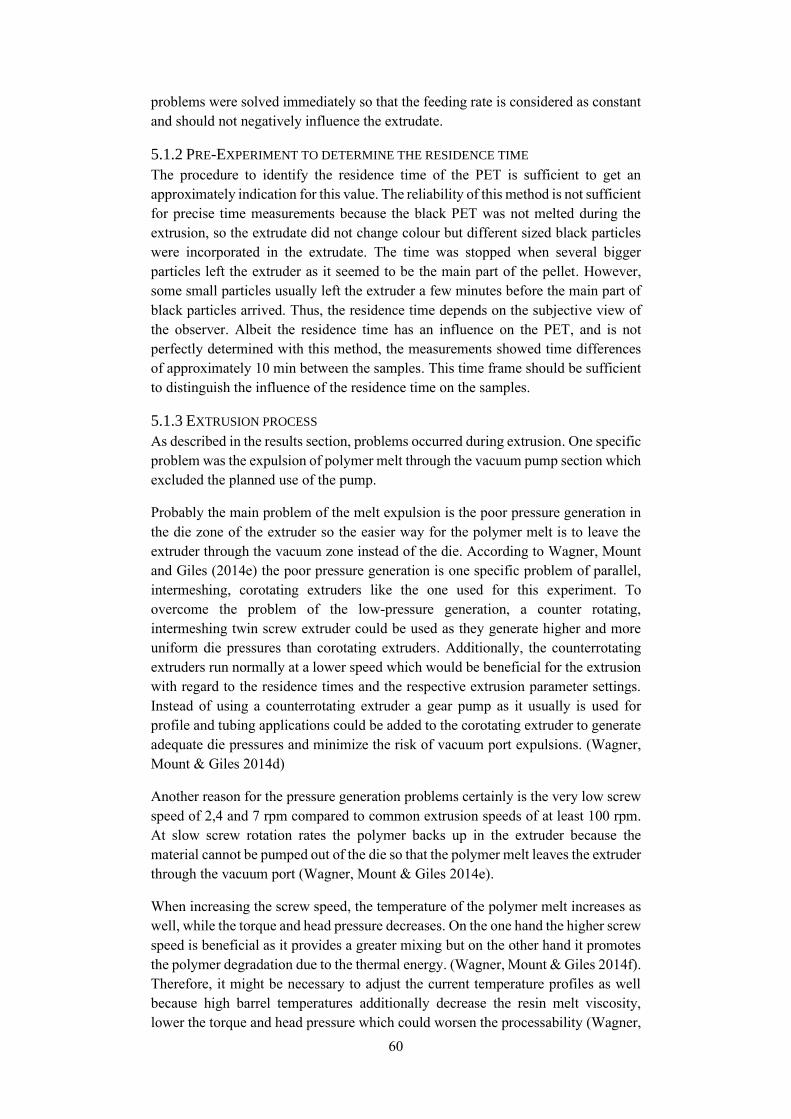
60
problems were solved immediately so that the feeding rate is considered as constant
and should not negatively influence the extrudate.
5.1.2 PRE-EXPERIMENT TO DETERMINE THE RESIDENCE TIME
The procedure to identify the residence time of the PET is sufficient to get an
approximately indication for this value. The reliability of this method is not sufficient
for precise time measurements because the black PET was not melted during the
extrusion, so the extrudate did not change colour but different sized black particles
were incorporated in the extrudate. The time was stopped when several bigger
particles left the extruder as it seemed to be the main part of the pellet. However,
some small particles usually left the extruder a few minutes before the main part of
black particles arrived. Thus, the residence time depends on the subjective view of
the observer. Albeit the residence time has an influence on the PET, and is not
perfectly determined with this method, the measurements showed time differences
of approximately 10 min between the samples. This time frame should be sufficient
to distinguish the influence of the residence time on the samples.
5.1.3 EXTRUSION PROCESS
As described in the results section, problems occurred during extrusion. One specific
problem was the expulsion of polymer melt through the vacuum pump section which
excluded the planned use of the pump.
Probably the main problem of the melt expulsion is the poor pressure generation in
the die zone of the extruder so the easier way for the polymer melt is to leave the
extruder through the vacuum zone instead of the die. According to Wagner, Mount
and Giles (2014e) the poor pressure generation is one specific problem of parallel,
intermeshing, corotating extruders like the one used for this experiment. To
overcome the problem of the low-pressure generation, a counter rotating,
intermeshing twin screw extruder could be used as they generate higher and more
uniform die pressures than corotating extruders. Additionally, the counterrotating
extruders run normally at a lower speed which would be beneficial for the extrusion
with regard to the residence times and the respective extrusion parameter settings.
Instead of using a counterrotating extruder a gear pump as it usually is used for
profile and tubing applications could be added to the corotating extruder to generate
adequate die pressures and minimize the risk of vacuum port expulsions. (Wagner,
Mount & Giles 2014d)
Another reason for the pressure generation problems certainly is the very low screw
speed of 2,4 and 7 rpm compared to common extrusion speeds of at least 100 rpm.
At slow screw rotation rates the polymer backs up in the extruder because the
material cannot be pumped out of the die so that the polymer melt leaves the extruder
through the vacuum port (Wagner, Mount & Giles 2014e).
When increasing the screw speed, the temperature of the polymer melt increases as
well, while the torque and head pressure decreases. On the one hand the higher screw
speed is beneficial as it provides a greater mixing but on the other hand it promotes
the polymer degradation due to the thermal energy. (Wagner, Mount & Giles 2014f).
Therefore, it might be necessary to adjust the current temperature profiles as well
because high barrel temperatures additionally decrease the resin melt viscosity,
lower the torque and head pressure which could worsen the processability (Wagner,
61
Mount & Giles 2014f). Because of the complex correlation of the screw rotation rate
and the temperature it is necessary to find the right balance between these two
parameters to be able to produce a high-quality product.
5.2 INTRINSIC VISCOSITIES STATISTICAL ANALYSIS
To sum it up, the model is not significant (F(8,18) = 24,736, p=0.079, n= 27). It is
identified that the screw rotation rate (F(2,18)=1.818, p=0.191) and the combination
of the screw rotation rate and the temperature (F(4,18)=0.703, p=0.600) does not
show a significant correlation to the intrinsic viscosity of the PET. However, the
temperature (F(2,18)=5.579, p=0.013) significantly influences the intrinsic viscosity
and therefore the molecular weight of the PET. The Bonferroni as well as the Tukey
corrected Post-hoc-tests show that only the 285 °C and the 295°C temperature level
have a significant influence on the PET´s intrinsic viscosity. However, it should be
considered that the polymer mass temperatures differ from the set temperatures and
the set temperatures were used for this analysis. As the actual temperatures of the
melt differed in a range. At a set temperature of 285°C the actual temperatures were
between 268°C and 270°C whereas the range differed to a greater extend at a set
temperature of 290°C. There the actual temperatures of the melt ranged between
273°C and 279°C. This might be a reason why this temperature is not significant in
contrast to the 285°C and 295°C. As the actual temperature range at a set temperature
of 295°C is between 277°C and 279°C which is a difference of only 2 degrees like
at a set temperature of 285°C. In comparison to that the difference of the actual
temperature at 290°C is 6 degrees so the difference is 3 times higher. Moreover,
Wagner, Mount and Giles (2014b) propose a temperature change of 8°C to 14°C if
a change in the extrudate is desired as temperature changes of 5K are normal during
extrusion and do usually not influence the extrudate. Hence, it is logic that the
statistics confirm an insignificant temperature of 290°C when using temperatures of
285°C and 295°C.
Albeit the statistics state that the screw rotation rate does not have a significant
influence on the IV of the polymer, this is questionable as the screw rotation induces
shear forces which can result in heat so that the screw rotation can possibly cause
polymer degradation. Furthermore, other researchers reported a raise of carboxylic
end-group concentration, a clear sign of PET degradation, when using lower screw
rotation rates. As low screw rotation rates and therefore longer residence times
enhance the impact of the temperature so that the PET is longer exposed higher
temperatures which leads to thermal degradation. (Spinacé & De Paoli 2001)
The IV values of the processed samples range between 78.10 dl/g (sample 8a) and
92.49 dl/g (sample 3c). This is a maximum difference of 14.39. Compared to the
virgin material with an IV of 98.03 dl/g the maximum IV reduction is 19.93 dl/g
which is a reduction of approx. 20%. In comparison to other IV decreases in the
literature this is a low decrease. Spinacé, Lucato, Ferrão, Davanzo & De Paoli (2005)
investigated the intrinsic viscosities of 20 PET samples processed in a single screw
extruder at temperatures of 220-280 °C from the feeding zone to the die and a screw
rotation rate of 102 rpm. Afterwards they determined the IV of the samples in an
Ubbelohde viscosimeter using a 60/40 (w/w) phenol/1,1,2,2-tetrachloroethane
solvent mixture and obtained results between 0.3458 dl/g and 0.7800 dl/g. The virgin
material had an IV of 0.8 dl/g.(Spinacé, Lucato, Ferrão, Davanzo & De Paoli 2006)
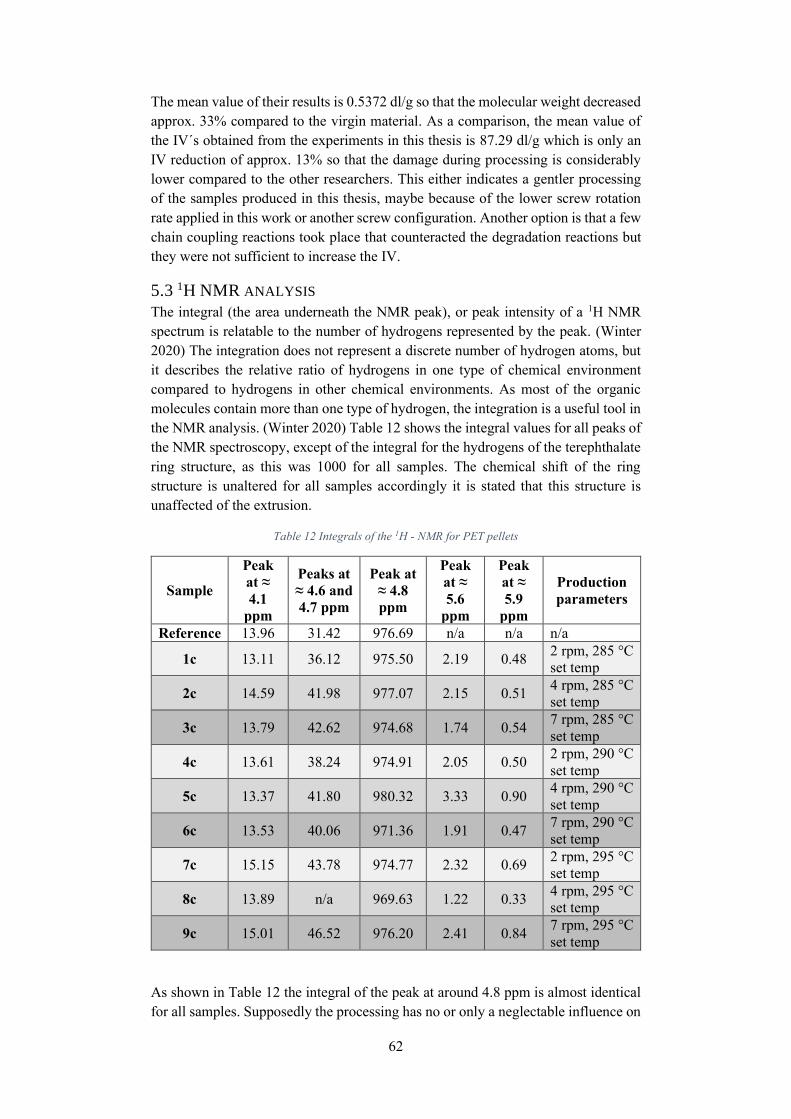
62
The mean value of their results is 0.5372 dl/g so that the molecular weight decreased
approx. 33% compared to the virgin material. As a comparison, the mean value of
the IV´s obtained from the experiments in this thesis is 87.29 dl/g which is only an
IV reduction of approx. 13% so that the damage during processing is considerably
lower compared to the other researchers. This either indicates a gentler processing
of the samples produced in this thesis, maybe because of the lower screw rotation
rate applied in this work or another screw configuration. Another option is that a few
chain coupling reactions took place that counteracted the degradation reactions but
they were not sufficient to increase the IV.
5.3 1H NMR ANALYSIS
The integral (the area underneath the NMR peak), or peak intensity of a 1H NMR
spectrum is relatable to the number of hydrogens represented by the peak. (Winter
2020) The integration does not represent a discrete number of hydrogen atoms, but
it describes the relative ratio of hydrogens in one type of chemical environment
compared to hydrogens in other chemical environments. As most of the organic
molecules contain more than one type of hydrogen, the integration is a useful tool in
the NMR analysis. (Winter 2020) Table 12 shows the integral values for all peaks of
the NMR spectroscopy, except of the integral for the hydrogens of the terephthalate
ring structure, as this was 1000 for all samples. The chemical shift of the ring
structure is unaltered for all samples accordingly it is stated that this structure is
unaffected of the extrusion.
Table 12 Integrals of the 1H - NMR for PET pellets
Sample
Peak
at ≈
4.1
ppm
Peaks at
≈ 4.6 and
4.7 ppm
Peak at
≈ 4.8
ppm
Peak
at ≈
5.6
ppm
Peak
at ≈
5.9
ppm
Production
parameters
Reference 13.96 31.42 976.69 n/a n/a n/a
1c 13.11 36.12 975.50 2.19 0.48 2 rpm, 285 °C
set temp
2c 14.59 41.98 977.07 2.15 0.51 4 rpm, 285 °C
set temp
3c 13.79 42.62 974.68 1.74 0.54 7 rpm, 285 °C
set temp
4c 13.61 38.24 974.91 2.05 0.50 2 rpm, 290 °C
set temp
5c 13.37 41.80 980.32 3.33 0.90 4 rpm, 290 °C
set temp
6c 13.53 40.06 971.36 1.91 0.47 7 rpm, 290 °C
set temp
7c 15.15 43.78 974.77 2.32 0.69 2 rpm, 295 °C
set temp
8c 13.89 n/a 969.63 1.22 0.33 4 rpm, 295 °C
set temp
9c 15.01 46.52 976.20 2.41 0.84 7 rpm, 295 °C
set temp
As shown in Table 12 the integral of the peak at around 4.8 ppm is almost identical
for all samples. Supposedly the processing has no or only a neglectable influence on
63
the PET´s oxyethylene unit. The same applies for the integrals of the first peak at
around 4.1 ppm as it does not show a substantial difference. Therefore, it is presumed
that this structure is not essentially affected by the extrusion process.
A slight difference can be seen for the peaks around 4.6 and 4.7 ppm. At this peak,
the reference sample shows with 31.42 the lowest value whereas the processed
sample have at least a value of 36.12. When comparing the size of the integrals
within one temperature range it is noticeable that the lowest screw rotation rate
shows the smallest integral. It seems as if the screw rotation rate, and therefore
probably the introduced shear forces and shear heat respectively increase the
integral. As the height of the integration curve is proportional to the area underneath
the peak and represents the number of the peak´s hydrogens, the area underneath the
peak also represents the number of hydrogen atoms (Winter 2020). In short, the
higher the area underneath the curve the larger the number of hydrogen atoms bound
in the same chemical environment. This might be an indication that the number of
hydrogens increases during processing so there should be a reaction on the -CH2-
after the terephthalate group (position 1 and 5 in Figure 17) based on the screw
rotation rate. The new peak at around 4.1 ppm and the splitting of peak at 4.6 ppm
indicate a rise of -CH2CH2OH end groups because of degradation reactions. As the
samples with the lower screw rotation rates show with 36.12 (2 rpm, 285°C), 38.24
(2 rpm, 290 °C) and 43.78 (2 rpm 295 °C) smaller integrals underneath the peak than
at 7 rpm at the same temperature because the integral increased 6.5 for 285°C, 1.8
for 290°C and 2.74 at 295°C. An increase of hydrogens in this position could indicate
that chain scission reactions such as hydrolysis and thermal degradation could have
happened during processing. Products of hydrolysis and thermal degradation are
carboxyl acid end groups, with hydrogens bond on the positions 1 and 5 in Figure
17. Therefore, they could be a reason for the increased number of hydrogens bound
in this chemical environment. However, there is only a slight trend of an increasing
area under the curve with increasing screw rotation rate (within one temperature
range). The available data is not sufficient to give a clear indication as sample 5c
does not fit into the trend and there is no data for sample 8c. Regarding the deviation
of sample 5c it should be noted that there were some problems while conducting the
experiment that influenced the steady state operation of the extruder and therefore
most likely falsified the experimental outcome. Another minor trend in these results
is that the area underneath the integral is increasing with rising temperatures because
the peak intensity is higher for the samples processed at 295°C than the one of the
samples processed at 285°C. However, when examined critically it is observed that
the samples processed at 4 rpm and 7 rpm at 290°C do not follow this trend. With
the extrusion of this samples some processing problems came along (as described in
abstract 4.1.3 Extrusion process) for which reason this samples are an exception.
Albeit the theory of the thermal degradation during extrusion would still be
supported as the degradation is worse at higher temperatures.
The NMR peaks that appeared only in the processed materials (the septet at
approximately 5.6 ppm and the peak at around 5.9 ppm) have similar areas
underneath the peak for all samples. Therefore, it is assumed that the reaction, which
is responsible for these peaks, occurred to approximately the same extend at all
processing conditions. The integrals of the septet at around 5.6 ppm could show a
slight tendency that samples with the highest screw rotation rate of one temperature
64
range have the smallest area underneath the peak so less reactions would take place.
The shear rate, so the change of the shear strain over time, is proportional to the
screw rotation rate (Wagner, Mount & Giles 2014a). Higher screw rotation rates
would lead to higher shear strain and a lower polymer viscosity. Therefore,
increasing shear rates lead to reduced polymer viscosities. Maybe the reduced
polymer viscosity is a reason for a reduced shear heat, because due to the low
viscosity it is easier for the polymer melt to flow through the extruder, so that the
thermal degradation is reduced at higher screw rotation rates.
It is noticeable that the peak at around 5.9 ppm does neither seem to follow a
structure nor does it look as if it is influenced by temperature or screw rotation rate.
Albeit it is highly likely that this peak developed due to the degradation of the PET
during extrusion as it is within the area of 5-6 ppm which indicates hydrogen atoms
that are bond on a double bond (Schläger n/a). However, this peak cannot be clearly
identified.
If a more detailed analyze such as the quantification of the two major PET end groups
(carboxylic acid and hydroxy end groups) with 1H NMR is desired in the future, it is
advisable to mark these groups with trichloroacetyl isocyanate (TAI) (Donovan &
Moad 2005). This is advised as the end-group concentration is comparably low in
high molecular weight PET, so it is hard to identify the signal as it is overwhelmed
by other signals (Postma et al. 2006). Therefore, derivatization methods such as the
reaction with TAI is used to simplify the characterization and quantification of end
groups in 1H NMR. (Chaouch et al. 2009a)
5.4 DSC ANALYSIS
The DSC was performed to investigate the effects of the extrusion on the
crystallization and melting behavior of the PET.
The crystallization peak of the virgin PET was described as wide, compared to the
processed samples. This indicates a slow crystallization rate which is characteristic
for polymers with high molar masses. (López et al. 2014) Therefore this is a first
indication for a polymer degradation of the processed samples. When considering
the results of the IV measurements it is confirmed that the molar mass of the virgin
material is distinct higher than the molar masses of the processed samples.
Additionally, the average crystallization temperature of the processed samples is
higher than the one of the reference sample. Consequently, the crystallization process
of processed PET takes place earlier than in virgin material. The shift of the
crystallization process is influenced by the polymer degradation as the chain packing
is improved because of the chain scissions so that the crystallite size is increased and
the crystallization temperature is raised (Spinacé & De Paoli 2001). In conjunction
with the double melt peaks this is a sign for a change in the crystallization behavior
of the PET.
In contrast to the temperature of crystallization, the melt temperature of the
processed samples is decreasing for the first melting peak. The melting temperatures
of the second peak are close to the melt temperature of the virgin PET. Samples 2,
5, 6, 8 and 9 show small increases of the melt temperatures mainly in the 3rd or the
4th melting peak for sample 9. The phenomena of two melting peaks for recycled
PET is well known and a typical sign for thermo-mechanical degradation which
65
leads to crystallites with lower molar mass cyclic and linear oligomers (Romão et al.
2009). Kiliaris, Papaspyrides and Pfaendner (2007) propose that the melting peak
with the lower melting temperature occurs because secondary8 crystals of faulty (for
instance as a result of partly extended chains) or smaller crystals that arose due to
degradation are melting. Consequently, the single melting peak of the reference
sample is a sign for a more consistent crystal structure (Kiliaris, Papaspyrides &
Pfaendner 2007).
López et al. (2014) are more specific regarding the changes in the crystal structure.
They ascribe the appearance of two or more melting peaks to the distribution of
crystals that show a distinct lamellar thickness and to the melting behavior of
different crystal structures. According to them four different crystal types exist. The
researchers found a crystallization at around 220°C which is, according to them, “the
smallest lamellae produced by secondary crystallization or inter-lamellar crystals
developed after the primary step of crystallization is complete” (López et al. 2014).
This could explain the additional melting peak of sample 5b at 227°C. The second
type of crystal described by López et al. (2014) appears at approximately 235°C and
is formed because of the primary crystallization which would explain the additional
peaks at 238°C of sample 2c and 235°C of sample 9a. Finally, the third type of
crystal, described by López et al. (2014) arises next to 240°C and occurs because of
a recrystallization from the first and second type of crystals. As the average of the
first melting peak (Tm peak1) of all samples is at 246°C, so basically all samples
show a peak around 240°C. The third type of crystallization explains the additional,
lower melting peak of all processed samples. In general, the researchers propose a
fourth crystal which they call crystal 0 and assign it to secondary crystallizations due
to heterogeneities, for instance contaminations or additives, that influence the
crystallization process.
According to Kiliaris, Papaspyrides & Pfaendner (2007) higher values for Δ𝐻𝑐 and
𝛥𝐻𝑇 indicate a degradation process that enables crystallization, however this is not
in accordance with the findings of this DSC analyze. Only three samples, namely 6,7
and 9 show higher values for 𝛥𝐻𝑚 than the virgin material. With regard to the IV
measurements the samples 6,7 and 9 does not show the highest IV´s of the processed
samples but they are also not the worst. The samples 7,8 and 9 are the only samples
that show a higher 𝛥𝐻𝐶 than the virgin material. Except of sample 9 the other two
samples are the specimen with the lowest IV so that the theory of Kiliaris,
Papaspyrides & Pfaendner (2007) partly applies. This might indicate that a certain
level of degradation needs to be achieved until an improved chain packing can occur.
Therefore, it is concluded that a degradation during the processing occurred, but the
degradation is probably not that high. Albeit it is tried to explain the enthalpy
changes of the samples there are some doubts in the analysis as the enthalpy changes
for crystallization and melting are not coherent. Additionally, the samples were
neither dried before conducting the measurements nor was a purging with nitrogen
possible. Thus, a further polymer degradation during the DSC measurement cannot
8Secondary crystallization is described as lamellar thickening, changes of lamellar structures
and the crystallization of interlamellar amorphous chains. Primary crystallization is the
continuous growing of spherulites until they collide with their neighboring spherulites.
(Ikehara & Nishi 2000)
66
be excluded. The curve analysis might also be improvable so that especially the
results of the enthalpy changes and crystallinity are arguable.
5.5 PRE-EXPERIMENT FOR FEEDING THE TEXTILES
The length of the fabric stripe is essential for the successful feeding of the fabric. It
is necessary to control the position of the textile until it is drawn into the machine.
Therefore, the stripe must be long enough to be safely hold in the hand and reaching
down to the screws. It seems to be easier to feed the textile when letting it down
along the extruder barrel, so that it is positioned between the barrel wall and the
screw. Flat knots like the reef knot are unproblematic during feeding and do not
cause any problems. When the fabric is long enough to be held during the entire
feeding process until the textile is caught, it is no problem to feed the stripes into the
extruder.
5.6 SUSTAINABILITY ISSUES
The prevalent sustainability concept is based on three dimensions, the economic,
social and environmental factors (Purvis, Mao & Robinson 2019). The aim of the
economic sustainability is to maintain the capital impact so that the standard of living
is improved. Measures for the living standard are for example the incidence of
disease or the environmental quality (Fontinelle 2020). Social sustainability aims
among other things to ensure good and safe working conditions. The goal of the
environmental sustainability is to progress the human welfare while protecting
natural resources like water, minerals etc. so that the human needs are fulfilled
without compromising the needs and lives of future generations. (RMIT 2017)
If the recycling of PET in an extruder without the usage of additional chemicals is
feasible in the future, sustainability issues in all three areas need to be considered.
Regarding the economic sustainability, this recycling method would be sustainable
as the living standard could be increased by increasing the environmental quality
because of a waste reduction. A fewer landfilling or incineration of textiles because
of an increased recycling rate might lead to less air and land pollution, having a
positive influence on the health and reduces diseases.
Regarding the social sustainability, the recycling in an extruder without chemicals is
also beneficial. The workers do not need to deal with harsh chemicals which is
beneficial for the occupational safety. Even though it is still necessary to take care
of fumes, hot polymer melt and machine parts as well as all the other risks occurring
when working with an extruder. On the other hand, after recycling of the PET a new
PET grade, probably with different material properties and a changed hand feel,
would be introduced into the market. Consequently, the plastic sorting process could
become more complicated.
The environmental issues with the thermomechanical recycling are predominantly
positive as natural resources are preserved because of the reuse of already used
material. However, it is estimated that even though a product to product recycling
will be feasible in the future, it is limited to a certain amount of recycling cycles
before the material cannot be reused again. Therefore, this method could help to
delay the use of new resources but not avoid that new resources are needed.
67
6. CONCLUSIONS The research aimed to facilitate chain coupling reactions of the PET´s polymer
chains in the molten state in an extruder. Based on a quantitative analyse of the PET
processed at 2 rpm, 4 rpm and 7 rpm and 285°C, 290°C and 295°C, it is seen that the
molecular weight decreased for all processed samples. This might indicate that the
desired chain coupling reactions did not happen during extrusion in the molten state,
however, compared to the results obtained by Spinacé, Lucato, Ferrão, Davanzo &
De Paoli (2005) the IV reduction due to the processing is less distinct for the samples
produced in this thesis. Maybe the degradation and chain coupling reactions took
place simultaneously but there were fewer chain couplings than chain scissions.
The results of the intrinsic viscosity measurements clearly revealed a decreasing
intrinsic viscosity after processing and the statistical analysis showed that the
temperature change of 290°C is insignificant when using 285°C and 295°C as
processing temperatures. Albeit the study showed that temperatures differing 10°C,
significantly influences the intrinsic viscosity and therefore the molecular weight of
the polymer. According to the statistical analysis the screw rotation rate does not
have a significant influence. This statement is doubted because the low screw
rotation rate led to polymer agglomeration in the wrong extruder sections. This
should not have occurred as it disturbs the steady state operation of the extruder.
Probably a statistical significance of the screw speed would be determined in an ideal
extrusion process.
Because of the 1H NMR analysis a thermal degradation was further verified as the
peak at 4.1 ppm and the splitting of the peak at 4.6 ppm, signal an increase of -
CH2CH2OH end groups which are typical for the degradation of PET. Additionally
unsaturated C=C groups are formed (peak 5.9 and 5.6 ppm) which might be a further
indication for the degradation process as PET normally does not contains unsaturated
C=C groups. Albeit the evidence for the PET degradation, when focusing on the
integration it is seen that the overall structural changes are very small which would
support the hypothesis of fewer chain coupling than chain scission reactions.
The DSC analysis showed decreased melting and increased crystallization
temperatures as well as changes in crystallinity behaviour of the processed materials.
In accordance with the references these changes could indicate a degradation of the
PET during the processing. However due to the lack of sample drying, nitrogen
purging and an improvable curve analysis this assumption is questionable.
To sum it up, a polymer rejuvenation in the molten state in an extruder, with an
increase of the molecular weight under the processing conditions applied in this work
is not feasible. In the future with improved processing conditions, it might be
possible to increase the molecular wight of PET and therefore also the molecular
weight of polyester textiles. Thus, this topic could help in the future to recycle
polyester textiles and prevent the subsequent generations form land pollution,
resource depletion and a waist of potential resources. However, to reach this goal,
the process needs to be developed further.
68
7. FUTURE RESEARCH Due to some complications during the extrusion process, the experimental outcome
was not as desired. Therefore, it is important to improve the extrusion parameters,
especially the screw rotation rate and the barrel temperatures. It is suggested to
increase the screw rotation rate so that at first a continuous and unproblematic
automatic starve feeding is possible and second the screw speed is high enough to
convey the polymer melt out of the die. With a better polymer melt and pressure
generation it would be feasible to connect the vacuum pump so that by-products
could be removed which should reduce the polymer degradation. For the case that it
is not possible to generate a sufficient head pressure with the help of the extrusion
settings a change to a counterrotating extruder or the usage of a gear pump might be
an option.
Additionally, an adjusted screw profile, especially for the gentle processing of PET
is desirable to further reduce the degradation during the reprocessing. The feeding
and drying of the resin might also be improved as it is advisable to cool down the
PET to at least 60°C before releasing it from the oven to avoid a fast moisture uptake
from the environment. Also, a direct feeding of the dry resin into the extruder is
desirable to reduce the chances of moisture uptake and therefore possible sources for
degradation. When feeding textiles, it would be desirable to have the option to
control the feeding rate of the fabric. Moreover, other feeding methods could be
investigated, for instance pressing the textiles into pellets like the wooden ones used
for burning, or trying to needle punch fabric layers or shredded fabrics into a
nonwoven to increase the bulk density of the fabric. The nonwoven could then cut
in smaller pieces and fed into the extruder.
When thinking about the recycling of real post-consumer waste, the ideal case would
be to work on lab scaled polymer recycling machines as introduced in the literature
review, or to model the lab scale experiments more closely to the machine set up of
industrial scale recycling machines. These machines offer the ideal machine setup,
for instance a direct combination of material drying and extruder feeding without
exposing the material to normal environmental conditions. Therefore, it would be
possible to really focus and investigate the processing parameters, as many sources
of failures are already excluded due to the machine setup.
After establishing an extrusion process with chain coupling reactions, the industrial
scrap textiles can be artificially aged for example by several washing cycles, and
exposition to UV-light to simulate the usage in a controlled lab scale. Subsequently
to the artificial ageing the fabrics can be reprocessed to investigate how these
additional factors influence the reprocessing reaction.
69
8. REFERENCES
Adanur, S. (2008). 8 - Structure and mechanics of coated textile fabrics. In Schwartz,
P. (ed.) Structure and Mechanics of Textile Fibre Assemblies. Woodhead
Publishing, pp. 213-241. doi:https://doi.org/10.1533/9781845695231.213
Al-Sabagh, A. M., Yehia, F. Z., Eshaq, G., Rabie, A. M. & ElMetwally, A. E. (2016).
Greener routes for recycling of polyethylene terephthalate. Egyptian Journal
of Petroleum, 25(1), pp. 53-64.
doi:https://doi.org/10.1016/j.ejpe.2015.03.001
Assadi, R., Colin, X. & Verdu, J. (2004). Irreversible structural changes during PET
recycling by extrusion. Polymer, 45(13), pp. 4403-4412.
doi:https://doi.org/10.1016/j.polymer.2004.04.029
Awaja, F. & Pavel, D. (2005). Recycling of PET. European Polymer Journal, 41(7),
pp. 1453-1477. doi:10.1016/j.eurpolymj.2005.02.005
Baur, E., Brinkmann, S., Osswald, T. A. & Schmachtenberg, E. (2007a). Analytische
Untersuchungen. Saechtling Kunststoff Taschenbuch. München: Carl
Hanser Verlag, pp. 225-228.
Baur, E., Brinkmann, S., Osswald, T. A. & Schmachtenberg, E. (2007b).
Kunststoffverarbeitung. Saechtling Kunstoff Taschenbuch. München: Carl
Hanser Verlag, pp. 235-405.
Chang, S., Sheu, M.-F. & Chen, S.-M. (1983). Solid-state polymerization of
poly(ethylene terephthalate). Journal of Applied Polymer Science, 28(10),
pp. 3289-3300. doi:10.1002/app.1983.070281023
Chaouch, W., Dieval, F., Chakfe, N. & Durand, B. (2009a). Properties modification
of PET vascular prostheses. Journal of Physical Organic Chemistry, 22(5),
pp. 550-558. doi:10.1002/poc.1541
Chaouch, W., Dieval, F., Le Nouen, D., Defoin, A., Chakfe, N. & Durand, B.
(2009b). Nuclear magnetic resonance spectroscopy spectroscopic
investigation of the aging mechanism of polyethylene terephthalate vascular
prostheses. Journal of Applied Polymer Science, 113(5), pp. 2813-2825.
doi:10.1002/app.30089
Chen, S., Chen, S., Shanshan, G., Xianming, Z. & Chen, W. (2020). Film reaction
kinetics for melt postpolycondensation of poly(ethylene terephthalate).
Journal of Applied Polymer Science, pp. 1-8.
doi:https://doi.org/10.1002/app.48988
Chen, S., Zhang, X., Liu, M., Ma, J. P., Lu, W. & Chen, W. X. (2016). Rheological
Characterization and Thermal Stability of Different Intrinsic Viscosity
Poly(ethylene terephthalate) in Air and Nitrogen. International Polymer
Processing, 31, pp. 292-300. doi:10.3139/217.3138
Cowie, J. M. G. & Arrighi, V. (2007). Polymers: Chemistry and physics of modern
materials. 3 rd ed.: CRC Press Taylor & Francis Group.
Dieval, F., Khoffi, F., Mir, R., Chaouch, W., Nouen, D., Chakfé, N. & Durand, B.
(2012). Long-Term Biostability of Pet Vascular Prostheses. International
Journal of Polymer Science, 2012. doi:10.1155/2012/646578
Donovan, A. R. & Moad, G. (2005). A novel method for determination of polyester
end-groups by NMR spectroscopy. Polymer, 46(14), pp. 5005-5011.
doi:https://doi.org/10.1016/j.polymer.2005.04.032
Duh, B. (2002). Effects of the carboxyl concentration on the solid-state
polymerization of poly(ethylene terephthalate). Journal of Applied Polymer
Science, 83(6), pp. 1288-1304. doi:10.1002/app.2296
East, A. J. (2009a). 6 - The structure of polyester fibers. In Eichhorn, S. J., Hearle,
J. W. S., Jaffe, M. & Kikutani, T. (eds.) Handbook of Textile Fibre Structure.
Woodhead Publishing, pp. 181-231.
doi:https://doi.org/10.1533/9781845696504.2.181
70
East, A. J. (2009b). The structure of polyester fibers. Handbook of textile fibre
structure. Woodhead Publishing: CRC Press, pp. 181-231.
Ehrenstein, G. H. (2011a). Alterung und Stabilisierung. Polymer Werkstoffe Struktur
- Eigenschaften - Anwendung. 3 ed. München: Carl Hanser Verlag, pp. 275-
291.
Ehrenstein, G. H. (2011b). Aufbau der Polymer-Werkstoffe. Polymer Werkstoffe
Struktur - Eigenschaften - Anwendung. 3 ed. München: Carl Hanser Verlag,
pp. 70-71.
Erema (2020). INTAREMA T,TE High-performance thermoplastic plastics
recycling. Erema Plastic Recycling Systems,
https://www.erema.com/en/intarema_t_te/(retrieved: 21.08.2020).
Eriksen, M. K., Pivnenko, K., Olsson, M. E. & Astrup, T. F. (2018). Contamination
in plastic recycling: Influence of metals on the quality of reprocessed plastic.
Waste Management, 79, pp. 595-606.
doi:https://doi.org/10.1016/j.wasman.2018.08.007
EU (2010). Being wise with waste: The EU´s approach to waste management.
European Commission,
https://ec.europa.eu/environment/waste/pdf/WASTE%20BROCHURE.pdf
(retrieved: 21.08.2020).
Eyerer, P. (2012a). Alterung von Kunststoffen. In Eyerer, P., Elsner, P., Hirth, T. &
Domininghaus, H. (eds.) Kunststoffe Eigenschaften und Anwendungen.
Heidelberg: Springer Verlag, p. 60. doi:https://doi-
org.lib.costello.pub.hb.se/10.1007/978-3-642-16173-5
Eyerer, P. (2012b). Aufbereitung und Zusatzstoffe. In Eyerer, P., Elsner, P., Hirth,
T. & Domininghaus, H. (eds.) Kunststoffe Eigenschaften und Anwendungen.
Heidelberg: Springer Verlag, p. 70. doi:10.1007/978-3-642-16173-5
Fontinelle, A. (2020). Standard of Living vs. Quality of Life: What´s the Difference.
Investopedia, https://www.investopedia.com/articles/financial-
theory/08/standard-of-living-quality-of-life.asp(retrieved: 20.08.2020).
Francis, R. (2016). Recycling of Polymers : Methods, Characterization and
Applications. Newark, GERMANY: John Wiley & Sons, Incorporated.
Ikehara, T. & Nishi, T. (2000). Primary and secondary crystallization processes of
poly(ϵ-caprolactone)/styrene oligomer blends investigated by pulsed NMR.
Polymer, 41(21), pp. 7855-7864. doi:https://doi.org/10.1016/S0032-
3861(00)00134-8
Inata, H. & Matsumura, S. (1986). Chain extenders for polyester. II. Reactivities of
carboxyl-addition-type chain extenders; bis cyclic-imino-ethers. Journal of
Applied Polymer Science, 32(5), pp. 5193-5202.
doi:10.1002/app.1986.070320534
Karaosman, H., Brun, A. & Morales-Alonso, G. (2017). Vogue or vague:
sustainability performance appraisal in luxury fashion supply chains. In
Gardetti, M. A. (ed.) Sustainable management of luxury. Singapore:
Springer, pp. 301-330. doi:https://doi.org/10.1007/978-981-10-2917-2
Karayannidis, G. P., Kokkalas, D. E. & Bikiaris, D. N. (1993). Solid-state
polycondensation of poly(ethylene terephthalate) recycled from
postconsumer soft-drink bottles. I. Journal of Applied Polymer Science,
50(12), pp. 2135-2142. doi:10.1002/app.1993.070501213
Kiliaris, P., Papaspyrides, C. D. & Pfaendner, R. (2007). Reactive-extrusion route
for the closed-loop recycling of poly(ethylene terephthalate). Journal of
Applied Polymer Science, 104(3), pp. 1671-1678. doi:10.1002/app.25795
Koligkioni, A., Parajuly, K., Liholt Sørensen, B. & Cimpan, C. (2018).
Envirionmental assessment of end-of-life textiles in Denmark. 25th CIRP
Life Cycle Engineering (LCE) Conference, Copenhagen, Denmark.
Procedia CIRP, pp. 962-967.
Koo, H. J., Chang, G. S., Kim, S. H., Hahm, W. G. & Park, S. Y. (2013). Effects of
recycling processes on physical, mechanical and degradation properties of
71
PET yarns. Fibers and Polymers, 14(12), pp. 2083-2087.
doi:10.1007/s12221-013-2083-2
Lepschi, A., Gerstorfer, G. & Miethlinger, J. (2015). Determining the residence time
distribution of various screw elements in a co-rotating twin-screw extruder
by means of fluorescence spectroscopy.
Lin, C. A. (2008). 3 - Manufacture of polyester fibres. In Deopura, B. L.,
Alagirusamy, R., Joshi, M. & Gupta, B. (eds.) Polyesters and Polyamides.
Woodhead Publishing, pp. 62-96.
doi:https://doi.org/10.1533/9781845694609.1.62
López, M. d. M. C., Ares Pernas, A. I., Abad López, M. J., Latorre, A. L., López
Vilariño, J. M. & González Rodríguez, M. V. (2014). Assessing changes on
poly(ethylene terephthalate) properties after recycling: Mechanical
recycling in laboratory versus postconsumer recycled material. Materials
Chemistry and Physics, 147(3), pp. 884-894.
doi:https://doi.org/10.1016/j.matchemphys.2014.06.034
Martínez de Ilarduya, A. & Muñoz-Guerra, S. (2014). Chemical Structure and
Microstructure of Poly(alkylene terephthalate)s, their Copolyesters, and
their Blends as Studied by NMR. Macromol. Chem. Phys., (215), pp. 2138-
2160. doi:10.1002/macp.201400239
McDougall, F. R., White, P. R., Franke, M. & Hindle, P. (2001). Integrated Solid
Waste Management : A Life Cycle Inventory. Chichester, UNITED
KINGDOM: John Wiley & Sons, Incorporated.
Minitab (2020). Model Summary table for One-Way ANOVA. Minitab Support,
https://support.minitab.com/en-us/minitab/18/help-and-how-to/modeling-
statistics/anova/how-to/one-way-anova/interpret-the-results/all-statistics-
and-graphs/model-summary/#r-sq (retrieved: 21.08.2020).
Molnar, B. & Ronkay, F. (2019). Effect of solid-state polycondensation on
crystalline structure and mechanical properties of recycled polyethylene-
terephthalate. Polymer Bulletin, 76(5), pp. 2387-2398. doi:10.1007/s00289-
018-2504-x
Morini, G. L. (2013). Viscous Heating. In Li, D. (ed.) Encyclopedia of Microfluidics
and Nanofluidics. Boston, MA: Springer US, pp. 1-11. doi:10.1007/978-3-
642-27758-0_1670-2
Mount, E. M. (2017). 12 - Extrusion Processes. In Kutz, M. (ed.) Applied Plastics
Engineering Handbook (Second Edition). William Andrew Publishing, pp.
217-264. doi:https://doi.org/10.1016/B978-0-323-39040-8.00012-2
Nait-Ali, L. K., Colin, X. & Bergeret, A. (2011). Kinetic analysis and modelling of
PET macromolecular changes during its mechanical recycling by extrusion.
Polymer Degradation and Stability, 96(2), pp. 236-246.
doi:https://doi.org/10.1016/j.polymdegradstab.2010.11.004
NGR (2020). P:REACT Liquid State Polycondensation. NGR Plastic Recycling
Technologies, https://www.ngr-world.com/wp-
content/uploads/2018/09/NGR_PREACT_191121_EN-1.pdf (retrieved:
21.08.2020).
Park, S. H. & Kim, S. H. (2014). Poly (ethylene terephthalate) recycling for high
value added textiles. Fashion and Textiles, 1(1), p. 1. doi:10.1186/s40691-
014-0001-x
Pawlak, A., Pluta, M., Morawiec, J., Galeski, A. & Pracella, M. (2000).
Characterization of scrap poly(ethylene terephthalate). European Polymer
Journal, 36(9), pp. 1875-1884. doi:https://doi.org/10.1016/S0014-
3057(99)00261-X
Pepper, L. R. & Truscott, L. (2019). Preferred Fiber & Materials Market Report
2019. Exchange, T. https://store.textileexchange.org/wp-
content/uploads/woocommerce_uploads/2019/11/Textile-
Exchange_Preferred-Fiber-Material-Market-Report_2019.pdf
72
Po, R., Cardi, N., Fiocca, L., Gennaro, A., Giannotta, G. & Occhiello, E. (1992).
Process for preparing high molecular weight polyethylene-terephthalate
from recycled polyethyleneterephthalate. Patent US 5331065A.
Postma, A., Davis, T. P., Donovan, A. R., Li, G., Moad, G., Mulder, R. & O'Shea,
M. S. (2006). A simple method for determining protic end-groups of
synthetic polymers by 1H NMR spectroscopy. Polymer, 47(6), pp. 1899-
1911. doi:https://doi.org/10.1016/j.polymer.2006.01.050
Purvis, B., Mao, Y. & Robinson, D. (2019). Three pillars of sustainability: in search
of conceptual origins. Sustainability Science, 14(3), pp. 681-695.
doi:10.1007/s11625-018-0627-5
Qiu, G., Huang, N.-X., Tang, Z.-L. & Gerking, L. (1997). Modelling of solid state
polycondensation of poly(ethylene terephthalate). Chemical Engineering
Science, 52(3), pp. 371-376. doi:https://doi.org/10.1016/S0009-
2509(96)00414-9
Reichelt (2020). EVA - Ethylen-Vinylacetat-Copolymer. https://www.rct-
online.de/de/RctGlossar/detail/id/28
Richard, R. E., Boon, W. H., Martin-Shultz, M. L. & Sisson, E. A. (1992).
Incorporating Postconsumer Recycled Poly(ethylene terephthalate).
Emerging Technologies in Plastics Recycling. American Chemical Society,
pp. 196-204. doi:doi:10.1021/bk-1992-0513.ch015
10.1021/bk-1992-0513.ch015
RMIT (2017). The four pillars of sustainability. Future Learn - RMIT University:
Business Futures: Sustainable Business Through Green HR,
https://www.futurelearn.com/courses/sustainable-business/0/steps/78337
(retrieved: 20.08.2020).
Romão, W., Franco, M. F., Corilo, Y. E., Eberlin, M. N., Spinacé, M. A. S. & De
Paoli, M.-A. (2009). Poly (ethylene terephthalate) thermo-mechanical and
thermo-oxidative degradation mechanisms. Polymer Degradation and
Stability, 94(10), pp. 1849-1859.
doi:https://doi.org/10.1016/j.polymdegradstab.2009.05.017
Saito, T., Yamaji, T., Hayamizu, K., Yanagisawa, M. & Yamamoto, O. (2018).
Spectral Database for Organic Compounds SDBS. National Institute of
Advanced Industrial Science and Technology,
(https://sdbs.db.aist.go.jp/sdbs/cgi-bin/cre_index.cgi?lang=eng retrieved :
27.07.2020).
Santhana Gopala Krishnan, P. & Kulkarni, S. T. (2008). Polyester resins. In
Deopura, B. L., Alagirusamy, R., Joshi, M. & Gupta, B. (eds.) Polyesters
and polyamides. Cambridge England: Woodhead Publishing Limited.
Scheirs, J. (1998). Polymer recycling : science, technology and applications.
Scheirs, J. & Long, T. E. (2003). Modern polyesters: chemistry and technology of
polyesters and copolyesters. . Wiley.
Schindler, W. D. & Hauser, P. J. (2004). 4 - Hand building finishes. In Schindler,
W. D. & Hauser, P. J. (eds.) Chemical Finishing of Textiles. Woodhead
Publishing, pp. 43-50. doi:https://doi.org/10.1533/9781845690373.43
Schläger, T. (n/a). Grundlagen der NMR-Spektroskopie. In Münster, W. W.-U. &
Chemie, I. f. P. u. M. (eds.). Institut für Pharmazeutische und Medizinische
Chemie.
Shrivastava, A. (2018). 2 - Polymerization. In Shrivastava, A. (ed.) Introduction to
Plastics Engineering. William Andrew Publishing, pp. 17-48.
doi:https://doi.org/10.1016/B978-0-323-39500-7.00002-2
Spinacé, M. A. S. & De Paoli, M. A. (2001). Characterization of poly(ethylene
terephtalate) after multiple processing cycles. Journal of Applied Polymer
Science, 80(1), pp. 20-25. doi:10.1002/1097-4628(20010404)80:1<20::Aid-
app1069>3.0.Co;2-s
73
Spinacé, S. M. A., Lucato, M. U., Ferrão, M. F., Davanzo, C. U. & De Paoli, M. A.
(2006). Determination of intrinsic viscosity of poly(ethylene terephthalate)
using infrared spectroscopy and multivariate calibration method. Talanta,
69(3), pp. 643-649. doi:https://doi.org/10.1016/j.talanta.2005.10.035
Wagner, J. R., Mount, E. M. & Giles, H. F. (2014a). 4 - Plastic Behavior in the
Extruder. In Wagner, J. R., Mount, E. M. & Giles, H. F. (eds.) Extrusion
(Second Edition). Oxford: William Andrew Publishing, pp. 47-70.
doi:https://doi.org/10.1016/B978-1-4377-3481-2.00004-1
Wagner, J. R., Mount, E. M. & Giles, H. F. (2014b). 6 - Processing Conditions. In
Wagner, J. R., Mount, E. M. & Giles, H. F. (eds.) Extrusion (Second
Edition). Oxford: William Andrew Publishing, pp. 89-99.
doi:https://doi.org/10.1016/B978-1-4377-3481-2.00006-5
Wagner, J. R., Mount, E. M. & Giles, H. F. (2014c). 9 - Twin Screw Extrusion
Process. In Wagner, J. R., Mount, E. M. & Giles, H. F. (eds.) Extrusion
(Second Edition). Oxford: William Andrew Publishing, pp. 111-120.
doi:https://doi.org/10.1016/B978-1-4377-3481-2.00009-0
Wagner, J. R., Mount, E. M. & Giles, H. F. (2014d). 11 - Twin Screw Extruder
Equipment. In Wagner, J. R., Mount, E. M. & Giles, H. F. (eds.) Extrusion
(Second Edition). Oxford: William Andrew Publishing, pp. 125-148.
doi:https://doi.org/10.1016/B978-1-4377-3481-2.00011-9
Wagner, J. R., Mount, E. M. & Giles, H. F. (2014e). 12 - Plastic Behavior in Twin
Screw Extruders. In Wagner, J. R., Mount, E. M. & Giles, H. F. (eds.)
Extrusion (Second Edition). Oxford: William Andrew Publishing, pp. 149-
169. doi:https://doi.org/10.1016/B978-1-4377-3481-2.00012-0
Wagner, J. R., Mount, E. M. & Giles, H. F. (2014f). 14 - Processing Conditions. In
Wagner, J. R., Mount, E. M. & Giles, H. F. (eds.) Extrusion (Second
Edition). Oxford: William Andrew Publishing, pp. 181-192.
doi:https://doi.org/10.1016/B978-1-4377-3481-2.00014-4
Wang, Y., Chen, S., Guang, S., Wang, Y., Zhang, X. & Chen, W. (2019). Continuous
post-polycondensation of high-viscosity poly(ethylene terephthalate) in the
molten state. Journal of Applied Polymer Science, 136(19), p. 47484.
doi:10.1002/app.47484
Whisnant, D. (2020). Polymer Chemistry: Crystallization Tendency. Engineering
Libre Texts,
https://eng.libretexts.org/Bookshelves/Materials_Science/Supplemental_M
odules_(Materials_Science)/Polymer_Chemistry/Polymer_Chemistry%3A
_Morphology/Polymer_Chemistry%3A_Crystallization_Tendency
(retrieved: 31.08.2020).
Wilson, A. & Gwynne, J. (2010). Molecular weight.
https://www.doitpoms.ac.uk/tlplib/polymerbasics/mw.php
Winter, A. (2020). How to Measure Integration Curves in NMR Spectrum.
https://www.dummies.com/education/science/chemistry/how-to-measure-
integration-curves-in-the-nmr-spectrum/ (retrieved: 31.08.2020)
Woidasky, J. & Wolf, M. A. (2012). Kreislaufwirtschaft und Recycling. In Elsner,
P., Eyerer, P., Hirth, T. & Domininghaus, H. (eds.) Kunststoffe
Eigenschaften und Anwendungen. Heidelberg: Springer Verlag, pp. 105-
112. doi:https://doi-org.lib.costello.pub.hb.se/10.1007/978-3-642-16173-5
Wypych, G. (2015). 11.3 Molecular Weight. Handbook of UV Degradation and
Stabilization (2nd Edition). ChemTec Publishing, p. 374.
Xi, Z., Liu, T., Si, W., Bi, F., Xu, Z. & Zhao, L. (2018). High-efficiency acetaldehyde
removal during solid-state polycondensation of poly(ethylene terephthalate)
assisted by supercritical carbon dioxide. Chinese Journal of Chemical
Engineering, 26(6), pp. 1285-1291.
doi:https://doi.org/10.1016/j.cjche.2018.03.007
Yalcin Enis, I., Ozturk, M. & Sezgin, H. (2019). Risks and Management of Textile
Waste: The Impact of Embedded Multinational Enterprises. In Gothandam,

74
K. M., Ranjan, S., Dasgupta, N. & Lichtfouse, E. (eds.) Nanoscience and
Biotechnology for Environmental Applications. Springer International
Publishing, pp. 29-53. doi:10.1007/978-3-319-97922-9_2
Yang, R., Liu, Y., Yu, J. & Wang, K. (2006). Thermal oxidation products and
kinetics of polyethylene composites. Polymer Degradation and Stability, 91,
pp. 1651-1657. doi:10.1016/j.polymdegradstab.2005.12.013
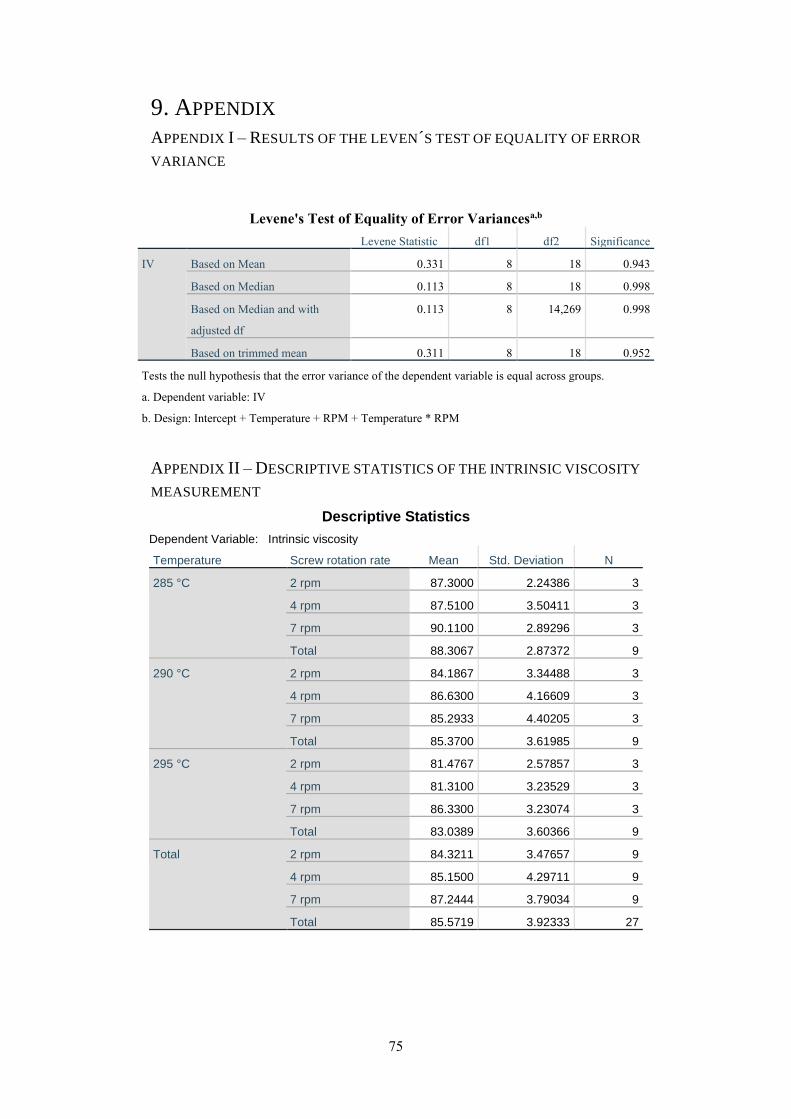
75
9. APPENDIX
APPENDIX I – RESULTS OF THE LEVEN´S TEST OF EQUALITY OF ERROR
VARIANCE
Levene's Test of Equality of Error Variancesa,b
Levene Statistic df1 df2 Significance
IV Based on Mean 0.331 8 18 0.943
Based on Median 0.113 8 18 0.998
Based on Median and with
adjusted df
0.113 8 14,269 0.998
Based on trimmed mean 0.311 8 18 0.952
Tests the null hypothesis that the error variance of the dependent variable is equal across groups.
a. Dependent variable: IV
b. Design: Intercept + Temperature + RPM + Temperature * RPM
APPENDIX II – DESCRIPTIVE STATISTICS OF THE INTRINSIC VISCOSITY
MEASUREMENT
Descriptive Statistics
Dependent Variable: Intrinsic viscosity
Temperature Screw rotation rate Mean Std. Deviation N
285 °C 2 rpm 87.3000 2.24386 3
4 rpm 87.5100 3.50411 3
7 rpm 90.1100 2.89296 3
Total 88.3067 2.87372 9
290 °C 2 rpm 84.1867 3.34488 3
4 rpm 86.6300 4.16609 3
7 rpm 85.2933 4.40205 3
Total 85.3700 3.61985 9
295 °C 2 rpm 81.4767 2.57857 3
4 rpm 81.3100 3.23529 3
7 rpm 86.3300 3.23074 3
Total 83.0389 3.60366 9
Total 2 rpm 84.3211 3.47657 9
4 rpm 85.1500 4.29711 9
7 rpm 87.2444 3.79034 9
Total 85.5719 3.92333 27
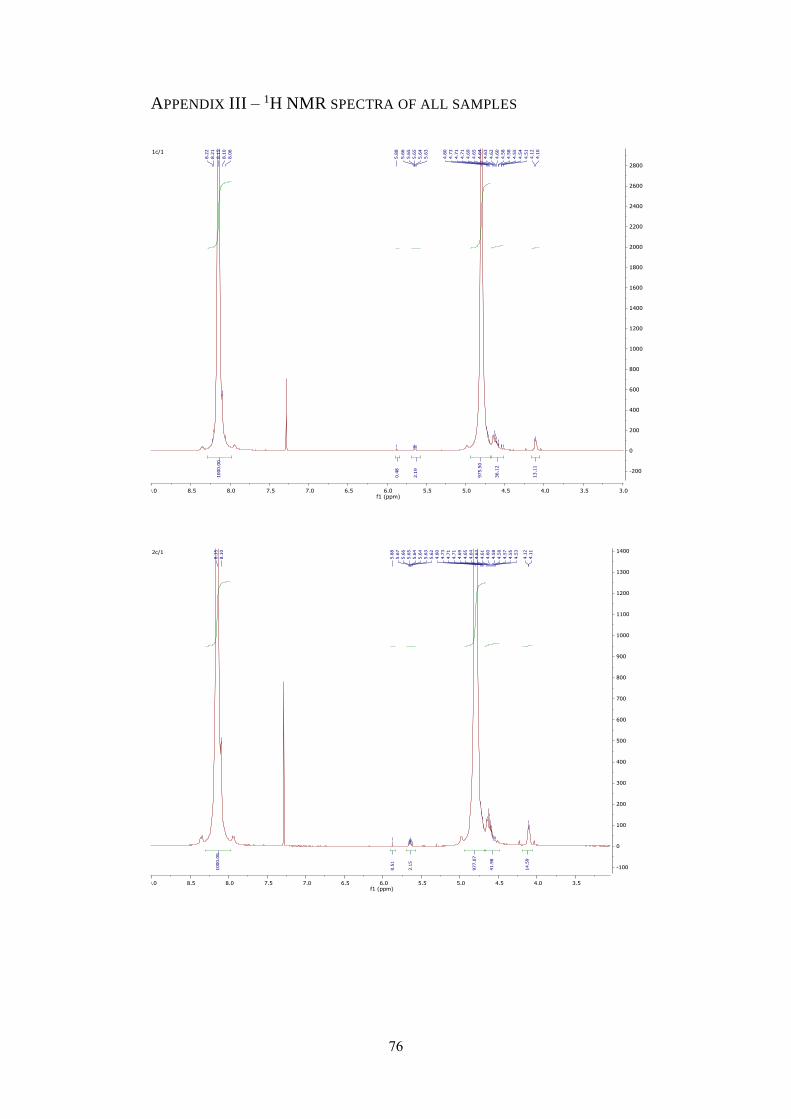
76
APPENDIX III – 1H NMR SPECTRA OF ALL SAMPLES
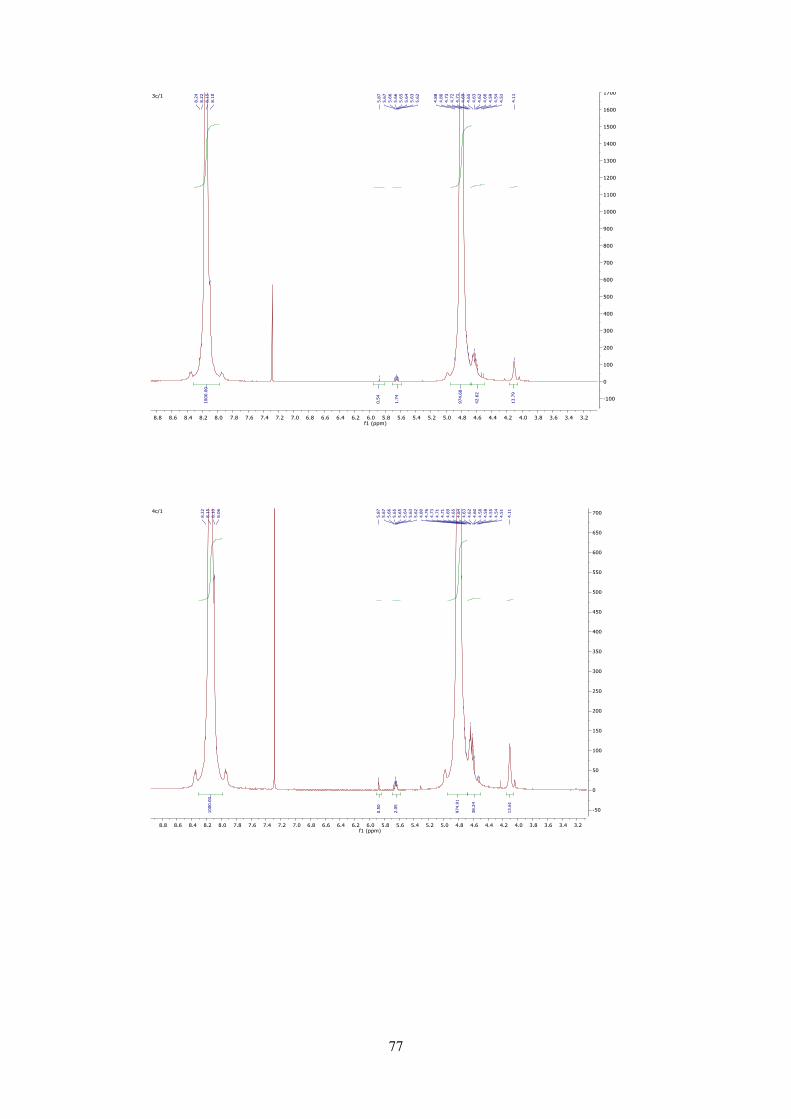
77
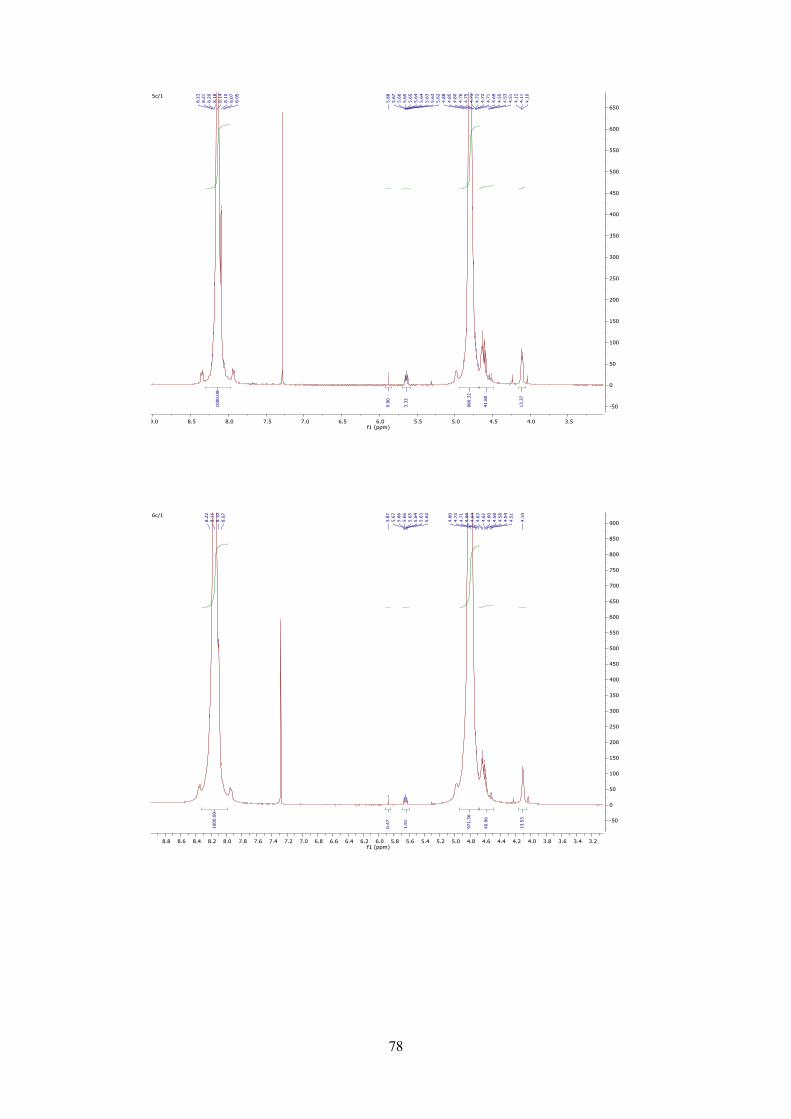
78
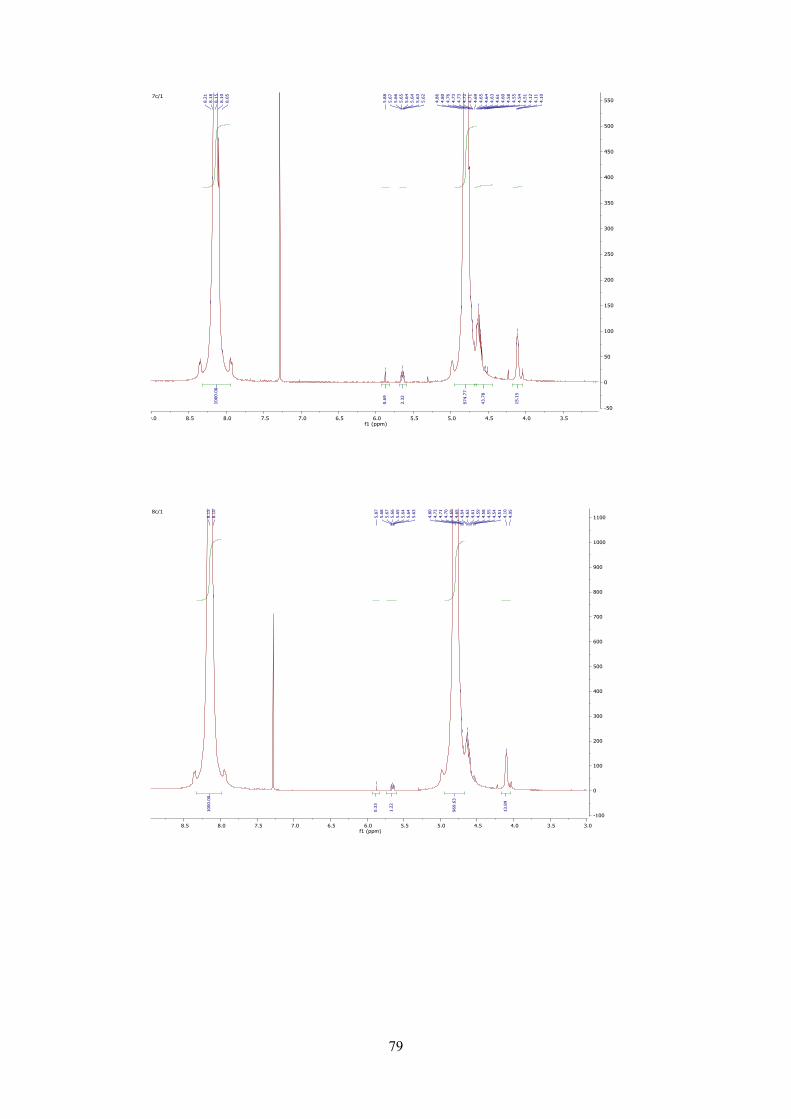
79
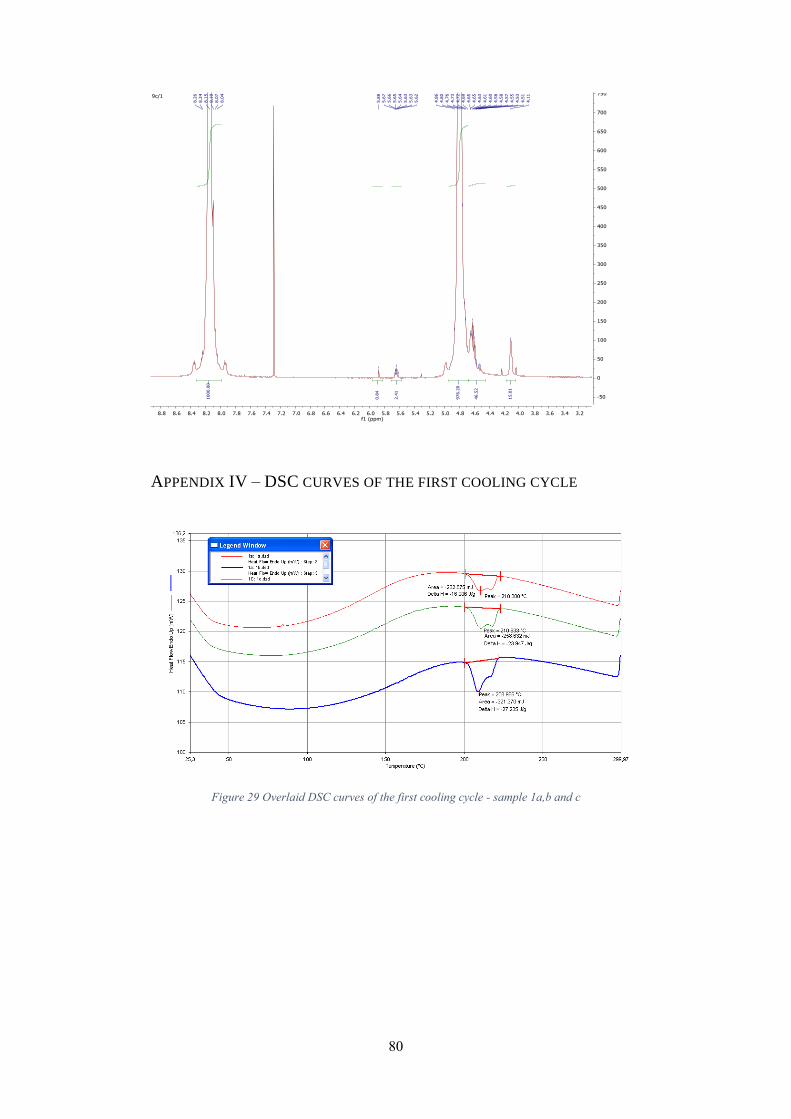
80
APPENDIX IV – DSC CURVES OF THE FIRST COOLING CYCLE
Figure 29 Overlaid DSC curves of the first cooling cycle - sample 1a,b and c
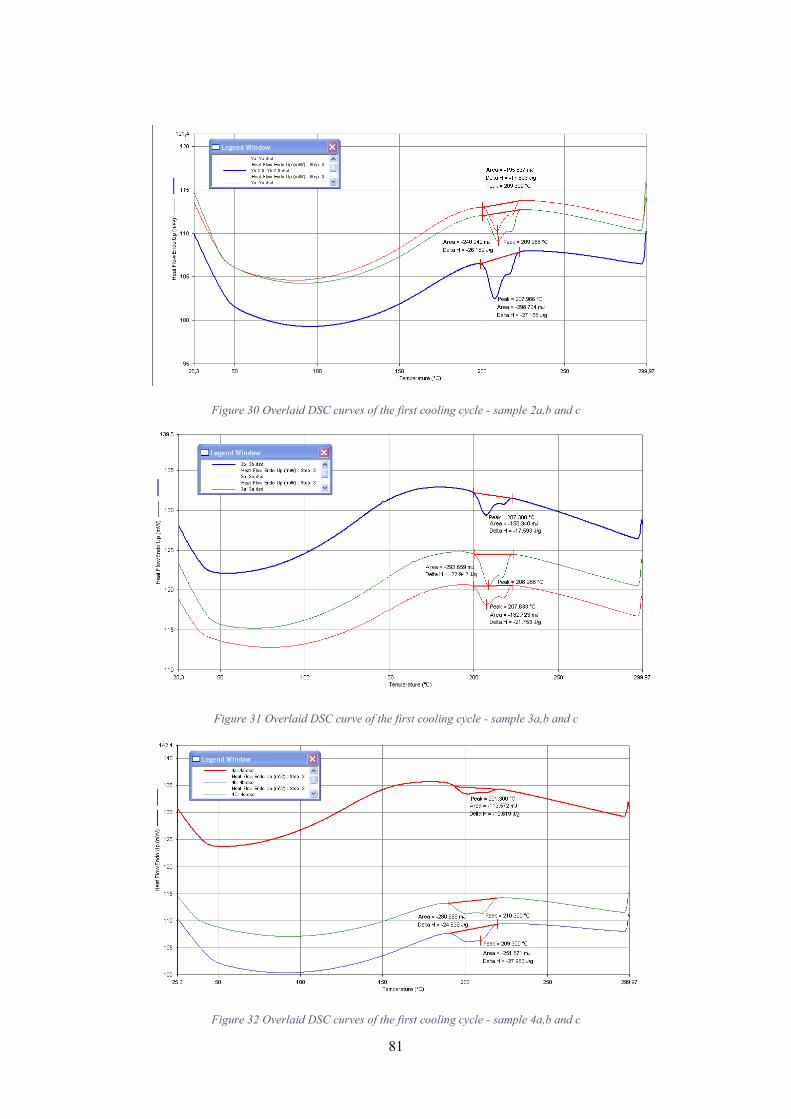
81
Figure 30 Overlaid DSC curves of the first cooling cycle - sample 2a,b and c
Figure 31 Overlaid DSC curve of the first cooling cycle - sample 3a,b and c
Figure 32 Overlaid DSC curves of the first cooling cycle - sample 4a,b and c
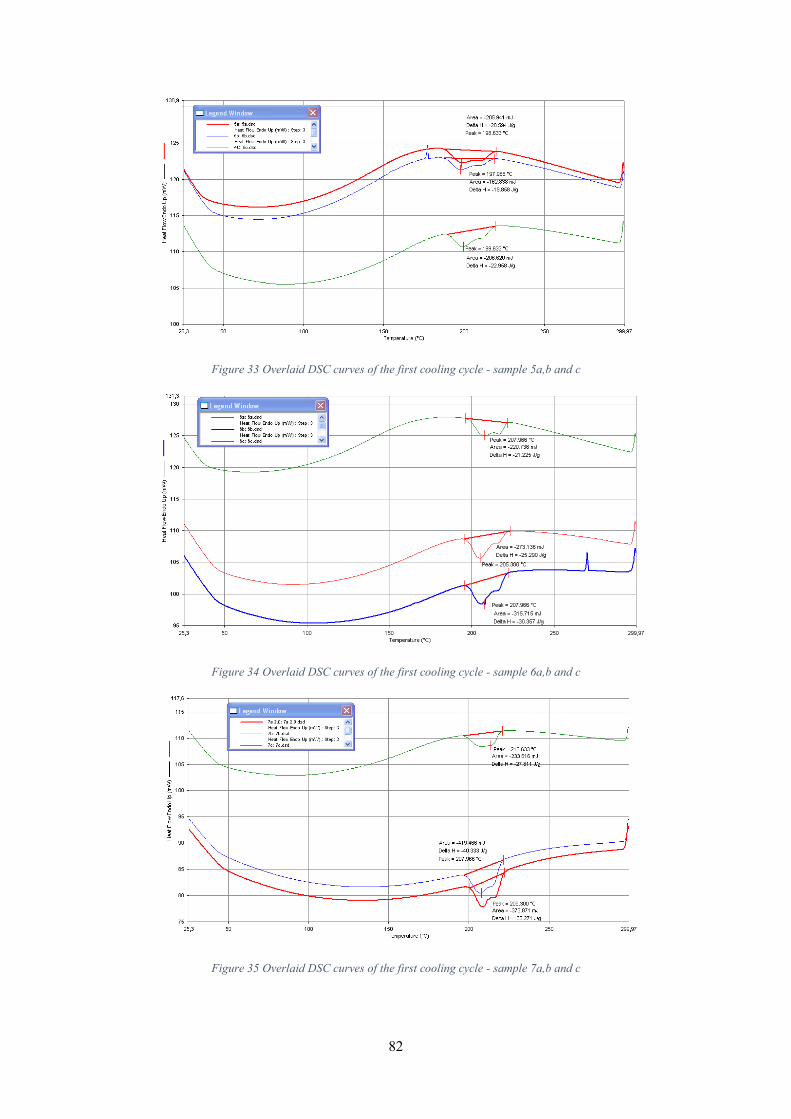
82
Figure 33 Overlaid DSC curves of the first cooling cycle - sample 5a,b and c
Figure 34 Overlaid DSC curves of the first cooling cycle - sample 6a,b and c
Figure 35 Overlaid DSC curves of the first cooling cycle - sample 7a,b and c
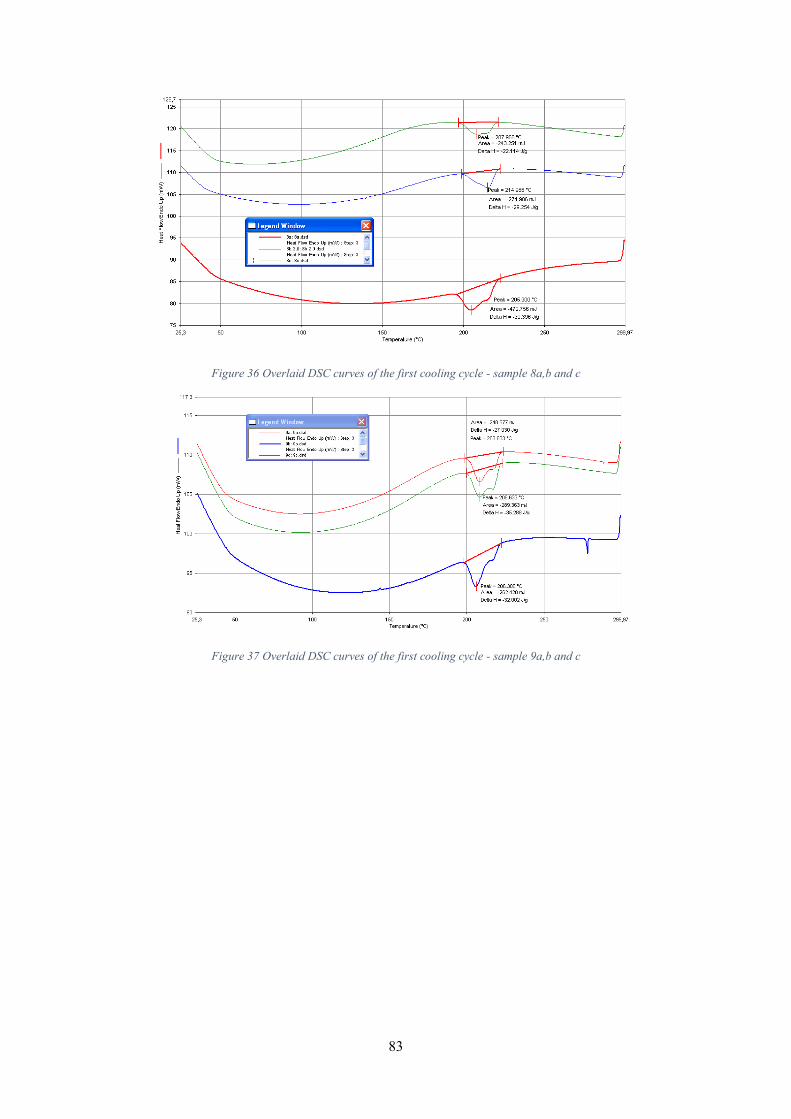
83
Figure 36 Overlaid DSC curves of the first cooling cycle - sample 8a,b and c
Figure 37 Overlaid DSC curves of the first cooling cycle - sample 9a,b and c
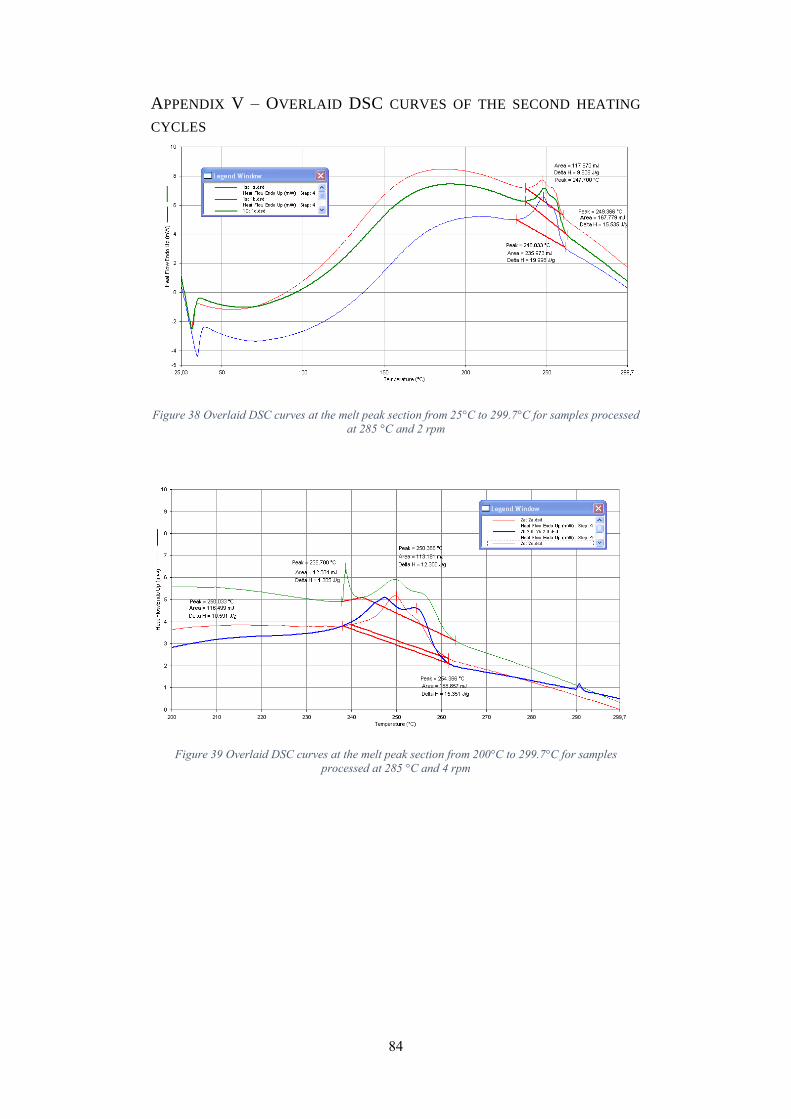
84
APPENDIX V – OVERLAID DSC CURVES OF THE SECOND HEATING
CYCLES
Figure 38 Overlaid DSC curves at the melt peak section from 25°C to 299.7°C for samples processed
at 285 °C and 2 rpm
Figure 39 Overlaid DSC curves at the melt peak section from 200°C to 299.7°C for samples
processed at 285 °C and 4 rpm
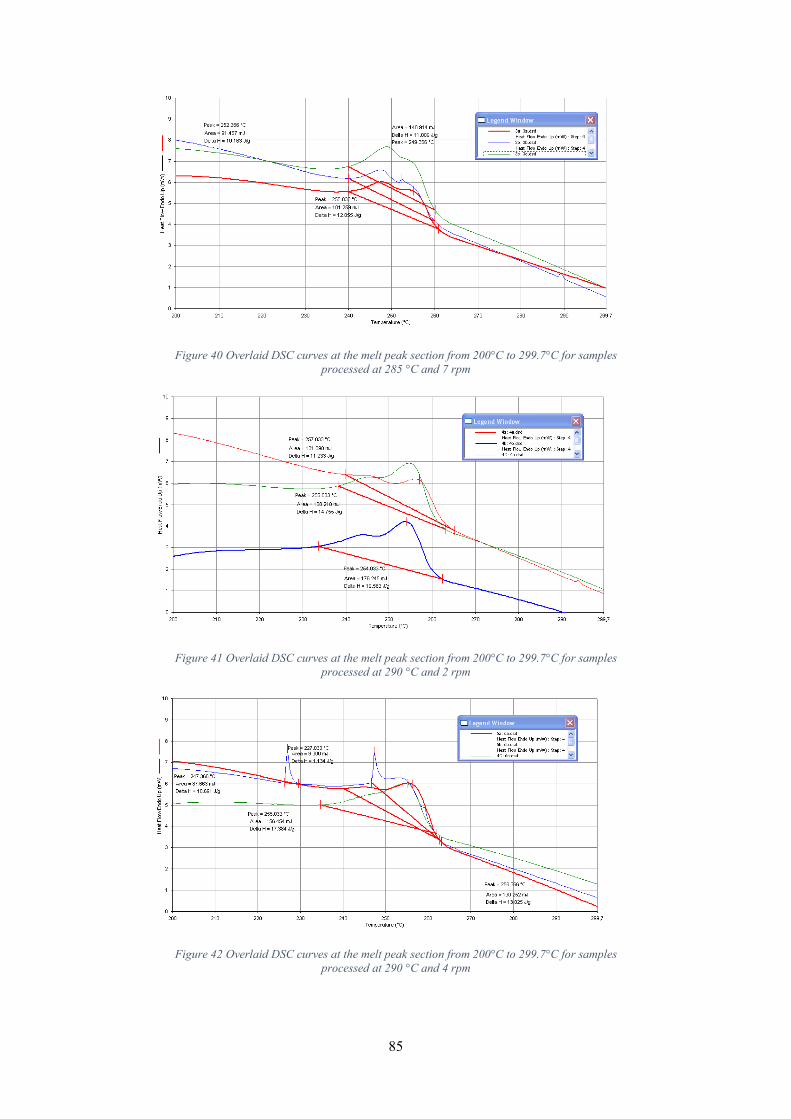
85
Figure 40 Overlaid DSC curves at the melt peak section from 200°C to 299.7°C for samples
processed at 285 °C and 7 rpm
Figure 41 Overlaid DSC curves at the melt peak section from 200°C to 299.7°C for samples
processed at 290 °C and 2 rpm
Figure 42 Overlaid DSC curves at the melt peak section from 200°C to 299.7°C for samples
processed at 290 °C and 4 rpm
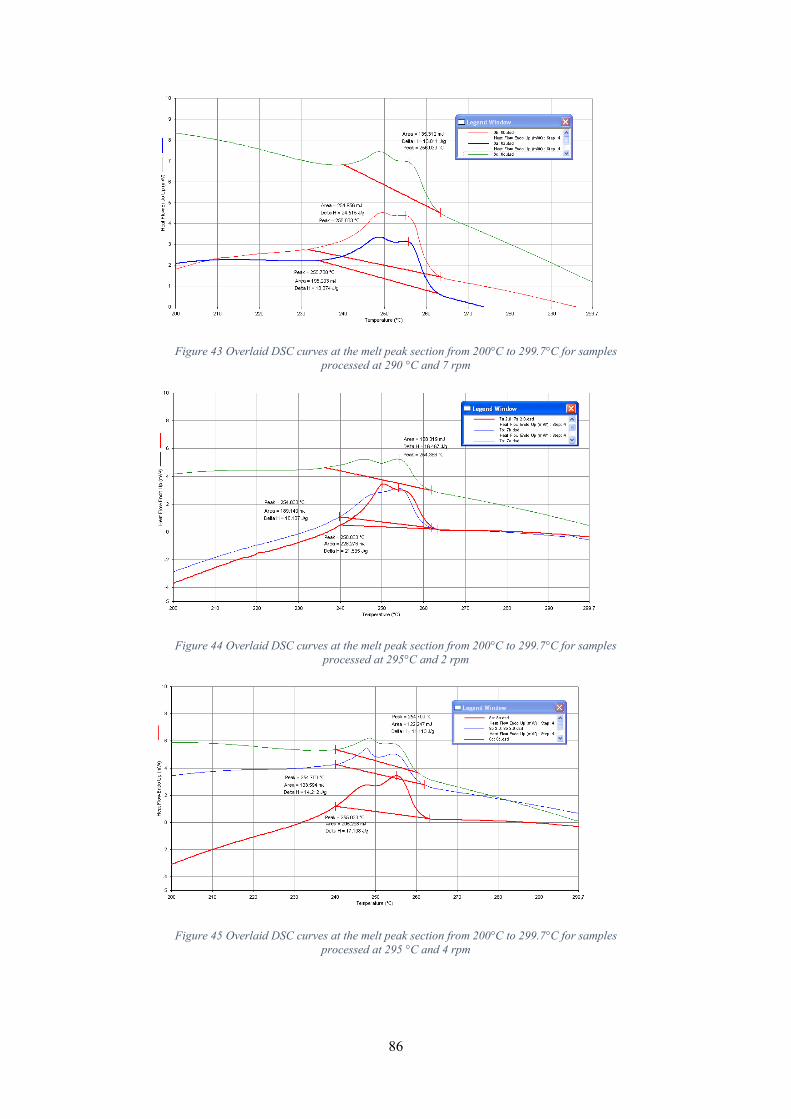
86
Figure 43 Overlaid DSC curves at the melt peak section from 200°C to 299.7°C for samples
processed at 290 °C and 7 rpm
Figure 44 Overlaid DSC curves at the melt peak section from 200°C to 299.7°C for samples
processed at 295°C and 2 rpm
Figure 45 Overlaid DSC curves at the melt peak section from 200°C to 299.7°C for samples
processed at 295 °C and 4 rpm
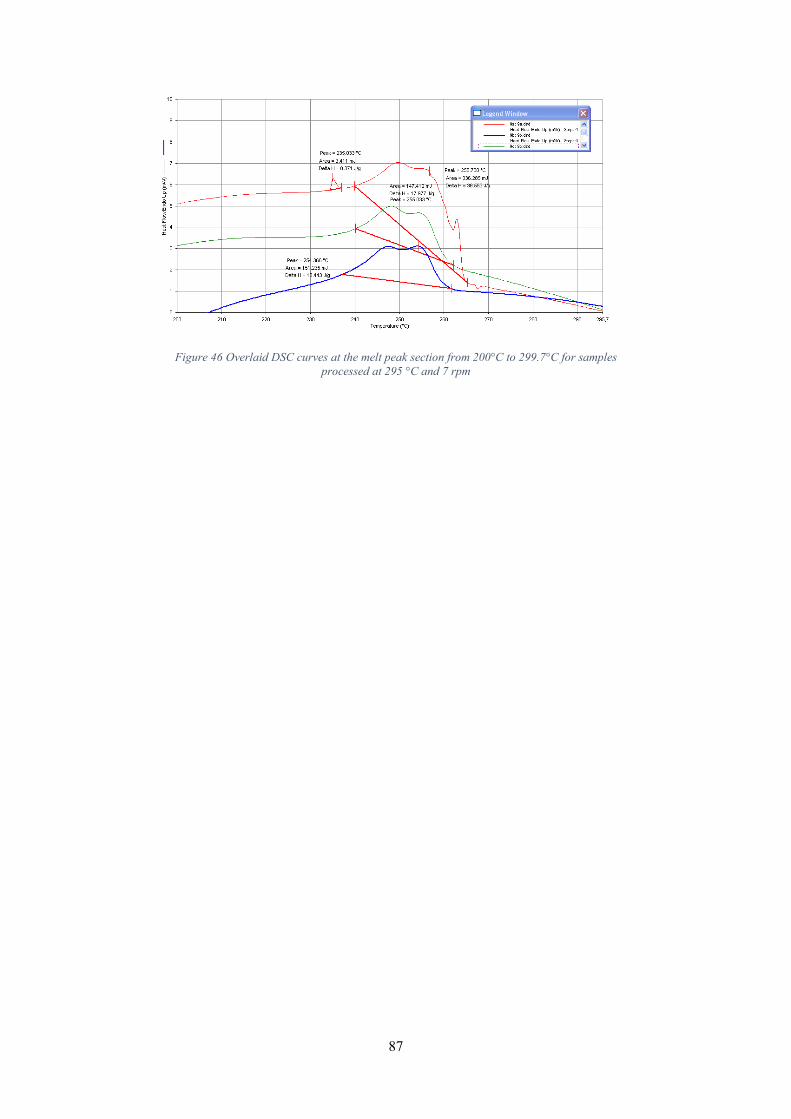
87
Figure 46 Overlaid DSC curves at the melt peak section from 200°C to 299.7°C for samples
processed at 295 °C and 7 rpm