Embed Size (px)
Citation preview
at SciVerse ScienceDirect
Polymer Degradation and Stability 97 (2012) 192e199
Contents lists available
Polymer Degradation and Stability
journal homepage: www.elsevier .com/locate/polydegstab
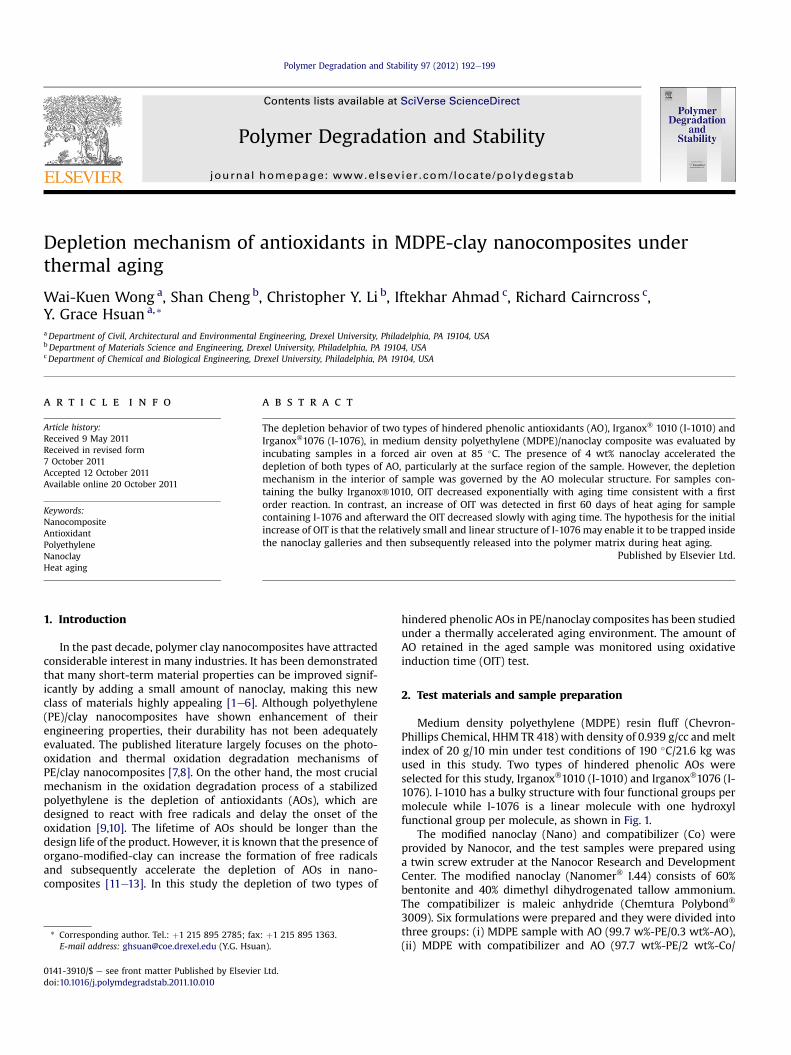
Depletion mechanism of antioxidants in MDPE-clay nanocomposites underthermal aging
Wai-Kuen Wong a, Shan Cheng b, Christopher Y. Li b, Iftekhar Ahmad c, Richard Cairncross c,Y. Grace Hsuan a,*
aDepartment of Civil, Architectural and Environmental Engineering, Drexel University, Philadelphia, PA 19104, USAbDepartment of Materials Science and Engineering, Drexel University, Philadelphia, PA 19104, USAcDepartment of Chemical and Biological Engineering, Drexel University, Philadelphia, PA 19104, USA
a r t i c l e i n f o
Article history:Received 9 May 2011Received in revised form7 October 2011Accepted 12 October 2011Available online 20 October 2011
Keywords:NanocompositeAntioxidantPolyethyleneNanoclayHeat aging
* Corresponding author. Tel.: þ1 215 895 2785; faxE-mail address: [email protected] (Y.G. Hsua
0141-3910/$ e see front matter Published by Elsevierdoi:10.1016/j.polymdegradstab.2011.10.010
a b s t r a c t
The depletion behavior of two types of hindered phenolic antioxidants (AO), Irganox� 1010 (I-1010) andIrganox�1076 (I-1076), in medium density polyethylene (MDPE)/nanoclay composite was evaluated byincubating samples in a forced air oven at 85 �C. The presence of 4 wt% nanoclay accelerated thedepletion of both types of AO, particularly at the surface region of the sample. However, the depletionmechanism in the interior of sample was governed by the AO molecular structure. For samples con-taining the bulky Irganox�1010, OIT decreased exponentially with aging time consistent with a firstorder reaction. In contrast, an increase of OIT was detected in first 60 days of heat aging for samplecontaining I-1076 and afterward the OIT decreased slowly with aging time. The hypothesis for the initialincrease of OIT is that the relatively small and linear structure of I-1076 may enable it to be trapped insidethe nanoclay galleries and then subsequently released into the polymer matrix during heat aging.
Published by Elsevier Ltd.
1. Introduction
In the past decade, polymer clay nanocomposites have attractedconsiderable interest in many industries. It has been demonstratedthat many short-term material properties can be improved signif-icantly by adding a small amount of nanoclay, making this newclass of materials highly appealing [1e6]. Although polyethylene(PE)/clay nanocomposites have shown enhancement of theirengineering properties, their durability has not been adequatelyevaluated. The published literature largely focuses on the photo-oxidation and thermal oxidation degradation mechanisms ofPE/clay nanocomposites [7,8]. On the other hand, the most crucialmechanism in the oxidation degradation process of a stabilizedpolyethylene is the depletion of antioxidants (AOs), which aredesigned to react with free radicals and delay the onset of theoxidation [9,10]. The lifetime of AOs should be longer than thedesign life of the product. However, it is known that the presence oforgano-modified-clay can increase the formation of free radicalsand subsequently accelerate the depletion of AOs in nano-composites [11e13]. In this study the depletion of two types of
: þ1 215 895 1363.n).
Ltd.
hindered phenolic AOs in PE/nanoclay composites has been studiedunder a thermally accelerated aging environment. The amount ofAO retained in the aged sample was monitored using oxidativeinduction time (OIT) test.
2. Test materials and sample preparation
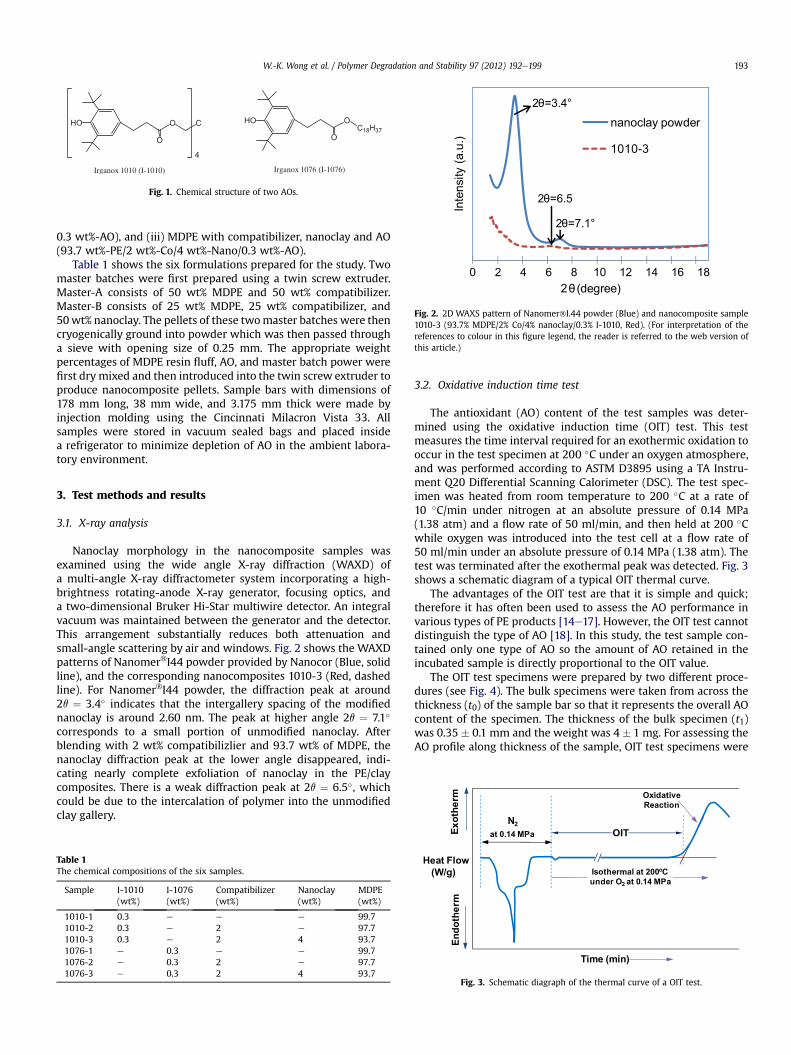
Medium density polyethylene (MDPE) resin fluff (Chevron-Phillips Chemical, HHM TR 418) with density of 0.939 g/cc and meltindex of 20 g/10 min under test conditions of 190 �C/21.6 kg wasused in this study. Two types of hindered phenolic AOs wereselected for this study, Irganox�1010 (I-1010) and Irganox�1076 (I-1076). I-1010 has a bulky structure with four functional groups permolecule while I-1076 is a linear molecule with one hydroxylfunctional group per molecule, as shown in Fig. 1.
The modified nanoclay (Nano) and compatibilizer (Co) wereprovided by Nanocor, and the test samples were prepared usinga twin screw extruder at the Nanocor Research and DevelopmentCenter. The modified nanoclay (Nanomer� I.44) consists of 60%bentonite and 40% dimethyl dihydrogenated tallow ammonium.The compatibilizer is maleic anhydride (Chemtura Polybond�
3009). Six formulations were prepared and they were divided intothree groups: (i) MDPE sample with AO (99.7 w%-PE/0.3 wt%-AO),(ii) MDPE with compatibilizer and AO (97.7 wt%-PE/2 wt%-Co/
HO O
O
4
C
Irganox 1010 (I-1010)
HO O
OC18H37
Irganox 1076 (I-1076)
Fig. 1. Chemical structure of two AOs.
0 2 4 6 8 10 12 14 16 18
Inte
nsity
(a.u
.)
2θ (degree)
nanoclay powder
1010-3
2θ=6.5
2θ=3.4°
2θ=7.1°
Fig. 2. 2D WAXS pattern of Nanomer�I.44 powder (Blue) and nanocomposite sample1010-3 (93.7% MDPE/2% Co/4% nanoclay/0.3% I-1010, Red). (For interpretation of thereferences to colour in this figure legend, the reader is referred to the web version ofthis article.)
W.-K. Wong et al. / Polymer Degradation and Stability 97 (2012) 192e199 193
0.3 wt%-AO), and (iii) MDPE with compatibilizer, nanoclay and AO(93.7 wt%-PE/2 wt%-Co/4 wt%-Nano/0.3 wt%-AO).
Table 1 shows the six formulations prepared for the study. Twomaster batches were first prepared using a twin screw extruder.Master-A consists of 50 wt% MDPE and 50 wt% compatibilizer.Master-B consists of 25 wt% MDPE, 25 wt% compatibilizer, and50wt% nanoclay. The pellets of these twomaster batches were thencryogenically ground into powder which was then passed througha sieve with opening size of 0.25 mm. The appropriate weightpercentages of MDPE resin fluff, AO, and master batch power werefirst dry mixed and then introduced into the twin screw extruder toproduce nanocomposite pellets. Sample bars with dimensions of178 mm long, 38 mm wide, and 3.175 mm thick were made byinjection molding using the Cincinnati Milacron Vista 33. Allsamples were stored in vacuum sealed bags and placed insidea refrigerator to minimize depletion of AO in the ambient labora-tory environment.
oth
erm
N2
Oxidative
Reaction
3. Test methods and results
3.1. X-ray analysis
Nanoclay morphology in the nanocomposite samples wasexamined using the wide angle X-ray diffraction (WAXD) ofa multi-angle X-ray diffractometer system incorporating a high-brightness rotating-anode X-ray generator, focusing optics, anda two-dimensional Bruker Hi-Star multiwire detector. An integralvacuum was maintained between the generator and the detector.This arrangement substantially reduces both attenuation andsmall-angle scattering by air and windows. Fig. 2 shows the WAXDpatterns of Nanomer�I44 powder provided by Nanocor (Blue, solidline), and the corresponding nanocomposites 1010-3 (Red, dashedline). For Nanomer�I44 powder, the diffraction peak at around2q ¼ 3.4� indicates that the intergallery spacing of the modifiednanoclay is around 2.60 nm. The peak at higher angle 2q ¼ 7.1�
corresponds to a small portion of unmodified nanoclay. Afterblending with 2 wt% compatibilizlier and 93.7 wt% of MDPE, thenanoclay diffraction peak at the lower angle disappeared, indi-cating nearly complete exfoliation of nanoclay in the PE/claycomposites. There is a weak diffraction peak at 2q ¼ 6.5�, whichcould be due to the intercalation of polymer into the unmodifiedclay gallery.
Table 1The chemical compositions of the six samples.
Sample I-1010(wt%)
I-1076(wt%)
Compatibilizer(wt%)
Nanoclay(wt%)
MDPE(wt%)
1010-1 0.3 e e e 99.71010-2 0.3 e 2 e 97.71010-3 0.3 e 2 4 93.71076-1 e 0.3 e e 99.71076-2 e 0.3 2 e 97.71076-3 e 0.3 2 4 93.7
3.2. Oxidative induction time test
The antioxidant (AO) content of the test samples was deter-mined using the oxidative induction time (OIT) test. This testmeasures the time interval required for an exothermic oxidation tooccur in the test specimen at 200 �C under an oxygen atmosphere,and was performed according to ASTM D3895 using a TA Instru-ment Q20 Differential Scanning Calorimeter (DSC). The test spec-imen was heated from room temperature to 200 �C at a rate of10 �C/min under nitrogen at an absolute pressure of 0.14 MPa(1.38 atm) and a flow rate of 50 ml/min, and then held at 200 �Cwhile oxygen was introduced into the test cell at a flow rate of50 ml/min under an absolute pressure of 0.14 MPa (1.38 atm). Thetest was terminated after the exothermal peak was detected. Fig. 3shows a schematic diagram of a typical OIT thermal curve.
The advantages of the OIT test are that it is simple and quick;therefore it has often been used to assess the AO performance invarious types of PE products [14e17]. However, the OIT test cannotdistinguish the type of AO [18]. In this study, the test sample con-tained only one type of AO so the amount of AO retained in theincubated sample is directly proportional to the OIT value.
The OIT test specimens were prepared by two different proce-dures (see Fig. 4). The bulk specimens were taken from across thethickness (t0) of the sample bar so that it represents the overall AOcontent of the specimen. The thickness of the bulk specimen (t1)was 0.35 � 0.1 mm and the weight was 4 � 1 mg. For assessing theAO profile along thickness of the sample, OIT test specimens were
Ex
En
do
th
erm
at 0.14 MPa
Isothermal at 200oC
under O2
at 0.14 MPa
OIT
Time (min)
Heat Flow
(W/g)
Fig. 3. Schematic diagraph of the thermal curve of a OIT test.

OIT
(min
.)
Incubation Time (days)
010050
•
to
t1
Sample Bar
Bulk specimen
to
OIT
(min
.)
Normalized Thickness
0 1.00.5
••
•• • •
•
••
t2
Sample Bar
Sliced specimen
Fig. 4. Configuration of bulk and sliced specimens taken from the incubation sample for the OIT test.
W.-K. Wong et al. / Polymer Degradation and Stability 97 (2012) 192e199194
prepared by slicing parallel to the surface of the sample layer bylayer. Nine slices were cut along the sample’s thickness (t0). Thethickness of the each slice (t2) ranged from 0.1 � 0.05 mm to0.7 � 0.1 mm with corresponding weight from 1.0 � 0.2 mg to7.0 � 1.0 mg. Thinner slices were cut at the edge region of thesample in comparison to interior portion because OIT changedmore rapidly near the surface than in the interior of the sample.
30
40
50
60
70
IT (m
in.)
3.3. Unaged samples
OIT tests were performed on the original test samples and theretrieved incubated samples. For unaged original samples, theaverage OIT value of the bulk specimen of six formulations is shownin Table 2. The same weight percent of each AO has been added tothree materials: MDPE, MDPE/Co, and MDPE/Co/Nano.
Since the weight percentage was used to calculate eachcomponent in the sample, the actual molar concentration of theactive hydroxyl groups in I-1010 would be twice of that in I-1076.However, the average OIT value of I-1076 is less than half of thevalue of I-1010 by comparing between 1010-1 and 1076-1, and1010-2 and 1076-2. The lower OIT value may indicate that a greateramount of I-1076 was consumed during the pellet extrusion andinjection modeling of the sample. The recorded temperatures invarious zones of the twin extruder ranged from 210 to 250 �C, while1% weight loss at 230 �C was stated in the I-1076 specificationsheet. Adding nanoclay did not affect the average OIT for samplescontaining I-1010 (1010-2 vs. 1010-3); however, the sample with 2-wt% of compatibilizer has a lower OIT value than the pristine resin
Table 2OIT value of unaged samples.
Sample I-1010(wt%)
I-1076(wt%)
Co(wt%)
Nanoclay(wt%)
OIT Value(min.)
1010-1 0.3 e e e 74.4 � 1.21010-2 0.3 e 2 e 67.7 � 0.91010-3 0.3 e 2 4 65.1 � 0.71076-1 e 0.3 e e 21.7 � 2.81076-2 0.3 2 e 23.0 � 1.01076-3 0.3 2 4 15.1 � 0.5
(1010-2 vs. 1010-1). For samples containing I-1076, the average OITvalues are the same with and without 2-wt% of compatibilizerwhile the average OIT is lowered by adding 4-wt% of nanoclay(1076-3 vs. 1076-2). The distribution of AO along the thickness ofthe unaged original nanocomposite samples was also evaluated bymeasuring the OIT value of sliced specimens. The results show thatOIT values are relatively similar along the thickness for 1010-3 and1076-3, as shown in Fig. 5.
3.4. Aged samples
Six sets of samples were incubated in a forced air oven at 85 �Cto accelerate the depletion rate of AO. The incubated samples wereretrieved from the oven and the remaining AO content wasmeasured by the OIT test. Fig. 6 shows the average OIT value of bulkspecimen versus aging time. Adding 4 wt% of nanoclay to MDPE/Colowered the average OIT value significantly, implying that theoxidation mechanism had been accelerated by the nanoclay.Similar behavior has also been reported in other thermal aging andultraviolet degradation studies of polypropylene and polyethylene
0
10
20
0 0.2 0.4 0.6 0.8 1 1.2
O
Normolized Thickness
1010-1 1076-1
Fig. 5. Initial AO distribution along the thickness of MDPE/Co/Nano samples using thinsliced specimens.
0
20
40
60
80
100
120
0 50 100 150 200 250
OIT
Ret
aine
d (%
)
Incubation Time (day)
1010-2 1010-3 1076-2 1076-3
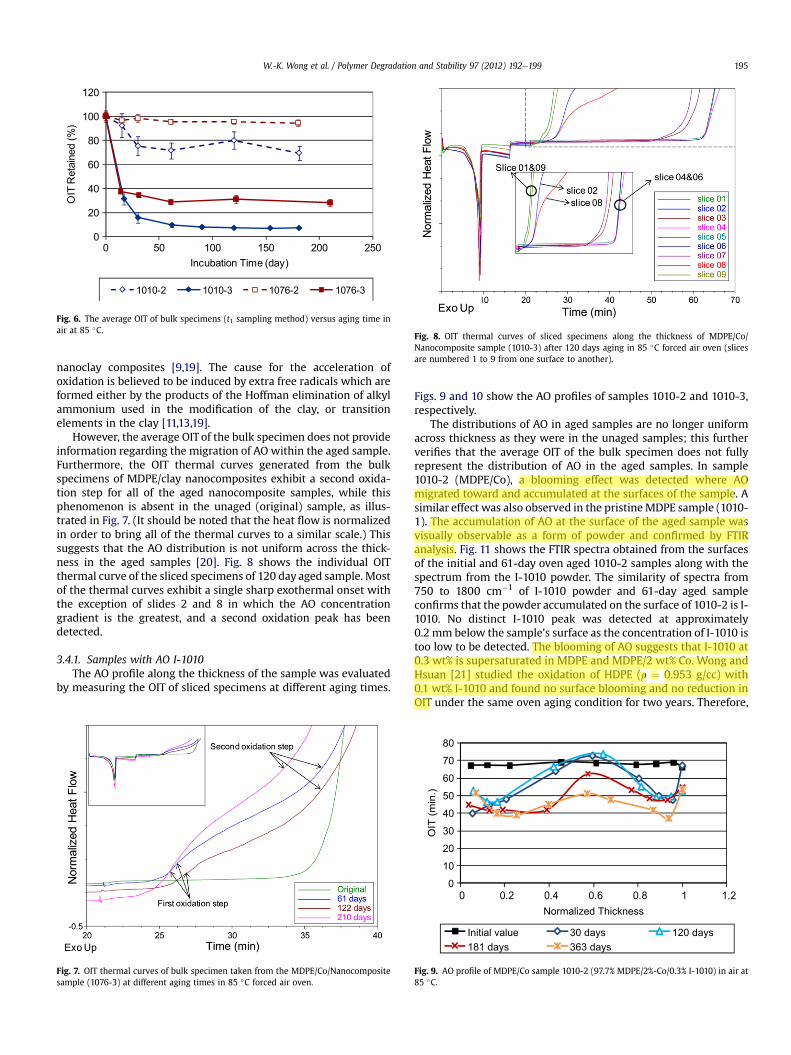
Fig. 6. The average OIT of bulk specimens (t1 sampling method) versus aging time inair at 85 �C.
Fig. 8. OIT thermal curves of sliced specimens along the thickness of MDPE/Co/Nanocomposite sample (1010-3) after 120 days aging in 85 �C forced air oven (slicesare numbered 1 to 9 from one surface to another).
W.-K. Wong et al. / Polymer Degradation and Stability 97 (2012) 192e199 195
nanoclay composites [9,19]. The cause for the acceleration ofoxidation is believed to be induced by extra free radicals which areformed either by the products of the Hoffman elimination of alkylammonium used in the modification of the clay, or transitionelements in the clay [11,13,19].
However, the average OIT of the bulk specimen does not provideinformation regarding the migration of AO within the aged sample.Furthermore, the OIT thermal curves generated from the bulkspecimens of MDPE/clay nanocomposites exhibit a second oxida-tion step for all of the aged nanocomposite samples, while thisphenomenon is absent in the unaged (original) sample, as illus-trated in Fig. 7. (It should be noted that the heat flow is normalizedin order to bring all of the thermal curves to a similar scale.) Thissuggests that the AO distribution is not uniform across the thick-ness in the aged samples [20]. Fig. 8 shows the individual OITthermal curve of the sliced specimens of 120 day aged sample. Mostof the thermal curves exhibit a single sharp exothermal onset withthe exception of slides 2 and 8 in which the AO concentrationgradient is the greatest, and a second oxidation peak has beendetected.
3.4.1. Samples with AO I-1010The AO profile along the thickness of the sample was evaluated
by measuring the OIT of sliced specimens at different aging times.
Fig. 7. OIT thermal curves of bulk specimen taken from the MDPE/Co/Nanocompositesample (1076-3) at different aging times in 85 �C forced air oven.
Figs. 9 and 10 show the AO profiles of samples 1010-2 and 1010-3,respectively.
The distributions of AO in aged samples are no longer uniformacross thickness as they were in the unaged samples; this furtherverifies that the average OIT of the bulk specimen does not fullyrepresent the distribution of AO in the aged samples. In sample1010-2 (MDPE/Co), a blooming effect was detected where AOmigrated toward and accumulated at the surfaces of the sample. Asimilar effect was also observed in the pristine MDPE sample (1010-1). The accumulation of AO at the surface of the aged sample wasvisually observable as a form of powder and confirmed by FTIRanalysis. Fig. 11 shows the FTIR spectra obtained from the surfacesof the initial and 61-day oven aged 1010-2 samples along with thespectrum from the I-1010 powder. The similarity of spectra from750 to 1800 cm�1 of I-1010 powder and 61-day aged sampleconfirms that the powder accumulated on the surface of 1010-2 is I-1010. No distinct I-1010 peak was detected at approximately0.2 mm below the sample’s surface as the concentration of I-1010 istoo low to be detected. The blooming of AO suggests that I-1010 at0.3 wt% is supersaturated in MDPE and MDPE/2 wt% Co. Wong andHsuan [21] studied the oxidation of HDPE (r ¼ 0.953 g/cc) with0.1 wt% I-1010 and found no surface blooming and no reduction inOIT under the same oven aging condition for two years. Therefore,
0
10
20
30
40
50
60
70
80
0 0.2 0.4 0.6 0.8 1 1.2
OIT
(min
.)
Normalized Thickness
Initial value 30 days 120 days181 days 363 days
Fig. 9. AO profile of MDPE/Co sample 1010-2 (97.7% MDPE/2%-Co/0.3% I-1010) in air at85 �C.

0
10
20
30
40
50
60
70
80
0 0.2 0.4 0.6 0.8 1 1.2
OIT
(min
.)
Normalized Thickness
Initial Value 30 days 62 days120 days 181 days 262 days445 days
Fig. 10. AO profile of MDPE/Co/Nano sample 1010-3 (93.7% MDPE/2% Co/4% nanoclay/0.3% I-1010) in air at 85 �C.
0
10
20
30
40
50
60
70
0 0.2 0.4 0.6 0.8 1 1.2
OIT
(min
.)
Normalized Thickness
Initial value 30 days 62 days 90 days
Fig. 12. AO profile of MDPE/Co/Nano sample 1010-3 (93.7% MDPE/2% Co/4% Nanoclay/0.3% I-1010) in stagnant air at 85 �C.
W.-K. Wong et al. / Polymer Degradation and Stability 97 (2012) 192e199196
the dome-shaped AO profile of 1010-2 in Fig. 9 was likely inducedby the physical migration of AO rather than the free radical reac-tions. This hypothesis is further verified by incubating 1010-2samples in a nitrogen atmosphere and the result will be discussedin Section 3.5.
For the nanocomposite sample (1010-3), the AO migration iscompletely altered by the presence of 4 wt% of nanoclay. Asymmetrical table-top profile was resulted and the profile waspreserved as aging proceeded. The AO near the two exposedsurfaces depleted rapidly as indicated by the abrupt drop in the OITvalue close to the surface. After 30 days of incubation, the OIT valuedecreased to almost zero. On the other hand, a uniform distributionof AO was detected in the interior of aged samples. As aging timeincreased, AO in the core of the sample decreased consistently,while the AO depletion zone at two surfaces gradually propagatedinwards. The AO profiles were mainly affected by three mainparameters: AO migration rate, oxygen diffusion rate, and AOconsumption rate. The presence of oxygen and nanoclay may causethe high AO consumption at the two surfaces. With oxygen, the rateof free radical formation could be accelerated by the alkyl ammo-nium cations or transition metals on the clay surface, therefore theconsumption rate of AO also increased. Since the AO-depletedsection is limited to a relatively small portion at the two exposedsurfaces of the sample, the profile indicates that the oxygen diffu-sion rate may be impeded by the nanoclay platelets, reducing the
Fig. 11. FTIR spectrum obtained from the surface of initial and aged MDPE/
oxygen penetration depth and resulting in a table-top profileinstead of a parabolic curve which typically corresponds todiffusion-control mechanism [14,15]. The evenly distributed AO inthe core of the aged sample suggests that themobility of I-1010 wasalso limited by the nanoclay platelets. However, further study isneeded to understand the AO depletion mechanism in the interiorof the sample.
The cause for the large depletion of AO near the two exposedsurfaces was further investigated by incubating sample 1010-3 ina stagnant air. Sample was hanged inside an open steel containerwhich was placed in the forced air oven at 85 �C. The table-topprofile is still observed in the aged samples, as shown in Fig. 12.After 60 days, the OIT value decreased to 40 min near the surfacesand 54 min in the core of the sample, whereas OIT values of 3 minand 48 minwere measured near the surface and core of the samplerespectively in the circulated air. Furthermore, the normalizedthickness of the surface region (inwhich OIT varies from the nearly-uniform value in the center of the sample to a lower value at thesurface) is approximately 0.15 after 60 days in stagnant air but it is0.25 in circulated air. Results suggest that circulated air of theforced air oven enhanced the AO consumption rate near the surfaceby increasing the rate of evaporation of AO.
3.4.2. Samples with AO-1076The AO distribution profiles of 1076-2 and 1076-3 are shown in
Figs. 13 and 14, respectively. For the sample without nanoclay
Co sample 1010-2 (97.7% MDPE/2% Co/0.3% I-1010) and I-1010 powder.
0
5
10
15
20
25
30
0 0.2 0.4 0.6 0.8 1 1.2
OIT
(min
.)
Normalized Thickness
Initial Value 30 days 120 days180 days 363 days
Fig. 13. AO profile of MDPE/Co sample 1076-2 (97.7% MDPE/2% Co/0.3% I-1076) in air at85 �C.
0102030405060708090
0 0.2 0.4 0.6 0.8 1 1.2
OIT
(min
.)
Normalized Thickness
Initial Value 30 days 120 days
Fig. 15. AO profile of MDPE/Co sample 1010-2 (97.7% MDPE/2% Co/0.3% I-1010) innitrogen at 85 �C.
W.-K. Wong et al. / Polymer Degradation and Stability 97 (2012) 192e199 197
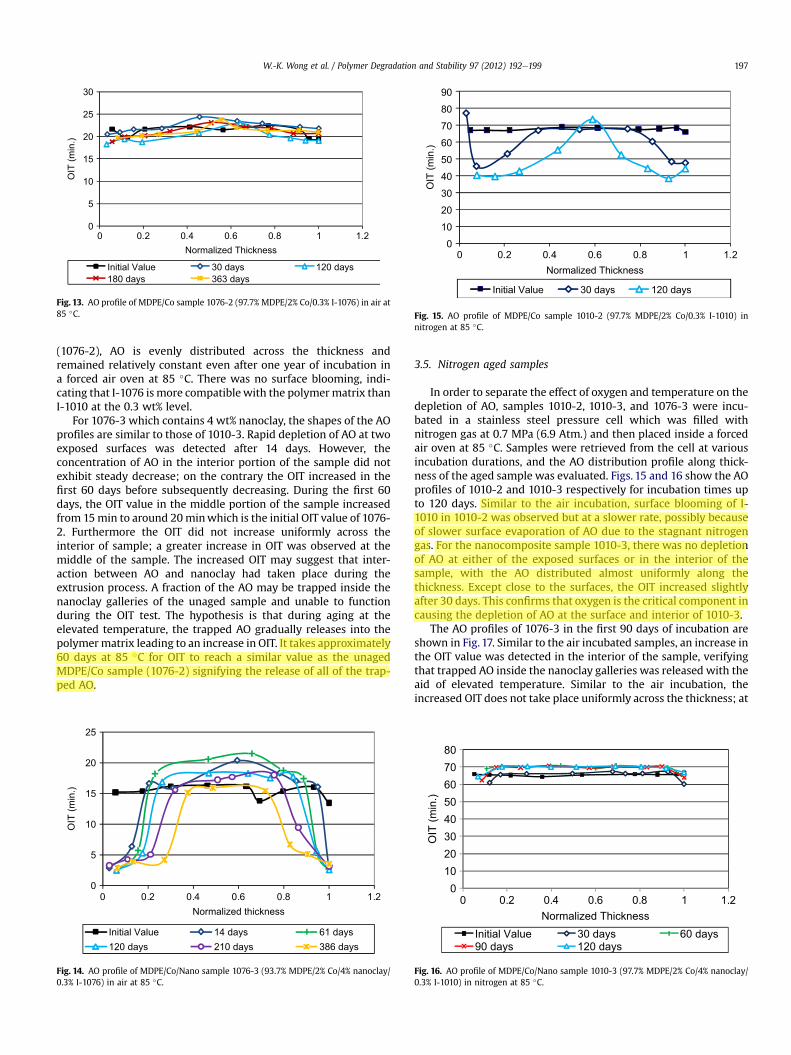
(1076-2), AO is evenly distributed across the thickness andremained relatively constant even after one year of incubation ina forced air oven at 85 �C. There was no surface blooming, indi-cating that I-1076 ismore compatiblewith the polymermatrix thanI-1010 at the 0.3 wt% level.
For 1076-3 which contains 4 wt% nanoclay, the shapes of the AOprofiles are similar to those of 1010-3. Rapid depletion of AO at twoexposed surfaces was detected after 14 days. However, theconcentration of AO in the interior portion of the sample did notexhibit steady decrease; on the contrary the OIT increased in thefirst 60 days before subsequently decreasing. During the first 60days, the OIT value in the middle portion of the sample increasedfrom 15min to around 20minwhich is the initial OIT value of 1076-2. Furthermore the OIT did not increase uniformly across theinterior of sample; a greater increase in OIT was observed at themiddle of the sample. The increased OIT may suggest that inter-action between AO and nanoclay had taken place during theextrusion process. A fraction of the AO may be trapped inside thenanoclay galleries of the unaged sample and unable to functionduring the OIT test. The hypothesis is that during aging at theelevated temperature, the trapped AO gradually releases into thepolymermatrix leading to an increase in OIT. It takes approximately60 days at 85 �C for OIT to reach a similar value as the unagedMDPE/Co sample (1076-2) signifying the release of all of the trap-ped AO.
0
5
10
15
20
25
0 0.2 0.4 0.6 0.8 1 1.2
OIT
(min
.)
Normalized thickness
Initial Value 14 days 61 days120 days 210 days 386 days
Fig. 14. AO profile of MDPE/Co/Nano sample 1076-3 (93.7% MDPE/2% Co/4% nanoclay/0.3% I-1076) in air at 85 �C.
3.5. Nitrogen aged samples
In order to separate the effect of oxygen and temperature on thedepletion of AO, samples 1010-2, 1010-3, and 1076-3 were incu-bated in a stainless steel pressure cell which was filled withnitrogen gas at 0.7 MPa (6.9 Atm.) and then placed inside a forcedair oven at 85 �C. Samples were retrieved from the cell at variousincubation durations, and the AO distribution profile along thick-ness of the aged sample was evaluated. Figs. 15 and 16 show the AOprofiles of 1010-2 and 1010-3 respectively for incubation times upto 120 days. Similar to the air incubation, surface blooming of I-1010 in 1010-2 was observed but at a slower rate, possibly becauseof slower surface evaporation of AO due to the stagnant nitrogengas. For the nanocomposite sample 1010-3, there was no depletionof AO at either of the exposed surfaces or in the interior of thesample, with the AO distributed almost uniformly along thethickness. Except close to the surfaces, the OIT increased slightlyafter 30 days. This confirms that oxygen is the critical component incausing the depletion of AO at the surface and interior of 1010-3.
The AO profiles of 1076-3 in the first 90 days of incubation areshown in Fig. 17. Similar to the air incubated samples, an increase inthe OIT value was detected in the interior of the sample, verifyingthat trapped AO inside the nanoclay galleries was released with theaid of elevated temperature. Similar to the air incubation, theincreased OIT does not take place uniformly across the thickness; at
01020304050607080
0 0.2 0.4 0.6 0.8 1 1.2
OIT
(min
.)
Normalized ThicknessInitial Value 30 days 60 days90 days 120 days
Fig. 16. AO profile of MDPE/Co/Nano sample 1010-3 (97.7% MDPE/2% Co/4% nanoclay/0.3% I-1010) in nitrogen at 85 �C.

0
5
10
15
20
25
0 0.2 0.4 0.6 0.8 1 1.2
OIT
(min
.)
Normalized Thickness
Initial value 30 days 60 days 90 days
Fig. 17. AO profile of MDPE/Co/Nano sample 1076-3 (97.7% MDPE/2% Co/4% nanoclay/0.3% I-1076) in nitrogen at 85 �C.
Table 3Penetration depth of aged nanocomposite samples at different aging periods.
Sample 1010-3 Sample 1076-3
Agingtime(day)
Depth(side one)
Depth(side two)
Averagedepth
Agingtime(day)
Depth(side one)
Depth(side two)
Averagedepth
0 0 0 0 0 0 0 030 0.15 0.06 0.105 14 0.20 0.070 0.13562 0.27 0.18 0.225 61 0.28 0.13 0.205120 0.27 0.19 0.230 120 0.30 0.16 0.230181 0.29 0.27 0.280 210 0.36 0.21 0.285262 0.28 0.18 0.230 386 0.40 0.28 0.340445 0.32 e 0.295
W.-K. Wong et al. / Polymer Degradation and Stability 97 (2012) 192e199198
the center of the sample, the OIT value increases from 15 to around20 min whereas the value at the two surfaces remains around15 min after 60 days. This suggests that a greater amount of AO wastrapped inside nanoclay galleries in the interior of the sample thanat the edges of the sample, possibly caused by a temperaturegradient across the sample thickness during the injection modelingof the sample.
4. Discussion
The AO depletion mechanism in MDPE/clay nanocomposites at85 �C air environment was evaluated. Blending 4-wt% nanoclay intoMDPE with 3 wt% I-1010 or I-1076 significantly changes the AOdepletion behavior. Regardless of the type of AO, a rapid depletionof AO near two surfaces of the sample was detected as early as 14days after the incubation, creating a table-top shaped OIT profilealong the thickness of aged samples. The drastic decrease of AO atthe two surfaces is caused by multiple factors. As oxygen diffusesinto the nanocomposite, free radicals form and readily react withavailable AO. The depletion of AO is enhanced by the acceleratedformation of free radicals due to the alkyl ammonium in thenanoclay, and by the constantly circulated air which increases theAO evaporation rate. Furthermore, the presence of nanoclay in thepolymer composite likely hindered the migration of AO to thesurface to compensate for the loss. Likewise, the diffusion of oxygenis also impeded by nanoclay, but probably to a lesser degree due tothe small molecular size.
y = 0.0588ln(x) - 0.0585R² = 0.7464
y = 0.0599ln(x) - 0.0348R² = 0.9595
0
0.1
0.2
0.3
0.4
000100101
Pene
tratio
n D
epth
Aging Time (Day)
1010-3 1076-3
Fig. 18. The penetration depth of surface AO depletion against aging time for MDPE/Co/Nano samples 1010-3 and 1076-3 in air at 85 �C.
Fig. 18 shows the progress of AO depletion zone at the surface ofnanocomposites 1010-3 and 1076-3 by plotting the penetrationdepth against the aging time. The penetration depth which is thenormalized thickness corresponding to the onset of the drop in OITas an average calculated from both surfaces, and the values arelisted in Table 3. The data can be fitted with semi-log equations, asexpressed in Eqs. (1) and (2) for 1010-3 and 1076-3, respectively.The slopes of the two curves are very similar, although data from1010 to 3 yielded a poorer fit than that from 1076 to 3. The similarslope suggests that the AO depletion mechanism in both samples isthe same due to the commonality of functional groups between thetwo AOs. The propagation depth of 1076-3 is greater than 1010-3however, since the molar concentration of hydroxyl functionalgroups in 1076-3 is approximately half of that in 1010-3.
d ¼ 0:0599lnðtÞ � 0:0348 (1)
d ¼ 0:0588lnðtÞ � 0:0585 (2)
Where: d is penetration depth and t is aging time in days.In the interior of the nanocomposite samples, the reactivity of
the two AOs behaved differently, possibly due to the difference inthe molecular structure between I-1010 and I-1076. For 1010-3which contained I-1010, AO in the mid-section of the sampledecreased steadily with aging time, as documented by thedecreasing OIT shown in Fig. 19. It has found that the AO depletedexponentially with time as shown in Fig. 20 and Eq. (3). Theexponential decrease is consistent with a first order reaction whichis the common mechanism for depletion of AO in MDPE products
Fig. 19. OIT thermal curve of sliced specimen located at mid-section of sample 1010-3at various aging times in 85 �C forced air oven.
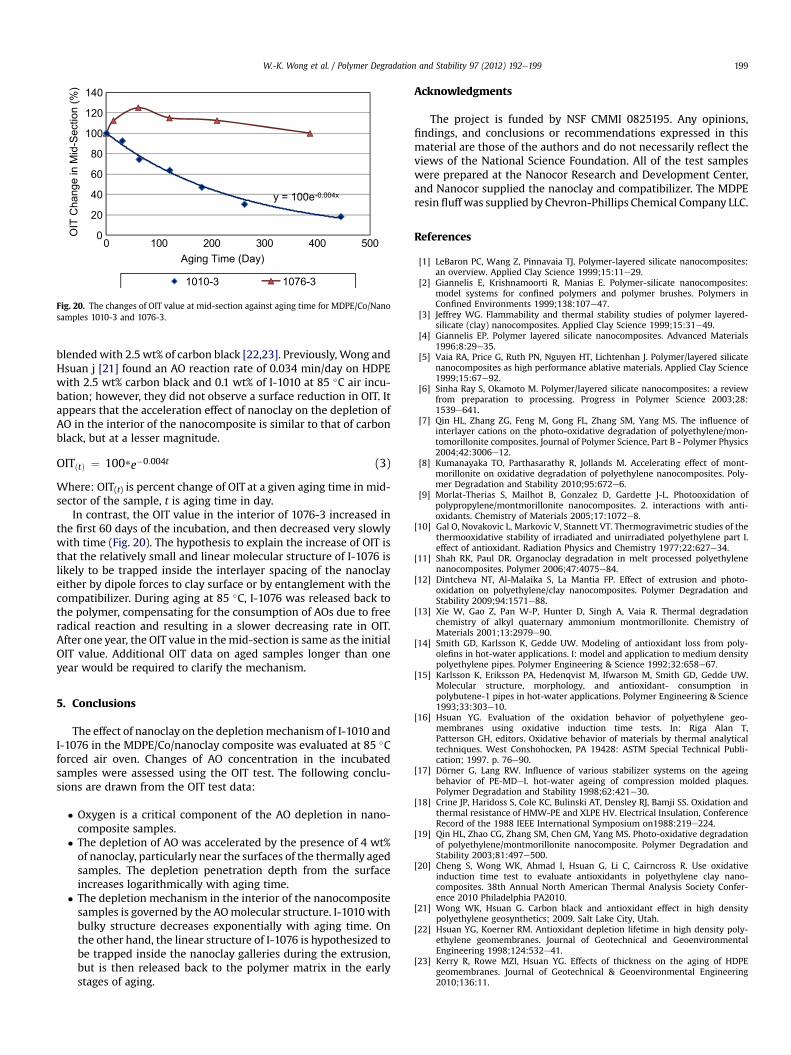
y = 100e-0.004x
0
20
40
60
80
100
120
140
0 100 200 300 400 500
OIT
Cha
nge
in M
id-S
ectio
n (%
)
Aging Time (Day)
1010-3 1076-3
Fig. 20. The changes of OIT value at mid-section against aging time for MDPE/Co/Nanosamples 1010-3 and 1076-3.
W.-K. Wong et al. / Polymer Degradation and Stability 97 (2012) 192e199 199
blendedwith 2.5 wt% of carbon black [22,23]. Previously, Wong andHsuan j [21] found an AO reaction rate of 0.034 min/day on HDPEwith 2.5 wt% carbon black and 0.1 wt% of I-1010 at 85 �C air incu-bation; however, they did not observe a surface reduction in OIT. Itappears that the acceleration effect of nanoclay on the depletion ofAO in the interior of the nanocomposite is similar to that of carbonblack, but at a lesser magnitude.
OITðtÞ ¼ 100*e�0:004t (3)
Where: OIT(t) is percent change of OIT at a given aging time in mid-sector of the sample, t is aging time in day.
In contrast, the OIT value in the interior of 1076-3 increased inthe first 60 days of the incubation, and then decreased very slowlywith time (Fig. 20). The hypothesis to explain the increase of OIT isthat the relatively small and linear molecular structure of I-1076 islikely to be trapped inside the interlayer spacing of the nanoclayeither by dipole forces to clay surface or by entanglement with thecompatibilizer. During aging at 85 �C, I-1076 was released back tothe polymer, compensating for the consumption of AOs due to freeradical reaction and resulting in a slower decreasing rate in OIT.After one year, the OIT value in themid-section is same as the initialOIT value. Additional OIT data on aged samples longer than oneyear would be required to clarify the mechanism.
5. Conclusions
The effect of nanoclay on the depletionmechanism of I-1010 andI-1076 in the MDPE/Co/nanoclay composite was evaluated at 85 �Cforced air oven. Changes of AO concentration in the incubatedsamples were assessed using the OIT test. The following conclu-sions are drawn from the OIT test data:
� Oxygen is a critical component of the AO depletion in nano-composite samples.
� The depletion of AO was accelerated by the presence of 4 wt%of nanoclay, particularly near the surfaces of the thermally agedsamples. The depletion penetration depth from the surfaceincreases logarithmically with aging time.
� The depletion mechanism in the interior of the nanocompositesamples is governed by the AOmolecular structure. I-1010 withbulky structure decreases exponentially with aging time. Onthe other hand, the linear structure of I-1076 is hypothesized tobe trapped inside the nanoclay galleries during the extrusion,but is then released back to the polymer matrix in the earlystages of aging.
Acknowledgments
The project is funded by NSF CMMI 0825195. Any opinions,findings, and conclusions or recommendations expressed in thismaterial are those of the authors and do not necessarily reflect theviews of the National Science Foundation. All of the test sampleswere prepared at the Nanocor Research and Development Center,and Nanocor supplied the nanoclay and compatibilizer. The MDPEresin fluff was supplied by Chevron-Phillips Chemical Company LLC.
References
[1] LeBaron PC, Wang Z, Pinnavaia TJ. Polymer-layered silicate nanocomposites:an overview. Applied Clay Science 1999;15:11e29.
[2] Giannelis E, Krishnamoorti R, Manias E. Polymer-silicate nanocomposites:model systems for confined polymers and polymer brushes. Polymers inConfined Environments 1999;138:107e47.
[3] Jeffrey WG. Flammability and thermal stability studies of polymer layered-silicate (clay) nanocomposites. Applied Clay Science 1999;15:31e49.
[4] Giannelis EP. Polymer layered silicate nanocomposites. Advanced Materials1996;8:29e35.
[5] Vaia RA, Price G, Ruth PN, Nguyen HT, Lichtenhan J. Polymer/layered silicatenanocomposites as high performance ablative materials. Applied Clay Science1999;15:67e92.
[6] Sinha Ray S, Okamoto M. Polymer/layered silicate nanocomposites: a reviewfrom preparation to processing. Progress in Polymer Science 2003;28:1539e641.
[7] Qin HL, Zhang ZG, Feng M, Gong FL, Zhang SM, Yang MS. The influence ofinterlayer cations on the photo-oxidative degradation of polyethylene/mon-tomorillonite composites. Journal of Polymer Science, Part B - Polymer Physics2004;42:3006e12.
[8] Kumanayaka TO, Parthasarathy R, Jollands M. Accelerating effect of mont-morillonite on oxidative degradation of polyethylene nanocomposites. Poly-mer Degradation and Stability 2010;95:672e6.
[9] Morlat-Therias S, Mailhot B, Gonzalez D, Gardette J-L. Photooxidation ofpolypropylene/montmorillonite nanocomposites. 2. interactions with anti-oxidants. Chemistry of Materials 2005;17:1072e8.
[10] Gal O, Novakovic L, Markovic V, Stannett VT. Thermogravimetric studies of thethermooxidative stability of irradiated and unirradiated polyethylene part I.effect of antioxidant. Radiation Physics and Chemistry 1977;22:627e34.
[11] Shah RK, Paul DR. Organoclay degradation in melt processed polyethylenenanocomposites. Polymer 2006;47:4075e84.
[12] Dintcheva NT, Al-Malaika S, La Mantia FP. Effect of extrusion and photo-oxidation on polyethylene/clay nanocomposites. Polymer Degradation andStability 2009;94:1571e88.
[13] Xie W, Gao Z, Pan W-P, Hunter D, Singh A, Vaia R. Thermal degradationchemistry of alkyl quaternary ammonium montmorillonite. Chemistry ofMaterials 2001;13:2979e90.
[14] Smith GD, Karlsson K, Gedde UW. Modeling of antioxidant loss from poly-olefins in hot-water applications. I: model and application to medium densitypolyethylene pipes. Polymer Engineering & Science 1992;32:658e67.
[15] Karlsson K, Eriksson PA, Hedenqvist M, Ifwarson M, Smith GD, Gedde UW.Molecular structure, morphology, and antioxidant- consumption inpolybutene-1 pipes in hot-water applications. Polymer Engineering & Science1993;33:303e10.
[16] Hsuan YG. Evaluation of the oxidation behavior of polyethylene geo-membranes using oxidative induction time tests. In: Riga Alan T,Patterson GH, editors. Oxidative behavior of materials by thermal analyticaltechniques. West Conshohocken, PA 19428: ASTM Special Technical Publi-cation; 1997. p. 76e90.
[17] Dörner G, Lang RW. Influence of various stabilizer systems on the ageingbehavior of PE-MDeI. hot-water ageing of compression molded plaques.Polymer Degradation and Stability 1998;62:421e30.
[18] Crine JP, Haridoss S, Cole KC, Bulinski AT, Densley RJ, Bamji SS. Oxidation andthermal resistance of HMW-PE and XLPE HV. Electrical Insulation, ConferenceRecord of the 1988 IEEE International Symposium on1988:219e224.
[19] Qin HL, Zhao CG, Zhang SM, Chen GM, Yang MS. Photo-oxidative degradationof polyethylene/montmorillonite nanocomposite. Polymer Degradation andStability 2003;81:497e500.
[20] Cheng S, Wong WK, Ahmad I, Hsuan G, Li C, Cairncross R. Use oxidativeinduction time test to evaluate antioxidants in polyethylene clay nano-composites. 38th Annual North American Thermal Analysis Society Confer-ence 2010 Philadelphia PA2010.
[21] Wong WK, Hsuan G. Carbon black and antioxidant effect in high densitypolyethylene geosynthetics; 2009. Salt Lake City, Utah.
[22] Hsuan YG, Koerner RM. Antioxidant depletion lifetime in high density poly-ethylene geomembranes. Journal of Geotechnical and GeoenvironmentalEngineering 1998;124:532e41.
[23] Kerry R, Rowe MZI, Hsuan YG. Effects of thickness on the aging of HDPEgeomembranes. Journal of Geotechnical & Geoenvironmental Engineering2010;136:11.