Embed Size (px)
Citation preview
PHYSICAL REVIEW E 83, 066402 (2011)
Polygon construction to investigate melting in two-dimensional strongly coupled dusty plasma
W. D. Suranga Ruhunusiri,* J. Goree, Yan Feng, and Bin LiuDepartment of Physics and Astronomy, The University of Iowa, Iowa City, Iowa 52242, USA
(Received 27 January 2011; revised manuscript received 15 April 2011; published 3 June 2011)
The polygon construction method of Glaser and Clark is used to characterize melting and crystallization in atwo-dimensional (2D) strongly coupled dusty plasma. Using particle positions measured by video microscopy,bonds are identified by triangulation, and unusually long bonds are deleted. The resulting polygons have three ormore sides. Geometrical defects, which are polygons with more than three sides, are found to proliferate duringmelting. Pentagons are found in liquids, where they tend to cluster with other pentagons. Quadrilaterals are aless severe defect, so that disorder can be characterized by the ratio of quadrilaterals to pentagons. This ratio isfound to be less in a liquid than in a solid or a superheated solid. Another measure of disorder is the abundance ofdifferent kinds of vertices, according to the type of polygons that adjoin there. Unexpectedly, spikes are observedin the abundance of certain vertex types during rapid temperature changes. Hysteresis, revealed by a plot of adisorder parameter vs temperature, is examined to study sudden heating. The hysteresis diagram also revealsfeatures suggesting a possibility of latent heat in the melting and rapid cooling processes.
DOI: 10.1103/PhysRevE.83.066402 PACS number(s): 52.27.Lw, 64.60.A−, 64.60.Cn, 61.20.−p
I. INTRODUCTION
Dusty plasma consists of microparticles immersed inplasma [1–3]. In laboratory experiments the microparticlesare often made of a dielectric material such as a polymer, andthey can range in size from nanometers to micrometers. Thesemicroparticles collect electron and ion currents and becomecharged. In laboratory dusty plasma, the charge is usuallynegative and quite large, typically thousands of electroniccharges for micrometer-size particles. Dusty plasma like thisis sometimes termed complex plasma.
Due to the large charge, microparticles interacting amongthemselves can have potential energies larger than their kineticenergies; when this happens the microparticles comprise astrongly coupled plasma. In general, unlike more commonweakly coupled plasmas, strongly coupled plasmas can exhibitthe properties of liquids or solids [4] because the particles arehighly collisional with their nearest neighbors. When theseCoulomb interactions are so dominant that a particle is trappedby its nearest neighbors, the strongly coupled plasma actslike a solid called a Wigner crystal. The melting transitionbetween solid-like and liquid-like phases of strongly coupledplasmas has been studied for many years. Many of the earliestmelting theories and simulations were carried out assuming a1/r potential, that is, the one-component plasma (OCP) model[5–10]. Experiments appeared later, when apparatus to cooland confine pure-ion plasmas was developed [11,12]. Later,simulations of melting in plasma were carried out assuming aYukawa (Debye-Huckel) potential [13–17].
In the field of condensed matter physics, melting is oftenstudied using model systems, which usually allow directobservation of the positions and motions of the constituentparticles. A colloidal suspension is an example of a modelsystem that allows imaging of the positions of particles, whichis ideal for an experimental study of melting at an atomisticscale [18,19]. Dusty plasma can serve as another model system,and it allows imaging of particles and their motion with video
microscopy [20–22]. Dusty plasma also allows manipulationof microparticles, for example, by applying radiation pressureforces from laser beams to increase the kinetic temperature ofmicroparticles [23,24].
One approach to study melting theoretically and experimen-tally is with two-dimensional (2D) systems. Melting experi-ments have been reported with many 2D or quasi-2D physicalsystems, including colloidal suspensions [25–27], electronson liquid helium surface [28], liquid crystal films [29],vibrated granular monolayers [30], magnetic bubble arrays[31], ferrofluid spikes [32], vortex lattices in superconductors[33], and gases adsorbed on graphite surfaces [34]. Two-dimensional melting experiments have also been performed industy plasmas with a single layer of microparticles suspendedin a glow discharge plasma [23,35–39]. Quasi-2D meltingexperiments have also been performed in dusty plasmas, withmultiple layers [40–44].
Two-dimensional melting is often described as beingmediated by defects. Defects play a central role in severaltheories and descriptions of 2D melting [45–51]. Identifyingdefects in 2D simulations, and in 2D experiments that allowdirect imaging, is commonly done using Voronoi analysis [52].
Here we will use polygon construction, an alternative toVoronoi analysis developed by Glaser and Clark [49,50],to analyze melting in a 2D strongly coupled dusty plasmaexperiment. Beyond comparing the 2D structure in solidand liquid states, we will also explore the development ofstructure during rapid heating. The experiment we analyze waspreviously reported, along with Voronoi analysis [53]. Therapid heating that was employed in this experiment yieldeda short-lived superheated solid, that is, a structure with fewdefects as in a solid but a temperature above the meltingpoint. Here we will further investigate the superheated solid,exploiting the sensitivity of polygon construction.
We provide our source code for polygon constructionin the supplementary material [54]. Our intention is toencourage readers to use it for other experiments orsimulations. We have validated this code by testing it usinga simulation with the same WCA potential as in [50] to verify
066402-11539-3755/2011/83(6)/066402(10) ©2011 American Physical Society
RUHUNUSIRI, GOREE, FENG, AND LIU PHYSICAL REVIEW E 83, 066402 (2011)
that we obtain the same results (within statistical uncertainty)for the abundance of various polygons. We carried out thesetests using the same temperature and density parameters asin [50].
In Sec. II we review the motivation and method forpolygon construction, and compare it to Voronoi analysis. Theexperiment and data analysis procedure are summarized inSec. III. In Sec. IV we present and interpret our results.
II. DEFECT IDENTIFICATION
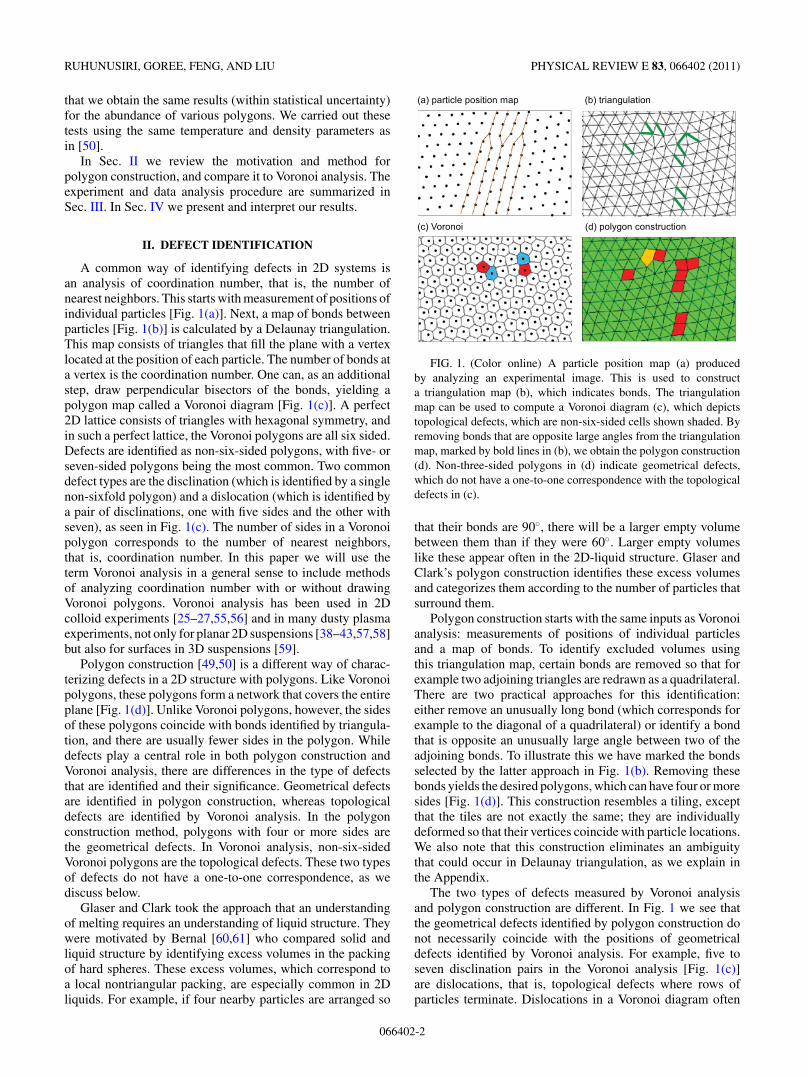
A common way of identifying defects in 2D systems isan analysis of coordination number, that is, the number ofnearest neighbors. This starts with measurement of positions ofindividual particles [Fig. 1(a)]. Next, a map of bonds betweenparticles [Fig. 1(b)] is calculated by a Delaunay triangulation.This map consists of triangles that fill the plane with a vertexlocated at the position of each particle. The number of bonds ata vertex is the coordination number. One can, as an additionalstep, draw perpendicular bisectors of the bonds, yielding apolygon map called a Voronoi diagram [Fig. 1(c)]. A perfect2D lattice consists of triangles with hexagonal symmetry, andin such a perfect lattice, the Voronoi polygons are all six sided.Defects are identified as non-six-sided polygons, with five- orseven-sided polygons being the most common. Two commondefect types are the disclination (which is identified by a singlenon-sixfold polygon) and a dislocation (which is identified bya pair of disclinations, one with five sides and the other withseven), as seen in Fig. 1(c). The number of sides in a Voronoipolygon corresponds to the number of nearest neighbors,that is, coordination number. In this paper we will use theterm Voronoi analysis in a general sense to include methodsof analyzing coordination number with or without drawingVoronoi polygons. Voronoi analysis has been used in 2Dcolloid experiments [25–27,55,56] and in many dusty plasmaexperiments, not only for planar 2D suspensions [38–43,57,58]but also for surfaces in 3D suspensions [59].
Polygon construction [49,50] is a different way of charac-terizing defects in a 2D structure with polygons. Like Voronoipolygons, these polygons form a network that covers the entireplane [Fig. 1(d)]. Unlike Voronoi polygons, however, the sidesof these polygons coincide with bonds identified by triangula-tion, and there are usually fewer sides in the polygon. Whiledefects play a central role in both polygon construction andVoronoi analysis, there are differences in the type of defectsthat are identified and their significance. Geometrical defectsare identified in polygon construction, whereas topologicaldefects are identified by Voronoi analysis. In the polygonconstruction method, polygons with four or more sides arethe geometrical defects. In Voronoi analysis, non-six-sidedVoronoi polygons are the topological defects. These two typesof defects do not have a one-to-one correspondence, as wediscuss below.
Glaser and Clark took the approach that an understandingof melting requires an understanding of liquid structure. Theywere motivated by Bernal [60,61] who compared solid andliquid structure by identifying excess volumes in the packingof hard spheres. These excess volumes, which correspond toa local nontriangular packing, are especially common in 2Dliquids. For example, if four nearby particles are arranged so
FIG. 1. (Color online) A particle position map (a) producedby analyzing an experimental image. This is used to constructa triangulation map (b), which indicates bonds. The triangulationmap can be used to compute a Voronoi diagram (c), which depictstopological defects, which are non-six-sided cells shown shaded. Byremoving bonds that are opposite large angles from the triangulationmap, marked by bold lines in (b), we obtain the polygon construction(d). Non-three-sided polygons in (d) indicate geometrical defects,which do not have a one-to-one correspondence with the topologicaldefects in (c).
that their bonds are 90◦, there will be a larger empty volumebetween them than if they were 60◦. Larger empty volumeslike these appear often in the 2D-liquid structure. Glaser andClark’s polygon construction identifies these excess volumesand categorizes them according to the number of particles thatsurround them.
Polygon construction starts with the same inputs as Voronoianalysis: measurements of positions of individual particlesand a map of bonds. To identify excluded volumes usingthis triangulation map, certain bonds are removed so that forexample two adjoining triangles are redrawn as a quadrilateral.There are two practical approaches for this identification:either remove an unusually long bond (which corresponds forexample to the diagonal of a quadrilateral) or identify a bondthat is opposite an unusually large angle between two of theadjoining bonds. To illustrate this we have marked the bondsselected by the latter approach in Fig. 1(b). Removing thesebonds yields the desired polygons, which can have four or moresides [Fig. 1(d)]. This construction resembles a tiling, exceptthat the tiles are not exactly the same; they are individuallydeformed so that their vertices coincide with particle locations.We also note that this construction eliminates an ambiguitythat could occur in Delaunay triangulation, as we explain inthe Appendix.
The two types of defects measured by Voronoi analysisand polygon construction are different. In Fig. 1 we see thatthe geometrical defects identified by polygon construction donot necessarily coincide with the positions of geometricaldefects identified by Voronoi analysis. For example, five toseven disclination pairs in the Voronoi analysis [Fig. 1(c)]are dislocations, that is, topological defects where rows ofparticles terminate. Dislocations in a Voronoi diagram often
066402-2
POLYGON CONSTRUCTION TO INVESTIGATE MELTING . . . PHYSICAL REVIEW E 83, 066402 (2011)
appear near clusters of quadrilaterals or pentagons in a polygonconstruction, but there is no unique one-to-one relationshipbetween the topological and geometrical defects. Moreover,in polygon construction, quadrilaterals can appear where thereis some small distortion of the lattice far away from anytopological defects, as seen at the bottom of Fig. 1(d), and theabundance of these quadrilaterals depends on the thresholdschosen for removing bonds.
The polygon construction method has the advantage ofproviding a gradation in the severity of geometrical defects.Quadrilaterals are the least severe, while pentagons, hexagons,etc. are progressively more severe. In contrast, defect identi-fication using Voronoi analysis is usually a binary measurewhen used in dusty plasma experiments, that is, at the locationof a particle, there is either a topological defect, or there isnot [42,53]. The gradation of defects in polygon constructionallows a greater sensitivity in identifying and classifyingdisorder.
Although the polygon construction method has someadvantages when compared to Voronoi analysis, its use hasnot yet become common. We find only two previous reports ofits use in the literature. It was introduced with 2D simulations[49,50], and it was later used in an experiment with Cs atoms,which were adsorbed on a Si-Ag surface, and imaged byscanning tunneling microscopy [62].
III. EXPERIMENT AND ANALYSIS
The dusty plasma experiment that we analyze was firstreported in [53], where it was analyzed by the Voronoimethod. We briefly summarize the experimental conditionsand procedures here; further details are provided in [53], andthe apparatus is described in [24]. The dusty plasma is afour-component mixture of neutral gas, positive argon ions,electrons, and electrically charged microparticles. Argon gasat 7 mTorr was partially ionized by applying a low powerrf voltage at 13.56 MHz with a 97 V peak-to-peak ampli-tude. Monodisperse melamine formaldehyde microparticles ofdiameter 4.83 μm were introduced into the plasma. Themutual repulsion of these microparticles in the experiment canbe modeled by a Yukawa potential [63], with −4360e for theelectrical charge and 0.65 mm for the screening length. Themicroparticles were levitated in an electric sheath above thelower electrode. By limiting the number of microparticlesinserted into the plasma, a suspension was prepared with only asingle layer and a lattice constant b = 0.86 mm. In the absenceof manipulation, the microparticles self-organized in a solidtriangular lattice with sixfold symmetry.
Particle motion was tracked using video microscopy. Adigital camera operated at 55 frames/s imaged a 34.2 ×25.6 mm2 region that contained about 1000 microparticles.The particle positions, which are the starting point for ourpolygon construction, were measured using an image analysisprocedure [64] for each particle in each video frame.
The experimenters controlled the kinetic temperature,which describes the kinetic energy of random motion of themicroparticles. This kinetic temperature is not a thermody-namic temperature because the surrounding gas and plasmahad different temperatures. The polymer material inside themicroparticles probably had yet another temperature that was
never hot enough to melt them. The melting that we study inthis paper is not for the polymer material itself, but rather forthe spatial configuration of microparticles that are suspendedin space.
The kinetic temperature was increased suddenly to causemelting by abruptly applying laser manipulation. This lasermanipulation, which applied nearly random kicks to micropar-ticles [24], was sustained for 55 s. Afterwards, laser heatingwas abruptly turned off to allow a cooling due to gas friction.The resulting time series for kinetic temperature is shownin Fig. 2(a). In general, a melting point could be identifiedseveral ways. We choose to use the phase diagram of Hartmannet al. [17]. They identified the melting point by noting a sharpdecay of the bond-angular order parameter as temperature wasvaried slowly in their 2D Yukawa simulation.
In polygon construction it is necessary to define a somewhatarbitrary threshold when identifying unusually long bonds orunusually large angles for bond removal. For bond length,the threshold should be between b and
√2b (where b is the
lattice constant for a perfect triangular lattice) in order toidentify quadrilateral arrangements. For bond angles, thethreshold should be between 60◦ and 90◦, again to allowidentifying quadrilateral arrangements. Here we use the bond-angle approach, with the same 75◦ threshold as in [49,50].
We use this polygon construction three ways. First, todetermine how defects proliferate and cluster as meltingprogresses, we inspect maps visually. Second, to characterizedisorder during the formation of a superheated solid andsubsequent melting, we count types of polygons, for example,triangles and quadrilaterals. Third, to quantify our observationsof how defects tend to cluster, we will classify each vertexaccording to the sequence of polygons around the vertex.
IV. RESULTS AND CONCLUSIONS
A. Comparing the structures of liquid and solid
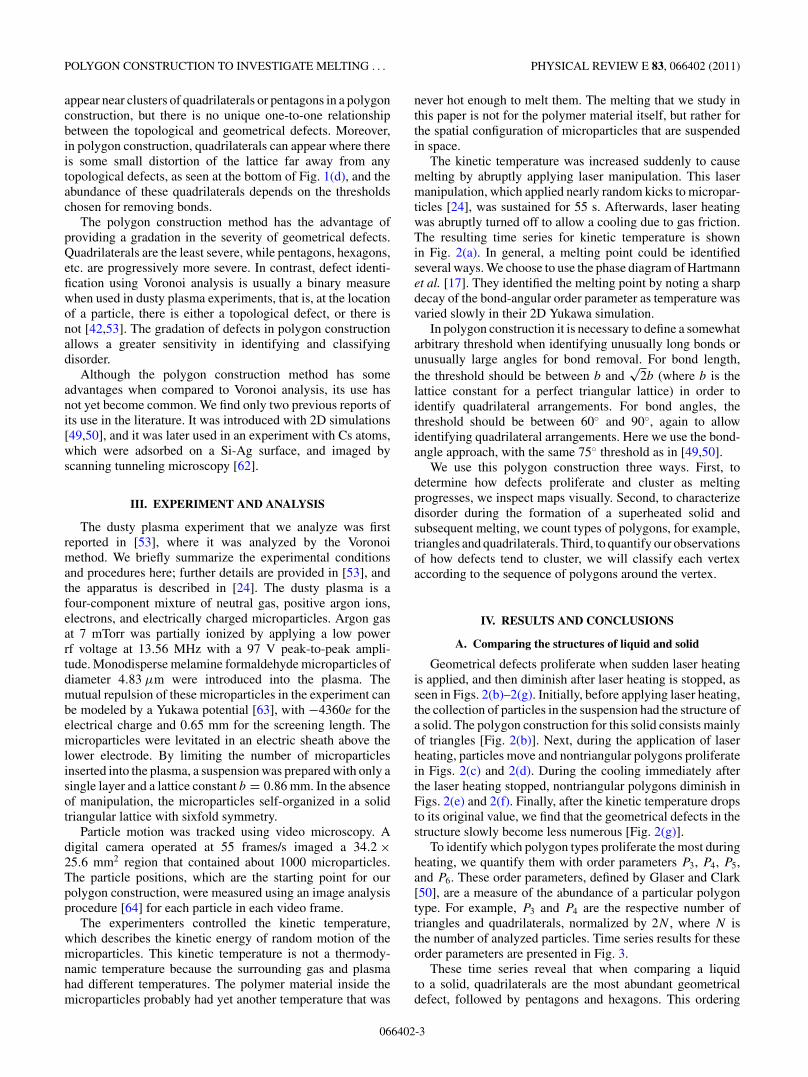
Geometrical defects proliferate when sudden laser heatingis applied, and then diminish after laser heating is stopped, asseen in Figs. 2(b)–2(g). Initially, before applying laser heating,the collection of particles in the suspension had the structure ofa solid. The polygon construction for this solid consists mainlyof triangles [Fig. 2(b)]. Next, during the application of laserheating, particles move and nontriangular polygons proliferatein Figs. 2(c) and 2(d). During the cooling immediately afterthe laser heating stopped, nontriangular polygons diminish inFigs. 2(e) and 2(f). Finally, after the kinetic temperature dropsto its original value, we find that the geometrical defects in thestructure slowly become less numerous [Fig. 2(g)].
To identify which polygon types proliferate the most duringheating, we quantify them with order parameters P3, P4, P5,and P6. These order parameters, defined by Glaser and Clark[50], are a measure of the abundance of a particular polygontype. For example, P3 and P4 are the respective number oftriangles and quadrilaterals, normalized by 2N , where N isthe number of analyzed particles. Time series results for theseorder parameters are presented in Fig. 3.
These time series reveal that when comparing a liquidto a solid, quadrilaterals are the most abundant geometricaldefect, followed by pentagons and hexagons. This ordering
066402-3
RUHUNUSIRI, GOREE, FENG, AND LIU PHYSICAL REVIEW E 83, 066402 (2011)
FIG. 2. (Color online) Results from an analysis of the sudden-heating experiment of [53]. Starting with a low-temperature solidstructure, laser heating was suddenly applied and then later turnedoff. (a) Time series of microparticle kinetic temperature reportedin [53]. Times marked b–g correspond to the panels below. (b)–(g)Polygon construction: triangles are non-defects, while quadrilaterals,pentagons, hexagons, etc. are geometrical defects. Starting with asolid (b), after laser heating was turned on a proliferation of geo-metrical defects is seen during melting, (c) and (d). Diminishment ofgeometrical defects is seen during cooling, (e)–(g), as crystallizationgradually progresses.
0
0.2
0.4
0.6
0.8
1
0 20 40 60 80 100
solid liquid
normalizedkinetic temperature
P3
P4
P5 P6
erutarepmet
citenikdezila
mrondna
retema rap
re dro
time (s)
FIG. 3. (Color online) Time series for order parameters P3 toP6 and the kinetic temperature (normalized by its maximum). Theabundance of geometrical defects, as indicated by P4 to P6, is greaterin a liquid than in the initial solid. Quadrilaterals, indicated by P4, arethe most frequent geometrical defect (in both a liquid and a solid),while pentagons and hexagons are the next most frequent.
is as expected, since quadrilaterals are the least severe typeof geometrical defect. A similar ordering was observed inWCA simulations [49,50]. Later, we will characterize the ratioP4/P5, which reveals the relative abundance of these two kindsof geometrical defects.
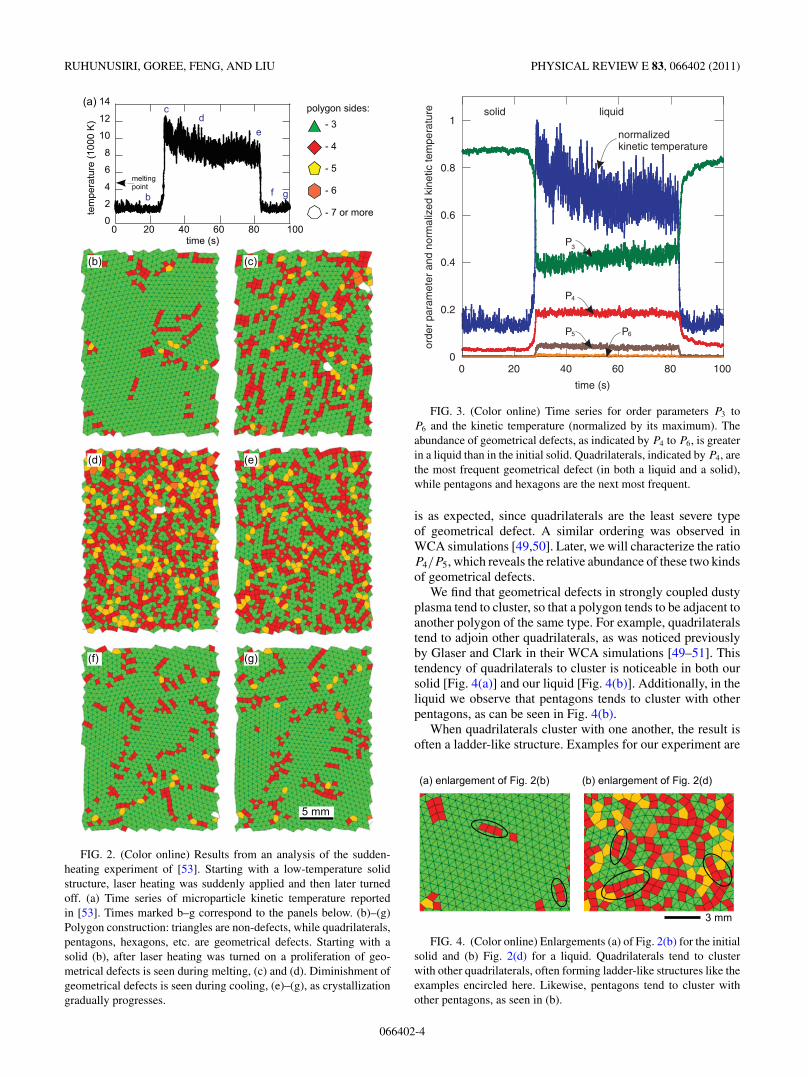
We find that geometrical defects in strongly coupled dustyplasma tend to cluster, so that a polygon tends to be adjacent toanother polygon of the same type. For example, quadrilateralstend to adjoin other quadrilaterals, as was noticed previouslyby Glaser and Clark in their WCA simulations [49–51]. Thistendency of quadrilaterals to cluster is noticeable in both oursolid [Fig. 4(a)] and our liquid [Fig. 4(b)]. Additionally, in theliquid we observe that pentagons tends to cluster with otherpentagons, as can be seen in Fig. 4(b).
When quadrilaterals cluster with one another, the result isoften a ladder-like structure. Examples for our experiment are
FIG. 4. (Color online) Enlargements (a) of Fig. 2(b) for the initialsolid and (b) Fig. 2(d) for a liquid. Quadrilaterals tend to clusterwith other quadrilaterals, often forming ladder-like structures like theexamples encircled here. Likewise, pentagons tend to cluster withother pentagons, as seen in (b).
066402-4
POLYGON CONSTRUCTION TO INVESTIGATE MELTING . . . PHYSICAL REVIEW E 83, 066402 (2011)
Vertextype
A
Vertextype Diagram
B
C
D
Diagram
E
F
G
Vertextype Diagram
H
I
J
Vertextype Diagram
K
L
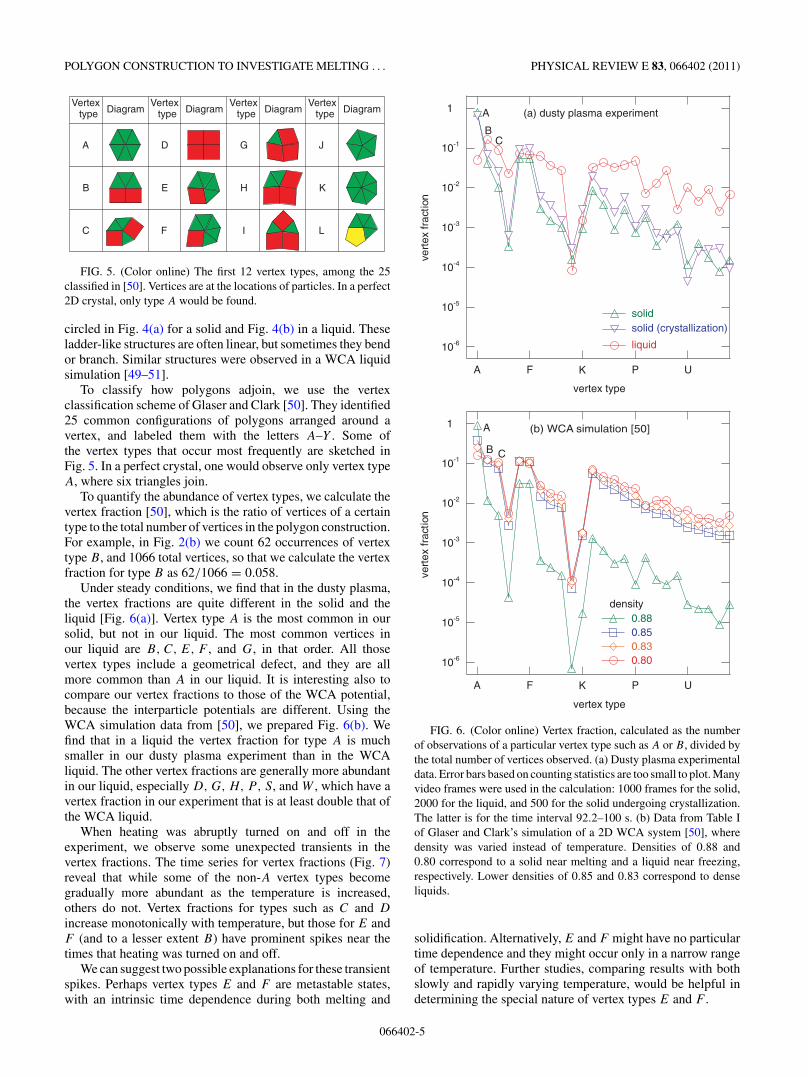
FIG. 5. (Color online) The first 12 vertex types, among the 25classified in [50]. Vertices are at the locations of particles. In a perfect2D crystal, only type A would be found.
circled in Fig. 4(a) for a solid and Fig. 4(b) in a liquid. Theseladder-like structures are often linear, but sometimes they bendor branch. Similar structures were observed in a WCA liquidsimulation [49–51].
To classify how polygons adjoin, we use the vertexclassification scheme of Glaser and Clark [50]. They identified25 common configurations of polygons arranged around avertex, and labeled them with the letters A–Y . Some ofthe vertex types that occur most frequently are sketched inFig. 5. In a perfect crystal, one would observe only vertex typeA, where six triangles join.
To quantify the abundance of vertex types, we calculate thevertex fraction [50], which is the ratio of vertices of a certaintype to the total number of vertices in the polygon construction.For example, in Fig. 2(b) we count 62 occurrences of vertextype B, and 1066 total vertices, so that we calculate the vertexfraction for type B as 62/1066 = 0.058.
Under steady conditions, we find that in the dusty plasma,the vertex fractions are quite different in the solid and theliquid [Fig. 6(a)]. Vertex type A is the most common in oursolid, but not in our liquid. The most common vertices inour liquid are B, C, E, F , and G, in that order. All thosevertex types include a geometrical defect, and they are allmore common than A in our liquid. It is interesting also tocompare our vertex fractions to those of the WCA potential,because the interparticle potentials are different. Using theWCA simulation data from [50], we prepared Fig. 6(b). Wefind that in a liquid the vertex fraction for type A is muchsmaller in our dusty plasma experiment than in the WCAliquid. The other vertex fractions are generally more abundantin our liquid, especially D, G, H, P, S, and W , which have avertex fraction in our experiment that is at least double that ofthe WCA liquid.
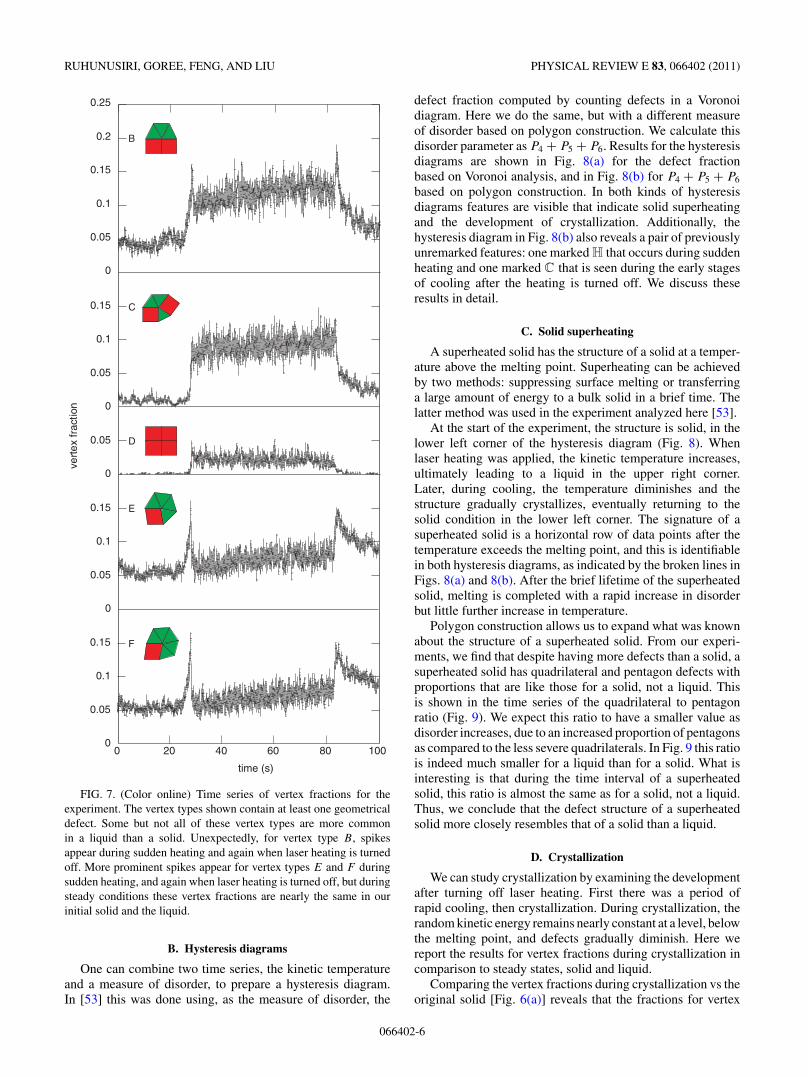
When heating was abruptly turned on and off in theexperiment, we observe some unexpected transients in thevertex fractions. The time series for vertex fractions (Fig. 7)reveal that while some of the non-A vertex types becomegradually more abundant as the temperature is increased,others do not. Vertex fractions for types such as C and D
increase monotonically with temperature, but those for E andF (and to a lesser extent B) have prominent spikes near thetimes that heating was turned on and off.
We can suggest two possible explanations for these transientspikes. Perhaps vertex types E and F are metastable states,with an intrinsic time dependence during both melting and
10-6
10-5
10-4
10-3
10-2
10-1
1ve
rtex
frac
tion
vertex type
0.880.850.830.80
density
A
CB
(b) WCA simulation [50]
A F K P U
10-6
10-5
10-4
10-3
10-2
10-1
1
vert
exfr
actio
n
vertex type
liquid
solidsolid (crystallization)
A
CB
(a) dusty plasma experiment
A F K P U
FIG. 6. (Color online) Vertex fraction, calculated as the numberof observations of a particular vertex type such as A or B, divided bythe total number of vertices observed. (a) Dusty plasma experimentaldata. Error bars based on counting statistics are too small to plot. Manyvideo frames were used in the calculation: 1000 frames for the solid,2000 for the liquid, and 500 for the solid undergoing crystallization.The latter is for the time interval 92.2–100 s. (b) Data from Table Iof Glaser and Clark’s simulation of a 2D WCA system [50], wheredensity was varied instead of temperature. Densities of 0.88 and0.80 correspond to a solid near melting and a liquid near freezing,respectively. Lower densities of 0.85 and 0.83 correspond to denseliquids.
solidification. Alternatively, E and F might have no particulartime dependence and they might occur only in a narrow rangeof temperature. Further studies, comparing results with bothslowly and rapidly varying temperature, would be helpful indetermining the special nature of vertex types E and F .
066402-5
RUHUNUSIRI, GOREE, FENG, AND LIU PHYSICAL REVIEW E 83, 066402 (2011)ve
rtex
frac
tion
0
0.05
0.1
0.15
0.2
0.25
0
0.05
0.1
0.15
0
0.05
0
0.05
0.1
0.15
0
0.05
0.1
0.15
0 20 40 60 80 100
time (s)
B
C
D
E
F
FIG. 7. (Color online) Time series of vertex fractions for theexperiment. The vertex types shown contain at least one geometricaldefect. Some but not all of these vertex types are more commonin a liquid than a solid. Unexpectedly, for vertex type B, spikesappear during sudden heating and again when laser heating is turnedoff. More prominent spikes appear for vertex types E and F duringsudden heating, and again when laser heating is turned off, but duringsteady conditions these vertex fractions are nearly the same in ourinitial solid and the liquid.
B. Hysteresis diagrams
One can combine two time series, the kinetic temperatureand a measure of disorder, to prepare a hysteresis diagram.In [53] this was done using, as the measure of disorder, the
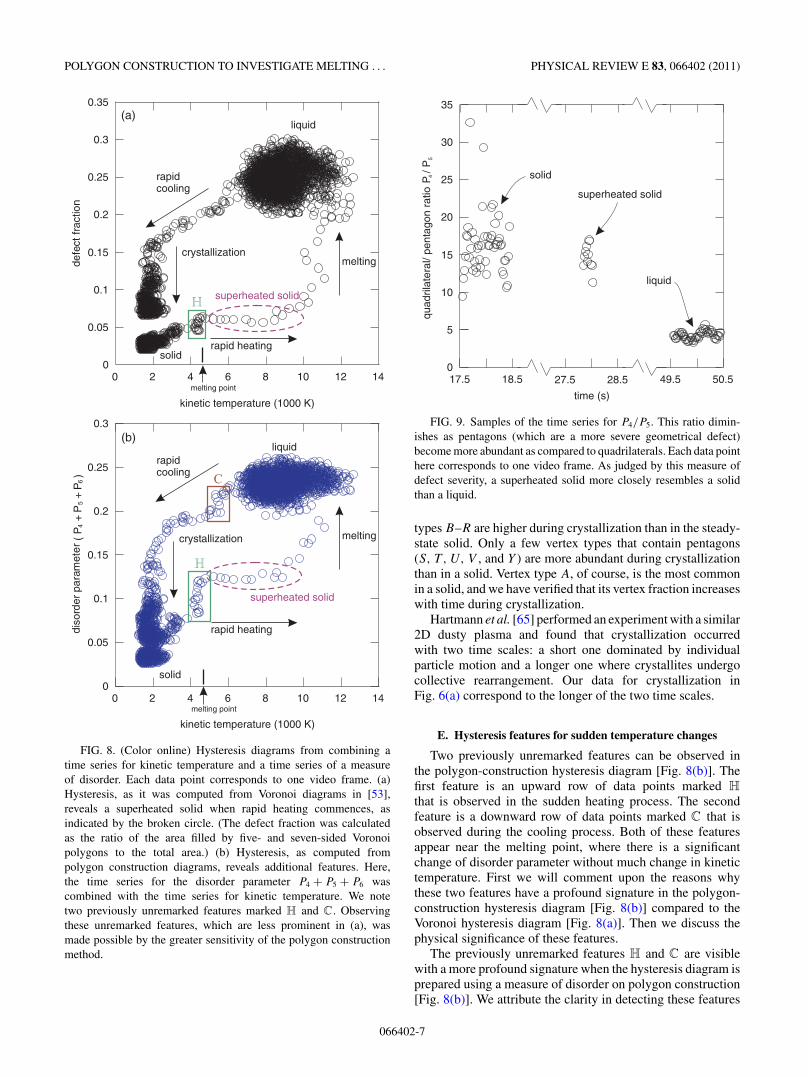
defect fraction computed by counting defects in a Voronoidiagram. Here we do the same, but with a different measureof disorder based on polygon construction. We calculate thisdisorder parameter as P4 + P5 + P6. Results for the hysteresisdiagrams are shown in Fig. 8(a) for the defect fractionbased on Voronoi analysis, and in Fig. 8(b) for P4 + P5 + P6
based on polygon construction. In both kinds of hysteresisdiagrams features are visible that indicate solid superheatingand the development of crystallization. Additionally, thehysteresis diagram in Fig. 8(b) also reveals a pair of previouslyunremarked features: one marked H that occurs during suddenheating and one marked C that is seen during the early stagesof cooling after the heating is turned off. We discuss theseresults in detail.
C. Solid superheating
A superheated solid has the structure of a solid at a temper-ature above the melting point. Superheating can be achievedby two methods: suppressing surface melting or transferringa large amount of energy to a bulk solid in a brief time. Thelatter method was used in the experiment analyzed here [53].
At the start of the experiment, the structure is solid, in thelower left corner of the hysteresis diagram (Fig. 8). Whenlaser heating was applied, the kinetic temperature increases,ultimately leading to a liquid in the upper right corner.Later, during cooling, the temperature diminishes and thestructure gradually crystallizes, eventually returning to thesolid condition in the lower left corner. The signature of asuperheated solid is a horizontal row of data points after thetemperature exceeds the melting point, and this is identifiablein both hysteresis diagrams, as indicated by the broken lines inFigs. 8(a) and 8(b). After the brief lifetime of the superheatedsolid, melting is completed with a rapid increase in disorderbut little further increase in temperature.
Polygon construction allows us to expand what was knownabout the structure of a superheated solid. From our experi-ments, we find that despite having more defects than a solid, asuperheated solid has quadrilateral and pentagon defects withproportions that are like those for a solid, not a liquid. Thisis shown in the time series of the quadrilateral to pentagonratio (Fig. 9). We expect this ratio to have a smaller value asdisorder increases, due to an increased proportion of pentagonsas compared to the less severe quadrilaterals. In Fig. 9 this ratiois indeed much smaller for a liquid than for a solid. What isinteresting is that during the time interval of a superheatedsolid, this ratio is almost the same as for a solid, not a liquid.Thus, we conclude that the defect structure of a superheatedsolid more closely resembles that of a solid than a liquid.
D. Crystallization
We can study crystallization by examining the developmentafter turning off laser heating. First there was a period ofrapid cooling, then crystallization. During crystallization, therandom kinetic energy remains nearly constant at a level, belowthe melting point, and defects gradually diminish. Here wereport the results for vertex fractions during crystallization incomparison to steady states, solid and liquid.
Comparing the vertex fractions during crystallization vs theoriginal solid [Fig. 6(a)] reveals that the fractions for vertex
066402-6
POLYGON CONSTRUCTION TO INVESTIGATE MELTING . . . PHYSICAL REVIEW E 83, 066402 (2011)
0
0.05
0.1
0.15
0.2
0.25
0.3
0.35
0 2 4 6 8 10 12 14
defe
ctfr
actio
n
(a)
rapid heating
superheated solid
melting
liquid
rapidcooling
crystallization
melting point
solid
H
kinetic temperature (1000 K)
kinetic temperature (1000 K)
0
0.05
0.1
0.15
0.2
0.25
0.3
0 2 4 6 8 10 12 14
diso
rder
para
met
er
(b)
melting
rapid heating
superheated solid
liquidrapidcooling
crystallization
P(
4P
+5
P+
6)
solid
C
H
melting point
FIG. 8. (Color online) Hysteresis diagrams from combining atime series for kinetic temperature and a time series of a measureof disorder. Each data point corresponds to one video frame. (a)Hysteresis, as it was computed from Voronoi diagrams in [53],reveals a superheated solid when rapid heating commences, asindicated by the broken circle. (The defect fraction was calculatedas the ratio of the area filled by five- and seven-sided Voronoipolygons to the total area.) (b) Hysteresis, as computed frompolygon construction diagrams, reveals additional features. Here,the time series for the disorder parameter P4 + P5 + P6 wascombined with the time series for kinetic temperature. We notetwo previously unremarked features marked H and C. Observingthese unremarked features, which are less prominent in (a), wasmade possible by the greater sensitivity of the polygon constructionmethod.
0
5
10
15
20
25
30
35
17.5 18.5
time (s)
27.5 28.5 49.5 50.5
solid
liquid
superheated solid
tnep/laretalirdauqP
oitarnoga
P/5
4FIG. 9. Samples of the time series for P4/P5. This ratio dimin-
ishes as pentagons (which are a more severe geometrical defect)become more abundant as compared to quadrilaterals. Each data pointhere corresponds to one video frame. As judged by this measure ofdefect severity, a superheated solid more closely resembles a solidthan a liquid.
types B–R are higher during crystallization than in the steady-state solid. Only a few vertex types that contain pentagons(S, T , U, V , and Y ) are more abundant during crystallizationthan in a solid. Vertex type A, of course, is the most commonin a solid, and we have verified that its vertex fraction increaseswith time during crystallization.
Hartmann et al. [65] performed an experiment with a similar2D dusty plasma and found that crystallization occurredwith two time scales: a short one dominated by individualparticle motion and a longer one where crystallites undergocollective rearrangement. Our data for crystallization inFig. 6(a) correspond to the longer of the two time scales.
E. Hysteresis features for sudden temperature changes
Two previously unremarked features can be observed inthe polygon-construction hysteresis diagram [Fig. 8(b)]. Thefirst feature is an upward row of data points marked Hthat is observed in the sudden heating process. The secondfeature is a downward row of data points marked C that isobserved during the cooling process. Both of these featuresappear near the melting point, where there is a significantchange of disorder parameter without much change in kinetictemperature. First we will comment upon the reasons whythese two features have a profound signature in the polygon-construction hysteresis diagram [Fig. 8(b)] compared to theVoronoi hysteresis diagram [Fig. 8(a)]. Then we discuss thephysical significance of these features.
The previously unremarked features H and C are visiblewith a more profound signature when the hysteresis diagram isprepared using a measure of disorder on polygon construction[Fig. 8(b)]. We attribute the clarity in detecting these features
066402-7
RUHUNUSIRI, GOREE, FENG, AND LIU PHYSICAL REVIEW E 83, 066402 (2011)
to the sensitivity of the polygon construction method due tothe gradations of geometrical defects as compared to the morebinary measure of the presence of topological defect.
Feature H in the sudden heating process suggests that(at least in this experiment) sudden melting is a three-stepprocess. First, when the temperature has reached the meltingpoint in the experiment, there is a marked increase in disorderwithout any temperature increase, as indicated by the verticalrow of data points enclosed by a box. Second, there is asuperheated solid, revealed by a horizontal row of data points.Third, the superheated solid melts with little further increasein temperature, and this appears as another vertical row of datapoints.
Both features H and C appear as vertical rows of datapoints in Fig. 8(b), suggesting that the underlying physicalprocess may involve a latent heat, which would be an indicationof a first-order melting transition. In general, the latent heatin a first-order transition corresponds to a change in internalpotential energy, that is, the potential energy for interparticleinteractions, without a change in temperature. Our disorderparameter serves as an indirect indication of a change in thepotential energy landscape. To make a definitive conclusion ofwhether these features indicate a first-order transition wouldrequire measurements of other thermodynamic quantities suchas the internal potential energy of the system.
Perhaps one reason that feature H has not been previouslyremarked upon is that earlier solid-superheating experimentsdid not allow the preparation of a hysteresis diagram likeFig. 8(b). This diagram requires data for both structure andkinetic temperature. Previous solid-superheating experimentsrelied on diagnostics, for example electron diffraction, thatindicate structure but provide no time-resolved data for kinetictemperature. Thus, at present it is not known whether featureH is common to physical systems other than dusty plasmas.
One might ask whether feature H in the sudden heatingprocess is related to the formation of the metastable states,vertex types E and F that we detected in the time seriesfor vertex fractions (Fig. 7). Feature H occurs from 27.5 to27.8 s, whereas the spikes for vertex types E and F in Fig. 7are observed later during sudden heating at 27.95 and 28.04 s,respectively. This suggests that feature H is not related to theformation of metastable states.
We have not yet identified any special features in thestructure while feature C occurs, during cooling. Certainly theabundances of the different polygons changes during featureC, as indicated by the value of P4 + P5 + P6 in Fig. 8(b).However, we determine by a qualitative inspection of polygonconstructions, during the time interval corresponding to featureC, that there were not any other developments, such as theformation of crystallites.
V. SUMMARY
The polygon construction method of identifying geo-metrical defects in 2D structures is used to analyze datafrom a strongly coupled dusty plasma experiment in severalconditions: a solid, a superheated solid during rapid heating, aliquid, and a solid undergoing crystallization. We exploit theadvantage of polygon construction that it distinguishes defectsaccording to severity.
Comparing solids and liquids under steady conditions, wefind that while both quadrilaterals and pentagons become morenumerous in a liquid, their ratio does not remain constant.We find that the quadrilaterals tend to cluster with otherquadrilaterals in ladder-like structures in both our solid andliquid. We also find that the pentagons tend to cluster with otherpentagons in our liquid. In order to classify the arrangementof polygons, we measure the vertex fractions. We find thatalmost all vertex types, except for type A which is typical fora hexagonal crystal, become more numerous in a liquid ascompared to a solid.
The hysteresis diagram we prepared from the polygonconstruction suggests that sudden heating has three steps.First, at a temperature near the melting point, there is anincrease in disorder without much change in temperature.Second, a superheated solid appears at temperatures abovethe melting point. Third, the superheated solid melts, yieldinga liquid. The first of these three steps was not remarkedupon previously, when a hysteresis diagram was preparedusing Voronoi analysis. Further experiments or simulationsare needed to determine whether this step commonly occursduring sudden heating.
Finally, polygon construction is used to characterize thenature of geometrical defects present during the transient con-ditions of solid superheating and crystallization. Geometricaldefects in a superheated solid are more numerous than in asolid, and less numerous than in a liquid. We find that thenature of the geometrical defects in the superheated solid moreclosely resembles that of a solid than a liquid. This conclusionwas made possible by polygon construction, which allows acalculation of the ratio of quadrilaterals (which are less severegeometrical defects) to pentagons (which are more severe).
Additionally, we also observe a transient burst in theabundance of certain vertex types during rapid changes oftemperature, for both heating and cooling. The vertex typesthat exhibit the most profound bursts are E and F , which eachcontain a single quadrilateral. Further studies are needed todetermine whether these vertex types are abundant only in anarrow temperature range, or whether they are a metastableconfiguration with a short lifetime.
ACKNOWLEDGMENTS
We thank N. A. Clark for suggesting the use of polygonconstruction with dusty plasma experiments and we thankM. A. Glaser for helpful discussions. This work was supportedby NSF and NASA.
APPENDIX: TRIANGULATION
Polygon construction starts with measurements of individ-ual particle positions and map of bonds calculated by Delaunaytriangulation. Particle positions correspond to vertices inthe triangulation and bonds correspond to the the linesdrawn between these vertices. Delaunay triangulation usuallyidentifies bonds uniquely for a given configuration of particlepositions. But under extremely rare circumstances it is possiblefor this bond calculation to be ambiguous. Here we discuss thisambiguity in Delaunay triangulation and discuss how it doesnot affect polygon construction.
066402-8
POLYGON CONSTRUCTION TO INVESTIGATE MELTING . . . PHYSICAL REVIEW E 83, 066402 (2011)
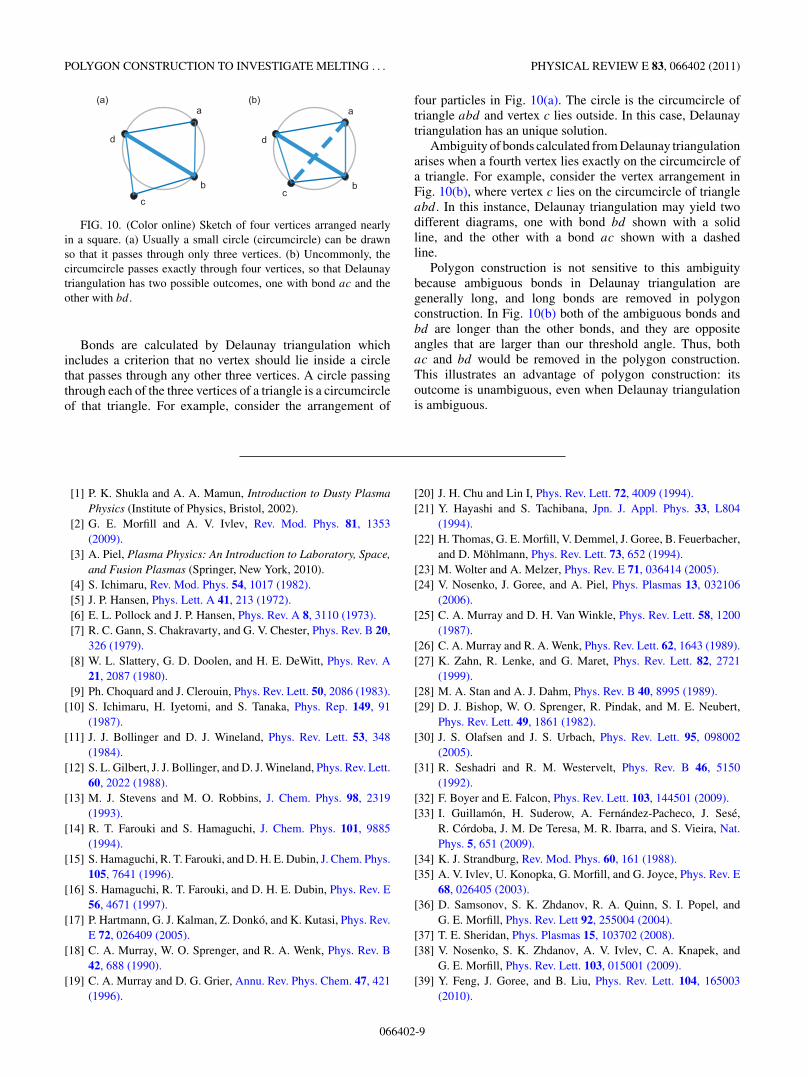
FIG. 10. (Color online) Sketch of four vertices arranged nearlyin a square. (a) Usually a small circle (circumcircle) can be drawnso that it passes through only three vertices. (b) Uncommonly, thecircumcircle passes exactly through four vertices, so that Delaunaytriangulation has two possible outcomes, one with bond ac and theother with bd .
Bonds are calculated by Delaunay triangulation whichincludes a criterion that no vertex should lie inside a circlethat passes through any other three vertices. A circle passingthrough each of the three vertices of a triangle is a circumcircleof that triangle. For example, consider the arrangement of
four particles in Fig. 10(a). The circle is the circumcircle oftriangle abd and vertex c lies outside. In this case, Delaunaytriangulation has an unique solution.
Ambiguity of bonds calculated from Delaunay triangulationarises when a fourth vertex lies exactly on the circumcircle ofa triangle. For example, consider the vertex arrangement inFig. 10(b), where vertex c lies on the circumcircle of triangleabd. In this instance, Delaunay triangulation may yield twodifferent diagrams, one with bond bd shown with a solidline, and the other with a bond ac shown with a dashedline.
Polygon construction is not sensitive to this ambiguitybecause ambiguous bonds in Delaunay triangulation aregenerally long, and long bonds are removed in polygonconstruction. In Fig. 10(b) both of the ambiguous bonds andbd are longer than the other bonds, and they are oppositeangles that are larger than our threshold angle. Thus, bothac and bd would be removed in the polygon construction.This illustrates an advantage of polygon construction: itsoutcome is unambiguous, even when Delaunay triangulationis ambiguous.
[1] P. K. Shukla and A. A. Mamun, Introduction to Dusty PlasmaPhysics (Institute of Physics, Bristol, 2002).
[2] G. E. Morfill and A. V. Ivlev, Rev. Mod. Phys. 81, 1353(2009).
[3] A. Piel, Plasma Physics: An Introduction to Laboratory, Space,and Fusion Plasmas (Springer, New York, 2010).
[4] S. Ichimaru, Rev. Mod. Phys. 54, 1017 (1982).[5] J. P. Hansen, Phys. Lett. A 41, 213 (1972).[6] E. L. Pollock and J. P. Hansen, Phys. Rev. A 8, 3110 (1973).[7] R. C. Gann, S. Chakravarty, and G. V. Chester, Phys. Rev. B 20,
326 (1979).[8] W. L. Slattery, G. D. Doolen, and H. E. DeWitt, Phys. Rev. A
21, 2087 (1980).[9] Ph. Choquard and J. Clerouin, Phys. Rev. Lett. 50, 2086 (1983).
[10] S. Ichimaru, H. Iyetomi, and S. Tanaka, Phys. Rep. 149, 91(1987).
[11] J. J. Bollinger and D. J. Wineland, Phys. Rev. Lett. 53, 348(1984).
[12] S. L. Gilbert, J. J. Bollinger, and D. J. Wineland, Phys. Rev. Lett.60, 2022 (1988).
[13] M. J. Stevens and M. O. Robbins, J. Chem. Phys. 98, 2319(1993).
[14] R. T. Farouki and S. Hamaguchi, J. Chem. Phys. 101, 9885(1994).
[15] S. Hamaguchi, R. T. Farouki, and D. H. E. Dubin, J. Chem. Phys.105, 7641 (1996).
[16] S. Hamaguchi, R. T. Farouki, and D. H. E. Dubin, Phys. Rev. E56, 4671 (1997).
[17] P. Hartmann, G. J. Kalman, Z. Donko, and K. Kutasi, Phys. Rev.E 72, 026409 (2005).
[18] C. A. Murray, W. O. Sprenger, and R. A. Wenk, Phys. Rev. B42, 688 (1990).
[19] C. A. Murray and D. G. Grier, Annu. Rev. Phys. Chem. 47, 421(1996).
[20] J. H. Chu and Lin I, Phys. Rev. Lett. 72, 4009 (1994).[21] Y. Hayashi and S. Tachibana, Jpn. J. Appl. Phys. 33, L804
(1994).[22] H. Thomas, G. E. Morfill, V. Demmel, J. Goree, B. Feuerbacher,
and D. Mohlmann, Phys. Rev. Lett. 73, 652 (1994).[23] M. Wolter and A. Melzer, Phys. Rev. E 71, 036414 (2005).[24] V. Nosenko, J. Goree, and A. Piel, Phys. Plasmas 13, 032106
(2006).[25] C. A. Murray and D. H. Van Winkle, Phys. Rev. Lett. 58, 1200
(1987).[26] C. A. Murray and R. A. Wenk, Phys. Rev. Lett. 62, 1643 (1989).[27] K. Zahn, R. Lenke, and G. Maret, Phys. Rev. Lett. 82, 2721
(1999).[28] M. A. Stan and A. J. Dahm, Phys. Rev. B 40, 8995 (1989).[29] D. J. Bishop, W. O. Sprenger, R. Pindak, and M. E. Neubert,
Phys. Rev. Lett. 49, 1861 (1982).[30] J. S. Olafsen and J. S. Urbach, Phys. Rev. Lett. 95, 098002
(2005).[31] R. Seshadri and R. M. Westervelt, Phys. Rev. B 46, 5150
(1992).[32] F. Boyer and E. Falcon, Phys. Rev. Lett. 103, 144501 (2009).[33] I. Guillamon, H. Suderow, A. Fernandez-Pacheco, J. Sese,
R. Cordoba, J. M. De Teresa, M. R. Ibarra, and S. Vieira, Nat.Phys. 5, 651 (2009).
[34] K. J. Strandburg, Rev. Mod. Phys. 60, 161 (1988).[35] A. V. Ivlev, U. Konopka, G. Morfill, and G. Joyce, Phys. Rev. E
68, 026405 (2003).[36] D. Samsonov, S. K. Zhdanov, R. A. Quinn, S. I. Popel, and
G. E. Morfill, Phys. Rev. Lett 92, 255004 (2004).[37] T. E. Sheridan, Phys. Plasmas 15, 103702 (2008).[38] V. Nosenko, S. K. Zhdanov, A. V. Ivlev, C. A. Knapek, and
G. E. Morfill, Phys. Rev. Lett. 103, 015001 (2009).[39] Y. Feng, J. Goree, and B. Liu, Phys. Rev. Lett. 104, 165003
(2010).
066402-9
RUHUNUSIRI, GOREE, FENG, AND LIU PHYSICAL REVIEW E 83, 066402 (2011)
[40] H. M. Thomas and G. E. Morfill, Nature (London) 379, 806(1996).
[41] A. Melzer, A. Homann, and A. Piel, Phys. Rev. E 53, 2757(1996).
[42] R. A. Quinn and J. Goree, Phys. Rev. E 64, 051404(2001).
[43] Y. J. Lai and Lin I, Phys. Rev. Lett. 89, 155002 (2002).[44] R. Ichiki, Y. Ivanov, M. Wolter, Y. Kawai, and A. Melzer, Phys.
Rev. E 70, 066404 (2004).[45] J. M. Kosterlitz and D. J. Thouless, J. Phys. C 6, 1181 (1973).[46] B. I. Halperin and D. R. Nelson, Phys. Rev. Lett. 41, 121
(1978).[47] D. R. Nelson and B. I. Halperin, Phys. Rev. B 19, 2457 (1979).[48] A. P. Young, Phys. Rev. B 19, 1855 (1979).[49] M. A. Glaser and N. A. Clark, Phys. Rev. A 41, 4585 (1990).[50] M. A. Glaser and N. A. Clark, Adv. Chem. Phys. 83, 543 (1993).[51] M. A. Glaser and N. A. Clark, in Proceedings of the Fourth
Nishinomiya-Yukawa Memorial Symposium, Dynamics andPatterns in Complex Fluids, edited by A. Onuki and M. Doi(Springer, Berlin, 1993).
[52] G. F. Voronoi, J. Reine Angew. Math. 136, 67 (1909).[53] Y. Feng, J. Goree, and B. Liu, Phys. Rev. Lett. 100, 205007
(2008).
[54] See supplemental material at [http://link.aps.org/supplemental/10.1103/PhysRevE.83.066402] for source codes in two pro-gramming languages.
[55] B.-J. Lin and L.-J. Chen, J. Chem. Phys. 126, 034706 (2007).[56] Z. Wang, A. M. Alsayed, A. G. Yodh, and Y. Han, J. Chem.
Phys. 132, 154501 (2010).[57] V. Nosenko and S. K. Zhdanov, Contrib. Plasma Phys. 49, 191
(2009).[58] C.-L. Chan, C.-W. Io, and Lin I, Contrib. Plasma Phys. 49, 215
(2009).[59] O. Arp, D. Block, A. Piel, and A. Melzer, Phys. Rev. Lett. 93,
165004 (2004).[60] J. D. Bernal, Nature (London) 183, 141 (1959).[61] J. D. Bernal, Nature (London) 185, 68 (1960).[62] C. Liu, S. Yamazaki, R. Hobara, I. Matsuda, and S. Hasegawa,
Phys. Rev. B 71, 041310(R) (2005).[63] U. Konopka, G. E. Morfill, and L. Ratke, Phys. Rev. Lett. 84,
891 (2000).[64] Y. Feng, J. Goree, and B. Liu, Rev. Sci. Instrum. 78, 053704
(2007).[65] P. Hartmann, A. Douglass, J. C. Reyes, L. S. Matthews, T. W.
Hyde, A. Kovacs, and Z. Donko, Phys. Rev. Lett. 105, 115004(2010).
066402-10