Embed Size (px)
Citation preview
0
Poly(γ-glutamic) acid (PGA) production from confectionery waste using Bacillus
species
by
Sharon Rademeyer
Thesis submitted in fulfilment of the requirements for the degree
Master of Engineering: Chemical Engineering
in the Faculty of Engineering and the Built Environment
at the Cape Peninsula University of Technology
Supervisor: Professor Sue Harrison
Co-supervisor: Professor Marshall Sheldon
Cape Town
Date submitted: December 2018
CPUT copyright information

The thesis may not be published either in part (in scholarly, scientific or technical journals), or
as a whole (as a monograph), unless permission has been obtained from the University
DECLARATION i
DECLARATION
I, Sharon Rademeyer, declare that the contents of this thesis represent my own unaided work,
and that the thesis has not previously been submitted for academic examination towards any
qualification. Furthermore, it represents my own opinions and not necessarily those of the
Cape Peninsula University of Technology.
December 2018
Signed Date
ABSTRACT ii
ABSTRACT
Approximately 9 million tonnes of food waste is generated annually in South Africa. Its
treatment, including treatment of confectionery waste, is costly because of the high chemical
oxygen demand (COD) loads; as a result much of this waste is sent to landfill. South Africa’s
confectionery industry contributes to a significant proportion of the country’s economy. Among
the confectionery waste entering landfills are defective material, expired sweets and returns.
This high COD waste can create breeding grounds for pathogenic microorganisms and
anaerobic methanogens, causing negative environmental impacts. Part of the Department of
Science and Technology (DST) Waste Research, Development and Innovation (RD&I)
roadmap initiative is to minimise waste entering landfills by identifying waste sources from
which to produce value that will contribute to social and economic growth.
Confectionery waste has a high sugar content which can be used for feedstock to
bioprocesses. By placing this bioproduction into a waste biorefinery framework, bio-based raw
materials can be used to produce competitively priced products with low environmental impact,
thereby optimising remediation and value generation simultaneously. Ongoing research at the
Centre for Bioprocess Engineering Research (CeBER) at the University of Cape Town has
shown that a wastewater biorefinery approach can use wastewater as feedstock for the
generation of products of value. Previous studies have investigated potential products of value
based on nutrient loads found in wastewater as well as the nature of the product. Among the
organisms selected was the Bacillus species, producing the potential product poly-γ-glutamic
acid (PGA), an extracellular poly-amino acid when there is an excess of nutrients. Similarly,
this product could potentially be produced from sugar-rich waste candy.
The aim of this study was to explore the use of hard candy waste as a feedstock for PGA, and
Bacillus licheniformis JCM 2505 was selected as it was characterised in terms of the nutrients
needed. The most attractive attribute of this strain was that it did not need L-glutamic acid to
synthesise PGA but could do so from sugar. L-glutamic acid is costly. Using a cheaper nitrogen
alternative would make the process more cost effective. To investigate this potential, the
confectionery waste was characterised to identify the nutrients, namely, sugars, organic
nitrogen and key trace elements needed for cell function and PGA production. Results showed
that the nitrogen content and trace element concentrations were insignificant, as it was
determined that the waste consisted mostly of sucrose. This therefore had to be supplemented
with a basal medium containing the supplementation needed for cell function and PGA
production. The growth of B. licheniformis was profiled in Erlenmeyer shake flasks using candy
waste supplemented with the basal medium, with sucrose supplemented with basal medium
as a control. The results showed similar trends on candy waste and sucrose. These findings
iii
were used to plan two batch experiments; one with sucrose supplemented with basal medium
the other with candy waste supplemented with basal medium. Similar growth profiles were
obtained on the two substrates with the exception of the longer lag phase seen on growth on
the candy waste, which was attributed to the amount of Na+ ions present in the alkaline buffer
used to neutralise the acidic candy waste. Furthermore, PGA was found to be a growth-
associated product, provided that there was an adequate amount of sucrose and nitrogen
within the system. To increase the productivity and yield of PGA, duplicate fed-batch
experiments were run by constantly feeding candy and NH4Cl solution at 0.0833 L/h in the C:N
ratio needed for optimal PGA production. The biomass concentration was increased from
5.86±0.68 g/L to 10.3±0.81 g/L, while the PGA productivity remained unchanged. Further
investigation into the enhancement of PGA production is recommended. PGA production from
solid confectionery waste will prevent the waste from going to landfill, thus reducing the
environmental burden by preventing the breeding of harmful microorganisms that produce
noxious gases.
ACKNOWLEDGEMENTS iv
ACKNOWLEDGEMENTS
I wish to thank:
• To one of the most influential people in my life, Professor Sue Harrison. Thank you
for being a constant pillar of support in my life; your guidance and wisdom have
helped me navigate through this tough postgraduate journey. Words can never
even begin to describe the positive impact that you have had (and continue to have)
in my life. From the bottom of my heart, thank you.
• To Professor Marshall Sheldon, thank you for allowing me the opportunity to work
with you. Thank you for your guidance and patience throughout this whole
process.You are an inspiring woman and I would love to work more with you in the
future.
• To my parents for your constant support and words of encouragement. This journey
has been tough, but I appreciate the kind words and the late night phone calls.
• Dr Madelyn Johnstone-Robertson for your guidance during the beginning of this
project.
• Mr Tich Samkange, the man that performed miracles when equipment failed. Thank
you so much for going the extra mile. I would not have accomplished what I have
without your assistance.
• Ms Catherine Edward, my designated lab companion. Thank you for making sure I
was always fed and that I was awake to sample. Your companionship and support
during those late nights were greatly appreciated.
• Ms Fadzai Kadzinga for her technical input and constant support.
• Ms Sue Jobson for her overwhelming support and concern.
• Ms Lesley Mostert for being helpful and supportive with life in general, and editing.
• Ms Candice Lowin for constantly supporting and motivating me through this patch.
• To the rest of my friends that have been so supportive during this journey. I
appreciate each and every one of you. Life is a team effort.
• The financial assistance of the Department of Science and Technology towards this
research is acknowledged. Opinions expressed in this dissertation and the
conclusions arrived at, are those of the author, and are not necessarily to be
attributed to the Department of Science and Technology.
DEDICATION v
DEDICATION
This thesis is dedicated to my parents. God has blessed me with two wonderful souls that have
equipped me with the tools to help me pursue my dreams, and for that I am eternally grateful.
“It always seems impossible until it’s done.” ―Nelson Mandela
TABLE OF CONTENTS vi
TABLE OF CONTENTS
DECLARATION ...................................................................................................................... I
ABSTRACT ........................................................................................................................... II
ACKNOWLEDGEMENTS..................................................................................................... IV
DEDICATION ........................................................................................................................ V
TABLE OF CONTENTS ........................................................................................................ VI
LIST OF FIGURES .............................................................................................................. VIII
LIST OF TABLES ................................................................................................................. IX
GLOSSARY .......................................................................................................................... X
ABBREVIATIONS ................................................................................................................ XI
NOMENCLATURE .............................................................................................................. XII
CHAPTER 1: INTRODUCTION ........................................................................................ 1
1.1 BACKGROUND ................................................................................................................. 1
1.2 PROBLEM STATEMENT ..................................................................................................... 2
1.3 RESEARCH QUESTIONS .................................................................................................... 3
1.4 SCOPE ............................................................................................................................ 3
1.5 THE OBJECTIVES ............................................................................................................. 3
1.6 SIGNIFICANCE ................................................................................................................. 3
1.7 DELINEATION .................................................................................................................. 3
CHAPTER 2: LITERATURE REVIEW .............................................................................. 4
2.1 INTRODUCTION TO SOUTH AFRICA’S CONFECTIONERY INDUSTRY ....................................... 4
2.2 CONFECTIONARY MANUFACTURE ..................................................................................... 4
2.2.1 CONFECTIONERY WASTE AS A RENEWABLE RESOURCE .................................................... 5
2.2.2 CONFECTIONERY WASTE TREATMENT IN INDUSTRY ......................................................... 8
2.3 BIOREFINERY CONCEPT ................................................................................................... 8
2.4 PROPERTIES AND USES OF POLY(Γ-GLUTAMIC ACID) ........................................................ 11
2.4.1 BIOSYNTHESIS OF PGA ............................................................................................... 12
2.4.2 KEY NUTRIENTS NEEDED FOR CELL GROWTH ................................................................ 15
2.4.3 THE DIFFERENT STAGES OF CELL GROWTH ................................................................... 15
2.4.4 PGA PRODUCTION FROM RENEWABLE RESOURCES ....................................................... 16
2.5 OPERATION MODE FOR THE PRODUCTION OF BIOPOLYMERS AND GROWTH KINETICS ......... 21
2.5.1 OPERATION MODES FOR PGA PRODUCTION ................................................................. 22
CHAPTER 3: MATERIALS AND METHODS ................................................................. 26
3.1 SELECTION OF BACILLUS AND CULTIVATION OF SPECIES ................................................. 26
3.1.1 CULTIVATION OF B. LICHENIFORMIS JCM2505 ON NUTRIENT-RICH MEDIUM ..................... 26
3.1.2 ADAPTATION OF B. LICHENIFORMIS TO A MINIMAL MEDIUM ............................................. 27
3.1.3 CULTIVATION OF B. LICHENIFORMIS IN SHAKE FLASKS USING SUCROSE AND CANDY WASTE ..
.................................................................................................................................. 27
3.2 CHARACTERISATION OF CONFECTIONERY WASTE ............................................................ 28
3.3 IDENTIFICATION OF KEY NUTRIENTS NEEDED FOR THE CULTIVATION OF B. LICHENIFORMIS . 28
3.4 BIOREACTOR STUDIES ................................................................................................... 30
3.4.1 BATCH BIOREACTOR STUDIES ...................................................................................... 31
3.4.2 FED-BATCH BIOREACTOR STUDIES ............................................................................... 32
3.4.3 CALCULATION OF KINETICS .......................................................................................... 33
3.4.4 YIELD FACTORS IN BATCH ............................................................................................ 34
vii
3.4.5 YIELD FACTORS IN FED-BATCH ..................................................................................... 34
3.5 ANALYTICAL TECHNIQUES .............................................................................................. 35
3.5.1 TOTAL ORGANIC CARBON (TOC) .................................................................................. 35
3.5.2 TOTAL KJELDAHL NITROGEN (TKN) .............................................................................. 35
3.5.3 INDUCTIVELY COUPLED PLASMA – OPTICAL EMISSION SPECTROMETRY (ICP-OES) .......... 36
3.5.4 NINYDRIN ASSAY ......................................................................................................... 36
3.5.5 HIGH-PERFORMANCE LIQUID CHROMATOGRAPHY (HPLC) OF CARBOHYDRATES .............. 36
3.5.6 PGA SPECTROPHOTOMETRIC ASSAY ............................................................................ 37
3.5.7 OPTICAL DENSITY (OD) ............................................................................................... 37
3.5.8 STATISTICAL ANALYSIS ................................................................................................ 38
CHAPTER 4: RESULTS AND DISCUSSION ................................................................. 39
4.1 INTRODUCTION .............................................................................................................. 39
4.2 CHARACTERISATION OF CONFECTIONERY WASTE ............................................................ 39
4.3 GROWTH OF B. LICHENIFORMIS ON CONFECTIONERY WASTE ............................................ 40
4.3.1 CULTIVATION OF B. LICHENIFORMIS ON A NUTRIENT-RICH MEDIUM .................................. 43
4.3.2 GROWTH OF B. LICHENIFORMIS ON SUCROSE ............................................................... 44
4.3.3 GROWTH OF B. LICHENIFORMIS ON HARD CANDY WASTE................................................ 45
4.4 BIOREACTOR STUDIES ................................................................................................... 46
4.4.1 BATCH REACTOR CULTIVATION OF B. LICHENIFORMIS ON SUCROSE ................................ 46
4.4.2 BATCH REACTOR CULTIVATION OF B. LICHENIFORMIS ON CANDY WASTE ......................... 49
4.5 FED-BATCH BIOREACTOR STUDIES ................................................................................. 51
4.5.1 CULTIVATION OF B. LICHENIFORMIS IN FED-BATCH MODE ............................................... 51
4.6 INTEGRATED DISCUSSION............................................................................................... 53
4.6.1 THE RELATIONSHIP BETWEEN SUBSTRATE CONSUMPTION AND BIOMASS FORMATION ....... 53
4.6.2 COMPARISON KINETIC PARAMETERS IN BATCH AND FED-BATCH REACTORS ..................... 55
CHAPTER 5: CONCLUSIONS AND RECOMMENDATIONS......................................... 56
5.1 CONCLUSIONS .............................................................................................................. 56
5.2 RECOMMENDATIONS ...................................................................................................... 57
REFERENCES .................................................................................................................... 58
APPENDIX A: STANDARD PROCEDURES ................................................................... 67
A.1 HPLC METHOD FOR SUGARS ......................................................................................... 67
A.2 ICP-OES (INDUCTIVELY COUPLED PLASMA – OPTICAL EMISSION SPECTROMETRY) ........... 68
A.3 NINYDRIN METHOD ........................................................................................................ 68
A.4 PGA QUANTIFICATION ................................................................................................... 69
APPENDIX B: CALCULATIONS ..................................................................................... 70
LIST OF FIGURES viii
LIST OF FIGURES
Figure 2-1 Biorefinery pillars .................................................................................................................................... 9
Figure 2-2 Confectionery waste biorefinery concept .............................................................................................. 11
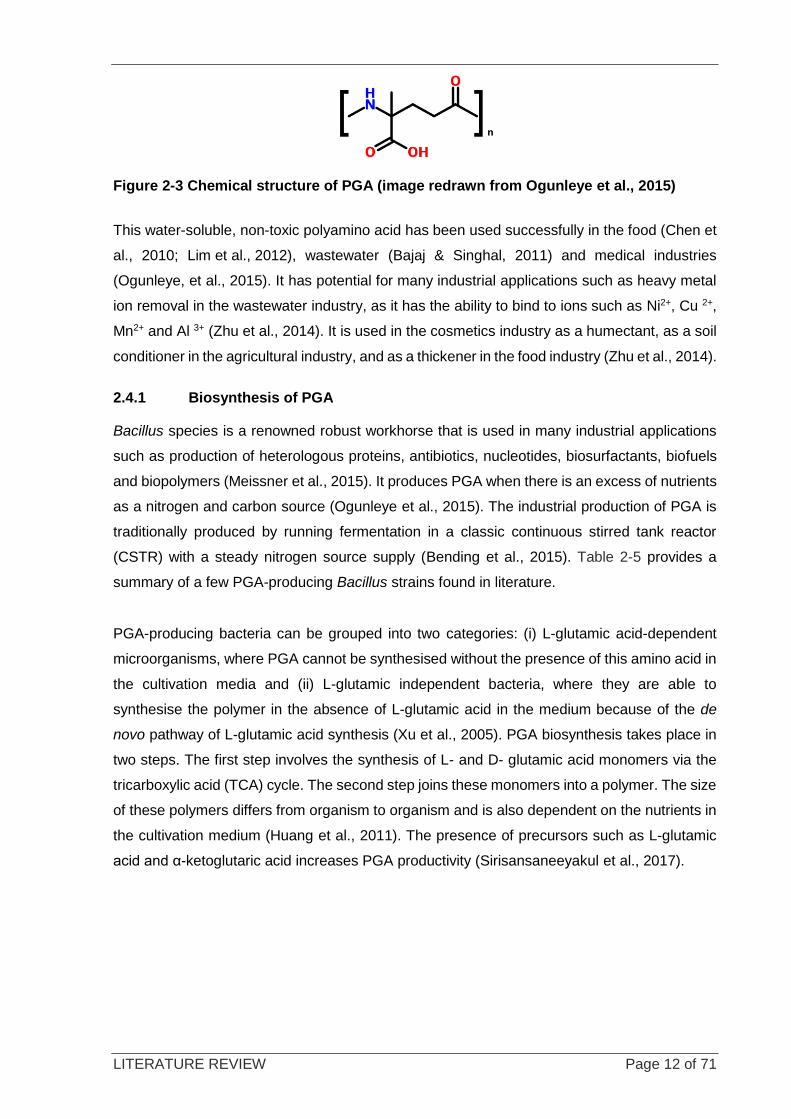
Figure 2-3 Chemical structure of PGA ................................................................................................................... 12
Figure 2-4 Biosynthesis of PGA ............................................................................................................................. 14
Figure 2-5 Stages of growth of a microorganism ................................................................................................... 16
Figure 3-1 Inoculum train for the cultivation of B. licheniformis on nutrient-rich medium ....................................... 27
Figure 3-2 Inoculum train for the adaptation of B. licheniformis on a minimal medium .......................................... 27
Figure 3-3 Confectionery waste solutions .............................................................................................................. 29
Figure 3-4 Orientation of the multi-well plates used in experiments ....................................................................... 30
Figure 3-5 BioFlo 110 fermenter system ................................................................................................................ 31
Figure 3-6 Fed batch fermentation in the BioFlo 110 fermenter system ................................................................ 32
Figure 3-7 Sugar chromatograms and their retention times ................................................................................... 37
Figure 4-1 Multiwell plates containing 1) glucose, 2) chocolate, 3) hard candy, 4) marshmallow, and 5)
mixture prior to inoculation with B. licheniformis ............................................................................... 41
Figure 4-2 Multiwell plates containing 1) glucose, 2) chocolate, 3) hard candy, 4) marshmallow, and 5) the
mixture after 30 h cultivation ............................................................................................................. 42
Figure 4-3 Sugar profile of hard candy per gram of waste ..................................................................................... 43
Figure 4-4 Growth of B. licheniformis on nutrient-rich medium .............................................................................. 44
Figure 4-5 Growth of B. licheniformis on sucrose in shake flasks .......................................................................... 45
Figure 4-6 Growth of B. licheniformis on candy waste in shake flasks ................................................................... 46
Figure 4-7 Sugar utilisation of B. licheniformis on sucrose .................................................................................... 47
Figure 4-8 PGA formation and pH of a B. licheniformis culture grown in sucrose .................................................. 48
Figure 4-9 Correlation between CDW versus PGA ................................................................................................ 48
Figure 4-10 Growth of B. licheniformis and associated sucrose utilisation when grown on candy waste. ............. 49
Figure 4-11 pH profile and PGA formation on candy waste ................................................................................... 50
Figure 4-12 Cultivation of B. licheniformis on candy-supplemented basal medium in fed-batch mode. ................. 52
Figure 4-13 pH profile and PGA formation on candy waste in fed-batch mode. .................................................... 53
Figure 4-14 Relationship between sugar consumption and sugars added ............................................................. 54
Figure 4-15 Relationship between biomass formed and PGA formed ................................................................... 55
Figure 5-1 PGA standard curve ............................................................................................................................. 69
LIST OF TABLES ix
LIST OF TABLES
Table 2-1 Production quantities of confectionery manufacturers in SA .................................................................... 4
Table 2-2 Composition of different sweets ............................................................................................................... 5
Table 2-3 Products produced from confectionery waste found in literature. ............................................................ 6
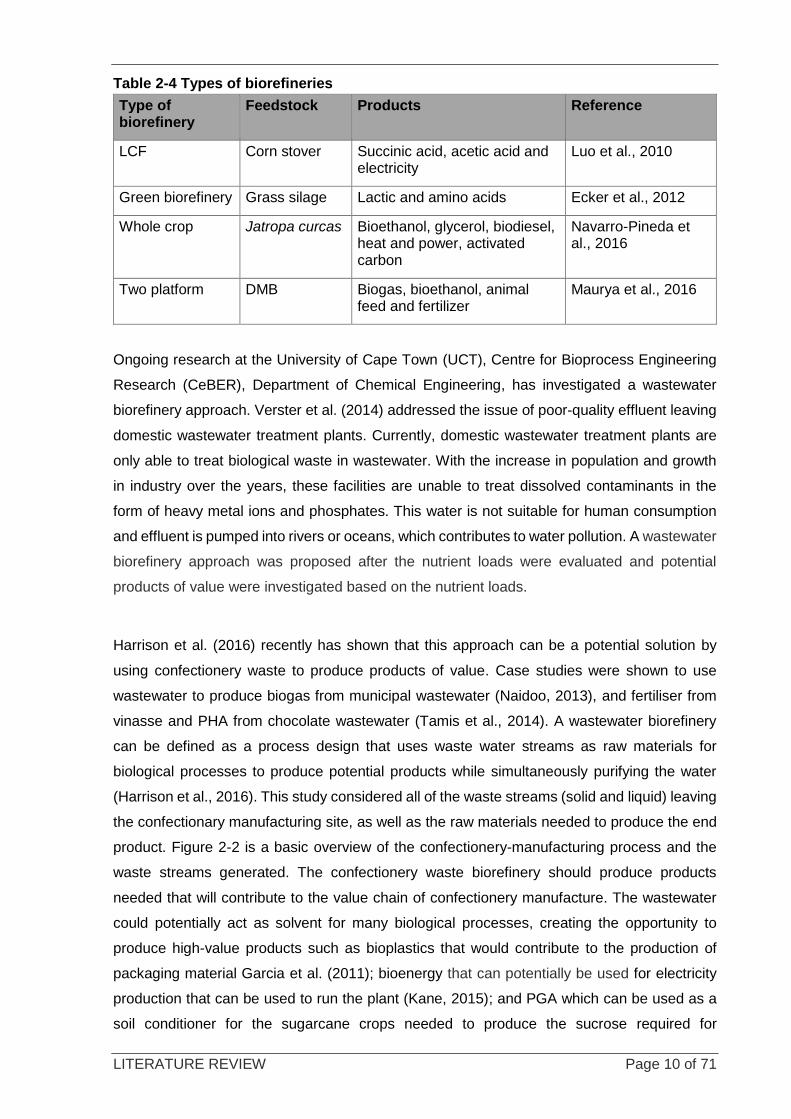
Table 2-4 Types of biorefineries............................................................................................................................. 10
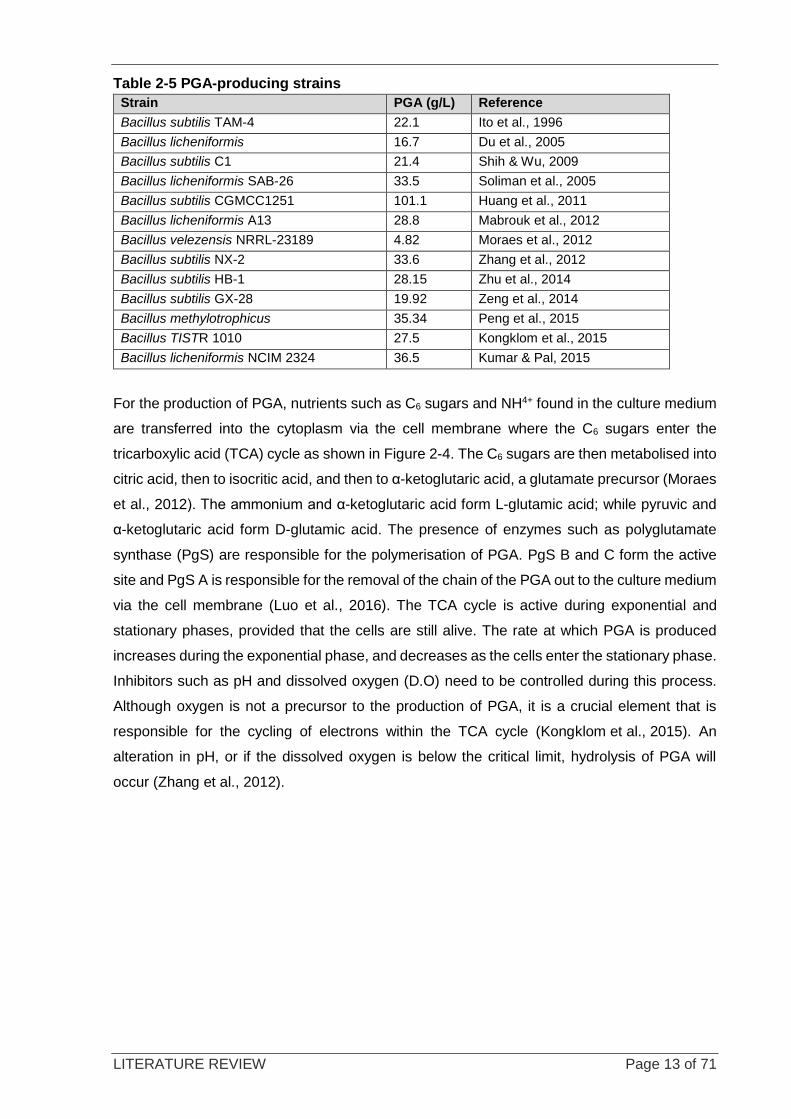
Table 2-5 PGA-producing strains ........................................................................................................................... 13
Table 2-6 Medium selecion for PGA synthesis using renewable resources ........................................................... 19
Table 2-7 Operation mode for PGA production ...................................................................................................... 24
Table 3-1 Composition of the basal medium .......................................................................................................... 28
Table 3-2 Analytical techniques used for the analysis and characterisation of confectionery waste ...................... 28
Table 3-3 Orientation of mutiwell plates ................................................................................................................. 30
Table 3-4 Parameters for batch bioreactor experiments ........................................................................................ 31
Table 3-5 Parameters for fed-batch experiments ................................................................................................... 33
Table 4-1 Confectionery waste characterisation .................................................................................................... 40
Table 4-2 The individual carbon requirements of glucose, citric acid and glycerol................................................ 40
Table 4-3 Respective carbon amounts added from various confectionery waste .................................................. 41
Table 4-4 Growth of B. licheniformis in multiwell plates after 30 h cultivation ........................................................ 43
Table 4-5 Kinetic parameters in shake flasks ........................................................................................................ 46
Table 4-6 Comparison between kinetic parameters of PGA production on hard candy and sucrose .................... 50
Table 4-7 Comparison between kinetic parameters in batch and fed batch ........................................................... 55
Table 5-1 Composition of basal medium ................................................................................................................ 67
GLOSSARY x
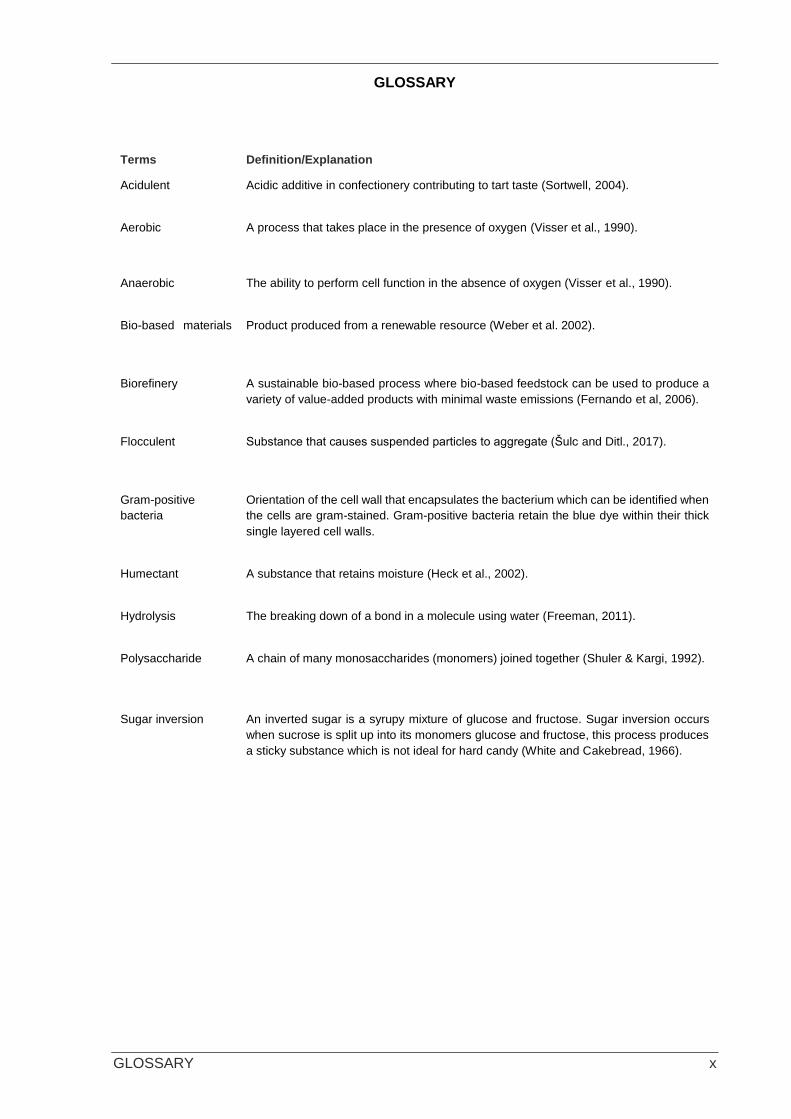
GLOSSARY
Terms Definition/Explanation
Acidulent Acidic additive in confectionery contributing to tart taste (Sortwell, 2004).
Aerobic
A process that takes place in the presence of oxygen (Visser et al., 1990).
Anaerobic The ability to perform cell function in the absence of oxygen (Visser et al., 1990).
Bio-based materials
Product produced from a renewable resource (Weber et al. 2002).
Biorefinery A sustainable bio-based process where bio-based feedstock can be used to produce a
variety of value-added products with minimal waste emissions (Fernando et al, 2006).
Flocculent
Substance that causes suspended particles to aggregate (Šulc and Ditl., 2017).
Gram-positive
bacteria
Orientation of the cell wall that encapsulates the bacterium which can be identified when
the cells are gram-stained. Gram-positive bacteria retain the blue dye within their thick
single layered cell walls.
Humectant A substance that retains moisture (Heck et al., 2002).
Hydrolysis The breaking down of a bond in a molecule using water (Freeman, 2011).
Polysaccharide
A chain of many monosaccharides (monomers) joined together (Shuler & Kargi, 1992).
Sugar inversion An inverted sugar is a syrupy mixture of glucose and fructose. Sugar inversion occurs
when sucrose is split up into its monomers glucose and fructose, this process produces
a sticky substance which is not ideal for hard candy (White and Cakebread, 1966).
ABBREVIATIONS xi
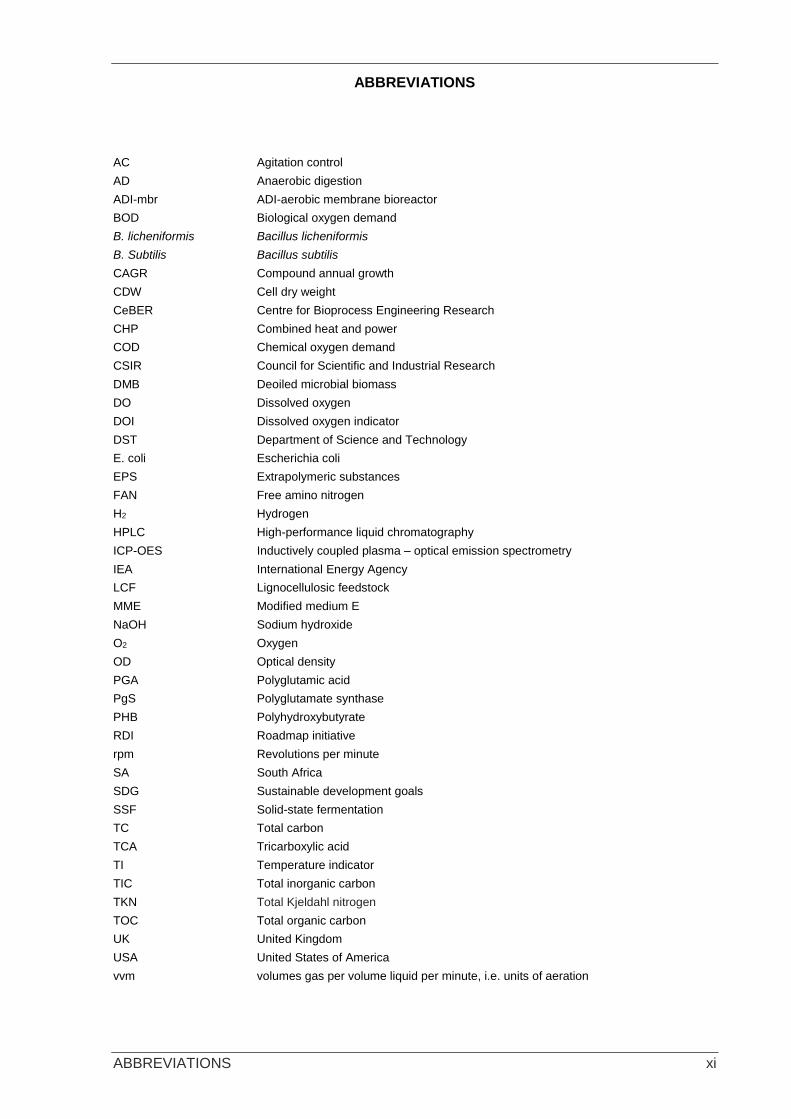
ABBREVIATIONS
AC Agitation control
AD Anaerobic digestion
ADI-mbr ADI-aerobic membrane bioreactor
BOD Biological oxygen demand
B. licheniformis Bacillus licheniformis
B. Subtilis Bacillus subtilis
CAGR Compound annual growth
CDW Cell dry weight
CeBER Centre for Bioprocess Engineering Research
CHP Combined heat and power
COD Chemical oxygen demand
CSIR Council for Scientific and Industrial Research
DMB Deoiled microbial biomass
DO Dissolved oxygen
DOI Dissolved oxygen indicator
DST Department of Science and Technology
E. coli Escherichia coli
EPS Extrapolymeric substances
FAN Free amino nitrogen
H2 Hydrogen
HPLC High-performance liquid chromatography
ICP-OES Inductively coupled plasma – optical emission spectrometry
IEA International Energy Agency
LCF Lignocellulosic feedstock
MME Modified medium E
NaOH Sodium hydroxide
O2 Oxygen
OD Optical density
PGA Polyglutamic acid
PgS Polyglutamate synthase
PHB Polyhydroxybutyrate
RDI Roadmap initiative
rpm Revolutions per minute
SA South Africa
SDG Sustainable development goals
SSF Solid-state fermentation
TC Total carbon
TCA Tricarboxylic acid
TI Temperature indicator
TIC Total inorganic carbon
TKN Total Kjeldahl nitrogen
TOC Total organic carbon
UK United Kingdom
USA United States of America
vvm volumes gas per volume liquid per minute, i.e. units of aeration
NOMENCLATURE xii
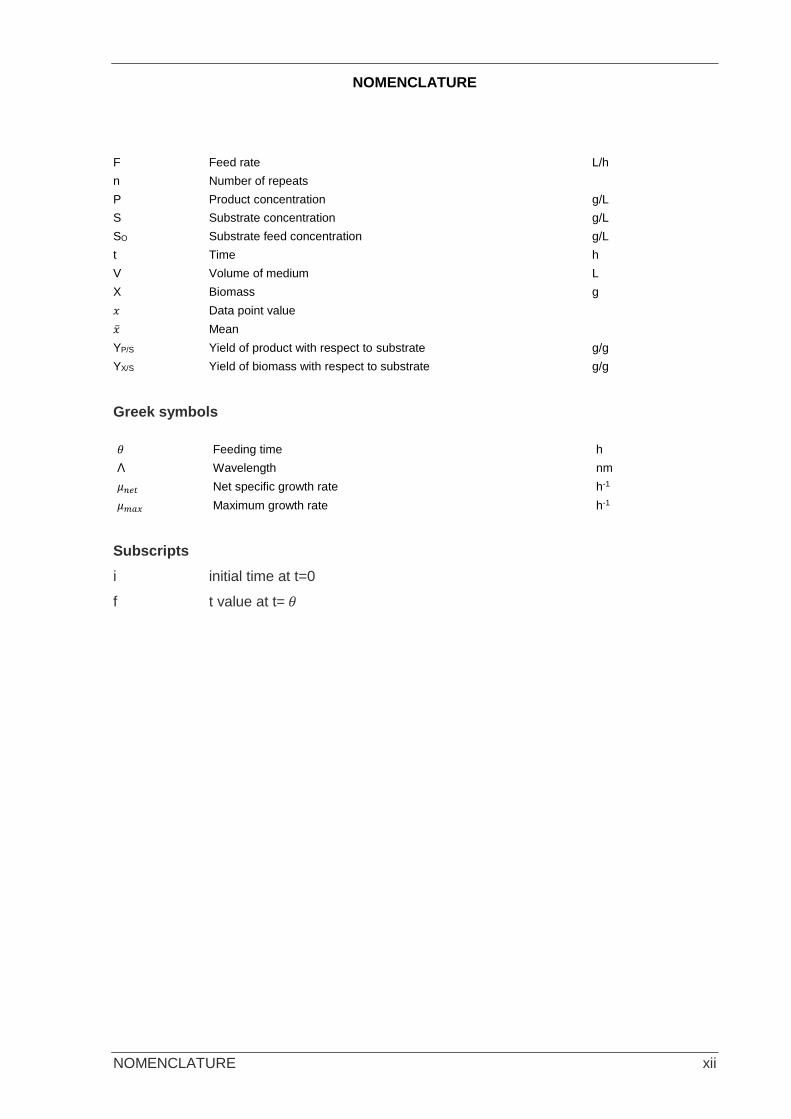
NOMENCLATURE
Greek symbols
Subscripts
i initial time at t=0
f t value at t= 𝜃
F Feed rate L/h
n Number of repeats
P Product concentration g/L
S Substrate concentration g/L
SO Substrate feed concentration g/L
t Time h
V Volume of medium L
X Biomass g
𝑥 Data point value
�̅� Mean
YP/S Yield of product with respect to substrate g/g
YX/S Yield of biomass with respect to substrate g/g
𝜃 Feeding time h
Λ Wavelength nm
𝜇𝑛𝑒𝑡 Net specific growth rate h-1
𝜇𝑚𝑎𝑥 Maximum growth rate h-1
INTRODUCTION Page 1 of 71
CHAPTER 1: INTRODUCTION
1.1 Background
With rapid population growth, there is a need for the development of processes and
infrastructure to accommodate this growth without creating excess environmental burden. One
such concern is the fate of wastes, including food waste, which is becoming a global concern
(Ravindran & Jaiswan, 2015). Oelofse and Nahman (2013) did a study to estimate the
magnitude of food waste generated in South Africa (SA). Results showed that an estimated
9.04 million tonnes of food waste are generated annually and one-third of food equivalent to
the value of R60 billion is disposed of as waste annually (Olivier, 2015).
According to SA’s National Environmental Management: Waste Act No. 59 of 2008, it has
explicitly been stated that a hierarchy of waste management steps should be followed:
• Waste should be reduced at the source by minimising creation within the industrial
process.
• Products should be re-used; this entails reusing them in their original form.
• Recycling of waste as raw material to produce other products should be used where
possible.
• Waste should be minimised by removing valuable products from the stream through
resource recovery before discarding.
• Waste should be treated before disposal.
Once all of the above steps have been taken, the remaining solid waste can be disposed of in
a landfill in a controlled manner (Institute of Waste Management Southern Africa, 2007). Some
of these wastes contain high biological oxygen demand (BOD) and chemical oxygen demand
(COD) loads. Their treatment is costly and, as a result, they get dumped into landfills where
they may support growth of pathogenic organisms or of methanogens, both of which are toxic
to the environment (Digman & Kim, 2008). Global awareness of the accumulation of these
large quantities of food waste in landfill has led to a need to find ways to divert waste from
landfill by exploring waste valorisation options using waste as feedstock to produce products
of value (Panesar & Kaur, 2015). Ideally, the waste should rather be remediated with the
concurrent generation of value, using a value-generating biorefinery approach. Food waste
has great potential for valorisation as a feedstock for biological processes as it contains a rich
INTRODUCTION Page 2 of 71
source of organic components such as proteins, fats and polysaccharides (Arancon et al.,
2013).
SA’s well established and constantly growing confectionery industry has three main
confectionery manufacturers: Mondelēz, Nestlé and Tiger brands (Peristeris et al., 2015). In
2016, the confectionery industry generated R5.6 billionof revenue, an increase of 6% from the
previous year (Das Nair et al., 2017). With greater production comes greater responsibility to
manage process waste streams which consist mainly of raw materials not fit for human
consumption as well as production wastes in the form of dough, chocolate mass, fatty
flavourings, and starch from jelly production (Rusín et al., 2015). According to one SA
company, it generates 650 tonnes of confectionery waste annually. These organic, sugar-rich
wastes could be used as feedstock for biological processes which can generate products of
value. This could be made possible by using a biorefinery approach which can utilise waste
streams as raw materials for biological processes to produce potential products of value while
simultaneously treating the waste stream (Harrison et al., 2016). Part of the SA waste research,
development and innovation (RD&I) roadmap initiative is to use waste from landfills as
renewable resources to produce products of value which will contribute to social and economic
development as well as reduce the negative environmental impact.
Polyglutamic acid (PGA) is a high-value product that can be produced by cultivating Bacillus
species. In this study, it is proposed that it is viable to use confectionery waste, rich in C6
sugars, from a local confectionery factory as a feedstock in a biorefinery using Bacillus species
for the production of PGA. Among the many applications of PGA, this study selected it for its
potential use in the agricultural industry as it has the ability to retain moisture and is a nitrogen
source (Zhu et al., 2014).
1.2 Problem statement
SA is challenged by the rapid accumulation of solid food waste in landfill, and the confectionery
industry is a significant contributor. The accumulation of food waste in landfill has a negative
environmental impact owing to production of the greenhouse gas, methane, and uncontrolled
support of microbial growth.
INTRODUCTION Page 3 of 71
1.3 Research questions
• Which components in confectionery waste can be used as microbial feedstock to
produce compounds such as PGA?
• Which Bacillus species will be suitable to produce PGA using a renewable resource
such as confectionery waste?
• What is the productivity and yield of PGA?
1.4 Scope
The aim of this study was to determine the potential of using solid confectionery waste as
afeedstock system to produce PGA.
1.5 The objectives
The objectives of the study were to:
• identify a Bacillus species that is able to produce PGA;
• characterise the confectionery waste from an identified factory in SA;
• identify key nutrients needed to supplement the waste to produce PGA;
• determine the sugar concentration range needed to produce PGA;
• commission and operate a bioreactor set-up that will produce PGA;
• determine the growth kinetics of Bacillus species for the production of PGA.
1.6 Significance
The findings in this report contribute to the “Value recovery from solid confectionery waste”
project conducted at the Centre for Bioprocess Engineering Research (CeBER). This study
will contribute to the Waste RDI Roadmap 10-year innovation plan coordinated by the
Department of Science and Technology (DST) through the Council for Scientific and Industrial
Research (CSIR).
1.7 Delineation
• All other products considered as potential products within the waste biorefinery will not be
included in this dissertation.
• Only one Bacillus species was identified and tested.
LITERATURE REVIEW Page 4 of 71
CHAPTER 2: LITERATURE REVIEW
2.1 Introduction to South Africa’s confectionery industry
SA has a well-established confectionery industry where sugar commodity prices are at a
constant low, making confectionery an affordable luxury. In 2016, the revenue of the
confectionery market in SA was R5.6 billion, with a compound annual growth rate (CAGR) of
11% since 2011. In 2016, the highest revenue generators were pastilles and gums, jellies,
boiled sweets and toffees (Das Nair et al., 2017).
There are approximately ten main confectionery producers in SA. Production quantities are
site specific and are dependent on the variety of products produced. Information on the quantity
of confectionery products produced cannot be readily found, as information is restricted and
can only be obtained through interviews. Table 2-1 is a summary of production values sourced
from Das Nair et al. (2017).
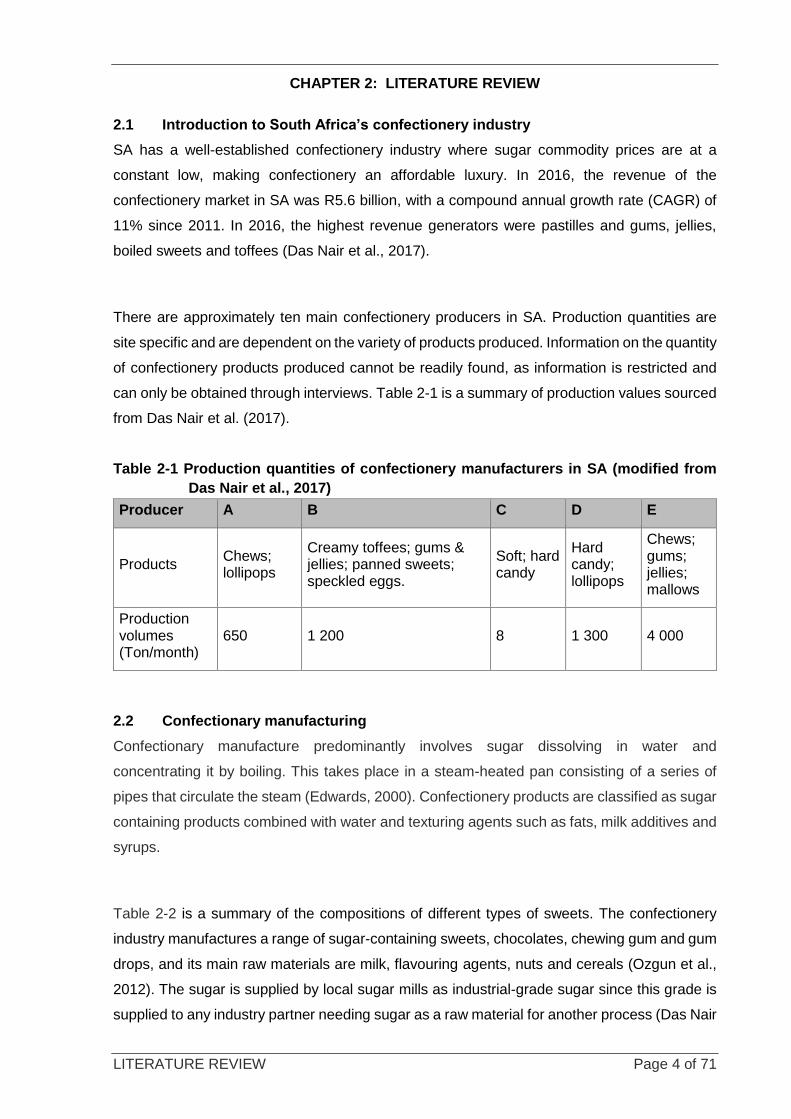
Table 2-1 Production quantities of confectionery manufacturers in SA (modified from
Das Nair et al., 2017)
Producer A B C D E
Products Chews; lollipops
Creamy toffees; gums & jellies; panned sweets; speckled eggs.
Soft; hard candy
Hard candy; lollipops
Chews; gums; jellies; mallows
Production volumes (Ton/month)
650 1 200 8 1 300 4 000
2.2 Confectionary manufacturing
Confectionary manufacture predominantly involves sugar dissolving in water and
concentrating it by boiling. This takes place in a steam-heated pan consisting of a series of
pipes that circulate the steam (Edwards, 2000). Confectionery products are classified as sugar
containing products combined with water and texturing agents such as fats, milk additives and
syrups.
Table 2-2 is a summary of the compositions of different types of sweets. The confectionery
industry manufactures a range of sugar-containing sweets, chocolates, chewing gum and gum
drops, and its main raw materials are milk, flavouring agents, nuts and cereals (Ozgun et al.,
2012). The sugar is supplied by local sugar mills as industrial-grade sugar since this grade is
supplied to any industry partner needing sugar as a raw material for another process (Das Nair
LITERATURE REVIEW Page 5 of 71
et al., 2017). Confectionery manufacturing processes use six types of acidulents: acetic,
fumaric, citric, lactic, malic and acetic acid. These acidulents are used as flavourants as well
as preservatives to keep the pH of the candy low to prevent microbial contamination (Sortwell,
2004). Generally, there are three main colourants used in candy: (i) Brilliant blue FCF E 133;
(ii) Allura red AC E129; and (iii) Tartazine E102. These colours are blended to produce various
colours (Ozsoy & Van Leeuwen, 2010).
Candies can be divided into two groups based on their sugar structures: (i) non-crystalline or
(ii) crystalline. Hard-boiled sweets are produced by concentrating a sugar solution containing
glucose, sucrose, fructose and glycerol. During the boiling process, some of the sucrose is
hydrolysed into glucose and fructose (Lees & Jackson, 1973). The acidulents used in hard
candy are generally a blend of malic acid and lactic acid. Malic acid blends well and enhances
fruity flavours, while lactic acid works well with creamy-flavoured confections (Sortwell, 2004).
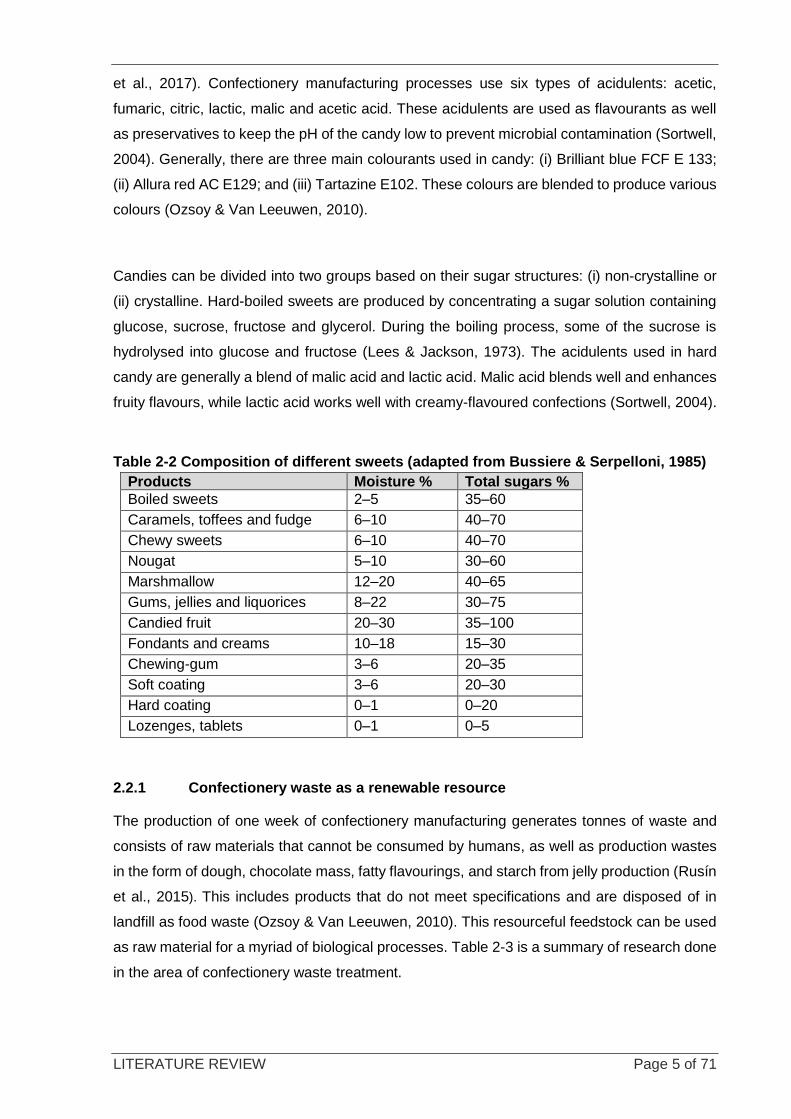
Table 2-2 Composition of different sweets (adapted from Bussiere & Serpelloni, 1985)
Products Moisture % Total sugars %
Boiled sweets 2–5 35–60
Caramels, toffees and fudge 6–10 40–70
Chewy sweets 6–10 40–70
Nougat 5–10 30–60
Marshmallow 12–20 40–65
Gums, jellies and liquorices 8–22 30–75
Candied fruit 20–30 35–100
Fondants and creams 10–18 15–30
Chewing-gum 3–6 20–35
Soft coating 3–6 20–30
Hard coating 0–1 0–20
Lozenges, tablets 0–1 0–5
2.2.1 Confectionery waste as a renewable resource
The production of one week of confectionery manufacturing generates tonnes of waste and
consists of raw materials that cannot be consumed by humans, as well as production wastes
in the form of dough, chocolate mass, fatty flavourings, and starch from jelly production (Rusín
et al., 2015). This includes products that do not meet specifications and are disposed of in
landfill as food waste (Ozsoy & Van Leeuwen, 2010). This resourceful feedstock can be used
as raw material for a myriad of biological processes. Table 2-3 is a summary of research done
in the area of confectionery waste treatment.
LITERATURE REVIEW Page 6 of 71
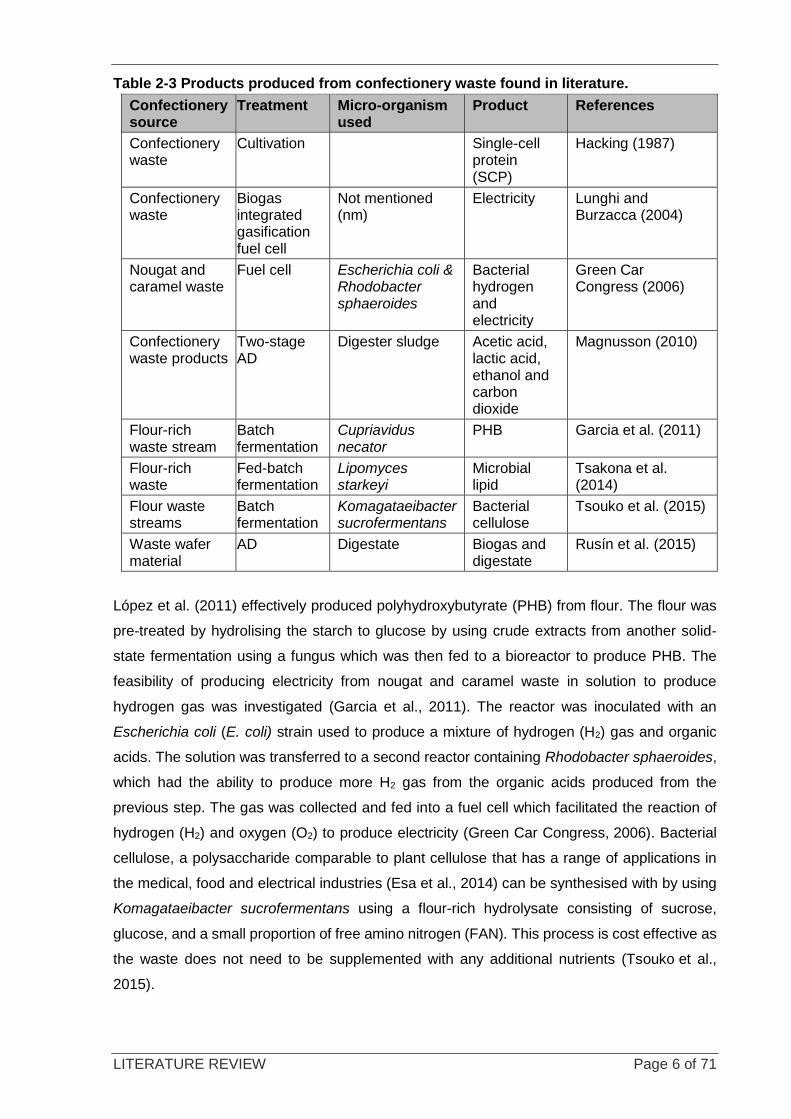
Table 2-3 Products produced from confectionery waste found in literature.
Confectionery source
Treatment Micro-organism used
Product References
Confectionery waste
Cultivation Single-cell protein (SCP)
Hacking (1987)
Confectionery waste
Biogas integrated gasification fuel cell
Not mentioned (nm)
Electricity Lunghi and Burzacca (2004)
Nougat and caramel waste
Fuel cell Escherichia coli & Rhodobacter sphaeroides
Bacterial hydrogen and electricity
Green Car Congress (2006)
Confectionery waste products
Two-stage AD
Digester sludge Acetic acid, lactic acid, ethanol and carbon dioxide
Magnusson (2010)
Flour-rich waste stream
Batch fermentation
Cupriavidus necator
PHB Garcia et al. (2011)
Flour-rich waste
Fed-batch fermentation
Lipomyces starkeyi
Microbial lipid
Tsakona et al. (2014)
Flour waste streams
Batch fermentation
Komagataeibacter sucrofermentans
Bacterial cellulose
Tsouko et al. (2015)
Waste wafer material
AD Digestate Biogas and digestate
Rusín et al. (2015)
López et al. (2011) effectively produced polyhydroxybutyrate (PHB) from flour. The flour was
pre-treated by hydrolising the starch to glucose by using crude extracts from another solid-
state fermentation using a fungus which was then fed to a bioreactor to produce PHB. The
feasibility of producing electricity from nougat and caramel waste in solution to produce
hydrogen gas was investigated (Garcia et al., 2011). The reactor was inoculated with an
Escherichia coli (E. coli) strain used to produce a mixture of hydrogen (H2) gas and organic
acids. The solution was transferred to a second reactor containing Rhodobacter sphaeroides,
which had the ability to produce more H2 gas from the organic acids produced from the
previous step. The gas was collected and fed into a fuel cell which facilitated the reaction of
hydrogen (H2) and oxygen (O2) to produce electricity (Green Car Congress, 2006). Bacterial
cellulose, a polysaccharide comparable to plant cellulose that has a range of applications in
the medical, food and electrical industries (Esa et al., 2014) can be synthesised with by using
Komagataeibacter sucrofermentans using a flour-rich hydrolysate consisting of sucrose,
glucose, and a small proportion of free amino nitrogen (FAN). This process is cost effective as
the waste does not need to be supplemented with any additional nutrients (Tsouko et al.,
2015).
LITERATURE REVIEW Page 7 of 71
Anaerobic digestion (AD) is a simple process that is used to produce biogas which is a
renewable bioenergy with many potential applications. A study based in Opava, Czech
Republic, loaded defective waste wafer material into a semi-continuous horizontal fermenter.
The AD reactor comprised of a three-layered bag made up of Sioen B6070 with a 0.7 m3 total
volume and 0.5 m3 working volume. The bag was attached to the fermenter nozzle with a
diameter of 0.5 m. This system had a 500 kg capacity which produced 8.2 m3/d biogas. The
waste was sourced from a nearby biscuit-production site. This particular manufacturing site
generates approximately 350 ton of waste per month. This process is advantageous as no
trace elements are needed to supplement the waste and the technology used can
accommodate heavy loads (Rusín et al., 2015).
LITERATURE REVIEW Page 8 of 71
2.2.2 Confectionery waste treatment in industry
2.2.2
Globally, there has been a paradigm shift in respect of waste generated by processes. This
waste is seen as a resource that can be used in another process to produce energy or products
of value. The latest phrase coined by industry is “zero waste”, which means that waste
generated in the manufacturing process is treated, valorised and recycled into the process and
zero waste is sent to landfill (Matete & Trois, 2008; Mia et al., 2015).
International companies have started putting systems into place where the confectionery waste
is converted to energy in the form of biogas through AD. Nestlé United Kingdom (UK) and
Ireland’s Fawdon factory in Newcastle upon Tyne managed to achieve “zero waste” by
constructing an AD plant on site. 200 000 L of effluent from the factory in the form of “chocolate
soup” is produced into biogas. The biogas produced by this process is able to generate
approximately 200 kW of electricity by feeding the gas to a combined heat and power engine
(CHP) (Kane, 2015). The Mars chocolate factory in Veghel, the Netherlands, constructed a
Memthane® wastewater treatment plant to treat the chocolate wastewater effluent generated
by the factory. This plant has the ability to reduce the COD from 10 000 to 50 mg/L without
having to pre-treat the effluent. In addition, the treated water does not require a polishing step
for the discharge before it is transported to a nearby municipal wastewater treatment plant.
The plant has a 1 000 000 m3 capacity that is recirculated to the boiler house which contributes
to 10% of energy used to run the factory (Dutch Water Sector, 2014). Mondelēz international
has managed to achieve its 2010 goals of “zero waste to landfill” at its Banbury manufacturing
site by installing a biogas engine with the capacity to power 400 homes with electricity
(Food and Drink Federation, 2012).
Independent companies have been selling technologies that treat confectionery waste by
reducing COD and BOD concentrations. ADI Systems did a case study at an unnamed
confectionery-manufacturing plant in Pennsylvania, United States of America (USA) (ADI
system 2015). The factory had an on-site anaerobic wastewater treatment system which was
retrofitted to an anaerobic membrane bioreactor (ADI-mBR) which improved effluent quality.
Water treatment reduced COD from 12 000 to 350 mg/L before discharge to a public-owned
treatment works.
2.3 Biorefinery concept
In the quest to find alternative energy sources, the biorefinery concept has proved to be a
solution and can be defined as a bio-based process where bio-based feedstock can be used
to produce a variety of value-added products with minimal waste emissions
(Fernando et al., 2006). A biorefinery should be able to produce bio-based products able to be
sold for profit or to produce energy. The products produced may be intermediate products;
LITERATURE REVIEW Page 9 of 71
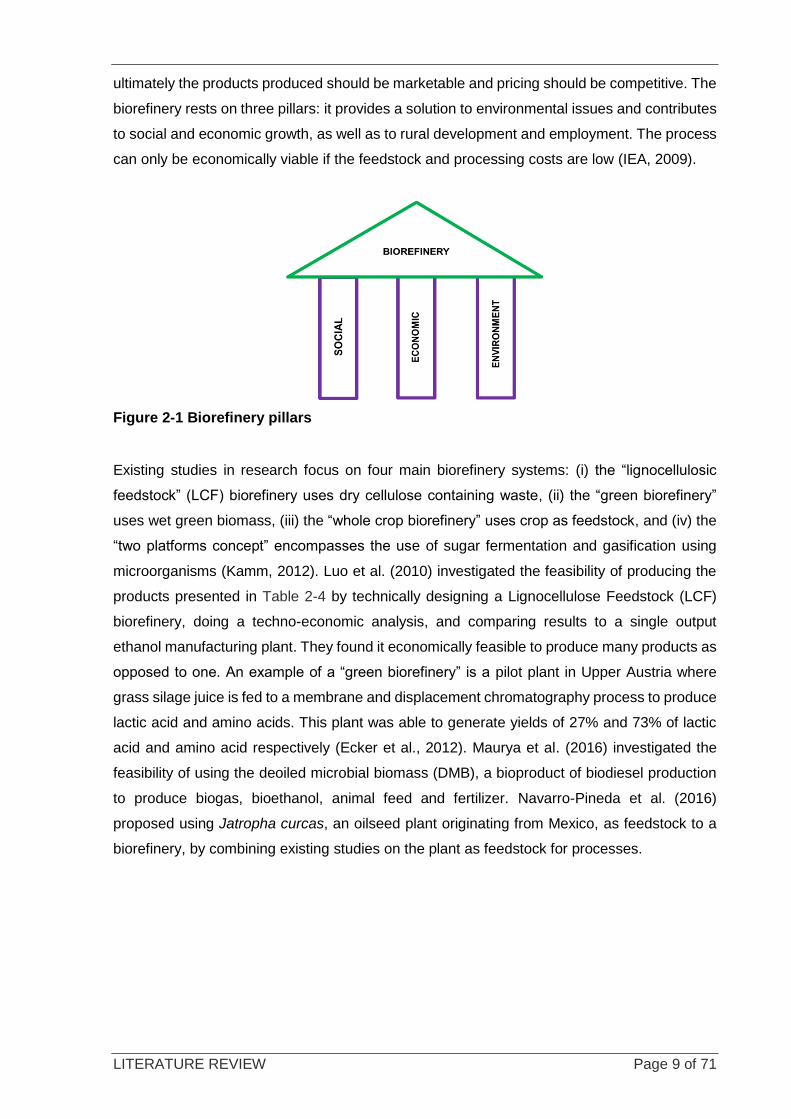
ultimately the products produced should be marketable and pricing should be competitive. The
biorefinery rests on three pillars: it provides a solution to environmental issues and contributes
to social and economic growth, as well as to rural development and employment. The process
can only be economically viable if the feedstock and processing costs are low (IEA, 2009).
Figure 2-1 Biorefinery pillars
Existing studies in research focus on four main biorefinery systems: (i) the “lignocellulosic
feedstock” (LCF) biorefinery uses dry cellulose containing waste, (ii) the “green biorefinery”
uses wet green biomass, (iii) the “whole crop biorefinery” uses crop as feedstock, and (iv) the
“two platforms concept” encompasses the use of sugar fermentation and gasification using
microorganisms (Kamm, 2012). Luo et al. (2010) investigated the feasibility of producing the
products presented in Table 2-4 by technically designing a Lignocellulose Feedstock (LCF)
biorefinery, doing a techno-economic analysis, and comparing results to a single output
ethanol manufacturing plant. They found it economically feasible to produce many products as
opposed to one. An example of a “green biorefinery” is a pilot plant in Upper Austria where
grass silage juice is fed to a membrane and displacement chromatography process to produce
lactic acid and amino acids. This plant was able to generate yields of 27% and 73% of lactic
acid and amino acid respectively (Ecker et al., 2012). Maurya et al. (2016) investigated the
feasibility of using the deoiled microbial biomass (DMB), a bioproduct of biodiesel production
to produce biogas, bioethanol, animal feed and fertilizer. Navarro-Pineda et al. (2016)
proposed using Jatropha curcas, an oilseed plant originating from Mexico, as feedstock to a
biorefinery, by combining existing studies on the plant as feedstock for processes.
LITERATURE REVIEW Page 10 of 71
Table 2-4 Types of biorefineries
Type of biorefinery
Feedstock Products Reference
LCF Corn stover Succinic acid, acetic acid and electricity
Luo et al., 2010
Green biorefinery Grass silage Lactic and amino acids Ecker et al., 2012
Whole crop Jatropa curcas Bioethanol, glycerol, biodiesel, heat and power, activated carbon
Navarro-Pineda et al., 2016
Two platform DMB Biogas, bioethanol, animal feed and fertilizer
Maurya et al., 2016
Ongoing research at the University of Cape Town (UCT), Centre for Bioprocess Engineering
Research (CeBER), Department of Chemical Engineering, has investigated a wastewater
biorefinery approach. Verster et al. (2014) addressed the issue of poor-quality effluent leaving
domestic wastewater treatment plants. Currently, domestic wastewater treatment plants are
only able to treat biological waste in wastewater. With the increase in population and growth
in industry over the years, these facilities are unable to treat dissolved contaminants in the
form of heavy metal ions and phosphates. This water is not suitable for human consumption
and effluent is pumped into rivers or oceans, which contributes to water pollution. A wastewater
biorefinery approach was proposed after the nutrient loads were evaluated and potential
products of value were investigated based on the nutrient loads.
Harrison et al. (2016) recently has shown that this approach can be a potential solution by
using confectionery waste to produce products of value. Case studies were shown to use
wastewater to produce biogas from municipal wastewater (Naidoo, 2013), and fertiliser from
vinasse and PHA from chocolate wastewater (Tamis et al., 2014). A wastewater biorefinery
can be defined as a process design that uses waste water streams as raw materials for
biological processes to produce potential products while simultaneously purifying the water
(Harrison et al., 2016). This study considered all of the waste streams (solid and liquid) leaving
the confectionary manufacturing site, as well as the raw materials needed to produce the end
product. Figure 2-2 is a basic overview of the confectionery-manufacturing process and the
waste streams generated. The confectionery waste biorefinery should produce products
needed that will contribute to the value chain of confectionery manufacture. The wastewater
could potentially act as solvent for many biological processes, creating the opportunity to
produce high-value products such as bioplastics that would contribute to the production of
packaging material Garcia et al. (2011); bioenergy that can potentially be used for electricity
production that can be used to run the plant (Kane, 2015); and PGA which can be used as a
soil conditioner for the sugarcane crops needed to produce the sucrose required for
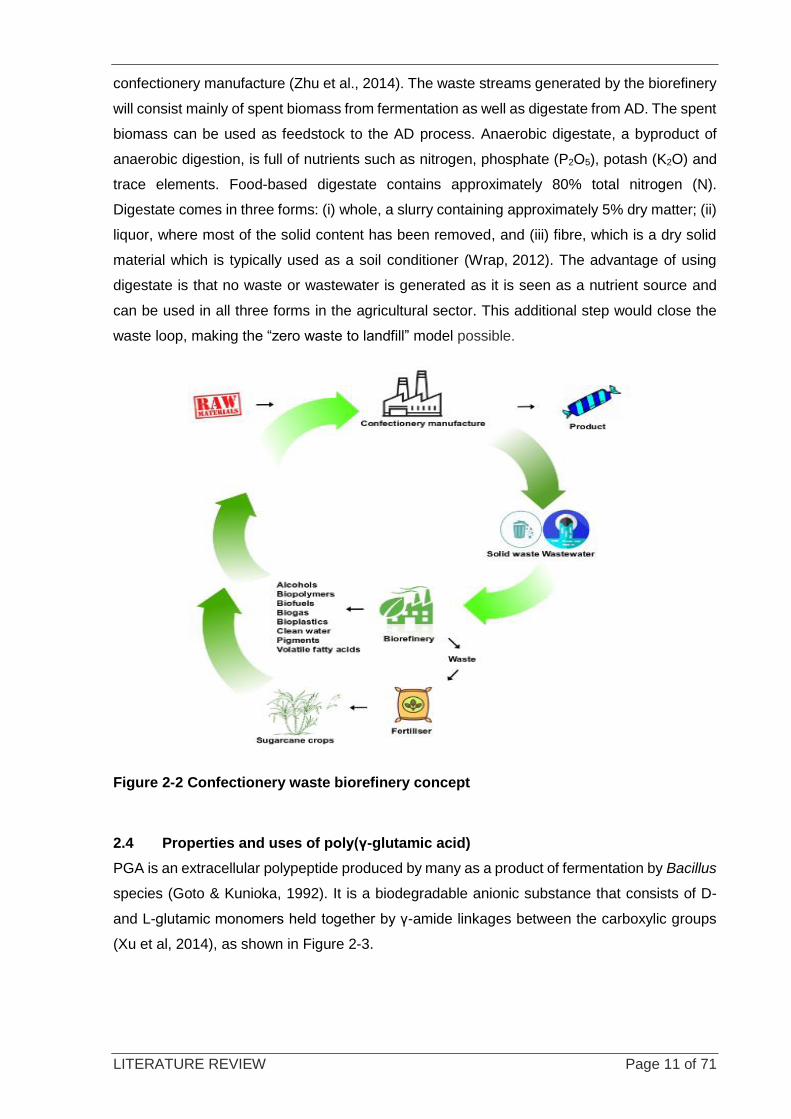
LITERATURE REVIEW Page 11 of 71
confectionery manufacture (Zhu et al., 2014). The waste streams generated by the biorefinery
will consist mainly of spent biomass from fermentation as well as digestate from AD. The spent
biomass can be used as feedstock to the AD process. Anaerobic digestate, a byproduct of
anaerobic digestion, is full of nutrients such as nitrogen, phosphate (P2O5), potash (K2O) and
trace elements. Food-based digestate contains approximately 80% total nitrogen (N).
Digestate comes in three forms: (i) whole, a slurry containing approximately 5% dry matter; (ii)
liquor, where most of the solid content has been removed, and (iii) fibre, which is a dry solid
material which is typically used as a soil conditioner (Wrap, 2012). The advantage of using
digestate is that no waste or wastewater is generated as it is seen as a nutrient source and
can be used in all three forms in the agricultural sector. This additional step would close the
waste loop, making the “zero waste to landfill” model possible.
Figure 2-2 Confectionery waste biorefinery concept
2.4 Properties and uses of poly(γ-glutamic acid)
PGA is an extracellular polypeptide produced by many as a product of fermentation by Bacillus
species (Goto & Kunioka, 1992). It is a biodegradable anionic substance that consists of D-
and L-glutamic monomers held together by γ-amide linkages between the carboxylic groups
(Xu et al, 2014), as shown in Figure 2-3.
LITERATURE REVIEW Page 12 of 71
Figure 2-3 Chemical structure of PGA (image redrawn from Ogunleye et al., 2015)
This water-soluble, non-toxic polyamino acid has been used successfully in the food (Chen et
al., 2010; Lim et al., 2012), wastewater (Bajaj & Singhal, 2011) and medical industries
(Ogunleye, et al., 2015). It has potential for many industrial applications such as heavy metal
ion removal in the wastewater industry, as it has the ability to bind to ions such as Ni2+, Cu 2+,
Mn2+ and Al 3+ (Zhu et al., 2014). It is used in the cosmetics industry as a humectant, as a soil
conditioner in the agricultural industry, and as a thickener in the food industry (Zhu et al., 2014).
2.4.1 Biosynthesis of PGA
Bacillus species is a renowned robust workhorse that is used in many industrial applications
such as production of heterologous proteins, antibiotics, nucleotides, biosurfactants, biofuels
and biopolymers (Meissner et al., 2015). It produces PGA when there is an excess of nutrients
as a nitrogen and carbon source (Ogunleye et al., 2015). The industrial production of PGA is
traditionally produced by running fermentation in a classic continuous stirred tank reactor
(CSTR) with a steady nitrogen source supply (Bending et al., 2015). Table 2-5 provides a
summary of a few PGA-producing Bacillus strains found in literature.
PGA-producing bacteria can be grouped into two categories: (i) L-glutamic acid-dependent
microorganisms, where PGA cannot be synthesised without the presence of this amino acid in
the cultivation media and (ii) L-glutamic independent bacteria, where they are able to
synthesise the polymer in the absence of L-glutamic acid in the medium because of the de
novo pathway of L-glutamic acid synthesis (Xu et al., 2005). PGA biosynthesis takes place in
two steps. The first step involves the synthesis of L- and D- glutamic acid monomers via the
tricarboxylic acid (TCA) cycle. The second step joins these monomers into a polymer. The size
of these polymers differs from organism to organism and is also dependent on the nutrients in
the cultivation medium (Huang et al., 2011). The presence of precursors such as L-glutamic
acid and α-ketoglutaric acid increases PGA productivity (Sirisansaneeyakul et al., 2017).
LITERATURE REVIEW Page 13 of 71
Table 2-5 PGA-producing strains
Strain PGA (g/L) Reference
Bacillus subtilis TAM-4 22.1 Ito et al., 1996
Bacillus licheniformis 16.7 Du et al., 2005
Bacillus subtilis C1 21.4 Shih & Wu, 2009
Bacillus licheniformis SAB-26 33.5 Soliman et al., 2005
Bacillus subtilis CGMCC1251 101.1 Huang et al., 2011
Bacillus licheniformis A13 28.8 Mabrouk et al., 2012
Bacillus velezensis NRRL-23189 4.82 Moraes et al., 2012
Bacillus subtilis NX-2 33.6 Zhang et al., 2012
Bacillus subtilis HB-1 28.15 Zhu et al., 2014
Bacillus subtilis GX-28 19.92 Zeng et al., 2014
Bacillus methylotrophicus 35.34 Peng et al., 2015
Bacillus TISTR 1010 27.5 Kongklom et al., 2015
Bacillus licheniformis NCIM 2324 36.5 Kumar & Pal, 2015
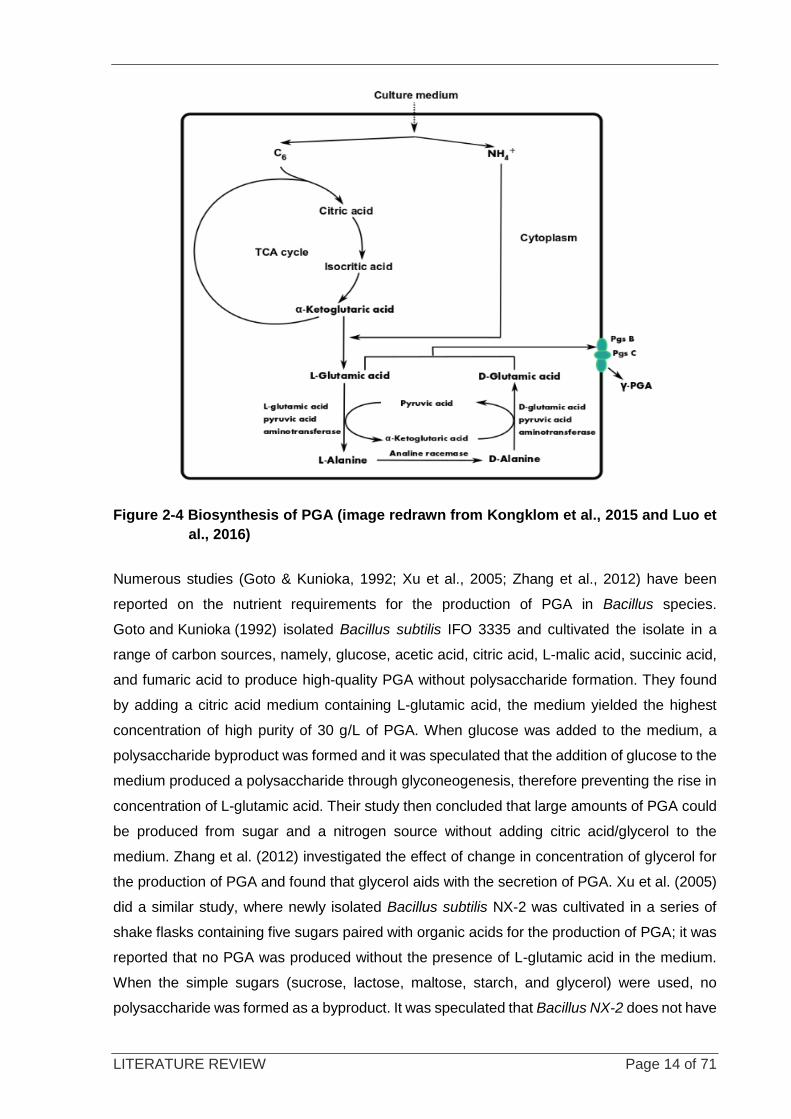
For the production of PGA, nutrients such as C6 sugars and NH4+ found in the culture medium
are transferred into the cytoplasm via the cell membrane where the C6 sugars enter the
tricarboxylic acid (TCA) cycle as shown in Figure 2-4. The C6 sugars are then metabolised into
citric acid, then to isocritic acid, and then to α-ketoglutaric acid, a glutamate precursor (Moraes
et al., 2012). The ammonium and α-ketoglutaric acid form L-glutamic acid; while pyruvic and
α-ketoglutaric acid form D-glutamic acid. The presence of enzymes such as polyglutamate
synthase (PgS) are responsible for the polymerisation of PGA. PgS B and C form the active
site and PgS A is responsible for the removal of the chain of the PGA out to the culture medium
via the cell membrane (Luo et al., 2016). The TCA cycle is active during exponential and
stationary phases, provided that the cells are still alive. The rate at which PGA is produced
increases during the exponential phase, and decreases as the cells enter the stationary phase.
Inhibitors such as pH and dissolved oxygen (D.O) need to be controlled during this process.
Although oxygen is not a precursor to the production of PGA, it is a crucial element that is
responsible for the cycling of electrons within the TCA cycle (Kongklom et al., 2015). An
alteration in pH, or if the dissolved oxygen is below the critical limit, hydrolysis of PGA will
occur (Zhang et al., 2012).
LITERATURE REVIEW Page 14 of 71
Figure 2-4 Biosynthesis of PGA (image redrawn from Kongklom et al., 2015 and Luo et
al., 2016)
Numerous studies (Goto & Kunioka, 1992; Xu et al., 2005; Zhang et al., 2012) have been
reported on the nutrient requirements for the production of PGA in Bacillus species.
Goto and Kunioka (1992) isolated Bacillus subtilis IFO 3335 and cultivated the isolate in a
range of carbon sources, namely, glucose, acetic acid, citric acid, L-malic acid, succinic acid,
and fumaric acid to produce high-quality PGA without polysaccharide formation. They found
by adding a citric acid medium containing L-glutamic acid, the medium yielded the highest
concentration of high purity of 30 g/L of PGA. When glucose was added to the medium, a
polysaccharide byproduct was formed and it was speculated that the addition of glucose to the
medium produced a polysaccharide through glyconeogenesis, therefore preventing the rise in
concentration of L-glutamic acid. Their study then concluded that large amounts of PGA could
be produced from sugar and a nitrogen source without adding citric acid/glycerol to the
medium. Zhang et al. (2012) investigated the effect of change in concentration of glycerol for
the production of PGA and found that glycerol aids with the secretion of PGA. Xu et al. (2005)
did a similar study, where newly isolated Bacillus subtilis NX-2 was cultivated in a series of
shake flasks containing five sugars paired with organic acids for the production of PGA; it was
reported that no PGA was produced without the presence of L-glutamic acid in the medium.
When the simple sugars (sucrose, lactose, maltose, starch, and glycerol) were used, no
polysaccharide was formed as a byproduct. It was speculated that Bacillus NX-2 does not have
LITERATURE REVIEW Page 15 of 71
the enzymes of the glyconeogenesis pathway; therefore it could not use citric acid in the TCA
cycle for cell growth and a PGA synthesis system cannot be formed.
2.4.2 Key nutrients needed for cell growth
The nutrients essential for microbial growth are a combination of carbon, nitrogen, oxygen and
phosphate sources, as well as key trace elements, namely, magnesium, potassium, and iron
(Forage, 1979). Biomass production from confectionery waste can be represented as:
𝐶6𝐻12𝑂6 + 𝑂2 + 𝑁, 𝑃, 𝐾, 𝑀𝑔, 𝑆 → 𝐵𝐼𝑂𝑀𝐴𝑆𝑆 + 𝐶𝑂2 + 𝐻2𝑂 + 𝐻𝐸𝐴𝑇, Eq 2.1
where simple C6 sugars such as glucose/fructose, with the combination of oxygen and
nitrogen, as well as trace elements, produce biomass, carbon dioxide, water and heat
(Forage, 1979).
The type of nutrients needed are dependent on the organism used. Madonsela (2013)
optimised the growth medium for B. licheniformis JCM 2505 called modified medium E (MME),
which consists of 20 g/L glucose 1 g/L glycerol, 12 g/L citric acid, 3.48 g/L NH4Cl, 2.99 g/L
K2HPO4 and mineral salts (0.5 g/L MgSO4.7H2O, 0.104 g/L MnSO4.H2O, 0.04 g/L FeCl3.6H2O
and 0.15 g/L CaCl2.2H2O). It is imperative that these trace elements be added in the correct
proportions as an oversupply of metal ions can hinder growth of microorganisms by causing
cation toxicity, as an increase in cation concentration has been shown to diminish growth
performance Sibanda (2009).
2.4.3 The different stages of cell growth
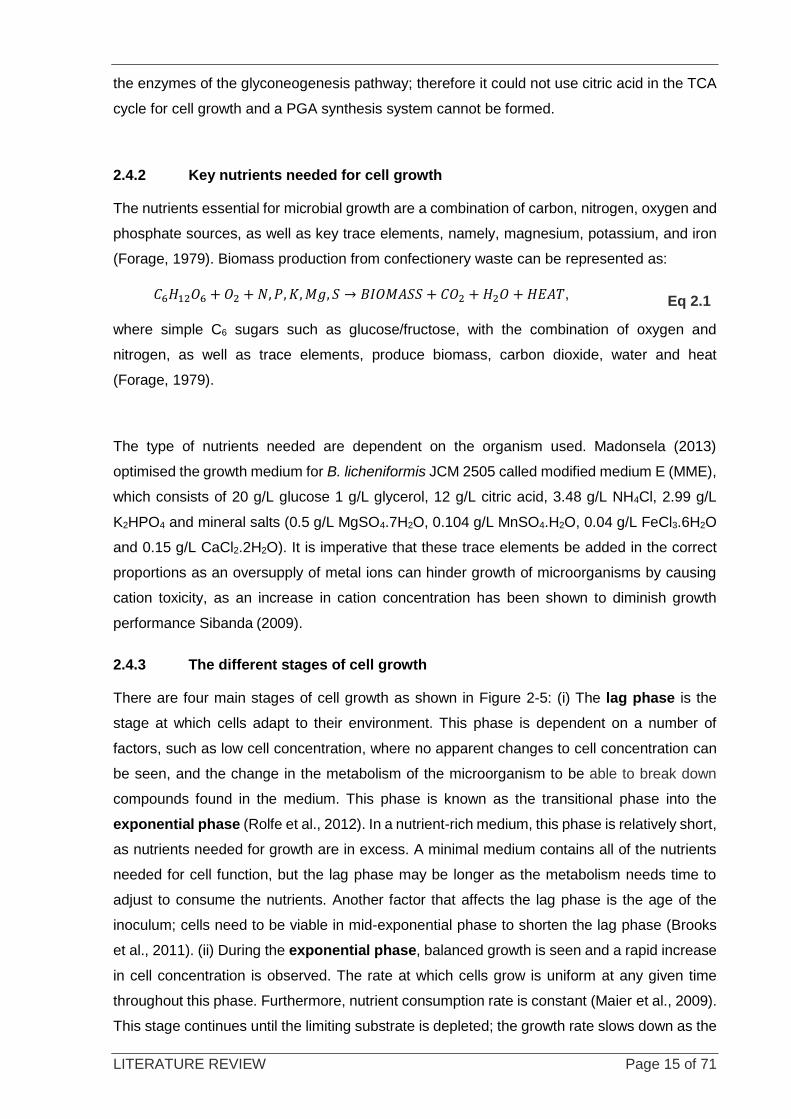
There are four main stages of cell growth as shown in Figure 2-5: (i) The lag phase is the
stage at which cells adapt to their environment. This phase is dependent on a number of
factors, such as low cell concentration, where no apparent changes to cell concentration can
be seen, and the change in the metabolism of the microorganism to be able to break down
compounds found in the medium. This phase is known as the transitional phase into the
exponential phase (Rolfe et al., 2012). In a nutrient-rich medium, this phase is relatively short,
as nutrients needed for growth are in excess. A minimal medium contains all of the nutrients
needed for cell function, but the lag phase may be longer as the metabolism needs time to
adjust to consume the nutrients. Another factor that affects the lag phase is the age of the
inoculum; cells need to be viable in mid-exponential phase to shorten the lag phase (Brooks
et al., 2011). (ii) During the exponential phase, balanced growth is seen and a rapid increase
in cell concentration is observed. The rate at which cells grow is uniform at any given time
throughout this phase. Furthermore, nutrient consumption rate is constant (Maier et al., 2009).
This stage continues until the limiting substrate is depleted; the growth rate slows down as the
LITERATURE REVIEW Page 16 of 71
cells enter the (iii) stationary phase. During this stage, nutrient supply is limited and the rate
at which cells die equates to the rate at which cells are formed; no apparent growth is seen.
(iv) The death phase is the stage at which cells begin to die off and degrade. During the lag
phase, the specific growth rate (µ) equates to 0. The exponential phase, µ, increases to its
maximum (µMAX); and remains constant and approaches 0 as it enters the stationary phase,
where it remains 0 (Shuler & Kargi, 1992).
Figure 2-5 Stages of growth of a microorganism (Redrawn from Maier et al., 2009)
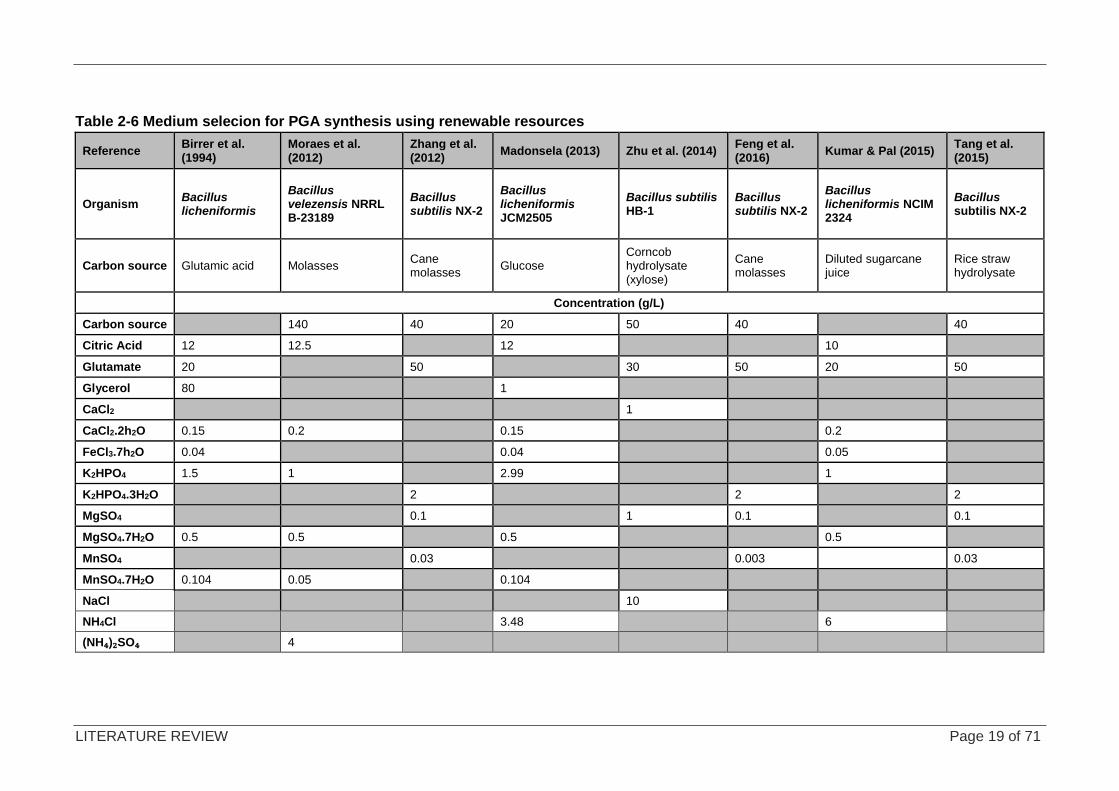
2.4.4 PGA production from renewable resources
To the author’s knowledge, no literature exists that uses confectionery waste for the production
of PGA; however researchers have been looking for renewable resources as feedstock to
produce PGA as shown in Table 2-6. Zhu et al. (2014) investigated the possibility of using
corncob hydrolysate containing glucose, xylose and arabinose as an alternative carbon source
for the production of PGA using Bacillus subtillis HB-1. They found that xylose produces more
PGA than glucose does. They concluded that corncob fibre hydrolysate can be used as a
suitable carbon source in place of glucose. The use of waste streams as a nutrient source has
also been explored by Zhang et al. (2012), using untreated cane molasses, which contains a
combination of 24% (w/w) glucose and 28.3% (w/w) fructose. It was found that this was a
suitable carbon source for the production of PGA using Bacillus subtilis NX-2. They found that
the molasses did not require hydrolysis before addition to the fermentation. Bacillus subtilis
has a well-characterised sucrose utilisation system responsible for the hydrolysis of the
sucrose molecule by sucrose hydrolases. It was speculated that the untreated cane molasses
contained unidentified nutrients which aided in the production of PGA (Zhang et al., 2012).
LITERATURE REVIEW Page 17 of 71
Researchers (Tang et al., 2015; Zhang et al., 2012; Feng et al., 2016) used a “basal medium”,
which contained several micronutrients, as well as glutamate as a nitrogen source.
The common nutrients across all of the media used for PGA cultivation were Mn2+; Mg2+and
PO43- source. Citric acid was commonly used, with the exception of B. subtilis NX-2, as this
particular strain does not need it to produce PGA (Xu et al., 2005), and Bacillus subtilis HB-1,
which was cultivated on corncob hydrolysate supplemented with 40 g/L of yeast extract, which
is a nutrient-rich source containing a variety of nutrients needed for cell function
(Zhu et al., 2014).
The glutamate-dependent strains need an organic nitrogen source in the form of glutamate for
PGA synthesis, making the production medium costly as glutamate is expensive. Glutamate-
independent strains such as Bacillus velezensis NRRL B-23189 are able to utilise an inorganic
nitrogen source for PGA synthesis. Moraes et al. (2012) supplemented molasses with citric
acid and ammonium sulphate was used as a nitrogen source in place of glutamate.
Madonsela (2013) demonstrated that Bacillus licheniformis JCM2505 was able to use an
inorganic nitrogen source, NH4Cl, to produce PGA. In addition to the carbon source(s), the key
nutrients identified were citric acid, a phosphate and nitrogen source, as well as trace elements
which are all present in minimal medium E (MME), a medium optimised from medium E (ME)
(Birrer et al., 1994), by Madonsela (2013) for the optimum carbon, nitrogen, and phosphorus
ratio for the PGA production from B. licheniformis.

LITERATURE REVIEW Page 19 of 71
Table 2-6 Medium selecion for PGA synthesis using renewable resources
Reference Birrer et al. (1994)
Moraes et al. (2012)
Zhang et al. (2012)
Madonsela (2013) Zhu et al. (2014) Feng et al. (2016)
Kumar & Pal (2015) Tang et al. (2015)
Organism Bacillus licheniformis
Bacillus velezensis NRRL B-23189
Bacillus subtilis NX-2
Bacillus licheniformis JCM2505
Bacillus subtilis HB-1
Bacillus subtilis NX-2
Bacillus licheniformis NCIM 2324
Bacillus subtilis NX-2
Carbon source Glutamic acid Molasses Cane molasses
Glucose Corncob hydrolysate (xylose)
Cane molasses
Diluted sugarcane juice
Rice straw hydrolysate
Concentration (g/L)
Carbon source 140 40 20 50 40 40
Citric Acid 12 12.5 12 10
Glutamate 20 50 30 50 20 50
Glycerol 80 1
CaCl2 1
CaCl2.2h2O 0.15 0.2 0.15 0.2
FeCl3.7h2O 0.04 0.04 0.05
K2HPO4 1.5 1 2.99 1
K2HPO4.3H2O 2 2 2
MgSO4 0.1 1 0.1 0.1
MgSO4.7H2O 0.5 0.5 0.5 0.5
MnSO4 0.03 0.003 0.03
MnSO4.7H2O 0.104 0.05 0.104
NaCl 10
NH4Cl 3.48 6
(NH₄)₂SO₄ 4

LITERATURE REVIEW Page 21 of 71
2.5 Operation mode for the production of biopolymers and growth kinetics
The operation mode used for the production of biopolymers is dependent on the nature of the
product as well as the organism. The main function of a microorganism is to respond to its
direct environment. Depending on factors such as chemical and nutritional conditions, the
microbe is able to produce an array of products. The relationship between available nutrients
and cells is related to the products formed and cells grown (Shuler & Kargi, 1992).
Traditionally, many biopolymers are produced in a stirred tank reactor (Sukan et al., 2015).
This system is able to create conditions that are conducive to growth as well as to product
formation, and this is made possible by controlling parameters such as oxygen transfer via
agitation and aeration, pH, and temperature. This control mode is useful when producing high-
value products with high quality. In addition, this system is able to overcome variance in the
feed composition as it controls its parameters effectively (Rani & Rao, 1999).
A batch system consists of a stirred tank reactor containing a sterilised cultivation medium that
is inoculated by the seed culture at the beginning of the cultivation. The system is closed, and
no additional components are added for the duration of the cultivation. The concentration of
the nutrients in the medium as well as the cell concentration varies with time
(Maier et al., 2009). To ensure that there is adequate oxygen in the system, the medium is
aerated, mixing by impeller promotes bubble dispersion. The heat transfer and mass transfer
of this system are adequate, and pH control is accurate. The advantage of the system is that
sterility is maintained; the drawback of using a batch system is that resources are finite, and
will ultimately lead to substrate limitation (Singh et al., 2014).
The fed-batch system consists of a stirred tank reactor with a pump that feeds a concentrated
solution of the substrate. During the fermentation, the feed is introduced and no components
are removed until the cultivation is complete, while maintaining sterility of the system. This
system is highly favoured in the fermentation of many biological products such as amino acids,
enzymes and vitamins (Qu et al., 2013). There is accurate control of parameters such as pH
and temperature, heat, and mass transfer. The controlled feed enables the maintenance of a
substrate concentration favourable for optimum growth of microorganisms, without overfeeding
and inhibiting growth (Rani & Rao, 1999). This operation mode is used to obtain better yields
than the batch system. The challenge with this mode is implementing a feeding strategy that
is able to maintain a required substrate concentration within the system (Singh et al., 2014).
The moving-bed biofilm reactor (MBBR) system is advantageous as it has carriers containing
immobilised cells (biofilm attached to the surface). The system is aerated and the carriers are
LITERATURE REVIEW Page 22 of 71
in constant suspension, allowing a continuous supply of nutrients into the system without the
concern of potentially washing cells out. High biomass concentration in the form of biofilm
accumulation combined with good oxygen mass transfer (Jing et al., 2009) has shown to
increase PGA yields (Jiang et al., 2016). The technology has gained popularity in the
wastewater treatment industry as it has a small footprint and is able to rapidly reduce the COD
and BOD loads. This system has continuous flow, and is robust and simple to operate
(Kamstra et al., 2017).
2.5.1 Operation modes for PGA production
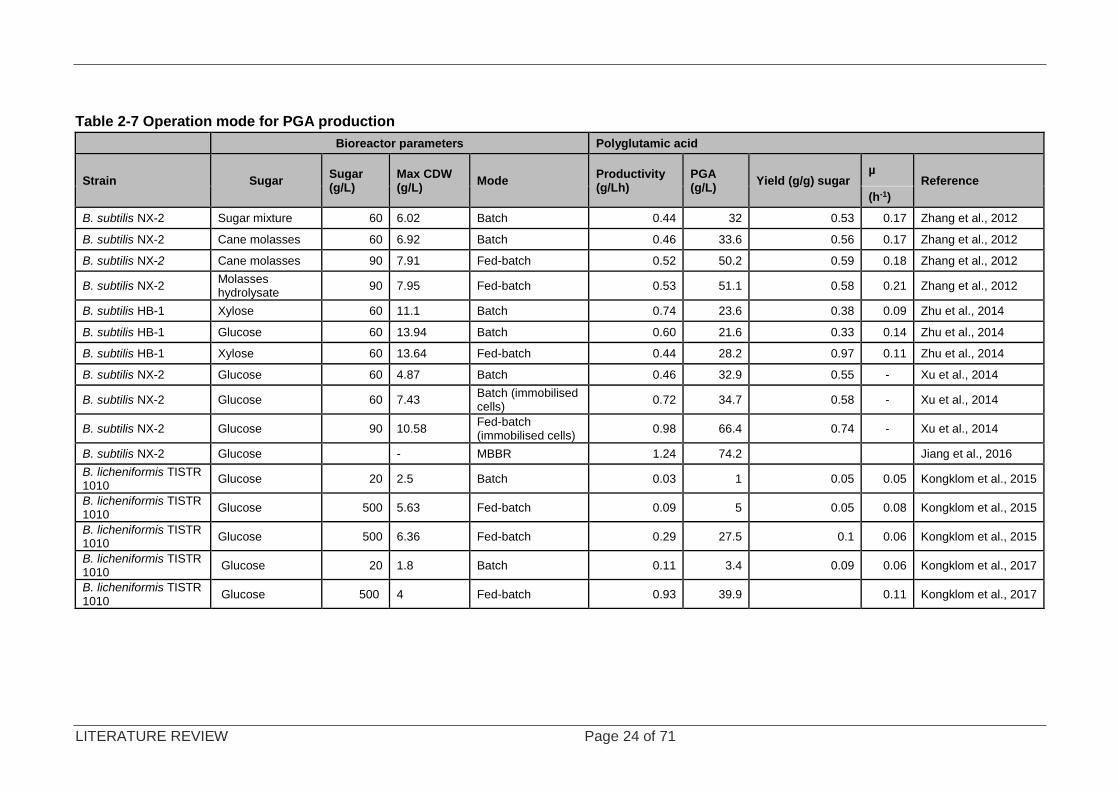
Huang et al. (2011); Zhang et al. (2012) and Jiang et al. (2016) all reported that substrate
limitation has a negative impact on the biosynthesis of PGA. The relationship between fed-
batch and batch reactors was investigated in a 7.5 L batch bioreactor. As shown in Table 2-7,
it was demonstrated that there is a considerable increase in PGA yield. Glucose as a carbon
source produced the highest concentration of PGA at 53.0 g/L, while the renewable carbon
source untreated cane molasses produced 52.1 g/L, which is fairly close to the glucose-
containing medium. Furthermore, a relationship between biomass concentration and product
formation can be seen; an increase in biomass yields more PGA. This was demonstrated by a
system which used biofilm on carriers. When cultivating Bacillus subtilis NX-2, a comparison
study between free cells in batch and immobilised cells increased from 32.86 ± 0.58 g/L to
34.74±0.61 g/L, respectively. Immobilised cells in fed- batch mode further increased the
maximum PGA concentration to 66.38 ± 0.67g/L. The advantage of immobilised cells in the
system shortens the lag phase and could turn into a semi-continuous operation without having
to sterilise the system in between runs (Xu et al., 2014). Subsequent studies tested PGA
productivity in an MBBR; a significant productivity of1.24 g/Lh was noted, the highest found in
literature.
Since Bacillus subtilis NX-2 is a glutamate-dependent strain; the basal medium contained
50 g/L glutamate (Zhang et al., 2012), therefore higher yields were expected as glutamate is a
PGA precursor (Sirisansaneeyakul et al., 2017). B. licheniformis TISTR 1010 is a glutamate-
independent strainand research and development in the area of glutamate-independent strains
is underway (Kongklom et al. 2015; Kongklom et al., 2017). Kongklom et al. (2015) compared
different feeding strategies by investigating the effects of pH, dissolved oxygen (DO), nitrogen
depletion and substrate inhibition of PGA production. Their initial fed-batch bioreactor study
involved constantly feeding glucose (500 g/L) into a bioreactor, so that the concentration
medium was maintained at 6 to 20 g/L, using improvised software. There were three different
feeding stages: Phase A (8 h) when pH was not controlled; during the second phase B, pH
was maintained at 7.3 by 3M NaOH, and the last stage did not have an acidic buffer to maintain
LITERATURE REVIEW Page 23 of 71
pH. DO was not controlled, aeration was 1 vvm, agitation 300 rpm. These conditions did not
change throughout the experiments. After 44 h, PGA began to degrade as the nitrogen source
was depleted. They speculated that pH should be controlled by feeding both carbon and
nitrogen sources. Their subsequent work controlled the pH during phase (C) using an acidic
solution of 20% citric acid and 20% NH4Cl with DO control (>20% air saturation). This alteration
increased the PGA concentration within the system from 5.03±0.04 to 27.54±0.20 g/L. The
main conclusions of their study were: (i) oxygen is essential for the recycling of NaDH and
FaDH2 which are used by the enzymes in the TCA cycle; (ii) the TCA cycle is active in live and
resting cells – this means that PGA can be produced during the stationary phase; and (iii)
maintaining the carbon and nitrogen within the system prevents PGA degradation. Their
successive study focused on maintaining the DO >50% saturation (sparged with oxygen-
enriched air) in a fed-batch system by raising the agitation by 50 rpm increments when the DO
dropped below the threshold. This increased the PGA concentration to 39.9 ±0.28 g/L
(Kongklom et al., 2017).
LITERATURE REVIEW Page 24 of 71
Table 2-7 Operation mode for PGA production
Bioreactor parameters Polyglutamic acid
Strain Sugar Sugar (g/L)
Max CDW (g/L)
Mode Productivity (g/Lh)
PGA (g/L)
Yield (g/g) sugar µ
Reference
(h-1)
B. subtilis NX-2 Sugar mixture 60 6.02 Batch 0.44 32 0.53 0.17 Zhang et al., 2012
B. subtilis NX-2 Cane molasses 60 6.92 Batch 0.46 33.6 0.56 0.17 Zhang et al., 2012
B. subtilis NX-2 Cane molasses 90 7.91 Fed-batch 0.52 50.2 0.59 0.18 Zhang et al., 2012
B. subtilis NX-2 Molasses hydrolysate
90 7.95 Fed-batch 0.53 51.1 0.58 0.21 Zhang et al., 2012
B. subtilis HB-1 Xylose 60 11.1 Batch 0.74 23.6 0.38 0.09 Zhu et al., 2014
B. subtilis HB-1 Glucose 60 13.94 Batch 0.60 21.6 0.33 0.14 Zhu et al., 2014
B. subtilis HB-1 Xylose 60 13.64 Fed-batch 0.44 28.2 0.97 0.11 Zhu et al., 2014
B. subtilis NX-2 Glucose 60 4.87 Batch 0.46 32.9 0.55 - Xu et al., 2014
B. subtilis NX-2 Glucose 60 7.43 Batch (immobilised cells)
0.72 34.7 0.58 - Xu et al., 2014
B. subtilis NX-2 Glucose 90 10.58 Fed-batch (immobilised cells)
0.98 66.4 0.74 - Xu et al., 2014
B. subtilis NX-2 Glucose - MBBR 1.24 74.2 Jiang et al., 2016
B. licheniformis TISTR 1010
Glucose 20 2.5 Batch 0.03 1 0.05 0.05 Kongklom et al., 2015
B. licheniformis TISTR 1010
Glucose 500 5.63 Fed-batch 0.09 5 0.05 0.08 Kongklom et al., 2015
B. licheniformis TISTR 1010
Glucose 500 6.36 Fed-batch 0.29 27.5 0.1 0.06 Kongklom et al., 2015
B. licheniformis TISTR 1010
Glucose 20 1.8 Batch 0.11 3.4 0.09 0.06 Kongklom et al., 2017
B. licheniformis TISTR 1010
Glucose 500 4 Fed-batch 0.93 39.9 0.11 Kongklom et al., 2017
LITERATURE REVIEW Page 25 of 71
The production of PGA has three major requirements: (i) A constant supply of carbon and
nitrogen nutrients; (ii) pH control (Kongklom et al., 2015) and (iii) sufficient oxygen supply to
the system (Kongklom et al., 2017). Confectionery waste was a suitable carbon source as it
contains a large proportion of sucrose (Ozgun et al., 2012). To the author’s knowledge, no
literature has noted the use of confectionery waste for the production of PGA; however the key
nutrients needed for cell function and PGA synthesis were sourced through similar studies that
used renewable resources to produce PGA (Kumar & Pal, 2015; Tang et al., 2015; Zhang et
al., 2012; Feng et al., 2016). PGA has a range of potential applications; however owing to the
nature of the feedstock, the application will be of value in the agricultural industry (Zhu et al.,
2014).
Hypothesis 1
Confectionery waste dissolved in water supplemented with citric acid, a nitrogen, phosphate
source, and trace elements can be used for the production of PGA using Bacillus, as Bacillus
species are able to hydrolyse sugars like sucrose and solid candy waste.
Key questions
1. What sugar concentration should be used for the production of PGA?
2. How long will it take for the Bacillus species to hydrolyse the sugar before using it to
produce PGA?
3. Does feedstock media need to be supplemented with other nutrients to aid in the
production of PGA?
Hypothesis 2
Fed-batch operation will produce more biomass, which in turn will produce more PGA. A
constant concentration of sugars within the medium promotes PGA production.
Key question
How does sucrose as a substrate affect growth of Bacillus?
MATERIALS AND METHODS Page 26 of 71
CHAPTER 3: MATERIALS AND METHODS
This chapter details the research approach and methods used to achieve the objectives stated
in Section 1.5. The selection of Bacillus sp; the cultivation of B. licheniformis in shake flasks
using a nutrient medium and adaptation to a chemically defined medium; the preliminary waste
characterisation; as well as proof of concept and the conditions used in the batch bioreactor
studies are presented.
3.1 Selection of Bacillus and cultivation of species
In the selection process for a Bacillus species, the following selection criteria were used:
• A well-characterised microorganism was preferred.
• The focus was on the biosynthesis of PGA in L-glutamic acid independent organisms, able
to produce PGA, and used as an alternative nitrogen source to glutamate, as glutamate is
costly.
B. licheniformis JCM 2505 was selected based on the criteria above. Madonsela (2013)
demonstrated that this strain was able to produce PGA without glutamate as a nitrogen source,
using a two-level Plackett–Burman factorial design to assess the impact of C:N:P ratios. The
medium was optimised from ME to MME by determining the ideal proportions needed to
facilitate growth and PGA production. The strain was originally obtained from Riken, the
Japanese research institute.
3.1.1 Cultivation of B. licheniformis JCM2505 on nutrient-rich medium
A glycerol stock containing B. licheniformis JCM 2505, stored at −50 °C, was obtained from
the CeBER master stock culture collection. An aliquot of this stock was suspended in a sterile
tryptone-soy medium (30 g/L tryptone soy in deionised water) and incubated for 24 h at 150
rpm on an orbital shaker (MRC) in a constant temperature room set at 37 °C. The culture was
then streak-plated onto sterile tryptone-soy agar (30 g/L tryptone soy, 15 g/L bacteriological
agar in deionised water) and incubated at 37 °C for 24 h, as shown in Figure 3-1. For pre-
inoculum preparation, a single colony was scraped off the agar and transferred to a 250 mL
flask containing 50 mL sterile tryptone-soy medium. This was incubated with agitation at 150
rpm for 24 h. An aliquot of the pre-inoculum was transferred to a 500 mL shaking flask
containing 100 mL sterile tryptone-soy medium to achieve an optical density (OD) of 0.1. The
value of 0.1 is a standardised concentration. With all experimental data starting at an OD of
0.1, data analysis is uncomplicated as it is easier to compare reproducible data sets under
different conditions. Furthermore, the addition of a more concentrated culture will shorten the
exponential phase, depleting the nutrients in a shorter space of time and giving insufficient
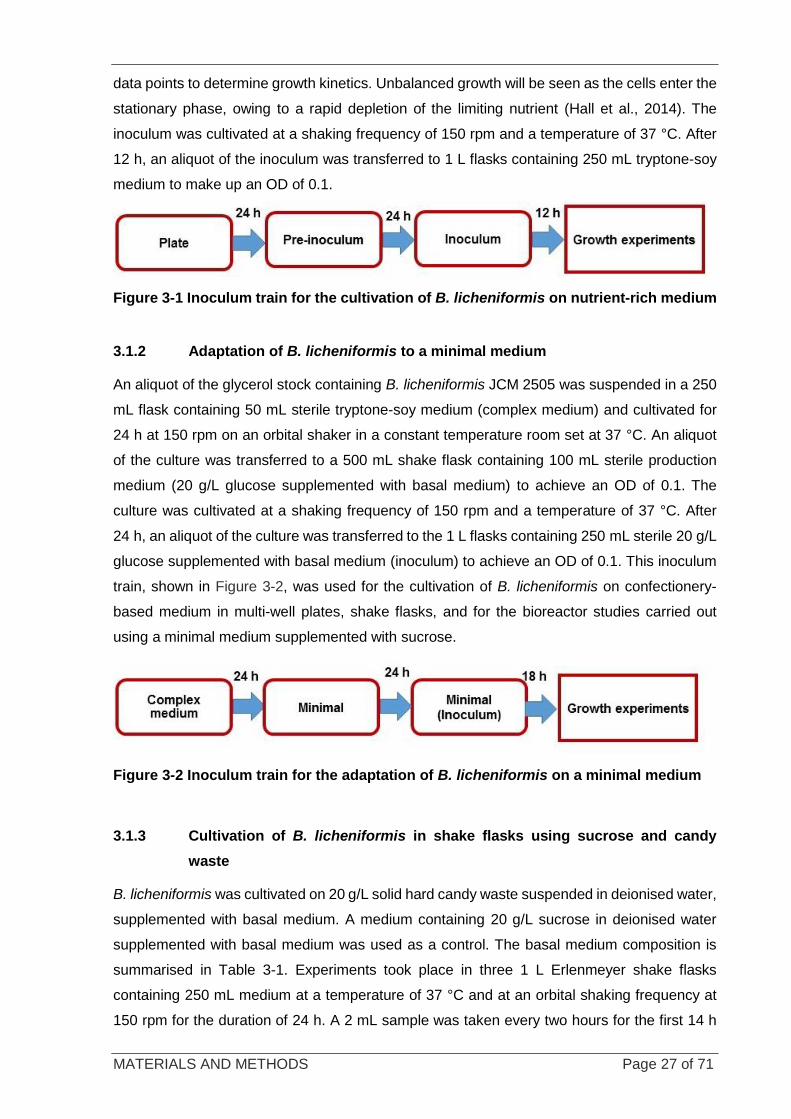
MATERIALS AND METHODS Page 27 of 71
data points to determine growth kinetics. Unbalanced growth will be seen as the cells enter the
stationary phase, owing to a rapid depletion of the limiting nutrient (Hall et al., 2014). The
inoculum was cultivated at a shaking frequency of 150 rpm and a temperature of 37 °C. After
12 h, an aliquot of the inoculum was transferred to 1 L flasks containing 250 mL tryptone-soy
medium to make up an OD of 0.1.
Figure 3-1 Inoculum train for the cultivation of B. licheniformis on nutrient-rich medium
3.1.2 Adaptation of B. licheniformis to a minimal medium
An aliquot of the glycerol stock containing B. licheniformis JCM 2505 was suspended in a 250
mL flask containing 50 mL sterile tryptone-soy medium (complex medium) and cultivated for
24 h at 150 rpm on an orbital shaker in a constant temperature room set at 37 °C. An aliquot
of the culture was transferred to a 500 mL shake flask containing 100 mL sterile production
medium (20 g/L glucose supplemented with basal medium) to achieve an OD of 0.1. The
culture was cultivated at a shaking frequency of 150 rpm and a temperature of 37 °C. After
24 h, an aliquot of the culture was transferred to the 1 L flasks containing 250 mL sterile 20 g/L
glucose supplemented with basal medium (inoculum) to achieve an OD of 0.1. This inoculum
train, shown in Figure 3-2, was used for the cultivation of B. licheniformis on confectionery-
based medium in multi-well plates, shake flasks, and for the bioreactor studies carried out
using a minimal medium supplemented with sucrose.
Figure 3-2 Inoculum train for the adaptation of B. licheniformis on a minimal medium
3.1.3 Cultivation of B. licheniformis in shake flasks using sucrose and candy
waste
B. licheniformis was cultivated on 20 g/L solid hard candy waste suspended in deionised water,
supplemented with basal medium. A medium containing 20 g/L sucrose in deionised water
supplemented with basal medium was used as a control. The basal medium composition is
summarised in Table 3-1. Experiments took place in three 1 L Erlenmeyer shake flasks
containing 250 mL medium at a temperature of 37 °C and at an orbital shaking frequency at
150 rpm for the duration of 24 h. A 2 mL sample was taken every two hours for the first 14 h
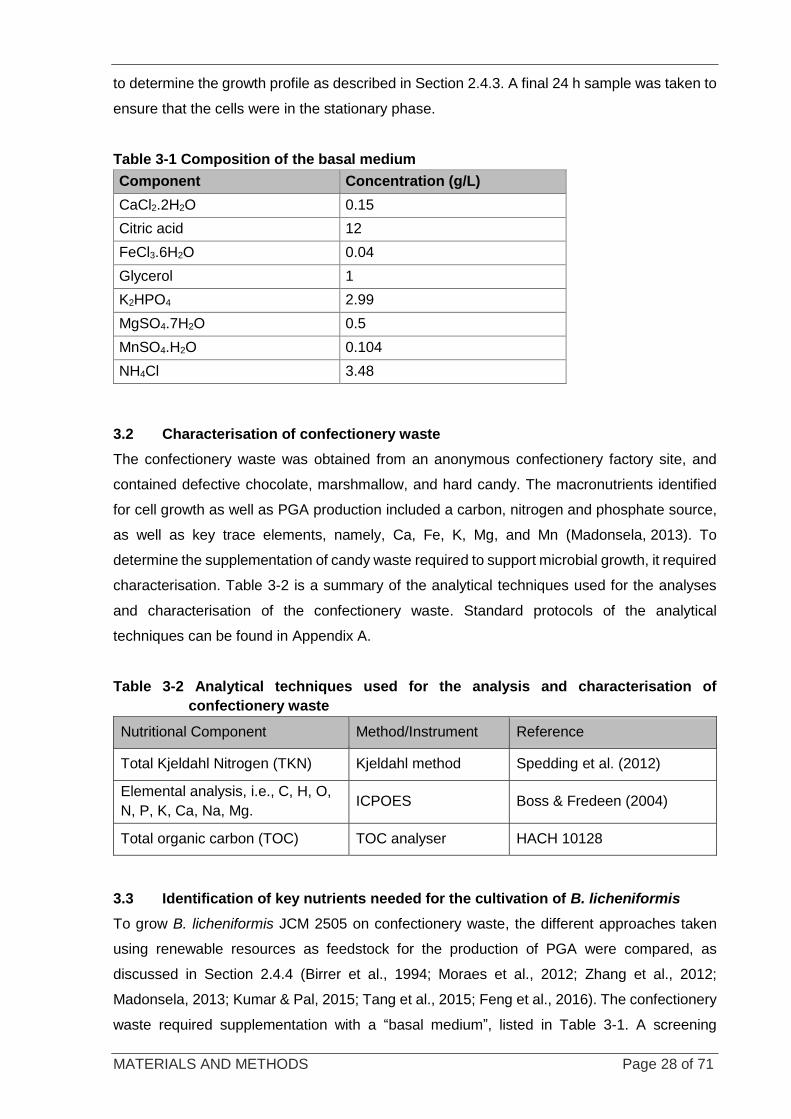
MATERIALS AND METHODS Page 28 of 71
to determine the growth profile as described in Section 2.4.3. A final 24 h sample was taken to
ensure that the cells were in the stationary phase.
Table 3-1 Composition of the basal medium
Component Concentration (g/L)
CaCl2.2H2O 0.15
Citric acid 12
FeCl3.6H2O 0.04
Glycerol 1
K2HPO4 2.99
MgSO4.7H2O 0.5
MnSO4.H2O 0.104
NH4Cl 3.48
3.2 Characterisation of confectionery waste
The confectionery waste was obtained from an anonymous confectionery factory site, and
contained defective chocolate, marshmallow, and hard candy. The macronutrients identified
for cell growth as well as PGA production included a carbon, nitrogen and phosphate source,
as well as key trace elements, namely, Ca, Fe, K, Mg, and Mn (Madonsela, 2013). To
determine the supplementation of candy waste required to support microbial growth, it required
characterisation. Table 3-2 is a summary of the analytical techniques used for the analyses
and characterisation of the confectionery waste. Standard protocols of the analytical
techniques can be found in Appendix A.
Table 3-2 Analytical techniques used for the analysis and characterisation of
confectionery waste
Nutritional Component Method/Instrument Reference
Total Kjeldahl Nitrogen (TKN) Kjeldahl method Spedding et al. (2012)
Elemental analysis, i.e., C, H, O,
N, P, K, Ca, Na, Mg. ICPOES Boss & Fredeen (2004)
Total organic carbon (TOC) TOC analyser HACH 10128
3.3 Identification of key nutrients needed for the cultivation of B. licheniformis
To grow B. licheniformis JCM 2505 on confectionery waste, the different approaches taken
using renewable resources as feedstock for the production of PGA were compared, as
discussed in Section 2.4.4 (Birrer et al., 1994; Moraes et al., 2012; Zhang et al., 2012;
Madonsela, 2013; Kumar & Pal, 2015; Tang et al., 2015; Feng et al., 2016). The confectionery
waste required supplementation with a “basal medium”, listed in Table 3-1. A screening
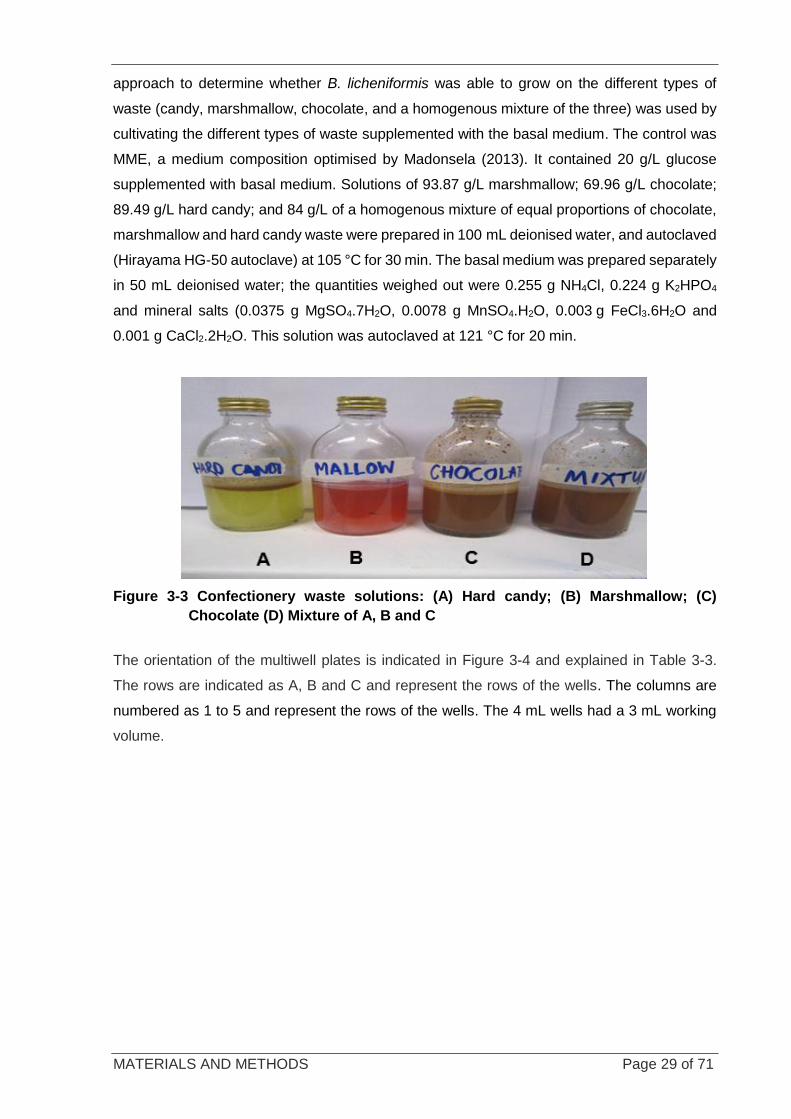
MATERIALS AND METHODS Page 29 of 71
approach to determine whether B. licheniformis was able to grow on the different types of
waste (candy, marshmallow, chocolate, and a homogenous mixture of the three) was used by
cultivating the different types of waste supplemented with the basal medium. The control was
MME, a medium composition optimised by Madonsela (2013). It contained 20 g/L glucose
supplemented with basal medium. Solutions of 93.87 g/L marshmallow; 69.96 g/L chocolate;
89.49 g/L hard candy; and 84 g/L of a homogenous mixture of equal proportions of chocolate,
marshmallow and hard candy waste were prepared in 100 mL deionised water, and autoclaved
(Hirayama HG-50 autoclave) at 105 °C for 30 min. The basal medium was prepared separately
in 50 mL deionised water; the quantities weighed out were 0.255 g NH4Cl, 0.224 g K2HPO4
and mineral salts (0.0375 g MgSO4.7H2O, 0.0078 g MnSO4.H2O, 0.003 g FeCl3.6H2O and
0.001 g CaCl2.2H2O. This solution was autoclaved at 121 °C for 20 min.
Figure 3-3 Confectionery waste solutions: (A) Hard candy; (B) Marshmallow; (C)
Chocolate (D) Mixture of A, B and C
The orientation of the multiwell plates is indicated in Figure 3-4 and explained in Table 3-3.
The rows are indicated as A, B and C and represent the rows of the wells. The columns are
numbered as 1 to 5 and represent the rows of the wells. The 4 mL wells had a 3 mL working
volume.
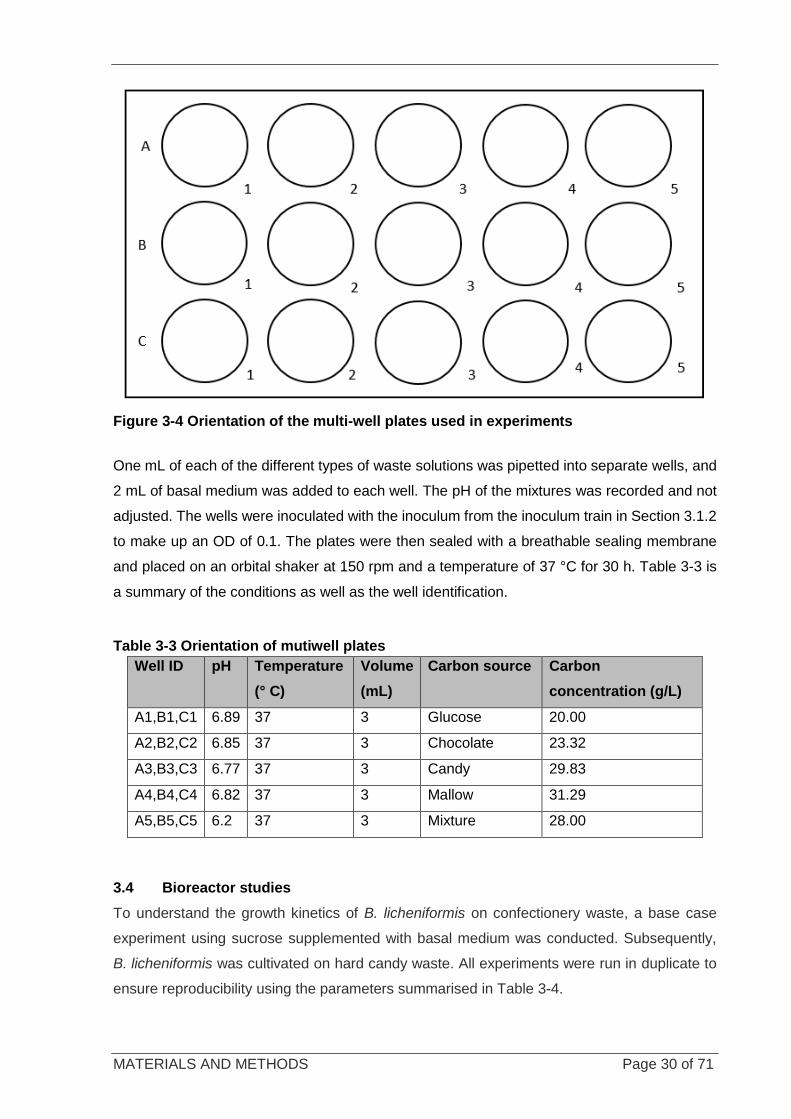
MATERIALS AND METHODS Page 30 of 71
Figure 3-4 Orientation of the multi-well plates used in experiments
One mL of each of the different types of waste solutions was pipetted into separate wells, and
2 mL of basal medium was added to each well. The pH of the mixtures was recorded and not
adjusted. The wells were inoculated with the inoculum from the inoculum train in Section 3.1.2
to make up an OD of 0.1. The plates were then sealed with a breathable sealing membrane
and placed on an orbital shaker at 150 rpm and a temperature of 37 °C for 30 h. Table 3-3 is
a summary of the conditions as well as the well identification.
Table 3-3 Orientation of mutiwell plates
Well ID pH Temperature
(° C)
Volume
(mL)
Carbon source Carbon
concentration (g/L)
A1,B1,C1 6.89 37 3 Glucose 20.00
A2,B2,C2 6.85 37 3 Chocolate 23.32
A3,B3,C3 6.77 37 3 Candy 29.83
A4,B4,C4 6.82 37 3 Mallow 31.29
A5,B5,C5 6.2 37 3 Mixture 28.00
3.4 Bioreactor studies
To understand the growth kinetics of B. licheniformis on confectionery waste, a base case
experiment using sucrose supplemented with basal medium was conducted. Subsequently,
B. licheniformis was cultivated on hard candy waste. All experiments were run in duplicate to
ensure reproducibility using the parameters summarised in Table 3-4.
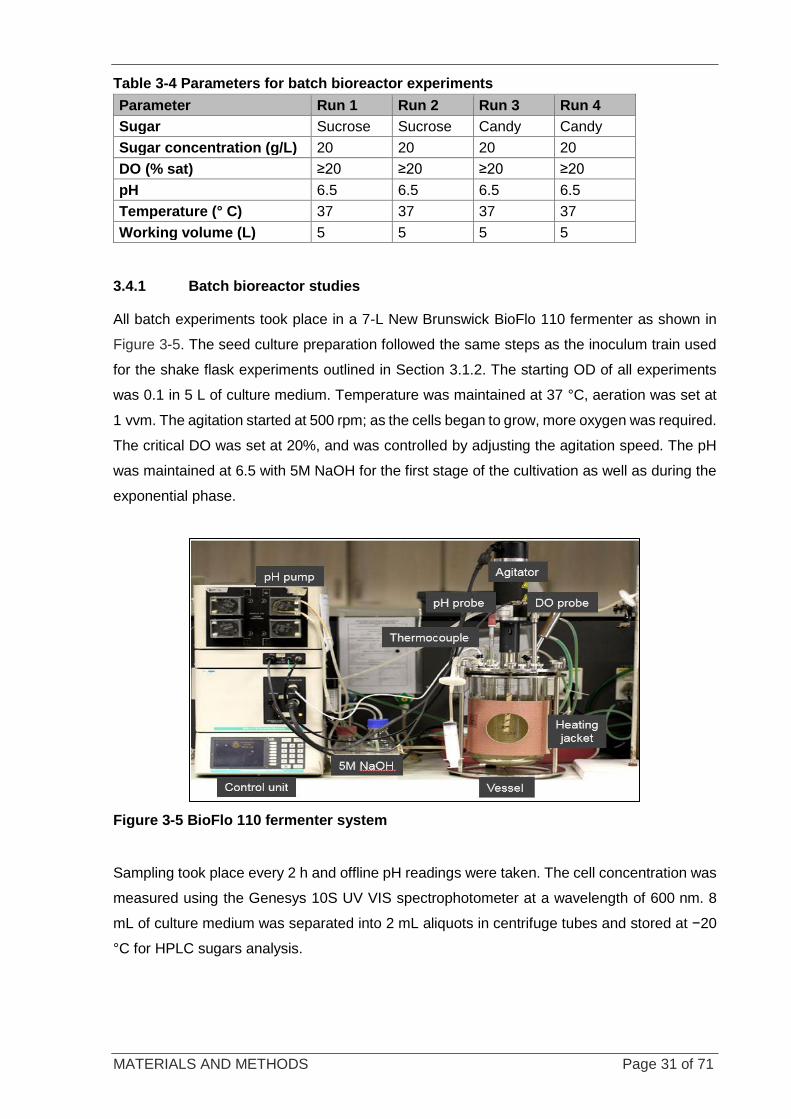
MATERIALS AND METHODS Page 31 of 71
Table 3-4 Parameters for batch bioreactor experiments
Parameter Run 1 Run 2 Run 3 Run 4
Sugar Sucrose Sucrose Candy Candy
Sugar concentration (g/L) 20 20 20 20
DO (% sat) ≥20 ≥20 ≥20 ≥20
pH 6.5 6.5 6.5 6.5
Temperature (° C) 37 37 37 37
Working volume (L) 5 5 5 5
3.4.1 Batch bioreactor studies
All batch experiments took place in a 7-L New Brunswick BioFlo 110 fermenter as shown in
Figure 3-5. The seed culture preparation followed the same steps as the inoculum train used
for the shake flask experiments outlined in Section 3.1.2. The starting OD of all experiments
was 0.1 in 5 L of culture medium. Temperature was maintained at 37 °C, aeration was set at
1 vvm. The agitation started at 500 rpm; as the cells began to grow, more oxygen was required.
The critical DO was set at 20%, and was controlled by adjusting the agitation speed. The pH
was maintained at 6.5 with 5M NaOH for the first stage of the cultivation as well as during the
exponential phase.
Figure 3-5 BioFlo 110 fermenter system
Sampling took place every 2 h and offline pH readings were taken. The cell concentration was
measured using the Genesys 10S UV VIS spectrophotometer at a wavelength of 600 nm. 8
mL of culture medium was separated into 2 mL aliquots in centrifuge tubes and stored at −20
°C for HPLC sugars analysis.
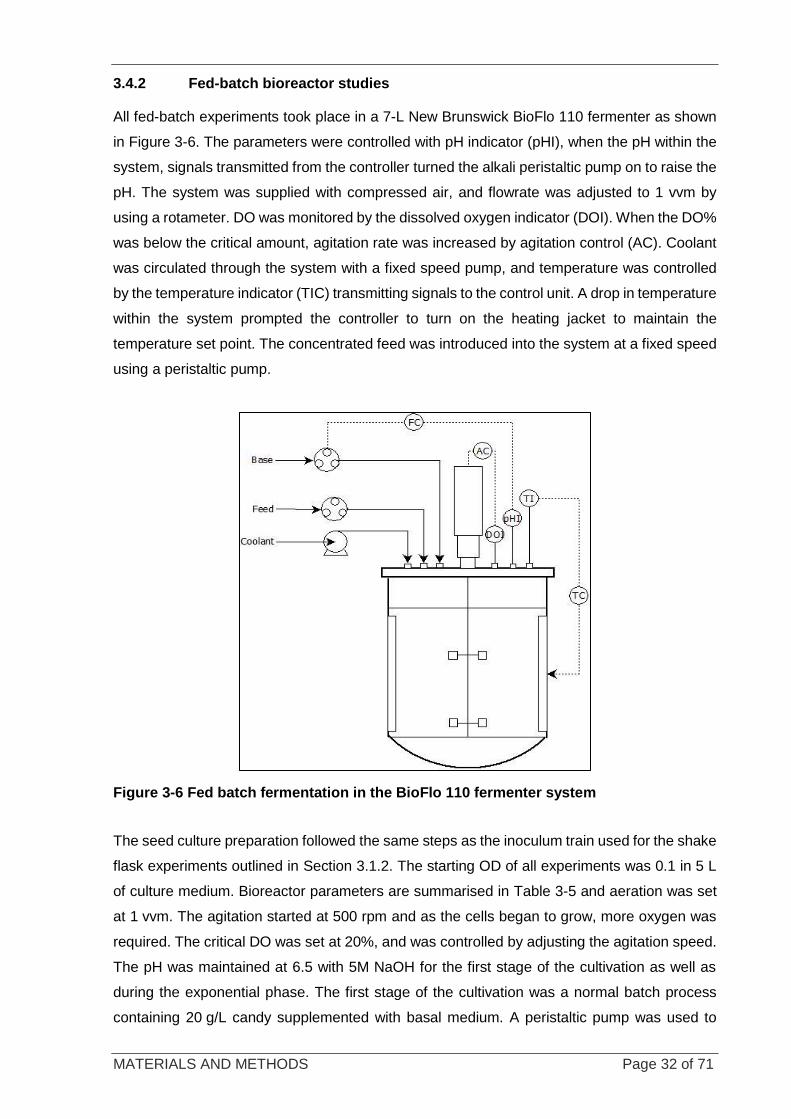
MATERIALS AND METHODS Page 32 of 71
3.4.2 Fed-batch bioreactor studies
All fed-batch experiments took place in a 7-L New Brunswick BioFlo 110 fermenter as shown
in Figure 3-6. The parameters were controlled with pH indicator (pHI), when the pH within the
system, signals transmitted from the controller turned the alkali peristaltic pump on to raise the
pH. The system was supplied with compressed air, and flowrate was adjusted to 1 vvm by
using a rotameter. DO was monitored by the dissolved oxygen indicator (DOI). When the DO%
was below the critical amount, agitation rate was increased by agitation control (AC). Coolant
was circulated through the system with a fixed speed pump, and temperature was controlled
by the temperature indicator (TIC) transmitting signals to the control unit. A drop in temperature
within the system prompted the controller to turn on the heating jacket to maintain the
temperature set point. The concentrated feed was introduced into the system at a fixed speed
using a peristaltic pump.
Figure 3-6 Fed batch fermentation in the BioFlo 110 fermenter system
The seed culture preparation followed the same steps as the inoculum train used for the shake
flask experiments outlined in Section 3.1.2. The starting OD of all experiments was 0.1 in 5 L
of culture medium. Bioreactor parameters are summarised in Table 3-5 and aeration was set
at 1 vvm. The agitation started at 500 rpm and as the cells began to grow, more oxygen was
required. The critical DO was set at 20%, and was controlled by adjusting the agitation speed.
The pH was maintained at 6.5 with 5M NaOH for the first stage of the cultivation as well as
during the exponential phase. The first stage of the cultivation was a normal batch process
containing 20 g/L candy supplemented with basal medium. A peristaltic pump was used to
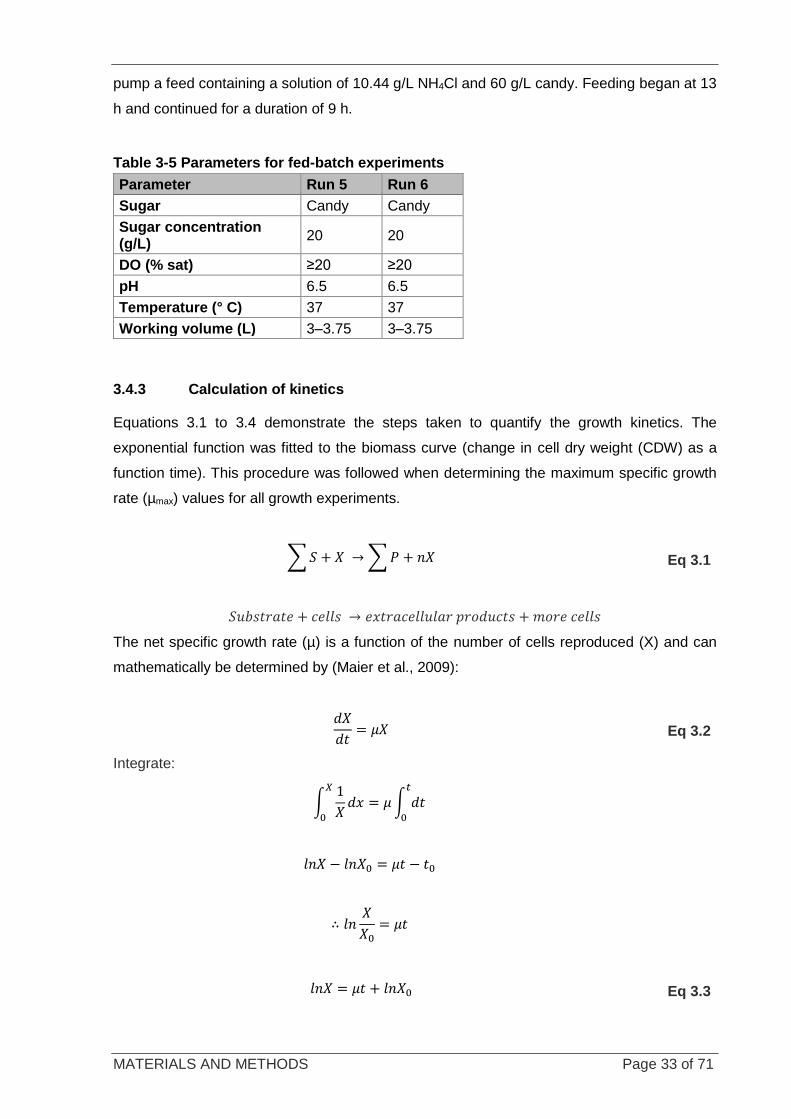
MATERIALS AND METHODS Page 33 of 71
pump a feed containing a solution of 10.44 g/L NH4Cl and 60 g/L candy. Feeding began at 13
h and continued for a duration of 9 h.
Table 3-5 Parameters for fed-batch experiments
Parameter Run 5 Run 6
Sugar Candy Candy
Sugar concentration (g/L)
20 20
DO (% sat) ≥20 ≥20
pH 6.5 6.5
Temperature (° C) 37 37
Working volume (L) 3–3.75 3–3.75
3.4.3 Calculation of kinetics
Equations 3.1 to 3.4 demonstrate the steps taken to quantify the growth kinetics. The
exponential function was fitted to the biomass curve (change in cell dry weight (CDW) as a
function time). This procedure was followed when determining the maximum specific growth
rate (µmax) values for all growth experiments.
∑ 𝑆 + 𝑋 → ∑ 𝑃 + 𝑛𝑋 Eq 3.1
𝑆𝑢𝑏𝑠𝑡𝑟𝑎𝑡𝑒 + 𝑐𝑒𝑙𝑙𝑠 → 𝑒𝑥𝑡𝑟𝑎𝑐𝑒𝑙𝑙𝑢𝑙𝑎𝑟 𝑝𝑟𝑜𝑑𝑢𝑐𝑡𝑠 + 𝑚𝑜𝑟𝑒 𝑐𝑒𝑙𝑙𝑠
The net specific growth rate (µ) is a function of the number of cells reproduced (X) and can
mathematically be determined by (Maier et al., 2009):
𝑑𝑋
𝑑𝑡= 𝜇𝑋 Eq 3.2
Integrate:
∫1
𝑋
𝑋
0
𝑑𝑥 = 𝜇 ∫ 𝑑𝑡𝑡
0
𝑙𝑛𝑋 − 𝑙𝑛𝑋0 = 𝜇𝑡 − 𝑡0
∴ 𝑙𝑛𝑋
𝑋0= 𝜇𝑡
𝑙𝑛𝑋 = 𝜇𝑡 + 𝑙𝑛𝑋0 Eq 3.3
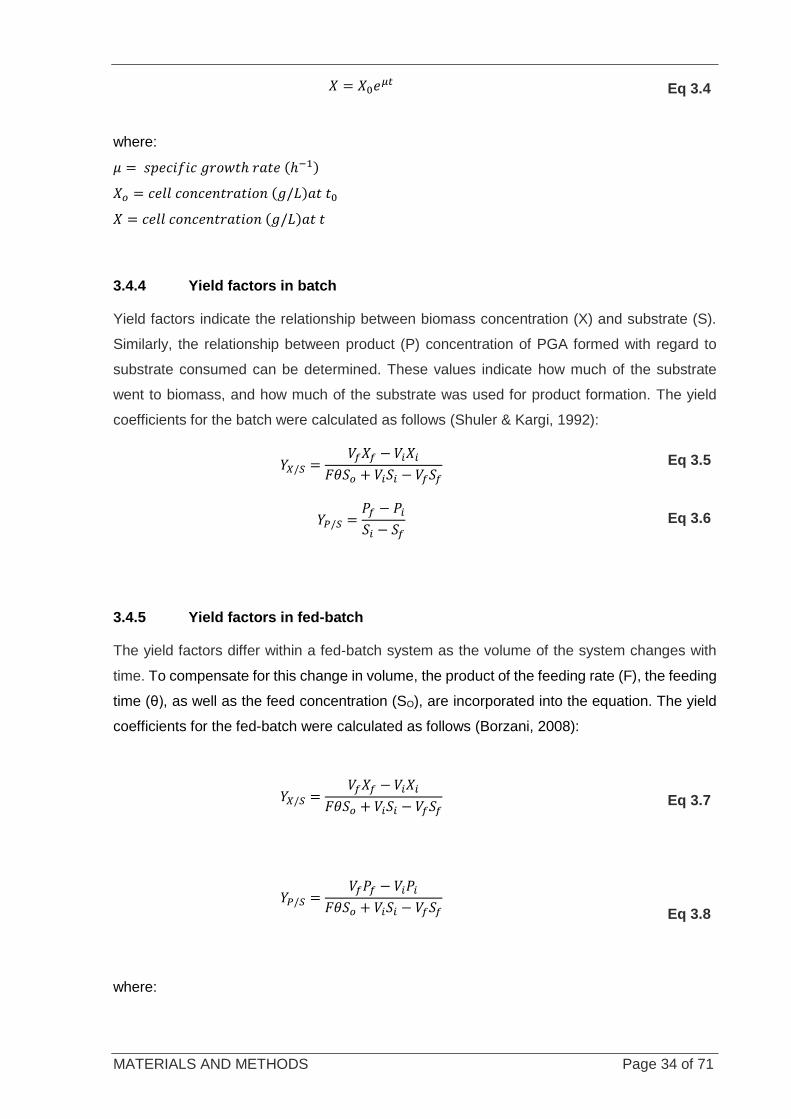
MATERIALS AND METHODS Page 34 of 71
𝑋 = 𝑋0𝑒𝜇𝑡 Eq 3.4
where:
𝜇 = 𝑠𝑝𝑒𝑐𝑖𝑓𝑖𝑐 𝑔𝑟𝑜𝑤𝑡ℎ 𝑟𝑎𝑡𝑒 (ℎ−1)
𝑋𝑜 = 𝑐𝑒𝑙𝑙 𝑐𝑜𝑛𝑐𝑒𝑛𝑡𝑟𝑎𝑡𝑖𝑜𝑛 (𝑔/𝐿)𝑎𝑡 𝑡0
𝑋 = 𝑐𝑒𝑙𝑙 𝑐𝑜𝑛𝑐𝑒𝑛𝑡𝑟𝑎𝑡𝑖𝑜𝑛 (𝑔/𝐿)𝑎𝑡 𝑡
3.4.4 Yield factors in batch
Yield factors indicate the relationship between biomass concentration (X) and substrate (S).
Similarly, the relationship between product (P) concentration of PGA formed with regard to
substrate consumed can be determined. These values indicate how much of the substrate
went to biomass, and how much of the substrate was used for product formation. The yield
coefficients for the batch were calculated as follows (Shuler & Kargi, 1992):
𝑌𝑋/𝑆 =𝑉𝑓𝑋𝑓 − 𝑉𝑖𝑋𝑖
𝐹𝜃𝑆𝑜 + 𝑉𝑖𝑆𝑖 − 𝑉𝑓𝑆𝑓
𝑌𝑃/𝑆 =𝑃𝑓 − 𝑃𝑖
𝑆𝑖 − 𝑆𝑓
Eq 3.5
Eq 3.6
3.4.5 Yield factors in fed-batch
The yield factors differ within a fed-batch system as the volume of the system changes with
time. To compensate for this change in volume, the product of the feeding rate (F), the feeding
time (θ), as well as the feed concentration (SO), are incorporated into the equation. The yield
coefficients for the fed-batch were calculated as follows (Borzani, 2008):
𝑌𝑋/𝑆 =𝑉𝑓𝑋𝑓 − 𝑉𝑖𝑋𝑖
𝐹𝜃𝑆𝑜 + 𝑉𝑖𝑆𝑖 − 𝑉𝑓𝑆𝑓
Eq 3.7
𝑌𝑃/𝑆 =𝑉𝑓𝑃𝑓 − 𝑉𝑖𝑃𝑖
𝐹𝜃𝑆𝑜 + 𝑉𝑖𝑆𝑖 − 𝑉𝑓𝑆𝑓
Eq 3.8
where:
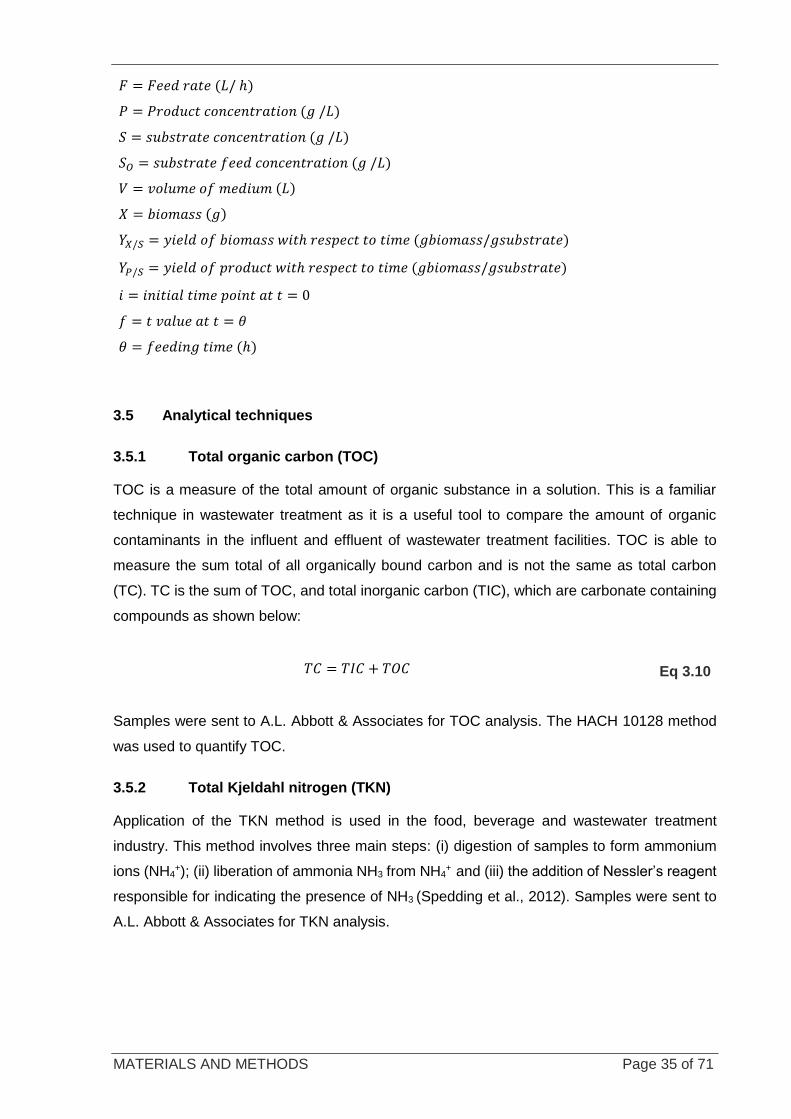
MATERIALS AND METHODS Page 35 of 71
𝐹 = 𝐹𝑒𝑒𝑑 𝑟𝑎𝑡𝑒 (𝐿/ ℎ)
𝑃 = 𝑃𝑟𝑜𝑑𝑢𝑐𝑡 𝑐𝑜𝑛𝑐𝑒𝑛𝑡𝑟𝑎𝑡𝑖𝑜𝑛 (𝑔 /𝐿)
𝑆 = 𝑠𝑢𝑏𝑠𝑡𝑟𝑎𝑡𝑒 𝑐𝑜𝑛𝑐𝑒𝑛𝑡𝑟𝑎𝑡𝑖𝑜𝑛 (𝑔 /𝐿)
𝑆𝑂 = 𝑠𝑢𝑏𝑠𝑡𝑟𝑎𝑡𝑒 𝑓𝑒𝑒𝑑 𝑐𝑜𝑛𝑐𝑒𝑛𝑡𝑟𝑎𝑡𝑖𝑜𝑛 (𝑔 /𝐿)
𝑉 = 𝑣𝑜𝑙𝑢𝑚𝑒 𝑜𝑓 𝑚𝑒𝑑𝑖𝑢𝑚 (𝐿)
𝑋 = 𝑏𝑖𝑜𝑚𝑎𝑠𝑠 (𝑔)
𝑌𝑋/𝑆 = 𝑦𝑖𝑒𝑙𝑑 𝑜𝑓 𝑏𝑖𝑜𝑚𝑎𝑠𝑠 𝑤𝑖𝑡ℎ 𝑟𝑒𝑠𝑝𝑒𝑐𝑡 𝑡𝑜 𝑡𝑖𝑚𝑒 (𝑔𝑏𝑖𝑜𝑚𝑎𝑠𝑠/𝑔𝑠𝑢𝑏𝑠𝑡𝑟𝑎𝑡𝑒)
𝑌𝑃/𝑆 = 𝑦𝑖𝑒𝑙𝑑 𝑜𝑓 𝑝𝑟𝑜𝑑𝑢𝑐𝑡 𝑤𝑖𝑡ℎ 𝑟𝑒𝑠𝑝𝑒𝑐𝑡 𝑡𝑜 𝑡𝑖𝑚𝑒 (𝑔𝑏𝑖𝑜𝑚𝑎𝑠𝑠/𝑔𝑠𝑢𝑏𝑠𝑡𝑟𝑎𝑡𝑒)
𝑖 = 𝑖𝑛𝑖𝑡𝑖𝑎𝑙 𝑡𝑖𝑚𝑒 𝑝𝑜𝑖𝑛𝑡 𝑎𝑡 𝑡 = 0
𝑓 = 𝑡 𝑣𝑎𝑙𝑢𝑒 𝑎𝑡 𝑡 = 𝜃
𝜃 = 𝑓𝑒𝑒𝑑𝑖𝑛𝑔 𝑡𝑖𝑚𝑒 (ℎ)
3.5 Analytical techniques
3.5.1 Total organic carbon (TOC)
TOC is a measure of the total amount of organic substance in a solution. This is a familiar
technique in wastewater treatment as it is a useful tool to compare the amount of organic
contaminants in the influent and effluent of wastewater treatment facilities. TOC is able to
measure the sum total of all organically bound carbon and is not the same as total carbon
(TC). TC is the sum of TOC, and total inorganic carbon (TIC), which are carbonate containing
compounds as shown below:
𝑇𝐶 = 𝑇𝐼𝐶 + 𝑇𝑂𝐶 Eq 3.10
Samples were sent to A.L. Abbott & Associates for TOC analysis. The HACH 10128 method
was used to quantify TOC.
3.5.2 Total Kjeldahl nitrogen (TKN)
Application of the TKN method is used in the food, beverage and wastewater treatment
industry. This method involves three main steps: (i) digestion of samples to form ammonium
ions (NH4+); (ii) liberation of ammonia NH3 from NH4
+ and (iii) the addition of Nessler’s reagent
responsible for indicating the presence of NH3 (Spedding et al., 2012). Samples were sent to
A.L. Abbott & Associates for TKN analysis.
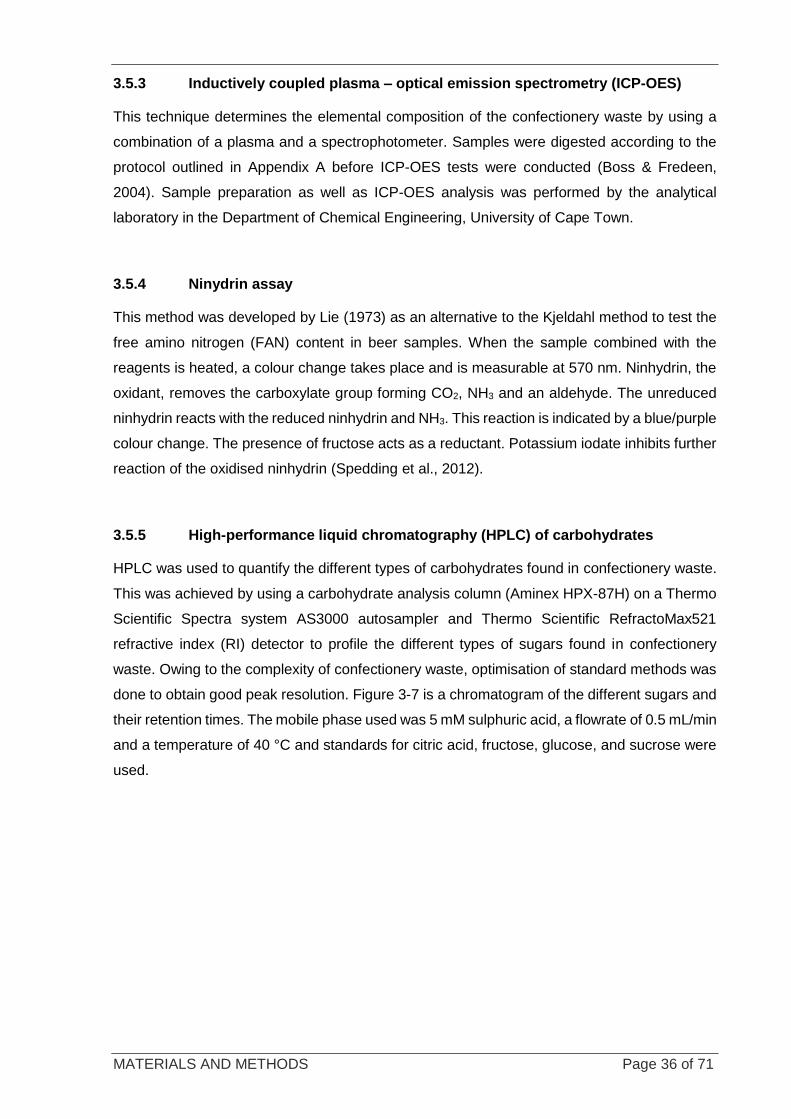
MATERIALS AND METHODS Page 36 of 71
3.5.3 Inductively coupled plasma – optical emission spectrometry (ICP-OES)
This technique determines the elemental composition of the confectionery waste by using a
combination of a plasma and a spectrophotometer. Samples were digested according to the
protocol outlined in Appendix A before ICP-OES tests were conducted (Boss & Fredeen,
2004). Sample preparation as well as ICP-OES analysis was performed by the analytical
laboratory in the Department of Chemical Engineering, University of Cape Town.
3.5.4 Ninydrin assay
This method was developed by Lie (1973) as an alternative to the Kjeldahl method to test the
free amino nitrogen (FAN) content in beer samples. When the sample combined with the
reagents is heated, a colour change takes place and is measurable at 570 nm. Ninhydrin, the
oxidant, removes the carboxylate group forming CO2, NH3 and an aldehyde. The unreduced
ninhydrin reacts with the reduced ninhydrin and NH3. This reaction is indicated by a blue/purple
colour change. The presence of fructose acts as a reductant. Potassium iodate inhibits further
reaction of the oxidised ninhydrin (Spedding et al., 2012).
3.5.5 High-performance liquid chromatography (HPLC) of carbohydrates
HPLC was used to quantify the different types of carbohydrates found in confectionery waste.
This was achieved by using a carbohydrate analysis column (Aminex HPX-87H) on a Thermo
Scientific Spectra system AS3000 autosampler and Thermo Scientific RefractoMax521
refractive index (RI) detector to profile the different types of sugars found in confectionery
waste. Owing to the complexity of confectionery waste, optimisation of standard methods was
done to obtain good peak resolution. Figure 3-7 is a chromatogram of the different sugars and
their retention times. The mobile phase used was 5 mM sulphuric acid, a flowrate of 0.5 mL/min
and a temperature of 40 °C and standards for citric acid, fructose, glucose, and sucrose were
used.
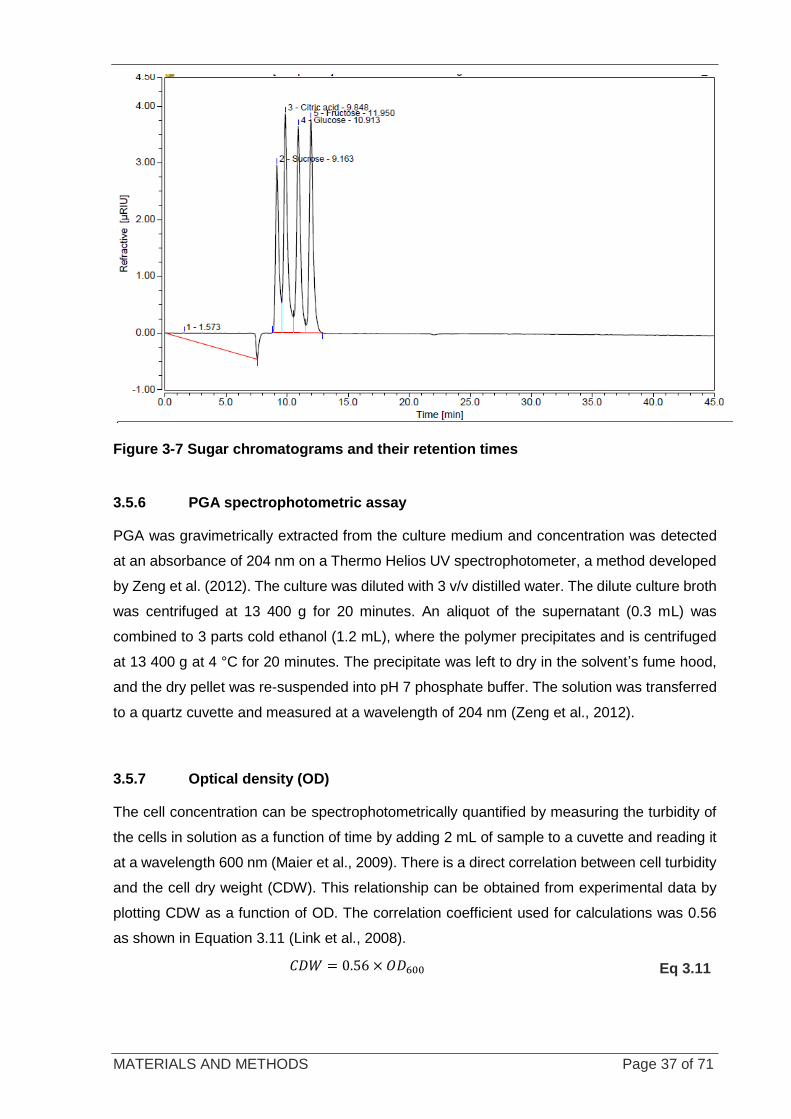
MATERIALS AND METHODS Page 37 of 71
Figure 3-7 Sugar chromatograms and their retention times
3.5.6 PGA spectrophotometric assay
PGA was gravimetrically extracted from the culture medium and concentration was detected
at an absorbance of 204 nm on a Thermo Helios UV spectrophotometer, a method developed
by Zeng et al. (2012). The culture was diluted with 3 v/v distilled water. The dilute culture broth
was centrifuged at 13 400 g for 20 minutes. An aliquot of the supernatant (0.3 mL) was
combined to 3 parts cold ethanol (1.2 mL), where the polymer precipitates and is centrifuged
at 13 400 g at 4 °C for 20 minutes. The precipitate was left to dry in the solvent’s fume hood,
and the dry pellet was re-suspended into pH 7 phosphate buffer. The solution was transferred
to a quartz cuvette and measured at a wavelength of 204 nm (Zeng et al., 2012).
3.5.7 Optical density (OD)
The cell concentration can be spectrophotometrically quantified by measuring the turbidity of
the cells in solution as a function of time by adding 2 mL of sample to a cuvette and reading it
at a wavelength 600 nm (Maier et al., 2009). There is a direct correlation between cell turbidity
and the cell dry weight (CDW). This relationship can be obtained from experimental data by
plotting CDW as a function of OD. The correlation coefficient used for calculations was 0.56
as shown in Equation 3.11 (Link et al., 2008).
𝐶𝐷𝑊 = 0.56 × 𝑂𝐷600 Eq 3.11
MATERIALS AND METHODS Page 38 of 71
3.5.8 Statistical analysis
Deviation between data sets was determined by using the standard deviation (Harvey,2011):
𝑆𝑡𝑎𝑛𝑑𝑎𝑟𝑑 𝑑𝑒𝑣𝑖𝑎𝑡𝑖𝑜𝑛 = √∑(𝑥 − �̅�)2
(𝑛 − 1)
where:
𝑛 = 𝑛𝑢𝑚𝑏𝑒𝑟 𝑜𝑓 𝑟𝑒𝑝𝑒𝑎𝑡𝑠
𝑥 = 𝑑𝑎𝑡𝑎 𝑝𝑜𝑖𝑛𝑡 𝑣𝑎𝑙𝑢𝑒
�̅� = 𝑚𝑒𝑎𝑛
Eq 3.12
The above analytical techniques were used to characterise the confectionery waste,
quantification of the product, and substrate concentration. The PGA analytical method was
used to profile product formation throughout the cultivations. These values were used to
determine the growth kinetics of B. licheniformis in the different growth experiments.
RESULTS AND DISCUSSION Page 39 of 71
CHAPTER 4: RESULTS AND DISCUSSION
4.1 Introduction
Microorganisms, including B. licheniformis, need a sufficient nutrient supply to ensure proper
cell function (Birrer et al., 1994; Moraes et al., 2012; Zhang et al., 2012; Madonsela, 2013;
Kumar & Pal, 2015; Tang et al., 2015; Feng et al., 2016). PGA production is growth associated.
The amino acid monomer is produced from intermediates of the TCA cycle; hence it needs a
supply of C6 sugars and NH4+ ions (Kongklom et al., 2015; Kongklom et al., 2017). This
chapter contains the results from the characterisation of confectionary waste and the
cultivation of B. licheniformis on a sucrose-based minimal medium as base case and on
confectionery waste supplemented with basal medium. The shake flask data in Section 4.4
was used to determine the growth behaviour of B. licheniformis in order to inform the operation
of the bioreactor system. Based on these findings, the pH was maintained at a pH of 6.5 as it
fluctuated during the different stages of growth. The stirred tank bioreactor system was
selected as it was able to control parameters at the optimum determined for growth and
provided enhanced oxygen transfer to ensure that the cells within the system were not deprived
of oxygen.
4.2 Characterisation of confectionery waste
The confectionery waste was characterised in terms of trace elements, sugars and free amino
nitrogen. Confectionery waste is known to contain a large proportion carbohydrates (Bussiere
& Serpelloni, 1985), and acidulents (Sortwell, 2004) which can form the carbon source for the
cultivation of B. licheniformis. Confectionery waste was characterised to determine whether
supplementation with nutrients was required. The characterisation of confectionery waste was
conducted using the analyses found in Table 3-2.The aim was to quantify the nutrients in the
waste and compare these with the nutrients needed for PGA production, such as free amino
nitrogen, fermentable sugars, and trace elements, identified in Section 2.4.4
The N, TOC and trace element results obtained for confectionery waste are tabulated in Table
4-1. The results show that chocolate, marshmallow and hard candy waste consisted largely of
total organic carbon (TOC). According to Madonsela (2013), the required C:N ratio (based on
the composition of MME) was calculated to be 14:1 (calculations can be found in Appendix B).
The chocolate waste contained the most TKN, the most N at 0.5% on a mass basis. However,
the concentrations were too low to be used as a nitrogen source as the requirement of 1.1 g
of NH3 was needed for PGA production. The C:N ratios of chocolate, marshmallow and hard
candy were calculated and are presented in Table 4-1. Hard candy had the highest C:N ratio
of 400:1. This high value indicated that the waste consisted mostly of carbon with little to no
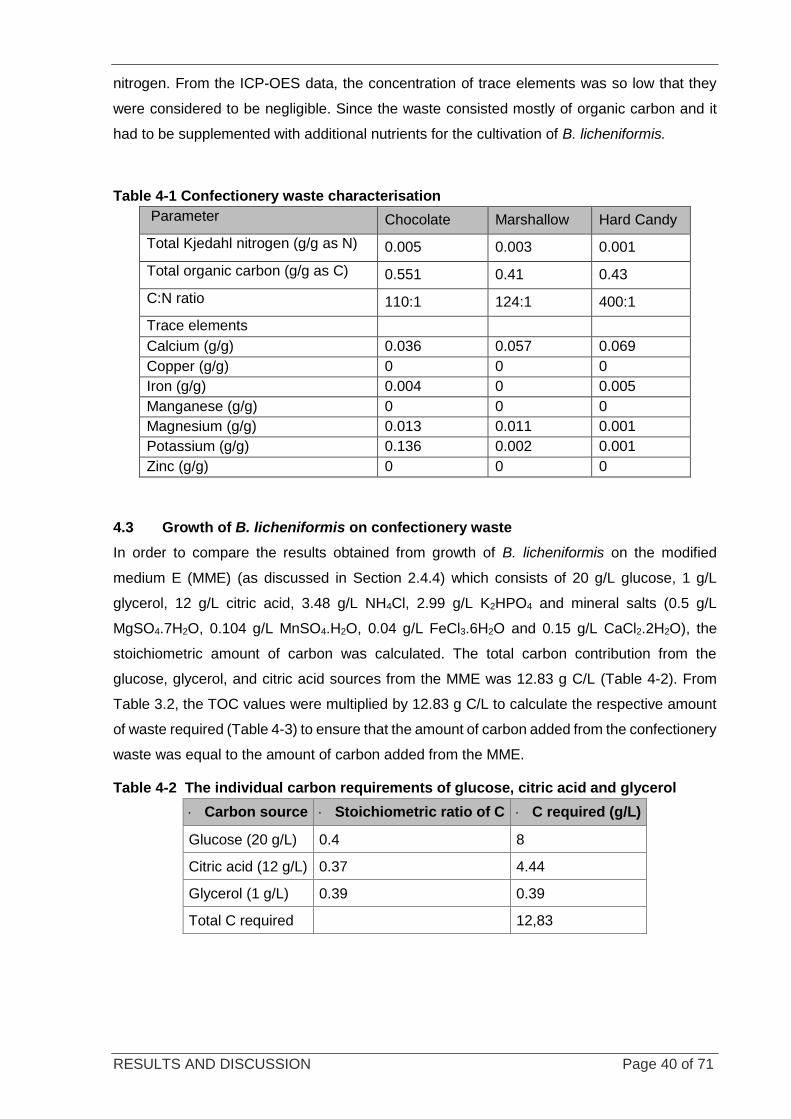
RESULTS AND DISCUSSION Page 40 of 71
nitrogen. From the ICP-OES data, the concentration of trace elements was so low that they
were considered to be negligible. Since the waste consisted mostly of organic carbon and it
had to be supplemented with additional nutrients for the cultivation of B. licheniformis.
Table 4-1 Confectionery waste characterisation
Parameter Chocolate Marshallow Hard Candy
Total Kjedahl nitrogen (g/g as N) 0.005 0.003 0.001
Total organic carbon (g/g as C) 0.551 0.41 0.43
C:N ratio 110:1 124:1 400:1
Trace elements
Calcium (g/g) 0.036 0.057 0.069
Copper (g/g) 0 0 0
Iron (g/g) 0.004 0 0.005
Manganese (g/g) 0 0 0
Magnesium (g/g) 0.013 0.011 0.001
Potassium (g/g) 0.136 0.002 0.001
Zinc (g/g) 0 0 0
4.3 Growth of B. licheniformis on confectionery waste
In order to compare the results obtained from growth of B. licheniformis on the modified
medium E (MME) (as discussed in Section 2.4.4) which consists of 20 g/L glucose, 1 g/L
glycerol, 12 g/L citric acid, 3.48 g/L NH4Cl, 2.99 g/L K2HPO4 and mineral salts (0.5 g/L
MgSO4.7H2O, 0.104 g/L MnSO4.H2O, 0.04 g/L FeCl3.6H2O and 0.15 g/L CaCl2.2H2O), the
stoichiometric amount of carbon was calculated. The total carbon contribution from the
glucose, glycerol, and citric acid sources from the MME was 12.83 g C/L (Table 4-2). From
Table 3.2, the TOC values were multiplied by 12.83 g C/L to calculate the respective amount
of waste required (Table 4-3) to ensure that the amount of carbon added from the confectionery
waste was equal to the amount of carbon added from the MME.
Table 4-2 The individual carbon requirements of glucose, citric acid and glycerol
Carbon source Stoichiometric ratio of C C required (g/L)
Glucose (20 g/L) 0.4 8
Citric acid (12 g/L) 0.37 4.44
Glycerol (1 g/L) 0.39 0.39
Total C required 12,83
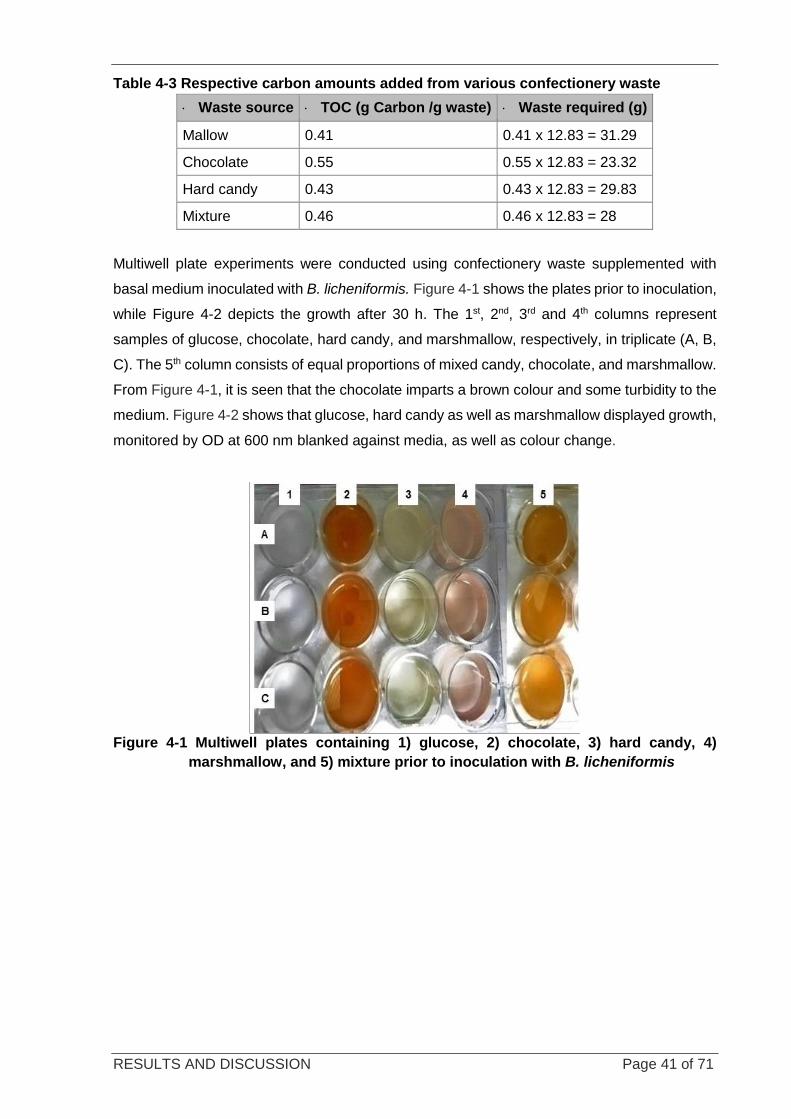
RESULTS AND DISCUSSION Page 41 of 71
Table 4-3 Respective carbon amounts added from various confectionery waste
Waste source TOC (g Carbon /g waste) Waste required (g)
Mallow 0.41 0.41 x 12.83 = 31.29
Chocolate 0.55 0.55 x 12.83 = 23.32
Hard candy 0.43 0.43 x 12.83 = 29.83
Mixture 0.46 0.46 x 12.83 = 28
Multiwell plate experiments were conducted using confectionery waste supplemented with
basal medium inoculated with B. licheniformis. Figure 4-1 shows the plates prior to inoculation,
while Figure 4-2 depicts the growth after 30 h. The 1st, 2nd, 3rd and 4th columns represent
samples of glucose, chocolate, hard candy, and marshmallow, respectively, in triplicate (A, B,
C). The 5th column consists of equal proportions of mixed candy, chocolate, and marshmallow.
From Figure 4-1, it is seen that the chocolate imparts a brown colour and some turbidity to the
medium. Figure 4-2 shows that glucose, hard candy as well as marshmallow displayed growth,
monitored by OD at 600 nm blanked against media, as well as colour change.
Figure 4-1 Multiwell plates containing 1) glucose, 2) chocolate, 3) hard candy, 4)
marshmallow, and 5) mixture prior to inoculation with B. licheniformis
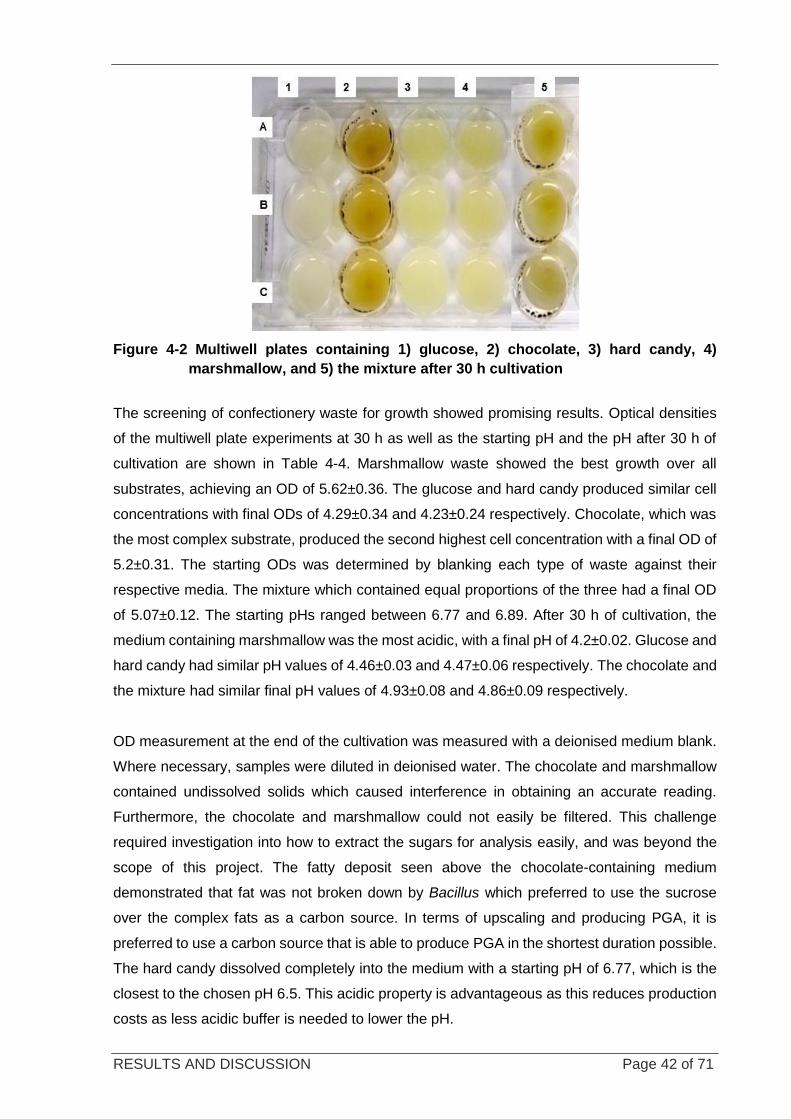
RESULTS AND DISCUSSION Page 42 of 71
Figure 4-2 Multiwell plates containing 1) glucose, 2) chocolate, 3) hard candy, 4)
marshmallow, and 5) the mixture after 30 h cultivation
The screening of confectionery waste for growth showed promising results. Optical densities
of the multiwell plate experiments at 30 h as well as the starting pH and the pH after 30 h of
cultivation are shown in Table 4-4. Marshmallow waste showed the best growth over all
substrates, achieving an OD of 5.62±0.36. The glucose and hard candy produced similar cell
concentrations with final ODs of 4.29±0.34 and 4.23±0.24 respectively. Chocolate, which was
the most complex substrate, produced the second highest cell concentration with a final OD of
5.2±0.31. The starting ODs was determined by blanking each type of waste against their
respective media. The mixture which contained equal proportions of the three had a final OD
of 5.07±0.12. The starting pHs ranged between 6.77 and 6.89. After 30 h of cultivation, the
medium containing marshmallow was the most acidic, with a final pH of 4.2±0.02. Glucose and
hard candy had similar pH values of 4.46±0.03 and 4.47±0.06 respectively. The chocolate and
the mixture had similar final pH values of 4.93±0.08 and 4.86±0.09 respectively.
OD measurement at the end of the cultivation was measured with a deionised medium blank.
Where necessary, samples were diluted in deionised water. The chocolate and marshmallow
contained undissolved solids which caused interference in obtaining an accurate reading.
Furthermore, the chocolate and marshmallow could not easily be filtered. This challenge
required investigation into how to extract the sugars for analysis easily, and was beyond the
scope of this project. The fatty deposit seen above the chocolate-containing medium
demonstrated that fat was not broken down by Bacillus which preferred to use the sucrose
over the complex fats as a carbon source. In terms of upscaling and producing PGA, it is
preferred to use a carbon source that is able to produce PGA in the shortest duration possible.
The hard candy dissolved completely into the medium with a starting pH of 6.77, which is the
closest to the chosen pH 6.5. This acidic property is advantageous as this reduces production
costs as less acidic buffer is needed to lower the pH.
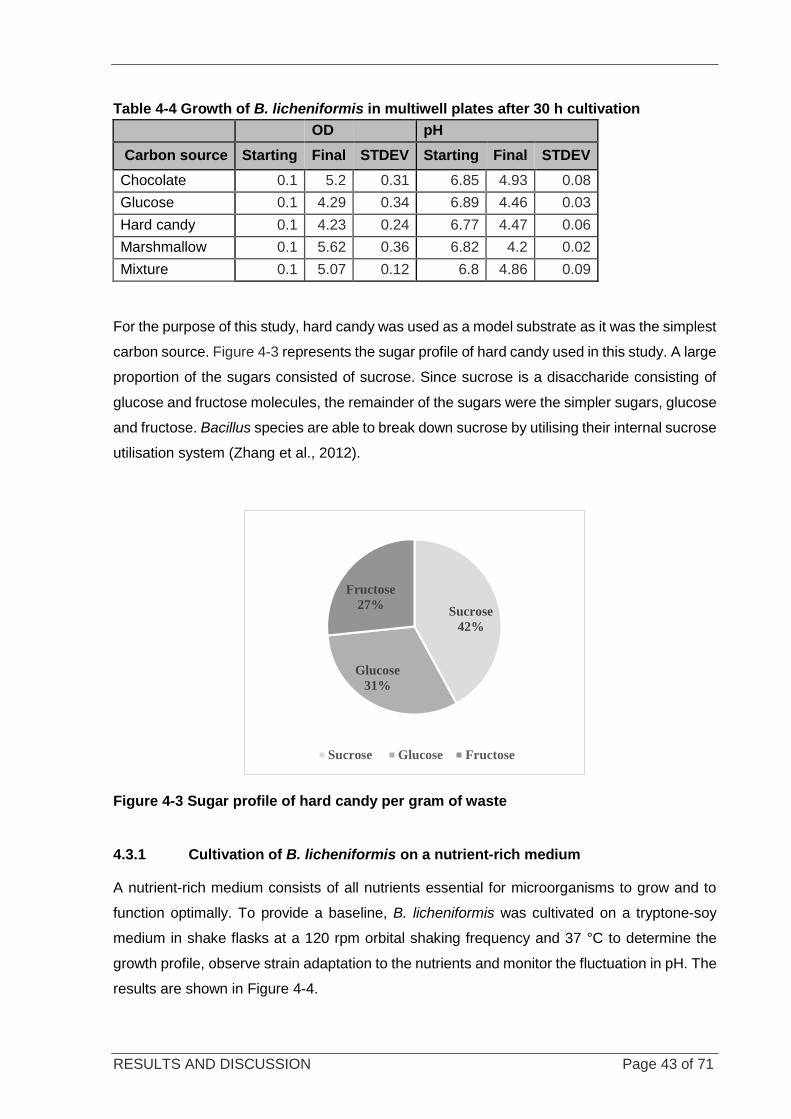
RESULTS AND DISCUSSION Page 43 of 71
Table 4-4 Growth of B. licheniformis in multiwell plates after 30 h cultivation
OD pH
Carbon source Starting Final STDEV Starting Final STDEV
Chocolate 0.1 5.2 0.31 6.85 4.93 0.08
Glucose 0.1 4.29 0.34 6.89 4.46 0.03
Hard candy 0.1 4.23 0.24 6.77 4.47 0.06
Marshmallow 0.1 5.62 0.36 6.82 4.2 0.02
Mixture 0.1 5.07 0.12 6.8 4.86 0.09
For the purpose of this study, hard candy was used as a model substrate as it was the simplest
carbon source. Figure 4-3 represents the sugar profile of hard candy used in this study. A large
proportion of the sugars consisted of sucrose. Since sucrose is a disaccharide consisting of
glucose and fructose molecules, the remainder of the sugars were the simpler sugars, glucose
and fructose. Bacillus species are able to break down sucrose by utilising their internal sucrose
utilisation system (Zhang et al., 2012).
Figure 4-3 Sugar profile of hard candy per gram of waste
4.3.1 Cultivation of B. licheniformis on a nutrient-rich medium
A nutrient-rich medium consists of all nutrients essential for microorganisms to grow and to
function optimally. To provide a baseline, B. licheniformis was cultivated on a tryptone-soy
medium in shake flasks at a 120 rpm orbital shaking frequency and 37 °C to determine the
growth profile, observe strain adaptation to the nutrients and monitor the fluctuation in pH. The
results are shown in Figure 4-4.
Sucrose
42%
Glucose
31%
Fructose
27%
Sucrose Glucose Fructose
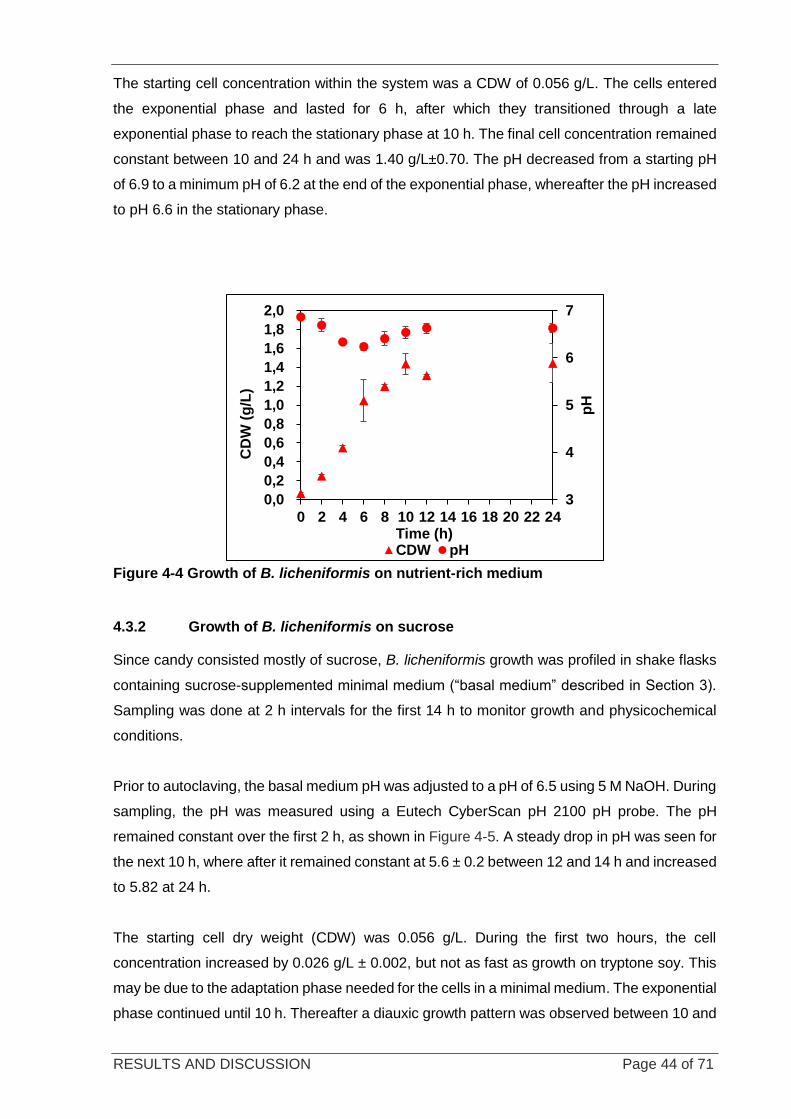
RESULTS AND DISCUSSION Page 44 of 71
The starting cell concentration within the system was a CDW of 0.056 g/L. The cells entered
the exponential phase and lasted for 6 h, after which they transitioned through a late
exponential phase to reach the stationary phase at 10 h. The final cell concentration remained
constant between 10 and 24 h and was 1.40 g/L±0.70. The pH decreased from a starting pH
of 6.9 to a minimum pH of 6.2 at the end of the exponential phase, whereafter the pH increased
to pH 6.6 in the stationary phase.
Figure 4-4 Growth of B. licheniformis on nutrient-rich medium
4.3.2 Growth of B. licheniformis on sucrose
Since candy consisted mostly of sucrose, B. licheniformis growth was profiled in shake flasks
containing sucrose-supplemented minimal medium (“basal medium” described in Section 3).
Sampling was done at 2 h intervals for the first 14 h to monitor growth and physicochemical
conditions.
Prior to autoclaving, the basal medium pH was adjusted to a pH of 6.5 using 5 M NaOH. During
sampling, the pH was measured using a Eutech CyberScan pH 2100 pH probe. The pH
remained constant over the first 2 h, as shown in Figure 4-5. A steady drop in pH was seen for
the next 10 h, where after it remained constant at 5.6 ± 0.2 between 12 and 14 h and increased
to 5.82 at 24 h.
The starting cell dry weight (CDW) was 0.056 g/L. During the first two hours, the cell
concentration increased by 0.026 g/L ± 0.002, but not as fast as growth on tryptone soy. This
may be due to the adaptation phase needed for the cells in a minimal medium. The exponential
phase continued until 10 h. Thereafter a diauxic growth pattern was observed between 10 and
3
4
5
6
7
0,0
0,2
0,4
0,6
0,8
1,0
1,2
1,4
1,6
1,8
2,0
0 2 4 6 8 10 12 14 16 18 20 22 24
pH
CD
W (
g/L
)
Time (h)CDW pH
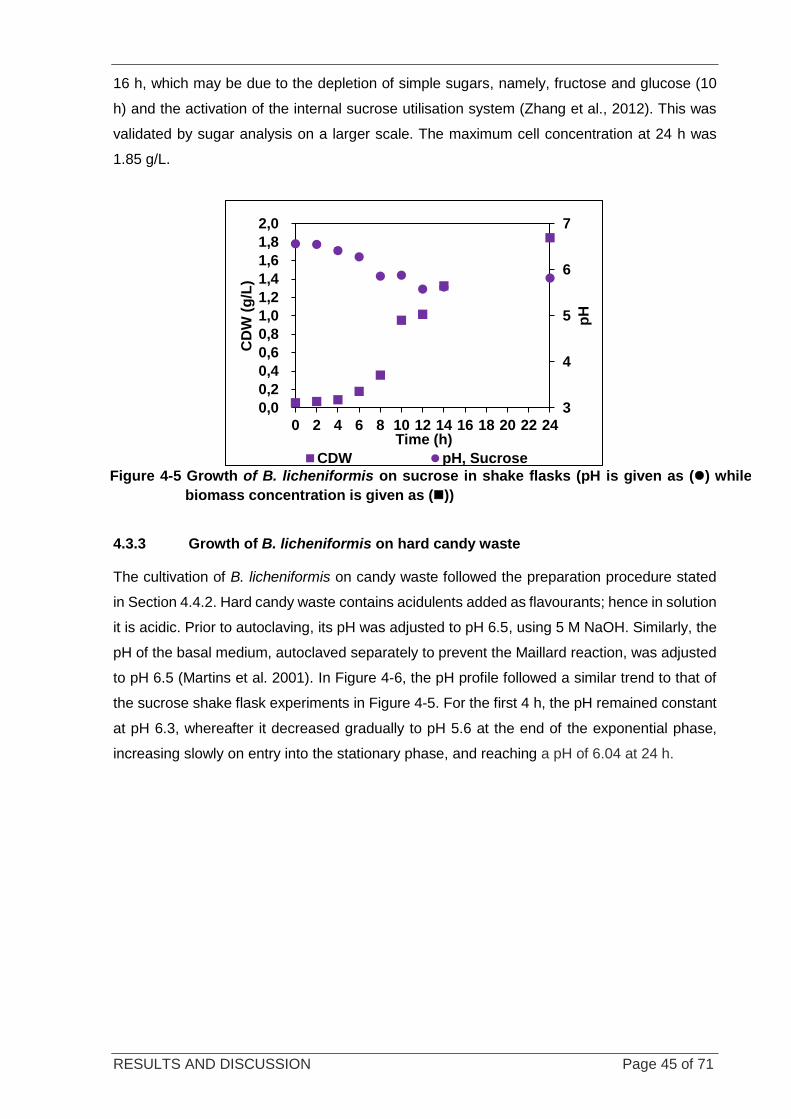
RESULTS AND DISCUSSION Page 45 of 71
16 h, which may be due to the depletion of simple sugars, namely, fructose and glucose (10
h) and the activation of the internal sucrose utilisation system (Zhang et al., 2012). This was
validated by sugar analysis on a larger scale. The maximum cell concentration at 24 h was
1.85 g/L.
4.3.3 Growth of B. licheniformis on hard candy waste
The cultivation of B. licheniformis on candy waste followed the preparation procedure stated
in Section 4.4.2. Hard candy waste contains acidulents added as flavourants; hence in solution
it is acidic. Prior to autoclaving, its pH was adjusted to pH 6.5, using 5 M NaOH. Similarly, the
pH of the basal medium, autoclaved separately to prevent the Maillard reaction, was adjusted
to pH 6.5 (Martins et al. 2001). In Figure 4-6, the pH profile followed a similar trend to that of
the sucrose shake flask experiments in Figure 4-5. For the first 4 h, the pH remained constant
at pH 6.3, whereafter it decreased gradually to pH 5.6 at the end of the exponential phase,
increasing slowly on entry into the stationary phase, and reaching a pH of 6.04 at 24 h.
3
4
5
6
7
0,0
0,2
0,4
0,6
0,8
1,0
1,2
1,4
1,6
1,8
2,0
0 2 4 6 8 10 12 14 16 18 20 22 24
pH
CD
W (
g/L
)
Time (h)
CDW pH, Sucrose
Figure 4-5 Growth of B. licheniformis on sucrose in shake flasks (pH is given as (⚫) while
biomass concentration is given as (◼))
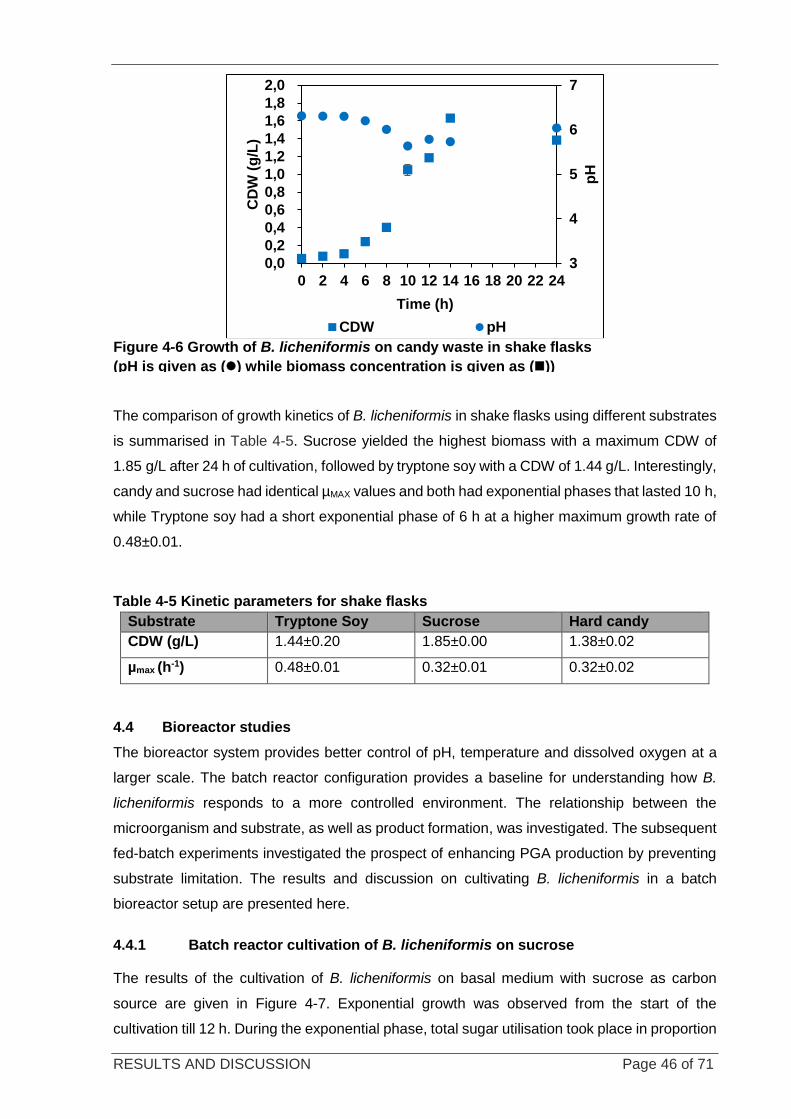
RESULTS AND DISCUSSION Page 46 of 71
The comparison of growth kinetics of B. licheniformis in shake flasks using different substrates
is summarised in Table 4-5. Sucrose yielded the highest biomass with a maximum CDW of
1.85 g/L after 24 h of cultivation, followed by tryptone soy with a CDW of 1.44 g/L. Interestingly,
candy and sucrose had identical µMAX values and both had exponential phases that lasted 10 h,
while Tryptone soy had a short exponential phase of 6 h at a higher maximum growth rate of
0.48±0.01.
Table 4-5 Kinetic parameters for shake flasks
Substrate Tryptone Soy Sucrose Hard candy
CDW (g/L) 1.44±0.20 1.85±0.00 1.38±0.02
µmax (h-1) 0.48±0.01 0.32±0.01 0.32±0.02
4.4 Bioreactor studies
The bioreactor system provides better control of pH, temperature and dissolved oxygen at a
larger scale. The batch reactor configuration provides a baseline for understanding how B.
licheniformis responds to a more controlled environment. The relationship between the
microorganism and substrate, as well as product formation, was investigated. The subsequent
fed-batch experiments investigated the prospect of enhancing PGA production by preventing
substrate limitation. The results and discussion on cultivating B. licheniformis in a batch
bioreactor setup are presented here.
4.4.1 Batch reactor cultivation of B. licheniformis on sucrose
The results of the cultivation of B. licheniformis on basal medium with sucrose as carbon
source are given in Figure 4-7. Exponential growth was observed from the start of the
cultivation till 12 h. During the exponential phase, total sugar utilisation took place in proportion
3
4
5
6
7
0,0
0,2
0,4
0,6
0,8
1,0
1,2
1,4
1,6
1,8
2,0
0 2 4 6 8 10 12 14 16 18 20 22 24
pH
CD
W (
g/L
)
Time (h)
CDW pH
Figure 4-6 Growth of B. licheniformis on candy waste in shake flasks
(pH is given as (⚫) while biomass concentration is given as (◼))
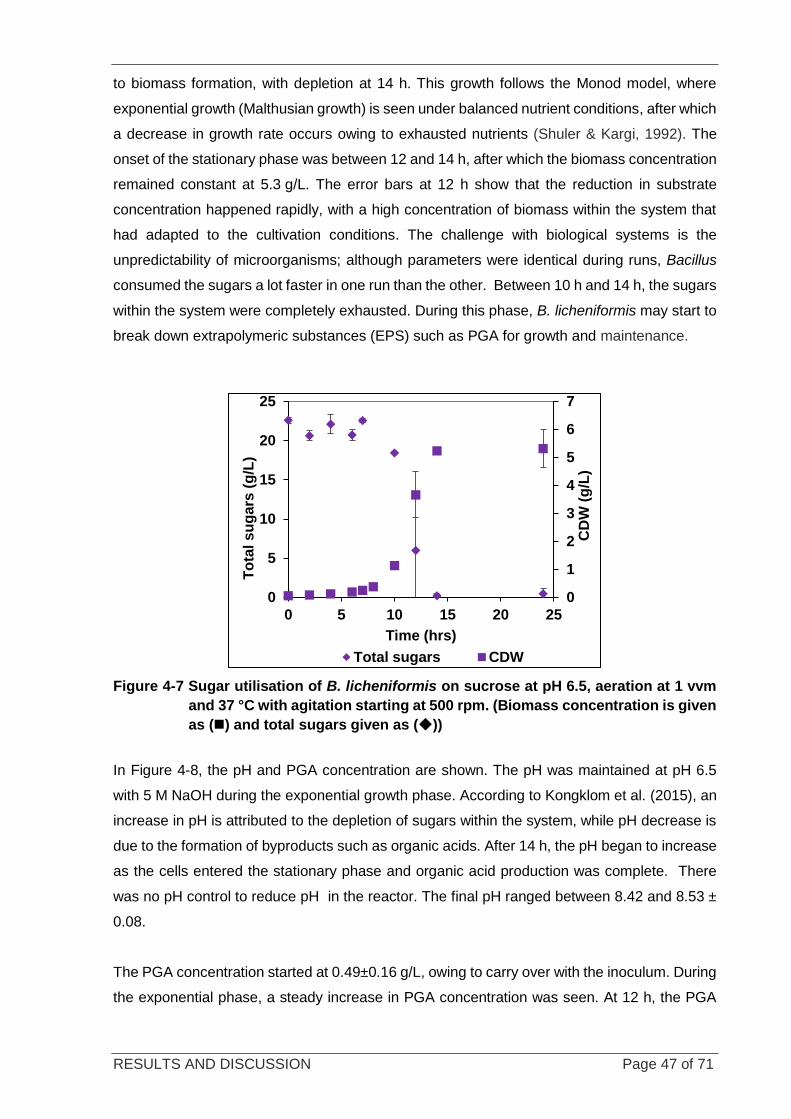
RESULTS AND DISCUSSION Page 47 of 71
to biomass formation, with depletion at 14 h. This growth follows the Monod model, where
exponential growth (Malthusian growth) is seen under balanced nutrient conditions, after which
a decrease in growth rate occurs owing to exhausted nutrients (Shuler & Kargi, 1992). The
onset of the stationary phase was between 12 and 14 h, after which the biomass concentration
remained constant at 5.3 g/L. The error bars at 12 h show that the reduction in substrate
concentration happened rapidly, with a high concentration of biomass within the system that
had adapted to the cultivation conditions. The challenge with biological systems is the
unpredictability of microorganisms; although parameters were identical during runs, Bacillus
consumed the sugars a lot faster in one run than the other. Between 10 h and 14 h, the sugars
within the system were completely exhausted. During this phase, B. licheniformis may start to
break down extrapolymeric substances (EPS) such as PGA for growth and maintenance.
Figure 4-7 Sugar utilisation of B. licheniformis on sucrose at pH 6.5, aeration at 1 vvm
and 37 °C with agitation starting at 500 rpm. (Biomass concentration is given
as (◼) and total sugars given as (◆))
In Figure 4-8, the pH and PGA concentration are shown. The pH was maintained at pH 6.5
with 5 M NaOH during the exponential growth phase. According to Kongklom et al. (2015), an
increase in pH is attributed to the depletion of sugars within the system, while pH decrease is
due to the formation of byproducts such as organic acids. After 14 h, the pH began to increase
as the cells entered the stationary phase and organic acid production was complete. There
was no pH control to reduce pH in the reactor. The final pH ranged between 8.42 and 8.53 ±
0.08.
The PGA concentration started at 0.49±0.16 g/L, owing to carry over with the inoculum. During
the exponential phase, a steady increase in PGA concentration was seen. At 12 h, the PGA
0
1
2
3
4
5
6
7
0
5
10
15
20
25
0 5 10 15 20 25
CD
W (
g/L
)
To
tal s
ug
ars
(g
/L)
Time (hrs)
Total sugars CDW
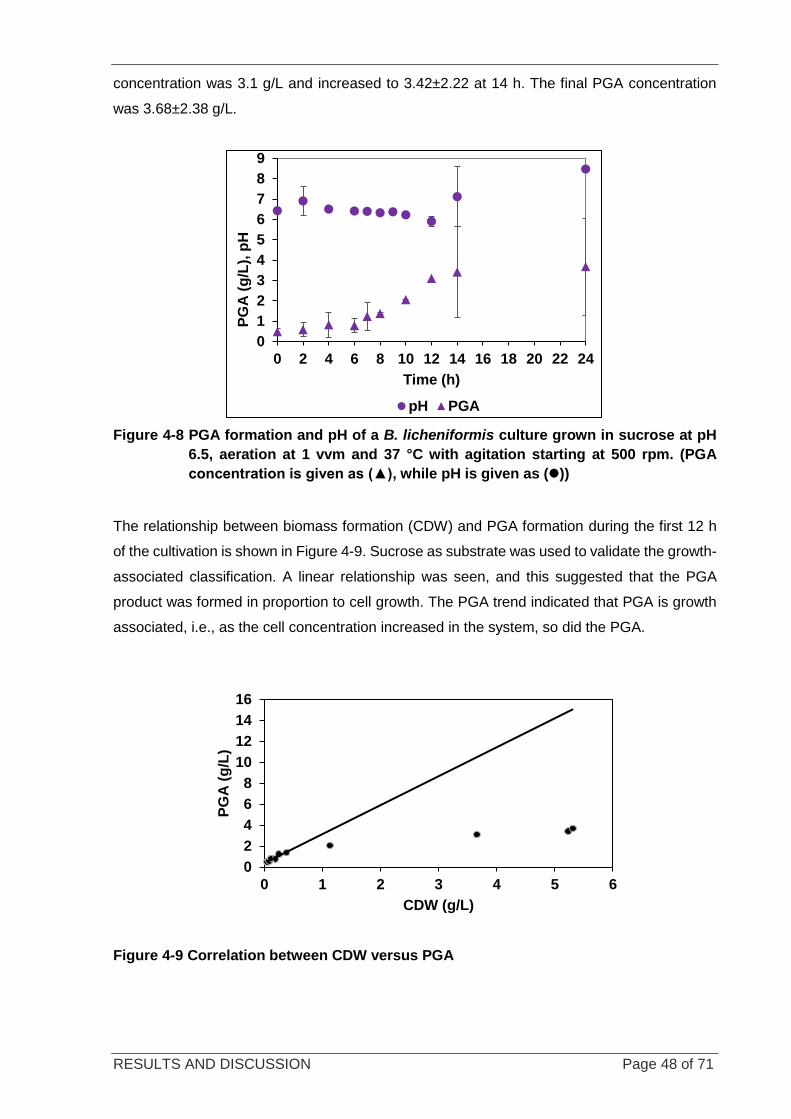
RESULTS AND DISCUSSION Page 48 of 71
concentration was 3.1 g/L and increased to 3.42±2.22 at 14 h. The final PGA concentration
was 3.68±2.38 g/L.
Figure 4-8 PGA formation and pH of a B. licheniformis culture grown in sucrose at pH
6.5, aeration at 1 vvm and 37 °C with agitation starting at 500 rpm. (PGA
concentration is given as (▲), while pH is given as (⚫))
The relationship between biomass formation (CDW) and PGA formation during the first 12 h
of the cultivation is shown in Figure 4-9. Sucrose as substrate was used to validate the growth-
associated classification. A linear relationship was seen, and this suggested that the PGA
product was formed in proportion to cell growth. The PGA trend indicated that PGA is growth
associated, i.e., as the cell concentration increased in the system, so did the PGA.
Figure 4-9 Correlation between CDW versus PGA
0
1
2
3
4
5
6
7
8
9
0 2 4 6 8 10 12 14 16 18 20 22 24
PG
A (
g/L
), p
H
Time (h)
pH PGA
0
2
4
6
8
10
12
14
16
0 1 2 3 4 5 6
PG
A (
g/L
)
CDW (g/L)
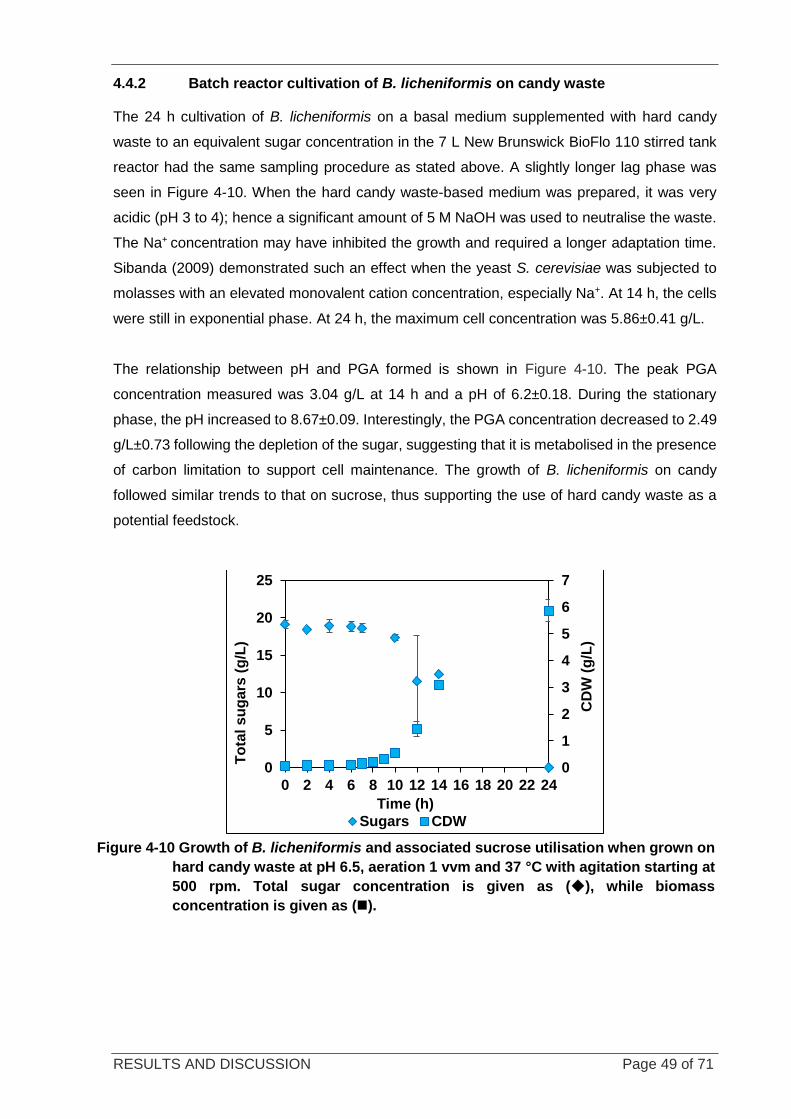
RESULTS AND DISCUSSION Page 49 of 71
4.4.2 Batch reactor cultivation of B. licheniformis on candy waste
The 24 h cultivation of B. licheniformis on a basal medium supplemented with hard candy
waste to an equivalent sugar concentration in the 7 L New Brunswick BioFlo 110 stirred tank
reactor had the same sampling procedure as stated above. A slightly longer lag phase was
seen in Figure 4-10. When the hard candy waste-based medium was prepared, it was very
acidic (pH 3 to 4); hence a significant amount of 5 M NaOH was used to neutralise the waste.
The Na+ concentration may have inhibited the growth and required a longer adaptation time.
Sibanda (2009) demonstrated such an effect when the yeast S. cerevisiae was subjected to
molasses with an elevated monovalent cation concentration, especially Na+. At 14 h, the cells
were still in exponential phase. At 24 h, the maximum cell concentration was 5.86±0.41 g/L.
The relationship between pH and PGA formed is shown in Figure 4-10. The peak PGA
concentration measured was 3.04 g/L at 14 h and a pH of 6.2±0.18. During the stationary
phase, the pH increased to 8.67±0.09. Interestingly, the PGA concentration decreased to 2.49
g/L±0.73 following the depletion of the sugar, suggesting that it is metabolised in the presence
of carbon limitation to support cell maintenance. The growth of B. licheniformis on candy
followed similar trends to that on sucrose, thus supporting the use of hard candy waste as a
potential feedstock.
0
1
2
3
4
5
6
7
0
5
10
15
20
25
0 2 4 6 8 10 12 14 16 18 20 22 24
CD
W (
g/L
)
To
tal s
ug
ars
(g
/L)
Time (h)
Sugars CDW
Figure 4-10 Growth of B. licheniformis and associated sucrose utilisation when grown on
hard candy waste at pH 6.5, aeration 1 vvm and 37 °C with agitation starting at
500 rpm. Total sugar concentration is given as (◆), while biomass
concentration is given as (◼).
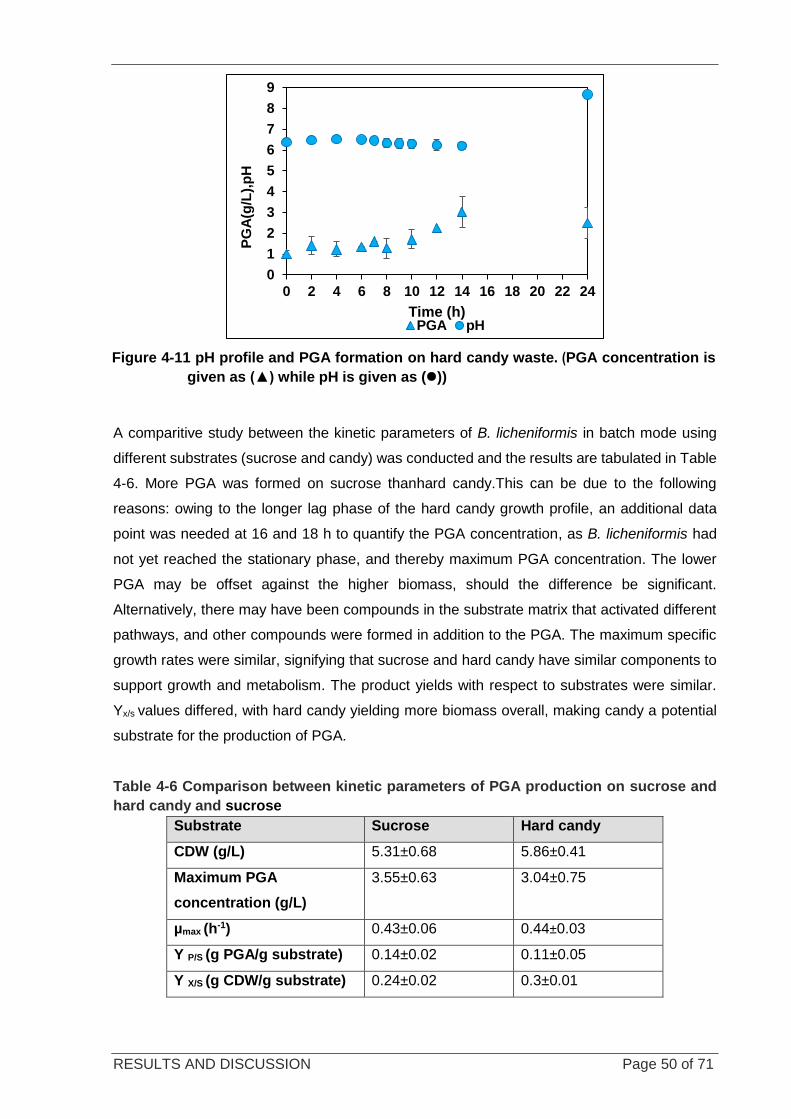
RESULTS AND DISCUSSION Page 50 of 71
A comparitive study between the kinetic parameters of B. licheniformis in batch mode using
different substrates (sucrose and candy) was conducted and the results are tabulated in Table
4-6. More PGA was formed on sucrose thanhard candy.This can be due to the following
reasons: owing to the longer lag phase of the hard candy growth profile, an additional data
point was needed at 16 and 18 h to quantify the PGA concentration, as B. licheniformis had
not yet reached the stationary phase, and thereby maximum PGA concentration. The lower
PGA may be offset against the higher biomass, should the difference be significant.
Alternatively, there may have been compounds in the substrate matrix that activated different
pathways, and other compounds were formed in addition to the PGA. The maximum specific
growth rates were similar, signifying that sucrose and hard candy have similar components to
support growth and metabolism. The product yields with respect to substrates were similar.
Yx/s values differed, with hard candy yielding more biomass overall, making candy a potential
substrate for the production of PGA.
Table 4-6 Comparison between kinetic parameters of PGA production on sucrose and
hard candy and sucrose
Substrate Sucrose Hard candy
CDW (g/L) 5.31±0.68 5.86±0.41
Maximum PGA
concentration (g/L)
3.55±0.63 3.04±0.75
µmax (h-1) 0.43±0.06 0.44±0.03
Y P/S (g PGA/g substrate) 0.14±0.02 0.11±0.05
Y X/S (g CDW/g substrate) 0.24±0.02 0.3±0.01
0
1
2
3
4
5
6
7
8
9
0 2 4 6 8 10 12 14 16 18 20 22 24
PG
A(g
/L),
pH
Time (h)PGA pH
Figure 4-11 pH profile and PGA formation on hard candy waste. (PGA concentration is
given as (▲) while pH is given as (⚫))
RESULTS AND DISCUSSION Page 51 of 71
4.5 Fed-batch bioreactor studies
Based on the findings of the batch bioreactor runs, it was shown that PGA production is growth
associated. Further, in the hard candy run, PGA production peaked at approximately 14 h,
and on subsequent depletion of the carbon source it began to decrease, suggesting it provided
a nutrient source for cell maintenance. It was proposed that operation in fed-batch
configuration would optimise PGA production by extending the biomass growth and associated
PGA production phase, and by avoiding PGA consumption on deletion of the carbon source.
The aim of the fed-batch was to enhance PGA concentration, and maintain the PGA
productivity within the system at a high rate over an extended time period. This was attempted
by constantly feeding a mixture of hard candy and NH4Cl into the reactor at a rate matching
their consumption for PGA production.
4.5.1 Cultivation of B. licheniformis in fed-batch mode
The cultivation of B. licheniformis in fed batch took place in two stages. The first stage (12 h)
was run as a normal batch process, where basal medium was supplemented with 20 g/L of
hard candy waste and added to the reactor prior to inoculation. The cultivation took place at
37 °C, 1 vvm, an initial agitation of 500 rpm and pH 6.5. Feeding was initiated at 13 h at 0.083
L/h and continued for the next 9 h and contained a solution of 60 g/L hard candy and 10.44 g/L
NH4Cl. The pH was maintained at pH 6.5, using 5 M NaOH for the first stage. No acid addition
was used for pH correction. The growth profile can be found in Figure 4-12. As expected,
during the first 12 h, the growth trend replicated the batch data. At 16 h, the cell concentration
(CDW) continued to increase and there remained a low level of sugar within the system, as
designed. During this feeding period, a consistent high biomass productivity was noted. The
maximum dry cell biomass concentration at 23 h was 10.30±0.81 g/L, a significant increase
from the 5.86±0.41 g/L produced in batch.
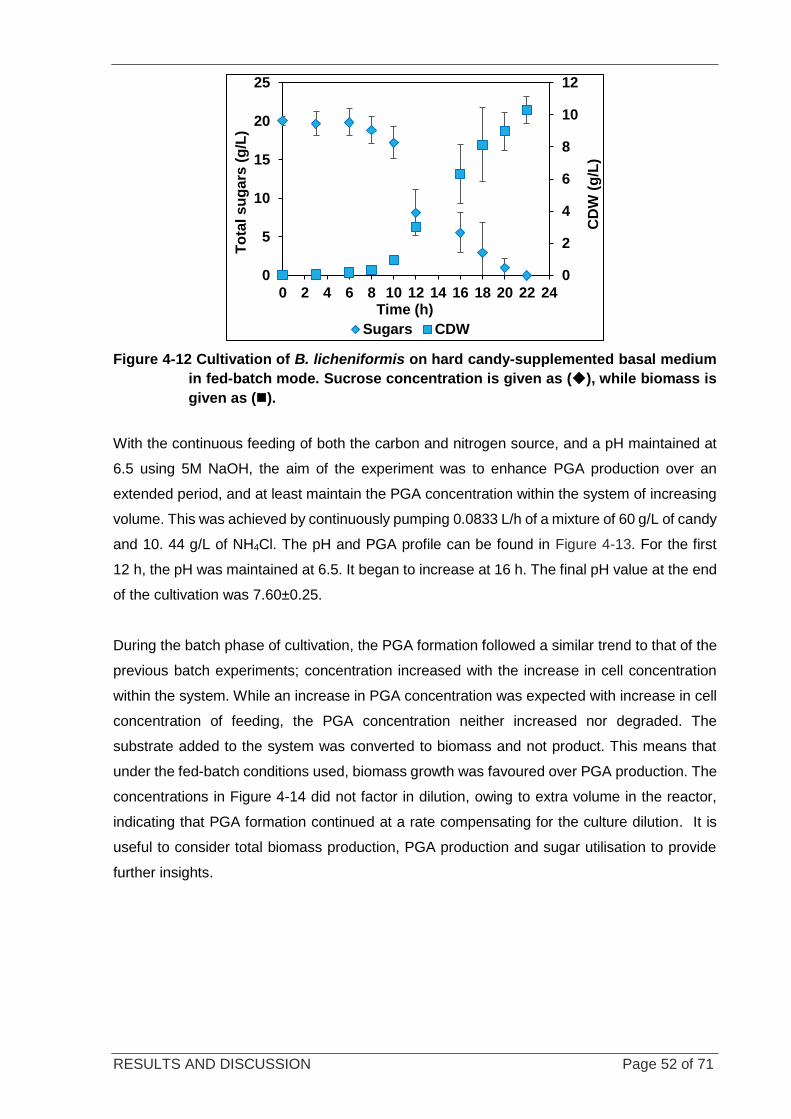
RESULTS AND DISCUSSION Page 52 of 71
Figure 4-12 Cultivation of B. licheniformis on hard candy-supplemented basal medium
in fed-batch mode. Sucrose concentration is given as (◆), while biomass is
given as (◼).
With the continuous feeding of both the carbon and nitrogen source, and a pH maintained at
6.5 using 5M NaOH, the aim of the experiment was to enhance PGA production over an
extended period, and at least maintain the PGA concentration within the system of increasing
volume. This was achieved by continuously pumping 0.0833 L/h of a mixture of 60 g/L of candy
and 10. 44 g/L of NH4Cl. The pH and PGA profile can be found in Figure 4-13. For the first
12 h, the pH was maintained at 6.5. It began to increase at 16 h. The final pH value at the end
of the cultivation was 7.60±0.25.
During the batch phase of cultivation, the PGA formation followed a similar trend to that of the
previous batch experiments; concentration increased with the increase in cell concentration
within the system. While an increase in PGA concentration was expected with increase in cell
concentration of feeding, the PGA concentration neither increased nor degraded. The
substrate added to the system was converted to biomass and not product. This means that
under the fed-batch conditions used, biomass growth was favoured over PGA production. The
concentrations in Figure 4-14 did not factor in dilution, owing to extra volume in the reactor,
indicating that PGA formation continued at a rate compensating for the culture dilution. It is
useful to consider total biomass production, PGA production and sugar utilisation to provide
further insights.
0
2
4
6
8
10
12
0
5
10
15
20
25
0 2 4 6 8 10 12 14 16 18 20 22 24
CD
W (
g/L
)
To
tal s
ug
ars
(g
/L)
Time (h)
Sugars CDW
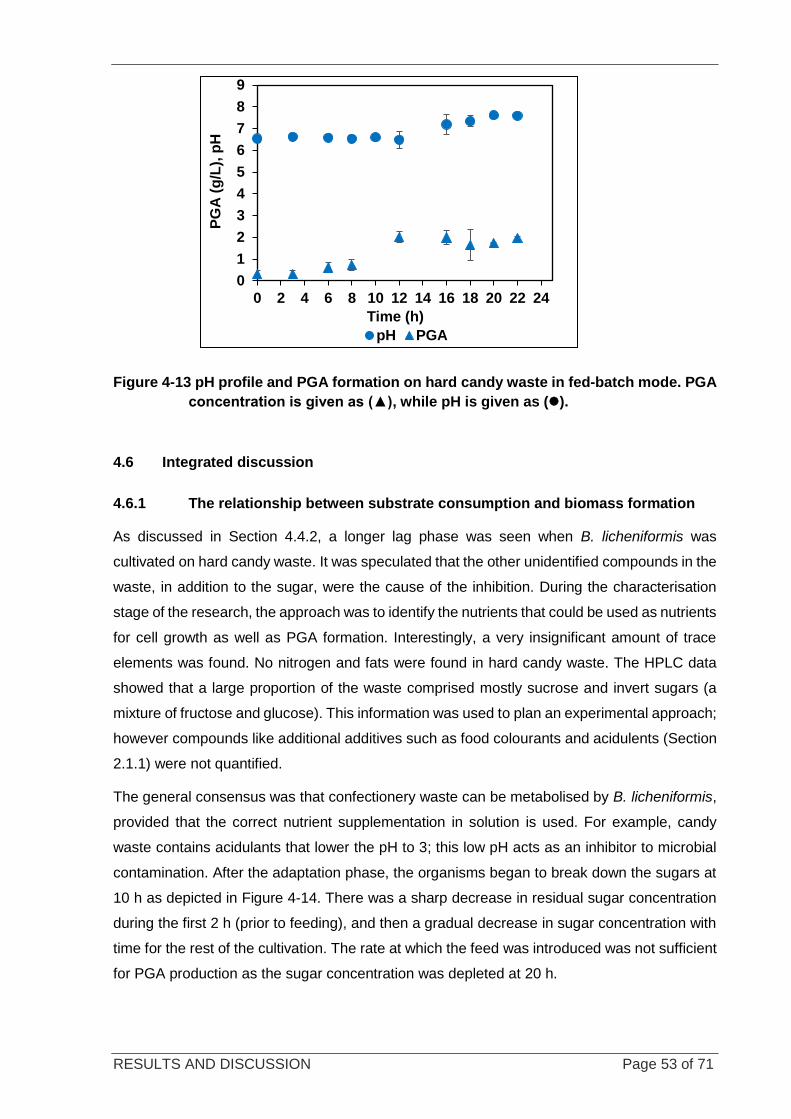
RESULTS AND DISCUSSION Page 53 of 71
Figure 4-13 pH profile and PGA formation on hard candy waste in fed-batch mode. PGA
concentration is given as (▲), while pH is given as (⚫).
4.6 Integrated discussion
4.6.1 The relationship between substrate consumption and biomass formation
As discussed in Section 4.4.2, a longer lag phase was seen when B. licheniformis was
cultivated on hard candy waste. It was speculated that the other unidentified compounds in the
waste, in addition to the sugar, were the cause of the inhibition. During the characterisation
stage of the research, the approach was to identify the nutrients that could be used as nutrients
for cell growth as well as PGA formation. Interestingly, a very insignificant amount of trace
elements was found. No nitrogen and fats were found in hard candy waste. The HPLC data
showed that a large proportion of the waste comprised mostly sucrose and invert sugars (a
mixture of fructose and glucose). This information was used to plan an experimental approach;
however compounds like additional additives such as food colourants and acidulents (Section
2.1.1) were not quantified.
The general consensus was that confectionery waste can be metabolised by B. licheniformis,
provided that the correct nutrient supplementation in solution is used. For example, candy
waste contains acidulants that lower the pH to 3; this low pH acts as an inhibitor to microbial
contamination. After the adaptation phase, the organisms began to break down the sugars at
10 h as depicted in Figure 4-14. There was a sharp decrease in residual sugar concentration
during the first 2 h (prior to feeding), and then a gradual decrease in sugar concentration with
time for the rest of the cultivation. The rate at which the feed was introduced was not sufficient
for PGA production as the sugar concentration was depleted at 20 h.
0
1
2
3
4
5
6
7
8
9
0 2 4 6 8 10 12 14 16 18 20 22 24
PG
A (
g/L
), p
H
Time (h)
pH PGA
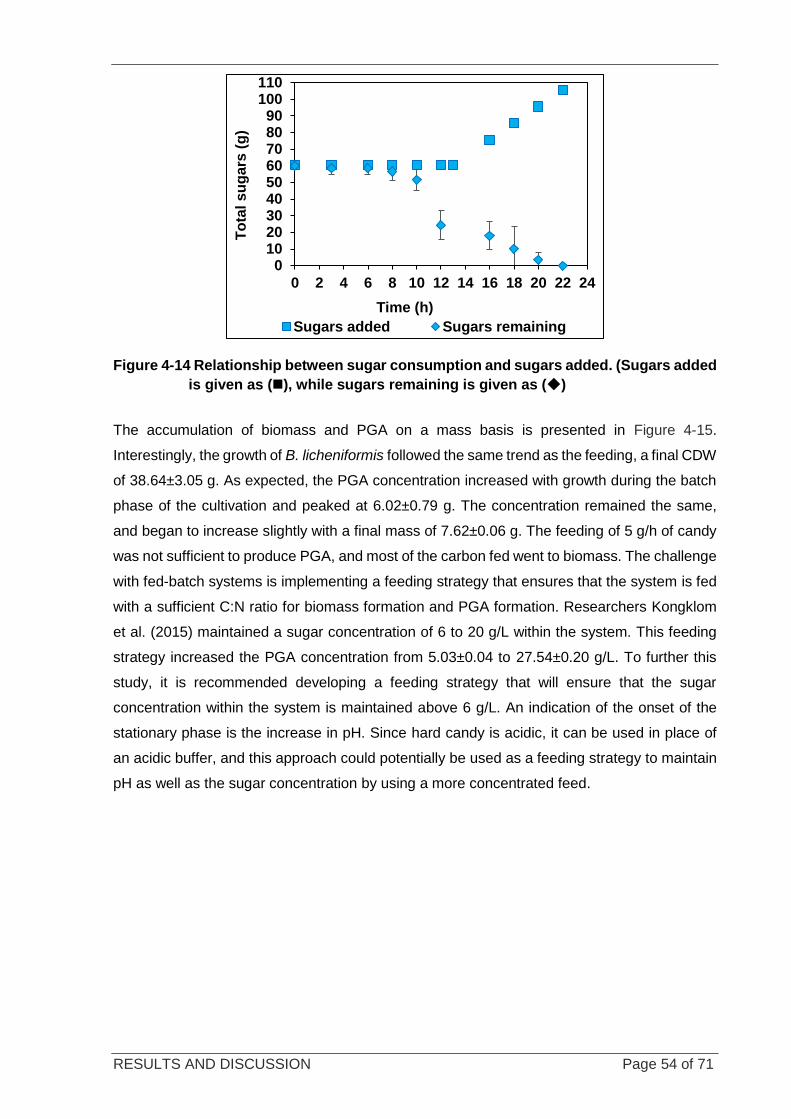
RESULTS AND DISCUSSION Page 54 of 71
Figure 4-14 Relationship between sugar consumption and sugars added. (Sugars added
is given as (◼), while sugars remaining is given as (◆)
The accumulation of biomass and PGA on a mass basis is presented in Figure 4-15.
Interestingly, the growth of B. licheniformis followed the same trend as the feeding, a final CDW
of 38.64±3.05 g. As expected, the PGA concentration increased with growth during the batch
phase of the cultivation and peaked at 6.02±0.79 g. The concentration remained the same,
and began to increase slightly with a final mass of 7.62±0.06 g. The feeding of 5 g/h of candy
was not sufficient to produce PGA, and most of the carbon fed went to biomass. The challenge
with fed-batch systems is implementing a feeding strategy that ensures that the system is fed
with a sufficient C:N ratio for biomass formation and PGA formation. Researchers Kongklom
et al. (2015) maintained a sugar concentration of 6 to 20 g/L within the system. This feeding
strategy increased the PGA concentration from 5.03±0.04 to 27.54±0.20 g/L. To further this
study, it is recommended developing a feeding strategy that will ensure that the sugar
concentration within the system is maintained above 6 g/L. An indication of the onset of the
stationary phase is the increase in pH. Since hard candy is acidic, it can be used in place of
an acidic buffer, and this approach could potentially be used as a feeding strategy to maintain
pH as well as the sugar concentration by using a more concentrated feed.
0102030405060708090
100110
0 2 4 6 8 10 12 14 16 18 20 22 24
To
tal s
ug
ars
(g
)
Time (h)
Sugars added Sugars remaining
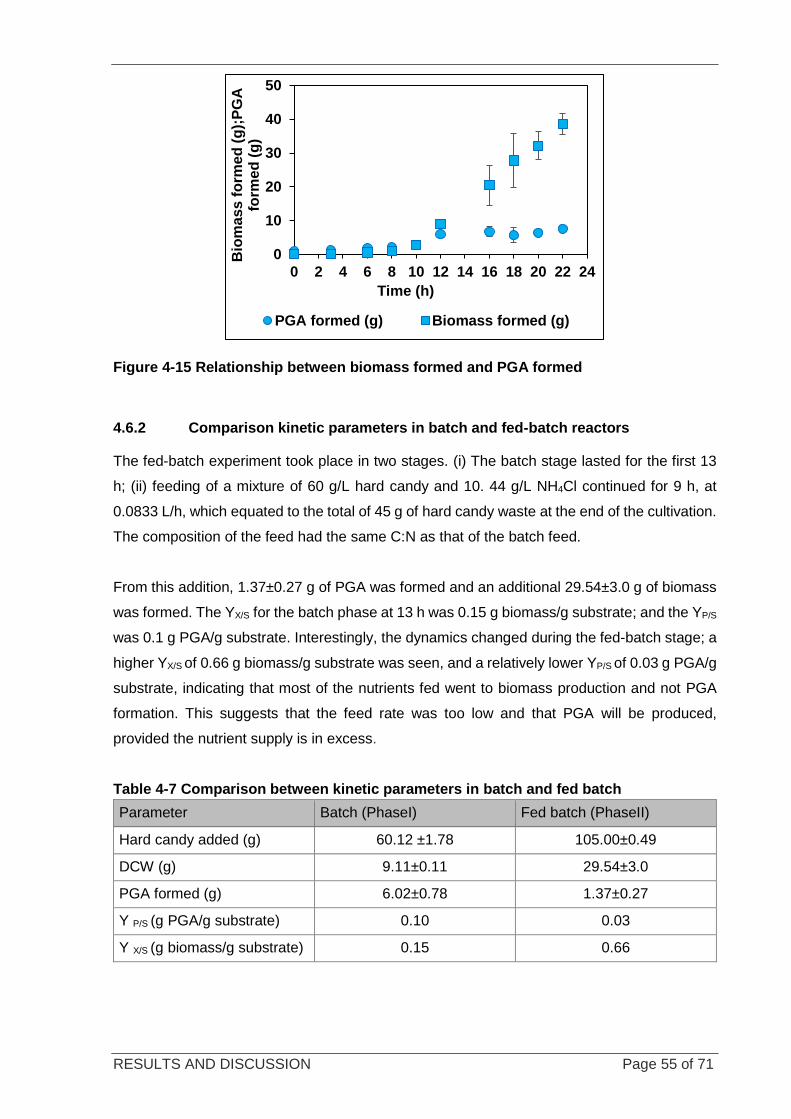
RESULTS AND DISCUSSION Page 55 of 71
Figure 4-15 Relationship between biomass formed and PGA formed
4.6.2 Comparison kinetic parameters in batch and fed-batch reactors
The fed-batch experiment took place in two stages. (i) The batch stage lasted for the first 13
h; (ii) feeding of a mixture of 60 g/L hard candy and 10. 44 g/L NH4Cl continued for 9 h, at
0.0833 L/h, which equated to the total of 45 g of hard candy waste at the end of the cultivation.
The composition of the feed had the same C:N as that of the batch feed.
From this addition, 1.37±0.27 g of PGA was formed and an additional 29.54±3.0 g of biomass
was formed. The YX/S for the batch phase at 13 h was 0.15 g biomass/g substrate; and the YP/S
was 0.1 g PGA/g substrate. Interestingly, the dynamics changed during the fed-batch stage; a
higher YX/S of 0.66 g biomass/g substrate was seen, and a relatively lower YP/S of 0.03 g PGA/g
substrate, indicating that most of the nutrients fed went to biomass production and not PGA
formation. This suggests that the feed rate was too low and that PGA will be produced,
provided the nutrient supply is in excess.
Table 4-7 Comparison between kinetic parameters in batch and fed batch
Parameter Batch (PhaseI) Fed batch (PhaseII)
Hard candy added (g) 60.12 ±1.78 105.00±0.49
DCW (g) 9.11±0.11 29.54±3.0
PGA formed (g) 6.02±0.78 1.37±0.27
Y P/S (g PGA/g substrate) 0.10 0.03
Y X/S (g biomass/g substrate) 0.15 0.66
0
10
20
30
40
50
0 2 4 6 8 10 12 14 16 18 20 22 24
Bio
ma
ss
fo
rme
d (
g);
PG
A
form
ed
(g
)
Time (h)
PGA formed (g) Biomass formed (g)
CONCLUSIONS AND RECOMMENDATIONS Page 56 of 71
CHAPTER 5: CONCLUSIONS AND RECOMMENDATIONS
5.1 Conclusions
The selected species B. licheniformis JCM2505 was able to produce PGA using a cheaper
alternative nitrogen source (e.g. NH4+ ions or proteins) to that of glutamate, making it a potential
organism of interest for PGA synthesis from waste organic products in the waste arena.
Following characterisation, B. licheniformis JCM 2505 was able to grow on all three wastes
(candy, chocolate and marshmallow), including a mixture of the three with the supplementation
of a basal medium. This study focused on hard candy waste as a carbon source, as candy
waste consists mainly of sugars and can be used as a potential carbon source for PGA
production when supplemented with a basal medium that contains all of the complementary
nutrients needed for optimal cell function and PGA production.
The C6 sugar is metabolised into two C3 components, each losing a CO2 molecule, and are
activated to acetyl CoA, which entered the TCA cycle where α-ketoglutaric acid is a key
intermediate. The presence of NH4+ in the cultivation medium drives the formation of L-glutamic
acid, which combines with D-glutamic acid to produce polyglutamic acid. In addition to a carbon
and nitrogen source, the key nutrients needed for cell function were a phosphate source and
trace elements. 20 g/L of candy waste supplemented with “basal medium” which contained
12 g/L citric acid, 3.48 g/L NH4Cl, 2.99 g/L K2HPO4 and mineral salts (0.5 g/L MgSO4.7H2O,
0.104°g/L MnSO4.H2O, 0.04 g/L FeCl3.6H2O and 0.15 g/L CaCl2.2H2O) were selected as the
cultivation medium for the production of PGA.
The similarity of growth of B. licheniformis on sucrose and sucrose supplied through hard
candy waste was seen, with the exception of the increased lag phase when using hard candy.
This was attributed to the large addition of Na+ on neutralising the acidic candy waste with
NaOH. Alternatively, it may have resulted from the inhibitory acidulants and additives present
in the hard candy. The growth kinetics of B. licheniformis on candy and sucrose are
comparable with slight differences. More PGA was formed on sucrose with a yield coefficient
of 0.14±0.02 g PGA/g substrate and 0.11±0.05 g PGA/g substrate for candy in batch.
Interestingly, more biomass was formed on candy with a maximum DCW of 5.86±0.41 g/L,
making it a suitable substrate for the production of PGA.
The aim of the fed batch operation mode was to maintain the exponential growth phase by
feeding the system with a constant supply of carbon. During the feeding stage of the fed- batch
experiments, a large majority of the substrate fed went to biomass formation and very little
PGA was formed. B. licheniformis favoured a specific C:N ratio for PGA production, and this
CONCLUSIONS AND RECOMMENDATIONS Page 57 of 71
was not achieved. It can be concluded that the feed rate was too slow and that the process
should be optimised by increasing the feed concentration. Further work into investigating the
required C:N ratio on production of PGA relative to biomass is needed.
5.2 Recommendations
• Further characterisation studies are recommended to identify the additional nutrient
compounds found in candy waste, as it is a complex source. Optimisation experiments
are needed to enhance PGA production on confectionery waste.
• A techno-economic feasibility study should be conducted to determine if it is
economically viable to produce PGA from confectionery waste. Granted the waste was
used as feedstock, a lot of supplementary nutrients were needed to ensure good growth
of the organism and PGA production. Furthermore, determination of the minimum
supplementary nutrients that need to be added needs investigation. When using waste,
one needs to ensure that productivity remains constant.
• Further investigation into finding a wastewater stream high in nitrogen, i.e., corn steep
liquor, metal ions, and phosphates such as domestic wastewater, will aid in
supplementing the candy waste and act as a solvent. It is highly recommended that
further work is combined with wastewater treatment. This approach will minimise the
process costs, as candy waste in solution is needed for PGA production. An integration
of these effluents will contribute to knowledge in the wastewater biorefinery space.
• Furthermore, the extraction of PGA can be further improved, as precipitation with cold
ethanol is effective yet costly.
PGA is a highly versatile compound, and can be used in a range of applications. Owing to the
nature of the feedstock (waste), applications are limited to the agricultural and wastewater
industries. Production of PGA from solid confectionery waste would divert waste from going to
landfill, thus preventing the breeding of harmful anaerobic methanogens and pathogens
responsible for causing harm to the environment. Owing to its hygroscopic nature, it can be
used as a soil conditioner as well as a fertiliser. SA is a drought-stricken country and can
benefit from the industrialisation of this process, and coupled with other processes in a
biorefinery setting, could potentially produce high-value products. The biorefinery concept
contributes to seven of the sustainable development goals (SDGs), as it tackles many of the
issues relating to (i) infrastructure, (ii) renewable energy, (iii) pollution, (iv) responsible
production, (v) bridging the gap between different industries, (vi) promoting a circular economy,
and finally, addressing (vii) water and sanitation issues facing the manufacturing industry.
REFERENCES Page 58 of 71
REFERENCES
ADI® Systems. 2015. Upgrade to confectionery manufacturer’s wastewater treatment plant eliminates surcharges [Blog]. http://www.evoqua.com/en/brands/adi-systems/Pages/anmbr-upgrade-to-confectionery-manufacturers-plant-eliminates-surcharges.aspx [3 April. 2016]. Arancon, R.A.D., Lin, C.S.K., Chan, K.M., Kwan, T.H. & Luque, R. 2013. Advances on waste valorization: new horizons for a more sustainable society. Energy Science and Engineering, 1(2):53-71. Bajaj, I.B. & Singhal, R.S. 2011. Flocculation properties of poly(γ-glutamic acid) produced from Bacillus subtilis isolate. Food and Bioprocess Technology, 4(5):745-752. Bending, C., Kraxenberger, T. & Römer, L. 2015. Shaping the future with industrial biotechnology: new and efficient production processes for biopolymers. JSM Biotechnology and Bioengineering, 2(1):1025. 9pp. Birrer, G.A., Cromwick, A.M. & Gross, R.A. 1994. Gamma poly(glutamic acid) formation by Bacillus licheniformis 9945A: physiological and biochemical studies. International Journal of Biological Macromolecules, 16(5):265-275.
Borzani, W. 2008. Calculation of fermentation parameters from the results of a fed-batch test taking account of the volume of biomass in the fermenting medium. Brazilian Archives of Biology and Technology, 51(3):441-446. Boss, C.B., Fredeen, K.J. 1997. Concepts, Instrumentation and Techniques in Inductively Coupled Plasma Optical Emission Spectrometry. 2nd ed. The Perkin Elmer Corporation, USA. Brooks, A.N., Turkarslan, S., Beer, K.D. Yin Lo, F. & Baliga, N.S. 2011. Adaptation of cells to new environments. Wiley Interdisciplinary Reviews: Systems Biology and Medicine, 3(5):544-561. Bussiere, G. & Serpelloni, M. 1985. Confectionery and water activity determination of AW by calculation. In Simatos, D. & Multon, J.L. (eds). Properties of Water In Foods in Relation to Quality. Proceedings of the NATO Advanced Research Workshop on Influence of Water on Food Quality and Stability (ISOPOW III). Beaune, France, 11–16 September 1983. Dordrecht: Springer: 627-645. Chen, J., Shi, F., Zhang, B., Zhu, F., Cao, W., Xu, Z., Xu, G. & Cen, P. 2010. Effects of cultivation conditions on the production of γ-PGA with Bacillus ZJU-7. Applied Biochemistry and Biotechnology, 160(2):370-377. Das Nair, R., Nkhonjera, M. & Ziba, F. 2017. Growth and development in the sugar to confectionery value chain. CCRED Working Paper No. 2017/16. Johannesburg: CCRED. Digman, B. & Kim, D.S. 2008. Review: Alternative energy from food processing wastes. Environmental Progress, 27(4):524-537. Du, G., Yang, G., Qu, Y., Chen, J. & Lun, S. 2005. Effects of glycerol on the production of poly (γ-glutamic acid) by Bacillus licheniformis. Process Biochemistry, 40(6):2143-2147.
REFERENCES Page 59 of 71
Dutch Water Sector. 2014. Mars commissions Memthane wastewater treatment plant at world's largest chocolate factory in Veghel, the Netherlands. https://www.dutchwatersector.com/news-events/news/12127-mars-commissions-memthane-wastewater-treatment-plant-at-world-s-largest.html [20 June 2016}. Ecker, J., Schaffenberger, M., Koschuh, Mandl, M., Bochzelt, H. Schnitzer, H., Harasek, M. & Steinmüller, H. 2012. Green biorefinery upper Austria – Pilot plant operation. Separation and Purification Technology, 96:237-247. Edwards, W.P. 2000. The science of sugar confectionery. Cambridge: Royal Society of Chemistry.
Esa, F., Tasirin, S.M. & Rahman, N.A. 2014. Overview of bacterial cellulose production and application. Agriculture and Agricultural Science Procedia, 2:113-119.
Feng, X., Tang, B., Jiang, Y., Xu, Z., Lei, P., Liang, J. & Xu, H. 2016. Efficient production of poly-γ-glutamic acid from cane molasses by Bacillus subtilis NX-2 immobilized on chemically modified sugarcane bagasse. Journal of Chemical Technology and Biotechnology, 91(7):2085-2093. Fernando, S., Adhikari, S., Chandrapal, C. & Murali, N. 2006. Biorefineries: current status, challenges, and future direction. Energy and Fuels, 20(4):1727-1737.
Food and Drink Federation. 2012. Case studies: Mondelēz International. https://www.fdf.org.uk/environment/2012-case-studies-mondelez.aspx [20 June 2016]. Forage, A.J. 1979. Utilization of agricultural and food processing wastes containing carbohydrates. Chemical Society Reviews, 8:309-314. Freeman, S. 2011. Biological science. 4th ed. Upper Saddle River, NJ: Pearson Prentice Hall. García, I.L., Dorado Pérez, M.P., López, J.A., Villar, M.A., Yanniotis, S. & Koutinas, A. 2011. Valorisation of confectionary industry wastes for the microbial production of polyhydroxyalkanoates (FEW677). In Taoukis, P.S. et al. (eds). Food Process Engineering in a Changing World: Proceedings of the 11th International Congress on Engineering and Food (ICEFF 11), Athens, Greece, 22–26 May. Athens: National Technical University of Athens, Vol. II: 745-746.
Goto, A. & Kunioka, M. 1992. Biosynthesis and hydrolysis of poly (γ-glutamic acid) from Bacillus subtilis IFO 3335. Bioscience, Biotechnology, and Biochemistry, 56(7):1031-1035. Green Car Congress. 2006. Bacterial hydrogen production from confectionary [sic] waste. http://www.greencarcongress.com/2006/05/bacterial_hydro.html [5 July 2016].
Hall, B.G., Acar, H., Nandipati, A. & Barlow, M. 2014. Growth rates made easy. Molecular Biology and Evolution, 31(1):232-238. Harrison S.T.L., Verster, B., Mostert, L., Rumjeet, S., Raper, T., Rademeyer, S. & Johnstone-Robertson, M. 2016. Towards wastewater biorefineries: integrated bioreactor and process design for combined water treatment and resource productivity. Final Report. WRC Project No. K5/2380. Pretoria: Water Research Commission
REFERENCES Page 60 of 71
Harvey, D.T. 2011. Analytical Chemistry 2.0 – an open-access digital textbook. Analytical and Bioanalytical. Chemistry, 399(1):149-152. Heck, J.D., Gaworski, C.L., Rajendran, N. & Morrissey, R.L. 2002. Toxicologic evaluation of humectants added to cigarette tobacco: 13-week smoke inhalation study of glycerine and propylene glycol in Fischer 344 rats. Inhalation Toxicology, 14(11):1135-1152. Huang, J., Du, Y., Xu, G., Zhang, H., Zhu, F., Huang, L. & Xu, Z. 2011. High yield and cost-effective production of poly(γ-glutamic acid) with Bacillus subtilis. Engineering in Life Sciences, 11(3):291-297. IEA Bioenergy. n.d. Task 42: Biorefining. http://www.iea-bioenergy.task42-biorefineries.com/en/ieabiorefinery.htm [03 October 2014].
Inbaraj, B.S., Chiu, C.P., Ho, G.H., Yang, J. & Chen, B.H. 2006. Removal of cationic dyes from aqueous solution using an anionic poly-γ-glutamic acid-based adsorbent. Journal of Hazardous Materials, 137(1):226-234. Institute of Waste Management Southern Africa. 2007. Waste management. http://www.enviropaedia.com/topic/default.php?topic_id=239 [3 April 2016]. Ito, Y., Tanaka, T., Ohmachi, T. & Asada, Y. 1996. Glutamic acid independent production of poly(γ-glutamic acid) by Bacillus subtilis TAM-4. Bioscience, Biotechnology, and Biochemistry, 60(8):1239-1242. Jiang, Y., Tang, B., Xu, Z., Liu, K., Xu, Z., Feng, X. & Xu, H. 2016. Improvement of poly-γ-glutamic acid biosynthesis in a moving bed biofilm reactor by Bacillus subtilis NX-2. Bioresource Technology, 218:360-366. Jing, J.Y., Feng, J. & Li, W.Y. 2009. Carrier effects on oxygen mass transfer behavior in a moving-bed biofilm reactor. Asia-Pacific Journal of Chemical Engineering, 4(5):618-623.
Kamm, B., Gruber, P.R. & Kamm, M. (eds). 2006. Biorefineries – Industrial processes and products: status quo and future directions. Weinheim: Wiley VCH.
Kamstra, A., Blom, E. & Terjesen, B. F. 2017. Mixing and scale affect moving bed biofilm reactor (MBBR) performance. Aquacultural Engineering, 78(Part A):9-17.
Kane, A. 2015. Nestlé factory achieves zero waste to landfill. http://resource.co/article/nestl%C3%A9-factory-achieves-zero-waste-landfill-10145 [3 April 2016].
Kongklom, N., Luo, H., Shi, Z, Pechyen, C., Chisti, Y. & Sirisansaneeyakul, S. 2015. Production of poly-γ-glutamic acid by glutamic acid-independent Bacillus licheniformis TISTR 1010 using different feeding strategies. Biochemical Engineering Journal, 100:67-75.
REFERENCES Page 61 of 71
Kongklom, N., Shi, Z., Chisti, Y. & Sirisansaneeyakul, S. 2017. Enhanced production of poly-γ-glutamic acid by Bacillus licheniformis TISTR 1010 with environmental controls. Applied Biochemistry and Biotechnology, 182(3):990-999.
Kumar, R. & Pal, P. 2015. Fermentative production of poly (γ-glutamic acid) from renewable carbon source and downstream purification through a continuous membrane-integrated hybrid process. Bioresource Technology, 177:141-148.
Lees R. & Jackson E.B. 1973. Boiled sweets. In Lees, R. & Jackson, E.B. (eds). Sugar confectionery and chocolate manufacture. Boston, MA: Springer: 161-190.
Lie, S. 1973. The EBC-Ninhydrin method for determination of free alpha amino nitrogen. Journal of the Institute of Brewing, 79(1):37-41.
Lim, S.M., Kim, J., Shim, J.Y., Imm, B.Y., Sung, M.H. & Imm, J.Y. 2012. Effect of poly-γ-glutamic acids (PGA) on oil uptake and sensory quality in doughnuts. Food Science and Biotechnology, 21(1):247-252.
Link, H., Anselment, B. & Weuster-Botz, D. 2008. Leakage of adenylates during cold methanol/glycerol quenching of Escherichia coli. Metabolomics, 4(3):240-247.
López, J.A., Villar, M.A., Gracia, I., Pérez, M.P.D., Tsekuora. F., Tsekoura, F., Komaitis, M., Papanikolaou, S. & Koutinas, A. 2011. Valorisation of confectionery industry wastes for the microbial production of polyhydroxyalkanoates. http://www.icef11.org/content/papers/few/FEW677.pdf
Lunghi, P. & Burzacca, R. 2004. Energy recovery from industrial waste confectionery plant by means of BIGFC plant. Energy, 29(12–15):2601-2617.
Luo, L., Van der Voet, E. & Huppes, G. 2010. Biorefining of lignocellulosic feedstock – Technical, economic and environmental considerations. Bioresource Technology, 101(13):5023-5032.
Mabrouk, M. Abou-Zeid, D.M. & Sabra, W. 2012. Application of Plackett–Burman experimental design to evaluate nutritional requirements for poly (γ- glutamic acid) production in batch fermentation by Bacillus licheniformis A13. African Journal of Applied Microbiology Research, 1(2):6-18.
Madonsela, Z. 2013. Selection of bacterial species from wastewater for potential production of poly (γ-glutamic acid): isolation, characterisation and growth kinetics. Unpublished MSc dissertation, University of Cape Town, SA.
REFERENCES Page 62 of 71
Magnusson, B. 2010. Evaluation of pre-fermentation using confectionery waste products for two-stage anaerobic digestion. Unpublished PhD. Linköping Institute of Technology, Sweden.
Maier, R.M., Pepper, I.L. & Gerba, C.P. 2009. Environmental microbiology. 2nd ed. Burlington, MA: Academic Press.
Martins, S.I.F.S., Jongen, W.M.F. & van Boekel, M.A.J.S. 2001. A review of Maillard reaction in food and implications to kinetic modelling. Trends in Food Science & Technology, 11:364-373.
Matete, N. & Trois, C. 2008. Towards zero waste in emerging countries – A South African experience. Waste Management, 28(8):1480-1492.
Maurya, R., Paliwal, C., Ghosh, T., Pancha, I., Chokshi, K., Mitra, M., Ghosh, A. & Mishra, S. 2016. Applications of de-oiled microalgal biomass towards development of sustainable biorefinery. Bioresource Technology, 214:787-796.
Meissner, L., Kauffmann, K., Wengeler, T., Mitsunaga, H., Fukusaki, E. & Büchs, J. 2015. Influence of nitrogen source and pH value on undesired poly(γ-glutamic acid) formation of a protease producing Bacillus licheniformis strain. Journal of Industrial Microbiology and Technology, 42(9):1203-1215.
Miah, J.H., Griffiths, A., McNeill, R., Poonaji, I., Martin, R., Morse, S., Yang, A. & Sadhukhan, J. 2015. Creating an environmentally sustainable food factory: A case study of the lighthouse project at Nestlé. Procedia CIRP, 26:229-234.
Moraes, L.P., Alegre, R.M. & Brito, P. 2012. Optimisation of poly(γ-glutamic acid) production by Bacillus velezensis NRRL B-23189 in liquid fermentation with molasses as the carbon source without addition of glutamic acid. International Review of Chemical Engineering, 4(6):618-623.
Naidoo, C. 2013. Johannesburg Water’s foray into renewable energy. Civil Engineering Magazine, 21(5):7-8.
Navarro-Pineda, F.S., Baz-Rodríguez, S.A., Handler, R. & Sacremento-Rivera, J.C. 2016. Advances on the processing of Jatropha curcas towards a whole-crop biorefinery. Renewable and Sustainable Energy Reviews, 54:247-269. Luo, L., Van der Voet, E. & Huppes, G. 2010. Biorefining of lignocellulosic feedstock – Technical, economic and environmental considerations. Bioresource Technology, 101(13):5023-5032.
Oelofse, S.H. & Nahman, A. 2013. Estimating the magnitude of food waste generated in South Africa. Waste Management & Research: The Journal of the International Solid Wastes and Public Cleansing Association, 31(1):80-86.
REFERENCES Page 63 of 71
Ogunleye, A., Bhat, A., Irorere, V.U., Hill, D., Williams, C. & Radecka, I. 2015. Poly-γ-glutamic acid: production, properties and applications. Microbiology, 161(Part 1):1-17.
Olivier, C. 2015. Food waste, South Africa's shameful secret. Daily Maverick, September 3. https://www.dailymaverick.co.za/opinionista/2015-09-03-food-waste-south-africas-shameful-secret/#.V3prffl97IW [3 April 2016].
Ozgun, H., Karagul, N., Dereli, R.K., Ersahin, M.E., Coskuner, T., Ciftci, D.I, Ozturk, I. & Altinbas, M. 2012. Confectionery industry: a case study on treatability-based effluent characterization and treatment system performance. Water Science and Technology, 66(1):15-20.
Ozsoy, H.D. & Van Leeuwen, J.H. 2010. Removal of color from fruit candy waste by activated carbon adsorption. Journal of Food Engineering, 101(1):106-112.
Panesar, P.S. & Kaur, S. 2015. Bioutilisation of agro-industrial waste for lactic acid production. International Journal for Food Science and Technology, 50(10):2143-2151.
Peng, Y., Jiang, B., Zhang, T., Mu, W., Miao, M. & Hua, Y. 2015. High-level production of poly(γ-glutamic acid) by a newly isolated glutamate-independent strain, methylotrophicus. Process Biochemistry, 50(3):329-335.
Peristeris, O., Kilbourn, P.J. & Walters, J. 2015. Benchmarking supply chain management practices in a South African confectionery manufacturing organisation. Journal of Transport and Supply Chain Management, 9(1), Art. No.179. 9pp. Qu, L., Ren, L.J., Sun, G.N., Ji, X.J., Nie, Z.K. & Huang, H. 2013. Batch, fed-batch and repeated fed-batch fermentation processes of the marine thraustochytrid Schizochytrium sp. for producing docosahexaenoic acid. Bioprocess and Biosystems Engineering, 36(12):1905-1912. Rani, K.Y. & Rao, V.S.R. 1999. Control of fermenters: a review. Bioprocess Engineering, 21(1):77-88. Ravindran, R. & Jaiswal, A.K. 2015. Exploitation of food industry waste for high-value products. Trends in Biotechology, 34(1):58-68. Rolfe, M.D., Rice, C.J., Lucchini, S., Pin, C., Thompson, A., Cameron, A.D., Alston, M., Stringer, M.F., Betts, R.P., Baranyi, J., Peck, M.W. & Hinton, J.C. 2012. Lag phase is a distinct growth phase that prepares bacteria for exponential growth and involves transient metal accumulation. Journal of Bacteriology, 194(3):686-701. Rusín, J., Kašáková, K. & Chamrádová, K. 2015. Anaerobic digestion of waste wafer material from the confectionery production. Energy, 85:194-199.
REFERENCES Page 64 of 71
Shih, I.L & Wu, J.Y. 2009. Biosynthesis and application of poly (γ-glutamic acid). In Rehm, B.H.A. (ed.). Microbial production of biopolymers and polymer precursors: applications and perspectives. Norfolk: Caister Academic: 101-144. Shuler, M. L. & Kargi, F. 1992. Bioprocess engineering: basic concepts. 2nd ed. Upper Saddle River, NJ: Prentice Hall. Sibanda, M.B. 2009. Impact of molasses quality on ethyl alcohol fermentation by the yeast Saccharomyces cerevisiae. Unpublished MSc Engineering dissertation, University of Cape Town, SA. Singh, J., Kaushik, N. & Biswas, S. 2014. Bioreactors – technology & design analysis. The Scitech Journal, 1(6):28-36. Sirisansaneeyakul, S., Cao, M., Kongklom, N., Chuensangjun, C., Shi, Z. & Chisti, Y. 2017. Microbial production of poly-γ-glutamic acid. World Journal of Microbiology and Biotechnology, 33(9):173. Soliman N.A, Berekaa, M.M & Abdel-Fattah Y.R. 2005. Polyglutamic acid (PGA) production by Bacillus sp. SAB-26: application of Plackett-Burman experimental design to evaluate culture requirements. Applied Microbiology and Biotechnology, 69(3): 259-267. Sortwell, D.R. 2004. The tart of good taste: acidulants for confectionery. Food and Beverage Asia: 58-60, October. Spedding, G., Harrison, N.R., Ganske, F.& Dell, E.J. 2012. A new way to test the free amino nitrogen content in alcoholic beverages with the SPECTROstar® Nano. BMG Labtech05/2012. https://www.bmglabtech.com/a-new-way-to-test-the-free-amino-nitrogen-content-in-alcoholic-beverages-with-the-spectrostar-nano/. Sukan, A., Roy, I. & Keshavarz, T. 2015. Dual production of biopolymers from bacteria. Carbohydrate Polymers, 126:47-51. Šulc, R. & Ditl, P. 2017. Scale-up rules for flocculation. International Journal of Mineral Processing, 167:79-85. Tamis, J., Lužkov, K., Jiang, Y., Van Loosdrecht, M.C.M. & Kleerebezem, R. 2014. Enrichment of Plasticicumulans acidivorans at pilot-scale for PHA production on industrial wastewater. Journal of Biotechnology, 192(Part A):161-169. Tang, B., Xu, H., Xu, Z., Xu, C., Xu, Z., Lei, P., Qiu, Y., Liang, J. & Feng, X. 2015. Conversion of agroindustrial residues for high poly(γ-glutamic acid) production by Bacillus subtilis NX-2 via solid state fermentation. Bioresource Technology, 181:351-354. Tsakona, S., Kopsahelis, N., Chatzifragkou, A., Papanikolaou, S., Kookos, I.K. & Koutinas, A.A. 2014. Formulation of fermentation media from flour-rich waste streams for microbial lipid production by Lipomyces starkeyi. Journal of Biotechnology, 189:36-45. Tsouko, E., Kourmentza, C., Ladakis, D., Kopsahelis, N., Mandala, I., Papanikolaou, S., Paloukis, S., Alves, V. & Koutinas, A. 2015. Bacterial cellulose production from industrial waste and by- product streams. International Journal of Molecular Science, 16(7):14832-14849. Verster, B. Madonsela Z., Minnaar S., Cohen B. & Harrison S.T.L. 2014. Introducing the wastewater biorefinery concept: a scoping study of poly-glutamic acid production from Bacillus-
REFERENCES Page 65 of 71
rich mixed culture using municipal wastewater. Project K5/2000. Pretoria: Water Research Commission. Visser, W., Scheffers, W.A., Batenburg-Van der Vegte, W.H. & Dijken, J.P. 1990. Oxygen requirements of yeasts. Applied and Environmental Microbiology, 56(12):3785-3792. Weber, C.J., Haugaard, V., Festersen, R. & Bertelsen, G. 2002. Production and applications of biobased packaging materials for the food industry. Food Additives and Contaminants, 19(Suppl.):172-177. White, G.W. & Cakebread, S.H. 1966. The glassy state in certain sugar-containing food products. International Journal of Food Science and Technology, 1(1):73-82. Wrap. 2012. Enhancement and treatment of digestates from anaerobic digestion. Banbury: Wrap. http://www.wrap.org.uk/sites/files/wrap/Digestates%20from%20Anaerobic%20Digestion%20A%20review%20of%20enhancement%20techniques%20and%20novel%20digestate%20products_0.pdf Xu, H., Jiang, M., Li, H., Lu, D. & Ouyang, P. 2005. Efficient production of poly(γ-glutamic acid) by newly isolated Bacillus subtilis NX-2. Process Biochemistry, 40(2):519-523. Xu, Z., Feng, X., Zhang, D., Tang, B., Lei, P., Liang, J. & Xu, H. 2014. Enhanced poly(γ-glutamic acid) fermentation by Bacillus subtilis NX-2 immobilised in aerobic plant fibrous-bed bioreactor. Bioresource Technology, 155:8-14. Zeng, W., Chen, G., Wang, Q., Zheng, S., Shu, L. & Liang, Z. 2014. Metabolic studies of temperature control strategy on poly(γ-glutamic acid) production in a thermophilic strain Bacillus subtilis GXA-28. Bioresource Technology, 155:104-110. Zeng, W., Chen, G., Zhange, Y., Wu, K. & Liang, Z. 2012. Studies on the UV spectrum of poly(-glutamic acid) based on development of a simple quantitative method. International Journal of Biological Macromolecules, 51:83-90. Zhang, D., Feng, X., Zhou, Z., Zhang, Y. & Xu, H. 2012. Economical production of poly(γ-glutamic acid) using untreated cane molasses and monosodium glutamate waste liquor by Bacillus subtilis NX-2. Bioresource Technology, 114:583-588. Zhu, F., Cai, J., Zheng, Q., Zhu, X., Cena, P. & Xu, Z. 2014. A novel approach for poly-γ-glutamic acid production using xylose and corncob fibres hydrolysate in Bacillus subtillis HB-1. Journal of Chemical Technology and Biotechnology, 89(4):616-622.

STANDARD PROCEDURES Page 67 of 71
APPENDIX A: STANDARD PROCEDURES
Table: A-1 Tryptone soy agar
Component Concentration (g/L)
Tryptone soy 30
Agar bacteriological 15
Table A-2 Composition of basal medium
Component Concentration (g/L)
CaCl2.2H2O 0.15
Citric acid 12
FeCl3.6H2O 0.04
Glycerol 1
K2HPO4 2.99
MgSO4.7H2O 0.5
MnSO4.H2O 0.104
NH4Cl 3.48
A.1 HPLC method for sugars
Standard
A stock solution of a mixture of 10 g/L citric acid, fructose, glucose and sucrose was prepared.
The mobile phase consisted of 2 L of 5 mM H2SO4 prepared and vacuum filtered through a
0.22 µm filter and degassed in a sonication bath under vacuum for 1 h. The stock solution was
diluted into a series of dilutions ranging between 200 mg/L and 1000 mg/L in 2 mL Eppendorf
tubes. 1.5 mL of each sample was then syringe filtered into glass HPLC vials using 0.22 µm
syringe filters.
Sample
All experimental samples were diluted five times with mobile phase and syringe filtered into
HPLC vials ready for analysis.
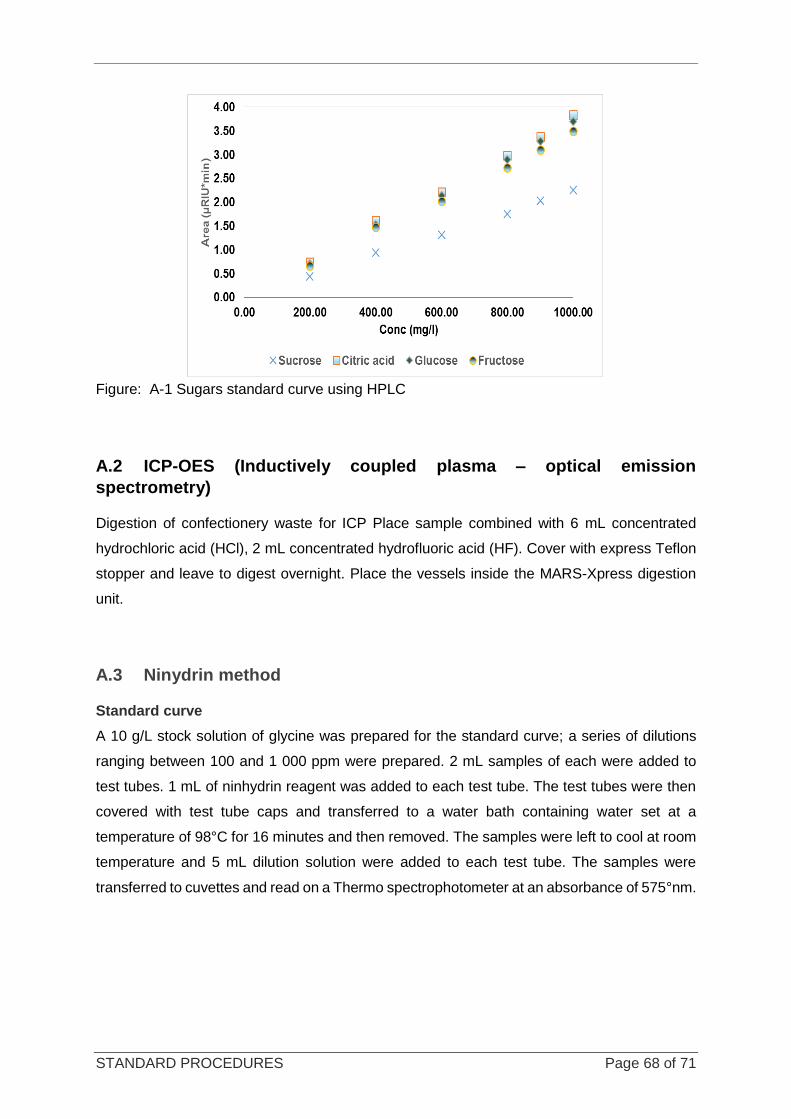
STANDARD PROCEDURES Page 68 of 71
Figure: A-1 Sugars standard curve using HPLC
A.2 ICP-OES (Inductively coupled plasma – optical emission
spectrometry)
Digestion of confectionery waste for ICP Place sample combined with 6 mL concentrated
hydrochloric acid (HCl), 2 mL concentrated hydrofluoric acid (HF). Cover with express Teflon
stopper and leave to digest overnight. Place the vessels inside the MARS-Xpress digestion
unit.
A.3 Ninydrin method
Standard curve
A 10 g/L stock solution of glycine was prepared for the standard curve; a series of dilutions
ranging between 100 and 1 000 ppm were prepared. 2 mL samples of each were added to
test tubes. 1 mL of ninhydrin reagent was added to each test tube. The test tubes were then
covered with test tube caps and transferred to a water bath containing water set at a
temperature of 98°C for 16 minutes and then removed. The samples were left to cool at room
temperature and 5 mL dilution solution were added to each test tube. The samples were
transferred to cuvettes and read on a Thermo spectrophotometer at an absorbance of 575°nm.
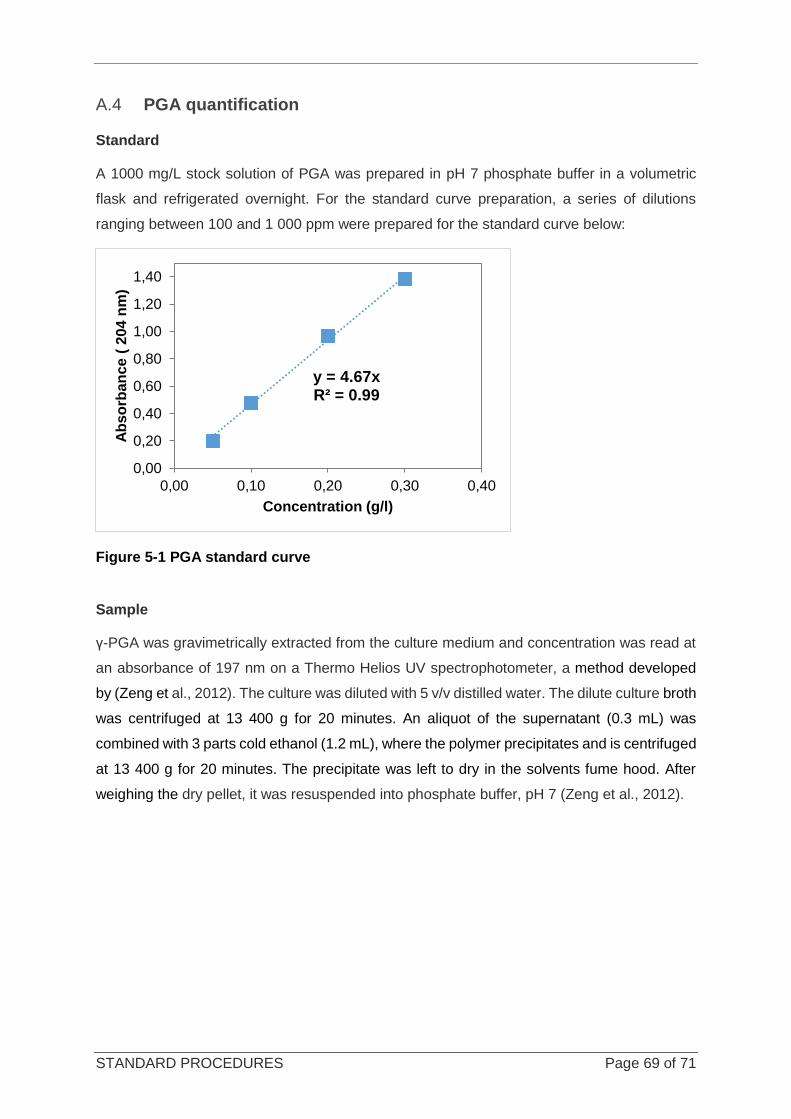
STANDARD PROCEDURES Page 69 of 71
A.4 PGA quantification
Standard
A 1000 mg/L stock solution of PGA was prepared in pH 7 phosphate buffer in a volumetric
flask and refrigerated overnight. For the standard curve preparation, a series of dilutions
ranging between 100 and 1 000 ppm were prepared for the standard curve below:
Figure 5-1 PGA standard curve
Sample
γ-PGA was gravimetrically extracted from the culture medium and concentration was read at
an absorbance of 197 nm on a Thermo Helios UV spectrophotometer, a method developed
by (Zeng et al., 2012). The culture was diluted with 5 v/v distilled water. The dilute culture broth
was centrifuged at 13 400 g for 20 minutes. An aliquot of the supernatant (0.3 mL) was
combined with 3 parts cold ethanol (1.2 mL), where the polymer precipitates and is centrifuged
at 13 400 g for 20 minutes. The precipitate was left to dry in the solvents fume hood. After
weighing the dry pellet, it was resuspended into phosphate buffer, pH 7 (Zeng et al., 2012).
y = 4.67xR² = 0.99
0,00
0,20
0,40
0,60
0,80
1,00
1,20
1,40
0,00 0,10 0,20 0,30 0,40
Ab
so
rban
ce
( 2
04
nm
)
Concentration (g/l)
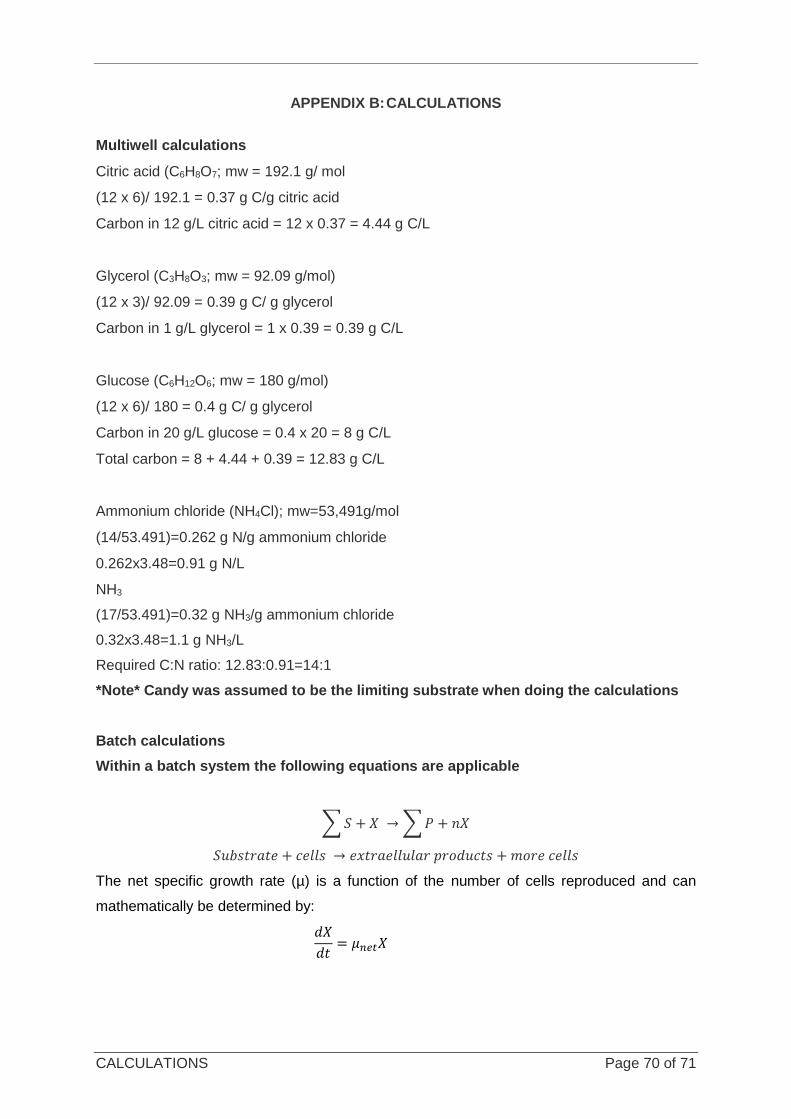
CALCULATIONS Page 70 of 71
APPENDIX B: CALCULATIONS
Multiwell calculations
Citric acid (C6H8O7; mw = 192.1 g/ mol
(12 x 6)/ 192.1 = 0.37 g C/g citric acid
Carbon in 12 g/L citric acid = 12 x 0.37 = 4.44 g C/L
Glycerol (C3H8O3; mw = 92.09 g/mol)
(12 x 3)/ 92.09 = 0.39 g C/ g glycerol
Carbon in 1 g/L glycerol = 1 x 0.39 = 0.39 g C/L
Glucose (C6H12O6; mw = 180 g/mol)
(12 x 6)/ 180 = 0.4 g C/ g glycerol
Carbon in 20 g/L glucose = 0.4 x 20 = 8 g C/L
Total carbon = 8 + 4.44 + 0.39 = 12.83 g C/L
Ammonium chloride (NH4Cl); mw=53,491g/mol
(14/53.491)=0.262 g N/g ammonium chloride
0.262x3.48=0.91 g N/L
NH3
(17/53.491)=0.32 g NH3/g ammonium chloride
0.32x3.48=1.1 g NH3/L
Required C:N ratio: 12.83:0.91=14:1
*Note* Candy was assumed to be the limiting substrate when doing the calculations
Batch calculations
Within a batch system the following equations are applicable
∑ 𝑆 + 𝑋 → ∑ 𝑃 + 𝑛𝑋
𝑆𝑢𝑏𝑠𝑡𝑟𝑎𝑡𝑒 + 𝑐𝑒𝑙𝑙𝑠 → 𝑒𝑥𝑡𝑟𝑎𝑒𝑙𝑙𝑢𝑙𝑎𝑟 𝑝𝑟𝑜𝑑𝑢𝑐𝑡𝑠 + 𝑚𝑜𝑟𝑒 𝑐𝑒𝑙𝑙𝑠
The net specific growth rate (µ) is a function of the number of cells reproduced and can
mathematically be determined by:
𝑑𝑋
𝑑𝑡= 𝜇𝑛𝑒𝑡𝑋
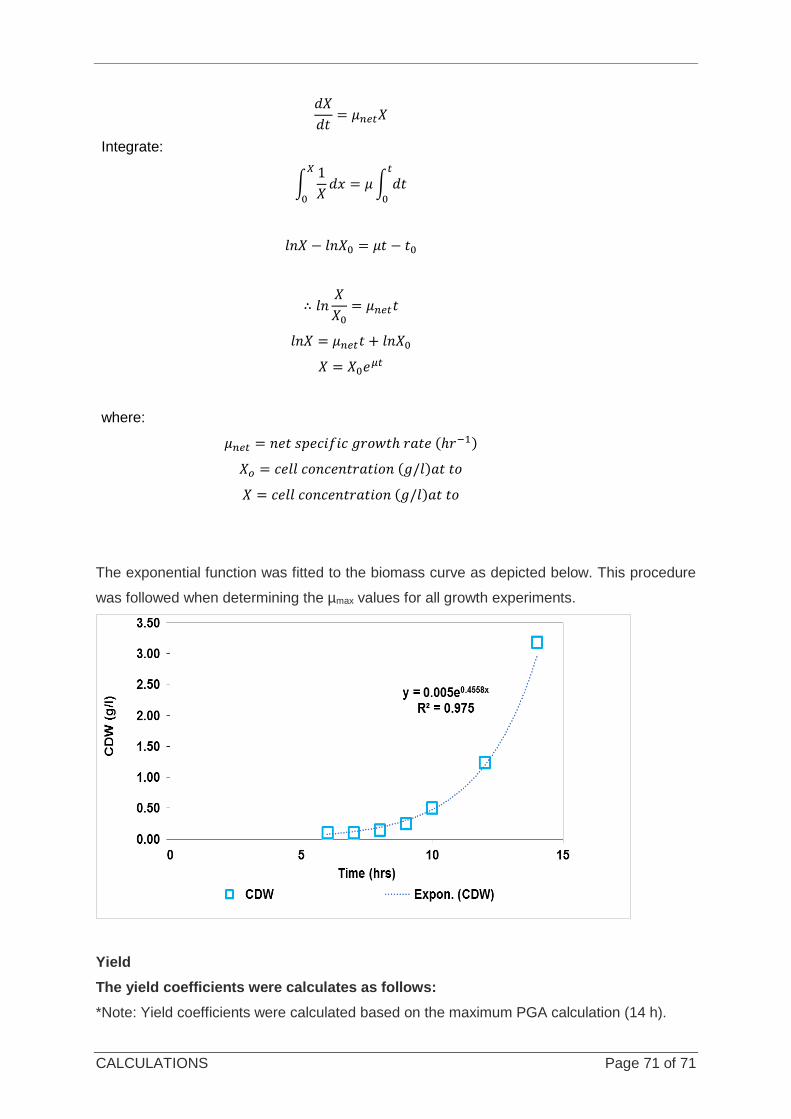
CALCULATIONS Page 71 of 71
𝑑𝑋
𝑑𝑡= 𝜇𝑛𝑒𝑡𝑋
Integrate:
∫1
𝑋
𝑋
0
𝑑𝑥 = 𝜇 ∫ 𝑑𝑡𝑡
0
𝑙𝑛𝑋 − 𝑙𝑛𝑋0 = 𝜇𝑡 − 𝑡0
∴ 𝑙𝑛𝑋
𝑋0= 𝜇𝑛𝑒𝑡𝑡
𝑙𝑛𝑋 = 𝜇𝑛𝑒𝑡𝑡 + 𝑙𝑛𝑋0
𝑋 = 𝑋0𝑒𝜇𝑡
where:
𝜇𝑛𝑒𝑡 = 𝑛𝑒𝑡 𝑠𝑝𝑒𝑐𝑖𝑓𝑖𝑐 𝑔𝑟𝑜𝑤𝑡ℎ 𝑟𝑎𝑡𝑒 (ℎ𝑟−1)
𝑋𝑜 = 𝑐𝑒𝑙𝑙 𝑐𝑜𝑛𝑐𝑒𝑛𝑡𝑟𝑎𝑡𝑖𝑜𝑛 (𝑔/𝑙)𝑎𝑡 𝑡𝑜
𝑋 = 𝑐𝑒𝑙𝑙 𝑐𝑜𝑛𝑐𝑒𝑛𝑡𝑟𝑎𝑡𝑖𝑜𝑛 (𝑔/𝑙)𝑎𝑡 𝑡𝑜
The exponential function was fitted to the biomass curve as depicted below. This procedure
was followed when determining the µmax values for all growth experiments.
Yield
The yield coefficients were calculates as follows:
*Note: Yield coefficients were calculated based on the maximum PGA calculation (14 h).
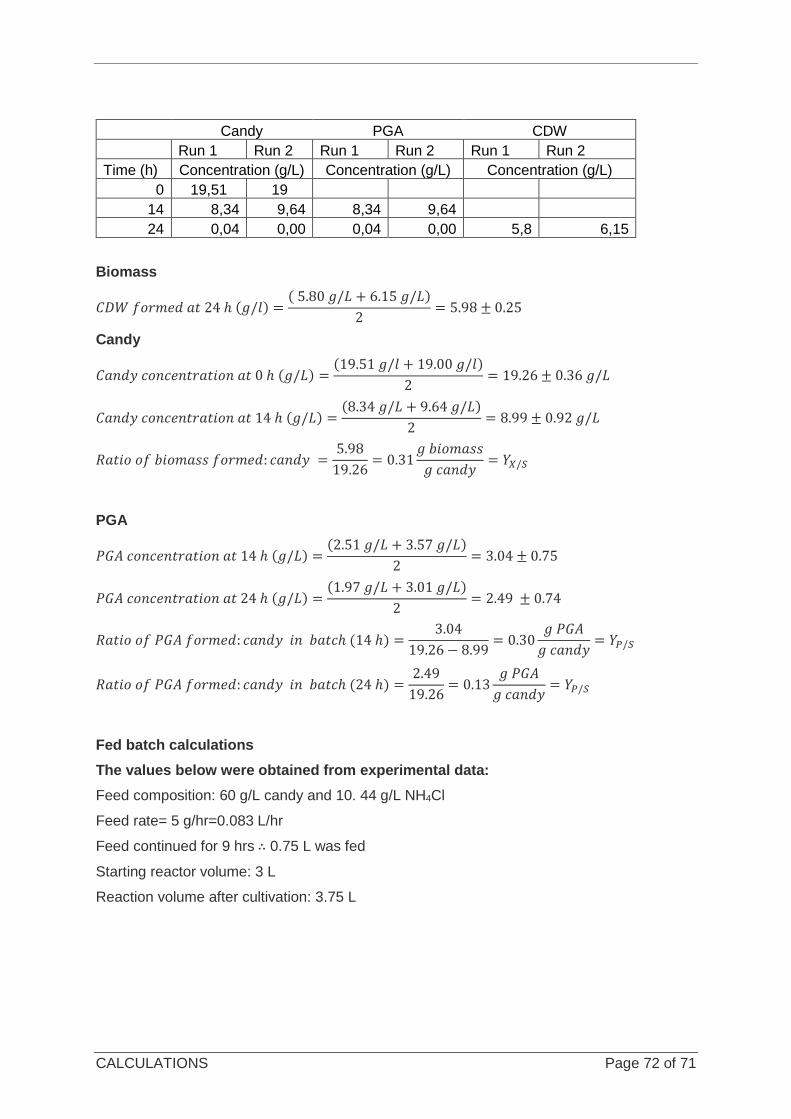
CALCULATIONS Page 72 of 71
Candy PGA CDW
Run 1 Run 2 Run 1 Run 2 Run 1 Run 2
Time (h) Concentration (g/L) Concentration (g/L) Concentration (g/L)
0 19,51 19
14 8,34 9,64 8,34 9,64
24 0,04 0,00 0,04 0,00 5,8 6,15
Biomass
𝐶𝐷𝑊 𝑓𝑜𝑟𝑚𝑒𝑑 𝑎𝑡 24 ℎ (𝑔/𝑙) =( 5.80 𝑔/𝐿 + 6.15 𝑔/𝐿)
2= 5.98 ± 0.25
Candy
𝐶𝑎𝑛𝑑𝑦 𝑐𝑜𝑛𝑐𝑒𝑛𝑡𝑟𝑎𝑡𝑖𝑜𝑛 𝑎𝑡 0 ℎ (𝑔/𝐿) =(19.51 𝑔/𝑙 + 19.00 𝑔/𝑙)
2= 19.26 ± 0.36 𝑔/𝐿
𝐶𝑎𝑛𝑑𝑦 𝑐𝑜𝑛𝑐𝑒𝑛𝑡𝑟𝑎𝑡𝑖𝑜𝑛 𝑎𝑡 14 ℎ (𝑔/𝐿) =(8.34 𝑔/𝐿 + 9.64 𝑔/𝐿)
2= 8.99 ± 0.92 𝑔/𝐿
𝑅𝑎𝑡𝑖𝑜 𝑜𝑓 𝑏𝑖𝑜𝑚𝑎𝑠𝑠 𝑓𝑜𝑟𝑚𝑒𝑑: 𝑐𝑎𝑛𝑑𝑦 =5.98
19.26= 0.31
𝑔 𝑏𝑖𝑜𝑚𝑎𝑠𝑠
𝑔 𝑐𝑎𝑛𝑑𝑦= 𝑌𝑋/𝑆
PGA
𝑃𝐺𝐴 𝑐𝑜𝑛𝑐𝑒𝑛𝑡𝑟𝑎𝑡𝑖𝑜𝑛 𝑎𝑡 14 ℎ (𝑔/𝐿) =(2.51 𝑔/𝐿 + 3.57 𝑔/𝐿)
2= 3.04 ± 0.75
𝑃𝐺𝐴 𝑐𝑜𝑛𝑐𝑒𝑛𝑡𝑟𝑎𝑡𝑖𝑜𝑛 𝑎𝑡 24 ℎ (𝑔/𝐿) =(1.97 𝑔/𝐿 + 3.01 𝑔/𝐿)
2= 2.49 ± 0.74
𝑅𝑎𝑡𝑖𝑜 𝑜𝑓 𝑃𝐺𝐴 𝑓𝑜𝑟𝑚𝑒𝑑: 𝑐𝑎𝑛𝑑𝑦 𝑖𝑛 𝑏𝑎𝑡𝑐ℎ (14 ℎ) =3.04
19.26 − 8.99= 0.30
𝑔 𝑃𝐺𝐴
𝑔 𝑐𝑎𝑛𝑑𝑦= 𝑌𝑃/𝑆
𝑅𝑎𝑡𝑖𝑜 𝑜𝑓 𝑃𝐺𝐴 𝑓𝑜𝑟𝑚𝑒𝑑: 𝑐𝑎𝑛𝑑𝑦 𝑖𝑛 𝑏𝑎𝑡𝑐ℎ (24 ℎ) =2.49
19.26= 0.13
𝑔 𝑃𝐺𝐴
𝑔 𝑐𝑎𝑛𝑑𝑦= 𝑌𝑃/𝑆
Fed batch calculations
The values below were obtained from experimental data:
Feed composition: 60 g/L candy and 10. 44 g/L NH4Cl
Feed rate= 5 g/hr=0.083 L/hr
Feed continued for 9 hrs ∴ 0.75 L was fed
Starting reactor volume: 3 L
Reaction volume after cultivation: 3.75 L
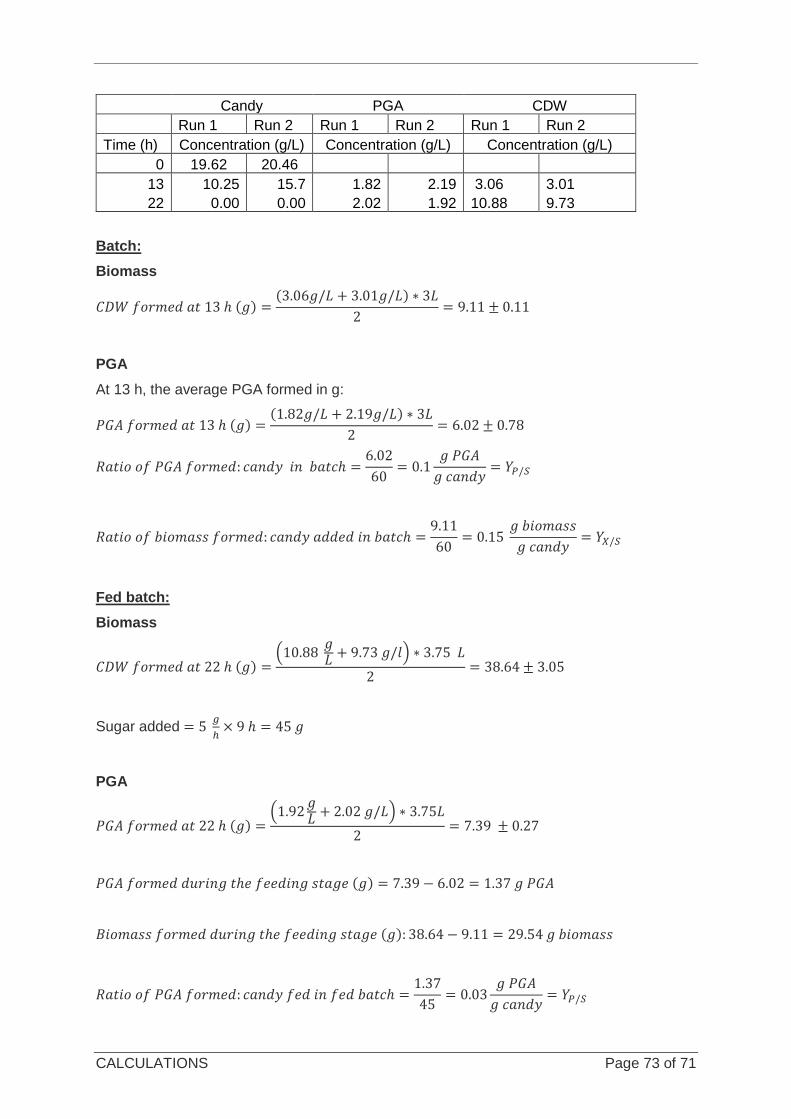
CALCULATIONS Page 73 of 71
Candy PGA CDW
Run 1 Run 2 Run 1 Run 2 Run 1 Run 2
Time (h) Concentration (g/L) Concentration (g/L) Concentration (g/L)
0 19.62 20.46
13 10.25 15.7 1.82 2.19 3.06 3.01
22 0.00 0.00 2.02 1.92 10.88 9.73
Batch:
Biomass
𝐶𝐷𝑊 𝑓𝑜𝑟𝑚𝑒𝑑 𝑎𝑡 13 ℎ (𝑔) =(3.06𝑔/𝐿 + 3.01𝑔/𝐿) ∗ 3𝐿
2= 9.11 ± 0.11
PGA
At 13 h, the average PGA formed in g:
𝑃𝐺𝐴 𝑓𝑜𝑟𝑚𝑒𝑑 𝑎𝑡 13 ℎ (𝑔) =(1.82𝑔/𝐿 + 2.19𝑔/𝐿) ∗ 3𝐿
2= 6.02 ± 0.78
𝑅𝑎𝑡𝑖𝑜 𝑜𝑓 𝑃𝐺𝐴 𝑓𝑜𝑟𝑚𝑒𝑑: 𝑐𝑎𝑛𝑑𝑦 𝑖𝑛 𝑏𝑎𝑡𝑐ℎ =6.02
60= 0.1
𝑔 𝑃𝐺𝐴
𝑔 𝑐𝑎𝑛𝑑𝑦= 𝑌𝑃/𝑆
𝑅𝑎𝑡𝑖𝑜 𝑜𝑓 𝑏𝑖𝑜𝑚𝑎𝑠𝑠 𝑓𝑜𝑟𝑚𝑒𝑑: 𝑐𝑎𝑛𝑑𝑦 𝑎𝑑𝑑𝑒𝑑 𝑖𝑛 𝑏𝑎𝑡𝑐ℎ =9.11
60= 0.15
𝑔 𝑏𝑖𝑜𝑚𝑎𝑠𝑠
𝑔 𝑐𝑎𝑛𝑑𝑦= 𝑌𝑋/𝑆
Fed batch:
Biomass
𝐶𝐷𝑊 𝑓𝑜𝑟𝑚𝑒𝑑 𝑎𝑡 22 ℎ (𝑔) =(10.88
𝑔𝐿 + 9.73 𝑔/𝑙) ∗ 3.75 𝐿
2= 38.64 ± 3.05
Sugar added = 5 𝑔
ℎ× 9 ℎ = 45 𝑔
PGA
𝑃𝐺𝐴 𝑓𝑜𝑟𝑚𝑒𝑑 𝑎𝑡 22 ℎ (𝑔) =(1.92
𝑔𝐿 + 2.02 𝑔/𝐿) ∗ 3.75𝐿
2= 7.39 ± 0.27
𝑃𝐺𝐴 𝑓𝑜𝑟𝑚𝑒𝑑 𝑑𝑢𝑟𝑖𝑛𝑔 𝑡ℎ𝑒 𝑓𝑒𝑒𝑑𝑖𝑛𝑔 𝑠𝑡𝑎𝑔𝑒 (𝑔) = 7.39 − 6.02 = 1.37 𝑔 𝑃𝐺𝐴
𝐵𝑖𝑜𝑚𝑎𝑠𝑠 𝑓𝑜𝑟𝑚𝑒𝑑 𝑑𝑢𝑟𝑖𝑛𝑔 𝑡ℎ𝑒 𝑓𝑒𝑒𝑑𝑖𝑛𝑔 𝑠𝑡𝑎𝑔𝑒 (𝑔): 38.64 − 9.11 = 29.54 𝑔 𝑏𝑖𝑜𝑚𝑎𝑠𝑠
𝑅𝑎𝑡𝑖𝑜 𝑜𝑓 𝑃𝐺𝐴 𝑓𝑜𝑟𝑚𝑒𝑑: 𝑐𝑎𝑛𝑑𝑦 𝑓𝑒𝑑 𝑖𝑛 𝑓𝑒𝑑 𝑏𝑎𝑡𝑐ℎ =1.37
45= 0.03
𝑔 𝑃𝐺𝐴
𝑔 𝑐𝑎𝑛𝑑𝑦= 𝑌𝑃/𝑆
CALCULATIONS Page 74 of 71
𝑅𝑎𝑡𝑖𝑜 𝑜𝑓 𝑏𝑖𝑜𝑚𝑎𝑠𝑠 𝑓𝑜𝑟𝑚𝑒𝑑: 𝑐𝑎𝑛𝑑𝑦 𝑓𝑒𝑑 𝑖𝑛 𝑓𝑒𝑑 𝑏𝑎𝑡𝑐ℎ =29.54
45= 0.66
𝑔 𝑏𝑖𝑜𝑚𝑎𝑠𝑠
𝑔 𝑐𝑎𝑛𝑑𝑦= 𝑌𝑋/𝑆