Embed Size (px)
Citation preview

Pollution Regulation and theEfficiency Gains fromTechnological Innovation
Ian W. H. Parry
Discussion Paper 98-04
October 1997
1616 P Street, NWWashington, DC 20036Telephone 202-328-5000Fax 202-939-3460
© 1997 Resources for the Future. All rights reserved.No portion of this paper may be reproduced withoutpermission of the author.
Discussion papers are research materials circulated by theirauthors for purposes of information and discussion. Theyhave not undergone formal peer review or the editorial
treatment accorded RFF books and other publications.

ii
Pollution Regulation and the Efficiency Gainsfrom Technological Innovation
Ian W. H. Parry
Abstract
Previous studies suggest that emissions taxes are more efficient at stimulating thedevelopment of improved pollution abatement technologies than other policy instruments,such as (non-auctioned) tradable emissions permits. We present results from a competitivemodel that cast some doubt on the empirical importance of this assertion. For example, wefind that efficiency in the market for “environmental R&D” under tradable permits is typicallyless than 6 percent lower than that under an emissions tax for innovations that reducepollution abatement costs by 10 percent or less. However the discrepancy is more significantin the case of more major innovations.
We also find that the presence of R&D spillovers per se does not necessarily implylarge inefficiency in the R&D market. For example, efficiency in the R&D market under aPigouvian emissions tax is generally more than 90 percent of that in the first best outcome ifthe private benefit from innovation exceeds 50 percent of the social benefit. Thus the R&Dspillover effect must substantially limit the private benefit from R&D in our analysis for therebe a potentially “large” efficiency gain from additional policies -- such as research subsidies --to stimulate innovation.
Key Words: emissions tax; tradable emissions permits; performance standard; R&D;efficiency effects; patents.
JEL Classification Nos.: Q28, O38.

iii
Table of Contents
1. Introduction .................................................................................................................. 1
2. The Social Planning Model ........................................................................................... 3
A. Model Assumptions ............................................................................................... 3
B. Socially Optimal Outcome ..................................................................................... 5
(i) Output and Emissions .................................................................................... 5
(ii) R&D .............................................................................................................. 6
C. Additional Assumptions in the Decentralized Market Model .................................. 8
3. Emissions Tax .............................................................................................................. 9
A. Model Solution ...................................................................................................... 9
(i) Output and Emissions .................................................................................... 9
(ii) R&D .............................................................................................................11
B. Parameter Values ..................................................................................................12
C. Simulations ...........................................................................................................13
4. Performance Standard ..................................................................................................14
A. Model Solution .....................................................................................................15
(i) Fixed Standard ..............................................................................................15
(ii) Flexible Standard ..........................................................................................16
B. Simulations ...........................................................................................................17
5. Tradable Emissions Permits .........................................................................................19
A. Equilibrium Conditions .........................................................................................19
(i) Fixed Permits ................................................................................................19
(ii) Flexible Permits ............................................................................................20
B. Simulations ...........................................................................................................21
6. Conclusion ...................................................................................................................22
References ..........................................................................................................................24
List of Figures and Tables
Figure 1. Optimal Industry Output ..................................................................................... 7
Figure 2. Optimum Abatement per Firm ...........................................................................16
Table 1. The R&D Efficiency Gain from an Emissions Tax ............................................14
Table 2. The R&D Efficiency Gain from an Emissions Standard .....................................18
Table 3. The R&D Efficiency Gain under Tradable Emissions Permits ...........................21

1
POLLUTION REGULATION AND THE EFFICIENCY GAINSFROM TECHNOLOGICAL INNOVATION
Ian W. H. Parry*
1. INTRODUCTION
Traditionally, economists have focused on the static efficiency impacts of pollutionregulations.1 These are determined by the environmental benefits and economic costs frominstantaneous reductions in pollution, given the current state of technology. In a dynamiccontext however, the state of technology is endogenous. This means that pollution regulationscan also affect efficiency through their impact on the incentives for technological innovation.This paper focuses on the efficiency gain from “environmental R&D” -- that is, R&D intoimproved pollution abatement technologies -- induced by alternative environmental policyinstruments. We refer to this as the R&D efficiency gain.
The potential for an R&D efficiency gain arises because of two potential externalityproblems associated with environmental R&D. First, innovating firms are unlikely to takeinto account spillover benefits to other firms in an industry that might be able to adopt newabatement technologies. Second -- in the absence of regulation -- firms may lack incentivesto adopt technologies that produce environmental benefits.
Previous studies have shown that emissions taxes are potentially more effective atstimulating environmental R&D than other instruments such as (non-auctioned) tradableemissions permits and performance standards.2 The problem with tradable permits is that thediffusion of cleaner technologies drives down the equilibrium permit price. This reduces theprivate gains from adopting cleaner technologies, since these gains include the revenues fromselling “spare” emissions permits.3 The problem with a performance standard is that firmsmay not reduce the level of emissions per unit of output to the ex post optimal level,following the adoption of a cleaner technology. Again, this reduces the private benefit fromadopting cleaner technologies. (These issues are discussed in more detail below).
* Fellow, Energy and Natural Resources Division, Resources for the Future. I am grateful to Dallas Burtraw,Jim Boyd, Mike Toman, and other colleagues at RFF for very helpful comments and suggestions.1 See for example the survey in Cropper and Oates (1992).2 For analytical models see Milliman and Prince (1989), Downing and White (1986), Jung et al. (1996) andParry (1996). Econometric studies find that environmental policies have had a significant effect on theincentives to invent and adopt cleaner technologies over time (for example Newell et al., 1996), and that theseincentives are greater under emissions taxes and tradable emissions permits than command and controlregulations (Jaffe and Stavins, 1995).3 However this problem could be avoided if the permits were auctioned by the regulatory agency (Milliman andPrince, 1989) or if the regulatory agency were willing to buy back permits at the initial market price (Parry, 1996).

Ian W. H. Parry RFF 98-04
2
In addition, previous studies have shown that even under an emissions tax (set at thePigouvian level) the amount of environmental R&D may be suboptimal.4 This is because aninnovating firm may not be able to appropriate the full social benefits from a new technologywhen there are spillover benefits to other firms. This suggests there may be an important casefor stimulating more innovation, either by raising the level of emissions tax or by usingsupplementary instruments such as research subsidies and prizes.
This paper investigates under what conditions there might be a potentially “large”R&D efficiency gain from using emissions taxes over other policy instruments and fromstimulating additional innovation under an emissions tax. We begin by deriving the first-bestefficiency gain from environmental R&D using a social planning model. We then derive theR&D efficiency gain in a decentralized version of the model under an emissions tax, aperformance standard and tradable emissions permits, assuming the Pigouvian level ofregulation is imposed. Simulations of the relative R&D efficiency gain in each case are thenpresented, using a wide range of values for the relevant parameters.
We find that efficiency in the R&D market is not necessarily much lower undertradable permits than emissions taxes, assuming environmental policies are set at ex anteoptimal levels. This crucially depends on the potential size of innovations, since thisdetermines whether the impact on the permit price will be substantial or not. For example, theR&D efficiency gain is typically less than 6 percent lower than that under the emissions taxfor an innovation that reduces pollution abatement costs by 10 percent or less. It is around10-40 percent lower for innovations that reduce abatement costs by 40 percent. The relativeefficiency discrepancy between the emissions tax and performance standard is somewhatlarger, although again is very sensitive to the potential size of innovation. Moreover, theefficiency differences between the policy instruments would be eliminated, more-or-less, ifthe instruments could be adjusted to their ex post Pigouvian levels following innovation.
We also find that the presence of R&D spillovers per se does not necessarily implylarge inefficiencies in the R&D market. For example, if the private benefit from innovation is50 percent or more of the social benefit, the R&D efficiency gain under the emissions tax is atleast 90 percent of that in the first-best outcome. This is because a “common pool” effecttends to counteract the effect of imperfect appropriability. Competition for a given amount ofinnovation rent is excessive because firms do not take into account the impact of theirresearch on reducing the likelihood that other firms will obtain imitation rents. However, incases where the lack of appropriability leads to a more dramatic divergence between theprivate and social benefits from innovation, the efficiency gains from inducing additionalenvironmental R&D can be more substantial.
4 See Biglaiser and Horrowitz (1995) and Parry (1995).

Ian W. H. Parry RFF 98-04
3
Our model is simplified in a number of respects to keep the analysis transparent andtractable. For example, we ignore heterogeneity among firms and the possibility of strategicbehavior in the R&D market. Nonetheless the analysis does provide a useful starting point forassessing under what conditions the R&D efficiency gain from using emissions taxes overother environmental policy instruments, or using additional incentives to stimulate innovation,are likely to be empirically important or not.
The next section outlines the model and derives the first-best R&D efficiency gainfrom the social planner’s optimization problem. The following three sections solve thedecentralized version of the model under an emissions tax, performance standard and tradableemissions permits, and present the empirical results. Section 6 concludes and discusses somequalifications to the results.
2. THE SOCIAL PLANNING MODEL5
In this section we begin by describing the model assumptions. We then solve thesocial planner’s optimization problem for the first-best level of production, waste emissionsand environmental R&D. This enables us to derive the first-best R&D efficiency gain.Finally, we describe some additional assumptions necessary to solve the decentralized versionof the model in subsequent sections.
A. Model Assumptions
Throughout the analysis we employ quadratic functional forms; that is, marginalbenefits and marginal costs are assumed to be linear. This assumption (in general) enables usto solve the model analytically.6
We assume that a large number of identical firms produce a good X that is consumed byhouseholds (for example electricity). The inverse demand function for X is P(X), where P′ < 0and P′′ = 0. X is produced under constant returns to scale and the cost per unit of producing X isc > 0. Therefore the supply curve of X is perfectly elastic. We choose units of X such that eachfirm produces one unit.7
5 The analytical model used below shares some features of that in Parry (1995), which in turn merged a model ofthe R&D market by Wright (1983) with a model of an environmental externality. The model below differs fromthat in Parry (1995) by allowing for variability in the emissions to final output ratio, and in considering a widerrange of policy instruments. Unlike Parry (1995), we also implement the model empirically.6 Our objective is to indicate approximate empirical magnitudes using explicit formulas. To empirically solvethe model under non-quadratic functional forms would typically require numerical simulation techniques. Thiscan provide more accuracy, but at the expense of less transparency.7 Allowing firms to have U-shaped average cost curves and to choose their level of output does not affect theresults of the analysis.

Ian W. H. Parry RFF 98-04
4
The production of X involves the discharge of waste emissions. These emissionscause environmental damages that are external to the industry.8 Production firms can reducetheir emissions per unit of X by employing inputs in abatement activities.9 We normalizeemissions such that emissions per firm in the absence of abatement activities would be unity.Actual emissions per firm are then e∆−1 where ∆e is the reduction in emissions per unit of Xfrom abatement. The firm’s abatement cost function takes the following quadratic form:a e∆ 2 2/ , where the parameter a > 0. Thus the marginal cost of abatement is increasing (this
is a typical empirical finding).Industry emissions are (1− ∆e )X. We assume that environmental damages are
h e X( )1 − ∆ , that is, proportional to total emissions, where the parameter h > 0 is marginal
environmental damage. (The implications of convex environmental damages are brieflydiscussed in Section 6).
In addition to the production sector, there is an R&D sector where a large number offirms attempt to invent a new emissions abatement technology. If discovered and adopted thistechnology would reduce abatement costs in the production sector to ( ) /1 22− r a e∆ , that is by
a proportionate amount r ( 0 1< <r ).10 Following Wright (1983), we assume that each R&Dfirm conducts one independent R&D project, and the number of firms is M. The probabilitythat the new technology will be discovered (by at least one firm) is given by the followingquadratic function:
π β β( )M M M= −
14
(3.1)
where the parameter β > 0. The maximum value of π(M) is unity and π′(M) is declining.Thus, at lower levels of M an additional firm can significantly increase the probability ofdiscovery. However as more firms enter the market the probability of discovery approachesone, so that an additional firm has less impact on increasing π.11
8 For example, the damages to human health, visibility and natural habitat associated with the six criteriapollutants regulated under the Clean Air Act or the damages to drinking water, fish stocks and recreationalactivities caused by pollutants regulated under the Clean Water Act.9 These activities may represent the installation of “end-pipe” abatement technologies such as “scrubbers” totrap air pollutants after fuel combustion or technologies to reduce the toxicity of solid waste. More generally,these activities may represent the substitution of cleaner inputs for dirty inputs in production (for example thesubstitution of natural gas for coal).10 This is a standard way to model an improved abatement technology (see for example Downing and White,1986, and Milliman and Price, 1989). The technology may have some commercial value if it reduces productioncost c (for example an energy-saving technology). We focus purely on the environmental implications of thediscovery; that is we assume no effect on c.11 Specifying a function relating the probability of innovation to the quantity of R&D is a common approach tomodeling the R&D market. More sophisticated models incorporate the possibility of more than one technologybeing invented (for example Biglaiser and Horrowitz, 1995) and that previous R&D experience may affect the

Ian W. H. Parry RFF 98-04
5
The total cost of R&D is given by kM2 2/ , where the parameter k > 0. Therefore the
marginal cost, or supply curve, of R&D is kM. This is upward sloping, representing theincreasing scarcity of specialized inputs, such as scientists and engineers, at higher level ofR&D.12 Finally, we assume interior solutions for R&D throughout the analysis; that is, R&Dis always positive, but below the level where π(M) = 1.
B. Socially Optimal Outcome
We now derive the state-contingent output and emissions levels, and the quantity ofR&D, that maximizes expected social welfare.
(i) Output and Emissions
If the new technology is not discovered, social welfare in this state is maximized by:13
{ }V MAX P X dX cX a e X h e XX e
X
1 1
0
1 1 12
1 1 11 1
1
2 1*
{ , }( ) ( / )( ) ( )= − + + −∫∆
∆ ∆
That is, by choosing output and the emissions reduction per firm to maximize consumerbenefit (the area under the demand curve), less the sum of production costs, abatement costsand environmental damages. This yields the conditions:
a e h∆ 1* = (3.2a)
{ } *1
*1
*1
2*1
*1 2/1)1())(2/()( MCehceheacXP =∆−+=∆−+∆+= (3.2b)
Equation (3.2a) defines the optimal emissions reduction per firm. This where the incrementalabatement cost equals the reduction in environmental damages, per unit of X. From equation(3.2b), the optimal production of X is where the marginal benefit to consumers (the height ofthe demand curve) equals the marginal social cost of production, *
1MC . This equals the cost
of production, plus the abatement cost, plus the environmental damage from residualemissions, per unit of X.
Following the analogous procedure, maximized social welfare (V2* ) in the state when
the cleaner technology is discovered occurs when:
( ) *1 2− =r a e h∆ (3.3a)
{ } *2
*2
*2
2*2
*2 2/1)1())(2/)(1()( MCehcehearcXP =∆−+=∆−+∆−+= (3.3b)
productivity of current research. For a survey of R&D models see Carlton and Perloff (1990), chapter 20, andTirole (1988), chapter 10.12 Again, allowing R&D to be variable at the firm level does not affect the results if firms have the same U-shapedaverage cost curve (Wright, 1983).13 The no discovery and discovery states are denoted by subscript “1” and “2” respectively.

Ian W. H. Parry RFF 98-04
6
From (3.2a) and (3.3a):
∆ ∆e e r2 1 1* * / ( )= − (3.4)
that is, the optimal emissions reduction per firm with the new technology would be ( )1 1− −r
times the optimal emissions reduction with the old technology.
Figure 1 illustrates the possible equilibrium, where X0* would be optimal production if
there were no possibility of abatement activity (a = ∞), and the marginal social cost ofproduction would be c+h. Using (3.2) and (3.3), the optimal level of production in each statecan be expressed:
*0
*1*
1*0
*1 2
1/)( Xe
PMChcXX
∆
+=′−+−=η
(3.5a)
*0
*1*
2*0
*2 )1(2
1/)( Xr
ePMChcXX
−∆
+=′−+−=η
(3.5b)
where
η = −′
hX P0
* (3.6)
η is the (magnitude of the) elasticity of demand for X at X0* , with respect to the shadow price
of environmental damages.From Figure 1, the social benefit from a new technology that reduced the marginal
social cost of production from *1MC to *
2MC would be:
2/))(()( *1
*2
*2
*1
*1
*2
*1
*1
*2
* XXMCMCXMCMCVVV −−+−=−=∆ (3.7)
The first component in equation (3.7) is rectangle *2
*1 tvMCMC in Figure 1, which is the
reduction in social cost per unit of X, multiplied by optimal output in the no discovery state.The second term is triangle tuv, which is the welfare gain from the additional output in thediscovery state. Substituting (3.2), (3.3) and (3.5) into (3.7) we can obtain:
∆∆ ∆
Ve r
re r
rhX*
* *
= + +−
−
14
21 2 1
1 10η (3.8)
(ii) R&D
The expected efficiency gain in the R&D sector is:
V M M V kM( ) ( ) /*= −π ∆ 2 2 (3.9)

7
Figure 1. Optimal Industry Output
Demand
P(X)
c + h
*0X *
1X tX 2 *2X
t
v
z
y
ufZ +*
2
P(X)
c + h
tfMC +*2
*1MC
P′
*2MC

Ian W. H. Parry RFF 98-04
8
This is the probability of discovering the new technology multiplied by the social benefit fromthe technology, less R&D costs. Maximizing this expression with respect to M gives:
π ′ =( )* * *M V kM∆ (3.10)
This equation equates the (expected) marginal social benefit and marginal social cost of R&D.Using (3.1) and (3.10) the socially optimal quantity of R&D is:
Mk
V*
*= +
−1 1
22
1
β β ∆ (3.11)
Finally, substituting (3.11) into (3.9) gives
V M VkV
( )* **= +
−
∆∆
12
2
1
β (3.12)
This expression is the R&D efficiency gain in the first-best outcome.
C. Additional Assumptions in the Decentralized Market Model
The rest of this paper examines outcomes in a decentralized market version of themodel. To do this requires some additional assumptions. First, we assume that theproduction and R&D markets are competitive, hence (in the absence of regulation) firm entryoccurs until profits are zero. Thus, we do not consider the complications posed by non-competitive behavior when the number of production or R&D firms is relatively small.14
Second, we assume that R&D firms can appropriate (part of) the returns frominnovation by obtaining a patent and then licensing the new technology to production firms.More generally, an innovating firm may use the technology itself and not license to otherfirms, thereby gaining monopoly rents. However when the product market is competitive,and the innovator does not face capacity constraints or increasing marginal costs, then thereturns from licensing or producing with the technology itself are equivalent (Carlton andPerloff (1990), chapter 20). Following Wright (1983) we assume that if two or more firmsdiscover the new technology then the patent is awarded at random to one of them.15
Therefore the ex ante probability that an R&D firm will win the patent is π(M)/M; that is theprobability of the discovery being made, divided by the number of R&D firms. The amountof R&D is determined by: 14 In fact, Oates and Strassmann (1984) suggest that the empirical significance of non-competitive product marketsfor environmental policies may not be that large. Many R&D models in the Industrial Organization literatureassume non-competitive behavior (see Tirole (1988) Ch.10 for a survey). However there are a plethora of differenttypes of models and it would be somewhat ad hoc to use one of them in preference to all the others. Moreover, itmakes some sense to start with the much more simple case of competition. Future investigations may then relaxthis assumption to assess whether this makes a significant empirical difference to the results or not.15 In patent races in the U.S. the patent is granted to the firm that can prove it made the discovery first.

Ian W. H. Parry RFF 98-04
9
π( )MM
F kM= (3.13)
where F is the revenue from licensing the new technology to production firms. Equation (3.13)says that R&D firms will enter the market until the expected or average benefit per firm -- theprobability of winning the patent times revenue from the patent -- equals the cost of the last firm.
Our third additional assumption is to incorporate an imitation effect into the analysis.Empirical evidence (for commercial innovations) suggests that the private returns toinnovation are well below the social returns. In the case of patented technologies, this isbecause firms may develop their own imitations by “inventing around” a patented technologyusing, for example, information disclosed in the patent application.16 However the patentholder is typically able to appropriate at least some rents, because imitation occurs only after alag (Mansfield et al., 1981). We cannot include a lagged imitation effect into our one periodmodel. Instead we assume that production firms could each imitate the new technology andthese imitations would reduce their abatement costs in proportion by µr, where 10 <≤ µ .
Although no imitation actually occurs in equilibrium, the threat of imitation limits the abilityof a patent holder to appropriate the full social returns from innovation.
3. EMISSIONS TAX
We now compare the R&D efficiency gain under a Pigouvian emissions tax onemissions with that in the first-best outcome. Given our assumption of constant marginalenvironmental damages the Pigouvian tax does not change following innovation. Therefore(unlike the other policy instruments) we do not distinguish between cases where the policymaker can and cannot adjust the environmental policy over time. In subsection A, we discussthe qualitative differences between the first-best outcome and that under the emissions tax.Subsection B presents a quantitative comparison.
A. Model Solution
(i) Output and Emissions
Suppose the new technology is not discovered. The private (total) cost per productionfirm would be C c a e h et
1 12
12 1= + + −( ) / ( )∆ ∆ ; that is, the sum of production cost, abatement
cost and the tax paid on residual emissions.17 Firms choose ∆e to minimize Ct1 , which gives
condition (3.2a). Thus *11 MCC t = ; that is the marginal private cost equals the marginal social
16 For empirical studies on the imitation of patented commercial innovations see Mansfield (1985) and Levinet al. (1987).17 We use superscript “t”, “s” and “p” to denote outcomes under an emissions tax, a performance standard andtradable emissions permits respectively.

Ian W. H. Parry RFF 98-04
10
cost of producing X. Production firms enter the market until price equals Ct1 , and therefore
the socially efficient level of production in Figure 1, *1X , is induced.
Now consider the state when the new technology is available. If the patent holdercharges a fee of f to license the technology, the private cost of a production firm adopting thetechnology is C c r a e h e ft
2 22
21 2 1= + − + − +( ) ( ) / ( )∆ ∆ .18 Minimizing this expression withrespect to ∆e2 gives condition (3.3a). Therefore the socially optimal amount of emissions per
firm is induced. However, the private cost per production firm is:
fMCC t += *22 (4.3b)
that is, it exceeds the social cost per firm by the license fee. Equilibrium production is whereprice equals Ct
2 , or analogous to (3.5):19
′−+−= PChcXfX tt /)()( 2*02 (4.5)
When choosing the license fee the patent holder is subject to a constraint. Privatecosts to production firms from producing with the licensed technology must not exceed thosefrom producing with the imitation; if they do there will be no demand for the new technologyand patent holder revenue would be zero. If a production firm used the imitation, private costper firm would be += cC It ,
2 )1(2/)()1( 22
2 ehear ∆−+∆− µ . Minimizing this expression
with respect to ∆e and using (3.2a) we can obtain:
C c he
rt I2
112 1
,*
( )= + −
−
∆µ
Equating this with Ct2 , and using (3.3b) and (4.3b), the maximum license fee constraint is:20
)1)(1(
)1(
2
*1
rrreh
ff t
−−−∆
=≤µ
µ (4.14)
The patent holder chooses f to maximize revenue F fX ft t= 2( ) subject to the constraint
(4.14). It is straightforward to verify that the constraint in (4.14) is binding so long as:
11
2/)1(
1
*1 <
−+−
−∆
rrr
r
e
µµη (4.15)
18 More generally, patent holders may charge a fee per unit of emissions abatement. However this schemewould be privately (as well as socially) inefficient in the sense of reducing abatement below the optimal level.Per unit license fees are more likely when the patent holder is uncertain about the costs savings to firms fromadopting the new technology.19 Since production firms are homogeneous, if it is profitable for one firm to license the technology, then it isprofitable for all firms to license the technology.20 If there were no possibility of imitation (µ = 0) the constraint on f is that private costs from licensing the newtechnology do not exceed those from continuing to use the original technology.

Ian W. H. Parry RFF 98-04
11
This condition is satisfied for the range of parameter values considered below. Thereforeusing (3.3b), (4.3b), (4.5) and (4.14), output under the emissions tax is:
Xe
rXt
21
012 1
= +−
ηµ
∆ **
( ) (4.5b)
Comparing (3.5) and (4.5b), X X Xt1 2 2* *≤ < . Therefore production in the discovery
state would be less than the socially optimal level. This is because of a monopoly pricingeffect associated with patents. It would be socially efficient to allow firms to adopt thecleaner technology free of charge. However, they have to pay a license fee that raises theircosts and reduces the level of output. In terms of Figure 1, welfare from diffusing the cleanertechnology is lower under the emissions tax than in the first-best outcome by triangle zuy,which has base X X t
2 2* − and height f t . Using (3.5b), (4.5b) and (4.14), this has area:
∆er
rr
hX1
2
011 1 8
**−
− −
µµ
η
Subtracting this expression from ∆V* in (3.8) gives the social benefit from diffusing thecleaner technology under the emissions tax:
∆∆ ∆
Ve r
r re r
rhXt = + +
−−
−−
−
14
21
111 2 1
1
2
10η µ
µ
* *
(4.8)
(ii) R&D
Multiplying (4.5b) by the expression in (4.14), patent holder revenue is:
Fe
re
rr
rhXt = +
−
−− −
12 1 2
11 1
1 10
ηµ
µµ
∆ ∆* *
( ) (4.16)
From (3.1) and (3.13), the equilibrium quantity of R&D is:
MkF
tt= +
−1 1
42
1
β β (4.11)
Comparing (3.11) and (4.11), R&D may be above or below that in the first-best outcome.Firms enter the R&D market until the average benefit per firm, rather than the marginalbenefit, equals the marginal cost.21 Since the average probability curve, π(M)/M, lies abovethe marginal probability curve, π′(M), this would generate an excessive amount of R&D if
21 Only if the R&D market were monopolistic rather than competitive, would the equilibrium be wheremarginal rather than average private benefit equals marginal cost.

Ian W. H. Parry RFF 98-04
12
F V= ∆ * . This is because of an externality problem associated with competition for patentrents: R&D firms do not take into account the impact of their entry on reducing theprobability that the other firms will win the patent. This has been referred to as the commonpool effect, since it is analogous to the over-exploitation of common pool resources such asopen-access fisheries.22 However the private benefit from innovation, area
*2
*2 )( zyMCfMC t+ in Figure 1, is below the social benefit from innovation in the first-best
case, area *2
*1 tuMCMC . Essentially, this is because the threat of imitation reduces the
maximum license fee below the reduction in social cost per firm, *2
*1 MCMC − .
Using (3.1) and (4.11), the efficiency gain from R&D under the emissions tax can beexpressed:
V M M V k MV
FkF
kt t t tt
t( ) ( ) ( ) /= − = −
+
−
πβ β
∆∆2
2
2
2212
14
(4.12)
B. Parameter Values
The previous subsection illustrated three reasons -- the monopoly pricing effect, thecommon pool effect and the imitation effect -- why the R&D market under the emissions taxis potentially less efficient than in the first-best outcome. We now investigate under whatconditions these imperfections are empirically important in our model by presenting somesimulations on the R&D efficiency gain under the emissions tax V(Mt), expressed as aproportion of that in the first-best case V(M*). To do this requires plausible values for fiveparameters. The ranges chosen for these parameters are necessarily somewhat arbitrary.However, we consider a wide range of parameter values, and -- with the exception of µ -- theresults are not especially sensitive to alternative parameter values. That is, varying parametervalues changes the R&D efficiency gain under the emissions tax and in the first-best case byapproximately the same proportion.
We consider three scenarios for the potential proportionate reduction in abatementcosts from the innovation: r = 0.01, 0.1 and 0.4. These cases span the range from a veryminor innovation to a major innovation. η is defined with respect to environmental damagesrather than the price of output and therefore is less than the elasticity of demand for X at X0
* ,
conventionally defined. We consider a range of 0.1 to 2 for this parameter, with a benchmarkvalue of 0.5. The optimal proportionate reduction in emissions per unit in the no discoverystate, ∆e1
* , is equal to marginal environmental damage divided by the slope of the marginal
abatement cost function. We assume a range of 0.05 to 0.5 for this “parameter”, with a
22 For more discussion see Wright (1983). R&D may still be excessive when the R&D market is notcompetitive. This can occur when the rents from innovation come at the expense of pure profits of existingfirms. See Dasgupta and Stiglitz (1980), Loury (1979), and Lee and Wilde (1980).

Ian W. H. Parry RFF 98-04
13
benchmark value of 0.2. The ratio k hX/ *β 20 reflects the slope of the marginal cost of R&D
relative to the slope of the marginal probability function (h and X0* are exogenous). We
choose this “parameter” to imply the probability of discovering the cleaner technology in thefirst-best outcome lies between 0.35 and 0.9, with a benchmark case of 0.65. This range is(almost) the largest possible that is consistent with interior solutions under all the policyinstruments considered. Finally, roughly speaking the private benefit from innovation isreduced below the social benefit in proportion to the imitation effect, represented by µ. Weconsider scenarios where imitation reduces the private benefit by up to 75 percent below thesocial benefit, and assume a 50 percent reduction in our benchmark case.23 Condition (4.15),and similar conditions for the other policy instruments derived below, are satisfied for thisrange of parameter values .
C. Simulations
Table 1 presents our calculations of V M V Mt( ) / ( )* using these parameter values and
equations (3.8), (3.12), (4.8), (4.12) and (4.16). The main point from this table is thatimitation per se does not necessarily imply large inefficiency in the R&D market. In ourbenchmark case when the private benefit from innovation is 50 percent of the social benefit,the R&D efficiency gain is still 92-97 percent of that in the first-best outcome. The mainreason for this is that the common pool effect counteracts the imitation effect. Indeed in somesimulations -- denoted by * in the table -- the common pool effect dominates and R&D underthe emissions tax exceeds that in the first-best outcome. In addition, when R&D differs fromthe socially optimal level the efficiency loss tends to be “small” relative to the total efficiencygain in the R&D market, because the incremental efficiency gain from R&D is declining. Forexample, if R&D were 25 percent less than in the first best case, the R&D efficiency gain isstill around 94 percent of the first-best R&D efficiency gain. Nonetheless, when the imitationeffect is substantial inefficiency in the R&D market can be more significant. For example,when the private benefits from innovation are 25 percent of the social benefits the R&Defficiency gain under the emissions tax falls to 63-79 percent of that in the first-best outcome(assuming benchmark values for other parameters).
An additional result of interest is that the relative efficiency loss from the monopolypricing effect (triangle zuy in Figure 1), is very small. This is because it is a second ordereffect. In all the simulations the social benefit from diffusion of the new technology (area
*2
*1 tzyMCMC ) is at least 96 percent of that in the first-best outcome (area *
2*1 tuMCMC ).
23 Estimates of the social rate of return vary widely across different case studies. In Mansfield’s (1977) study of17 innovations, the median social rate of return is roughly twice the private rate of return. However, the socialrates of return vary by a factor of more than 20.
Ian W. H. Parry RFF 98-04
14
Table 1. The R&D Efficiency Gain from an Emissions Tax(relative to that in the first-best case)
proportionate reduction in abatement cost0.01 0.1 0.4
Benchmark case .92 .94 .97
0 .93* .93* .91*µ .25 1.00* 1.00* .95*
.75 .63 .66 .79
π(M*) .35 .83 .85 .91.9 1.00* 1.00* 1.00*
η .1 .92 .93 .982.0 .94 .95 .96
*1e∆ .05 .81 .83 .90
.5 1.00 1.00* .96*
4. PERFORMANCE STANDARD
We now consider a performance standard. A performance standard specifies themaximum emissions per unit of production. In the current homogeneous firm model, itdiffers from an emissions tax in two respects. First, to maintain emissions abatement at theoptimal level, the standard must be tightened in the event that the new technology isdiscovered (no adjustment in the emissions tax is required). In practice a regulatory agencycan adjust an emissions standard over time in response to changing technology, but not inresponse to every individual innovation. Thus in subsection A we consider two cases whichspan the range of possibilities: a fixed performance standard and a flexible standard thatadjusts to the ex post optimal level following innovation. Second, in the absence of aproduction control the number of firms producing X, and hence the total amount of pollution,would be inefficiently high because firms are not charged for their residual emissions(Spulber, 1985; Goulder et al., 1997). This creates a greater demand for innovation andwould “distort” the comparison with other policy instruments. To avoid this problem, weassume that there is also a quota that limits production to the socially optimal amount.Subsection B presents the empirical results for the fixed and flexible performance standard.

Ian W. H. Parry RFF 98-04
15
A. Model Solution
(i) Fixed Standard
In the no discovery state, emissions per firm are constrained to the efficient level1 1− ∆e* , and the quota limits production to X1
* . The private cost per firm, C c a es1 1
2 2= + ( ) /*∆ ,
is less than the social cost *1MC because firms are not charged for their residual emissions
1 1− ∆e* .
In the discovery state the allowable level of emissions per firm remains at 1 1− ∆e* . If
a production firm were to license the new technology, the private cost to that firm would bess fearcC +∆−+= 2/)()1( 2*
12 . If instead a production firm used the imitation, the private
cost would be C c r a es I2 1
21 2, *( ) ( ) /= + − µ ∆ . The maximum license fee (when C Cs s I2 2= , ), is
therefore (using (3.2a))
fh e
rs = −∆ 1
21
*
( )µ (5.14)
Using (5.14) and (3.5a), patent holder revenue, *1Xf s , is:
*0
*1
*1
2)1(
21 X
erh
eF s ∆
−
∆
+= µη (5.16)
Since emissions remain at *11 e∆− , the social cost per production firm using the new
technology is:
∆+
−+=∆−+∆−+=2
)1(1)1(2/)()1(
*1*
12*
12
erhcehearcMC s ; (5.3b)
The social benefit from diffusion of the cleaner technology is ∆V Z Z Xs s= −( )* *1 2 1 ; that is the
reduction in social cost per firm times the number of firms, which remains at X1* . Using
(3.2b), (3.5a) and (5.3b) this can be expressed:
∆∆ ∆
Ve e
rhXs = +
12 2
1 10η
* ** (5.8)
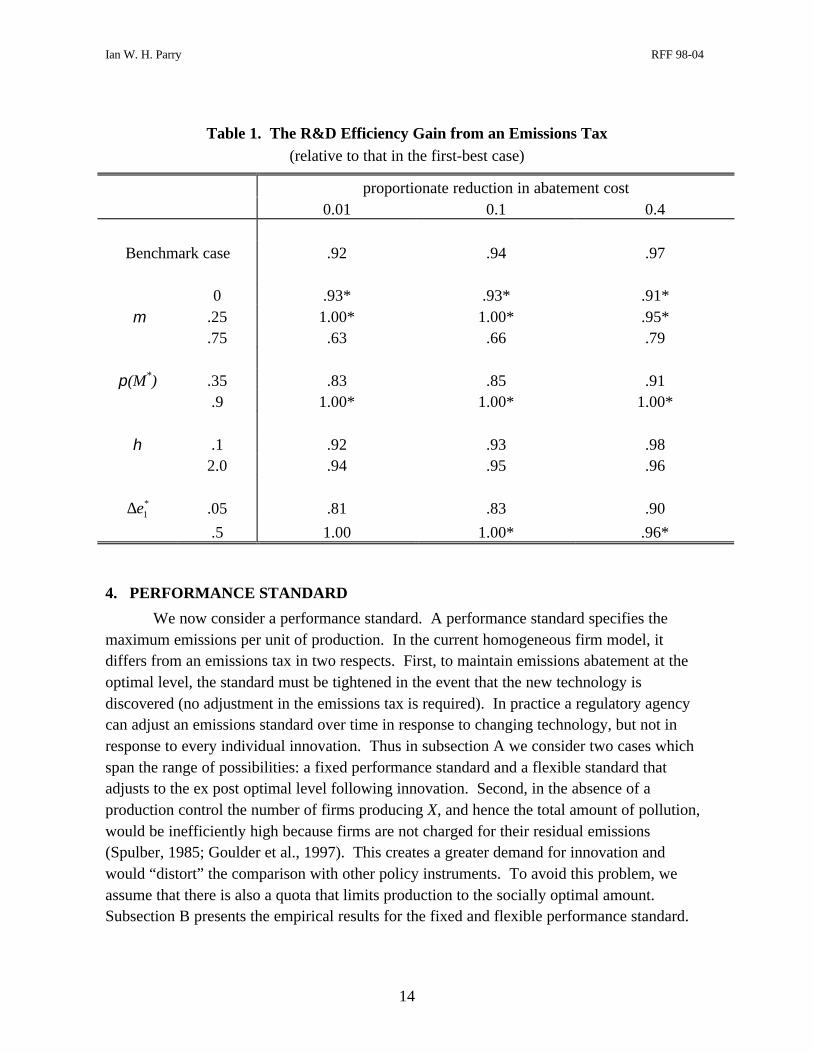
Figure 2 illustrates two important differences between the performance standard andthe emissions tax. First, under the emissions tax the social gain per production firm fromadopting the cleaner technology consists of triangle 0tu plus triangle tvu. These are thereduction in abatement cost at the initial level of abatement and the gain from the additionalemissions reductions from ∆e1
* to *2e∆ , respectively. Under the fixed performance standard
the social gain per firm only consists of triangle 0tu. Second, under the emissions tax theprivate gain from using the cleaner technology rather than the imitation consists of triangle0yw plus triangle yvw. These are the reduction in abatement cost for an emissions reduction

Ian W. H. Parry RFF 98-04
16
of ∆et I2, and the private gain from increasing emissions reductions to ∆e2
* respectively. Under
the performance standard the private gain is 0su, since emissions reductions are fixed at ∆e1* .
Hence the willingness to pay for the cleaner technology, and patent holder revenue, are lowerunder the performance standard.
Finally, for a given quantity of patent holder revenue the level of R&D is determinedin the same way as under the emissions tax. Hence the R&D efficiency gain is determined byequation (4.12), given the appropriate substitutions for F and ∆V.
Figure 2. Optimum Abatement per Firm
∆e1*
∆e2*∆et I
2,
a e∆
( )1− µr a e∆
( )1 − r a e∆
t
Emissions reduction
h
u
vy
z
0
ws
(ii) Flexible Standard
Now suppose that the required emissions reduction increases to *2e∆ , and the level of
production is restricted to X2* , in the case when the new technology is discovered. Following
a similar procedure to that above, we can obtain:
∆ ∆V Vs = * (5.8′)
Fh e r
rer
Xs =−−
+−
∆ ∆12
102
11
12 1
* **( )
( ) ( )µ η
(5.16′)

Ian W. H. Parry RFF 98-04
17
Equation (5.8′) says that the social benefit from diffusing the new technology equals that inthe first-best case. This follows because both emissions and output are adjusted to their expost optimal levels in the discovery state. Comparing (5.16′) with (4.16), patent holderrevenue exceeds that under the emissions tax. This occurs for two reasons. First, the privategains from using the cleaner technology, as opposed to the imitation, are greater in Figure 2by triangle yzv than under the tax, since the required emissions reduction in the discoverystate is fixed at ∆e2
* . This raises the maximum license fee that production firms are willing to
pay. Second, the equilibrium number of production firms is greater ( X X t2 2* > in Figure 1).
B. Simulations
The upper half of Table 2 shows the R&D efficiency gain under the fixed emissionsstandard, expressed relative to that under the emissions tax (using equations (4.8), (4.12), (4.16),(5.8), (5.16), and the previous parameter ranges). These simulations suggest that the R&Defficiency gain may be significantly lower under the fixed performance standard than under theemissions tax. However, this result is very sensitive to the potential size of the innovation. TheR&D efficiency gain under the performance standard is about 15-20 percent lower than under thetax, for an innovation that would reduce abatement costs by 10 percent. It is 1-3 percent and 46-71 percent lower for innovations that would reduce abatement costs by 1 percent and 40 percentrespectively. The explanation for this is clear from Figure 2. The larger the reduction in(marginal) abatement costs, the greater is the size of triangle tuv relative to triangle 0tu. Hencethe greater is the social benefit from diffusion of the cleaner technology under the emissions taxrelative to that under the performance standard. In addition, the larger the innovation, the largerthe size of area syvu relative to area 0su, hence the greater is patent holder revenue under theemissions tax relative to that under the performance standard. This implies lower efficiencyunder the performance standard (in cases when R&D is below the first-best level).
The lower half of Table 2 shows the R&D efficiency gain under the flexible performancestandard expressed relative to that under the emissions tax (using equations (4.8), (4.12), (4.16),(5.8′) and (5.16′)). In general these estimates are very close to unity implying that the R&Defficiency gain under the flexible performance standard is almost identical to that under theemissions tax. This is because the social gain from diffusion is greater when the performancestandard is flexible than when it is fixed. However, the flexible standard is more likely togenerate an excessive amount of R&D because firms’ willingness to pay for the new technologyexceeds that under the emissions tax by triangle yzv in Figure 2. This is especially the case whenthe reduction in abatement costs -- and hence triangle yzv -- is “large” and when the imitationeffect is weak.24
24 For example, when the proportionate reduction in abatement costs is 40 percent and there is no imitation effect,R&D under the flexible performance standard exceeds the first best level by 80 percent!

Ian W. H. Parry RFF 98-04
18
Table 2. The R&D Efficiency Gain from an Emissions Standard(relative to that under the emissions tax)
proportionate reduction in abatement cost
0.01 0.1 0.4
A. Fixed Standard
Benchmark case .98 .82 .37
µ 0 .99 .85 .40
.25 .98 .84 .43
.75 .97 .77 .29
π(M*) .35 .98 .79 .33
.9 .99 .87 .50
η .1 .98 .81 .38
2.0 .98 .81 .37
*1e∆ .05 .98 .79 .33
.5 .99 .86 .46
B. Flexible Standard
Benchmark case 1.00 1.02 1.02
µ 0 .99 .94 .38
.25 1.00 .99 .78
.75 1.00 1.02 1.09
π(M*) .35 1.00 1.03 1.09
.9 1.00 1.00 .88
η .1 1.00 1.02 1.01
2.0 1.00 1.02 1.01
*1e∆ .05 1.00 1.00 1.10
.5 1.00 1.00 .89

Ian W. H. Parry RFF 98-04
19
5. TRADABLE EMISSIONS PERMITS
We now examine the efficiency impact of tradable emissions permits in the R&D market.Unlike in the previous cases, the equilibrium conditions are non-linear and obtaining analyticalsolutions would be very complicated. Instead we characterize the equilibrium conditions andsolve the model computationally. Analogous to the previous section, we consider cases wherethe quantity of permits is fixed at the ex ante Pigouvian level and where the quantity of permits isadjusted to the ex post Pigouvian level if the cleaner technology is discovered. As discussedbelow, we regard the former assumption as probably the more realistic.
A. Equilibrium Conditions
(i) Fixed Permits
Suppose emissions are limited by the Pigouvian quantity of permits, that is X1* firms
are each given 1 1− ∆e* emissions permits. In the no discovery state production and emissions
are optimal and the permit price equals marginal environmental damages, h. If these firmscould adopt the new technology, the marginal abatement cost curve would pivot down to
ear ∆− )1( in Figure 2. Therefore the privately optimal level of emissions abatement would
increase above ∆e1* (at the initial permit price). This means that firms have “spare” emissions
permits. These permits can be sold to “entrants”; that is, firms who previously could notproduce X because they had no emissions permits.25 The private cost of an entrant licensingthe new technology would be C p
2 = c + ( ) ( ) /1 222− r a e∆ feq +∆−+ )1( 22 , where q2 is the
permit price and )1( 22 eq ∆− is the cost of purchasing the enough permits to cover residual
emissions. The net private cost of an initial permit holder is C q eP2 2 11− −( )*∆ ; that is, lower
than the cost to an entrant by the rents from the initial (exogenous) permit endowment.Minimizing CP
2 , the privately optimal emissions reduction for both entrants and
permit holders is defined by:
( )1 2 2− =r a e q∆ (6.3a)
Hence:
C c q e fp2 2 21 2= + − +( / )∆ (6.17)
Entrants come into the market until profits are zero. Thus P X C p( )2 2= , or analogous to (4.5)
′−+−= PChcXfX pp /)()( 2*02 (6.5)
If production firms used the imitation instead of licensing the cleaner technology, their privateproduction costs (gross of any permit rents) would be C p I
2, = c + ( ) ( ) /1 22
2− µr a e∆ + −q e2 21( )∆ .
25 In a more general setting firms may use spare permits to increase their own production rather than selling toentrants. In both cases, innovation leads to a decline in the permit price.

Ian W. H. Parry RFF 98-04
20
Minimizing this expression, and equating with that for pC2 , we can obtain the maximum license
fee constraint:26
f eq r
rp =
−−
∆ 22
21
1( )µ
µ (6.14)
Finally, there is the following additional constraint:
( ) ( )* *1 12 2 1 1− = −∆ ∆e X e Xp (6.18)
This equation says that total emissions equals the quantity of emissions permits.Equations (6.3a), (6.17), (6.5), (6.14) and (6.18) could be solved analytically for the
endogenous variables X p2 , ∆e2, q2 , C p
2 and f p . However this produces very complex
formulas because the system is non-linear.27 Instead, we present the numerical solutions to themodel in subsection B, which are solved computationally. Analogous to (3.7), the social gainfrom diffusion of the cleaner technology is:
)}(2/){()( *1222
*1
*12
*1 XXMCCMCXMCMCV ppppp −−++−=∆ (6.7)
where )2/1(2/)()1( 22
22ppp ehearcMC ∆−+∆−+= is the marginal social cost of production.
∆V p is the reduction in social cost from the initial X1* firms in the market, plus the efficiency
gain from the additional output.28 Finally, the privately optimal level of R&D, and the R&Defficiency gain, are again determined by equations (4.11) and (4.12), except that ∆V is definedby equation (6.7), and F f Xp p p= 2 .
(ii) Flexible Permits
Now suppose that the quantity of permits is adjusted to the ex post optimal amount,( ) *
2*21 Xe∆− , if the technology is discovered (prior to diffusion). The equations characterizing
the equilibrium are the same as in the fixed permit case, except that (6.18) now becomes:
*2
*222 )1()1( XeXe p ∆−=∆− (6.18′)
26 We assume that the patent holder cannot discriminate by charging different fees to initial permit holders andentrants.27 This is because the level of emissions abatement depends on the equilibrium permit price, which isendogenous. Under the emissions tax and performance standard the level of emissions abatement depends onlyon exogenous parameters.
28 The latter is the area under the demand curve (a trapezoid with average height 2/)( 2*1
pCMC + and base
X Xp2 1− * ) less the area under the marginal social cost curve (a rectangle with height pMC2 and base X Xp
2 1− * ).

Ian W. H. Parry RFF 98-04
21
Table 3. The R&D Efficiency Gain under Tradable Emissions Permits(expressed relative to that under the emissions tax)
proportionate reduction in abatement cost0.01 0.1 0.4
A. Fixed PermitsBenchmark case 1.00 .95 .73
µ 0 1.00 .98 .82.25 1.00 .97 .79.75 1.00 .92 .63
π(M*) .35 .99 .94 .68.9 1.00 .99 .88
η .1 1.00 .94 .632.0 1.00 .99 .91
∆e1* .5 1.00 .99 .91
.05 1.00 .94 .59
B. Flexible PermitsBenchmark case 1.00 1.00 1.00
µ 0 1.00 1.01 1.04.25 1.00 1.00 1.02.75 1.00 1.00 .99
π(M*) .35 1.00 .99 1.00.9 1.00 1.01 1.03
η .1 1.00 1.01 1.012.0 1.00 1.00 .99
∆e1* .05 1.00 1.00 .99
.5 1.00 1.01 .94
B. Simulations
The upper panel in Table 3 shows calculations of the R&D efficiency gain under thefixed permits policy, expressed relative to that under the emissions tax. All of the entries are lessthan or equal to unity; that is the R&D efficiency gain under tradable permits is less than underthe emissions tax, or at least never exceeds it. However, the entries are larger than those in theupper panel of Table 2; that is the efficiency gain exceeds that under the fixed performancestandard. These results are due to two asymmetries. First, the reduction in social cost per firmfrom adopting the new technology under the permit policy is between that under the emissionstax and the fixed performance standard. That is, firms increase abatement after adopting the

Ian W. H. Parry RFF 98-04
22
cleaner technology, but not all the way to ∆e2* in Figure 2. This is because the permit price falls
below h as permit holders sell spare permits to entrants (and emissions abatement is proportionalto the permit price in (6.3a)). Second, the willingness to pay for licensing the new technology,and hence patent holder revenue, is lower under tradable permits than under the emissions tax.This is because the fall in permit price reduces the private gains to production firms fromadopting the new technology and selling emissions permits.
However the discrepancy between tradable permits and the emissions tax is onlyempirically “significant” for major innovations, when the fall in permit price is moresubstantial. For an innovation that reduces abatement costs by 10 percent or less, the R&Defficiency gain is only up to around 6 percent lower under tradable permits than under theemissions tax. However, it is 10-40 percent lower for an innovation that reduces abatementcosts by 40 percent.
The lower panel of Table 3 shows the results for the flexible policy when the quantityof permits is reduced prior to diffusion of the cleaner technology. In this case the R&Defficiency gain is very similar to that under the emissions tax. Again, diffusion of the cleanertechnology causes a fall in the permit price. However the initial permit price is greater than inthe fixed permits case. This implies greater revenues for the patent holder, and a higher levelof emissions abatement with the cleaner technology.
In general, the case of fixed emissions permits is probably more realistic than that offlexible emissions permits. The existing programs for controlling sulfur dioxide and nitrogenoxides set the quantity of allowable emissions over a 15-year time horizon. It is unlikely thatthe announced targets will be renegotiated during the intervening years. Similarly, if the U.S.adopts a tradable permits program to reduce carbon dioxide emissions the quantity of permitsallocated each year is likely to be fixed in advance over a long time horizon.
6. CONCLUSION
This paper analyzes the welfare effect in the market for environmental R&D induced byalternative environmental policy instruments. The induced welfare gain is greater under anemissions tax than tradable emissions permits. However, we find that the empirical significanceof this discrepancy crucially depends on the potential size of innovation. For an innovation thatreduces abatement costs by 10 percent or less, the R&D efficiency gain is only up to around 6percent lower under tradable permits than under the emissions tax. However, it is 10-40 percentlower for an innovation that reduces abatement costs by 40 percent. The efficiencydiscrepancies between an emissions tax and a fixed performance standard are somewhat larger,although again they are very sensitive to the potential size of innovations.
The possibility that new, cleaner production technologies will be imitated by otherfirms can reduce the private benefits from innovation below the social benefits. This suggeststhat inducing more environmental R&D -- for example by research subsidies or tightening

Ian W. H. Parry RFF 98-04
23
environmental regulations beyond the Pigouvian level -- may significantly improve efficiencyin the R&D market. The above results cast some doubt on this assertion. We find thatefficiency in the R&D market is generally more than 90 percent of that in the first-bestoutcome, even when imitation limits private benefits to 50 percent of the social benefits frominnovation. This is because the common pool effect -- by which competition for innovationrents is excessive -- tends to offset the effects of imitation. Thus in our analysis the threat ofimitation has to be substantial before research subsidies can potentially produce “large”efficiency gains in the R&D market.
Our analysis does not examine the choice between R&D policy instruments. Howeverour results underscore that the potential efficiency gain from additional incentives to stimulateenvironmental R&D is highly sensitive to the discrepancy between the private and socialbenefit from innovation. This suggests that a policy that subsidizes all environmental R&D atthe same rate -- such as the existing R&D tax credit -- is potentially inefficient. A moreefficient policy might be to target research prizes at new emissions abatement technologies forwhich it is particularly difficult to appropriate spillover benefits to other firms.
Our analysis provides a useful starting point for assessing under what circumstancesthere might be significant inefficiency in the R&D market under alternative environmentalpolicies. However, there are many ways the analysis might be extended to examine howrobust the empirical results are. The model employs quadratic functional forms. Allowingfor more general functional forms may affect the quantitative results to some extent, althoughthis is unlikely in the case of more minor innovations. We assumed the environmentaldamage function is linear. Under a convex damage function the private benefits frominnovation under the Pigouvian emissions tax can exceed the social benefits. This is becausemarginal environmental benefits from diffusing a cleaner technology are declining, whilemarginal private benefits, in terms of reduced tax payments, are constant. Thus the possibilityof R&D exceeding the first-best level appears to be more likely under convex damages.29
The analysis does not investigate the implications of heterogeneity among firms or theempirical significance of possible strategic behavior in the R&D market. Nor do we allow fortransaction costs when analyzing tradable emissions permits. These transactions costs mayreduce the returns to innovation and hence the incentives for environmental R&D (Parry,1996). Our analysis also ignores the possibility that technological innovation may arise fromlearning by doing, rather than deliberate investments in research activity.30
29 For more discussion of this see Parry (1995).30 See Goulder and Mathai (1997) on the significance of this distinction.

Ian W. H. Parry RFF 98-04
24
REFERENCES
Biglaiser, G., and J. K. Horrowitz. 1995. “Pollution Regulation and Incentives for PollutionControl Research,” Journal of Economics and Management Strategy, 3, pp. 663-684.
Carlton, D. W., and J. M. Perloff. 1990. Modern Industrial Organization (Glenview, Ill.,Scott-Foresman).
Cropper, M. L., and W. E. Oates. 1992. “Environmental Economics: A Survey,” Journal ofEconomic Literature, 30, pp. 675-740.
Dasgupta, P., and J. E. Stiglitz. 1980. “Uncertainty, Industrial Structure and the Speed ofR&D,” The Bell Journal of Economics, 11, pp. 1-28.
Downing, P. G., and L. J. White. 1986. “Innovation in Pollution Control,” Journal ofEnvironmental Economics and Management, 13, pp. 18-29.
Goulder, L. H., and K. Mathai. 1997. “Optimal CO2 Abatement in the Presence of InducedTechnological Change,” unpublished manuscript, Stanford University, Calif.
Goulder, L. H., I. W. H. Parry, R. C. Williams, and D. Burtraw. 1997. “The Cost-Effectiveness of Alternative Instruments for Environmental Protection in a Second-BestSetting,” unpublished manuscript, Stanford University, Calif.
Jaffe, A. B., and R. N. Stavins. 1995. “Dynamic Incentives of Environmental Regulation:The Effects of Alternative Policy Instruments on Technology Diffusion,” Journal ofEnvironmental Economics and Management, 30, pp. 95-111.
Jung, C., K. Krutilla, and R. Boyd. 1996. “Incentives for Advanced Pollution AbatementTechnology at the Industry Level: An Evaluation of Policy Alternatives,” Journal ofEnvironmental Economics and Management, 30, pp. 95-111.
Lee, T., and L. Wilde. 1980. “Market Structure and Innovation: A Reformulation,”Quarterly Journal of Economics, 94, pp. 429-436.
Levin, R. C., A. K. Klevorick, R. R. Nelson, and S. G. Winter. 1987. “Appropriating theReturns from Industrial Research and Development,” Brookings Papers on EconomicActivity (Special Issue on Microeconomics), 3, pp. 783-820.
Loury, G. C. 1970. “Market Structure and Innovation,” Quarterly Journal of Economics, 93,pp. 395-410.
Mansfield, E. 1985. “How Rapidly does new Industrial Technology Leak Out?” Journal ofIndustrial Economics, 34, pp. 217-23.
Mansfield, E., J. Rapoport, A. Romeo, S. Wagner, and G. Beardsley. 1977. “Social andPrivate Rates of Return from Industrial Innovations,” Quarterly Journal of Economics,91, pp. 221-240.
Mansfield, E., M. Schwartz, and S. Wagner. 1981. “Imitation Costs and Patents,” EconomicJournal, 91, pp. 907-918.

Ian W. H. Parry RFF 98-04
25
Milliman, S. R., and R. Prince. 1989. “Firm Incentives to promote technological Change inPollution Control,” Journal of Environmental Economics and Management, 17, pp. 247-265.
Newell, R. G., A. B. Jaffe, and R. N. Stavins. 1996. “Energy-Saving Technology Innovation:The Effects of Economic Incentives and Direct Regulation,” discussion paper, HarvardUniversity, Cambridge, Mass.
Oates, W. E. and D. L. Strassmann. 1984. “Effluent Fees and Market Structure,” Journal ofPublic Economics, 24, pp. 29-46
Parry, I. W. H. 1995. “Optimal Pollution Taxes and Endogenous Technological Progress,”Resource and Energy Economics, 17, pp. 69-85.
Parry, I. W. H. 1996. “The Choice Between Emissions Taxes and Tradable Permits WhenTechnological Progress is Endogenous,” Discussion Paper 96-31, Resources for theFuture, Washington, D.C.
Spulber, D. F. 1985. “Effluent Regulation and Long-Run Optimality,” Journal ofEnvironmental Economics and Management, 12, pp. 103-116.
Tirole, J. 1988. The Theory of Industrial Organization (Cambridge, Mass., MIT Press).
Wenders, J. T. 1975. “Methods of Pollution Control and the Rate of Change in PollutionTechnology,” Water Resources Research, 11, pp. 683-691.
Wright, B. D. 1983. “The Economics of Invention Incentives: Patents, Prizes and ResearchContracts,” American Economic Review, 73, pp. 691-707.