Embed Size (px)
Citation preview
Pollution Prevention Analysis
and Plan Guidance Manual
Updated June 6, 2013 Publication Number TB 13-01

Arizona Department of Environmental Quality Sustainability Unit
Pollution Prevention Program 1110 West Washington Street
Phoenix, Arizona 85007 (602) 771-2351
Disclaimer The manual is neither rule nor law. While this manual is written to provide assistance to individuals preparing a Pollution Prevention Analysis and Plan, it does not replace the Arizona Revised Statutes, Title 49, Chapter 5, Articles 4 and 5. The document is written to assist in developing a pollution prevention plan. It is not meant to be a complete training manual for pollution prevention.
Printed on recycled paper
Updated June 6, 2013 ADEQ Document Number TB-13-01

i
In This Guidance Manual You Will Find:
Introduction ............................................................................................................ 1 Pollution prevention is a sensible approach for businesses ................................... 2 How to create a successful pollution prevention program ...................................... 4 How to use this guidance document....................................................................... 6 Part 1: Pollution prevention plan forms................................................................. 9 Part 2: Developing the pollution prevention analysis and plan and an example plan .................................................... 25 How do I perform a pollution prevention analysis and develop the plan? ................................................................. 27 What must be analyzed in the plan? ......................................................... 28 How are reduction targets or goals developed?........................................ 29 Example plan ............................................................................................ 30 Part 3: Staying in compliance by maintaining your P2 plan ............................................................................................ 63 What is a pollution prevention plan? ......................................................... 64 Who must develop a pollution prevention plan?........................................ 65 Are there any exemptions to doing a plan?............................................... 66 Keeping the P2 plan in compliance ........................................................... 67 Keep your plan up to date ................................................................. 67 How do I write a pollution prevention amendment?........................... 69 Part 4: P2 Tools .................................................................................................... 70 What is pollution prevention? .................................................................... 71 Can pollution prevention benefit my company?......................................... 76 Where can I find information for my plan?................................................. 77
ii
How do I search for the root cause of a waste, toxic substance use or emission? ................................................................ 78 Process mapping .............................................................................. 78 Pareto Chart...................................................................................... 83 Cause and effect diagram ................................................................. 84 Weighted sum method ...................................................................... 93 The Five Whys: A root cause analysis technique.............................. 94 Common P2 plan questions and answers.................................................... 95 References .................................................................................................. 99 Pollution prevention resources on the internet ........................................... 99
1
Introduction
Pollution prevention or “P2” helps Arizona’s businesses and the environment. P2 may be a company’s wisest and most cost-effective environmental method to improve profits. P2 is a re-thinking process, which is applied to operations at locations before toxic substances are used or before wastes and emissions are generated. In Arizona, P2 means: “Operational procedures and processes and improvements in housekeeping or management techniques that reduce potential or actual releases of pollutants to the environment including all air, water and land resources affected by those pollutants.” Implementing P2 requires a facility to adopt any of the following techniques: Toxic substance use reduction Recycling of wastes or secondary materials Source reduction/elimination Waste minimization and reuse of waste Emissions reductions Reclamation of wastes valuable components Water and energy conservation Substitution with less toxic substances Green House Gas reductions This manual is provided to help the regulated industry prepare P2 analyses and submit P2 plans that meet the requirements of the Arizona Revised Statutes (ARS) §49−961 et. seq. in the most simple and direct way. In complying with these requirements, the goal is to minimize paperwork deficiencies and maximize environmental improvements. The ADEQ P2 Program staff is available to provide P2 assistance during development of a Pollution Prevention Plan (Plan) or development of the annual P2 progress report. This assistance is available by calling the telephone on the inside cover. P2 information is also available on the ADEQ website located at: http://azdeq.gov/environ/waste/p2/index.html Thank you for your efforts to protect Arizona’s air, land and water.
2
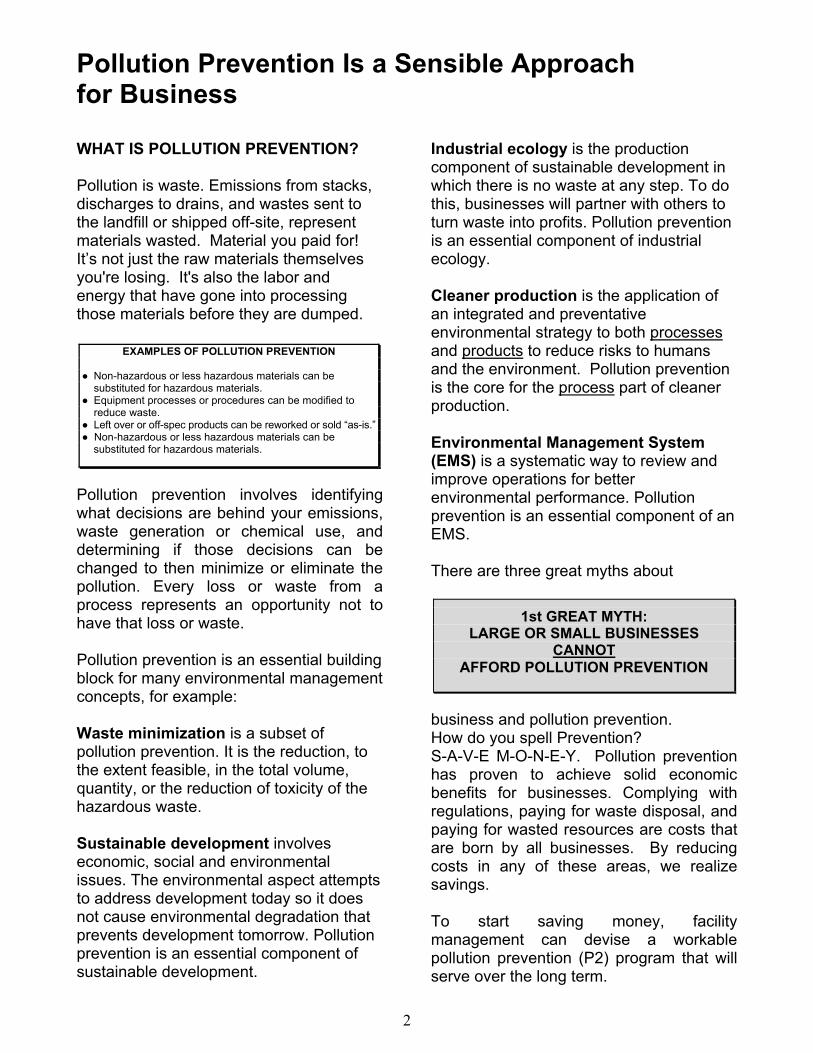
Pollution Prevention Is a Sensible Approach for Business WHAT IS POLLUTION PREVENTION? Pollution is waste. Emissions from stacks, discharges to drains, and wastes sent to the landfill or shipped off-site, represent materials wasted. Material you paid for! It’s not just the raw materials themselves you're losing. It's also the labor and energy that have gone into processing those materials before they are dumped.
Pollution prevention involves identifying what decisions are behind your emissions, waste generation or chemical use, and determining if those decisions can be changed to then minimize or eliminate the pollution. Every loss or waste from a process represents an opportunity not to have that loss or waste. Pollution prevention is an essential building block for many environmental management concepts, for example: Waste minimization is a subset of pollution prevention. It is the reduction, to the extent feasible, in the total volume, quantity, or the reduction of toxicity of the hazardous waste. Sustainable development involves economic, social and environmental issues. The environmental aspect attempts to address development today so it does not cause environmental degradation that prevents development tomorrow. Pollution prevention is an essential component of sustainable development.
Industrial ecology is the production component of sustainable development in which there is no waste at any step. To do this, businesses will partner with others to turn waste into profits. Pollution prevention is an essential component of industrial ecology. Cleaner production is the application of an integrated and preventative environmental strategy to both processes and products to reduce risks to humans and the environment. Pollution prevention is the core for the process part of cleaner production. Environmental Management System (EMS) is a systematic way to review and improve operations for better environmental performance. Pollution prevention is an essential component of an EMS. There are three great myths about
business and pollution prevention. How do you spell Prevention? S-A-V-E M-O-N-E-Y. Pollution prevention has proven to achieve solid economic benefits for businesses. Complying with regulations, paying for waste disposal, and paying for wasted resources are costs that are born by all businesses. By reducing costs in any of these areas, we realize savings. To start saving money, facility management can devise a workable pollution prevention (P2) program that will serve over the long term.
EXAMPLES OF POLLUTION PREVENTION ● Non-hazardous or less hazardous materials can be
substituted for hazardous materials. ● Equipment processes or procedures can be modified to
reduce waste. ● Left over or off-spec products can be reworked or sold “as-is.” ● Non-hazardous or less hazardous materials can be substituted for hazardous materials.
1st GREAT MYTH:
LARGE OR SMALL BUSINESSES CANNOT
AFFORD POLLUTION PREVENTION
3
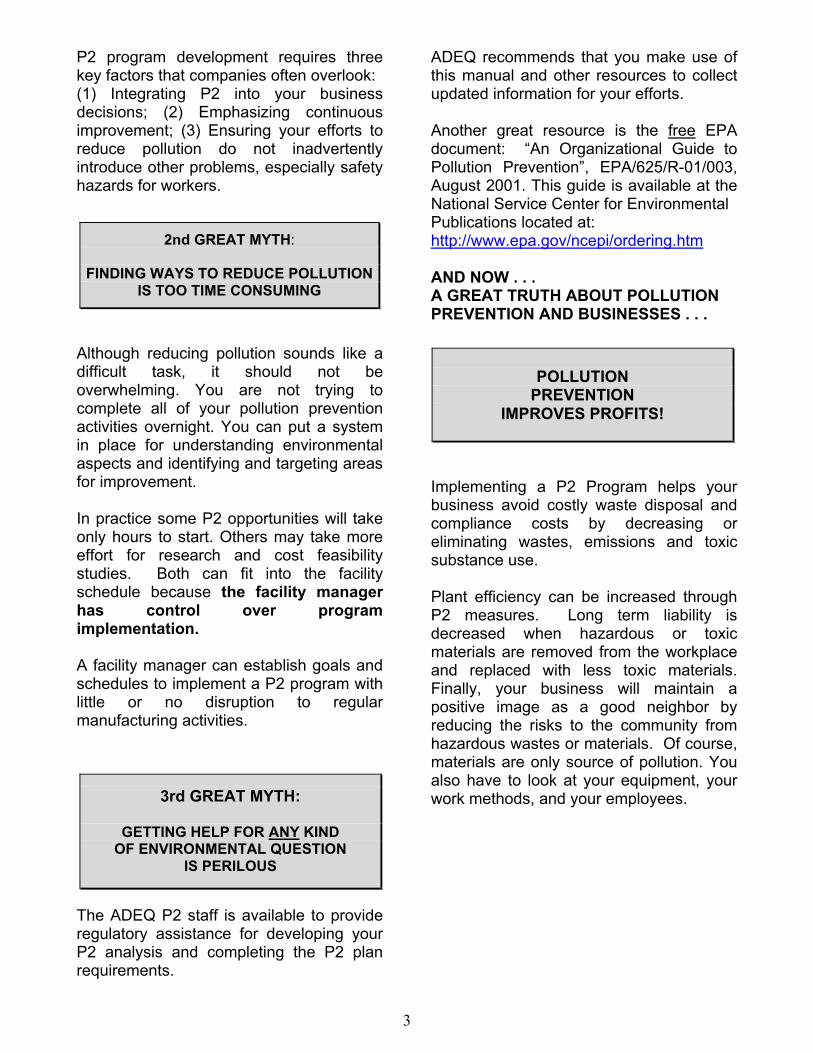
P2 program development requires three key factors that companies often overlook: (1) Integrating P2 into your business decisions; (2) Emphasizing continuous improvement; (3) Ensuring your efforts to reduce pollution do not inadvertently introduce other problems, especially safety hazards for workers.
Although reducing pollution sounds like a difficult task, it should not be overwhelming. You are not trying to complete all of your pollution prevention activities overnight. You can put a system in place for understanding environmental aspects and identifying and targeting areas for improvement. In practice some P2 opportunities will take only hours to start. Others may take more effort for research and cost feasibility studies. Both can fit into the facility schedule because the facility manager has control over program implementation. A facility manager can establish goals and schedules to implement a P2 program with little or no disruption to regular manufacturing activities.
The ADEQ P2 staff is available to provide regulatory assistance for developing your P2 analysis and completing the P2 plan requirements.
ADEQ recommends that you make use of this manual and other resources to collect updated information for your efforts. Another great resource is the free EPA document: “An Organizational Guide to Pollution Prevention”, EPA/625/R-01/003, August 2001. This guide is available at the National Service Center for Environmental Publications located at: http://www.epa.gov/ncepi/ordering.htm AND NOW . . . A GREAT TRUTH ABOUT POLLUTION PREVENTION AND BUSINESSES . . .
Implementing a P2 Program helps your business avoid costly waste disposal and compliance costs by decreasing or eliminating wastes, emissions and toxic substance use. Plant efficiency can be increased through P2 measures. Long term liability is decreased when hazardous or toxic materials are removed from the workplace and replaced with less toxic materials. Finally, your business will maintain a positive image as a good neighbor by reducing the risks to the community from hazardous wastes or materials. Of course, materials are only source of pollution. You also have to look at your equipment, your work methods, and your employees.
POLLUTION
PREVENTION IMPROVES PROFITS!
2nd GREAT MYTH:
FINDING WAYS TO REDUCE POLLUTION
IS TOO TIME CONSUMING
3rd GREAT MYTH:
GETTING HELP FOR ANY KIND
OF ENVIRONMENTAL QUESTION IS PERILOUS
4
How to Create A Successful Pollution Prevention Program Many companies understand the simple importance of P2 and have moved away from a pure compliance philosophy. They have learned that public expectations for a clean and safe environment are a better gauge to drive their environmental programs, not minimum compliance with regulations. Businesses are beginning to establish overriding environmental principles designed to govern company wide decision making and to ensure they are moving well beyond the minimum standards set by regulations. Facilities have implemented a variety of P2 programs in Arizona. The following elements are considered important to the most successful P2 programs. ● Management supports pollution prevention and commits the necessary implementation resources. - Pollution prevention is integrated into business planning. - Environmental considerations are part of business planning processes. - Facility pollution prevention goals are part of the business planning process. - Pollution prevention is used, whenever possible, in anticipation of future compliance requirements. ● Facilities use a champion, facilitator or focal point person to lead the program. ● A cross-functional P2 team is used. The purpose of forming a P2 team is to utilize the diverse skills of the team members to develop innovative P2 activities. Important elements and activities of a team include: - Organization and Purpose: Support from all levels of management and a defined purpose. - Multi-disciplinary Members: Membership from various work areas, departments, and sometimes even vendors. Many of the best ideas come from the production areas. - Regular Meetings: Have regular meetings to identify and prioritize P2 opportunities. For your meetings, make agendas, document the meetings with action items and follow through on them. - Set Goals: Develop goals from the opportunities identified. - Review Projects and Drive Them to Completion: Team members review how a project is progressing and encourage its completion. - Document Results: Document waste reductions and other benefits. - Communicate: Share your results and successes with all employees to promote and gain support for P2. ● All employees are involved in the program. - Suggestions are solicited from all employees. - All employees are made aware of the facility’s P2 efforts. - Employees are trained in P2.
5
● Recognition is used to sustain employee motivation. - Immediate recognition of early accomplishments helps establish the P2 program. - Facility and/or corporate level recognition programs help sustain employee motivation.
● P2 progress is tracked and communicated. - Facilities have the ability to measure progress. - Facilities periodically publish results against goals. - Results are communicated to all employees. - Results are communicated to the community. ● Facilities use quality tools in their P2 program (i.e. team based quality culture, ISO 9000/14000, Pareto principles, total quality management, etc.). ● P2 is integrated into pre-manufacturing decisions. - P2 begins at research, development and design phases of the product or process life. - Facilities work with equipment and raw material suppliers and customers to help identify P2 opportunities for products and processes.
6
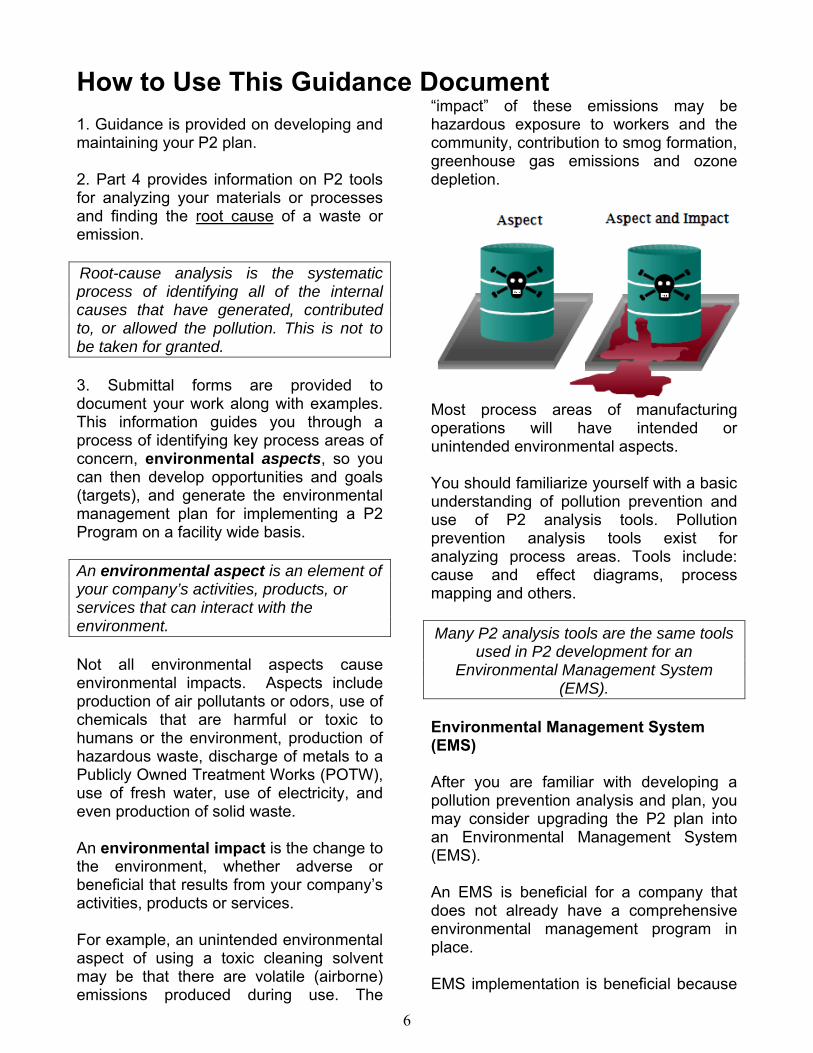
How to Use This Guidance Document 1. Guidance is provided on developing and maintaining your P2 plan. 2. Part 4 provides information on P2 tools for analyzing your materials or processes and finding the root cause of a waste or emission. Root-cause analysis is the systematic process of identifying all of the internal causes that have generated, contributed to, or allowed the pollution. This is not to be taken for granted. 3. Submittal forms are provided to document your work along with examples. This information guides you through a process of identifying key process areas of concern, environmental aspects, so you can then develop opportunities and goals (targets), and generate the environmental management plan for implementing a P2 Program on a facility wide basis. An environmental aspect is an element of your company’s activities, products, or services that can interact with the environment. Not all environmental aspects cause environmental impacts. Aspects include production of air pollutants or odors, use of chemicals that are harmful or toxic to humans or the environment, production of hazardous waste, discharge of metals to a Publicly Owned Treatment Works (POTW), use of fresh water, use of electricity, and even production of solid waste. An environmental impact is the change to the environment, whether adverse or beneficial that results from your company’s activities, products or services. For example, an unintended environmental aspect of using a toxic cleaning solvent may be that there are volatile (airborne) emissions produced during use. The
“impact” of these emissions may be hazardous exposure to workers and the community, contribution to smog formation, greenhouse gas emissions and ozone depletion.
Most process areas of manufacturing operations will have intended or unintended environmental aspects. You should familiarize yourself with a basic understanding of pollution prevention and use of P2 analysis tools. Pollution prevention analysis tools exist for analyzing process areas. Tools include: cause and effect diagrams, process mapping and others. Many P2 analysis tools are the same tools
used in P2 development for an Environmental Management System
(EMS). Environmental Management System (EMS) After you are familiar with developing a pollution prevention analysis and plan, you may consider upgrading the P2 plan into an Environmental Management System (EMS). An EMS is beneficial for a company that does not already have a comprehensive environmental management program in place. EMS implementation is beneficial because
7
it addresses both pollution prevention and compliance. An EMS can in turn lead to the creation of sustainable business goals. EMSs provide organizations of all types with a structured approach for managing environmental and regulatory responsibilities to improve overall environmental performance, including areas not subject to regulation such as resource conservation and energy efficiency. EMSs can also help organizations integrate all these environmental considerations, and get better results, by establishing a continuous process of checking to make sure environmental goals are met, and responding if problems occur. From a business perspective, they can often help make organizations more efficient and more competitive and help address other important issues such as security at key facilities. Helpful information on EMS development is available from the ADEQ-P2.
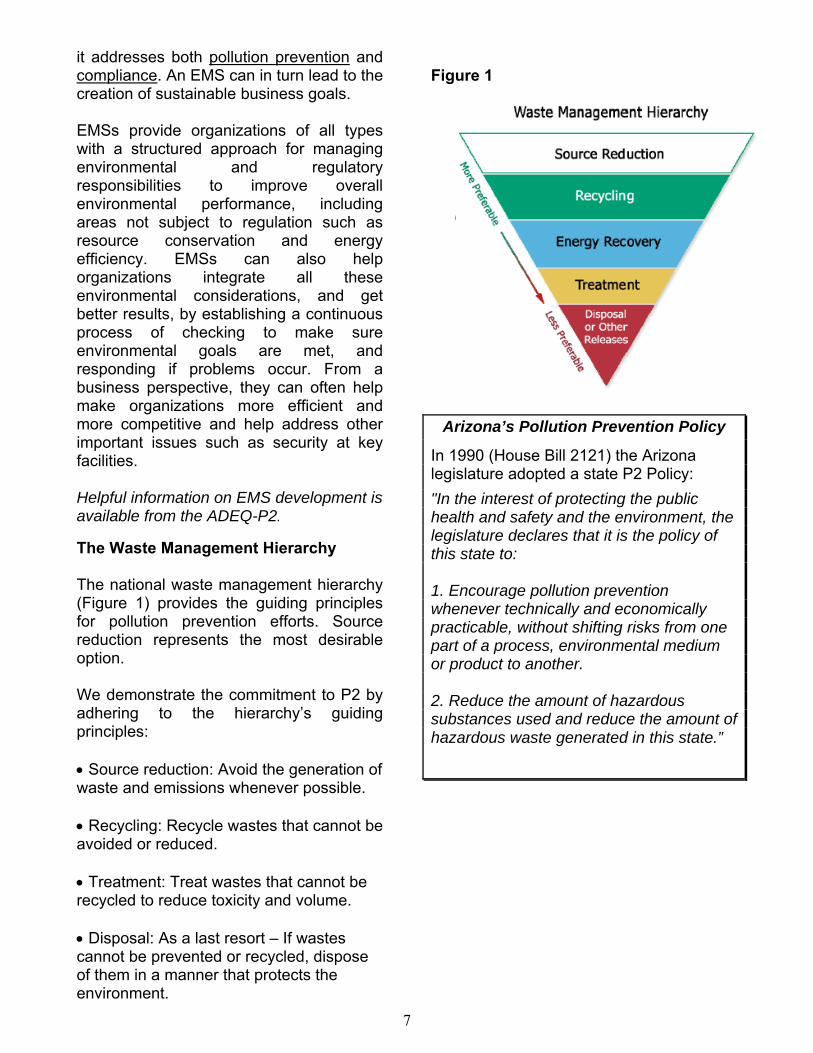
The Waste Management Hierarchy The national waste management hierarchy (Figure 1) provides the guiding principles for pollution prevention efforts. Source reduction represents the most desirable option. We demonstrate the commitment to P2 by adhering to the hierarchy’s guiding principles: Source reduction: Avoid the generation of waste and emissions whenever possible. Recycling: Recycle wastes that cannot be avoided or reduced. Treatment: Treat wastes that cannot be recycled to reduce toxicity and volume.
Disposal: As a last resort – If wastes cannot be prevented or recycled, dispose of them in a manner that protects the environment.
Figure 1
Arizona’s Pollution Prevention Policy
In 1990 (House Bill 2121) the Arizona legislature adopted a state P2 Policy:
"In the interest of protecting the public health and safety and the environment, the legislature declares that it is the policy of this state to: 1. Encourage pollution prevention whenever technically and economically practicable, without shifting risks from one part of a process, environmental medium or product to another. 2. Reduce the amount of hazardous substances used and reduce the amount of hazardous waste generated in this state.”
8
This page intentionally left blank
9
Part 1
Pollution Prevention Plan Forms
1. Use the forms on the following pages
or 2. Request forms in Microsoft Word by e-mail from the ADEQ P2 staff
or
3. Download the forms from the ADEQ Web Site under Pollution Prevention at: http://azdeq.gov/function/forms/appswaste.html#p2
Pollution Prevention Plan
10
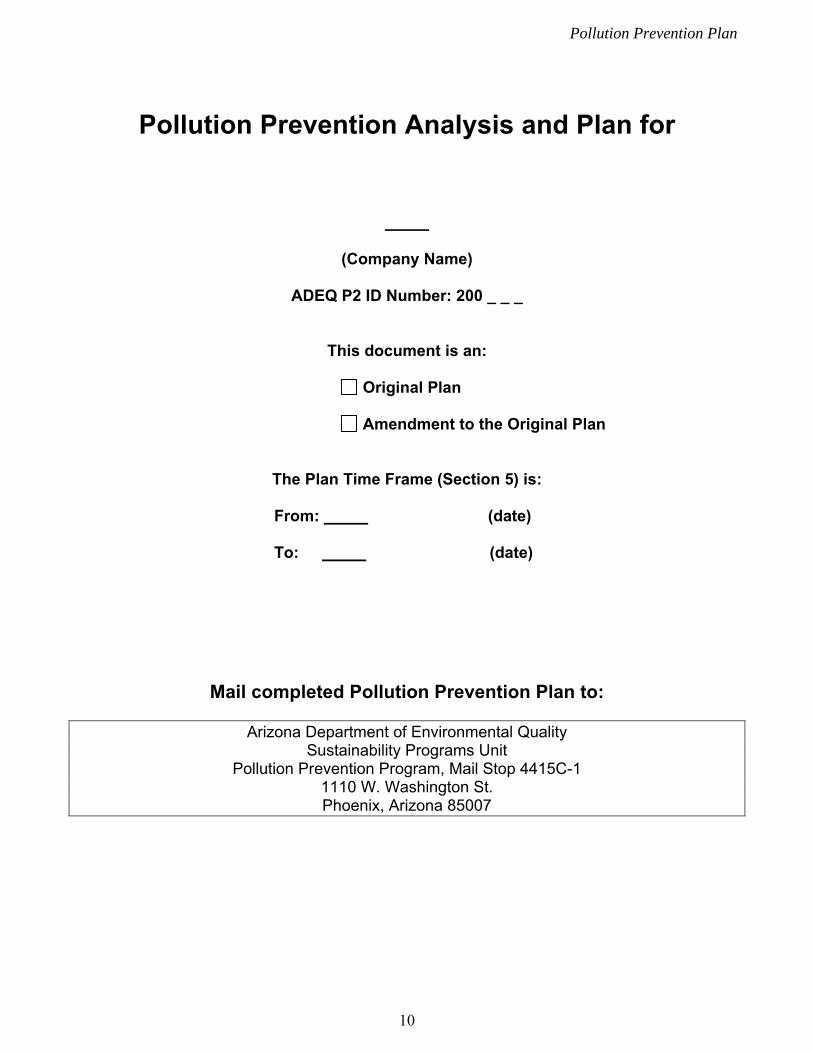
Pollution Prevention Analysis and Plan for
(Company Name)
ADEQ P2 ID Number: 200 _ _ _
This document is an:
Original Plan Amendment to the Original Plan
The Plan Time Frame (Section 5) is:
From: (date) To: (date)
Mail completed Pollution Prevention Plan to:
Arizona Department of Environmental Quality Sustainability Programs Unit
Pollution Prevention Program, Mail Stop 4415C-1 1110 W. Washington St. Phoenix, Arizona 85007
Pollution Prevention Plan
11
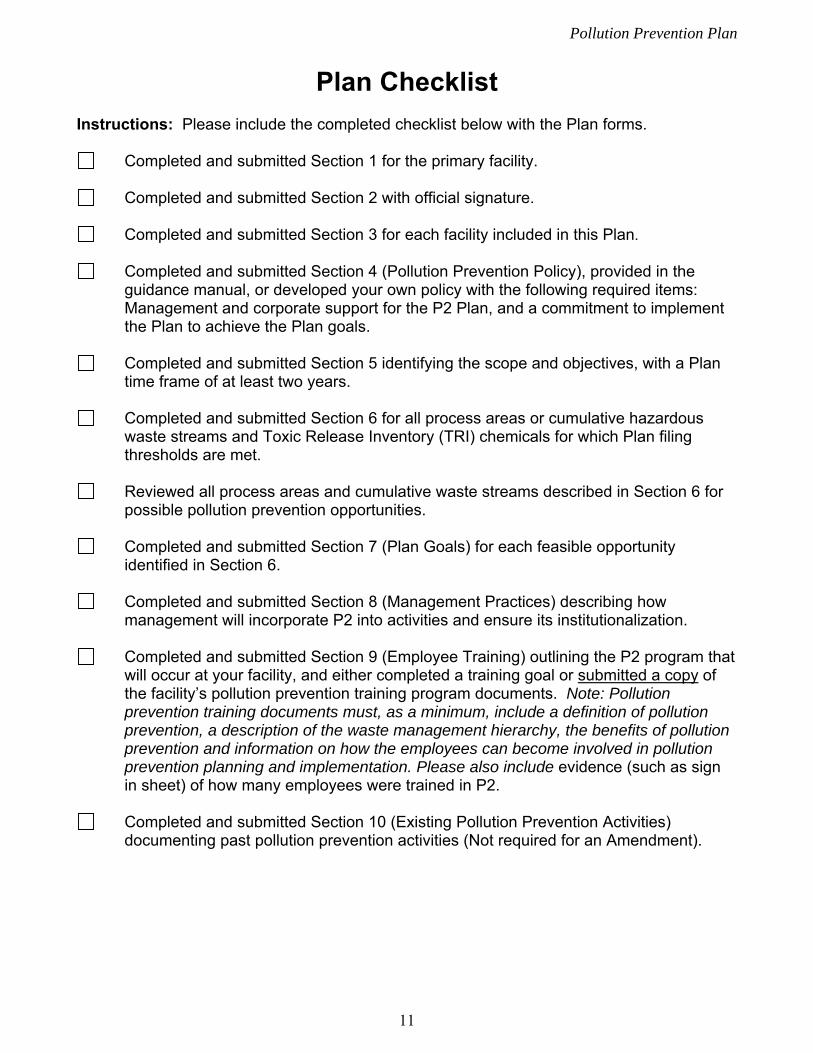
Plan Checklist Instructions: Please include the completed checklist below with the Plan forms.
Completed and submitted Section 1 for the primary facility.
Completed and submitted Section 2 with official signature.
Completed and submitted Section 3 for each facility included in this Plan.
Completed and submitted Section 4 (Pollution Prevention Policy), provided in the guidance manual, or developed your own policy with the following required items: Management and corporate support for the P2 Plan, and a commitment to implement the Plan to achieve the Plan goals.
Completed and submitted Section 5 identifying the scope and objectives, with a Plan
time frame of at least two years.
Completed and submitted Section 6 for all process areas or cumulative hazardous waste streams and Toxic Release Inventory (TRI) chemicals for which Plan filing thresholds are met.
Reviewed all process areas and cumulative waste streams described in Section 6 for
possible pollution prevention opportunities.
Completed and submitted Section 7 (Plan Goals) for each feasible opportunity identified in Section 6.
Completed and submitted Section 8 (Management Practices) describing how
management will incorporate P2 into activities and ensure its institutionalization.
Completed and submitted Section 9 (Employee Training) outlining the P2 program that will occur at your facility, and either completed a training goal or submitted a copy of the facility’s pollution prevention training program documents. Note: Pollution prevention training documents must, as a minimum, include a definition of pollution prevention, a description of the waste management hierarchy, the benefits of pollution prevention and information on how the employees can become involved in pollution prevention planning and implementation. Please also include evidence (such as sign in sheet) of how many employees were trained in P2.
Completed and submitted Section 10 (Existing Pollution Prevention Activities)
documenting past pollution prevention activities (Not required for an Amendment).
Pollution Prevention Plan
12
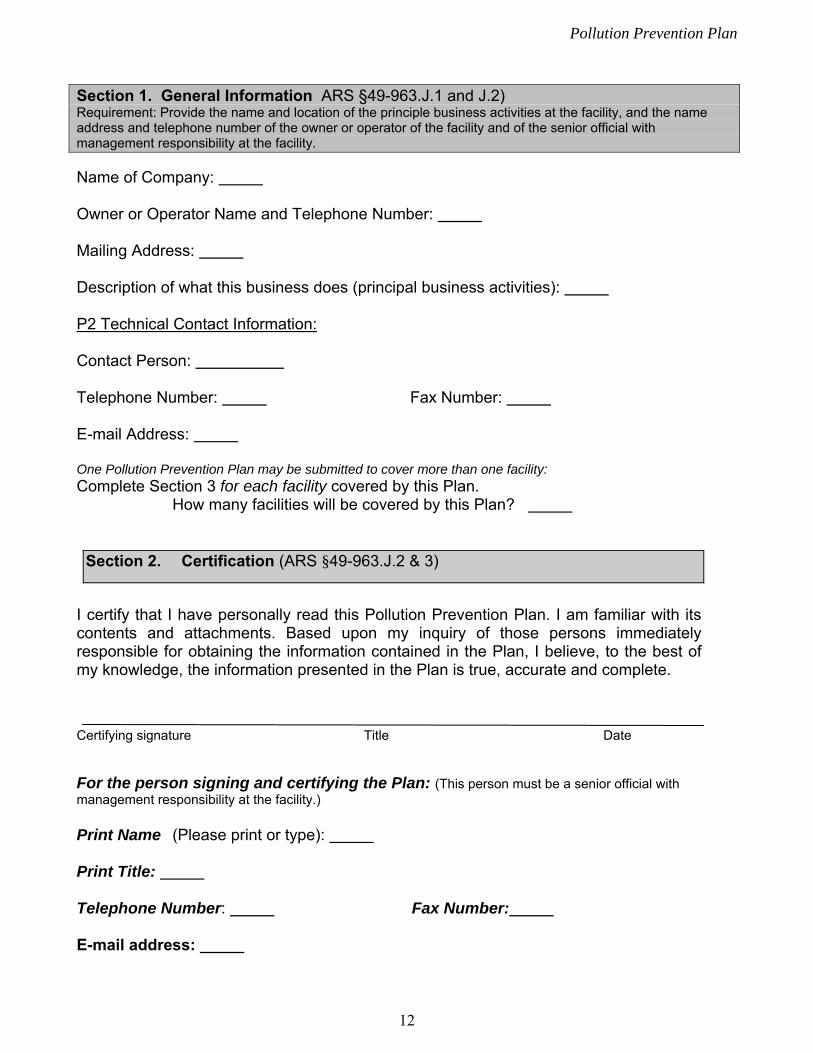
Section 2. Certification (ARS §49-963.J.2 & 3)
Section 1. General Information ARS §49-963.J.1 and J.2) Requirement: Provide the name and location of the principle business activities at the facility, and the name address and telephone number of the owner or operator of the facility and of the senior official with management responsibility at the facility. Name of Company:
Owner or Operator Name and Telephone Number:
Mailing Address:
Description of what this business does (principal business activities): P2 Technical Contact Information: Contact Person: Telephone Number: Fax Number: E-mail Address: One Pollution Prevention Plan may be submitted to cover more than one facility: Complete Section 3 for each facility covered by this Plan.
How many facilities will be covered by this Plan?
I certify that I have personally read this Pollution Prevention Plan. I am familiar with its contents and attachments. Based upon my inquiry of those persons immediately responsible for obtaining the information contained in the Plan, I believe, to the best of my knowledge, the information presented in the Plan is true, accurate and complete. Certifying signature Title Date For the person signing and certifying the Plan: (This person must be a senior official with management responsibility at the facility.) Print Name (Please print or type): Print Title: Telephone Number: Fax Number: E-mail address:
Pollution Prevention Plan
13
Section 3. Facility Information (ARS §49-963-J.1; §49-963-I) Facility Name: Physical Address: Primary NAICS Code (6 digits): Other NAICS Codes (optional): Permits (Please list below any permits at this facility. Write “NONE” for any permits that do not apply.) RCRA ID Number (also known as EPA ID Number):
(For example: AZD123456789.)
NPDES Permits:
Air Quality Permits:
Water Quality Permits:
List any other environmental permits:
Plan Requirement Threshold(s) Met (Please check all P2 Plan filing threshold(s) the facility met which require(s) the facility to file and maintain a P2 Plan.
Generated an average of one thousand kilograms per month of hazardous waste in calendar year 20 . The cumulative amount and streams of hazardous waste generated at the facility include all of the following waste streams :
Generated an average of one kilogram per month of acutely hazardous waste in
calendar year 20 . The cumulative amount and streams of acutely hazardous waste generated at the facility include all of the following waste streams :
Met the thresholds required to file a Toxic Release Inventory (TRI) form (form R or A)
for the calendar year 20 . The TRI identification number assigned to this facility is . The TRI chemicals that met the thresholds are:
Used in excess of 10,000 pounds of a toxic substance in calendar year
20 . The toxic substances used above the 10,000-pound threshold are:
Facility wants to file a voluntary P2 Plan although it does not meet the P2 Plan filing thresholds.
Pollution Prevention Plan
14
Section 4. Management and Corporate Support (ARS §49-963.J.5 and J.9) Requirement: Provide a written policy setting forth management and corporate support for the pollution prevention Plan and a commitment to implement the Plan to achieve the Plan goals. The Plan shall include employee awareness and training programs to involve employees in pollution prevention planning and implementation to the maximum extent feasible.
ENVIRONMENTAL POLICY
Check box 1 or 2 below. 1. The senior official with management responsibility at the facility has signed, and we have posted in our facility, a copy of the pollution prevention policy contained in the ADEQ P2 guidance document. A copy of the signed policy is provided on the next page of this Plan.
OR 2. The senior official with management responsibility at the facility has signed, and we have posted in our facility, a copy of our own pollution prevention policy setting forth management and corporate support for the P2 Plan and a commitment to implement the Plan to achieve the Plan goals. A copy of the signed policy is provided on the next page of this Plan.
Check each box that applies and complete information below that applies.
3. The policy will be displayed in view of all employees and introduced to new employees The policy is posted at the following location(s): 4. The policy will be available in languages other than English, as appropriate, and to the public and customers (as appropriate).
Pollution Prevention Plan
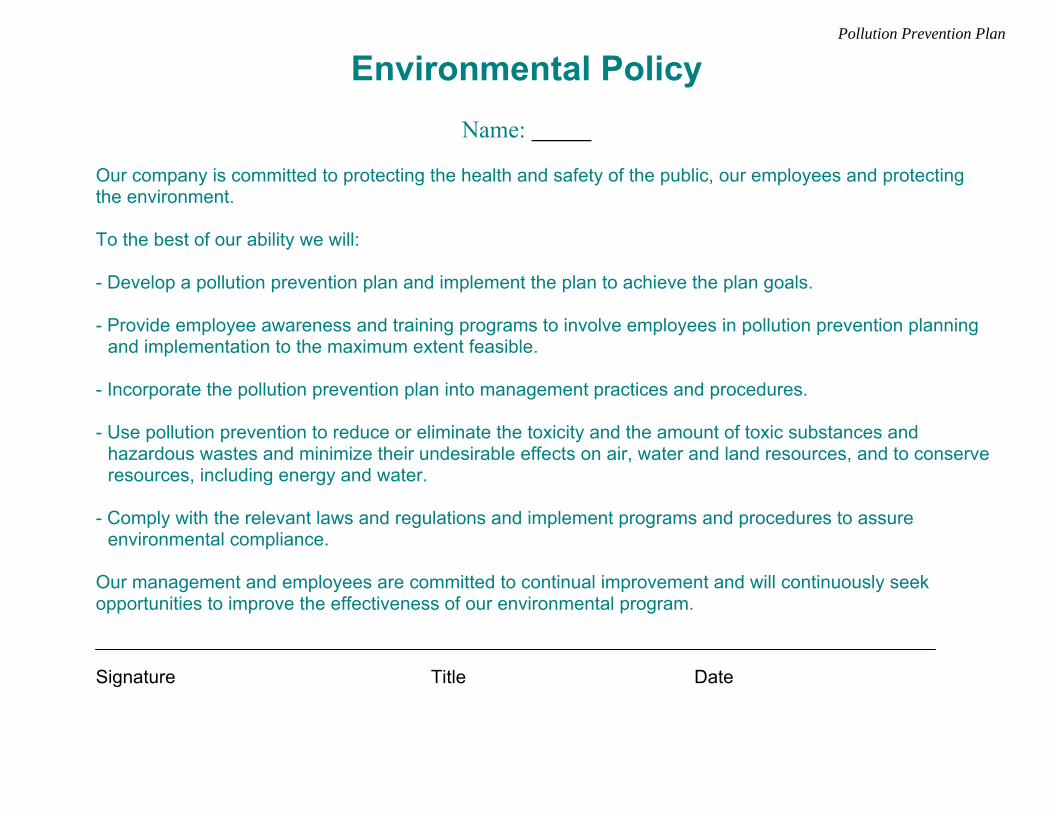
Environmental Policy
Name: Our company is committed to protecting the health and safety of the public, our employees and protecting the environment. To the best of our ability we will: - Develop a pollution prevention plan and implement the plan to achieve the plan goals. - Provide employee awareness and training programs to involve employees in pollution prevention planning and implementation to the maximum extent feasible. - Incorporate the pollution prevention plan into management practices and procedures. - Use pollution prevention to reduce or eliminate the toxicity and the amount of toxic substances and hazardous wastes and minimize their undesirable effects on air, water and land resources, and to conserve resources, including energy and water. - Comply with the relevant laws and regulations and implement programs and procedures to assure environmental compliance.
Our management and employees are committed to continual improvement and will continuously seek opportunities to improve the effectiveness of our environmental program.
Signature Title Date
Pollution Prevention Plan
Section 5. Scope and Objectives (ARS §49-963.K; ARS §49-963.J.6) Requirement: The timeframe of the original Plan must span at least TWO YEARS at a minimum. Provide a statement of the Plan’s scope and objectives.
Plan time frame: The current time frame of this Plan or Amendment will be:
FROM: TO: THE LAST GOAL COMPLETION DATE
(month/day/year) (month/day/year)
PLAN SCOPE Staff will look at the following process areas for this Plan: 1. 2. 3. 4. 5. ENVIRONMENTAL OBJECTIVES The general objectives for this scope were developed and include the following: (Check all that apply)
Improved operating practices to improve housekeeping or spill and leak prevention.
Improved management practices, such as purchase and inventory control.
Process or equipment modifications to minimize the use of toxic substances.
Process or equipment modifications to minimize the generation of hazardous waste.
Process or equipment modifications to minimize the generation of hazardous air pollutants (HAPs), volatile organic compounds (VOCs) or particulate emission reductions.
Raw material modifications or substitutions to minimize the “use” of toxic substances.
Resource conservation (water, energy, etc.).
Reuse or recycling of materials or wastes.
Reduction in use or emissions of greenhouse gasses or ozone producing chemicals. Other:
Pollution Prevention Plan
Section 6. Analysis and Opportunity Identification (ARS §49-963.J.7) Requirement: Provide and analysis identifying pollution prevention opportunities to reduce or eliminate toxic substance releases and hazardous waste generation.
Answer the following questions that apply to your operation, activity or process. Only current processes should be discussed in Section 6. Completed or historic pollution prevention projects, activities or accomplishments should be discussed in Section 10. Note: Even if you believe your facility has no feasible opportunities for reducing hazardous waste generation or toxic usage, you must discuss that here in Section 6. Process Review 1. Process Area (# ): 2. Process Information Use additional sheets to provide this information. The analysis information should be a narrative. The information may come from your “input-output” diagram or “input-output” table, from your root cause analysis results summary, or from other process analysis tools or methods. Those tools are commonly used to help visualize and develop the root cause of emissions toxic substance use and waste. Use additional sheets as there is not enough space here. To assure that you have provided complete P2 analysis process information, check the corresponding boxes below as you answer that question in your review. These boxes provide a confirmation that the information was included in the Plan.
Describe the process steps.
Discuss the toxic substances (inputs) used in the process and why they are used.
Discuss the wastes and emissions (output) generated by the process. (Include wastes and emissions due to spills, cleaning, maintenance, unused or expired raw materials, etc, and include waste codes.)
Describe what happens to each waste and emission. (Is it disposed, segregated recycled, treated, incinerated, released to air, etc?)
Discuss whether raw material purchases produce packaging material that must be handled? (i.e. pallets, drums, bags, etc.) If so, describe what happens to this material?
Discuss the root cause of each waste generation, emission or toxic substance use.
If any of the above information is not included in your process review, please explain here or on an attached sheet.
Pollution Prevention Plan
Section 6. (Continued)- 3. Are there pollution prevention opportunities? Your P2 analysis involves re-thinking how this process or function may be accomplished in other ways that might prove to be environmentally preferable, while still meeting cost and performance requirements. The waste management hierarchy and the different levels and kinds of pollution prevention techniques (alternatives) should be considered, such as using substitute products, technology changes, improved work practices, etc. Refer to the pollution prevention techniques table elsewhere in this document for examples.
As a result of your P2 analyses, answer the questions below.
Can the process “inputs” or method, etc., be eliminated or modified to reduce waste, emission(s) or toxic substance use?
Yes No
Can any of the toxic or non-toxic substances be:
Eliminated? Replaced with a less toxic substitute? Used less? Recycled or reused?
Reformulated to reduce None of these toxicity ? Other
4. Based on the results from item 3 above: Describe the pollution prevention opportunities to: eliminate at the source, reduce at the source, reduce toxicity, reduce the volume, reuse or recycle each waste, emission or use of the toxic substance.
Opportunity (A): (Describe) Will this opportunity be developed into a goal?
YES, fill out a goal form in Section 7, Goal number: NO, give the reason here:
Opportunity (B): (Describe)
Will this opportunity be developed into a goal?
YES, fill out a goal form in Section 7, Goal number: NO, give the reason here:
Opportunity (C): (Describe):
Will this opportunity be developed into a goal? YES, fill out a goal form in Section 7, Goal number: NO, give the reason here:
Write each feasible opportunity onto the goal form found on the next page. Use one goal form for each feasible opportunity.

Pollution Prevention Plan
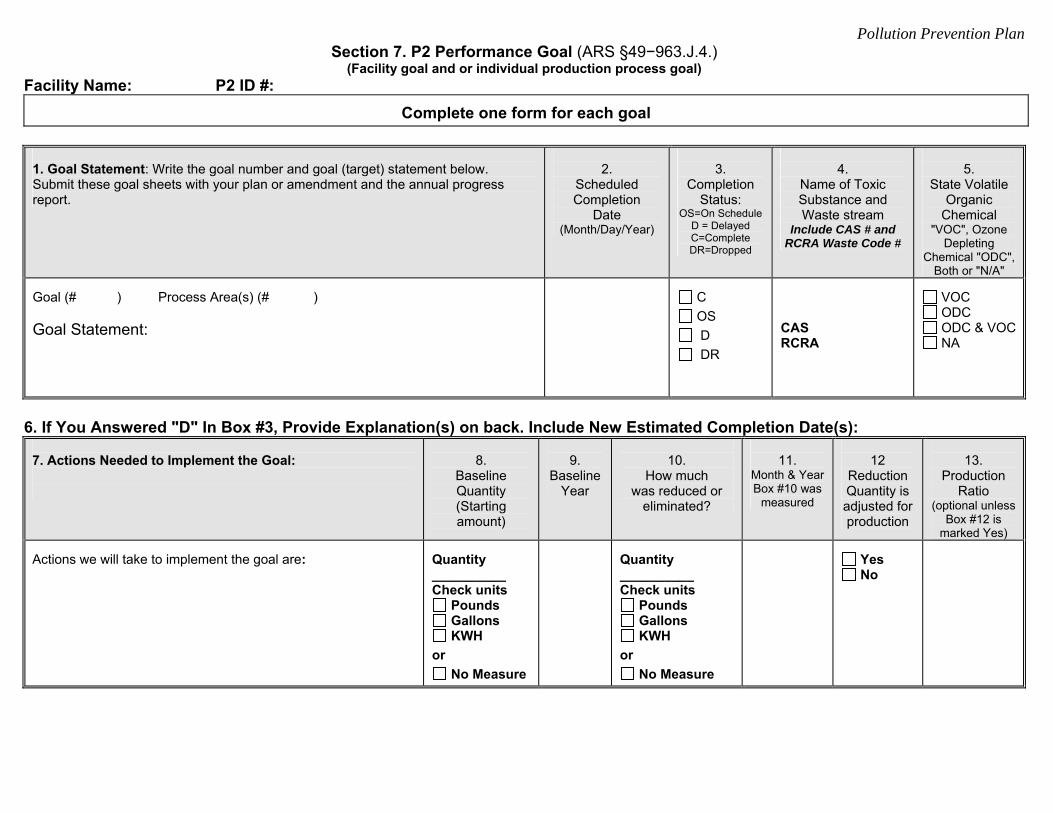
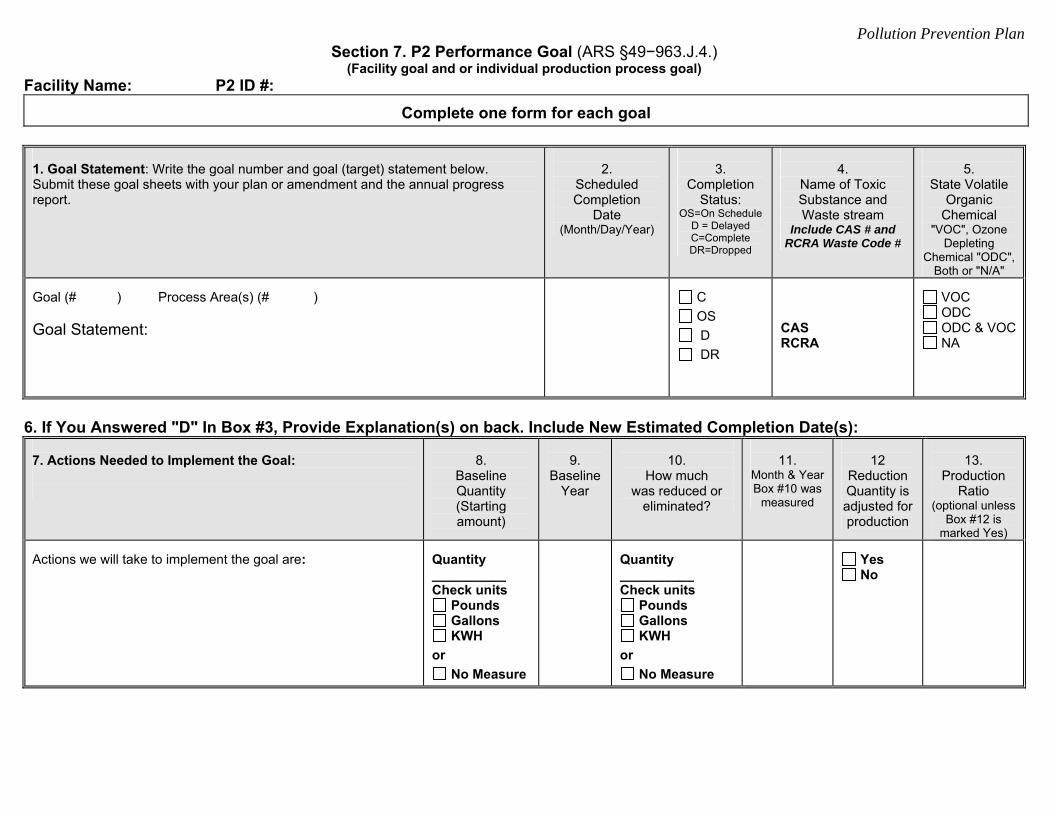
Section 7. P2 Performance Goal (ARS §49−963.J.4.) (Facility goal and or individual production process goal)
Facility Name: P2 ID #:
Complete one form for each goal
1. Goal Statement: Write the goal number and goal (target) statement below. Submit these goal sheets with your plan or amendment and the annual progress report.
2.
Scheduled Completion
Date (Month/Day/Year)
3.
Completion Status:
OS=On Schedule D = Delayed C=Complete DR=Dropped
4.
Name of Toxic Substance and Waste stream
Include CAS # and RCRA Waste Code #
5.
State Volatile Organic
Chemical "VOC", Ozone
Depleting Chemical "ODC",
Both or "N/A" Goal (# ) Process Area(s) (# ) Goal Statement:
C
OS
D
DR
CAS RCRA
VOC ODC ODC & VOC NA
6. If You Answered "D" In Box #3, Provide Explanation(s) on back. Include New Estimated Completion Date(s):
7. Actions Needed to Implement the Goal:
8.
Baseline Quantity (Starting amount)
9.
Baseline Year
10.
How much was reduced or
eliminated?
11.
Month & Year Box #10 was
measured
12
Reduction Quantity is adjusted for production
13.
Production Ratio
(optional unless Box #12 is
marked Yes) Actions we will take to implement the goal are:
Quantity __________ Check units
Pounds Gallons KWH
or
No Measure
Quantity __________ Check units
Pounds Gallons KWH
or
No Measure
Yes No
Pollution Prevention Plan
Section 7. P2 Performance Goal (ARS §49−963.J.4.) (Facility goal and or individual production process goal)
Facility Name: P2 ID #:
Complete one form for each goal
1. Goal Statement: Write the goal number and goal (target) statement below. Submit these goal sheets with your plan or amendment and the annual progress report.
2.
Scheduled Completion
Date (Month/Day/Year)
3.
Completion Status:
OS=On Schedule D = Delayed C=Complete DR=Dropped
4.
Name of Toxic Substance and Waste stream
Include CAS # and RCRA Waste Code #
5.
State Volatile Organic
Chemical "VOC", Ozone
Depleting Chemical "ODC",
Both or "N/A" Goal (# ) Process Area(s) (# ) Goal Statement:
C
OS
D
DR
CAS RCRA
VOC ODC ODC & VOC NA
6. If You Answered "D" In Box #3, Provide Explanation(s) on back. Include New Estimated Completion Date(s):
7. Actions Needed to Implement the Goal:
8.
Baseline Quantity (Starting amount)
9.
Baseline Year
10.
How much was reduced or
eliminated?
11.
Month & Year Box #10 was
measured
12
Reduction Quantity is adjusted for production
13.
Production Ratio
(optional unless Box #12 is
marked Yes) Actions we will take to implement the goal are:
Quantity __________ Check units
Pounds Gallons KWH
or
No Measure
Quantity __________ Check units
Pounds Gallons KWH
or
No Measure
Yes No
Pollution Prevention Plan
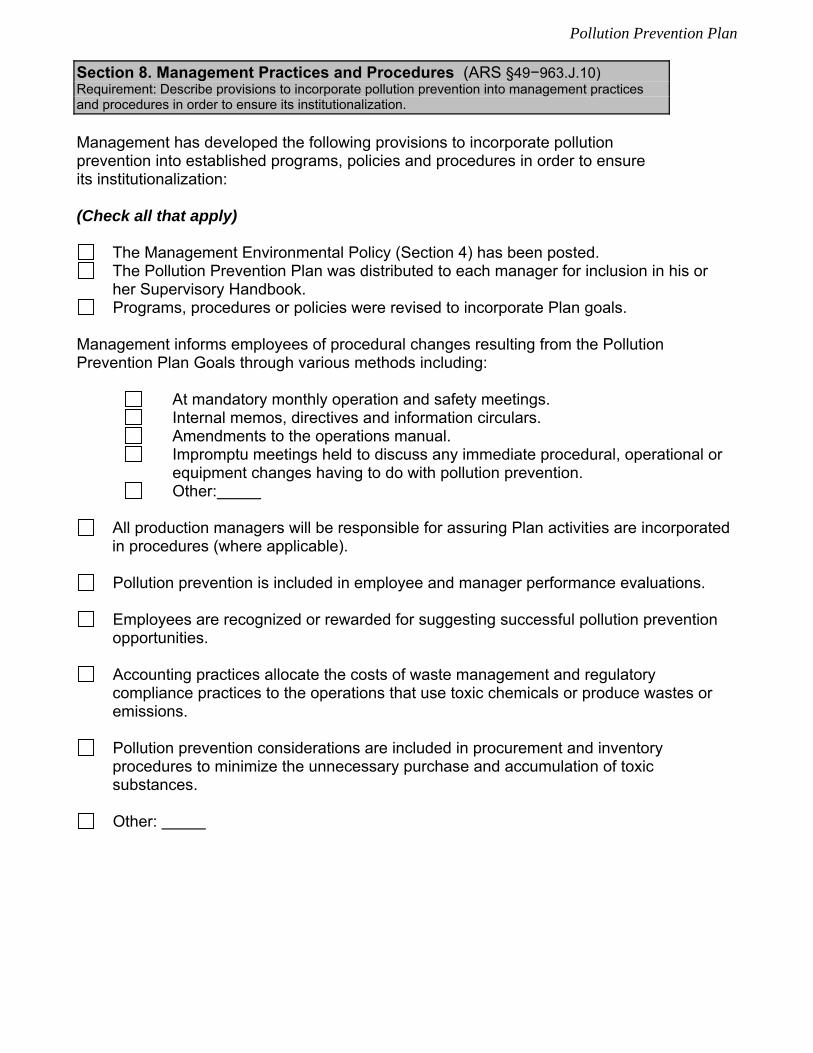
Section 8. Management Practices and Procedures (ARS §49−963.J.10) Requirement: Describe provisions to incorporate pollution prevention into management practices and procedures in order to ensure its institutionalization.
Management has developed the following provisions to incorporate pollution prevention into established programs, policies and procedures in order to ensure its institutionalization:
(Check all that apply)
The Management Environmental Policy (Section 4) has been posted. The Pollution Prevention Plan was distributed to each manager for inclusion in his or
her Supervisory Handbook. Programs, procedures or policies were revised to incorporate Plan goals.
Management informs employees of procedural changes resulting from the Pollution
Prevention Plan Goals through various methods including:
At mandatory monthly operation and safety meetings. Internal memos, directives and information circulars. Amendments to the operations manual. Impromptu meetings held to discuss any immediate procedural, operational or
equipment changes having to do with pollution prevention. Other: .
All production managers will be responsible for assuring Plan activities are incorporated
in procedures (where applicable).
Pollution prevention is included in employee and manager performance evaluations.
Employees are recognized or rewarded for suggesting successful pollution prevention opportunities.
Accounting practices allocate the costs of waste management and regulatory compliance practices to the operations that use toxic chemicals or produce wastes or emissions.
Pollution prevention considerations are included in procurement and inventory procedures to minimize the unnecessary purchase and accumulation of toxic substances.
Other:
Pollution Prevention Plan
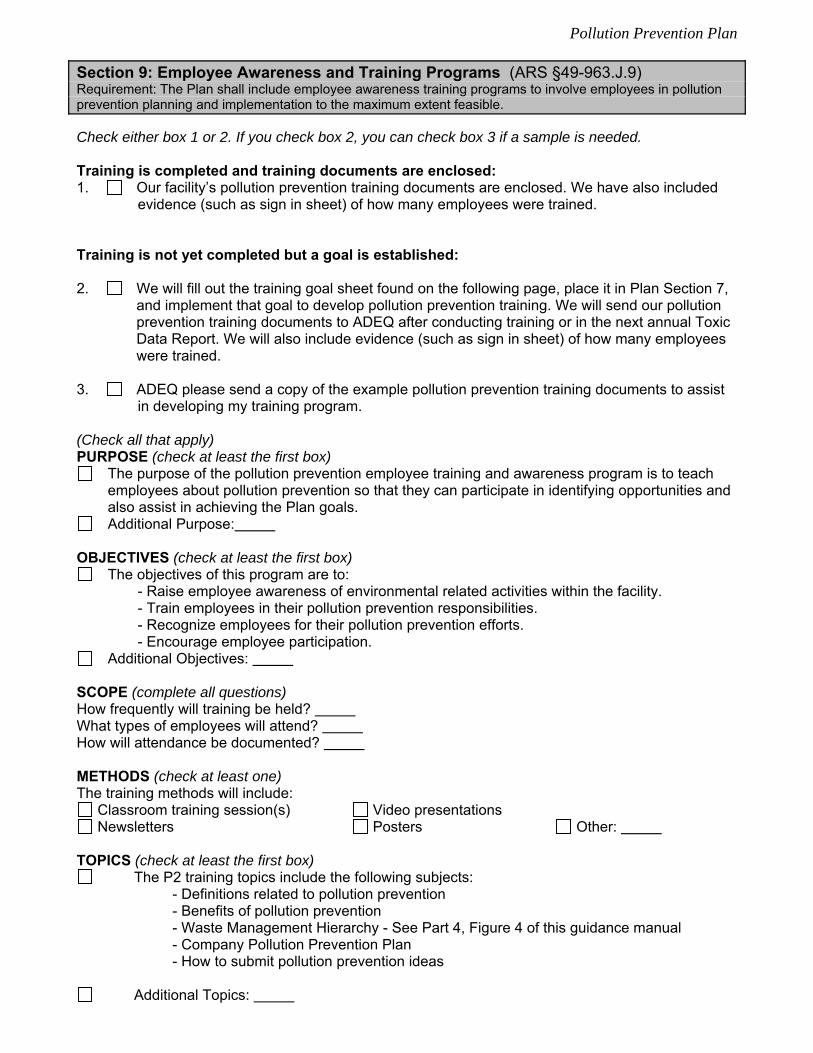
Section 9: Employee Awareness and Training Programs (ARS §49-963.J.9) Requirement: The Plan shall include employee awareness training programs to involve employees in pollution prevention planning and implementation to the maximum extent feasible. Check either box 1 or 2. If you check box 2, you can check box 3 if a sample is needed. Training is completed and training documents are enclosed: 1. Our facility’s pollution prevention training documents are enclosed. We have also included evidence (such as sign in sheet) of how many employees were trained. Training is not yet completed but a goal is established: 2. We will fill out the training goal sheet found on the following page, place it in Plan Section 7,
and implement that goal to develop pollution prevention training. We will send our pollution prevention training documents to ADEQ after conducting training or in the next annual Toxic
Data Report. We will also include evidence (such as sign in sheet) of how many employees were trained.
3. ADEQ please send a copy of the example pollution prevention training documents to assist in developing my training program. (Check all that apply) PURPOSE (check at least the first box)
The purpose of the pollution prevention employee training and awareness program is to teach employees about pollution prevention so that they can participate in identifying opportunities and also assist in achieving the Plan goals.
Additional Purpose: OBJECTIVES (check at least the first box)
The objectives of this program are to: - Raise employee awareness of environmental related activities within the facility. - Train employees in their pollution prevention responsibilities. - Recognize employees for their pollution prevention efforts. - Encourage employee participation.
Additional Objectives: SCOPE (complete all questions) How frequently will training be held? What types of employees will attend? How will attendance be documented? METHODS (check at least one) The training methods will include:
Classroom training session(s) Video presentations Newsletters Posters Other:
TOPICS (check at least the first box)
The P2 training topics include the following subjects: - Definitions related to pollution prevention - Benefits of pollution prevention - Waste Management Hierarchy - See Part 4, Figure 4 of this guidance manual - Company Pollution Prevention Plan - How to submit pollution prevention ideas
Additional Topics:
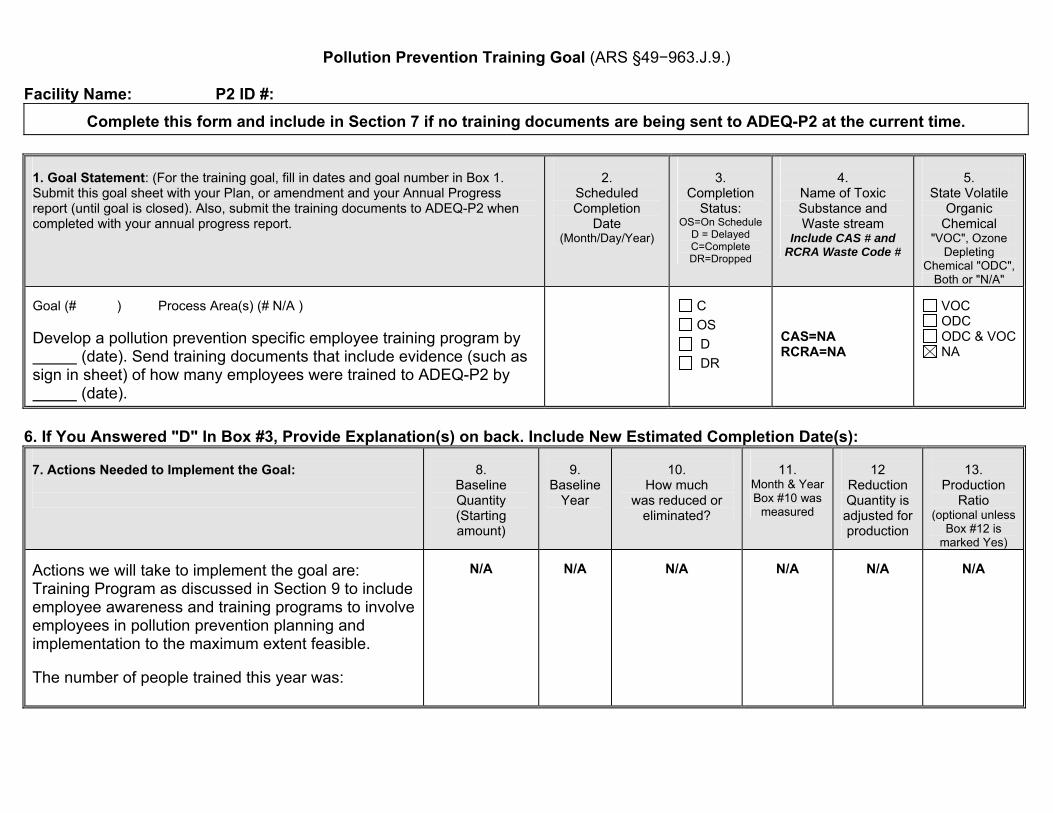
Pollution Prevention Training Goal (ARS §49−963.J.9.)
Facility Name: P2 ID #:
Complete this form and include in Section 7 if no training documents are being sent to ADEQ-P2 at the current time.
1. Goal Statement: (For the training goal, fill in dates and goal number in Box 1. Submit this goal sheet with your Plan, or amendment and your Annual Progress report (until goal is closed). Also, submit the training documents to ADEQ-P2 when completed with your annual progress report.
2.
Scheduled Completion
Date (Month/Day/Year)
3.
Completion Status:
OS=On Schedule D = Delayed C=Complete DR=Dropped
4.
Name of Toxic Substance and Waste stream
Include CAS # and RCRA Waste Code #
5.
State Volatile Organic
Chemical "VOC", Ozone
Depleting Chemical "ODC",
Both or "N/A" Goal (# ) Process Area(s) (# N/A ) Develop a pollution prevention specific employee training program by (date). Send training documents that include evidence (such as sign in sheet) of how many employees were trained to ADEQ-P2 by (date).
C
OS
D
DR
CAS=NA RCRA=NA
VOC ODC ODC & VOC NA
6. If You Answered "D" In Box #3, Provide Explanation(s) on back. Include New Estimated Completion Date(s):
7. Actions Needed to Implement the Goal:
8.
Baseline Quantity (Starting amount)
9.
Baseline Year
10.
How much was reduced or
eliminated?
11.
Month & Year Box #10 was
measured
12
Reduction Quantity is adjusted for production
13.
Production Ratio
(optional unless Box #12 is
marked Yes) Actions we will take to implement the goal are: Training Program as discussed in Section 9 to include employee awareness and training programs to involve employees in pollution prevention planning and implementation to the maximum extent feasible. The number of people trained this year was:
N/A
N/A
N/A
N/A
N/A
N/A
Pollution Prevention Plan
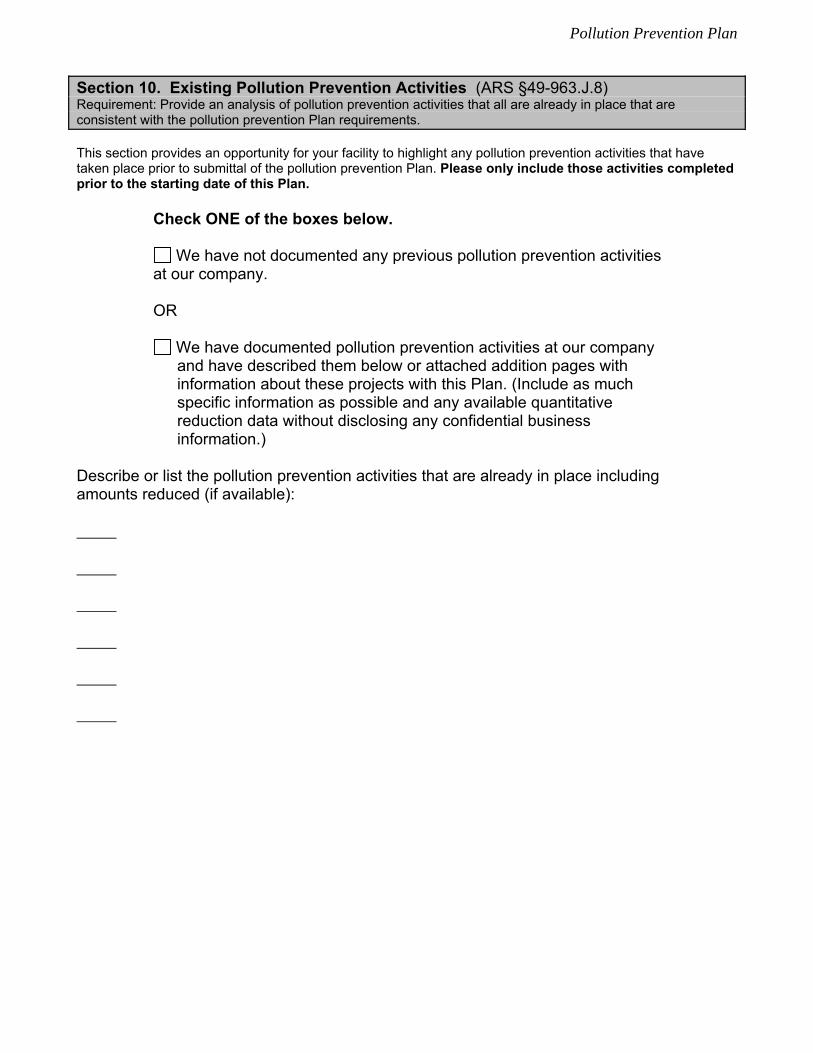
Section 10. Existing Pollution Prevention Activities (ARS §49-963.J.8) Requirement: Provide an analysis of pollution prevention activities that all are already in place that are consistent with the pollution prevention Plan requirements. This section provides an opportunity for your facility to highlight any pollution prevention activities that have taken place prior to submittal of the pollution prevention Plan. Please only include those activities completed prior to the starting date of this Plan.
Check ONE of the boxes below.
We have not documented any previous pollution prevention activities at our company. OR
We have documented pollution prevention activities at our company and have described them below or attached addition pages with information about these projects with this Plan. (Include as much specific information as possible and any available quantitative reduction data without disclosing any confidential business information.)
Describe or list the pollution prevention activities that are already in place including amounts reduced (if available):

Pollution Prevention Plan
This page intentionally left blank
Developing the Plan
Part 2
Developing the
Pollution Prevention Analysis and Plan
and
an Example Plan
Developing the Plan
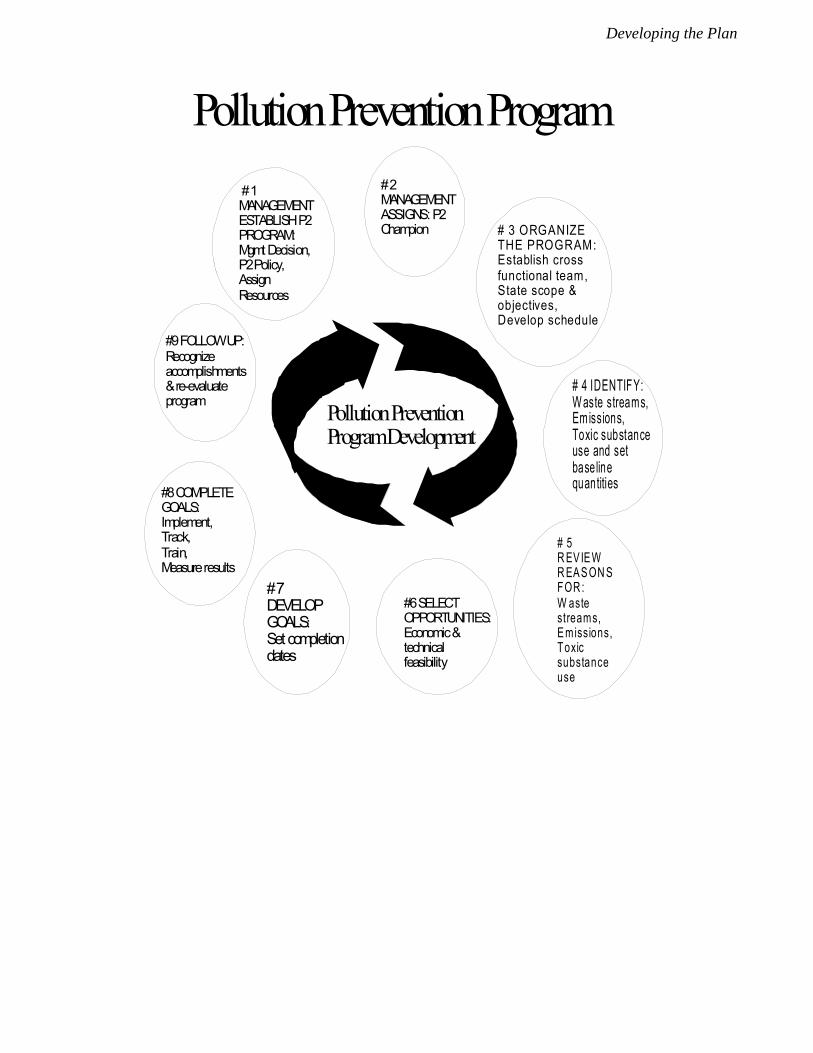
# 5R EVIE WR EAS ON SFOR :W astestreams,E missions,Toxicsubstanceuse
#9 FOLLOW UP:Recognizeaccomplishments& re-evaluateprogram
# 4 IDENTIFY:W aste streams,Emissions, Toxic substanceuse and setbaselinequantities
# 3 ORGANIZETHE PROGRAM:Establish crossfunctional team,State scope &objectives,Develop schedule
#6 SELECTOPPORTUNITIES:Economic &technical feasibility
#8 COMPLETEGOALS:Implement, Track, Train, Measure results
# 1MANAGEMENTESTABLISH P2PROGRAM:Mgmt Decision,P2 Policy,AssignResources
# 2MANAGEMENTASSIGNS: P2Champion
Pollution PreventionProgram Development
Pollution Prevention Program
# 7DEVELOPGOALS:Set completiondates
Developing the Plan
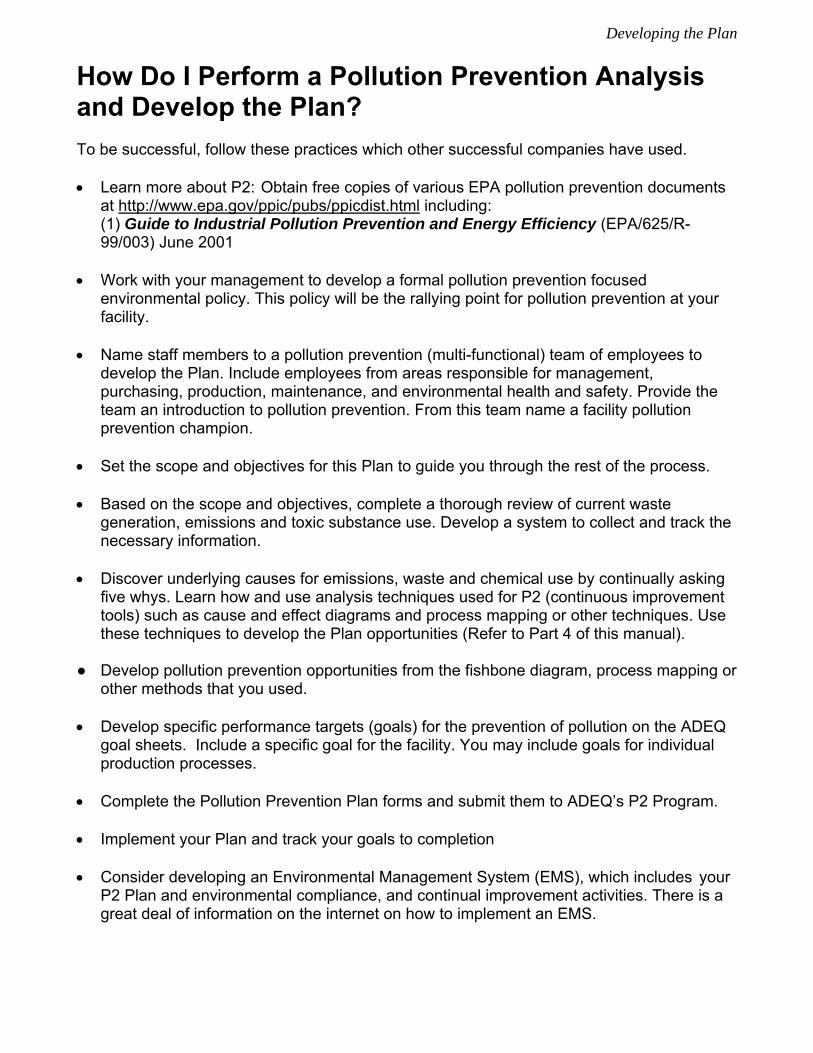
How Do I Perform a Pollution Prevention Analysis and Develop the Plan? To be successful, follow these practices which other successful companies have used. Learn more about P2: Obtain free copies of various EPA pollution prevention documents
at http://www.epa.gov/ppic/pubs/ppicdist.html including: (1) Guide to Industrial Pollution Prevention and Energy Efficiency (EPA/625/R- 99/003) June 2001 Work with your management to develop a formal pollution prevention focused
environmental policy. This policy will be the rallying point for pollution prevention at your facility.
Name staff members to a pollution prevention (multi-functional) team of employees to
develop the Plan. Include employees from areas responsible for management, purchasing, production, maintenance, and environmental health and safety. Provide the team an introduction to pollution prevention. From this team name a facility pollution prevention champion.
Set the scope and objectives for this Plan to guide you through the rest of the process. Based on the scope and objectives, complete a thorough review of current waste
generation, emissions and toxic substance use. Develop a system to collect and track the necessary information.
Discover underlying causes for emissions, waste and chemical use by continually asking
five whys. Learn how and use analysis techniques used for P2 (continuous improvement tools) such as cause and effect diagrams and process mapping or other techniques. Use these techniques to develop the Plan opportunities (Refer to Part 4 of this manual).
● Develop pollution prevention opportunities from the fishbone diagram, process mapping or
other methods that you used. Develop specific performance targets (goals) for the prevention of pollution on the ADEQ
goal sheets. Include a specific goal for the facility. You may include goals for individual production processes.
Complete the Pollution Prevention Plan forms and submit them to ADEQ’s P2 Program. Implement your Plan and track your goals to completion Consider developing an Environmental Management System (EMS), which includes your
P2 Plan and environmental compliance, and continual improvement activities. There is a great deal of information on the internet on how to implement an EMS.
Developing the Plan
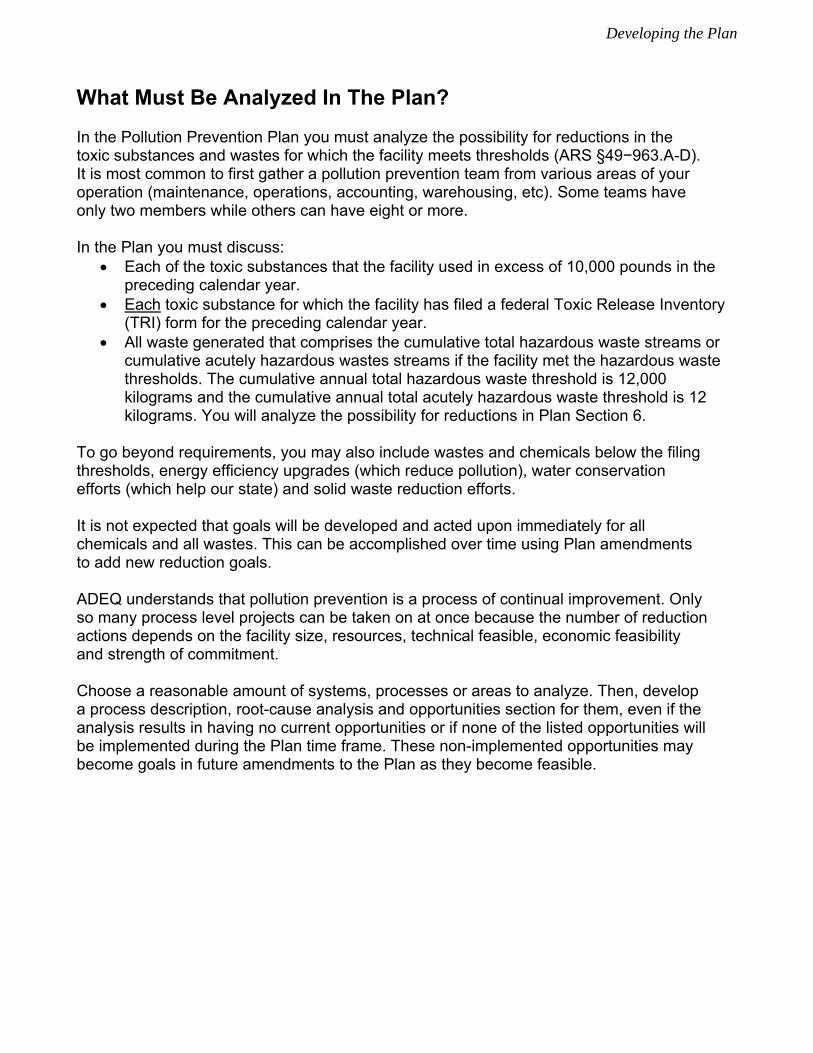
What Must Be Analyzed In The Plan? In the Pollution Prevention Plan you must analyze the possibility for reductions in the toxic substances and wastes for which the facility meets thresholds (ARS §49−963.A-D). It is most common to first gather a pollution prevention team from various areas of your operation (maintenance, operations, accounting, warehousing, etc). Some teams have only two members while others can have eight or more. In the Plan you must discuss:
Each of the toxic substances that the facility used in excess of 10,000 pounds in the preceding calendar year.
Each toxic substance for which the facility has filed a federal Toxic Release Inventory (TRI) form for the preceding calendar year.
All waste generated that comprises the cumulative total hazardous waste streams or cumulative acutely hazardous wastes streams if the facility met the hazardous waste thresholds. The cumulative annual total hazardous waste threshold is 12,000 kilograms and the cumulative annual total acutely hazardous waste threshold is 12 kilograms. You will analyze the possibility for reductions in Plan Section 6.
To go beyond requirements, you may also include wastes and chemicals below the filing thresholds, energy efficiency upgrades (which reduce pollution), water conservation efforts (which help our state) and solid waste reduction efforts. It is not expected that goals will be developed and acted upon immediately for all chemicals and all wastes. This can be accomplished over time using Plan amendments to add new reduction goals. ADEQ understands that pollution prevention is a process of continual improvement. Only so many process level projects can be taken on at once because the number of reduction actions depends on the facility size, resources, technical feasible, economic feasibility and strength of commitment. Choose a reasonable amount of systems, processes or areas to analyze. Then, develop a process description, root-cause analysis and opportunities section for them, even if the analysis results in having no current opportunities or if none of the listed opportunities will be implemented during the Plan time frame. These non-implemented opportunities may become goals in future amendments to the Plan as they become feasible.
Developing the Plan
How Are Reduction Targets or Goals Developed? You will develop pollution prevention reduction targets or goals after you perform a review and pollution prevention analysis of the sources of waste, emissions and uses of toxic substances at the facility. In your review (Plan Section 6), you will describe the current situation, substances, wastes, emissions and describe the reasons why they must be are used or why they are generated or why they cannot be reduced. Using pollution prevention tools (fishbone diagrams, process maps, etc.), your pollution prevention team can discuss or brainstorm possible reduction methods and make a list of possible opportunities. After further research and discussion, the best solutions are put into action as reduction targets (goals) in the Plan Section 7. An example plan is provided here to help in using the plan forms. Also, Part 4 of this manual discusses some of the P2 analysis tools that can be used to develop P2 goals.
Example Plan
31
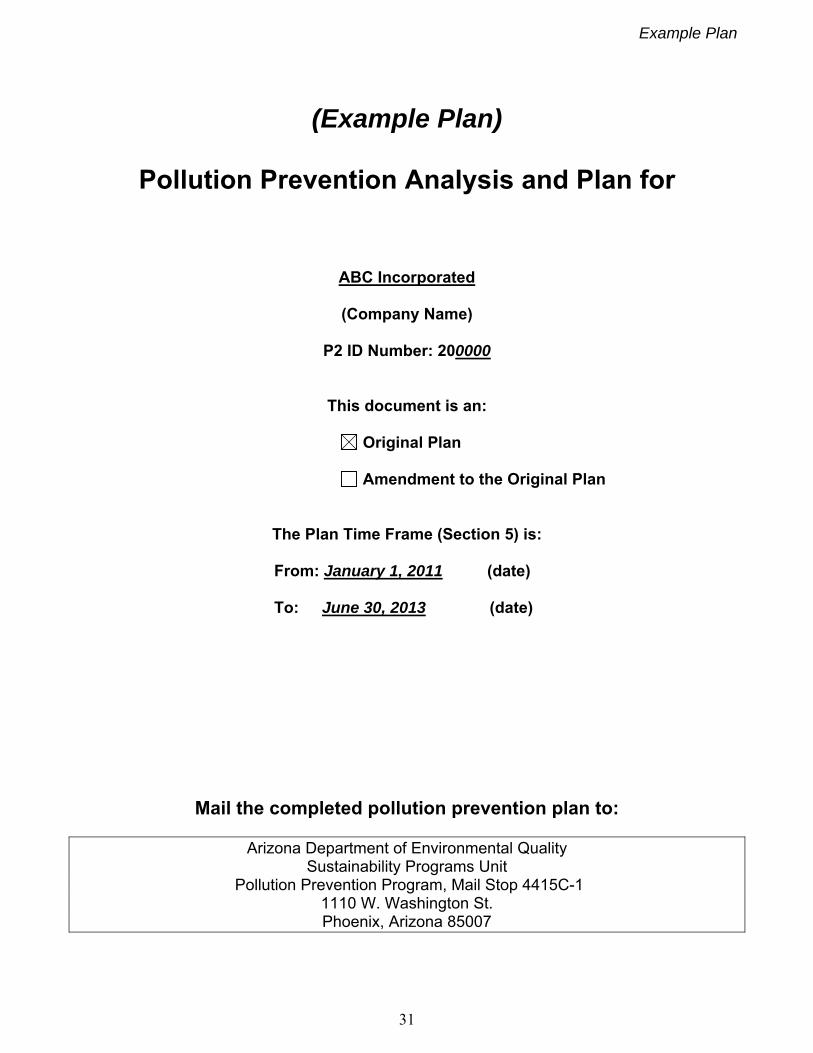
(Example Plan)
Pollution Prevention Analysis and Plan for
ABC Incorporated
(Company Name)
P2 ID Number: 200000
This document is an:
Original Plan Amendment to the Original Plan
The Plan Time Frame (Section 5) is:
From: January 1, 2011 (date) To: June 30, 2013 (date)
Mail the completed pollution prevention plan to:
Arizona Department of Environmental Quality Sustainability Programs Unit
Pollution Prevention Program, Mail Stop 4415C-1 1110 W. Washington St. Phoenix, Arizona 85007
Example Plan
32
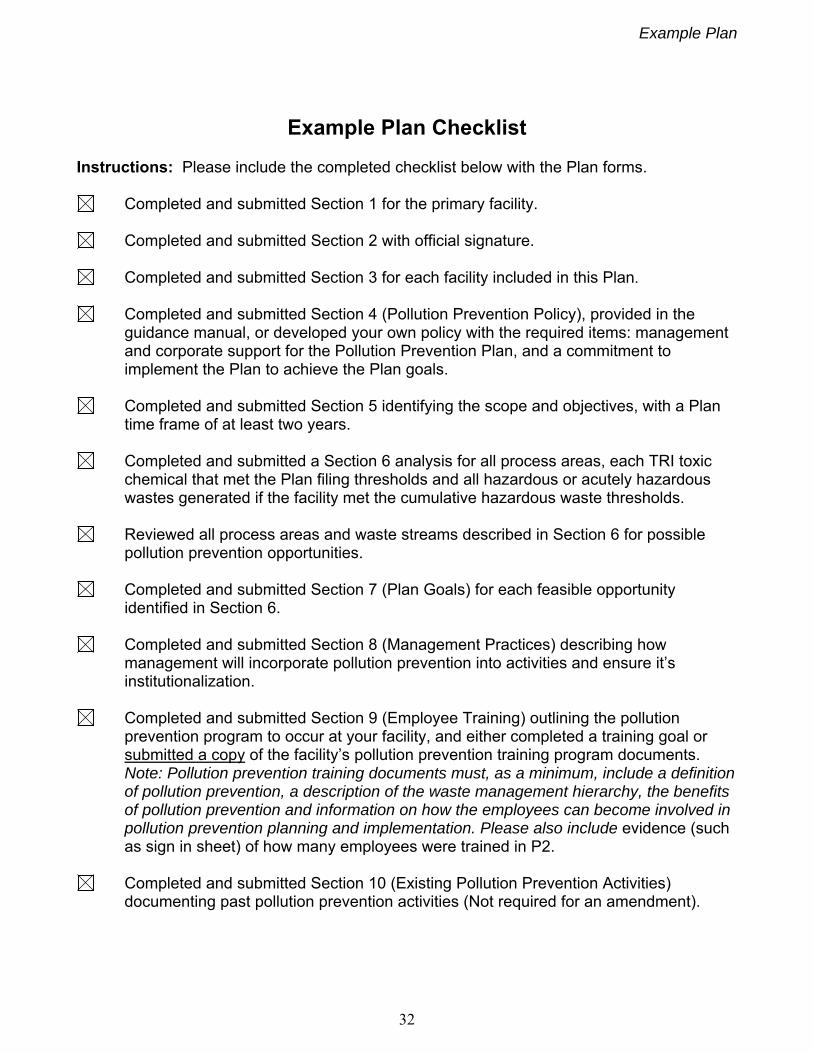
Example Plan Checklist Instructions: Please include the completed checklist below with the Plan forms.
Completed and submitted Section 1 for the primary facility.
Completed and submitted Section 2 with official signature.
Completed and submitted Section 3 for each facility included in this Plan.
Completed and submitted Section 4 (Pollution Prevention Policy), provided in the guidance manual, or developed your own policy with the required items: management and corporate support for the Pollution Prevention Plan, and a commitment to implement the Plan to achieve the Plan goals.
Completed and submitted Section 5 identifying the scope and objectives, with a Plan
time frame of at least two years.
Completed and submitted a Section 6 analysis for all process areas, each TRI toxic chemical that met the Plan filing thresholds and all hazardous or acutely hazardous wastes generated if the facility met the cumulative hazardous waste thresholds.
Reviewed all process areas and waste streams described in Section 6 for possible
pollution prevention opportunities.
Completed and submitted Section 7 (Plan Goals) for each feasible opportunity identified in Section 6.
Completed and submitted Section 8 (Management Practices) describing how
management will incorporate pollution prevention into activities and ensure it’s institutionalization.
Completed and submitted Section 9 (Employee Training) outlining the pollution
prevention program to occur at your facility, and either completed a training goal or submitted a copy of the facility’s pollution prevention training program documents. Note: Pollution prevention training documents must, as a minimum, include a definition of pollution prevention, a description of the waste management hierarchy, the benefits of pollution prevention and information on how the employees can become involved in pollution prevention planning and implementation. Please also include evidence (such as sign in sheet) of how many employees were trained in P2.
Completed and submitted Section 10 (Existing Pollution Prevention Activities)
documenting past pollution prevention activities (Not required for an amendment).
Example Plan
33
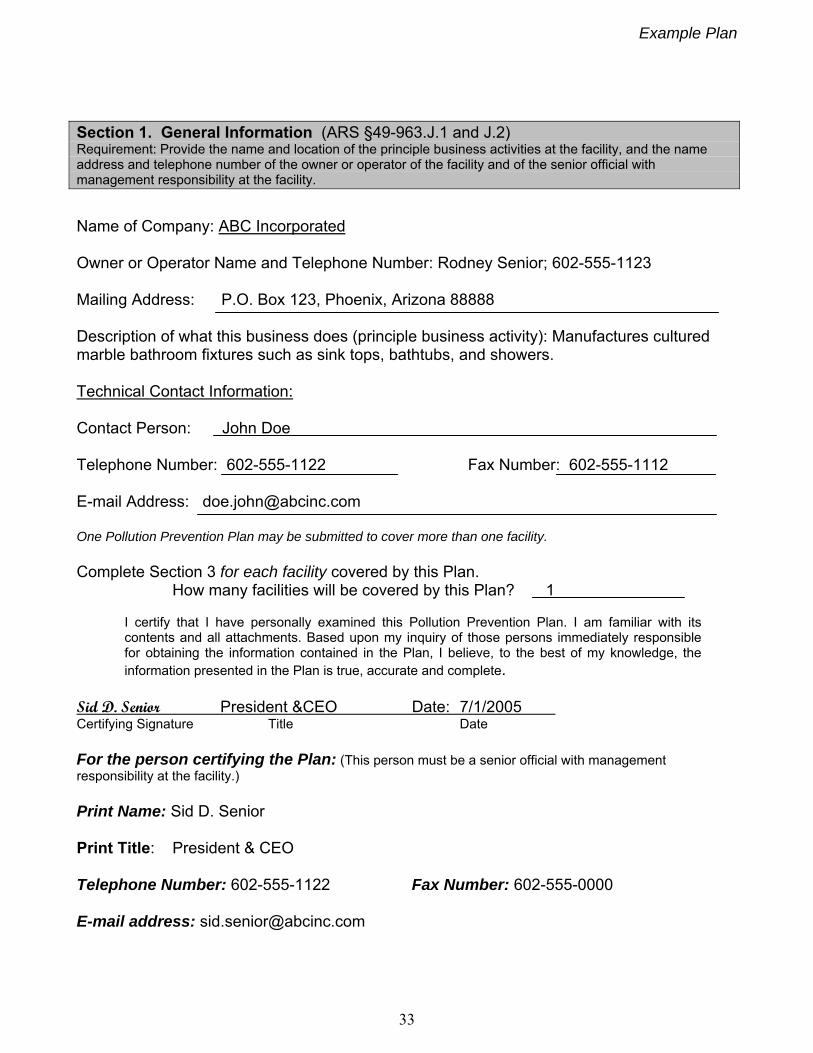
Section 1. General Information (ARS §49-963.J.1 and J.2) Requirement: Provide the name and location of the principle business activities at the facility, and the name address and telephone number of the owner or operator of the facility and of the senior official with management responsibility at the facility.
Name of Company: ABC Incorporated Owner or Operator Name and Telephone Number: Rodney Senior; 602-555-1123 Mailing Address: P.O. Box 123, Phoenix, Arizona 88888 Description of what this business does (principle business activity): Manufactures cultured marble bathroom fixtures such as sink tops, bathtubs, and showers. Technical Contact Information: Contact Person: John Doe Telephone Number: 602-555-1122 Fax Number: 602-555-1112 E-mail Address: [email protected] One Pollution Prevention Plan may be submitted to cover more than one facility. Complete Section 3 for each facility covered by this Plan.
How many facilities will be covered by this Plan? 1 I certify that I have personally examined this Pollution Prevention Plan. I am familiar with its contents and all attachments. Based upon my inquiry of those persons immediately responsible for obtaining the information contained in the Plan, I believe, to the best of my knowledge, the information presented in the Plan is true, accurate and complete.
Sid D. Senior President &CEO Date: 7/1/2005 Certifying Signature Title Date For the person certifying the Plan: (This person must be a senior official with management responsibility at the facility.) Print Name: Sid D. Senior Print Title: President & CEO Telephone Number: 602-555-1122 Fax Number: 602-555-0000 E-mail address: [email protected]
Example Plan
34
Guidance for Section 1: General Information Name of Company: Enter the name of the company, the owner or operators name and telephone number. Mailing Address: Enter the mailing address of the company where the contact person can be reached during normal business hours and where ADEQ will mail information. Description of what this business does (principle business activity): Provide a detailed description of the principle business activity and processes at the facility. You should consider adding information from the corporate of facility’s web page as it may describe in good detail what the company does and what products it manufactures. Technical Contact Information: Contact Person: Enter the name of the Pollution Prevention contact person. This should be the person at the facility who can be contacted by ADEQ for questions about the development and implementation of the Plan. Telephone Number, Fax Number, e-mail Address: Enter the work phone, fax and e-mail of the contact person. How many facilities will be covered by this plan? Enter the number of facilities at different locations that are covered by this Plan.
Guidance for Section 2: Certification Certification Statement: - Have the senior official with management responsibility at the facility review the Plan and read and understand the Plan certification statement. - The senior official with management responsibility at the facility must sign the certification statement. - Print or type the official’s name, the date the certification was signed, the official’s title, telephone number, e-mail, and fax number in the appropriate locations. - The person certifying the Plan should have the authority to assure that resources are allocated to implement the Plan to achieve the Plan goals.
Example Plan
35
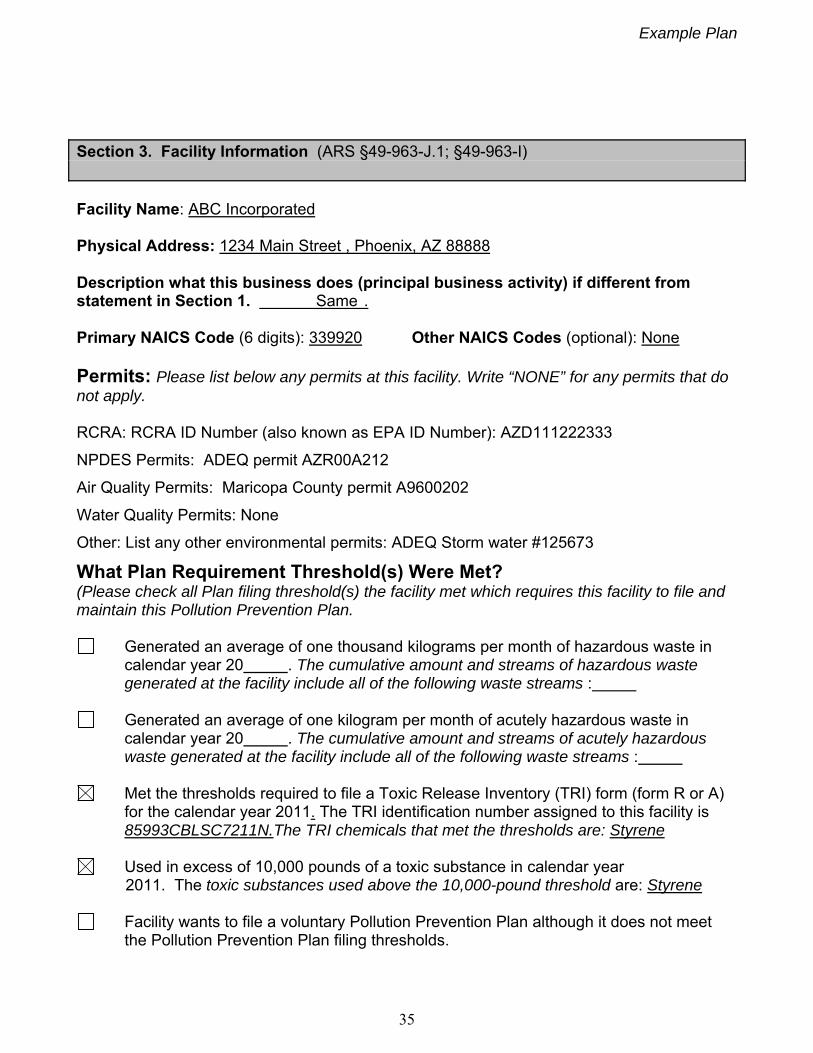
Section 3. Facility Information (ARS §49-963-J.1; §49-963-I) Facility Name: ABC Incorporated Physical Address: 1234 Main Street , Phoenix, AZ 88888 Description what this business does (principal business activity) if different from statement in Section 1. Same . Primary NAICS Code (6 digits): 339920 Other NAICS Codes (optional): None Permits: Please list below any permits at this facility. Write “NONE” for any permits that do not apply. RCRA: RCRA ID Number (also known as EPA ID Number): AZD111222333
NPDES Permits: ADEQ permit AZR00A212
Air Quality Permits: Maricopa County permit A9600202
Water Quality Permits: None
Other: List any other environmental permits: ADEQ Storm water #125673
What Plan Requirement Threshold(s) Were Met? (Please check all Plan filing threshold(s) the facility met which requires this facility to file and maintain this Pollution Prevention Plan.
Generated an average of one thousand kilograms per month of hazardous waste in calendar year 20 . The cumulative amount and streams of hazardous waste generated at the facility include all of the following waste streams :
Generated an average of one kilogram per month of acutely hazardous waste in
calendar year 20 . The cumulative amount and streams of acutely hazardous waste generated at the facility include all of the following waste streams :
Met the thresholds required to file a Toxic Release Inventory (TRI) form (form R or A)
for the calendar year 2011. The TRI identification number assigned to this facility is 85993CBLSC7211N.The TRI chemicals that met the thresholds are: Styrene
Used in excess of 10,000 pounds of a toxic substance in calendar year
2011. The toxic substances used above the 10,000-pound threshold are: Styrene
Facility wants to file a voluntary Pollution Prevention Plan although it does not meet the Pollution Prevention Plan filing thresholds.
Example Plan
36
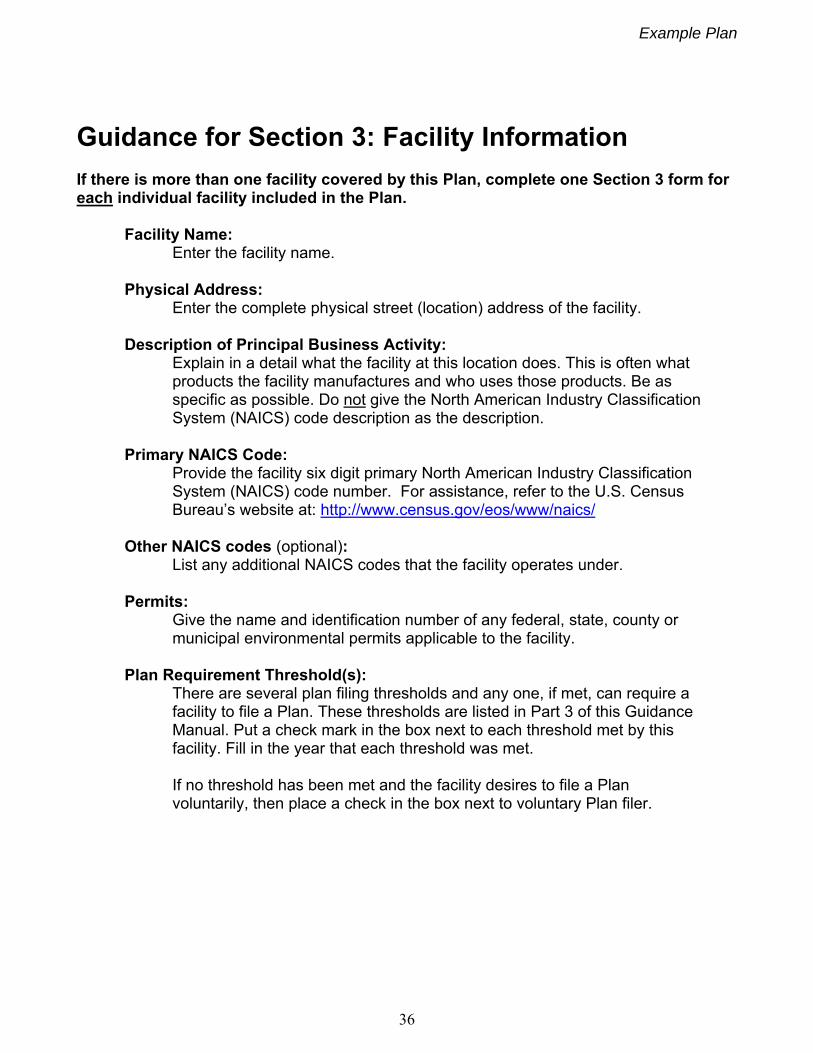
Guidance for Section 3: Facility Information If there is more than one facility covered by this Plan, complete one Section 3 form for each individual facility included in the Plan. Facility Name:
Enter the facility name. Physical Address:
Enter the complete physical street (location) address of the facility. Description of Principal Business Activity:
Explain in a detail what the facility at this location does. This is often what products the facility manufactures and who uses those products. Be as specific as possible. Do not give the North American Industry Classification System (NAICS) code description as the description.
Primary NAICS Code: Provide the facility six digit primary North American Industry Classification System (NAICS) code number. For assistance, refer to the U.S. Census
Bureau’s website at: http://www.census.gov/eos/www/naics/ Other NAICS codes (optional):
List any additional NAICS codes that the facility operates under. Permits:
Give the name and identification number of any federal, state, county or municipal environmental permits applicable to the facility.
Plan Requirement Threshold(s): There are several plan filing thresholds and any one, if met, can require a facility to file a Plan. These thresholds are listed in Part 3 of this Guidance
Manual. Put a check mark in the box next to each threshold met by this facility. Fill in the year that each threshold was met.
If no threshold has been met and the facility desires to file a Plan voluntarily, then place a check in the box next to voluntary Plan filer.
Example Plan
37
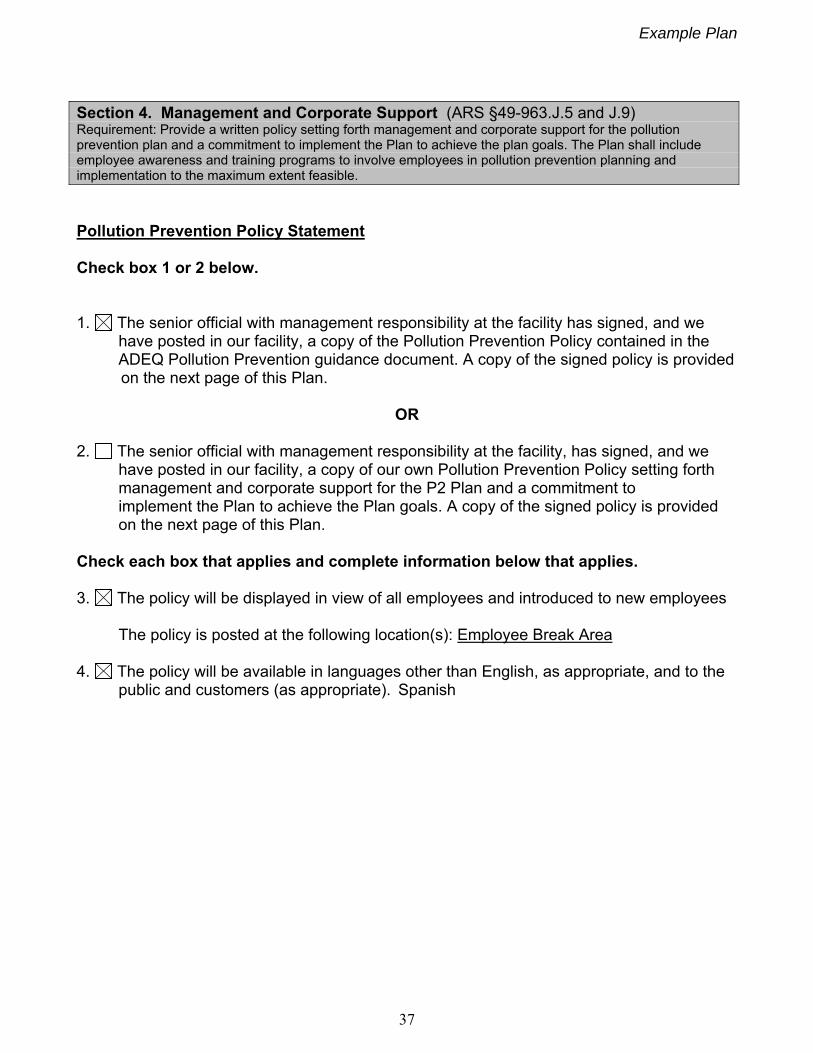
Section 4. Management and Corporate Support (ARS §49-963.J.5 and J.9) Requirement: Provide a written policy setting forth management and corporate support for the pollution prevention plan and a commitment to implement the Plan to achieve the plan goals. The Plan shall include employee awareness and training programs to involve employees in pollution prevention planning and implementation to the maximum extent feasible.
Pollution Prevention Policy Statement Check box 1 or 2 below. 1. The senior official with management responsibility at the facility has signed, and we have posted in our facility, a copy of the Pollution Prevention Policy contained in the ADEQ Pollution Prevention guidance document. A copy of the signed policy is provided on the next page of this Plan.
OR
2. The senior official with management responsibility at the facility, has signed, and we have posted in our facility, a copy of our own Pollution Prevention Policy setting forth management and corporate support for the P2 Plan and a commitment to implement the Plan to achieve the Plan goals. A copy of the signed policy is provided on the next page of this Plan.
Check each box that applies and complete information below that applies. 3. The policy will be displayed in view of all employees and introduced to new employees The policy is posted at the following location(s): Employee Break Area 4. The policy will be available in languages other than English, as appropriate, and to the public and customers (as appropriate). Spanish

Example Plan
37
Pollution Prevention Policy ABC Incorporated
Our company is committed to protecting the health and safety of the public, our employees and protecting the environment. To the best of our ability we will: - Develop a pollution prevention plan and implement the plan to achieve the plan goals. - Provide employee awareness and training programs to involve employees in pollution prevention planning and implementation to the maximum extent feasible. - Incorporate the pollution prevention plan into management practices and procedures. - Use pollution prevention to reduce or eliminate the toxicity and the amount of toxic substances and hazardous wastes and minimize their undesirable effects on air, water and land resources, and to conserve resources, including energy and water. - Comply with the relevant laws and regulations and implement programs and procedures to assure environmental compliance. Our management and employees are committed to continual improvement and will continuously seek opportunities to improve the effectiveness of our environmental program. Sid Senior Vice President December 21, 2004
Signature Title Date
Example Plan
38
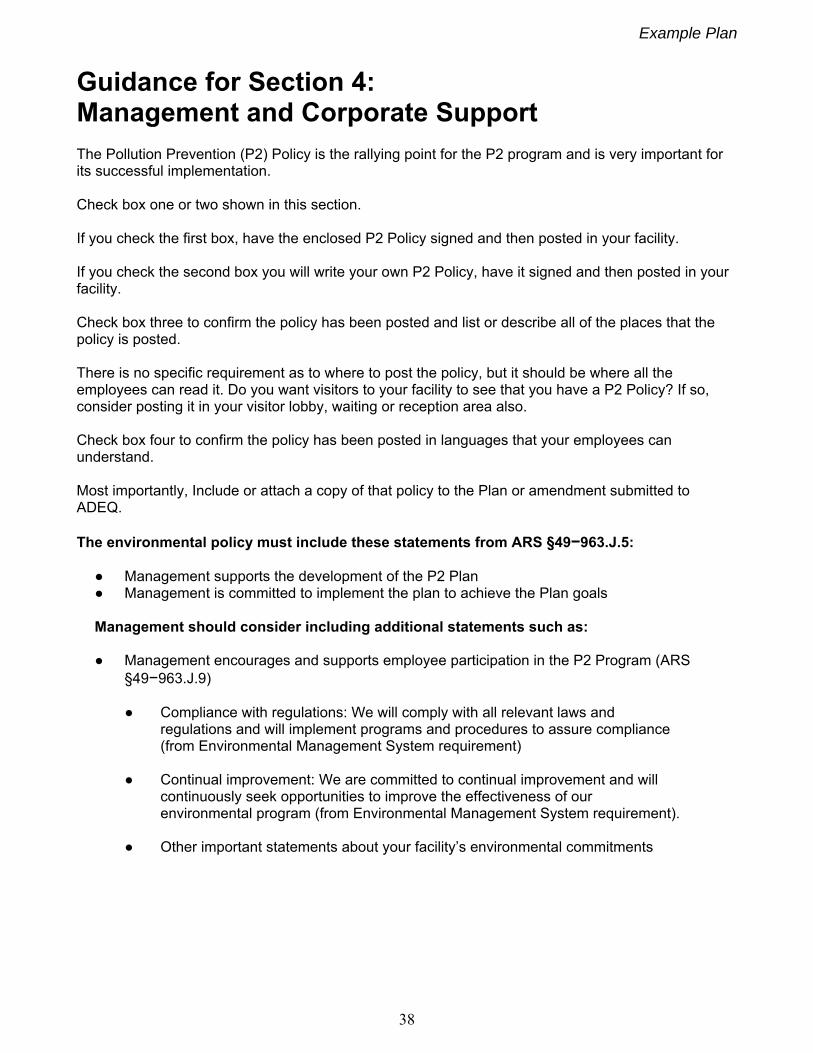
Guidance for Section 4: Management and Corporate Support The Pollution Prevention (P2) Policy is the rallying point for the P2 program and is very important for its successful implementation. Check box one or two shown in this section. If you check the first box, have the enclosed P2 Policy signed and then posted in your facility. If you check the second box you will write your own P2 Policy, have it signed and then posted in your facility. Check box three to confirm the policy has been posted and list or describe all of the places that the policy is posted. There is no specific requirement as to where to post the policy, but it should be where all the employees can read it. Do you want visitors to your facility to see that you have a P2 Policy? If so, consider posting it in your visitor lobby, waiting or reception area also. Check box four to confirm the policy has been posted in languages that your employees can understand. Most importantly, Include or attach a copy of that policy to the Plan or amendment submitted to ADEQ. The environmental policy must include these statements from ARS §49−963.J.5: ● Management supports the development of the P2 Plan ● Management is committed to implement the plan to achieve the Plan goals
Management should consider including additional statements such as: ● Management encourages and supports employee participation in the P2 Program (ARS
§49−963.J.9)
● Compliance with regulations: We will comply with all relevant laws and regulations and will implement programs and procedures to assure compliance (from Environmental Management System requirement)
● Continual improvement: We are committed to continual improvement and will continuously seek opportunities to improve the effectiveness of our environmental program (from Environmental Management System requirement). ● Other important statements about your facility’s environmental commitments
Example Plan
39
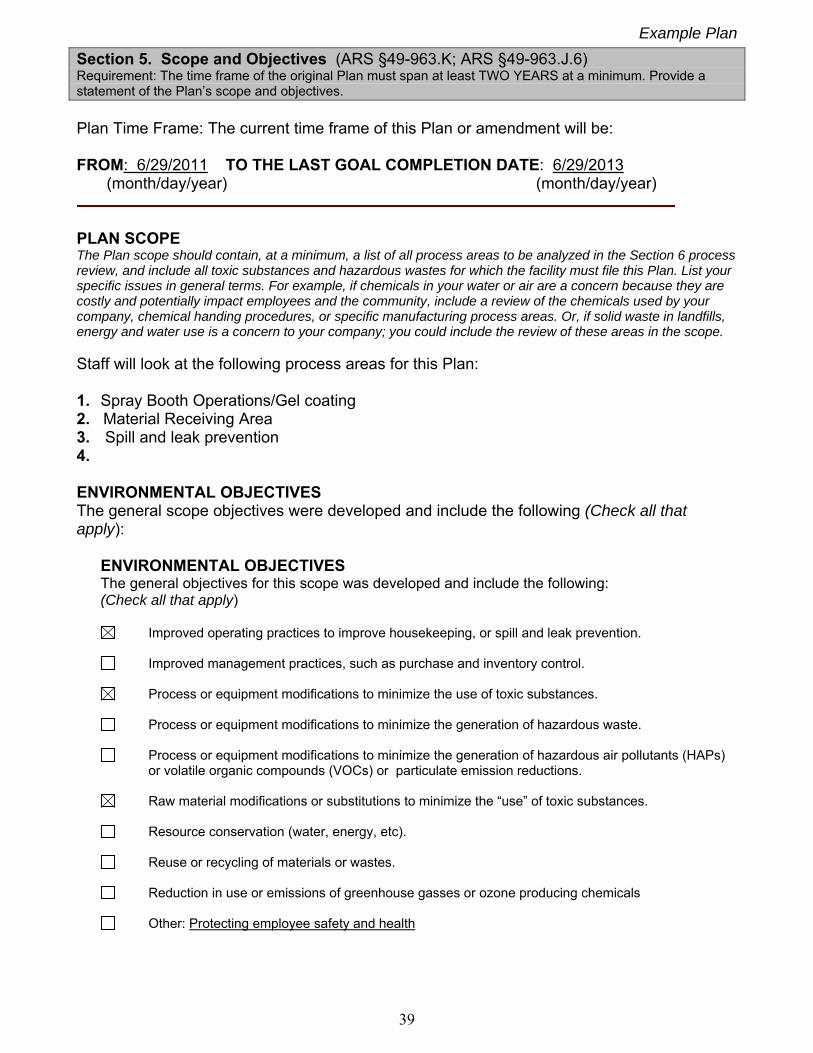
Section 5. Scope and Objectives (ARS §49-963.K; ARS §49-963.J.6) Requirement: The time frame of the original Plan must span at least TWO YEARS at a minimum. Provide a statement of the Plan’s scope and objectives.
Plan Time Frame: The current time frame of this Plan or amendment will be:
FROM: 6/29/2011 TO THE LAST GOAL COMPLETION DATE: 6/29/2013 (month/day/year) (month/day/year)
PLAN SCOPE The Plan scope should contain, at a minimum, a list of all process areas to be analyzed in the Section 6 process review, and include all toxic substances and hazardous wastes for which the facility must file this Plan. List your specific issues in general terms. For example, if chemicals in your water or air are a concern because they are costly and potentially impact employees and the community, include a review of the chemicals used by your company, chemical handing procedures, or specific manufacturing process areas. Or, if solid waste in landfills, energy and water use is a concern to your company; you could include the review of these areas in the scope. Staff will look at the following process areas for this Plan: 1. Spray Booth Operations/Gel coating 2. Material Receiving Area 3. Spill and leak prevention 4. ENVIRONMENTAL OBJECTIVES The general scope objectives were developed and include the following (Check all that apply):
ENVIRONMENTAL OBJECTIVES The general objectives for this scope was developed and include the following: (Check all that apply)
Improved operating practices to improve housekeeping, or spill and leak prevention.
Improved management practices, such as purchase and inventory control.
Process or equipment modifications to minimize the use of toxic substances.
Process or equipment modifications to minimize the generation of hazardous waste.
Process or equipment modifications to minimize the generation of hazardous air pollutants (HAPs) or volatile organic compounds (VOCs) or particulate emission reductions.
Raw material modifications or substitutions to minimize the “use” of toxic substances.
Resource conservation (water, energy, etc).
Reuse or recycling of materials or wastes.
Reduction in use or emissions of greenhouse gasses or ozone producing chemicals Other: Protecting employee safety and health
Example Plan
40
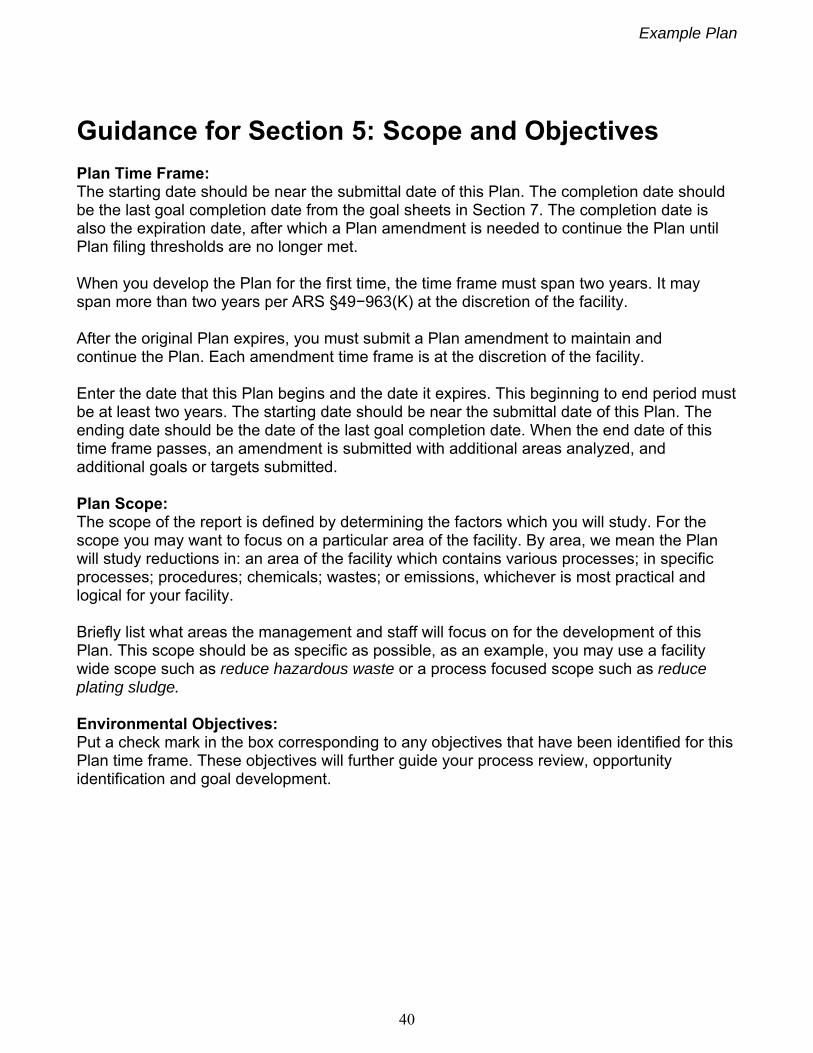
Guidance for Section 5: Scope and Objectives
Plan Time Frame: The starting date should be near the submittal date of this Plan. The completion date should be the last goal completion date from the goal sheets in Section 7. The completion date is also the expiration date, after which a Plan amendment is needed to continue the Plan until Plan filing thresholds are no longer met. When you develop the Plan for the first time, the time frame must span two years. It may span more than two years per ARS §49−963(K) at the discretion of the facility. After the original Plan expires, you must submit a Plan amendment to maintain and continue the Plan. Each amendment time frame is at the discretion of the facility. Enter the date that this Plan begins and the date it expires. This beginning to end period must be at least two years. The starting date should be near the submittal date of this Plan. The ending date should be the date of the last goal completion date. When the end date of this time frame passes, an amendment is submitted with additional areas analyzed, and additional goals or targets submitted.
Plan Scope: The scope of the report is defined by determining the factors which you will study. For the scope you may want to focus on a particular area of the facility. By area, we mean the Plan will study reductions in: an area of the facility which contains various processes; in specific processes; procedures; chemicals; wastes; or emissions, whichever is most practical and logical for your facility. Briefly list what areas the management and staff will focus on for the development of this Plan. This scope should be as specific as possible, as an example, you may use a facility wide scope such as reduce hazardous waste or a process focused scope such as reduce plating sludge.
Environmental Objectives: Put a check mark in the box corresponding to any objectives that have been identified for this Plan time frame. These objectives will further guide your process review, opportunity identification and goal development.
Example Plan
41
Section 6. Process Review and Opportunity Development (ARS §49−963.J.7) Requirement: Provide an analysis identifying pollution prevention opportunities to reduce or eliminate toxic substance releases and hazardous waste generation. 1. Process Area (# 1): Spray Booth Operations/Gel Coating Process 2. Process Information
Describe the process steps:
Discuss the toxic substances (inputs) used in the process and why they are used: Completed cultured marble pieces (sinks, tubs and shower stalls) are moved on rolling tables to a filtered open front spray booth.
Just before being sprayed gel coat is mixed inside the spray gun with 2% methyl ethyl ketone peroxide (MEKP) and gel coat resin containing about 49% (weight percent) styrene monomer resin. This MEKP catalyst assists in curing the resin coating.
Styrene gel coat resin and MEKP is applied in the spray booth with a high volume low pressure (HVLP) spray gun. HVLP guns require a high volume of air (10-20 cfm) and are limited to 10 psi, while conventional air spray is frequently operated at pressures of 60 psi. The HVLP spray system creates a soft low velocity spray which accounts for a higher transfer efficiency than conventional systems. A 20 to 30 mil layer of gel coat is applied.
The sprayed gel coat forms a smooth, shiny, hard surface on the pieces.
After the gel coat is sprayed, the piece is placed into one of the two natural gas heated curing tunnels to dry. The tunnels are heated to 150 degrees F which reduces curing time and helps increase production. The curing tunnels have a series of thick plastic strips on one side so employees can reach in and move the sprayed pieces in and out of the tunnel. Exhaust from the tunnels is vented to the outside.
Discuss the wastes and emissions (output) generated by the process. (Include wastes and emissions due to spills, cleaning, maintenance, unused or expired raw materials, etc, and include waste codes.)
Describe what happens to each waste and emission. (Is it disposed, segregated recycled, treated, incinerated, released to air, etc?):
Discuss whether raw material purchases produce packaging material that must be
handled. (i.e. pallets, drums, bags, etc.) If so, describe what happens to this material. Emissions: Emissions are generated from spraying, curing and cleanup.
Example Plan
42
Gel coat spraying and curing creates styrene emissions. Spraying emissions are due to styrene atomization. Curing emissions are from the large surface area of the pieces and volatile nature of styrene, emissions from over-spray on the floor. Some large catalyzed gel coat resin particles containing styrene miss landing on the piece end up on the shop floor or are captured in the spray booth filter, which while curing creates emissions. The MEKP catalyst in the spray becomes incorporated into the product so the MEKP emissions are small. The spray booth exhaust fan pulls in air, styrene and small MEKP emissions from the gel coat mixture. These emissions are removed from the facility and exhausted directly to the outside by air handling equipment. Facility wide styrene emissions total 2,500 pounds per year. Spray gun equipment is cleaned at the end of each day by spraying a few ounces of acetone through the gun. Acetone is used because it dissolves the styrene resin, which will clog the guns, if it is allowed to cure in the gun. The acetone sprayed through the gun all evaporates as air emissions. Waste: Waste includes used spray booth and personal respirator filters, used rags, chemical bottles, drums and totes. Rags are used for general shop cleanup, which is necessary due to gel coat over spray. Used spray booth and respirator filters as well as used rags are placed in the trash as solid waste, which is hauled to the local landfill. Empty 55-gallon drums that were emptied of gel coat and acetone are returned to the supplier for reuse. Gel coat over spray falls on the floor and polymerizes. The floor has a felt covering. This polymerized material and the floor felt covering, which is periodically removed, is sent to the landfill as solid waste. Any leftover gel coat resin not used is polymerized on-site then sent to the landfill as solid waste. Acetone drums are returned to the vendor for reuse. Gel coat resin totes are returned to the vendor for reuse. MEKP plastic bottles are reused on-site or cleaned and sent off-site as solid waste. There is no other packaging material. Therefore, raw material purchases do not produce much packaging waste.
Discuss the root cause of each waste generation, emission or toxic substance use: Root Cause From our process mapping and cause and effect diagrams we know that the styrene emissions result from curing of the gel coat (evaporation) and from our choice of applying the gel coat by atomization (spraying). Our root cause analysis and further research determined that the air emission amount is
Example Plan
43
affected by: 1) the weight percent of styrene in the gel coat, (2) the application method, 3) the spray gun type, 4) the spray gun applicator’s spraying skills (with affects the amount sprayed and the amount of over spray), and 5) the spray pump pressure, spay nozzle choice and equipment setup methods. Currently there is no other non-styrene substitute that is less toxic or can perform the function for the gel coat resin. However, there are some gel coat resins containing different styrene amounts, and different spray gun types. The acetone emissions result from choosing acetone as a cleaning solvent and spraying acetone through the spray gun to clean it.
Example Plan
44
Guidance for Section 6: Process Review and Opportunity Development Process Review Your facility may consist of a number of operations such as material preparation, casting, gel coating, and finishing. We call these distinct operations “process areas”.
Process Area Enter a number and a name for the process area. This is for identification purposes. The numbers should be carried throughout Sections 6 and 7. Process Information Only describe each current process area, as it was at the beginning of this Plan time frame. Give as much detail as possible so it is understandable.
In every process there is a functional sequence of work steps. You may use process mapping to visualize these steps and share this information with other team members and management. Besides process mapping, you can use cause and effect diagrams or other company methods to develop other information for the analysis and to ensure all process steps are identified. You should also walk through the entire process and respective plant area at your facility and talk with process operators. You do not need to submit these process maps or cause and effect diagrams, but you may do so. After information is gathered, begin writing the process information into the Plan and while doing so, check off the process questions to ensure that all steps are included. This example Plan will review the cultured marble gel coating process, which is step 3 shown in the overall cultured marble process in (Part 2, Figure 2). The gel coating process mapping example is then further developed as shown in (Part 2, Figure 2) gel coat process steps 3.1-3.4, and the cause and effect example diagram is shown in Part 2, Figure 3. Figures 2 and 3 allow us to organize our information and share the information with others.
Process mapping is a powerful tool for tracking all material use and waste production in a process. Part 4 of the guidance manual provides additional information on developing process maps and cause and effect diagrams, which help determine the root cause of a problem. Process Review Questions To assure that you have completed the P2 analysis, check the corresponding process information boxes on the Plan form as you answer that question in your review. The example only covers one process area, but your Plan will most likely have several process areas.
Example Plan
45
Discuss the process steps.
Describe the functional sequence of work steps for the process. Only describe the current process. Give as much detail as possible about why steps are performed, when they are performed, and how they are performed. The purpose of this is to allow you to get a complete understanding of what happens in your facility and why and how it happens. You should walk through the process area and talk to process operators to ensure that all steps are included.
Discuss the toxic substances (inputs) used in the process and why they are used. Include the name of each toxic chemical used in the process. Include the auxiliary processes such as cleaning and maintenance of equipment. Be sure to look at all chemicals involved with the process, i.e., solvents and wetting agents. Include those used for maintenance and cleaning activities.
Discuss the wastes and emissions (output) generated by the process. Include waste and emissions due to cleaning, maintenance, unused or expired raw materials, waste codes, etc.) Discuss the wastes and emissions that result from this process. You may wish to include solid waste, electricity and water use. Give the specific chemical name such as acetone instead of a generic chemical class name like solvent or F006 Waste.
Be sure to consider the following sources of wastes, emissions: ● Cleaning and maintenance— These are typically such things as solvents and their emissions, contaminated lubricating oil, etc.
● Raw material waste— Few processes are 100% efficient. ● Expired and unopened materials— These can make up a large part of the waste. Look back over any notes you have from the facility walk through to be sure that all substances have been addressed Most of the wastes and emissions information can be compiled from reports you probably already have, such as your facility’s: TRI Forms, Facility Annual Report (FAR), Air and Water Permits, Hazardous Waste Manifests, spill reports and shipping documents. Some other information, such as losses due to fugitive emissions or leaks, may take more effort to find. A material balance, process step method or some other calculations may be required. To determine what causes the wastes and emissions, you may want to use the cause and effect diagram tool which is described in Part
Discuss what happens to each waste and emission. (Is it disposed, segregated, recycled, treated, incinerated, released to air, etc.?) How is each waste handled while at your facility? Is it stored in drums and tanks or sent to the facility wastewater treatment area? Is the waste segregated?
Example Plan
46
Segregation can significantly reduce a facility’s hazardous waste. Some possible ways to segregate wastes are hazardous versus (vs.) non-hazardous waste, recyclable vs. non-recyclable material, chlorinated vs. non-chlorinated solvents, oil vs. solvents, etc.
Discuss each wastes final management method, such as disposed, recycled, reused, treated on-site, etc. for each waste and emission. Could it be handled more efficiently with less environmental impact?
Discuss whether raw material purchases produce packaging material that must be handled (i.e. pallets, drums, bags, etc.? If so describe what happens to this material. Packaging waste, while usually non-hazardous, hazardous can be a significant portion of a facility’s waste stream. Waste can be reduced or eliminated by getting your suppliers to use less packaging, ship in bulk or even take the packaging back for reuse. If reduction does not work, look into recycling. Many packaging materials are recyclable.
Discuss the root cause of each waste generation, emission or toxic substance use. Root cause is the basic reason (s) that a resource is being used or a waste or emission is occurring. If this cause (s) can be eliminated, the resource use or loss would be prevented. Techniques such as a an input—output diagram (Part 2, Figure 2) and or a cause and effect diagram tool (Part 2, Figure 3) and or the Five WHYs techniques are effective tools for conducting root cause analysis. Developing these P2 tools is discussed further in Part 4. To determine the root causes of the wastes and emissions, you may want to consider also: Process equipment use: Old equipment may cost more then it is worth due to frequent breakdowns, poor product quality, and risk of worker exposure. Sometimes replacing or reconfiguring equipment can have a significant benefit. Process equipment cleaning and maintenance: Are wastes or emissions generated during cleaning and maintenance of equipment used in this process? Cleaning and maintaining process equipment can produce significant wastes and emissions. Do not forget to include these auxiliary processes in the review. Chemical use procedures: Do you have procedures in place to review new substances for hazards and regulatory obligations before purchase? By reviewing new chemicals before purchase you can prevent the costs associated with handling hazardous materials and wastes while at the same time reducing liability, decreasing worker exposure and protecting the environment.
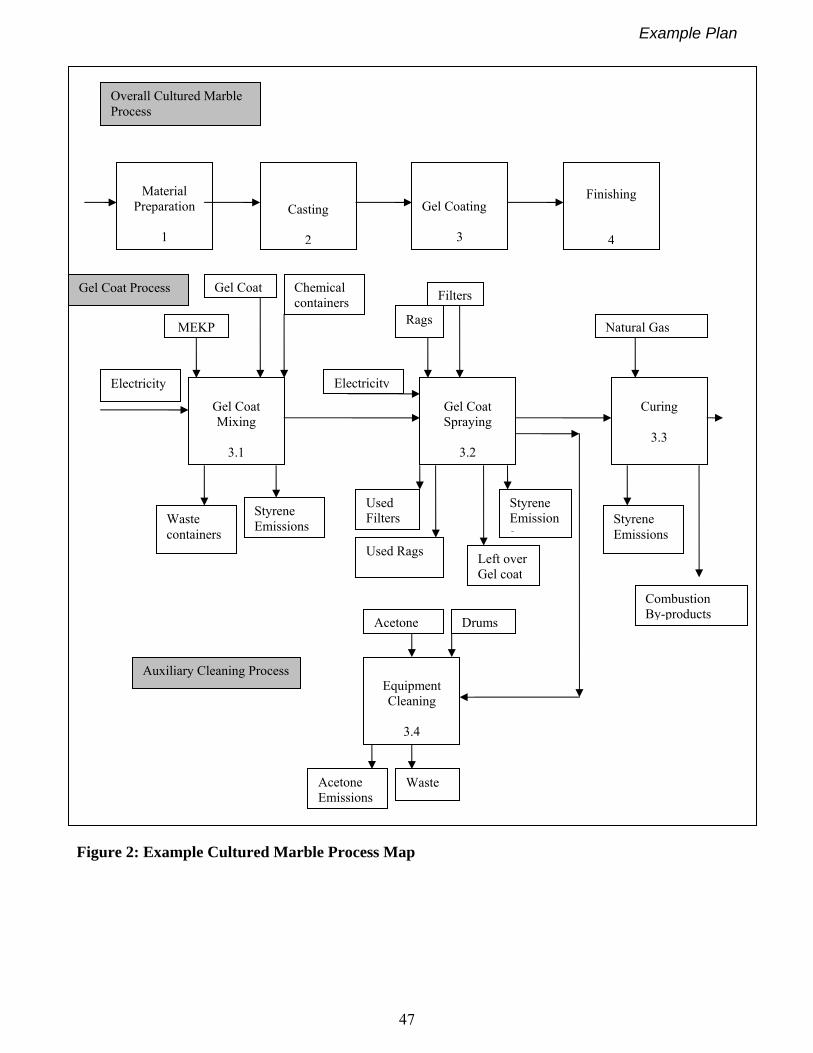
Example Plan
47
Figure 2: Example Cultured Marble Process Map
Material
Preparation
1
Casting
2
Gel Coating
3
Finishing
4
Overall Cultured Marble Process
Gel Coat Mixing
3.1
Gel Coat Spraying
3.2
Curing
3.3
Equipment Cleaning
3.4
Auxiliary Cleaning Process
MEKP
Gel Coat
Styrene Emissions
Electricity
Rags
Filters
Used Filters
Used Rags
Electricity
Styrene Emissions
Gel Coat Process
Natural Gas
Styrene Emissions
Combustion By-products
Acetone
Acetone Emissions
Waste
Drums
Waste containers
Chemical containers
Left over Gel coat
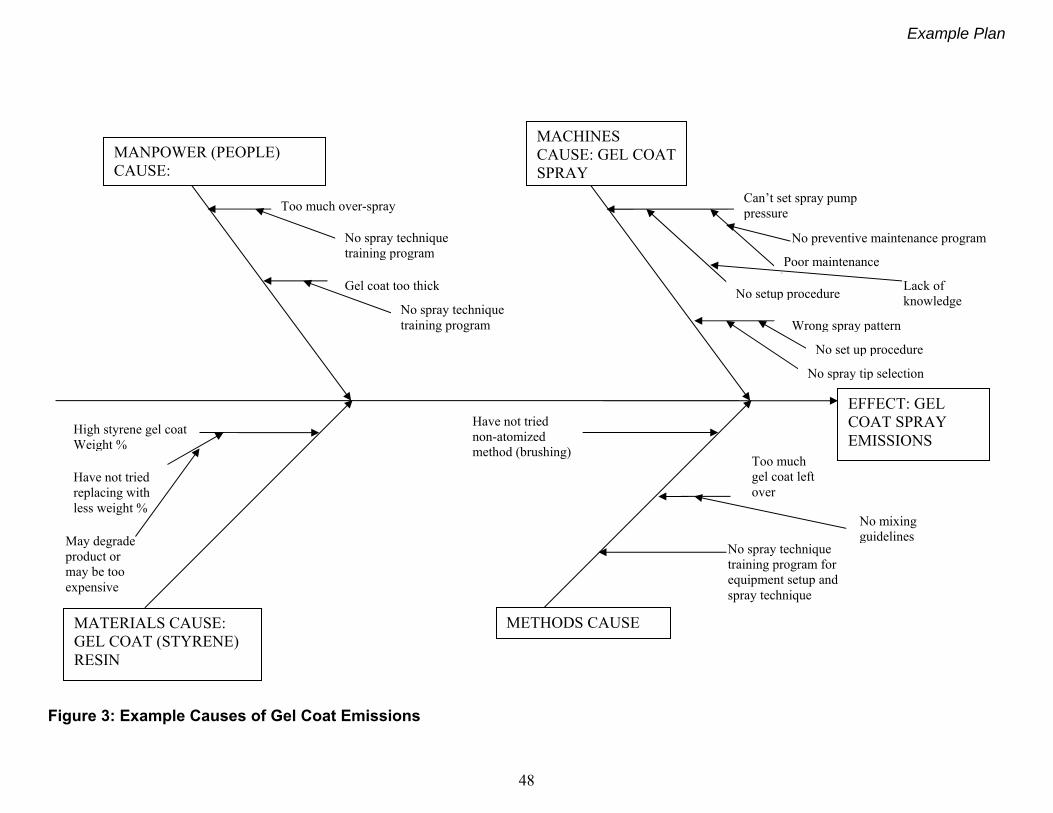
Example Plan
48
Figure 3: Example Causes of Gel Coat Emissions
EFFECT: GEL COAT SPRAY EMISSIONS
MATERIALS CAUSE: GEL COAT (STYRENE) RESIN
METHODS CAUSE
MANPOWER (PEOPLE) CAUSE:
MACHINES CAUSE: GEL COAT SPRAY
Can’t set spray pump pressure
Poor maintenance
No setup procedure
Wrong spray pattern
No set up procedure
No spray tip selection
No preventive maintenance program
Too much over-spray
No spray technique training program
High styrene gel coat Weight %
Have not tried replacing with less weight %
Have not tried non-atomized method (brushing)
May degrade product or may be too expensive
Gel coat too thick
No spray technique training program
Lack of knowledge
Too much gel coat left over
No mixing guidelines
No spray technique training program for equipment setup and spray technique
Example Plan
49
Developing Facility Pollution Prevention Opportunities After review of your process areas, researching root causes and reviewing process inputs and outputs, you are ready to begin discussing possible reduction opportunities with the P2 team.
A pollution prevention opportunity is a way that you have thought to prevent pollution. Your review should have given you insight into how processes or employees are actually using materials and generating wastes and releases. Now you must be creative and look for ways to reduce chemical use, waste generation and releases in the areas you investigated. What you list here need only be potential opportunities, they do not all need to be implemented and in fact it may be best to list any idea that is considered. After listing these potential opportunities you must determine if they will work for your facility. These are some questions to ask: ● Will it work technically? You may need to try it on a small scale first. ● Will it save your company money in a reasonable amount of time? ● Do you have the budget to get this done? ● Will it really help reduce toxicity, reduce potential employee health problems, reduce airborne releases, etc.? Some successful ways to develop pollution prevention opportunities are: ● Consult with workers and get their ideas. ● Use the waste management hierarchy and try actions that will move you up the pyramid (Refer to Part 4, Figure 4 in this manual). ● Consult with chemical suppliers to see if they have substitutes. ● Talk to other businesses to find out if they have already found a better way. ● Use the internet to look for ideas or communicate with vendors. ● Consult vendors who may have developed new processes. ● Review the table of pollution prevention techniques given in Part 4. ● Review pollution prevention Plans submitted by similar businesses. ● Perform research on the Internet, at local libraries, universities or government clearinghouses. ● Ask the federal, state or local government for pollution prevention assistance.
You will want to stay organized as you gather this information. One example of organizing your process area review results can be found in the example in Part 2, Table 1. Another is shown in Part 4, Table 6. Refer also to Part 4 of this manual regarding P2 tools to help develop opportunities and share P2 analysis information with the P2 team.
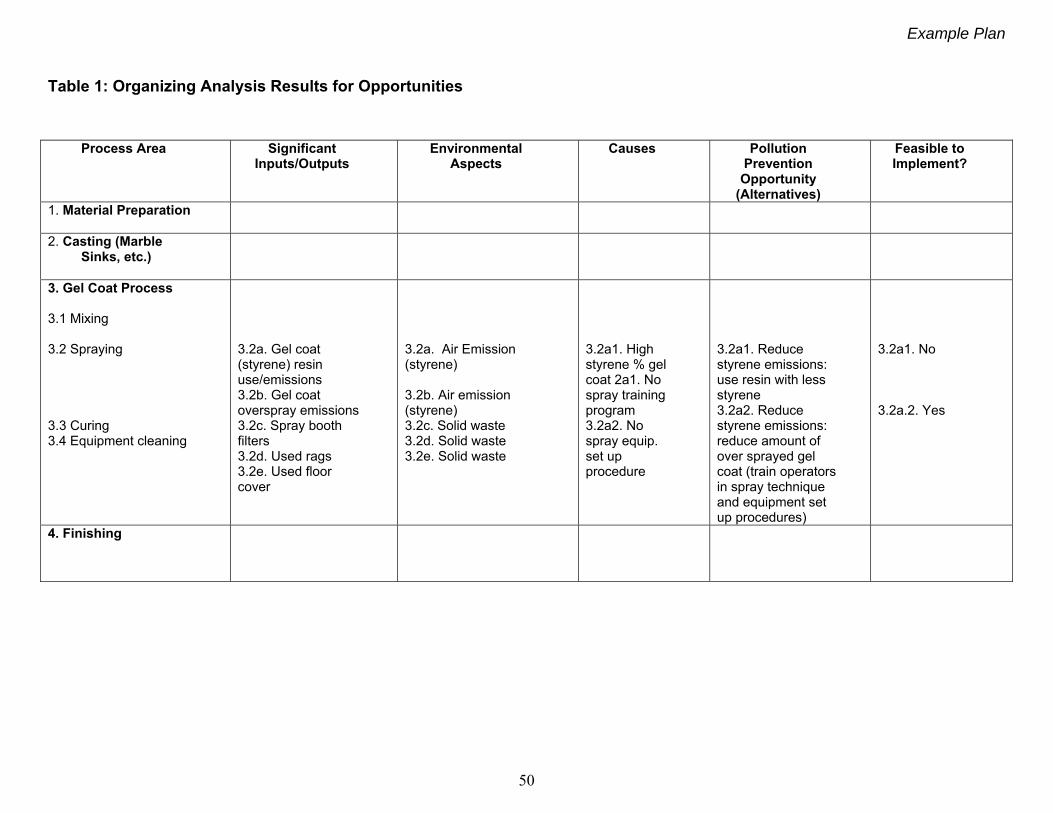
Example Plan
50
Table 1: Organizing Analysis Results for Opportunities
Process Area Significant Inputs/Outputs
Environmental Aspects
Causes Pollution Prevention Opportunity
(Alternatives)
Feasible to Implement?
1. Material Preparation
2. Casting (Marble Sinks, etc.)
3. Gel Coat Process 3.1 Mixing 3.2 Spraying 3.3 Curing 3.4 Equipment cleaning
3.2a. Gel coat (styrene) resin use/emissions 3.2b. Gel coat overspray emissions 3.2c. Spray booth filters 3.2d. Used rags 3.2e. Used floor cover
3.2a. Air Emission (styrene) 3.2b. Air emission (styrene) 3.2c. Solid waste 3.2d. Solid waste 3.2e. Solid waste
3.2a1. High styrene % gel coat 2a1. No spray training program 3.2a2. No spray equip. set up procedure
3.2a1. Reduce styrene emissions: use resin with less styrene 3.2a2. Reduce styrene emissions: reduce amount of over sprayed gel coat (train operators in spray technique and equipment set up procedures)
3.2a1. No 3.2a.2. Yes
4. Finishing
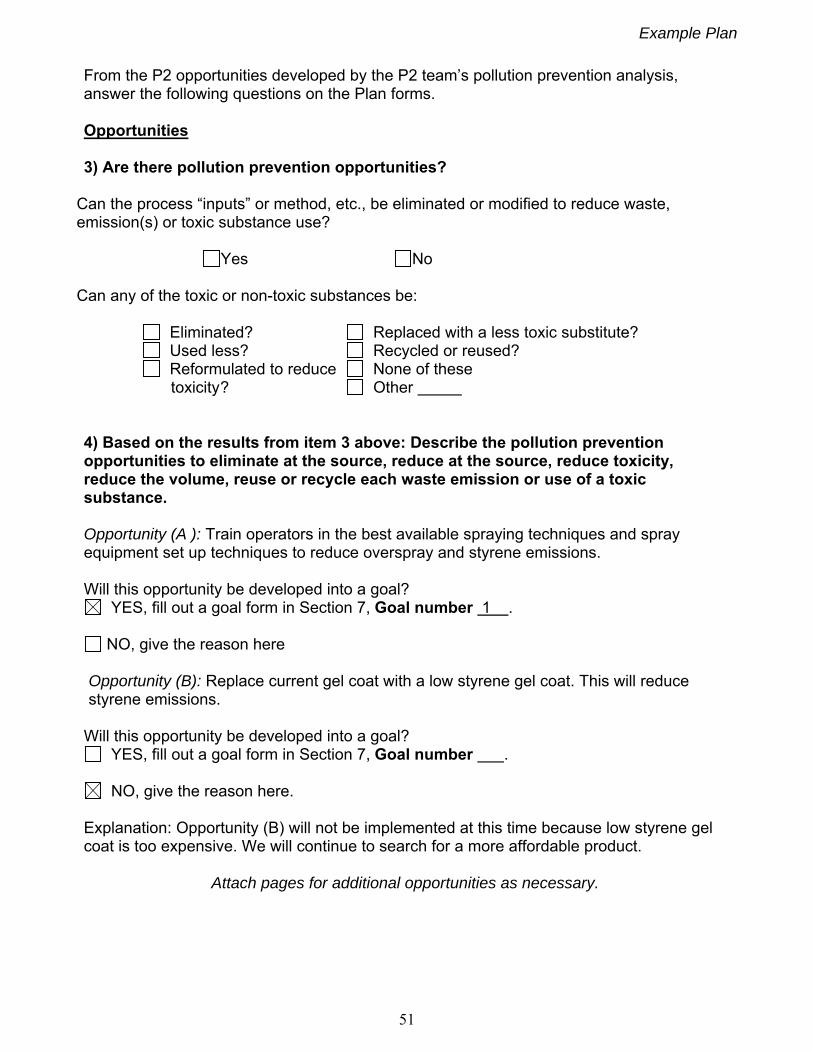
Example Plan
51
From the P2 opportunities developed by the P2 team’s pollution prevention analysis, answer the following questions on the Plan forms. Opportunities 3) Are there pollution prevention opportunities?
Can the process “inputs” or method, etc., be eliminated or modified to reduce waste, emission(s) or toxic substance use?
Yes No
Can any of the toxic or non-toxic substances be:
Eliminated? Replaced with a less toxic substitute? Used less? Recycled or reused?
Reformulated to reduce None of these toxicity ? Other
4) Based on the results from item 3 above: Describe the pollution prevention opportunities to eliminate at the source, reduce at the source, reduce toxicity, reduce the volume, reuse or recycle each waste emission or use of a toxic substance. Opportunity (A ): Train operators in the best available spraying techniques and spray equipment set up techniques to reduce overspray and styrene emissions. Will this opportunity be developed into a goal?
YES, fill out a goal form in Section 7, Goal number 1 .
NO, give the reason here Opportunity (B): Replace current gel coat with a low styrene gel coat. This will reduce styrene emissions.
Will this opportunity be developed into a goal?
YES, fill out a goal form in Section 7, Goal number .
NO, give the reason here. Explanation: Opportunity (B) will not be implemented at this time because low styrene gel coat is too expensive. We will continue to search for a more affordable product.
Attach pages for additional opportunities as necessary.
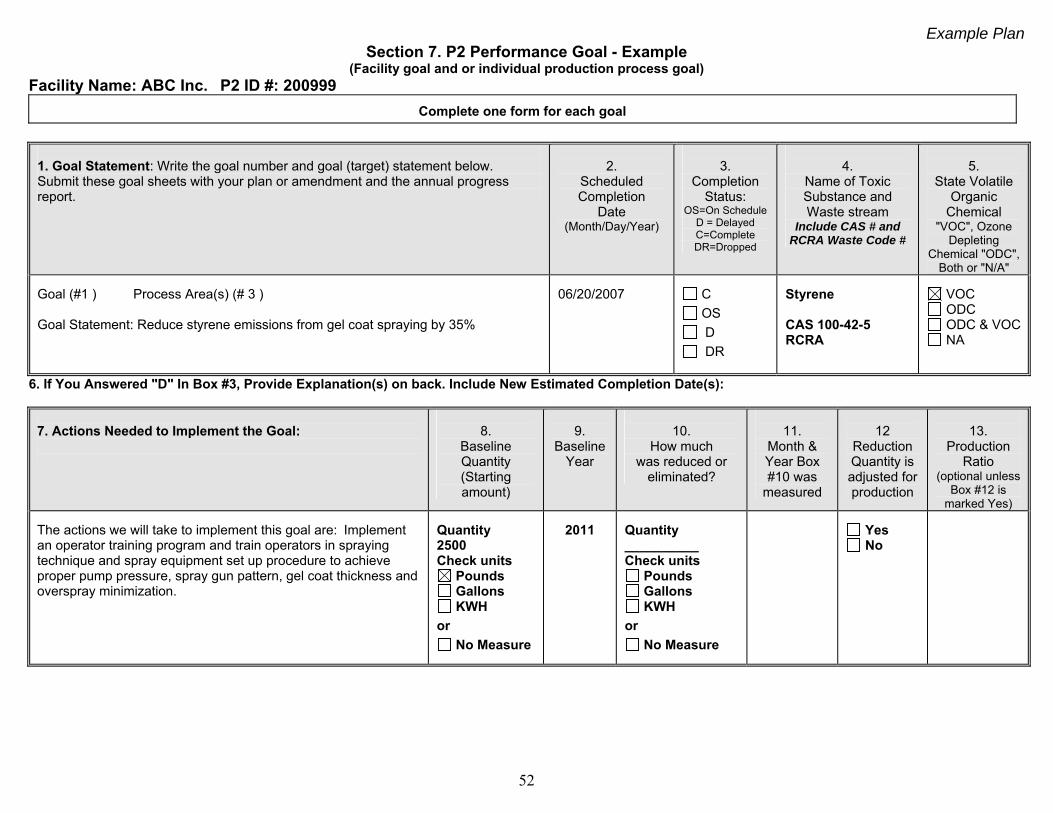
Example Plan
52
Section 7. P2 Performance Goal - Example (Facility goal and or individual production process goal)
Facility Name: ABC Inc. P2 ID #: 200999
Complete one form for each goal
1. Goal Statement: Write the goal number and goal (target) statement below. Submit these goal sheets with your plan or amendment and the annual progress report.
2.
Scheduled Completion
Date (Month/Day/Year)
3.
Completion Status:
OS=On Schedule D = Delayed C=Complete DR=Dropped
4.
Name of Toxic Substance and Waste stream
Include CAS # and RCRA Waste Code #
5.
State Volatile Organic
Chemical "VOC", Ozone
Depleting Chemical "ODC",
Both or "N/A" Goal (#1 ) Process Area(s) (# 3 ) Goal Statement: Reduce styrene emissions from gel coat spraying by 35%
06/20/2007
C
OS
D
DR
Styrene CAS 100-42-5 RCRA
VOC ODC ODC & VOC NA
6. If You Answered "D" In Box #3, Provide Explanation(s) on back. Include New Estimated Completion Date(s):
7. Actions Needed to Implement the Goal:
8.
Baseline Quantity (Starting amount)
9.
Baseline Year
10.
How much was reduced or
eliminated?
11.
Month & Year Box #10 was
measured
12
Reduction Quantity is adjusted for production
13.
Production Ratio
(optional unless Box #12 is
marked Yes) The actions we will take to implement this goal are: Implement an operator training program and train operators in spraying technique and spray equipment set up procedure to achieve proper pump pressure, spray gun pattern, gel coat thickness and overspray minimization.
Quantity 2500 Check units
Pounds Gallons KWH
or
No Measure
2011
Quantity __________ Check units
Pounds Gallons KWH
or
No Measure
Yes No
Example Plan
53
Guidance for Section 7: Pollution Prevention Plan Goal Forms Copy and complete one Section 7 pollution prevention performance goal form for each Section 6 opportunity that you will implement. Complete the information on each goal form as follows: 1. Goal Statement Enter the goal number. Each goal should have a unique number. Enter the number that you have assigned to the process area(s) that relate to this goal. Enter a statement of the expected result. The statement should address what can be accomplished by implementing one of the opportunities from Section 6. Goal statements must be in the form of an Action Verb) + Target chemical or waste stream used for/in Process by X%. Use action verbs such as “Reduce” or “Eliminate”. For example: Reduce solvent used for degreasing by 80%. If a goal cannot be measured or will take a long period of time to complete then include an action plan in the form (Box 7) that outlines measurable milestones. 2. Scheduled Completion Date List a realistic date (Month/Day/Year) for this goal’s completion. All goals must have a specific date even if the project will be ongoing. For example: it could be the date that equipment is installed or the date recycling begins. 3. Completion Status Leave blank. You will report this information on July 1st in a Progress Report. The report forms will be sent to you. 4. Name of Toxic Substance(s) or Waste Stream(s) If possible list only one chemical, chemical mixture or hazardous waste. Include a CAS number or hazardous waste code. If the goal targets a group of chemicals and the baseline quantity is based on this chemical group, then put a group name, i.e. spent non-halogenated solvents. If the goal targets a chemical mixture each chemical may be listed separately if each has a separate baseline. Please be as specific as possible. 5. Volatile Organic Compound (VOC) or Ozone Depleting Chemical (ODC) If the Toxic Substance or Waste stream is a VOC or ODC, or both, please indicate this by writing VOC, ODC or VOC/ODC as appropriate. If neither category applies, write N/A. 6. If you answered D or DR for Box #3, Provide an explanation. Include new estimated completion date(s) Leave blank. You may report this information on July 1st in a Progress Report. The Report forms will be sent to you. 7. Action Needed to Complete the Goal Write out the opportunity from Section 6 and describe the actions need to implement this goal.
Example Plan
54
8. Baseline Quantity Provide a 12-month baseline quantity so that the goal can be measured. Check the appropriate units. ADEQ can accept units only in pounds, gallons, kilowatt hours (KWH), or therms. Give only one baseline per chemical or chemical group. You can obtain this information from a variety of reports such as the Facility Annual Report, Toxic Data Release Inventory, Tier Two Chemical Inventory, Purchasing records, etc. If the goal is not measurable in pounds, gallons, kilowatt hours, or therms, such as when the goal is to develop P2 training, develop an EMS, or revise an operating procedure, then check the box marked “Not Measured.” 9. Baseline Year Provide the year the baseline quantity was measured for. Use the latest year that information is available. 10. How Much was Reduced or Eliminated? Leave blank. You will report this information in a Progress Report when the goal is completed. The Report forms will be sent to you. 11. Month, Day and Year Box #10 was Measured Leave blank. You will report this information in a Progress Report when the goal is completed. The Report forms will be sent to you. 12. Reduction Amounts is Adjusted for Production? Leave blank if doing a Plan. You will report this information in a Progress Report when the goal is completed. The Report forms will be sent to you. For the annual progress at the time the goal is completed, you will determine the amount of waste, emissions, or toxic substance use that was actually prevented or reduced by this goal and place that number in this box. 13. Production Ratio (Optional Unless Box #12 is Marked “Yes”) Leave blank. You will report this information in a Progress Report when the goal is completed. The Report forms will be sent to you.
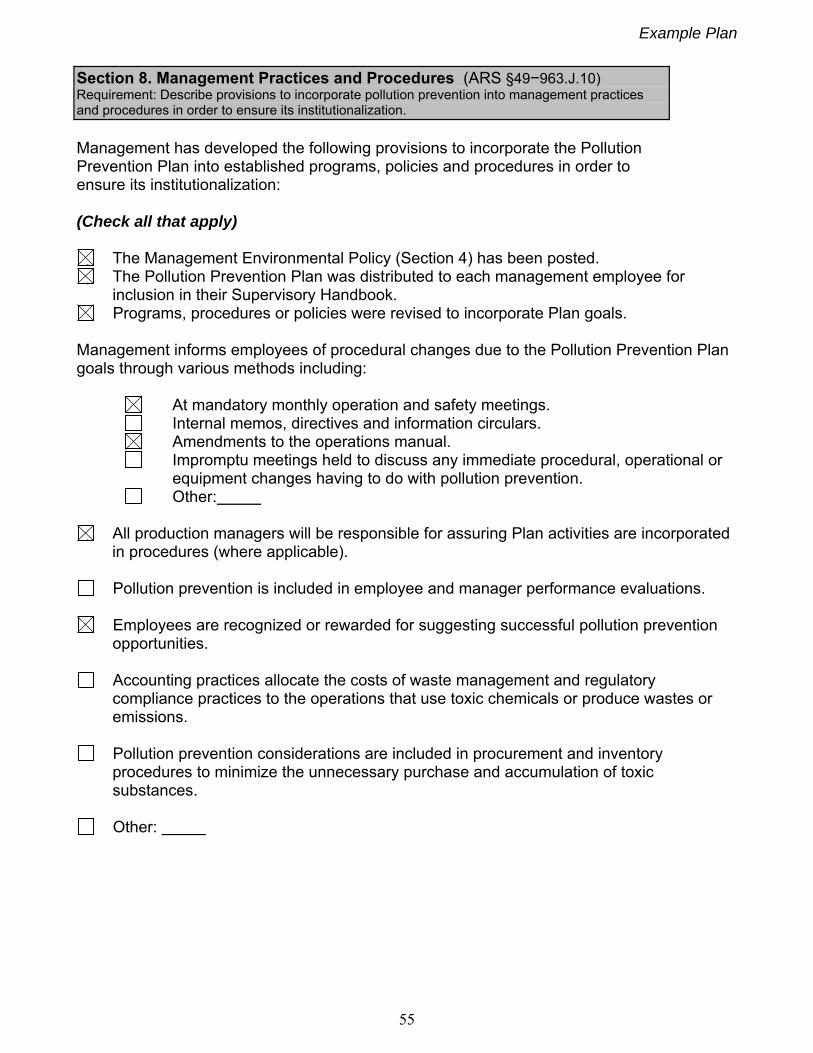
Example Plan
55
Section 8. Management Practices and Procedures (ARS §49−963.J.10) Requirement: Describe provisions to incorporate pollution prevention into management practices and procedures in order to ensure its institutionalization.
Management has developed the following provisions to incorporate the Pollution Prevention Plan into established programs, policies and procedures in order to ensure its institutionalization:
(Check all that apply)
The Management Environmental Policy (Section 4) has been posted. The Pollution Prevention Plan was distributed to each management employee for
inclusion in their Supervisory Handbook. Programs, procedures or policies were revised to incorporate Plan goals.
Management informs employees of procedural changes due to the Pollution Prevention Plan
goals through various methods including:
At mandatory monthly operation and safety meetings. Internal memos, directives and information circulars. Amendments to the operations manual. Impromptu meetings held to discuss any immediate procedural, operational or
equipment changes having to do with pollution prevention. Other: .
All production managers will be responsible for assuring Plan activities are incorporated
in procedures (where applicable).
Pollution prevention is included in employee and manager performance evaluations.
Employees are recognized or rewarded for suggesting successful pollution prevention opportunities.
Accounting practices allocate the costs of waste management and regulatory compliance practices to the operations that use toxic chemicals or produce wastes or emissions.
Pollution prevention considerations are included in procurement and inventory procedures to minimize the unnecessary purchase and accumulation of toxic substances.
Other:
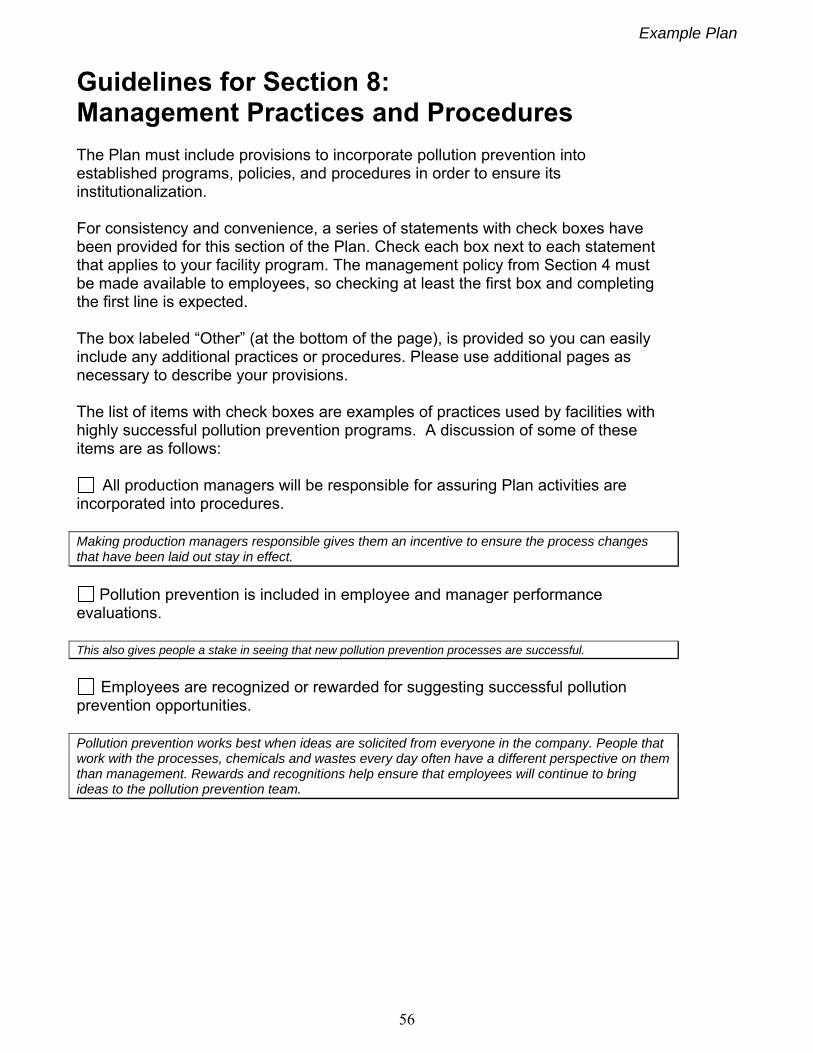
Example Plan
56
Guidelines for Section 8: Management Practices and Procedures The Plan must include provisions to incorporate pollution prevention into established programs, policies, and procedures in order to ensure its institutionalization. For consistency and convenience, a series of statements with check boxes have been provided for this section of the Plan. Check each box next to each statement that applies to your facility program. The management policy from Section 4 must be made available to employees, so checking at least the first box and completing the first line is expected. The box labeled “Other” (at the bottom of the page), is provided so you can easily include any additional practices or procedures. Please use additional pages as necessary to describe your provisions. The list of items with check boxes are examples of practices used by facilities with highly successful pollution prevention programs. A discussion of some of these items are as follows:
All production managers will be responsible for assuring Plan activities are incorporated into procedures. Making production managers responsible gives them an incentive to ensure the process changes that have been laid out stay in effect.
Pollution prevention is included in employee and manager performance
evaluations. This also gives people a stake in seeing that new pollution prevention processes are successful.
Employees are recognized or rewarded for suggesting successful pollution
prevention opportunities. Pollution prevention works best when ideas are solicited from everyone in the company. People that work with the processes, chemicals and wastes every day often have a different perspective on them than management. Rewards and recognitions help ensure that employees will continue to bring ideas to the pollution prevention team.
Example Plan
57
Accounting practices allocate the costs of waste management and regulatory
compliance to the operations that use toxic chemicals or produce wastes. Note: Some P2 accounting methods for new P2 projects can be found at this website: http://www.newmoa.org/prevention/topichub/subsection.cfm?hub=105&subsec=21&nav=21 Proper environmental accounting will allow the true cost of chemical use and waste production to be seen. This will make pollution prevention a production issue, thus shifting some of the responsibility of finding and implementing new opportunities to the production managers.
Pollution prevention considerations are included in procurement and inventory
procedures to minimize unnecessary purchase and accumulation of toxic substances.
The best way to avoid costly disposal of chemicals is not to bring them onsite in the first place. Purchasing and inventory controls can assure that unwanted and expired chemicals do not become a disposal problem.
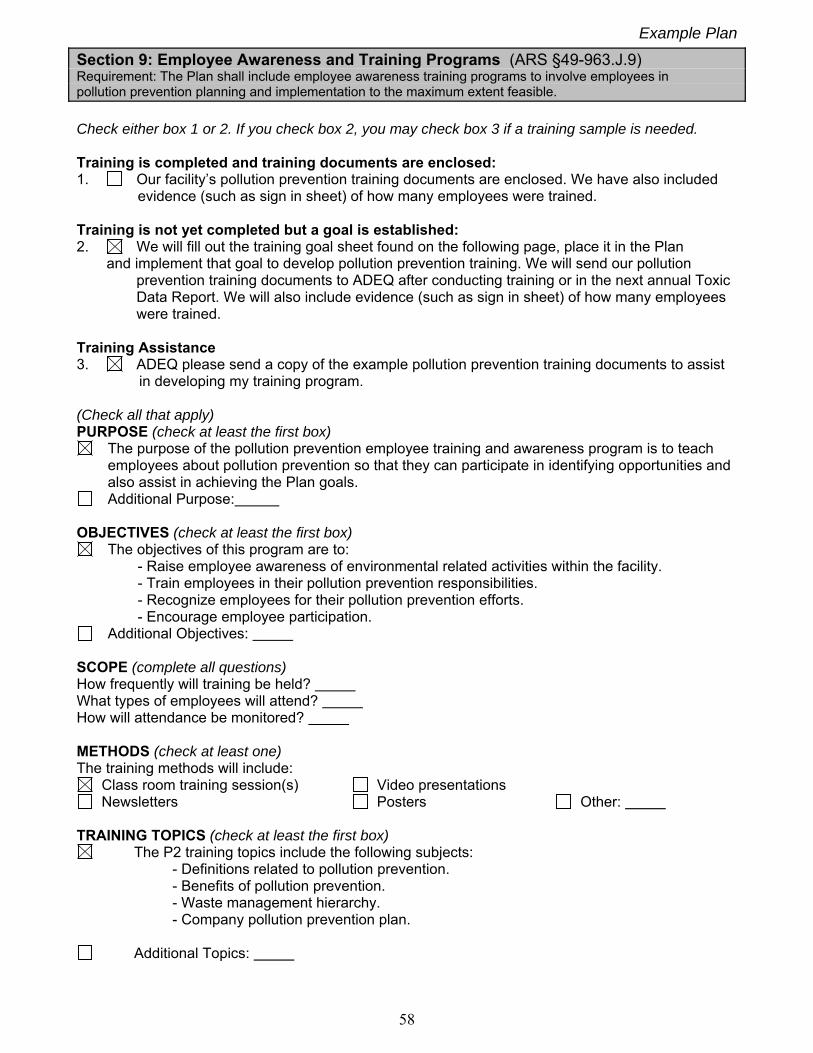
Example Plan
58
Section 9: Employee Awareness and Training Programs (ARS §49-963.J.9) Requirement: The Plan shall include employee awareness training programs to involve employees in pollution prevention planning and implementation to the maximum extent feasible.
Check either box 1 or 2. If you check box 2, you may check box 3 if a training sample is needed. Training is completed and training documents are enclosed: 1. Our facility’s pollution prevention training documents are enclosed. We have also included evidence (such as sign in sheet) of how many employees were trained. Training is not yet completed but a goal is established: 2. We will fill out the training goal sheet found on the following page, place it in the Plan and implement that goal to develop pollution prevention training. We will send our pollution
prevention training documents to ADEQ after conducting training or in the next annual Toxic Data Report. We will also include evidence (such as sign in sheet) of how many employees were trained.
Training Assistance 3. ADEQ please send a copy of the example pollution prevention training documents to assist in developing my training program. (Check all that apply) PURPOSE (check at least the first box)
The purpose of the pollution prevention employee training and awareness program is to teach employees about pollution prevention so that they can participate in identifying opportunities and also assist in achieving the Plan goals.
Additional Purpose: OBJECTIVES (check at least the first box)
The objectives of this program are to: - Raise employee awareness of environmental related activities within the facility. - Train employees in their pollution prevention responsibilities. - Recognize employees for their pollution prevention efforts. - Encourage employee participation.
Additional Objectives: SCOPE (complete all questions) How frequently will training be held? What types of employees will attend? How will attendance be monitored? METHODS (check at least one) The training methods will include:
Class room training session(s) Video presentations Newsletters Posters Other:
TRAINING TOPICS (check at least the first box)
The P2 training topics include the following subjects: - Definitions related to pollution prevention. - Benefits of pollution prevention. - Waste management hierarchy. - Company pollution prevention plan.
Additional Topics:
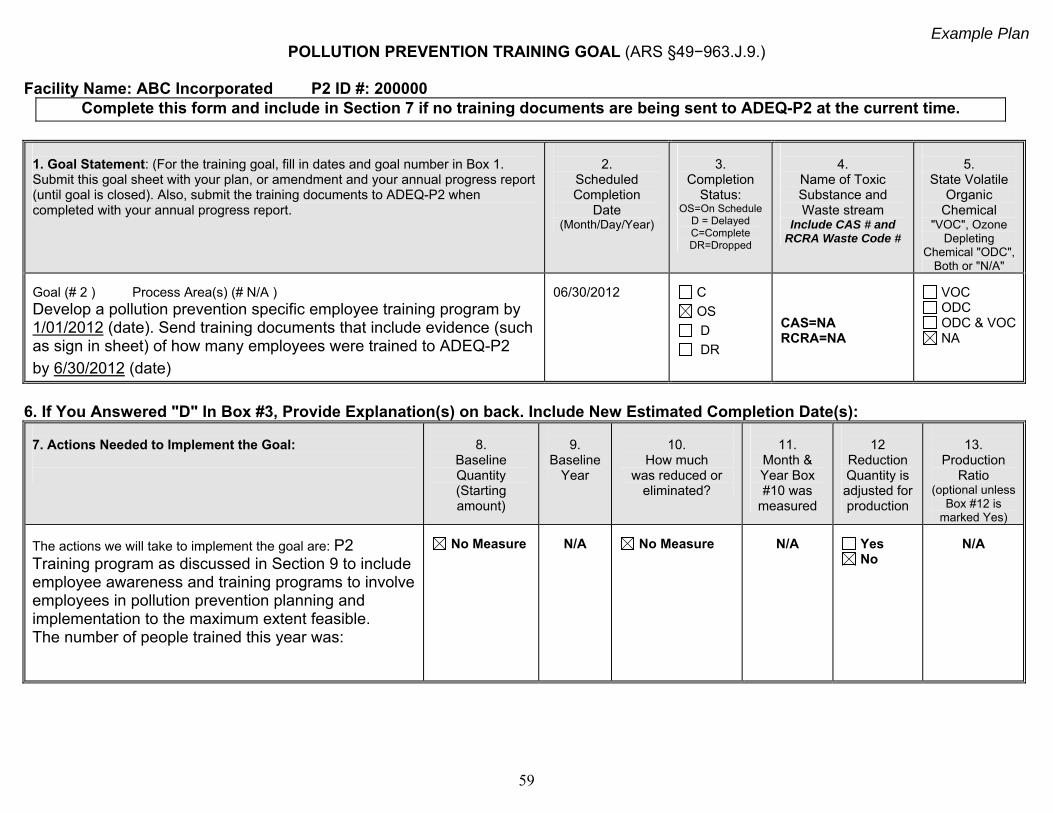
Example Plan
59
POLLUTION PREVENTION TRAINING GOAL (ARS §49−963.J.9.)
Facility Name: ABC Incorporated P2 ID #: 200000 Complete this form and include in Section 7 if no training documents are being sent to ADEQ-P2 at the current time.
1. Goal Statement: (For the training goal, fill in dates and goal number in Box 1. Submit this goal sheet with your plan, or amendment and your annual progress report (until goal is closed). Also, submit the training documents to ADEQ-P2 when completed with your annual progress report.
2.
Scheduled Completion
Date (Month/Day/Year)
3.
Completion Status:
OS=On Schedule D = Delayed C=Complete DR=Dropped
4.
Name of Toxic Substance and Waste stream
Include CAS # and RCRA Waste Code #
5.
State Volatile Organic
Chemical "VOC", Ozone
Depleting Chemical "ODC",
Both or "N/A" Goal (# 2 ) Process Area(s) (# N/A ) Develop a pollution prevention specific employee training program by 1/01/2012 (date). Send training documents that include evidence (such as sign in sheet) of how many employees were trained to ADEQ-P2 by 6/30/2012 (date)
06/30/2012
C
OS
D
DR
CAS=NA RCRA=NA
VOC ODC ODC & VOC NA
6. If You Answered "D" In Box #3, Provide Explanation(s) on back. Include New Estimated Completion Date(s):
7. Actions Needed to Implement the Goal:
8.
Baseline Quantity (Starting amount)
9.
Baseline Year
10.
How much was reduced or
eliminated?
11.
Month & Year Box #10 was
measured
12
Reduction Quantity is adjusted for production
13.
Production Ratio
(optional unless Box #12 is
marked Yes) The actions we will take to implement the goal are: P2 Training program as discussed in Section 9 to include employee awareness and training programs to involve employees in pollution prevention planning and implementation to the maximum extent feasible. The number of people trained this year was:
No Measure
N/A
No Measure
N/A
Yes No
N/A
Example Plan
60
Guidance for Section 9: Employee Awareness and Training Programs
This section of the Plan documents the requirement that the Pollution Prevention (P2) Plan include employee awareness and training programs to involve employees in pollution prevention planning and implementation to the maximum extent feasible. The P2 awareness and training program for this Plan must cover pollution prevention topics, not hazardous waste handling, Occupational Safety and Health Administration (OSHA) training, stormwater, etc. The policy statement, Section 4, can contain a statement about the commitment to employee involvement in P2. Complete the information in this Section 9 as follows to assure compliance with the statutes. Training Implementation and Training Documents: Check either box 1 or box 2. If you check box 1, submit the facility’s pollution prevention training documents along with the P2 Plan. If you check box 2, complete the training goal form provided and include the completed form in this Section 7 of your Plan submittal. Completing this training goal and submitting the resulting documents to ADEQ-P2 is a requirement if training documents are not provided at this time. Training Assistance: Check this box to have ADEQ send example training documents that can be used as a foundation to develop facility specific training. Purpose: Check at least the first box. Please write in any additional purpose for the training. Objectives: Check at least the first box. Please write in any additional objectives for this training. Scope: Write a brief response to all three questions detailing the logistics of the training. Methods: Check at least one box. Please write in any additional training methods that will be used. Topics: Check at least the first box. The training documents provided must include these topics. Please write in any additional topics that will be discussed.
Example Plan
61
Section 10. Existing Pollution Prevention Activities (ARS §49-963.J.8) Requirement: Provide an analysis of pollution prevention activities that all are already in place that are consistent with the pollution prevention Plan requirements.
Check ONE of the boxes below.
We have not documented any previous pollution prevention activities at our company. OR
We have documented pollution prevention activities at our company and have described them below or attached addition pages with information about these projects with this Plan. (Include as much specific information as possible and any available quantitative data without disclosing any confidential business information.)
Describe or list the P2 activities that are already in place including amounts reduced (if available):
1). In 2011 this facility conducted a Green Lights electricity usage review. At that time all fluorescent light ballasts were replaced with electronic ballasts and more efficient light bulbs (Model T-8) have been used since. This has saved the facility about 15% on its electric bill.
Example Plan
62
Guidance for Section 10: Existing Pollution Prevention Activities
This section provides an opportunity for your facility to highlight any pollution prevention activities that have taken place prior to submittal of the Pollution Prevention Plan. Please only include those activities completed prior to the starting date of this Plan. Check one of the boxes provided. We encourage you to provide as much detail about any past pollution prevention efforts. This is a chance to show your facility’s past commitment to pollution prevention and its results. Note: You do not need to complete this section if you are writing an amendment and you previously completed this section in the original Plan.
Compliance
63
Part 3
Staying in Compliance
by
Maintaining Your P2 Plan
Compliance
64
What is a Pollution Prevention Plan? The pollution prevention law established in Arizona empowers facilities to use knowledge of their own processes and procedures to reduce the use of toxic substances at the source, minimize the generation of hazardous waste, and prevent the release of pollutants to the environment. A Pollution Prevention Plan (Plan) is a stand alone management document that provides information on the facility operations that directly or indirectly produce waste or use toxic substances. The written Plan will analyze the current work practices, outline potential pollution prevention opportunities and provide specific performance goals including a schedule for implementing these pollution prevention activities. The Plan should also describe performance measures, which allow measurement or evaluation of the pollution prevention completed. The Plan will document that the facility has performed a rigorous pollution prevention assessment. In addition to describing current practices and planned pollution prevention activities, the Plan will include information on past pollution prevention activities that have already been completed at the facility.
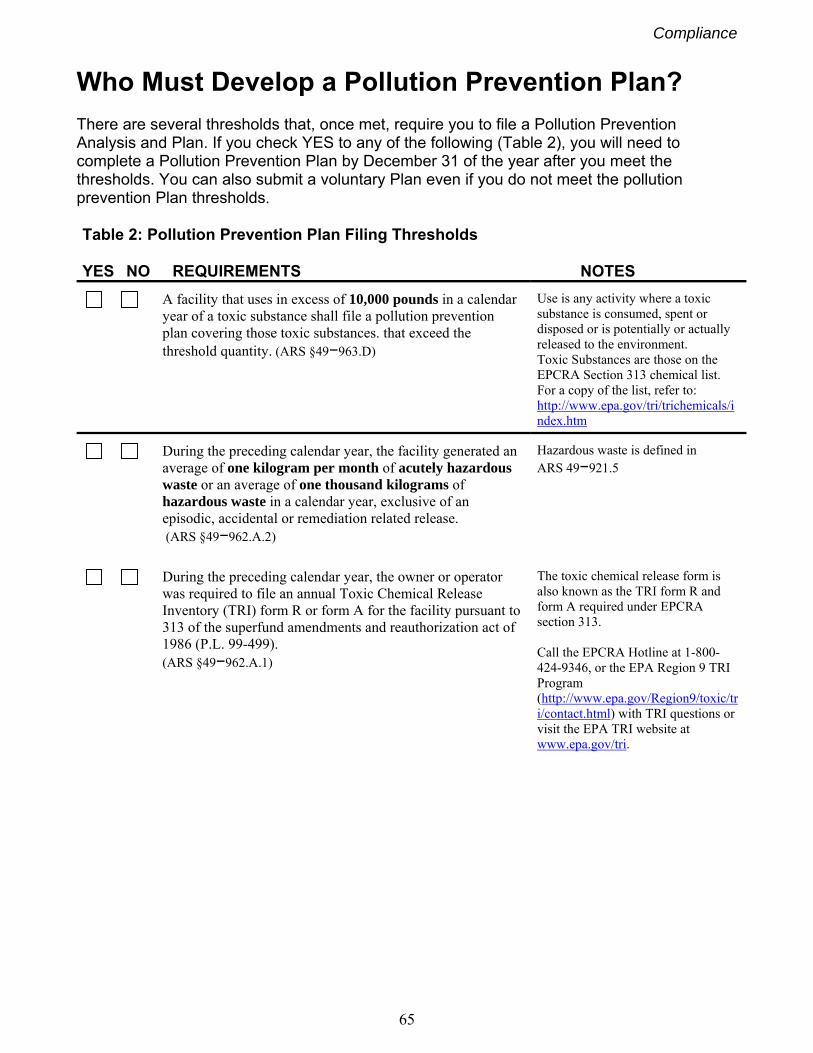
Compliance
65
Who Must Develop a Pollution Prevention Plan?
There are several thresholds that, once met, require you to file a Pollution Prevention Analysis and Plan. If you check YES to any of the following (Table 2), you will need to complete a Pollution Prevention Plan by December 31 of the year after you meet the thresholds. You can also submit a voluntary Plan even if you do not meet the pollution prevention Plan thresholds. Table 2: Pollution Prevention Plan Filing Thresholds YES NO REQUIREMENTS NOTES
A facility that uses in excess of 10,000 pounds in a calendar year of a toxic substance shall file a pollution prevention plan covering those toxic substances. that exceed the threshold quantity. (ARS §49−963.D)
Use is any activity where a toxic substance is consumed, spent or disposed or is potentially or actually released to the environment. Toxic Substances are those on the EPCRA Section 313 chemical list. For a copy of the list, refer to: http://www.epa.gov/tri/trichemicals/index.htm
During the preceding calendar year, the facility generated an average of one kilogram per month of acutely hazardous waste or an average of one thousand kilograms of hazardous waste in a calendar year, exclusive of an episodic, accidental or remediation related release. (ARS §49−962.A.2)
Hazardous waste is defined in ARS 49−921.5
During the preceding calendar year, the owner or operator was required to file an annual Toxic Chemical Release Inventory (TRI) form R or form A for the facility pursuant to 313 of the superfund amendments and reauthorization act of 1986 (P.L. 99-499). (ARS §49−962.A.1)
The toxic chemical release form is also known as the TRI form R and form A required under EPCRA section 313. Call the EPCRA Hotline at 1-800-424-9346, or the EPA Region 9 TRI Program (http://www.epa.gov/Region9/toxic/tri/contact.html) with TRI questions or visit the EPA TRI website at www.epa.gov/tri.
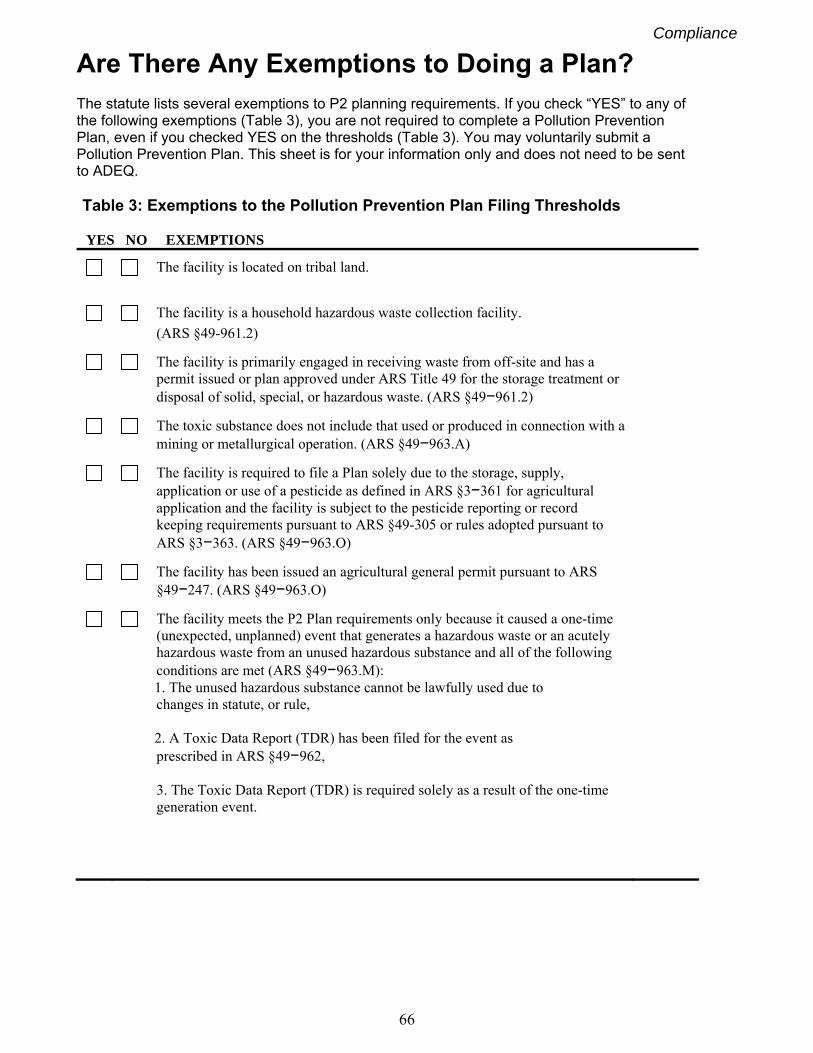
Compliance
66
Are There Any Exemptions to Doing a Plan?
The statute lists several exemptions to P2 planning requirements. If you check “YES” to any of the following exemptions (Table 3), you are not required to complete a Pollution Prevention Plan, even if you checked YES on the thresholds (Table 3). You may voluntarily submit a Pollution Prevention Plan. This sheet is for your information only and does not need to be sent to ADEQ. Table 3: Exemptions to the Pollution Prevention Plan Filing Thresholds YES NO EXEMPTIONS
The facility is located on tribal land.
The facility is a household hazardous waste collection facility.
(ARS §49-961.2)
The facility is primarily engaged in receiving waste from off-site and has a permit issued or plan approved under ARS Title 49 for the storage treatment or disposal of solid, special, or hazardous waste. (ARS §49−961.2)
The toxic substance does not include that used or produced in connection with a mining or metallurgical operation. (ARS §49−963.A)
The facility is required to file a Plan solely due to the storage, supply, application or use of a pesticide as defined in ARS §3−361 for agricultural application and the facility is subject to the pesticide reporting or record keeping requirements pursuant to ARS §49-305 or rules adopted pursuant to ARS §3−363. (ARS §49−963.O)
The facility has been issued an agricultural general permit pursuant to ARS §49−247. (ARS §49−963.O)
The facility meets the P2 Plan requirements only because it caused a one-time (unexpected, unplanned) event that generates a hazardous waste or an acutely hazardous waste from an unused hazardous substance and all of the following conditions are met (ARS §49−963.M): 1. The unused hazardous substance cannot be lawfully used due to changes in statute, or rule, 2. A Toxic Data Report (TDR) has been filed for the event as prescribed in ARS §49−962, 3. The Toxic Data Report (TDR) is required solely as a result of the one-time generation event.
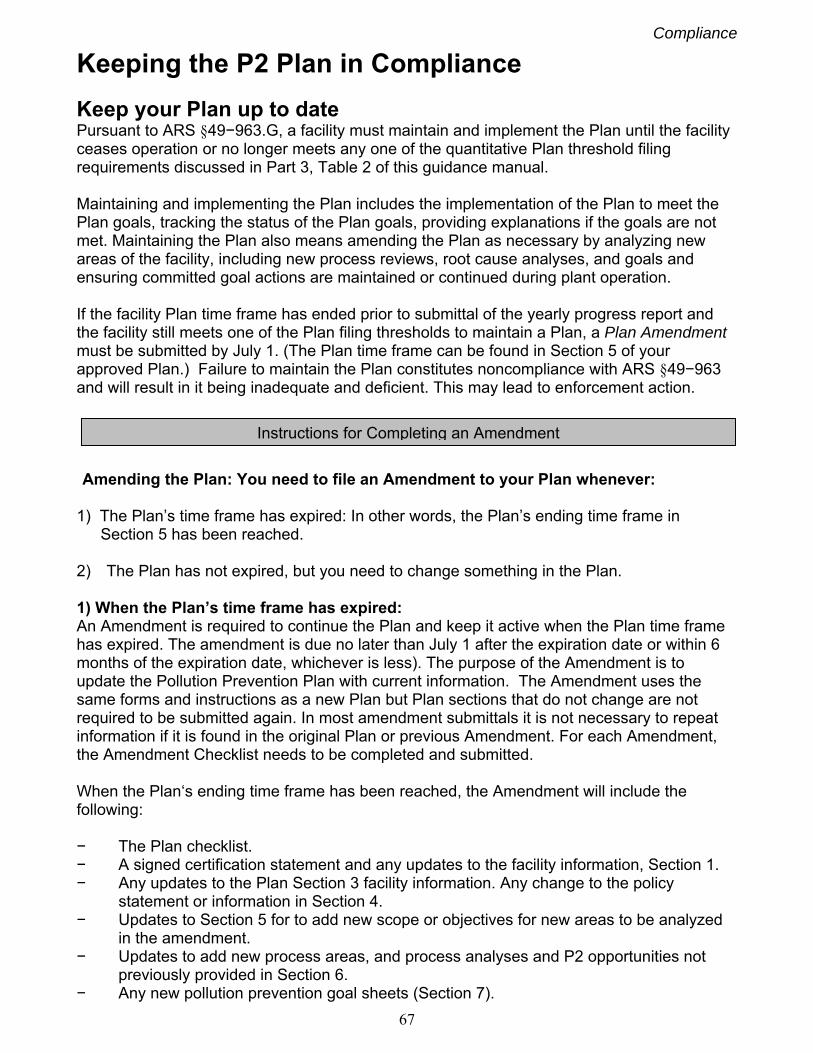
Compliance
67
Keeping the P2 Plan in Compliance
Keep your Plan up to date Pursuant to ARS §49−963.G, a facility must maintain and implement the Plan until the facility ceases operation or no longer meets any one of the quantitative Plan threshold filing requirements discussed in Part 3, Table 2 of this guidance manual. Maintaining and implementing the Plan includes the implementation of the Plan to meet the Plan goals, tracking the status of the Plan goals, providing explanations if the goals are not met. Maintaining the Plan also means amending the Plan as necessary by analyzing new areas of the facility, including new process reviews, root cause analyses, and goals and ensuring committed goal actions are maintained or continued during plant operation.
If the facility Plan time frame has ended prior to submittal of the yearly progress report and the facility still meets one of the Plan filing thresholds to maintain a Plan, a Plan Amendment must be submitted by July 1. (The Plan time frame can be found in Section 5 of your approved Plan.) Failure to maintain the Plan constitutes noncompliance with ARS §49−963 and will result in it being inadequate and deficient. This may lead to enforcement action. Amending the Plan: You need to file an Amendment to your Plan whenever:
1) The Plan’s time frame has expired: In other words, the Plan’s ending time frame in Section 5 has been reached. 2) The Plan has not expired, but you need to change something in the Plan.
1) When the Plan’s time frame has expired: An Amendment is required to continue the Plan and keep it active when the Plan time frame has expired. The amendment is due no later than July 1 after the expiration date or within 6 months of the expiration date, whichever is less). The purpose of the Amendment is to update the Pollution Prevention Plan with current information. The Amendment uses the same forms and instructions as a new Plan but Plan sections that do not change are not required to be submitted again. In most amendment submittals it is not necessary to repeat information if it is found in the original Plan or previous Amendment. For each Amendment, the Amendment Checklist needs to be completed and submitted.
When the Plan‘s ending time frame has been reached, the Amendment will include the following: − The Plan checklist. − A signed certification statement and any updates to the facility information, Section 1. − Any updates to the Plan Section 3 facility information. Any change to the policy statement or information in Section 4. − Updates to Section 5 for to add new scope or objectives for new areas to be analyzed in the amendment. − Updates to add new process areas, and process analyses and P2 opportunities not previously provided in Section 6. − Any new pollution prevention goal sheets (Section 7).
Instructions for Completing an Amendment
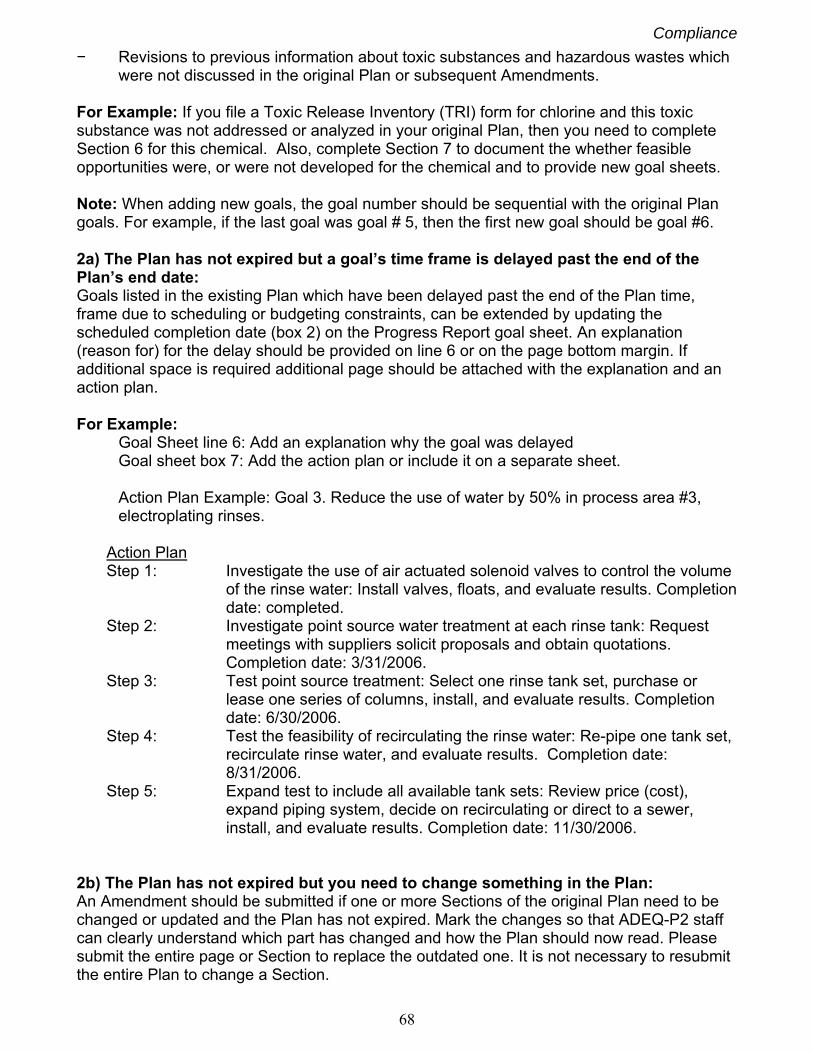
Compliance
68
− Revisions to previous information about toxic substances and hazardous wastes which were not discussed in the original Plan or subsequent Amendments. For Example: If you file a Toxic Release Inventory (TRI) form for chlorine and this toxic substance was not addressed or analyzed in your original Plan, then you need to complete Section 6 for this chemical. Also, complete Section 7 to document the whether feasible opportunities were, or were not developed for the chemical and to provide new goal sheets. Note: When adding new goals, the goal number should be sequential with the original Plan goals. For example, if the last goal was goal # 5, then the first new goal should be goal #6. 2a) The Plan has not expired but a goal’s time frame is delayed past the end of the Plan’s end date: Goals listed in the existing Plan which have been delayed past the end of the Plan time, frame due to scheduling or budgeting constraints, can be extended by updating the scheduled completion date (box 2) on the Progress Report goal sheet. An explanation (reason for) for the delay should be provided on line 6 or on the page bottom margin. If additional space is required additional page should be attached with the explanation and an action plan. For Example:
Goal Sheet line 6: Add an explanation why the goal was delayed Goal sheet box 7: Add the action plan or include it on a separate sheet. Action Plan Example: Goal 3. Reduce the use of water by 50% in process area #3, electroplating rinses.
Action Plan
Step 1: Investigate the use of air actuated solenoid valves to control the volume of the rinse water: Install valves, floats, and evaluate results. Completion date: completed.
Step 2: Investigate point source water treatment at each rinse tank: Request meetings with suppliers solicit proposals and obtain quotations. Completion date: 3/31/2006.
Step 3: Test point source treatment: Select one rinse tank set, purchase or lease one series of columns, install, and evaluate results. Completion date: 6/30/2006.
Step 4: Test the feasibility of recirculating the rinse water: Re-pipe one tank set, recirculate rinse water, and evaluate results. Completion date: 8/31/2006.
Step 5: Expand test to include all available tank sets: Review price (cost), expand piping system, decide on recirculating or direct to a sewer, install, and evaluate results. Completion date: 11/30/2006.
2b) The Plan has not expired but you need to change something in the Plan: An Amendment should be submitted if one or more Sections of the original Plan need to be changed or updated and the Plan has not expired. Mark the changes so that ADEQ-P2 staff can clearly understand which part has changed and how the Plan should now read. Please submit the entire page or Section to replace the outdated one. It is not necessary to resubmit the entire Plan to change a Section.
Compliance
69
Some companies, during the year identify, new opportunities and establish new goals for pollution prevention and want to incorporate these into the existing Plan. If this is the case, complete a new certification section (Section 1), new analysis and opportunities section (Section 6) and performance goal sheets for each goal (Section 7), amendment cover sheet, and amendment checklist according to previous amendment discussion described in this guidance manual.
How Do I Write a Pollution Prevention Amendment? − Writing an Amendment is very similar to writing a Plan. − Use this guidance manual. − Gather a multi-functional team of employees to develop the Amendment. Include employees from areas such as management, purchasing, production, maintenance, and environmental health and safety. − Set the scope and objectives to guide you through the rest of the process. − Complete a review of current waste and emission generation and the manufacturing, processing or use of toxic substances. − Develop a system to collect and track the necessary information. − Develop pollution prevention opportunities and goals. − Complete the Pollution Prevention forms and mail them to the ADEQ-P2 Program. What Should Be Addressed in a Pollution Prevention Amendment? An Amendment should address all toxic substances and wastes for which the facility meets thresholds, which were not addressed in the original Plan. Address all toxic substances that the facility uses in excess of 10,000 pounds, all toxic substances for which the facility filed a Toxic Release Inventory Form, and all hazardous wastes generated if the facility meets the hazardous waste thresholds. Because of the large number of processes at some facilities, you may not be able to complete the process review, analysis, opportunities and goals all chemicals or wastes at the same time. ADEQ recognizes that only so many projects can be taken on at once depending on the facility size, available resources, and strength of commitment. However, the Opportunities Section needs to be completed for each process area addressed. If no reduction opportunities are discovered, the Plan must state that fact. If opportunities are discovered, but not feasible at present, the Plan should state that fact. These non-implemented opportunities may become goals in future Amendments to the Plan as they become feasible.
P2 Tools
70
Part 4
P2 Tools
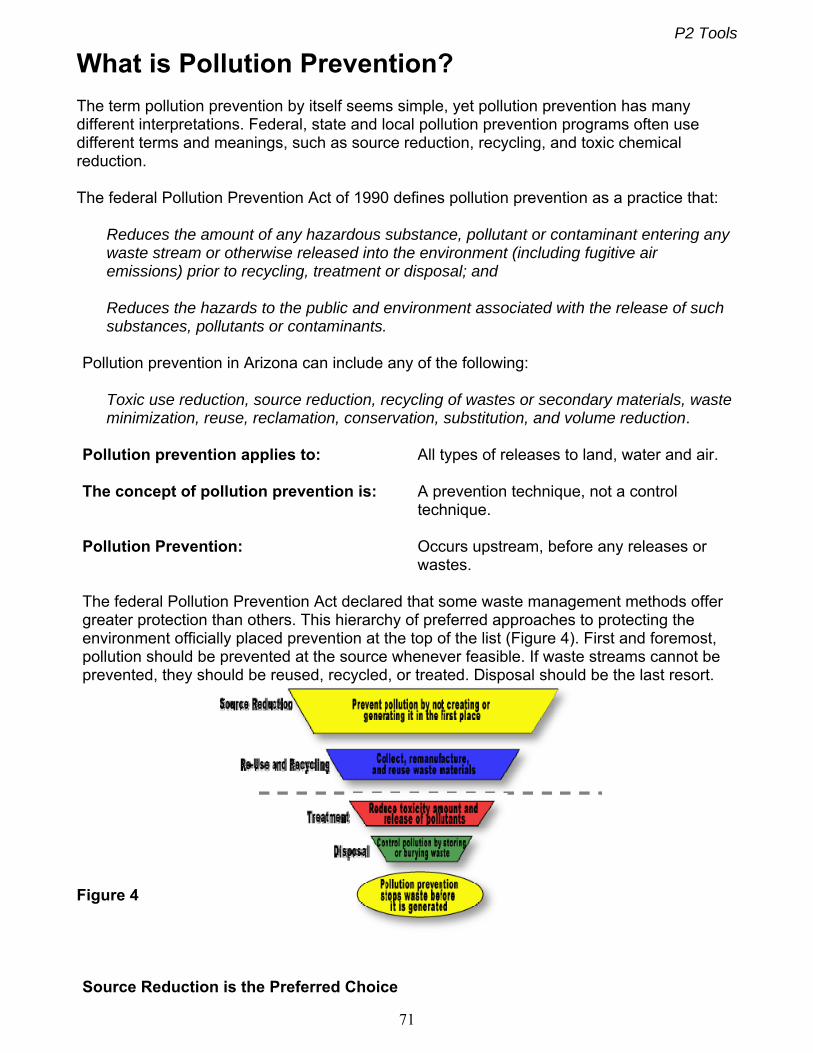
P2 Tools
71
What is Pollution Prevention? The term pollution prevention by itself seems simple, yet pollution prevention has many different interpretations. Federal, state and local pollution prevention programs often use different terms and meanings, such as source reduction, recycling, and toxic chemical reduction.
The federal Pollution Prevention Act of 1990 defines pollution prevention as a practice that:
Reduces the amount of any hazardous substance, pollutant or contaminant entering any waste stream or otherwise released into the environment (including fugitive air emissions) prior to recycling, treatment or disposal; and
Reduces the hazards to the public and environment associated with the release of such substances, pollutants or contaminants.
Pollution prevention in Arizona can include any of the following:
Toxic use reduction, source reduction, recycling of wastes or secondary materials, waste minimization, reuse, reclamation, conservation, substitution, and volume reduction.
Pollution prevention applies to: All types of releases to land, water and air. The concept of pollution prevention is: A prevention technique, not a control technique. Pollution Prevention: Occurs upstream, before any releases or
wastes. The federal Pollution Prevention Act declared that some waste management methods offer greater protection than others. This hierarchy of preferred approaches to protecting the environment officially placed prevention at the top of the list (Figure 4). First and foremost, pollution should be prevented at the source whenever feasible. If waste streams cannot be prevented, they should be reused, recycled, or treated. Disposal should be the last resort.
Figure 4 Source Reduction is the Preferred Choice
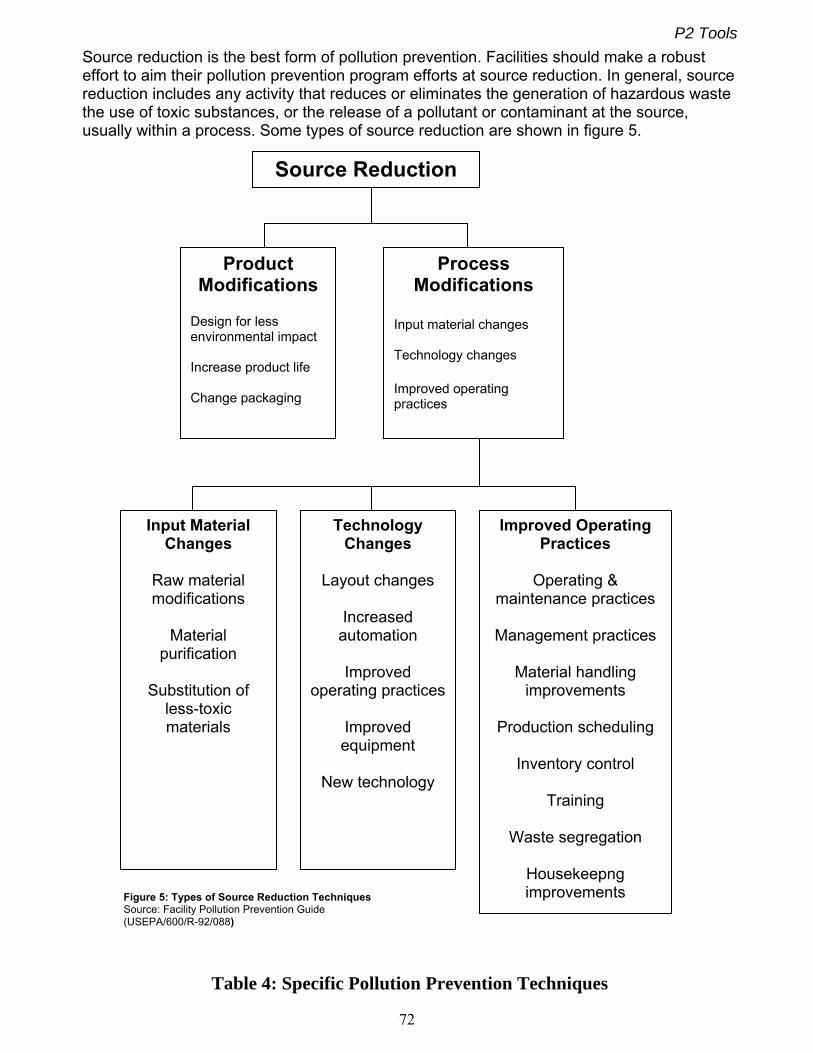
P2 Tools
72
Source reduction is the best form of pollution prevention. Facilities should make a robust effort to aim their pollution prevention program efforts at source reduction. In general, source reduction includes any activity that reduces or eliminates the generation of hazardous waste the use of toxic substances, or the release of a pollutant or contaminant at the source, usually within a process. Some types of source reduction are shown in figure 5.
Table 4: Specific Pollution Prevention Techniques
Source Reduction
Product Modifications
Design for less environmental impact Increase product life
Change packaging
Process Modifications
Input material changes Technology changes Improved operating practices
Input Material Changes
Raw material modifications
Material
purification
Substitution of less-toxic materials
Technology Changes
Layout changes
Increased
automation
Improved operating practices
Improved equipment
New technology
Improved Operating Practices
Operating &
maintenance practices
Management practices
Material handling improvements
Production scheduling
Inventory control
Training
Waste segregation
Housekeepng improvements Figure 5: Types of Source Reduction Techniques
Source: Facility Pollution Prevention Guide (USEPA/600/R-92/088)
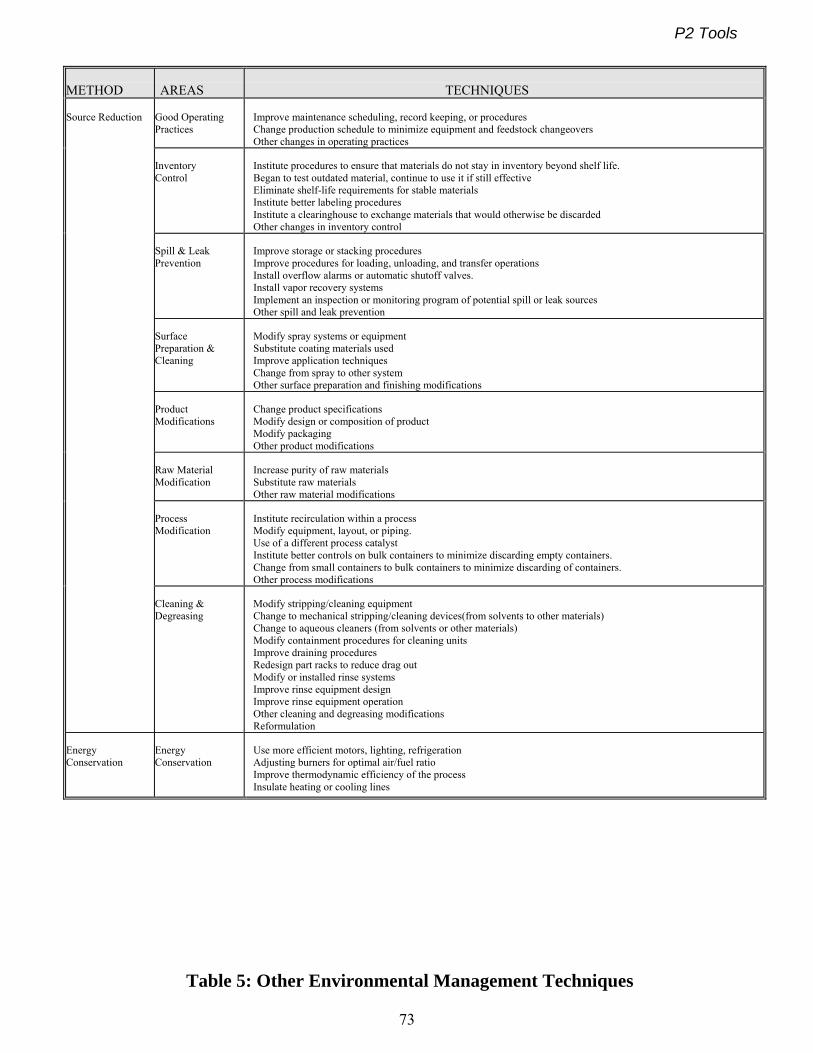
P2 Tools
73
METHOD
AREAS
TECHNIQUES
Good Operating Practices
Improve maintenance scheduling, record keeping, or procedures Change production schedule to minimize equipment and feedstock changeovers Other changes in operating practices
Inventory Control
Institute procedures to ensure that materials do not stay in inventory beyond shelf life. Began to test outdated material, continue to use it if still effective Eliminate shelf-life requirements for stable materials Institute better labeling procedures Institute a clearinghouse to exchange materials that would otherwise be discarded Other changes in inventory control
Spill & Leak Prevention
Improve storage or stacking procedures Improve procedures for loading, unloading, and transfer operations Install overflow alarms or automatic shutoff valves. Install vapor recovery systems Implement an inspection or monitoring program of potential spill or leak sources Other spill and leak prevention
Surface Preparation & Cleaning
Modify spray systems or equipment Substitute coating materials used Improve application techniques Change from spray to other system Other surface preparation and finishing modifications
Product Modifications
Change product specifications Modify design or composition of product Modify packaging Other product modifications
Raw Material Modification
Increase purity of raw materials Substitute raw materials Other raw material modifications
Process Modification
Institute recirculation within a process Modify equipment, layout, or piping. Use of a different process catalyst Institute better controls on bulk containers to minimize discarding empty containers. Change from small containers to bulk containers to minimize discarding of containers. Other process modifications
Source Reduction
Cleaning & Degreasing
Modify stripping/cleaning equipment Change to mechanical stripping/cleaning devices(from solvents to other materials) Change to aqueous cleaners (from solvents or other materials) Modify containment procedures for cleaning units Improve draining procedures Redesign part racks to reduce drag out Modify or installed rinse systems Improve rinse equipment design Improve rinse equipment operation Other cleaning and degreasing modifications Reformulation
Energy Conservation
Energy Conservation
Use more efficient motors, lighting, refrigeration Adjusting burners for optimal air/fuel ratio Improve thermodynamic efficiency of the process Insulate heating or cooling lines
Table 5: Other Environmental Management Techniques
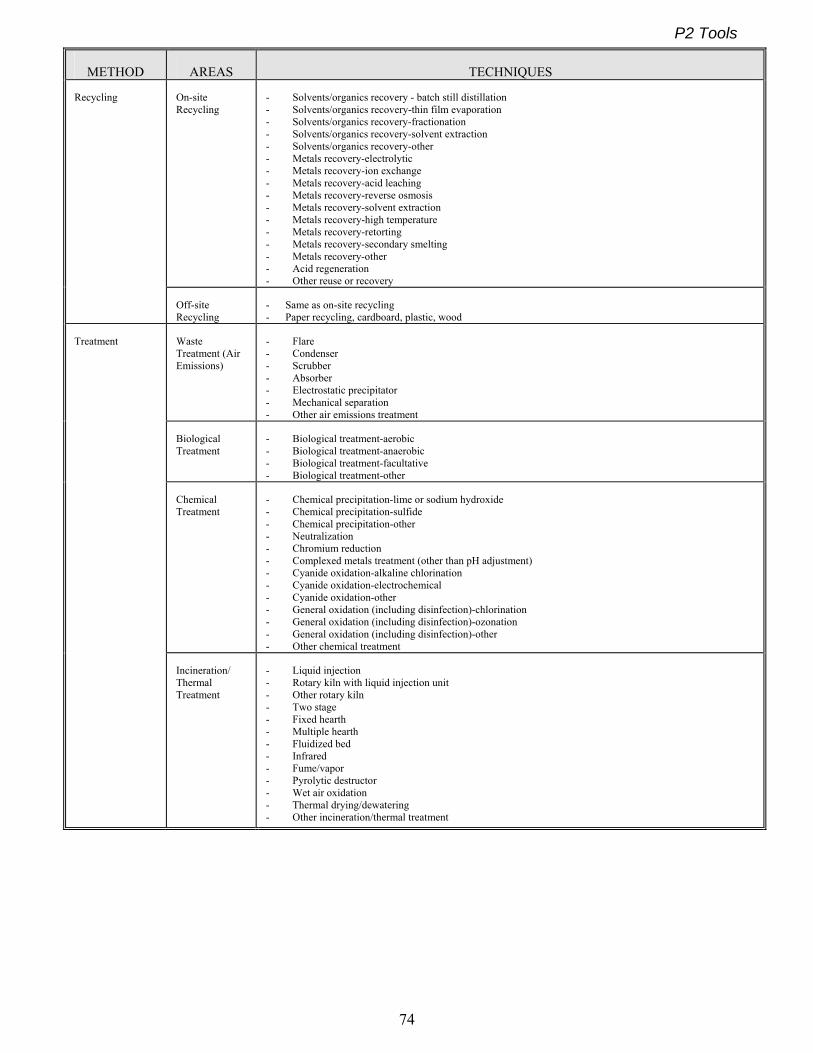
P2 Tools
74
METHOD
AREAS
TECHNIQUES
On-site Recycling
- Solvents/organics recovery - batch still distillation - Solvents/organics recovery-thin film evaporation - Solvents/organics recovery-fractionation - Solvents/organics recovery-solvent extraction - Solvents/organics recovery-other - Metals recovery-electrolytic - Metals recovery-ion exchange - Metals recovery-acid leaching - Metals recovery-reverse osmosis - Metals recovery-solvent extraction - Metals recovery-high temperature - Metals recovery-retorting - Metals recovery-secondary smelting - Metals recovery-other - Acid regeneration - Other reuse or recovery
Recycling
Off-site Recycling
- Same as on-site recycling - Paper recycling, cardboard, plastic, wood
Waste Treatment (Air Emissions)
- Flare - Condenser - Scrubber - Absorber - Electrostatic precipitator - Mechanical separation - Other air emissions treatment
Biological Treatment
- Biological treatment-aerobic - Biological treatment-anaerobic - Biological treatment-facultative - Biological treatment-other
Chemical Treatment
- Chemical precipitation-lime or sodium hydroxide - Chemical precipitation-sulfide - Chemical precipitation-other - Neutralization - Chromium reduction - Complexed metals treatment (other than pH adjustment) - Cyanide oxidation-alkaline chlorination - Cyanide oxidation-electrochemical - Cyanide oxidation-other - General oxidation (including disinfection)-chlorination - General oxidation (including disinfection)-ozonation - General oxidation (including disinfection)-other - Other chemical treatment
Treatment
Incineration/ Thermal Treatment
- Liquid injection - Rotary kiln with liquid injection unit - Other rotary kiln - Two stage - Fixed hearth - Multiple hearth - Fluidized bed - Infrared - Fume/vapor - Pyrolytic destructor - Wet air oxidation - Thermal drying/dewatering - Other incineration/thermal treatment
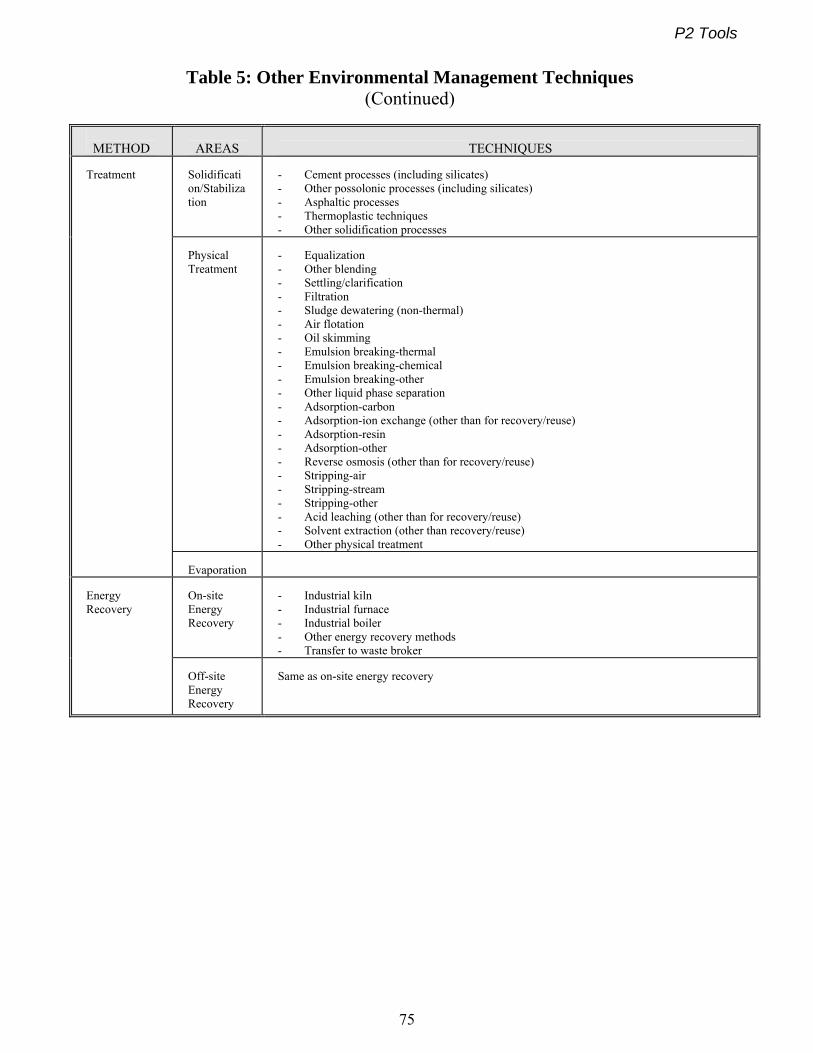
P2 Tools
75
Table 5: Other Environmental Management Techniques
(Continued)
METHOD
AREAS
TECHNIQUES Solidification/Stabilization
- Cement processes (including silicates) - Other possolonic processes (including silicates) - Asphaltic processes - Thermoplastic techniques - Other solidification processes
Physical Treatment
- Equalization - Other blending - Settling/clarification - Filtration - Sludge dewatering (non-thermal) - Air flotation - Oil skimming - Emulsion breaking-thermal - Emulsion breaking-chemical - Emulsion breaking-other - Other liquid phase separation - Adsorption-carbon - Adsorption-ion exchange (other than for recovery/reuse) - Adsorption-resin - Adsorption-other - Reverse osmosis (other than for recovery/reuse) - Stripping-air - Stripping-stream - Stripping-other - Acid leaching (other than for recovery/reuse) - Solvent extraction (other than recovery/reuse) - Other physical treatment
Treatment
Evaporation
Energy Recovery
On-site Energy Recovery
- Industrial kiln - Industrial furnace - Industrial boiler - Other energy recovery methods - Transfer to waste broker
Off-site Energy Recovery
Same as on-site energy recovery
P2 Tools
76
Can Pollution Prevention Benefit My Company? Most definitely! There are many reasons to reduce both the amount of waste generated and the amount of toxic chemicals released to the environment. For example, there are: Economic Benefits Regulatory Benefits Liability Benefits Public Relations Benefits Human Health and Environmental Benefits
You can save money on disposal costs, raw material costs, and labor costs. You will find reduced liability, and reduced compliance costs. It can improve your relationship with the public - your neighbors and customers. It will help to protect our health and the environment we must all live in. It is not only a good choice environmentally, but can give your company an economic advantage. When you protect the environment, you are ultimately protecting yourself, your children and your grandchildren.
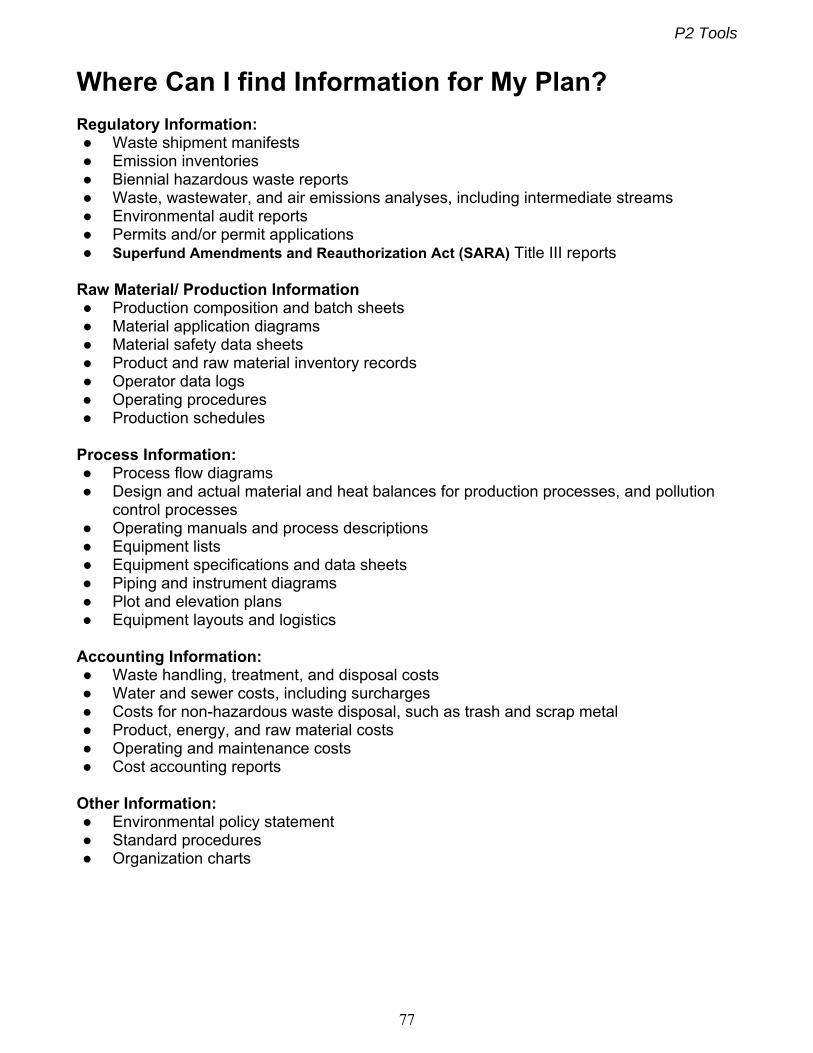
P2 Tools
77
Where Can I find Information for My Plan?
Regulatory Information: ● Waste shipment manifests ● Emission inventories ● Biennial hazardous waste reports ● Waste, wastewater, and air emissions analyses, including intermediate streams ● Environmental audit reports ● Permits and/or permit applications ● Superfund Amendments and Reauthorization Act (SARA) Title III reports
Raw Material/ Production Information ● Production composition and batch sheets ● Material application diagrams ● Material safety data sheets ● Product and raw material inventory records ● Operator data logs ● Operating procedures ● Production schedules Process Information: ● Process flow diagrams ● Design and actual material and heat balances for production processes, and pollution control processes ● Operating manuals and process descriptions ● Equipment lists ● Equipment specifications and data sheets ● Piping and instrument diagrams ● Plot and elevation plans ● Equipment layouts and logistics Accounting Information: ● Waste handling, treatment, and disposal costs ● Water and sewer costs, including surcharges ● Costs for non-hazardous waste disposal, such as trash and scrap metal ● Product, energy, and raw material costs ● Operating and maintenance costs ● Cost accounting reports Other Information: ● Environmental policy statement ● Standard procedures ● Organization charts
P2 Tools
78
How Do I Search for the Root Cause of a Waste, Toxic Substance Use or Emission? There are many analysis methods in use by pollution prevention practitioners. Some of these methods include: ● Process mapping ● Pareto charts ● Cause and effect diagrams ● Weighted sum method ● Five Whys (or more) Often, process mapping is often used first to develop the environmental aspects of your processes. Environmental aspects are elements of your company’s activities, products, or services that can interact with the environment. Next, cause and effect diagrams can be used to search for the root causes of each particular aspect. The 5 Whys questioning technique is also used, alone or used with the cause and effect analysis, to help develop root causes. Companies have other analysis techniques that may also be useful for this work. These analysis methods historically came from the area of continual quality improvement and are discussed in various books and in articles on the internet. Some of these methods are discussed below.
Process Mapping: How Can I Analyze My Processes and Develop Environmental Aspects? Use the process map tool for analyzing processes and developing a list of environmental aspects. Process mapping allows you to break any process down into individual events or activities and to display these in shorthand form showing the logical relationships between them. Constructing a process map promotes better understanding of processes, and better understanding of processes is a pre-requisite for improvement. The work steps on your map show how materials flow through your process to result in a product. A process map gives you a valuable tool to track material use and loss. It can also be used to track energy and water use. Unlike flowcharts or equipment schematics which use a complex system of symbols, a process map uses simple boxes and arrows (refer to Figure 6). Boxes denote work steps and arrows denote the movement of material and waste. Arrows pointing left and right represent the movement of product. Arrows pointing down into a box represent material inputs to that step. Arrows pointing down (out of a box) represent waste, emissions or pollution created by that step.
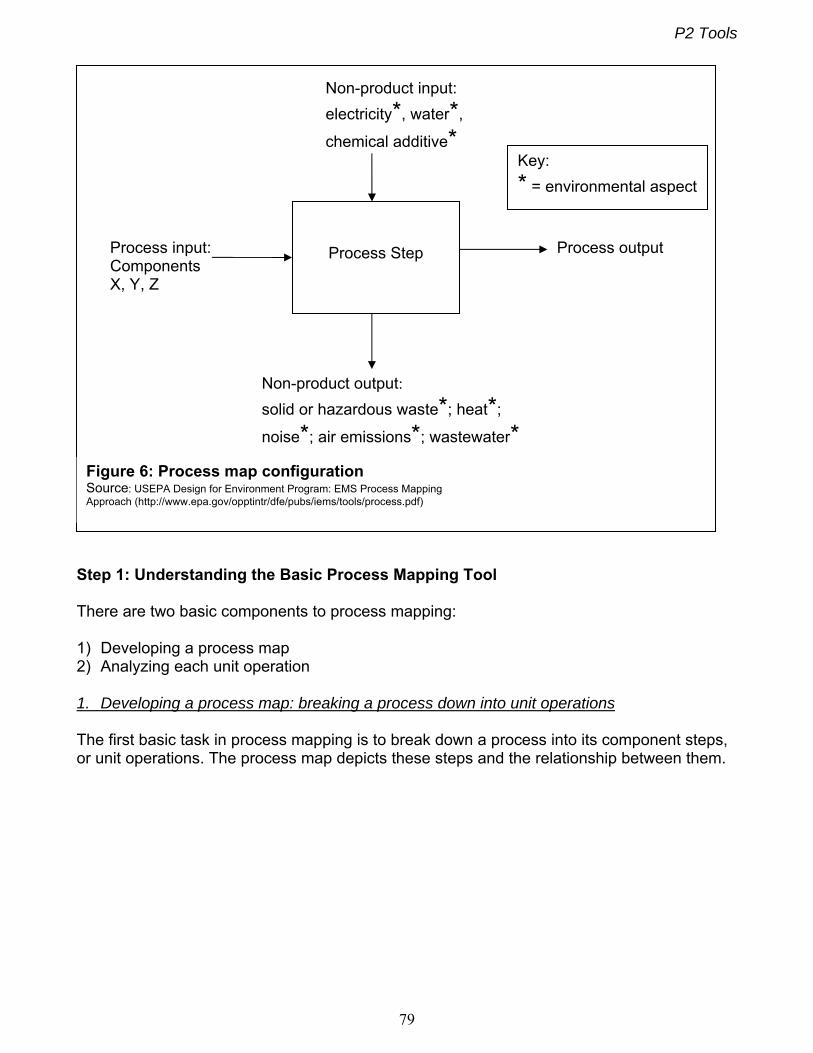
P2 Tools
79
Step 1: Understanding the Basic Process Mapping Tool There are two basic components to process mapping: 1) Developing a process map 2) Analyzing each unit operation 1. Developing a process map: breaking a process down into unit operations The first basic task in process mapping is to break down a process into its component steps, or unit operations. The process map depicts these steps and the relationship between them.
Process Step
Non-product input:
electricity*, water*,
chemical additive*
Non-product output:
solid or hazardous waste*; heat*;
noise*; air emissions*; wastewater*
Process input: Components X, Y, Z
Process output
Key:
* = environmental aspect
Figure 6: Process map configuration Source: USEPA Design for Environment Program: EMS Process Mapping Approach (http://www.epa.gov/opptintr/dfe/pubs/iems/tools/process.pdf)
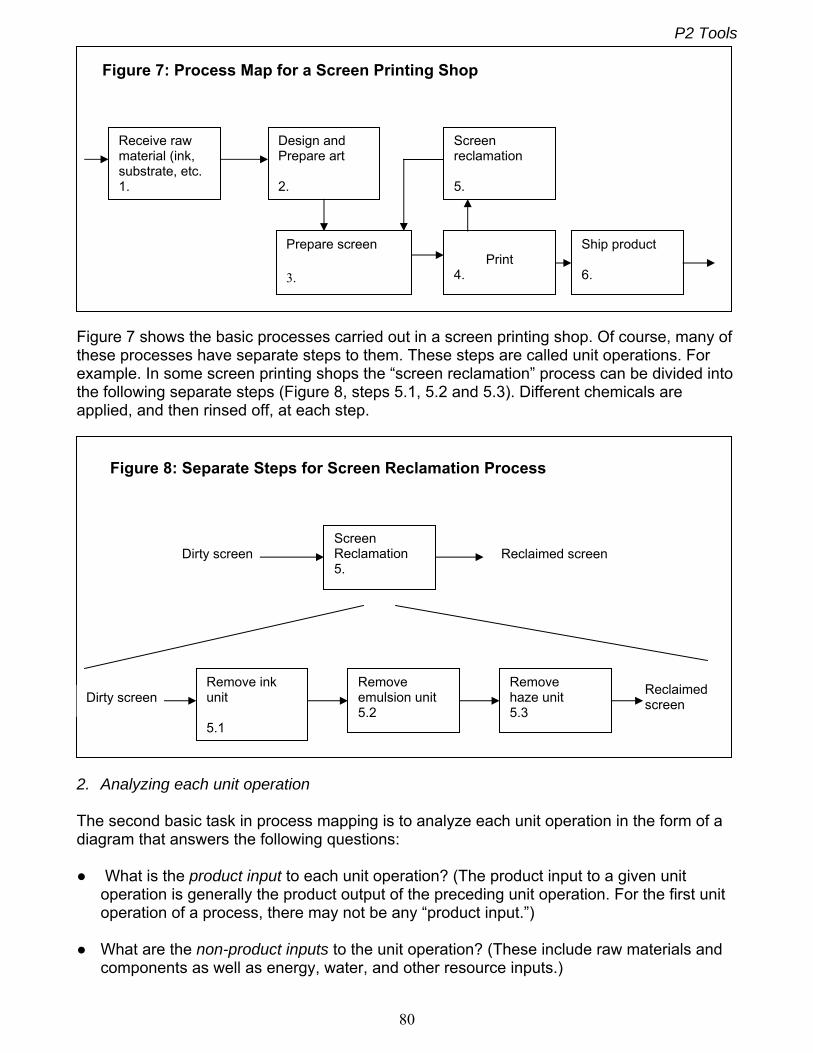
P2 Tools
80
Figure 7 shows the basic processes carried out in a screen printing shop. Of course, many of these processes have separate steps to them. These steps are called unit operations. For example. In some screen printing shops the “screen reclamation” process can be divided into the following separate steps (Figure 8, steps 5.1, 5.2 and 5.3). Different chemicals are applied, and then rinsed off, at each step.
2. Analyzing each unit operation The second basic task in process mapping is to analyze each unit operation in the form of a diagram that answers the following questions: ● What is the product input to each unit operation? (The product input to a given unit operation is generally the product output of the preceding unit operation. For the first unit operation of a process, there may not be any “product input.”) ● What are the non-product inputs to the unit operation? (These include raw materials and components as well as energy, water, and other resource inputs.)
Remove ink unit 5.1
Remove emulsion unit 5.2
Remove haze unit 5.3
Screen Reclamation 5.
Dirty screen
Reclaimed screen
Figure 8: Separate Steps for Screen Reclamation Process
Dirty screen
Reclaimed screen
4.
Receive raw material (ink, substrate, etc. 1.
Prepare screen 3.
Design and Prepare art 2.
Ship product 6.
Screen reclamation 5.
Figure 7: Process Map for a Screen Printing Shop
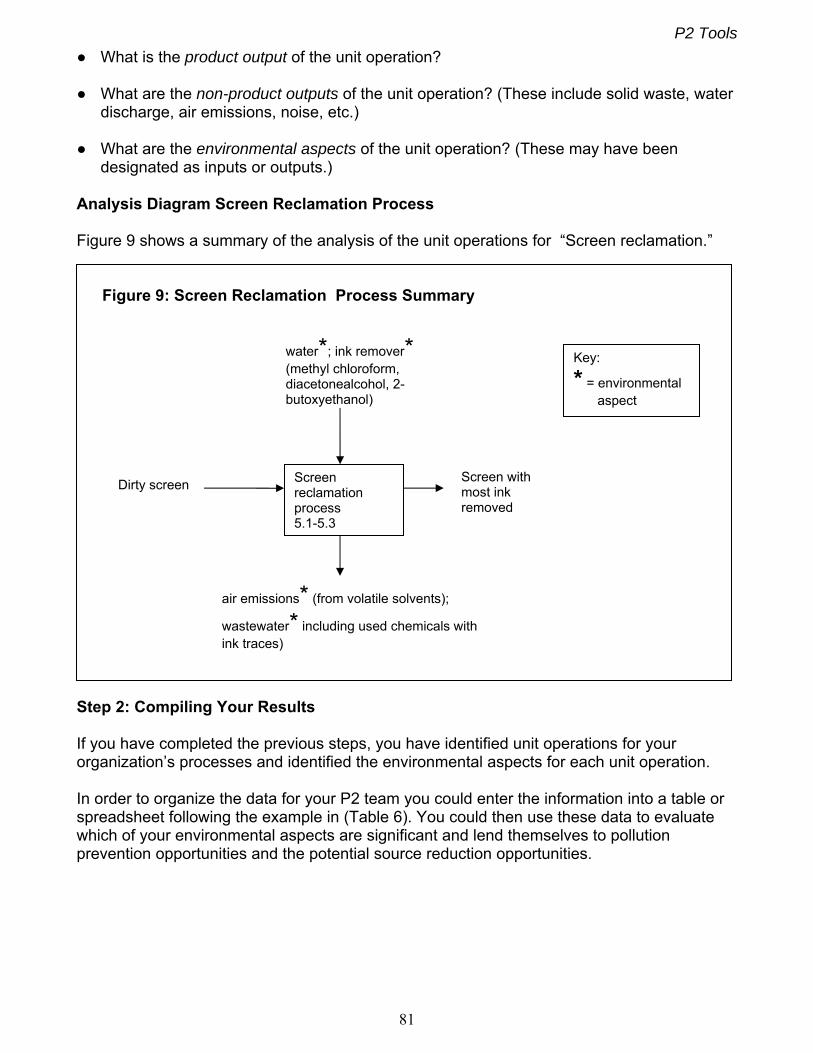
P2 Tools
81
● What is the product output of the unit operation? ● What are the non-product outputs of the unit operation? (These include solid waste, water discharge, air emissions, noise, etc.) ● What are the environmental aspects of the unit operation? (These may have been designated as inputs or outputs.) Analysis Diagram Screen Reclamation Process Figure 9 shows a summary of the analysis of the unit operations for “Screen reclamation.”
Step 2: Compiling Your Results If you have completed the previous steps, you have identified unit operations for your organization’s processes and identified the environmental aspects for each unit operation. In order to organize the data for your P2 team you could enter the information into a table or spreadsheet following the example in (Table 6). You could then use these data to evaluate which of your environmental aspects are significant and lend themselves to pollution prevention opportunities and the potential source reduction opportunities.
Screen reclamation process 5.1-5.3
water*; ink remover* (methyl chloroform, diacetonealcohol, 2-butoxyethanol)
air emissions* (from volatile solvents);
wastewater* including used chemicals with ink traces)
Dirty screen Screen with most ink removed
Key:
* = environmental aspect
Figure 9: Screen Reclamation Process Summary
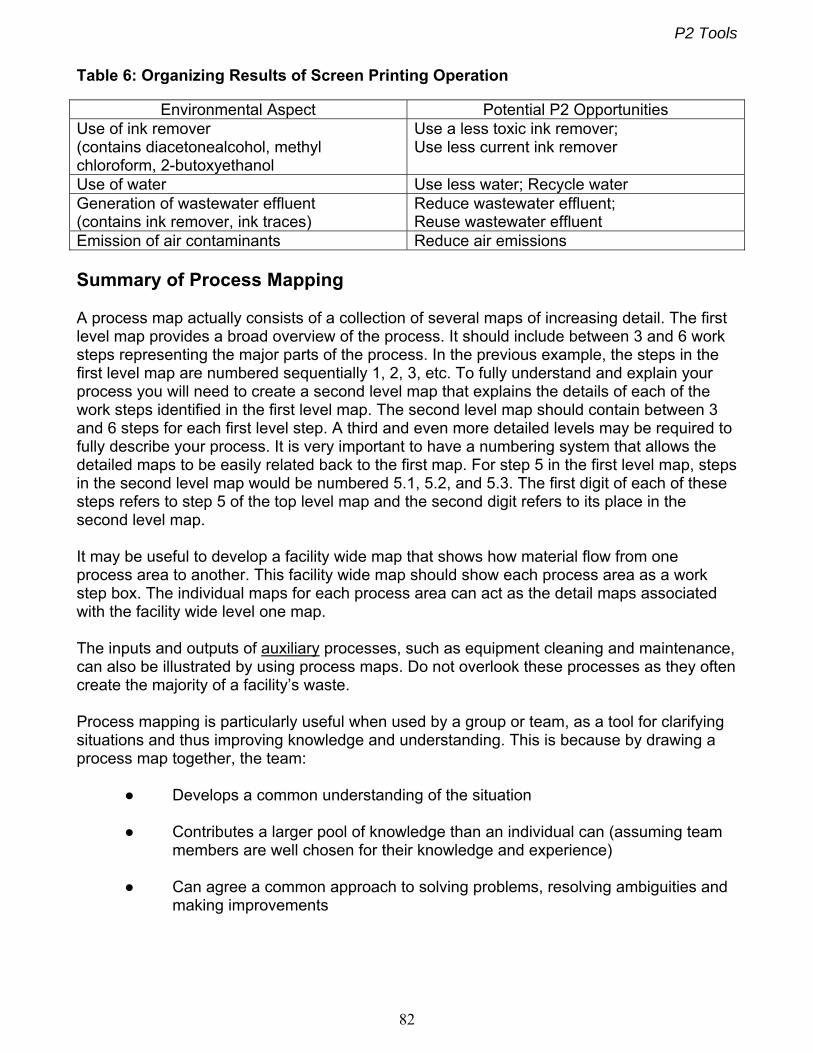
P2 Tools
82
Table 6: Organizing Results of Screen Printing Operation
Environmental Aspect Potential P2 Opportunities Use of ink remover (contains diacetonealcohol, methyl chloroform, 2-butoxyethanol
Use a less toxic ink remover; Use less current ink remover
Use of water Use less water; Recycle water Generation of wastewater effluent (contains ink remover, ink traces)
Reduce wastewater effluent; Reuse wastewater effluent
Emission of air contaminants Reduce air emissions Summary of Process Mapping A process map actually consists of a collection of several maps of increasing detail. The first level map provides a broad overview of the process. It should include between 3 and 6 work steps representing the major parts of the process. In the previous example, the steps in the first level map are numbered sequentially 1, 2, 3, etc. To fully understand and explain your process you will need to create a second level map that explains the details of each of the work steps identified in the first level map. The second level map should contain between 3 and 6 steps for each first level step. A third and even more detailed levels may be required to fully describe your process. It is very important to have a numbering system that allows the detailed maps to be easily related back to the first map. For step 5 in the first level map, steps in the second level map would be numbered 5.1, 5.2, and 5.3. The first digit of each of these steps refers to step 5 of the top level map and the second digit refers to its place in the second level map. It may be useful to develop a facility wide map that shows how material flow from one process area to another. This facility wide map should show each process area as a work step box. The individual maps for each process area can act as the detail maps associated with the facility wide level one map. The inputs and outputs of auxiliary processes, such as equipment cleaning and maintenance, can also be illustrated by using process maps. Do not overlook these processes as they often create the majority of a facility’s waste. Process mapping is particularly useful when used by a group or team, as a tool for clarifying situations and thus improving knowledge and understanding. This is because by drawing a process map together, the team: ● Develops a common understanding of the situation ● Contributes a larger pool of knowledge than an individual can (assuming team members are well chosen for their knowledge and experience) ● Can agree a common approach to solving problems, resolving ambiguities and making improvements
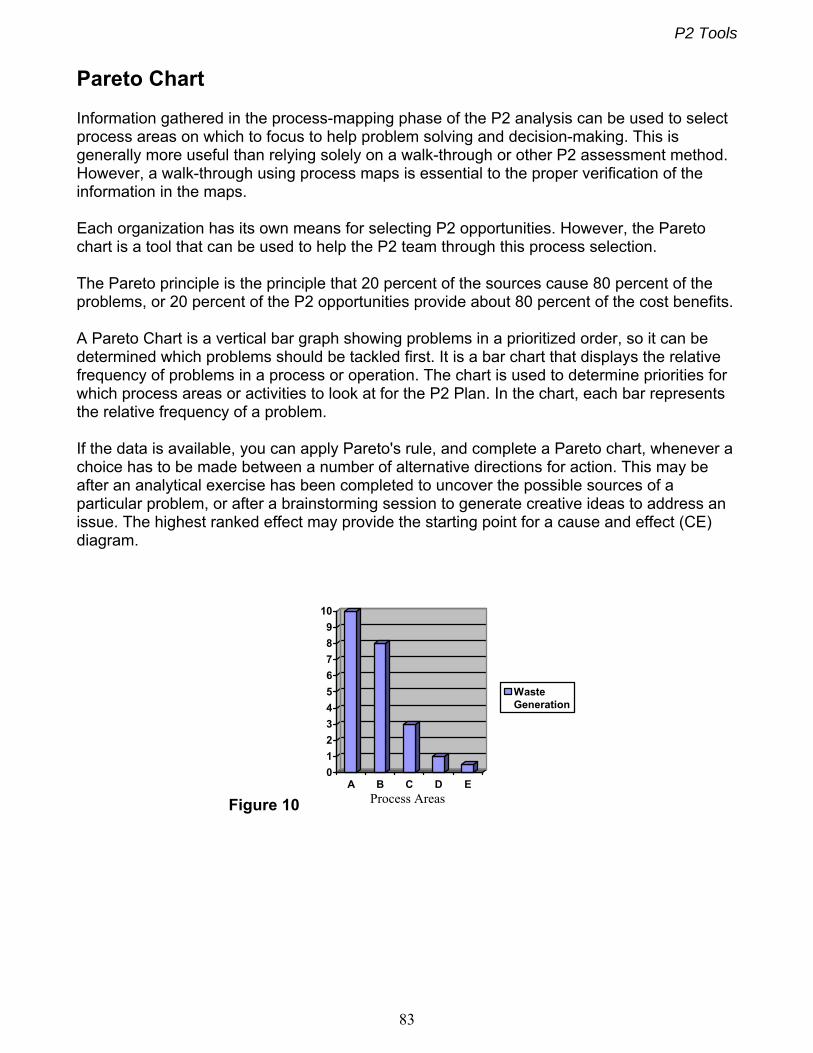
P2 Tools
83
Pareto Chart Information gathered in the process-mapping phase of the P2 analysis can be used to select process areas on which to focus to help problem solving and decision-making. This is generally more useful than relying solely on a walk-through or other P2 assessment method. However, a walk-through using process maps is essential to the proper verification of the information in the maps. Each organization has its own means for selecting P2 opportunities. However, the Pareto chart is a tool that can be used to help the P2 team through this process selection. The Pareto principle is the principle that 20 percent of the sources cause 80 percent of the problems, or 20 percent of the P2 opportunities provide about 80 percent of the cost benefits. A Pareto Chart is a vertical bar graph showing problems in a prioritized order, so it can be determined which problems should be tackled first. It is a bar chart that displays the relative frequency of problems in a process or operation. The chart is used to determine priorities for which process areas or activities to look at for the P2 Plan. In the chart, each bar represents the relative frequency of a problem. If the data is available, you can apply Pareto's rule, and complete a Pareto chart, whenever a choice has to be made between a number of alternative directions for action. This may be after an analytical exercise has been completed to uncover the possible sources of a particular problem, or after a brainstorming session to generate creative ideas to address an issue. The highest ranked effect may provide the starting point for a cause and effect (CE) diagram.
Figure 10
0
1
2
3
4
5
6
7
8
9
10
A B C D E
WasteGeneration
Process Areas
P2 Tools
84
Cause and Effect Diagram A Cause-and-Effect Diagram is a tool that is useful for identifying sorting, displaying and organizing the known or possible causes of a problem or effect. The structure provided by the diagram helps team members think in a very systematic way. Some of the benefits of constructing a Cause-and-Effect Diagram are that it: ● Helps determine the root causes of a problem or quality characteristic using a structured approach ● Encourages group participation and utilizes group knowledge of the process ● Uses an orderly, easy-to-read format to diagram cause-and-effect relationships ● Indicates possible causes of variation in a process ● Increases knowledge of the process by helping everyone to learn more about the factors at work and how they relate ● Identifies areas where data should be collected for further study
With a Cause-and-Effect (CE) Diagram, the user can see all possible causes for a particular effect, and hopefully find the root of process imperfections. This type of diagram is sometimes called an "Ishikawa” diagram because it was invented by Professor Kaoru Ishikawa of Tokyo University, a highly regarded Japanese expert in quality management. It is also called a "fishbone” diagram because of the way it looks. The major purpose of the CE Diagram is to act as a first step in problem solving by generating a comprehensive list of possible causes. It can lead to immediate identification of major causes and point to the potential remedial actions or, failing this, it may indicate the best potential areas for further exploration and analysis. At a minimum, preparing a CE Diagram will lead to greater understanding of the problem. It is an effective tool that allows people to easily see the relationship between factors to study processes, situations, and for planning. Like regular brainstorming this is best done with a team but one is not required. You can construct a CE Diagram whenever you need to investigate the causes or contributing factors for an effect (be it a quality characteristic or other outcome) which is of concern to you. This will most likely be after you have conducted a general investigation of problems for a particular function, product, or service, and ranked them using a Pareto Chart. When should a team use a Cause-And-Effect Diagram? Constructing a Cause-and-Effect Diagram can help your team when you need to: ● Identify the possible root causes, the basic reasons, for a specific effect, problem, or condition ● Sort out and relate some of the interactions among the factors affecting a particular process or effect
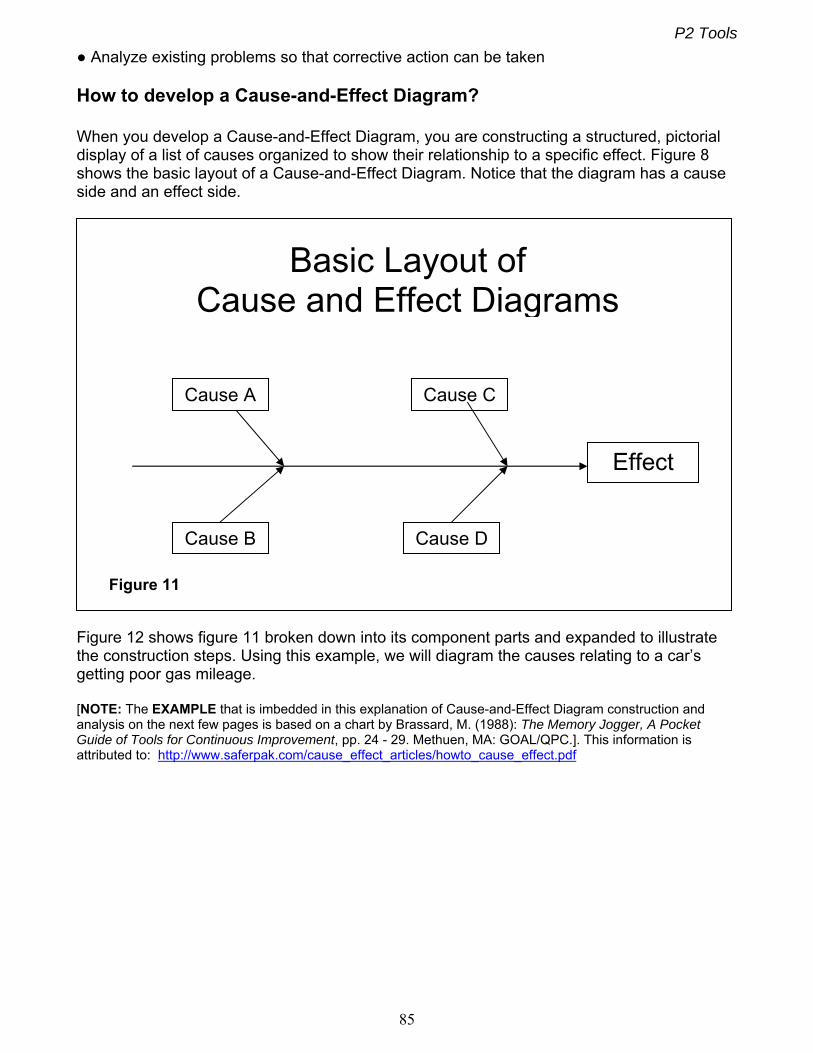
P2 Tools
85
● Analyze existing problems so that corrective action can be taken How to develop a Cause-and-Effect Diagram? When you develop a Cause-and-Effect Diagram, you are constructing a structured, pictorial display of a list of causes organized to show their relationship to a specific effect. Figure 8 shows the basic layout of a Cause-and-Effect Diagram. Notice that the diagram has a cause side and an effect side.
Figure 12 shows figure 11 broken down into its component parts and expanded to illustrate the construction steps. Using this example, we will diagram the causes relating to a car’s getting poor gas mileage. [NOTE: The EXAMPLE that is imbedded in this explanation of Cause-and-Effect Diagram construction and analysis on the next few pages is based on a chart by Brassard, M. (1988): The Memory Jogger, A Pocket Guide of Tools for Continuous Improvement, pp. 24 - 29. Methuen, MA: GOAL/QPC.]. This information is attributed to: http://www.saferpak.com/cause_effect_articles/howto_cause_effect.pdf
Basic Layout of Cause and Effect Diagrams
Effect
Cause A Cause C
Cause B Cause D
Figure 11
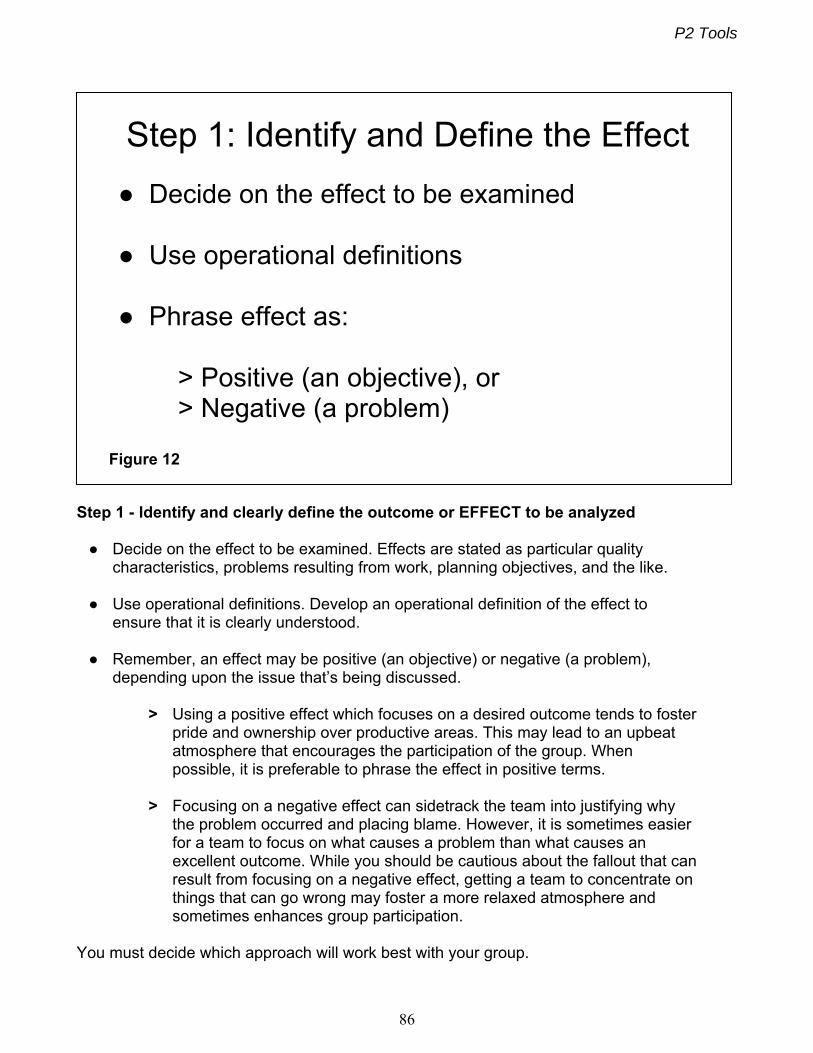
P2 Tools
86
Step 1 - Identify and clearly define the outcome or EFFECT to be analyzed ● Decide on the effect to be examined. Effects are stated as particular quality characteristics, problems resulting from work, planning objectives, and the like. ● Use operational definitions. Develop an operational definition of the effect to ensure that it is clearly understood. ● Remember, an effect may be positive (an objective) or negative (a problem), depending upon the issue that’s being discussed. > Using a positive effect which focuses on a desired outcome tends to foster pride and ownership over productive areas. This may lead to an upbeat atmosphere that encourages the participation of the group. When possible, it is preferable to phrase the effect in positive terms. > Focusing on a negative effect can sidetrack the team into justifying why the problem occurred and placing blame. However, it is sometimes easier for a team to focus on what causes a problem than what causes an excellent outcome. While you should be cautious about the fallout that can result from focusing on a negative effect, getting a team to concentrate on things that can go wrong may foster a more relaxed atmosphere and sometimes enhances group participation. You must decide which approach will work best with your group.
Step 1: Identify and Define the Effect
Figure 12
● Decide on the effect to be examined ● Use operational definitions ● Phrase effect as: > Positive (an objective), or > Negative (a problem)
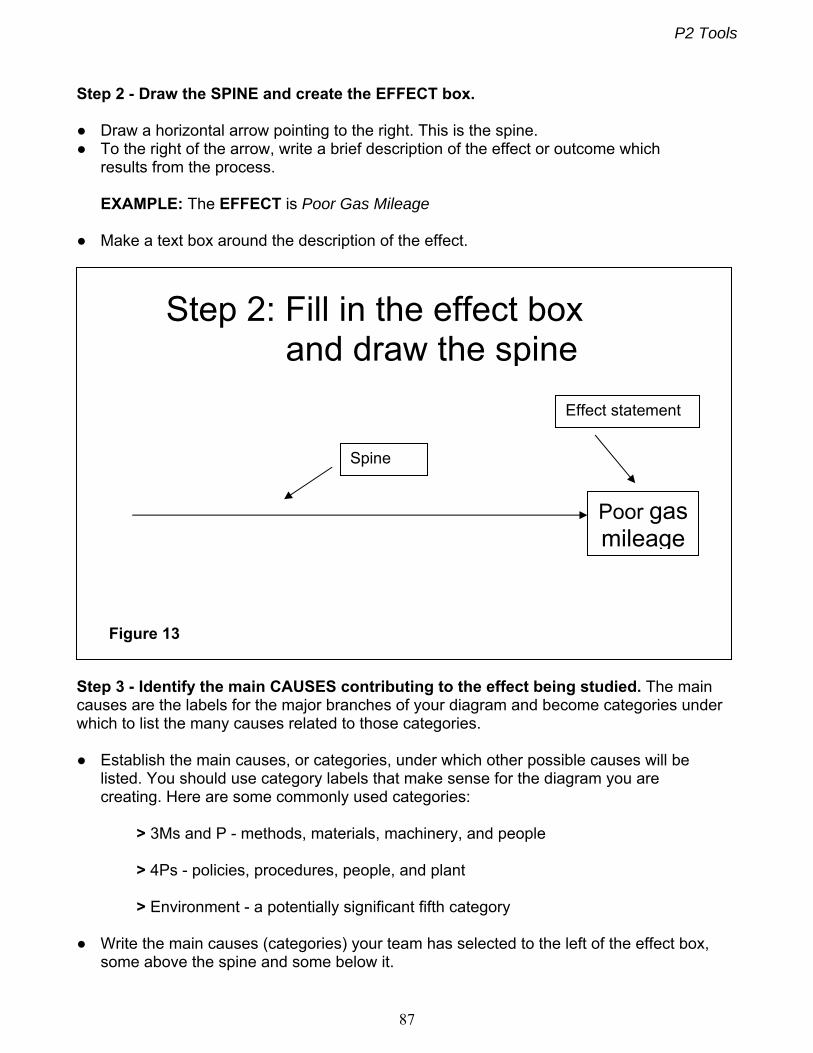
P2 Tools
87
Step 2 - Draw the SPINE and create the EFFECT box. ● Draw a horizontal arrow pointing to the right. This is the spine. ● To the right of the arrow, write a brief description of the effect or outcome which results from the process. EXAMPLE: The EFFECT is Poor Gas Mileage ● Make a text box around the description of the effect.
Step 3 - Identify the main CAUSES contributing to the effect being studied. The main causes are the labels for the major branches of your diagram and become categories under which to list the many causes related to those categories. ● Establish the main causes, or categories, under which other possible causes will be listed. You should use category labels that make sense for the diagram you are creating. Here are some commonly used categories: > 3Ms and P - methods, materials, machinery, and people > 4Ps - policies, procedures, people, and plant > Environment - a potentially significant fifth category ● Write the main causes (categories) your team has selected to the left of the effect box, some above the spine and some below it.
Step 2: Fill in the effect box and draw the spine
Poor gas mileage
Figure 13
Spine
Effect statement
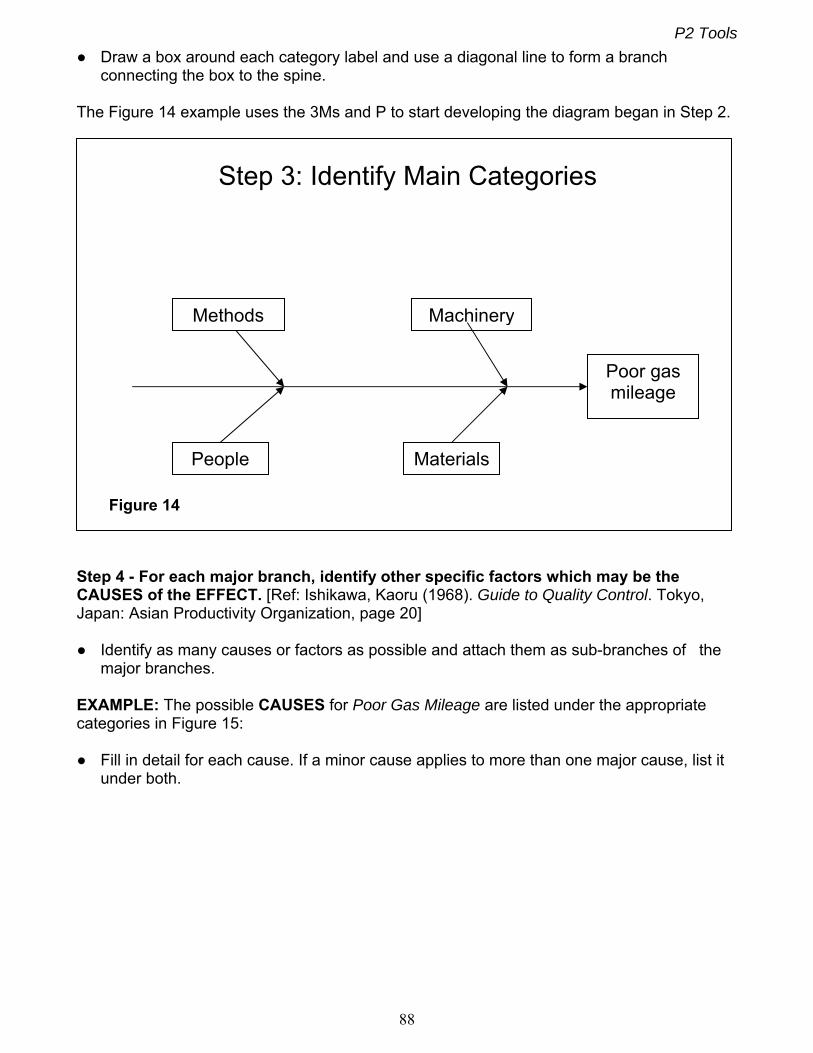
P2 Tools
88
● Draw a box around each category label and use a diagonal line to form a branch connecting the box to the spine. The Figure 14 example uses the 3Ms and P to start developing the diagram began in Step 2.
Step 4 - For each major branch, identify other specific factors which may be the CAUSES of the EFFECT. [Ref: Ishikawa, Kaoru (1968). Guide to Quality Control. Tokyo, Japan: Asian Productivity Organization, page 20] ● Identify as many causes or factors as possible and attach them as sub-branches of the major branches. EXAMPLE: The possible CAUSES for Poor Gas Mileage are listed under the appropriate categories in Figure 15: ● Fill in detail for each cause. If a minor cause applies to more than one major cause, list it under both.
Step 3: Identify Main Categories
Methods Machinery
People Materials
Figure 14
Poor gas mileage
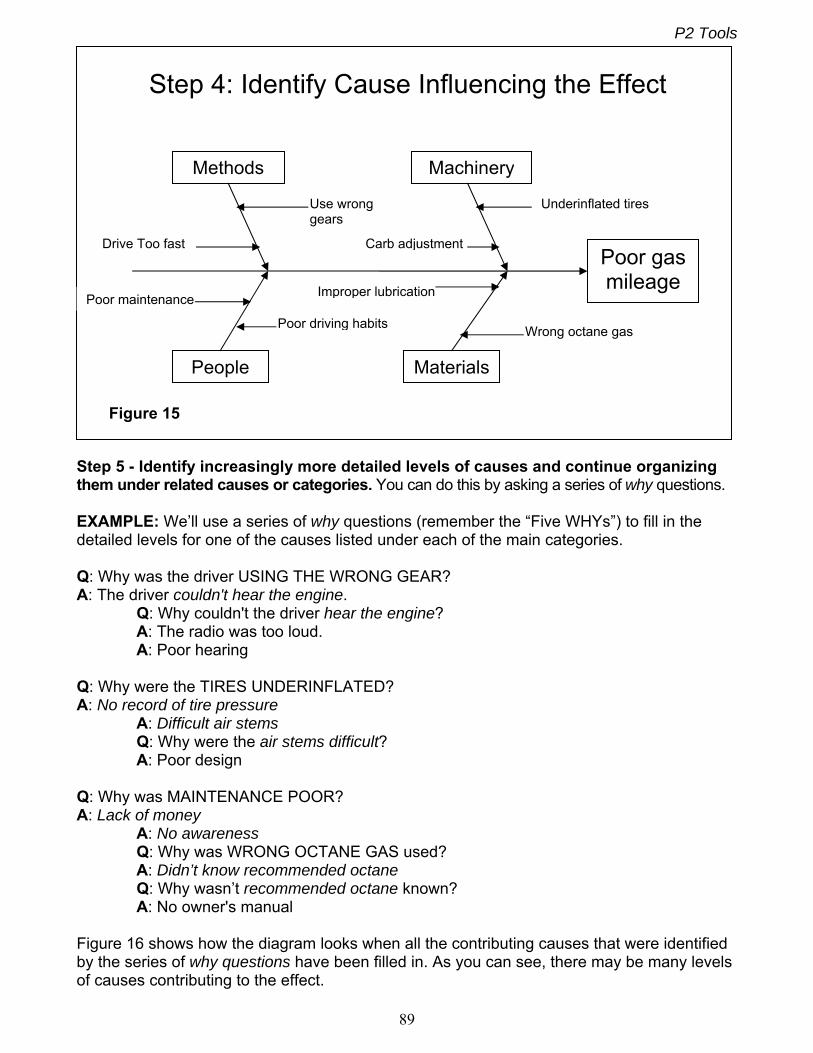
P2 Tools
89
Step 5 - Identify increasingly more detailed levels of causes and continue organizing them under related causes or categories. You can do this by asking a series of why questions. EXAMPLE: We’ll use a series of why questions (remember the “Five WHYs”) to fill in the detailed levels for one of the causes listed under each of the main categories. Q: Why was the driver USING THE WRONG GEAR? A: The driver couldn't hear the engine. Q: Why couldn't the driver hear the engine? A: The radio was too loud. A: Poor hearing Q: Why were the TIRES UNDERINFLATED? A: No record of tire pressure A: Difficult air stems Q: Why were the air stems difficult? A: Poor design Q: Why was MAINTENANCE POOR? A: Lack of money A: No awareness Q: Why was WRONG OCTANE GAS used? A: Didn’t know recommended octane Q: Why wasn’t recommended octane known? A: No owner's manual Figure 16 shows how the diagram looks when all the contributing causes that were identified by the series of why questions have been filled in. As you can see, there may be many levels of causes contributing to the effect.
Step 4: Identify Cause Influencing the Effect
Methods Machinery
People Materials
Figure 15
Poor gas mileage
Use wrong gears
Drive Too fast
Underinflated tires
Carb adjustment
Poor maintenance
Poor driving habits
Improper lubrication
Wrong octane gas
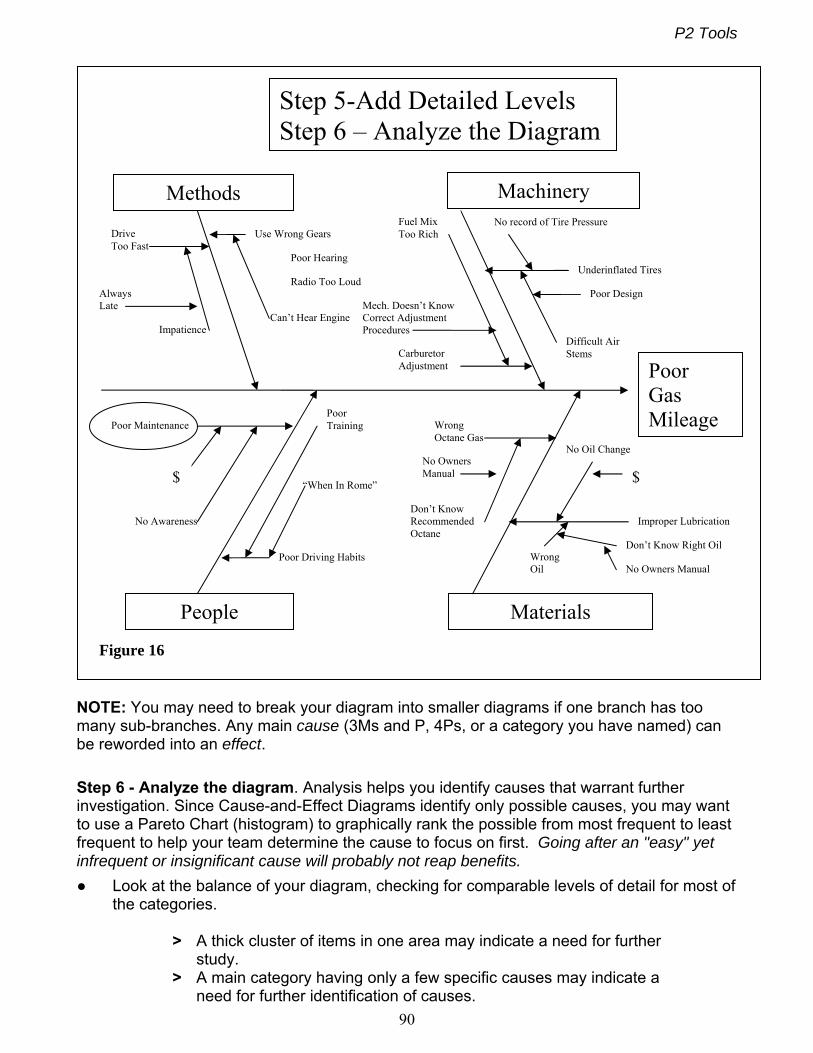
P2 Tools
90
NOTE: You may need to break your diagram into smaller diagrams if one branch has too many sub-branches. Any main cause (3Ms and P, 4Ps, or a category you have named) can be reworded into an effect.
Step 6 - Analyze the diagram. Analysis helps you identify causes that warrant further investigation. Since Cause-and-Effect Diagrams identify only possible causes, you may want to use a Pareto Chart (histogram) to graphically rank the possible from most frequent to least frequent to help your team determine the cause to focus on first. Going after an "easy" yet infrequent or insignificant cause will probably not reap benefits.
● Look at the balance of your diagram, checking for comparable levels of detail for most of the categories. > A thick cluster of items in one area may indicate a need for further study. > A main category having only a few specific causes may indicate a need for further identification of causes.
Poor Gas Mileage
Step 5-Add Detailed Levels Step 6 – Analyze the Diagram
Methods
Materials People
Machinery
Use Wrong Gears
Poor Hearing
Radio Too Loud
Can’t Hear Engine
Drive Too Fast
Always Late
Impatience
Carburetor Adjustment
Fuel Mix Too Rich
Mech. Doesn’t Know Correct Adjustment Procedures
Underinflated Tires
No record of Tire Pressure
Poor Design
Difficult Air Stems
Poor Maintenance
No Awareness
$
Poor Driving Habits
Poor Training
“When In Rome”
Figure 16
Improper Lubrication
Wrong Oil
Don’t Know Right Oil
No Owners Manual
No Oil Change
$No Owners Manual
Wrong Octane Gas
Don’t Know Recommended Octane
$ $
P2 Tools
91
> If several major branches have only a few sub-branches, you may need to combine them under a single category. ● Look for causes that appear repeatedly. These may represent root causes. ● Look for what you can measure in each cause so you can quantify the effects of any changes you make. ● Most importantly, identify and circle the causes that you can take action on. EXAMPLE: Let's analyze the diagram we have been constructing. > The level of detail is pretty well balanced. > No causes are repeated. > Poor Maintenance appears to be a cause for which you could develop measurements. > Moreover, Poor Maintenance appears to be a cause that you can take action on. It is circled in Figure 16 to mark it for further investigation.
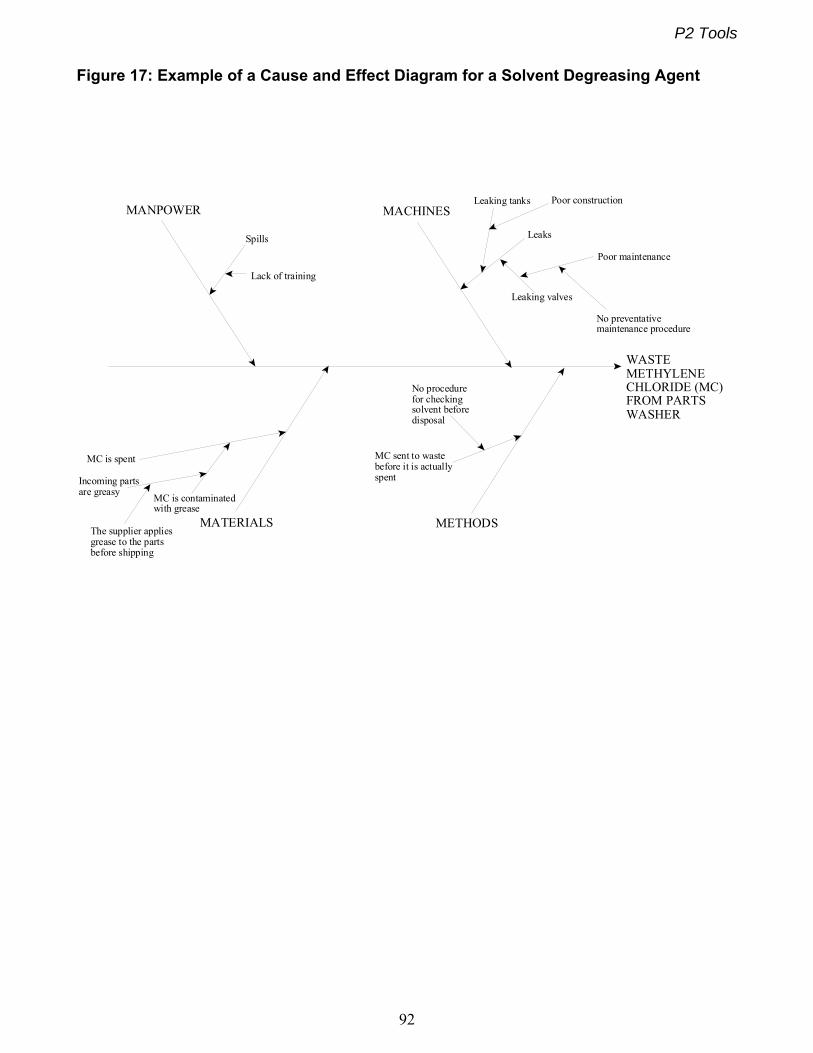
P2 Tools
92
Figure 17: Example of a Cause and Effect Diagram for a Solvent Degreasing Agent
WASTE METHYLENECHLORIDE (MC) FROM PARTS WASHER
MC sent to wastebefore it is actuallyspent
No procedurefor checkingsolvent beforedisposal
MC is spent
MC is contaminated with grease
Incoming partsare greasy
The supplier appliesgrease to the parts before shipping
Spills
Lack of training
Poor maintenance
Leaks
Leaking valves
Leaking tanks Poor constructionMACHINESMANPOWER
MATERIALS METHODS
No preventative maintenance procedure
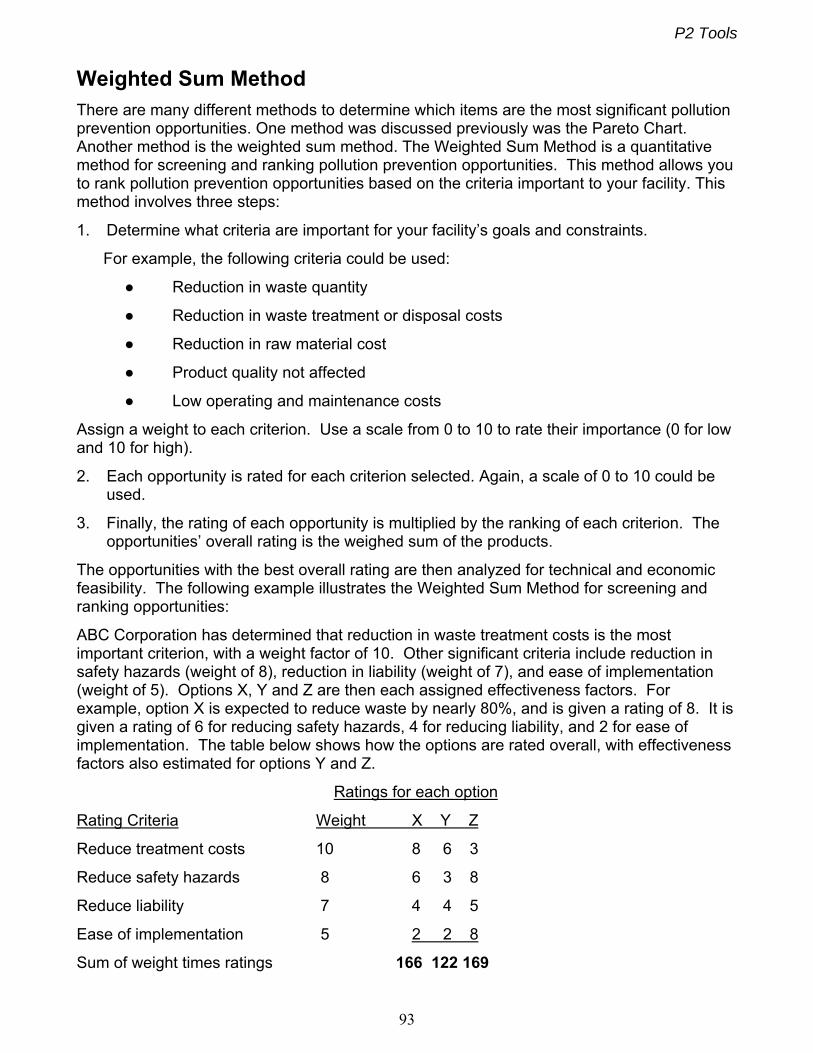
P2 Tools
93
Weighted Sum Method There are many different methods to determine which items are the most significant pollution prevention opportunities. One method was discussed previously was the Pareto Chart. Another method is the weighted sum method. The Weighted Sum Method is a quantitative method for screening and ranking pollution prevention opportunities. This method allows you to rank pollution prevention opportunities based on the criteria important to your facility. This method involves three steps:
1. Determine what criteria are important for your facility’s goals and constraints.
For example, the following criteria could be used:
● Reduction in waste quantity
● Reduction in waste treatment or disposal costs
● Reduction in raw material cost
● Product quality not affected
● Low operating and maintenance costs
Assign a weight to each criterion. Use a scale from 0 to 10 to rate their importance (0 for low and 10 for high).
2. Each opportunity is rated for each criterion selected. Again, a scale of 0 to 10 could be used.
3. Finally, the rating of each opportunity is multiplied by the ranking of each criterion. The opportunities’ overall rating is the weighed sum of the products.
The opportunities with the best overall rating are then analyzed for technical and economic feasibility. The following example illustrates the Weighted Sum Method for screening and ranking opportunities:
ABC Corporation has determined that reduction in waste treatment costs is the most important criterion, with a weight factor of 10. Other significant criteria include reduction in safety hazards (weight of 8), reduction in liability (weight of 7), and ease of implementation (weight of 5). Options X, Y and Z are then each assigned effectiveness factors. For example, option X is expected to reduce waste by nearly 80%, and is given a rating of 8. It is given a rating of 6 for reducing safety hazards, 4 for reducing liability, and 2 for ease of implementation. The table below shows how the options are rated overall, with effectiveness factors also estimated for options Y and Z.
Ratings for each option
Rating Criteria Weight X Y Z
Reduce treatment costs 10 8 6 3
Reduce safety hazards 8 6 3 8
Reduce liability 7 4 4 5
Ease of implementation 5 2 2 8
Sum of weight times ratings 166 122 169
P2 Tools
94
From this screening, option Z rates the highest with a score of 169. Option X’s score is 166 and Y’s score is 122. In this case, both option Z and X should be selected for further evaluation because both their scores are high.
The Five Whys: A Root Cause Analysis Technique A good technique to help determine the root cause is to continuously ask Why? By repeatedly asking the question Why (five times is a good rule of thumb), you can peel away the layers of symptoms which can lead to the root cause of a problem. You do not need to stop at 5.
Very often the apparent reason for a problem will lead you to another question. For a facility using a waste solvent as example: Why is the solvent a waste? Because it is contaminated with oil. Why is it contaminated with oil? Because the solvent was used to clean oil off of parts. Why are the parts oily? Because the manufacturer puts a coating of oil on them before shipping them to this facility. Why does the manufacturer put a coating on them? To prevent the parts from corroding after manufacture. Why is this type of corrosion protection absolutely necessary? There is no other way to protect the parts from corrosion. The root cause of this solvent waste is corrosion protection. If we investigate this root cause in this manner, we may find that solvent may not even be necessary if the oil is not needed (source reduction). If the oil is absolutely necessary, then we look at the hierarchy for answers to investigate maybe a less toxic solvent or water based system can be used (source reduction) to reduce the waste, if not, can we recycle the solvent to use less? In other words, the root cause would lead to more questions from the waste management hierarchy-Can the amount of oil be less? Can the solvent be recycled? Can a less toxic substance be used to remove the grease?
P2 Tools
95
Common P2 Plan Questions and Answers Q Where can I obtain more assistance in completing a Plan? A ADEQ- P2 Program staff are available to answer questions about developing your pollution prevention analysis and completing the P2 Plan requirements. The program has more than 280 P2 Plans on file that you may review, especially those from similar industries. The Internet also has numerous pollution prevention case studies and fact sheets. Q When must the Plan be submitted? A The Pollution Prevention Plan is required to be submitted on or before December 31st of the year following the year in which you meet the filing threshold. For example, if in calendar year 2012 your facility “used 10,000 pounds of a toxic substance,” a Plan would be due to ADEQ-P2 by December 31, 2013. All Sections of the Plan must be completed. Q Is there a standard Pollution Prevention form to use? A Yes. The ADEQ-P2 Plan forms are contained in the ADEQ Plan Guidance document and at : http://www.azdeq.gov/environ/waste/p2/download/p2_plan_forms.doc The statutes specify the elements that must be included and the forms follow those requirements. Q How will the Plan be reviewed and then approved? A Your Plan will be reviewed and checked by ADEQ staff to ensure that it meets the statutory requirements. If your Plan is not complete, ADEQ will contact you by phone, e-mail or with a letter that will outline the areas that need to be completed for acceptance. If your Plan is approved, ADEQ will accept it. Important Note: You should begin implementing your Plan goals prior to ADEQ acceptance in accordance with your Plan implementation schedule. Q What type of reduction is required? A The Plan shall include specific performance goals for the prevention of pollution. The Plan must include a goal for the facility and may include goals for individual processes. Facilities can establish their own specific goals based upon their knowledge of their processes and their efforts on pollution prevention. ADEQ expects facilities to challenge themselves in setting goals. A facility will not be penalized for setting ambitious goals when a good faith effort is made to achieve them. Q What if I am writing one report for multiple sites? A If you have multiple sites, you are allowed under the pollution prevention statute to develop single Plan, also called an “umbrella” Plan. You must complete Part I of the ADEQ P2 form for each facility or site covered by the Plan. Q What will be done with all the information provided in the Plan? A The goals and technologies used to achieve reductions are compiled into a database and then periodically summarized into categories for ADEQ use and reported into the National P2
P2 Tools
96
Results Data System (facility names are not used). Q What is a Toxic Data Report? A The state pollution prevention statutes refer to a “Toxic Data Report” which is a collection of several documents. A Toxic Data Report is due each July 1st and includes: 1) An annual Progress Report showing goal status. 2) A copy of the Toxic Chemical Release Inventory Report - EPA’s Form R or Form A Note: ADEQ now receives these electronically from the EPA so facilities do not need to provide one to ADEQ. and; 3) A Plan Amendment (If your Plan expired or you need to update or add goals.) Q When are Progress Reports due? A The annual Progress Report is due on July 1st of each year to show your goal status. Progress Reports consist of a cover sheet and a status update for each goal in Section 7 (until after that goal is reported as complete). ADEQ has instructions for completing Progress Reports. Q When and how do I amend my Plan to keep it active? A A Plan remains active if the Plan time frame has not expired, goals are still being implemented and initial reduction measurements are in progress. Once the Plan time frame has expired and your facility still meets filing thresholds, then a new Plan or an Amendment must be submitted by no later than July 1st of the following year. For example, if your Plan expires on December 31, 2013, then you must submit an Amendment by July 1, 2014. Q How long do I need an active Pollution Prevention Plan? A A facility can be removed from the Program if the facility ceases operation, or if the facility has determined that all of the following statements are true for two consecutive years: A. Toxic Chemical Release Inventory Form: The facility was not required to file a Toxic Release Inventory Form (TRI). B. Hazardous Waste Generation: The facility 1) did not generate an average of one kilogram per month of acutely hazardous waste (40 CFR, Part 261) or an average of 1,000 kilograms per month of hazardous waste in a calendar year, for the past two consecutive years, exclusive of an episodic, accidental or remediation related release or occurrence, and, 2) did not manufacture or process more than 25,000 pounds of a toxic substance or otherwise use more than 10,000 pounds of a toxic substance in the previous calendar year. (ARS §49−962.B). C. Toxic Substance Use: The facility did not use in excess of 10,000 pounds of a toxic substance during the previous calendar year.
P2 Tools
97
Q What does a facility need to submit to become inactive in ADEQ’s Pollution Prevention Program? A A facility should request in writing to be removed from the program because it no longer meets the filing thresholds or it has ceased manufacturing operations. The letter should include the reason and the date the thresholds were no longer being met. If the facility ceased manufacturing operations, the letter should contain the date the facility stopped operating. Q What does the term “use” mean? A The definition of the term “use” in relation to the Toxic Chemical Release Inventory Report, is clearly defined by EPA in their reporting instructions. However, the Arizona statutes do not explicitly define the term “use” in the context of the threshold that requires a facility “that uses 10,000 pounds of a toxic substance” to file a Pollution Prevention Plan. For the purposes of this definition only, “use” is considered to be “any activity where a toxic substance is consumed, spent or disposed or is potentially or actually released to the environment.” Several exemptions have been recognized including for example: use as a structural component of a facility, such as structural metal beams containing toxic metals, chrome fixtures or copper plumbing; use in routine janitorial or facility grounds maintenance; personal use by employees or other persons, use of toxic chemicals contained in intake air or intake water; storage, warehousing, repackaging, distribution or sale of a toxic chemical, such as gas stations or chemical sales, except for portions released or disposed; production, processing or purchase of toxic chemicals specifically for sale or distribution outside the manufacturing facility; use of a closed item containing toxic chemicals (such as a transformer containing polychlorinated biphenyls (PCBs), chiller containing ammonia, or a battery containing lead) that does not release the toxic chemical during normal use. However, the subsequent replacement chemicals added to the item must be counted in the “use” threshold calculations; and use of toxic substances contained in fuels for vehicles or aircraft, such as gasoline or aviation fuel, except for portions released or disposed. Q What is a Toxic Substance? A The “toxic substances” in the Pollution Prevention Program (as defined in ARS §49-961) are the chemicals found in the Emergency Planning and Community Right-to-Know Act (EPCRA), Section 313 (TRI Chemicals). A list of these chemicals is available at: http://www.epa.gov/tri/trichemicals/index.htm TRI chemicals can be added and delisted each year by the U.S. Environmental Protection Agency. Q Will the Plan be kept confidential? A No. The Department shall make all Plans, Progress Reports, associated documents and correspondence available to the public. Do not include any confidential information.
P2 Tools
98
Q Can a facility file an Environmental Management System (EMS) in place of a P2 Plan? A. No. The facility still needs to file a P2 Plan per statute. However, the plan can have the one goal to develop an EMS. An Annual Toxic Data Report is still required, which will include an annual P2 Progress Report on P2 goal progress. Conformance with the EMS model does not necessarily result in P2 performance. Consider developing a P2 focused EMS that has outcomes based on P2 solutions rather than based just on regulatory compliance.
99
References 1. Arizona Revised Statutes, Title 49, Article 4, Pollution Prevention 2. Waste Minimization Opportunity Assessment Manual, EPA/625/7-88/003, July 1998 3 Facility Pollution Prevention Guide, EPA/600/R-92/088, May 1992 4. EPA Federal Facility Pollution Prevention Guide, EPA 300-B-94-012, November 1994 5. An Organizational Guide to Pollution Prevention, EPA/625/R/01/003, August 2001 6. Guide to Industrial Pollution Prevention and Energy Efficiency (EPA/625/R-99/003), June 2001 7. Integrated Environmental Management Systems Implementation Guide (EPA 744-R-00- 011), October 2000 http://www.epa.gov/dfe/pubs/iems/iems_guide/ 8. An Introduction to Environmental Cost Accounting as a Business Management Tool (EPA 742-R-95-001), June 1995 [http://www.epa.gov/opptintr/acctg/pubs/busmgt.pdf] 9. Pollution Prevention Information Clearinghouse (PPIC) http://www.epa.gov/opptintr/library/ppicdist.htm#Gen
Pollution Prevention Resources on the Internet 1. The Western Sustainability Pollution Prevention Network (WSPPNTM) is a strategic alliance involving local, state, federal and tribal pollution prevention (P2) programs throughout EPA Region 9, which includes the states of California, Nevada, Arizona, Hawaii, the Tribal Lands and the Trust Territories of Guam and American Samoa. WSPPN was established in 1997 by the U.S. Environmental Protection Agency to improve communication and information dissemination among network members to maximize efficiency of P2 implementation. WSPPN is a proud member of the Pollution Prevention Resource Exchange (P2RxTM), http://www.p2rx.org/index.cfm a national network of eight centers providing pollution prevention information, networking opportunities and other services to States, local governments and technical assistance providers in their region. http://wsppn.org/ 2. The Pollution Prevention Resource Exchange is a national network of regional information centers: NEWMOA (Northeast), WRRC (Southeast), GLRPPR (Great Lakes), Zero Waste Network (Southwest), P2RIC (Plains), Peaks to Prairies (Mountain), WSPPN (Pacific Southwest), PPRC (Northwest). http://www.p2rx.org/home.cfm