Embed Size (px)
Citation preview
274
Pollution is defined as unfavourable alteration of our surroundings. Water is
an essential commodity for survival. It has the property to dissolve many substances
in it, therefore it can easily get polluted. High concentration of heavy metals in
surface water generally associated with industrial discharges. According to the World
Health Organization (WHO), the metals of most immediate concern are Aluminium,
Chromium, Iron, Cobalt, Copper, Nickel, Cadmium & Mercury1.
Water pollution has focused the attention of both the scientific community and
the public on environmental problems. It not only affects the health and welfare of
people and organisms, but it also damages vegetation and properties2
According to Mason3 there are five major types of toxic pollutants known to man:
1) Metals arising from industrial processes and some agricultural application
(lead, copper, nickel and zinc)
2) Organic compounds, originating from industrial, agricultural and some
domestic sources (herbicides, PCB's, organochloride pesticides, chlorinated
aliphatic hydrocarbons, organometallic compounds and phenols)
3) Gases (ammonia and chlorine)
4) Anions ( cyanides, fluorides, sulphides and sulphites)
5) Acids and alkalis
Amongst the pollutants contaminating water bodies, metals play an important
role 4.
Metals are elements found naturally in aquatic ecosystems due to various
processes such as weathering and erosion5. Some of these metals are essential to
living organisms in trace amounts (for example copper and zinc). Essential trace
elements have a narrow optimal concentration range for growth and reproduction,
both in excess and shortage can be detrimental to organisms6 with unusually high
concentrations becoming toxic to aquatic organisms7. Metals are present in very low
concentrations in natural aquatic ecosystems8 usually at the nanogram to microgram
per liter level, but recently the occurrence of especially heavy metals in excess of
natural loads, has become an increasing concern9-10 for aquatic ecosystem 'health'.
Heavy metals are part of a group of elements, whose hydrochemical cycles have been
accelerated to a great extent by man5. The most important heavy metals in water
pollution are zinc, copper, lead, cadmium, mercury, nickel and chromium5,11-12.
Metals are introduced into the environment by a wide range of natural and
275
anthropogenic sources7 and with anthropogenic being either domestic or industrial.
Heavy metals are often present at elevated concentrations in aquatic ecosystems, due
to
1) the rapid growth in population9-12,
2) an increase in industrialization6,9
3) the increase of urbanization and socio- economic activities, exploration and
exploitation of natural resources,
4) extension of irrigation and other modern agricultural practices, as well as
5) the lack of environmental regulations9.
Consequently aquatic organisms are exposed to the elevated levels of metals6,
levels not previously encountered8, posing a great threat to aquatic organisms in
particular, and to the whole ecosystem in general13-14.
An accelerated release of heavy metals into the aquatic environment poses
serious water pollution problems because of their toxicity15 persistence and
bioaccumulation in food chains16. Due to their adverse effects on aquatic ecosystems,
it is important to identify the sources and measure the discharges of heavy metals into
systems nationwide9. Metals and pesticides, in particular, have an inclination to
accumulate and undergo food chain magnification17. It is thus also important to
monitor the bioaccumulation of these metals in a system, in order to assess the
possible impact on human health (fish consumed) and organism health (exposure to a
pollutant or consumption by predators)18. Despite progress made in environmental
waste management, heavy metals still pose immense health hazards to humans and
biota. Metal pollution is an important worldwide problem, which is growing at an
alarming rate.4 Unlike other classes of pollutants, which can be biodegraded and
destroyed completely, metals are non-biodegradable7 and can neither be created nor
destroyed. However, these metals might be altered into more toxic forms or
complexed to more stable and less toxic compounds5. In an aquatic environment metal
toxicity can be influenced by various a biotic environmental factors such as oxygen,
calcium/water hardness19-21, pH and temperature5,18-20
Contamination of aquatic ecosystems with heavy metals should be monitored and
controlled21. Ecosystems are examined for heavy metal pollution by using chemical or
biological assays. Chemical measurements of heavy metals in water, although
sensitive, not provide bioavailability information of the metals22.
276
The random discharge of various wastes, pollute most ecosystems and affect
survival and physiological activities of organisms in these systems17. In natural
waters, metal ions occur as free aqueous ions, complexes with organic/inorganic
ligands or adsorbed onto the surfaces of particles23 and most metals are taken up in the
ionic form18. Free metal ions cause more serious damaging effects on aquatic
organisms than their more complex forms17. The duration of exposure of a specific
concentration of toxin can influence whether it will kill an aquatic organism19.
Nickel toxicity to aquatic life depends on the species, pH, water hardness and
other environmental factors27. According to Nebeker28, nickel has been shown as
moderately toxic to fish and aquatic invertebrates when compared to other metals.
The tolerance limit of Nickel in drinking water is 0.01mg/L beyond this limit it can
cause lung's, nose and bone cancer. It's poisining can cause deziness, headache,
nausia and vomitting, chest pain, dry cough and shortness of drug, rapid respiration
and extreme weakness, therefore, it is neccessary to remove Nickel (II) from waste
water before releasing it in to streams26.
Copper is an essential trace element to plants, animals and even humans29. It is
in fact a required element for all living organisms, and although the absolute
concentration of copper is usually low in nature, it occurs in adequate quantities for
growth in all aquatic environments30.
In animals, copper is important for bone formation, maintenance of myclin within the
nervous system, synthesis of haemoglobin, a component of key metalloenzymes, plus
it forms an important part of cytochrome oxidase and assorted other enzymes
involved in redox reactions in cells31,32. It is essential for cellular metabolism, where
its concentration is well regulated5 but becomes toxic at elevated levels. Iron (III) is
also toxic at higher concentration.
Dissolved oxygen, hardness, temperature, pH, and chelating agents can
increase the toxicity [Cu2+]8. Organic and inorganic substances can easily complex the
cupric form of copper, which is the most common speciation of this metal and it's then
adsorbed on to particulate matter. Therefore, the free ion is rarely found except in
pure acidic soft water33. The chemical speciation of copper strongly depends on the
pH of water, copper in water, precipitates at high pH (alkaline) and is thus not toxic,
whilst at low pH (acidic) it is mobile, soluble and toxic8.
277
Chromium are generally found into predominant forms as trivalent and
hexavalent state in industrial waste waters. Cr (VI) is hazardous than Cr(III) in
biological activities. The permiscible limit for Cr (VI) in drinking water is 0.05 ppm34
beyond this limit it affects the human health causes skin rashes upsets stomach,
creates respiratory problems weaken immune system, damages kidney and liver alters
genetic material, creates lung cancer and even leads to death36.
In recent years, increasing awareness of the environmental impact of heavy
metals has promoted a demand for the purification of industrial wastewaters prior to
discharge into natural waters. This has led to the introduction of more strict legislation
to control water pollution, such as the National Environmental Quality Standards37.
In advanced countries, removal of heavy metals in wastewater is normally
achieved by advance technologies such as ion exchange, chemical precipitation. Ultra
filtration, or electrochemical deposition do not seem to be economically feasible for
such industries because of their relatively high costs. Therefore, there is a need to look
into alternatives to investigate a low-cost method, which is effective and economic.
Recently a great deal of interest in the research for removal of heavy metals
from industrial elements have focused on to use of vegetable waste, agricultural by
products and also building waste material as adsorbents. They have been recognised
as an emerging technique for the de-pollution of heavy metal polluted streams38-39, as
the vegetable waste, agricultural by products building waste material are capable of
binding heavy metals by adsorption, chelation and ion exchange40-42.
In the present work, we have carried out the adsorption studies of the heavy
metal ions like Copper, Nickel, Iron and Chromium onto the easily available cut
material (building waste material) of Marble (M), Red Kotta (R), Kadappa (K) and
Granite (G) available from the units where cutting process of it was carried out at
negligible cost. The powder were collected processed and finally used as adsorbents
for the removal of these metal ions.
Literature survey reveals that the work carried by different researchers36-37
showed the effective and efficient adsorbative capacity of adsorbent after treatment
with acid. It gave us an idea whether acid treated MRKG can work and give good
adsorption results. Surprisingly acid treated MRKG showed encouraging results of
adsorption of metal ions from solution. It appears acid treatment of adsorbent increase
278
surface porosity, surface area, surface activity and surface roughness. The observation
also corroborated by the studies of acid treatment on bentonite and soil 43-44.
The adsorption efficiency depends on interfacial tension between metal ion
and MRKG and surface activity of the adsorbent. The water binding forces become
lower after the acid treatment and may increase the hydrophobacity of the adsorbent
surface45. Overall this situation may be helping easy diffusion of metal ions towards
the surface and increase in surface activity resulting into higher adsorption. In other
sense, as the metal ion solution coming in contact with surface of adsorbent, initially
the intermolecular forces of metal ion and surface of the adsorbent are strong and may
weaken towards saturation. This phenomenon also confirmed from 'L' type Giles
isotherm and also based on kinetic and thermodynamic parameters suggest a weak
chemi- adsorption. The present study aimed at to find the effect of treatment of
adsorbent with mineral acids viz H2SO4. As acid treatment creates an ideal condition
for facile adsorption of metal ions to the surface.
4.1 Effect of pH
The removal of metal ions from aqueous solution as the latter effects the
surface is related to the pH of the solution degree of ionisation and the species of
adsorbate41.
Quek et.al46 during their work showed the removal of metals by sago waste
which decreased with decrease in pH of the solution. The solution of optimum pH
value was taken into consideration during the work to avoid precipitation of metals at
higher pH value and which defeat the purpose of employing adsorption47-48.
According to Mohammod et.al49 pH 5 maximizes the exposure of negative
sites of the adsorbents through dissolution of more protons and thus enhances the
adsorption capacities as the surface oxide functions as ligands for metal ions while
adsorption is attributed solely to chemical interaction namely inner-sphere
complexation. The adsorption of metals found to be strongly dependent on the pH of
the solution demonstrates that the optimum pH for the adsorption of Cu, Pb were
about 5 which was rather acidic50 .
At low pH (<3) there was excessive protonation of the active sites at carbon
surface and this often refuses the formation of links between metal ions and the active
site. At moderate pH & values (3-6) linked H+ is released from active sites and
279
adsorbed amount of metal ions is generally found to be increase. At higher pH values
(>6) the precipitation is dominant or both ion exchange and aqueous metal hydroxide
formation (not necessarily precipitation ) may become significant mechanism in the
metal removal process this condition is often not desirable as the metal precipitation
could lead to a misunderstanding for the adsorption capacity. And in practice, metal
precipitation is generally not a stabilized form of heavy metal as the precipitation can
some time be very small in size and upon the neutralization of the effluents from the
waste water plant, the solubility of the metals increases resulting in a recontamination
of the waste outlet stream51. At low pH value the surface of the adsorbent would be
closely associated with hydronium ion (H3O+) which hinders the access of metal ions
by repulsive forces, to the surface functional groups, consequently decreasing the
percentage of metal removal.
In the present investigation the adsorption of Nickel, Copper, Iron and
Chromium carried on the surface MRKG as adsorbent by varying the pH and
keeping the initial concentration of adsorbate and amount of adsorbent constant. The
result are presented in Table No. 1.0.3, 2.0.3, 3.0.3, 4.0.3, 5.0.3, 6.0.3, 7.0.3 and 8.0.3
for Nickel Table Nos 1.1.3, 2.1.3, 3.1.3, 4.1.3, 5.1.3, 6.1.3, 7.1.3 and 8.1.3 for Copper
Table Nos. 1.2.3, 2.2.3, 3.2.3, 4.2.3, 5.2.3, 6.2.3, 7.2.3 and 8.2.3 and for Iron Table
Nos. 1.3.3, 2.3.3, 3.3.3, 4.3.3, 5.3.3, 6.3.3, 7.3.3 and 8.3.3 for Chromium and the
Summarised adsorbed values are presented in short in the tabular form.
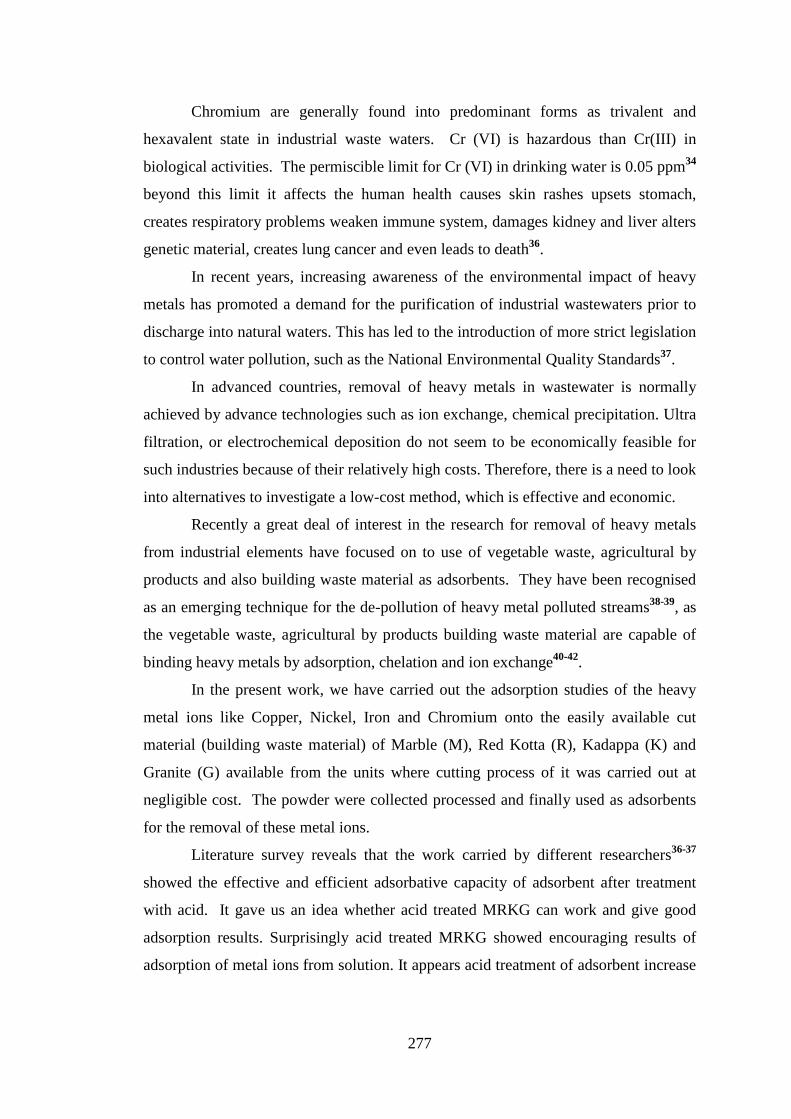
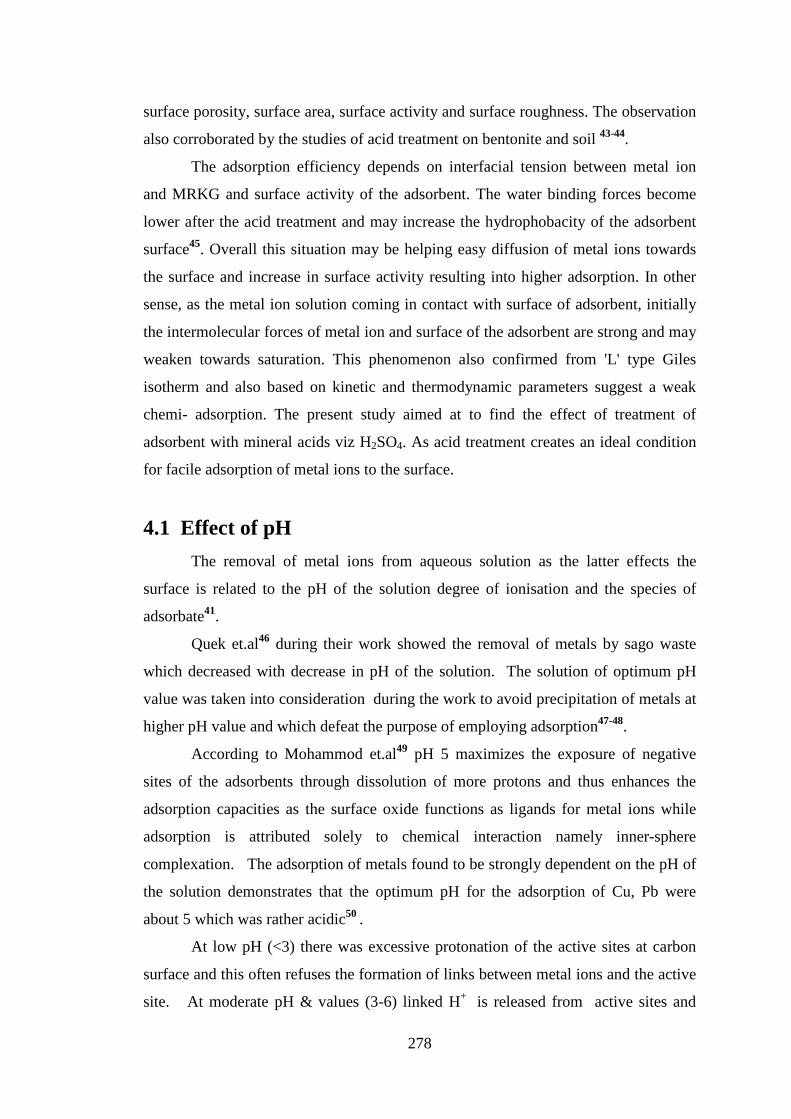
The adsorption capacities at varying pH (2-7) showed increase in adsorption of
metal ions as shown in figure 4.1.1 (A),(B) to 4.1.4(A),(B) and our findings are in
good agreement with singh et.al58.
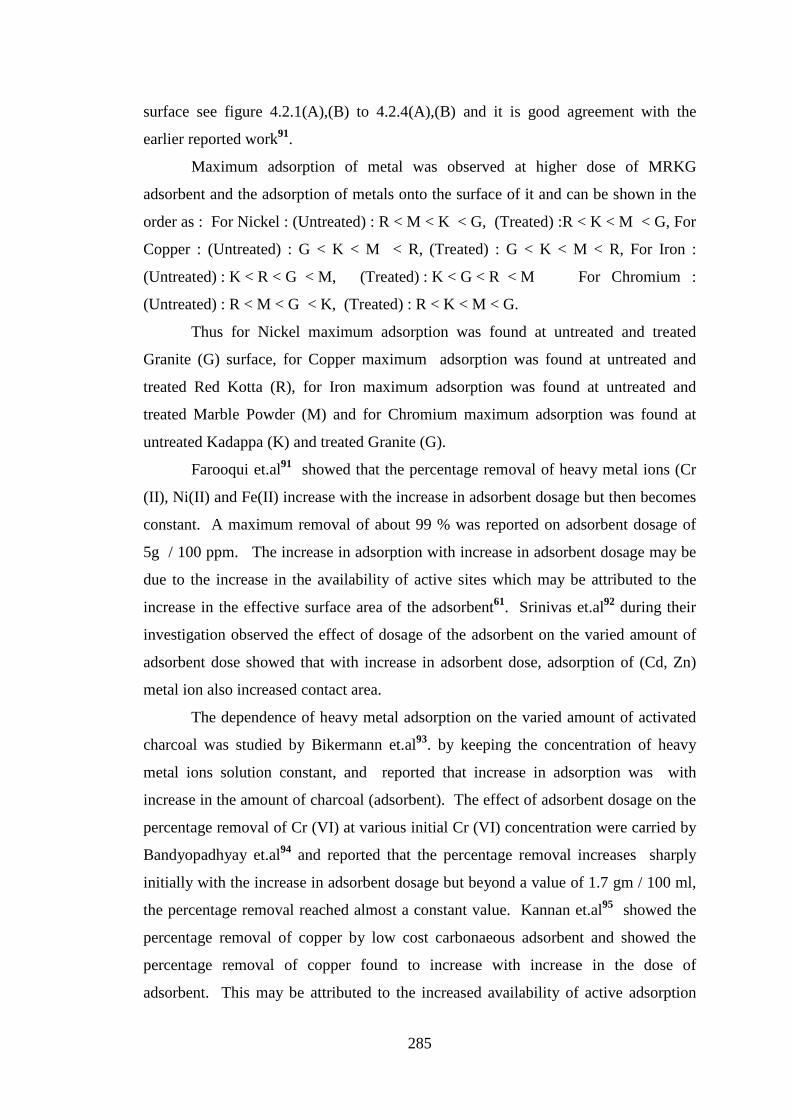
Fig. 4.1.1(A) : Effect of pH on Adsorption of Untreated Marble Powder (M)
Fig. 4.1.1(B) : Effect of pH on Adsorption of Treated Marble Powder (M)
280
Poor adsorption of metal ions at lower pH is apparent due to the higher
concentration of H+ ions present in the reaction mixture which compete with the M2+
ions during ion-exchange reaction on adsorbent. Further at higher pH the decrease in
adsorption may attributed to the formation of soluble complexes. 58-59
The removal of heavy metal by adsorption has been reported to be
significantly affected by the solution60-61. The solution pH plays a vital role in the
removal of heavy metals as the acidity of solution pH is one the most important
parameters controlling the uptake of heavy metals from wastewater and aqueous
solution.62
According to Najua et.al62 the uptake and percentage removal of copper from
the aqueous solution strongly affected by the pH of the solution which was in strong
Fig. 4.1.2(A) : Effect of pH on Adsorption of Untreated Red Kotta (R)
Fig. 4.1.2(B) : Effect of pH on Adsorption of Treated Red Kotta (R)
Fig. 4.1.3(A) : Effect of pH on Adsorption of Untreated Kadappa (K)
Fig. 4.1.3(B) : Effect of pH on Adsorption of Treated Kadappa (K)
Fig. 4.1.4(A) : Effect of pH on Adsorption of Untreated Granite (G)
Fig. 4.1.4(B) : Effect of pH on Adsorption of Treated Granite (G)
281
agreement with Kannan et.al60-61. The uptake of copper increased from 0.11 mg/g to
1.20 mg/g when the pH increased from pH=2 with 0.96 mg/g and 1.07 mg/g
adsorption capacity at pH=5 respectively, after that the capacity of adsorption
decreases slightly in pH range of 6 to 9.
The minimum adsorption observed at low pH (pH 2) may be due to the fact
that the higher concentration and higher mobility of H+ ions present favoured the
preferential adsorption of hydrogen ions compared to Cu (II) ions.63 It would be
plausible to suggest that at lower pH value, the surface of the adsorbent is surrounded
by hydronium ions (H3O+) thereby preventing the metal ions from approaching the
binding sites of the adsorbent64, thus at higher H+ concentration, the biosorbent
surface becomes more positively charged and the attraction between biomass and
metal cations gets reduced65 In contrast, as the pH increases, more negatively charged
surface becomes available thus facilitating greater copper removal. It is commonly
agreed that the adsorption of metal cations increases with increasing pH as the ionic
species become less stable in the solution.
However, at higher pH values (pH 6, pH 7, pH 8 and pH 9) there is a decrease
in the adsorption capacity. This is due to the occurrence of copper precipitation. At
pH 6 there are three species present in solution as suggested by Elliot et.al66. Cu2+ ion
in very small quantities and Cu(OH)+ and Cu(OH)2 in large quantities. Three species
are adsorbed at the surface of adsorbent by ion exchange mechanism with the
functional groups present in adsorbent or by hydrogen bonding67. The removal of
metal ions increases with increase in pH 6.0 to 10.0 even without adsorbent; this may
be due to the formation of metal hydroxide precipitation68-73.
According to Esmaeili et.al74 the pH of the aqueous solution is an important
controlling parameter in the adsorption process which is in good agreement with
Asmal et.al75 . The study of effect of pH on copper biosorption on activated carbon
was carried at room temperature by varying the pH of copper solution. The uptake of
copper (II) showed an increase with an increase in pH from 1.0 to 4.0. The lowest
uptake at higher pH value was probably due to the formation of anionic hydroxide
complexes. The effect at higher pH values may be attributed to the ligands such as
carboxylate and sulfonate groups could uptake fewer metal ions76.
Obh et.al77 showed that sour-sop seeds had a decrease in the adsorption rate for
Cu2+ and Zn2+ ions and an increase in the adsorption rate of Pb2+ and Ni2+ ions, when
282
the pH of the synthetic waste water was between the value of 5 and 7. When
alkalinity increased that is from pH value of 7 to 9 there was further decrease in the
rate of adsorption by Sour-sop seeds for Cu2+, Zn2+, Pb2+ and Ni2+ ions in the synthetic
waste water. Results showed highest rate of adsorption by sour-sop seeds was 69 %
removal for Ni2+ ions in the synthetic waste water at pH vlue of 7. with increase in
pH from 5 to 9, the degree of protonation of the adsorbent functional group decreased
gradually and hence removal was decreased. A close relationship between the surface
basis of the adsorbents and the anions is evident, where the interaction between
oxygen free Lewis basic sites and the free electrons of anions, as well as the
electrostatic interactions between the anions and the protonated sites of the adsorbents
are the main adsorption mechanism78-80.
The effect of pH can be explained to the availability of negative charged
groups at the biosorbent surface and is necessary for the sorption of metals to
proceed81-82, which is at the highly acidic pH 2 is unlikely as there is a net positive
charge in the system due to H+ and H3O+. In such a system H+ complete with metal
ions51 resulting in a active sites to become protonated to the virtual exclusion of metal
binding on the adsorbent surface83-84 . i.e. at higher H+ concentration, the adsorbent
surface becomes more positively charged reducing the attraction between adsorbent
and metal cations84 In contrast, as the pH increases, more negatively charged surface
becomes available thus facilitating greater metal uptake85.
In our findings the adsorption of metals Nickel (II), Copper (II), Iron (III) and
Chromium (VI) on to the surface of MRKG adsorbent exhibit a drastic decrease in
metal affinity at low pH condition. pH of medium affects the solubility of metal ions
and ionization state of the functional groups86.
The increase in metal removal with increase in pH can be explained on the
basis of a decrease in comptition between proton (H+) and metal cations for the same
functional groups. The decrease in positive charge surface as pH increases would
result in lower electrostatic repulsion between the surface of adsorbent and metal
ions87.
In our present investigation activated carbon adsorbent acts as a negative
surface and attracts the positively charged metal ions. Generally the net positive
charge decreases with increasing pH value leads in the decrease in repulsion between
the adsorbent surface and metal ions and thus improving the adsorption capacity85 .
283
The efficiency of adsorption of metal ions on to the surface of treated MRKG was
found to be higher than when compared with untreated MRKG. The order of
adsorption of metal ions on to the surface of MRKG are enlisted below as
For Nickel : (Untreated) : K < M < R < G, (Treated) : R < K < M < G; For Copper :
(Untreated) : M < K < R < G, (Treated) : M < K < G < R; For Iron : (Untreated) : M
< G < K < R, (Treated) : K < G < R < M & For Chromium : (Untreated) : G < K <
R < M, (Treated) : G < K < M < R.
4.2 Effect of Variation in adsorbent dose
Adsorption process is affected by surface properties such as surface area and
polarity. A large specific surface area is preferable for providing large adsorption
capacity, but the creation of a large internal surface area in a limited volume
inevitably gives rise to large numbers of sized pores between adsorption surfaces88.
The size of micropores determines the accessibility of adsorbate molecules to the
adsorption surface. Therefore, pore size distribution of micropore is an important
property for adsorptivity of adsorbents89. The existence of macropores serves as
diffusion path of adsorbate molecules from outside the granule to the micropores in
fine powders and crystals and can be used to classify adsorbents88. These properties
are possessed both by conventional and non-conventional adsorbents and are capable
of removing heavy metals from solution. In addition non conventional adsorbents
contain cellulose which is made up of repeating units of D-glucose as a major
component of cell walls. The polar hydroxyl groups on the cellulose could be
involved in chemical reaction and hence bind heavy metals from solutions90.
In the present investigation the adsorption of metals Nickel (II),
Copper (II), Iron (III) and Chromium (IV) was carried out on the surface of different
amount (1g, 2g, 3g, 4g, and 5 g) of MRKG adsorbent at constant temperature
concentration of metals and are presented in Table No's 1.0.2, 2.0.2, 3.0.2, 4.0.2,
5.0.2, 6.0.2, 7.0.2 and 8.0.2 for adsorption of Nickel Table No's 1.1.2, 2.1.2, 3.1.2,
4.1.2, 5.1.2, 6.1.2, 7.1.2 and 8.1.2 for adsorption of Copper Table No's 1.2.2, 2.2.2,
3.2.2, 4.2.2, 5.2.2, 6.2.2, 7.2.2 and 8.2.2 for adsorption of Iron Table No's1.3.2,
2.3.2, 3.3.2, 4.3.2, 5.3.2, 6.3.2, 7.3.2 and 8.3.2 for adsorption of Chromium.
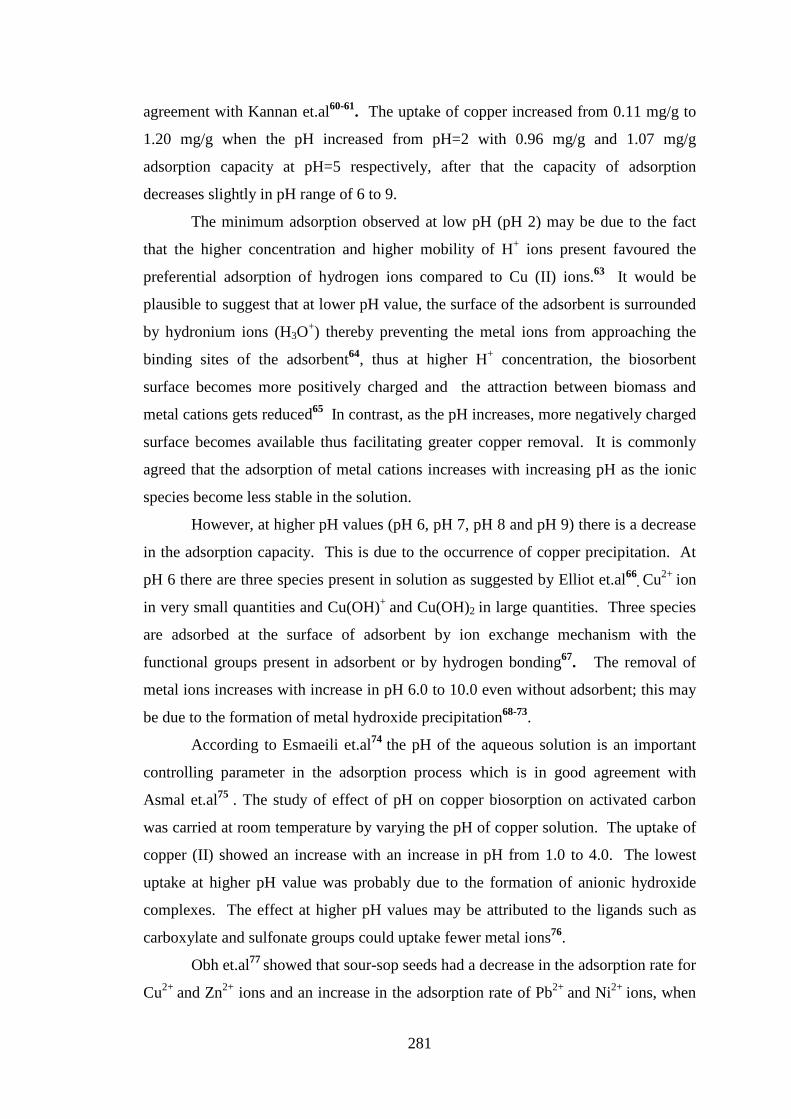
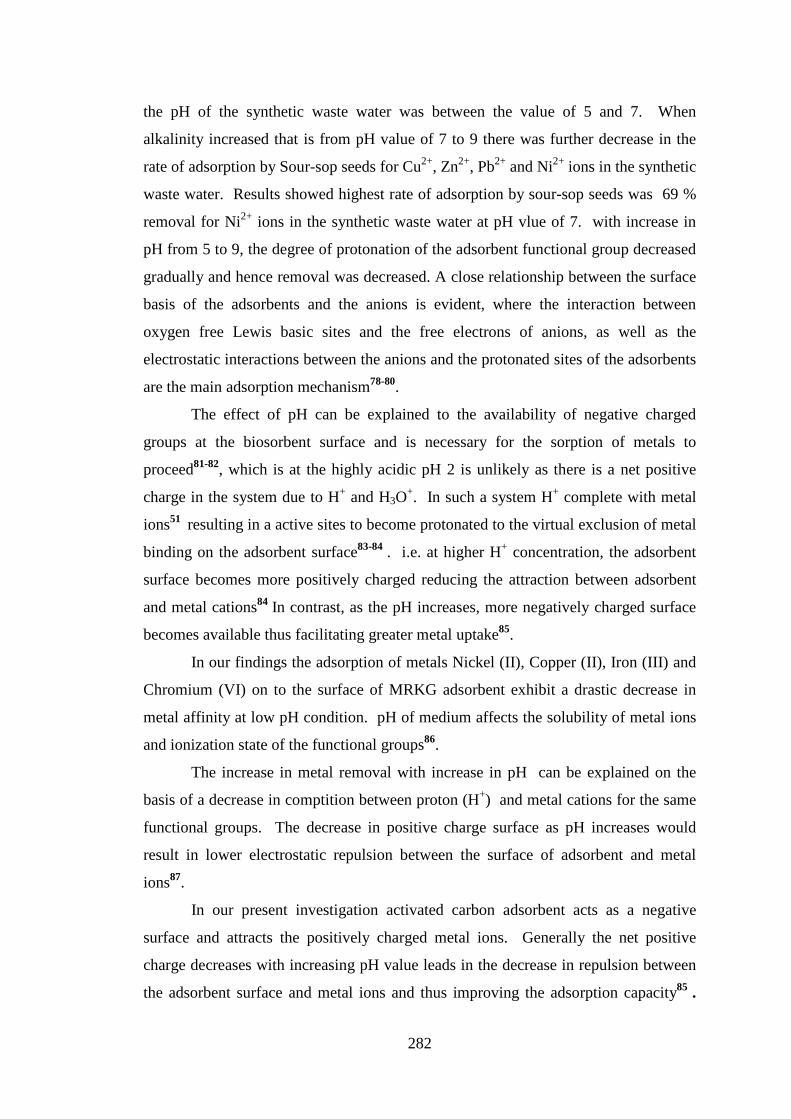
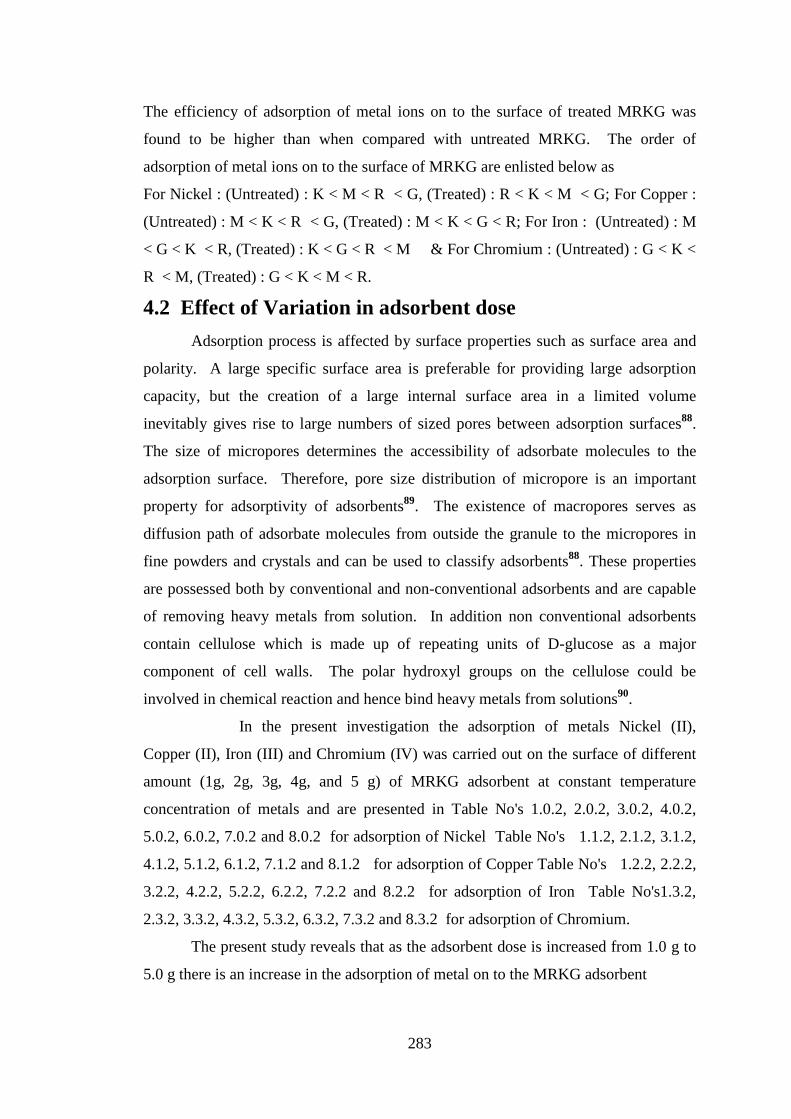
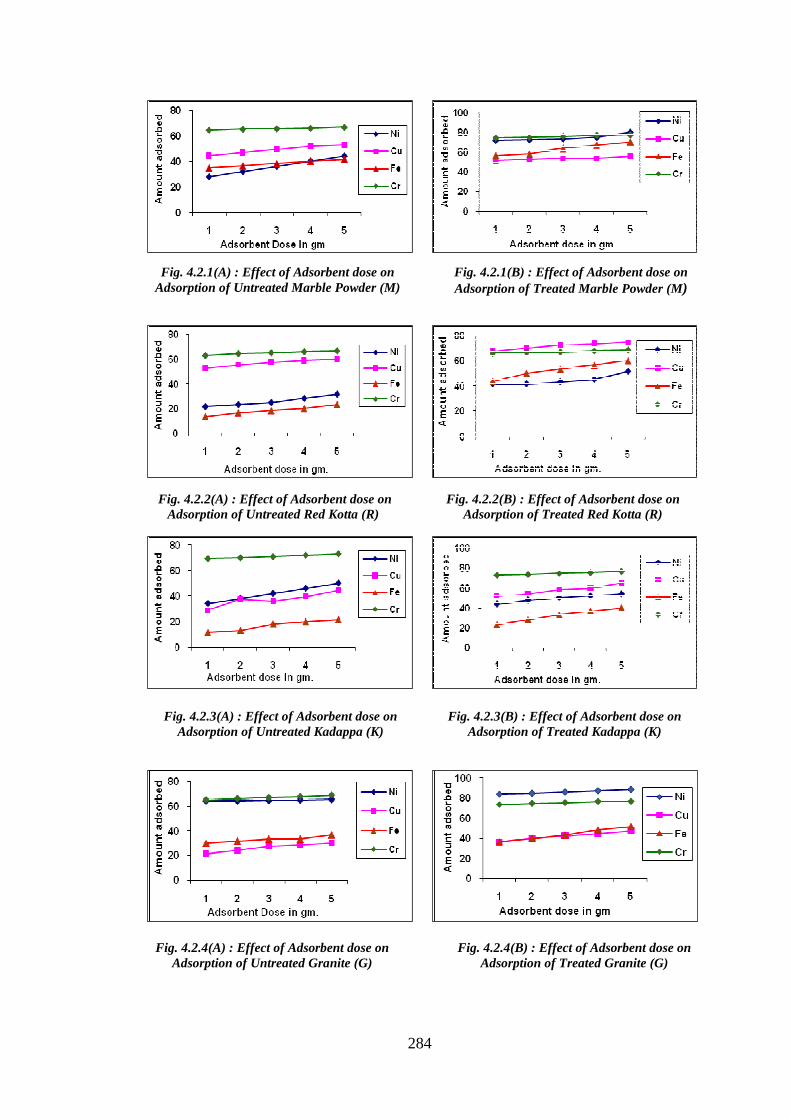
The present study reveals that as the adsorbent dose is increased from 1.0 g to
5.0 g there is an increase in the adsorption of metal on to the MRKG adsorbent
284
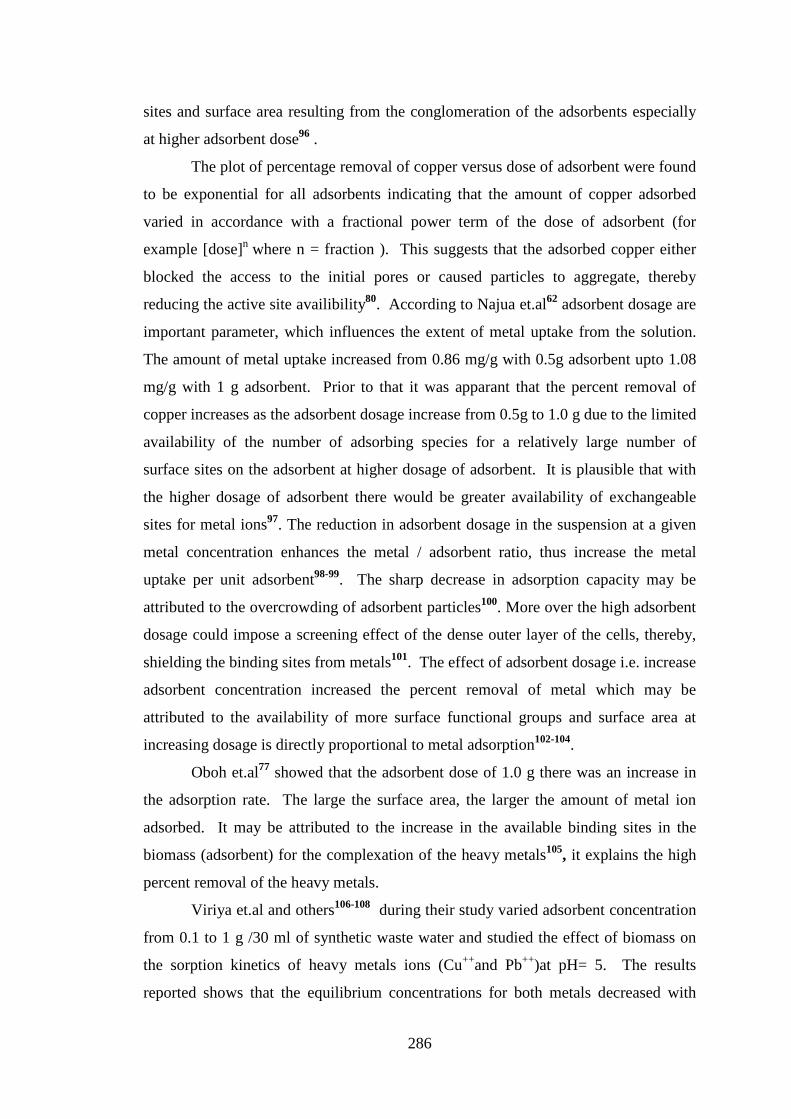
Fig. 4.2.1(A) : Effect of Adsorbent dose on Adsorption of Untreated Marble Powder (M)
Fig. 4.2.1(B) : Effect of Adsorbent dose on Adsorption of Treated Marble Powder (M)
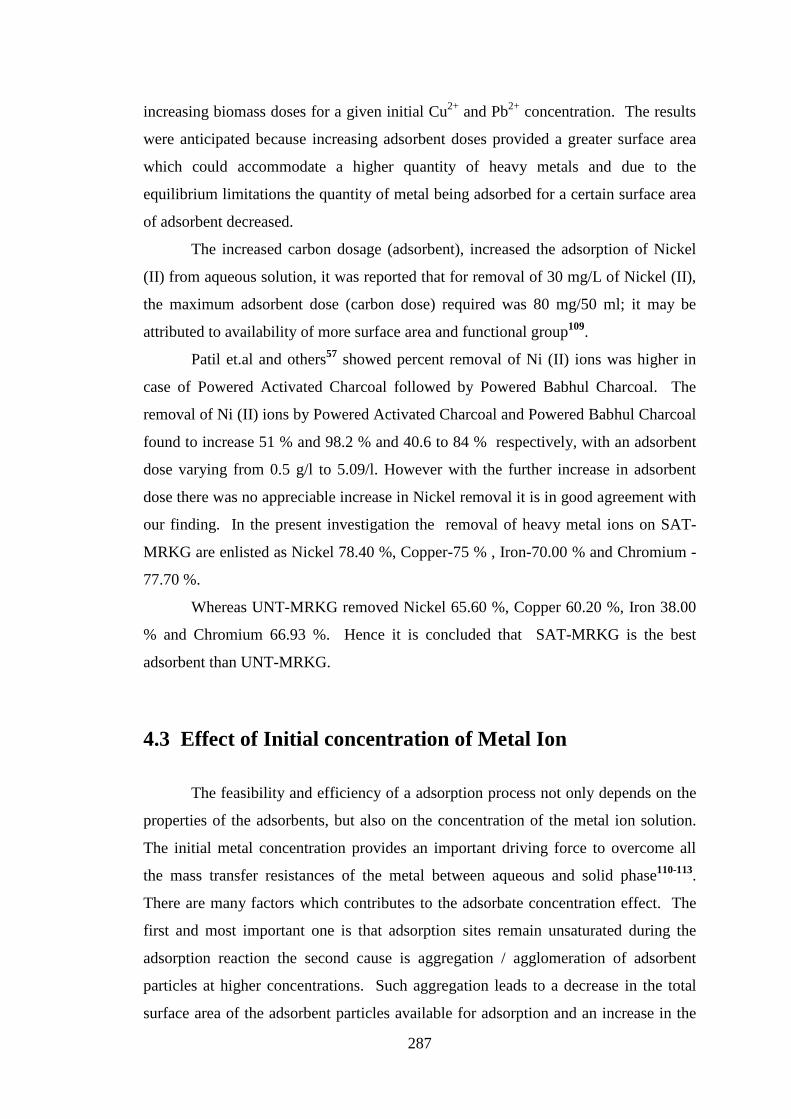
Fig. 4.2.2(A) : Effect of Adsorbent dose on Adsorption of Untreated Red Kotta (R)
Fig. 4.2.2(B) : Effect of Adsorbent dose on Adsorption of Treated Red Kotta (R)
Fig. 4.2.3(A) : Effect of Adsorbent dose on Adsorption of Untreated Kadappa (K)
Fig. 4.2.3(B) : Effect of Adsorbent dose on Adsorption of Treated Kadappa (K)
Fig. 4.2.4(A) : Effect of Adsorbent dose on Adsorption of Untreated Granite (G)
Fig. 4.2.4(B) : Effect of Adsorbent dose on Adsorption of Treated Granite (G)
285
surface see figure 4.2.1(A),(B) to 4.2.4(A),(B) and it is good agreement with the
earlier reported work91.
Maximum adsorption of metal was observed at higher dose of MRKG
adsorbent and the adsorption of metals onto the surface of it and can be shown in the
order as : For Nickel : (Untreated) : R < M < K < G, (Treated) :R < K < M < G, For
Copper : (Untreated) : G < K < M < R, (Treated) : G < K < M < R, For Iron :
(Untreated) : K < R < G < M, (Treated) : K < G < R < M For Chromium :
(Untreated) : R < M < G < K, (Treated) : R < K < M < G.
Thus for Nickel maximum adsorption was found at untreated and treated
Granite (G) surface, for Copper maximum adsorption was found at untreated and
treated Red Kotta (R), for Iron maximum adsorption was found at untreated and
treated Marble Powder (M) and for Chromium maximum adsorption was found at
untreated Kadappa (K) and treated Granite (G).
Farooqui et.al91 showed that the percentage removal of heavy metal ions (Cr
(II), Ni(II) and Fe(II) increase with the increase in adsorbent dosage but then becomes
constant. A maximum removal of about 99 % was reported on adsorbent dosage of
5g / 100 ppm. The increase in adsorption with increase in adsorbent dosage may be
due to the increase in the availability of active sites which may be attributed to the
increase in the effective surface area of the adsorbent61. Srinivas et.al92 during their
investigation observed the effect of dosage of the adsorbent on the varied amount of
adsorbent dose showed that with increase in adsorbent dose, adsorption of (Cd, Zn)
metal ion also increased contact area.
The dependence of heavy metal adsorption on the varied amount of activated
charcoal was studied by Bikermann et.al93. by keeping the concentration of heavy
metal ions solution constant, and reported that increase in adsorption was with
increase in the amount of charcoal (adsorbent). The effect of adsorbent dosage on the
percentage removal of Cr (VI) at various initial Cr (VI) concentration were carried by
Bandyopadhyay et.al94 and reported that the percentage removal increases sharply
initially with the increase in adsorbent dosage but beyond a value of 1.7 gm / 100 ml,
the percentage removal reached almost a constant value. Kannan et.al95 showed the
percentage removal of copper by low cost carbonaeous adsorbent and showed the
percentage removal of copper found to increase with increase in the dose of
adsorbent. This may be attributed to the increased availability of active adsorption
286
sites and surface area resulting from the conglomeration of the adsorbents especially
at higher adsorbent dose96 .
The plot of percentage removal of copper versus dose of adsorbent were found
to be exponential for all adsorbents indicating that the amount of copper adsorbed
varied in accordance with a fractional power term of the dose of adsorbent (for
example [dose]n where n = fraction ). This suggests that the adsorbed copper either
blocked the access to the initial pores or caused particles to aggregate, thereby
reducing the active site availibility80. According to Najua et.al62 adsorbent dosage are
important parameter, which influences the extent of metal uptake from the solution.
The amount of metal uptake increased from 0.86 mg/g with 0.5g adsorbent upto 1.08
mg/g with 1 g adsorbent. Prior to that it was apparant that the percent removal of
copper increases as the adsorbent dosage increase from 0.5g to 1.0 g due to the limited
availability of the number of adsorbing species for a relatively large number of
surface sites on the adsorbent at higher dosage of adsorbent. It is plausible that with
the higher dosage of adsorbent there would be greater availability of exchangeable
sites for metal ions97. The reduction in adsorbent dosage in the suspension at a given
metal concentration enhances the metal / adsorbent ratio, thus increase the metal
uptake per unit adsorbent98-99. The sharp decrease in adsorption capacity may be
attributed to the overcrowding of adsorbent particles100. More over the high adsorbent
dosage could impose a screening effect of the dense outer layer of the cells, thereby,
shielding the binding sites from metals101. The effect of adsorbent dosage i.e. increase
adsorbent concentration increased the percent removal of metal which may be
attributed to the availability of more surface functional groups and surface area at
increasing dosage is directly proportional to metal adsorption102-104.
Oboh et.al77 showed that the adsorbent dose of 1.0 g there was an increase in
the adsorption rate. The large the surface area, the larger the amount of metal ion
adsorbed. It may be attributed to the increase in the available binding sites in the
biomass (adsorbent) for the complexation of the heavy metals105, it explains the high
percent removal of the heavy metals.
Viriya et.al and others106-108 during their study varied adsorbent concentration
from 0.1 to 1 g /30 ml of synthetic waste water and studied the effect of biomass on
the sorption kinetics of heavy metals ions (Cu++and Pb++)at pH= 5. The results
reported shows that the equilibrium concentrations for both metals decreased with
287
increasing biomass doses for a given initial Cu2+ and Pb2+ concentration. The results
were anticipated because increasing adsorbent doses provided a greater surface area
which could accommodate a higher quantity of heavy metals and due to the
equilibrium limitations the quantity of metal being adsorbed for a certain surface area
of adsorbent decreased.
The increased carbon dosage (adsorbent), increased the adsorption of Nickel
(II) from aqueous solution, it was reported that for removal of 30 mg/L of Nickel (II),
the maximum adsorbent dose (carbon dose) required was 80 mg/50 ml; it may be
attributed to availability of more surface area and functional group109.
Patil et.al and others57 showed percent removal of Ni (II) ions was higher in
case of Powered Activated Charcoal followed by Powered Babhul Charcoal. The
removal of Ni (II) ions by Powered Activated Charcoal and Powered Babhul Charcoal
found to increase 51 % and 98.2 % and 40.6 to 84 % respectively, with an adsorbent
dose varying from 0.5 g/l to 5.09/l. However with the further increase in adsorbent
dose there was no appreciable increase in Nickel removal it is in good agreement with
our finding. In the present investigation the removal of heavy metal ions on SAT-
MRKG are enlisted as Nickel 78.40 %, Copper-75 % , Iron-70.00 % and Chromium -
77.70 %.
Whereas UNT-MRKG removed Nickel 65.60 %, Copper 60.20 %, Iron 38.00
% and Chromium 66.93 %. Hence it is concluded that SAT-MRKG is the best
adsorbent than UNT-MRKG.
4.3 Effect of Initial concentration of Metal Ion
The feasibility and efficiency of a adsorption process not only depends on the
properties of the adsorbents, but also on the concentration of the metal ion solution.
The initial metal concentration provides an important driving force to overcome all
the mass transfer resistances of the metal between aqueous and solid phase110-113.
There are many factors which contributes to the adsorbate concentration effect. The
first and most important one is that adsorption sites remain unsaturated during the
adsorption reaction the second cause is aggregation / agglomeration of adsorbent
particles at higher concentrations. Such aggregation leads to a decrease in the total
surface area of the adsorbent particles available for adsorption and an increase in the
288
diffusional path for adsorption and an increase in the diffusional path length114.
Addagalla et.al115 during their adsorption study of copper and Zinc, showed that
adsorption process was affected as the removal of heavy metals was stable and then
decreases with increase in the heavy metals concentration it may be attributed to
initial adsorption of metal ions fully at the active sites on adsorbent later on no free
sites available for adsorption.
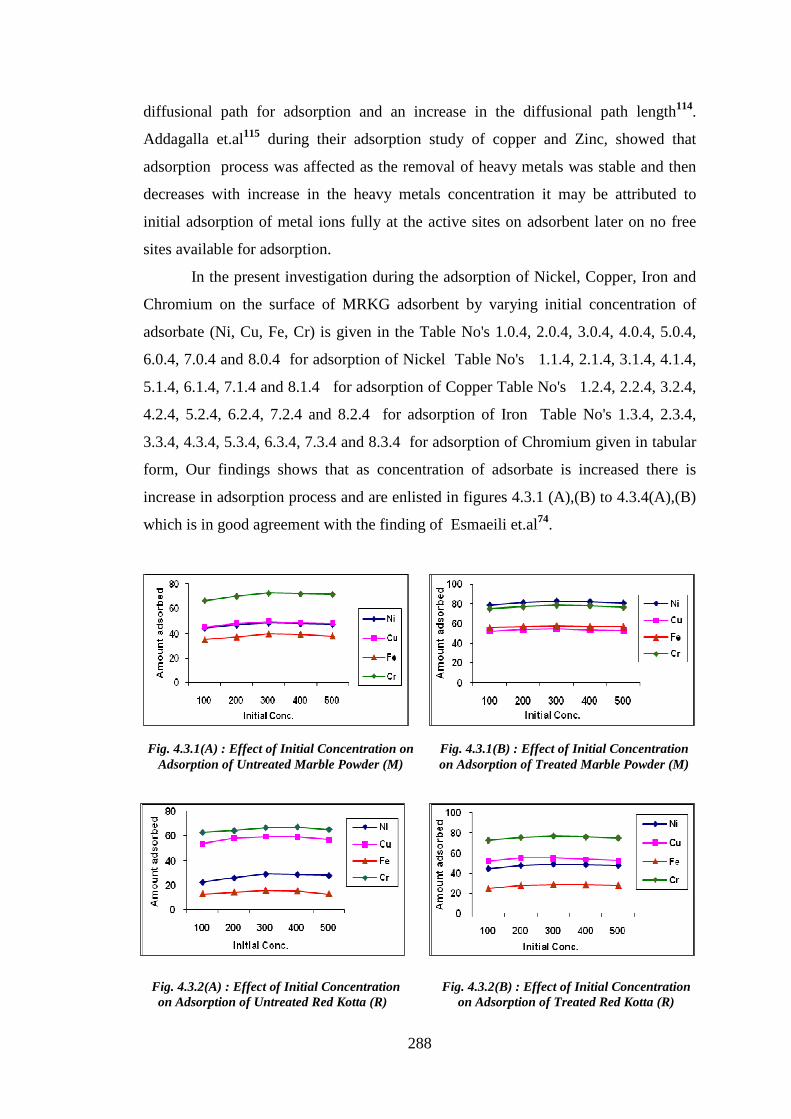
In the present investigation during the adsorption of Nickel, Copper, Iron and
Chromium on the surface of MRKG adsorbent by varying initial concentration of
adsorbate (Ni, Cu, Fe, Cr) is given in the Table No's 1.0.4, 2.0.4, 3.0.4, 4.0.4, 5.0.4,
6.0.4, 7.0.4 and 8.0.4 for adsorption of Nickel Table No's 1.1.4, 2.1.4, 3.1.4, 4.1.4,
5.1.4, 6.1.4, 7.1.4 and 8.1.4 for adsorption of Copper Table No's 1.2.4, 2.2.4, 3.2.4,
4.2.4, 5.2.4, 6.2.4, 7.2.4 and 8.2.4 for adsorption of Iron Table No's 1.3.4, 2.3.4,
3.3.4, 4.3.4, 5.3.4, 6.3.4, 7.3.4 and 8.3.4 for adsorption of Chromium given in tabular
form, Our findings shows that as concentration of adsorbate is increased there is
increase in adsorption process and are enlisted in figures 4.3.1 (A),(B) to 4.3.4(A),(B)
which is in good agreement with the finding of Esmaeili et.al74.
Fig. 4.3.1(A) : Effect of Initial Concentration on Adsorption of Untreated Marble Powder (M)
Fig. 4.3.1(B) : Effect of Initial Concentration on Adsorption of Treated Marble Powder (M)
Fig. 4.3.2(A) : Effect of Initial Concentration on Adsorption of Untreated Red Kotta (R)
Fig. 4.3.2(B) : Effect of Initial Concentration on Adsorption of Treated Red Kotta (R)
289
In a low solution concentration Sodium Chloride had little influence on the
adsorption capacity. At higher ionic strength the adsorption chromium of ion on
Babhul Bark Charcoal increased due to the partial neutralization of the positive charge
on the carbon surface and a consequent compression of the electrical double layer by
the Chloride anion. The chloride ion can also enhance adsorption of chromium ion
on Babhul Bark Charcoal by pairing of their charges and hence reducing the repulsion
between the chromium ions adsorbed on the surface69-71. This indicates carbon to
adsorb more of positive chromium ion.
Najua et.al62 during their investigation, showed that adsorption capacity of
Palmkernel adsorbent increased from 0.23 to 1.09 mg/g as the metal concentration
increases in the electrostatic interaction between the copper ions (adsorbate) and the
adsorbent active sites and it can be explained by the fact that more adsorption sites
were covered as the metal ion increases116. Beside higher initial concentration lead to
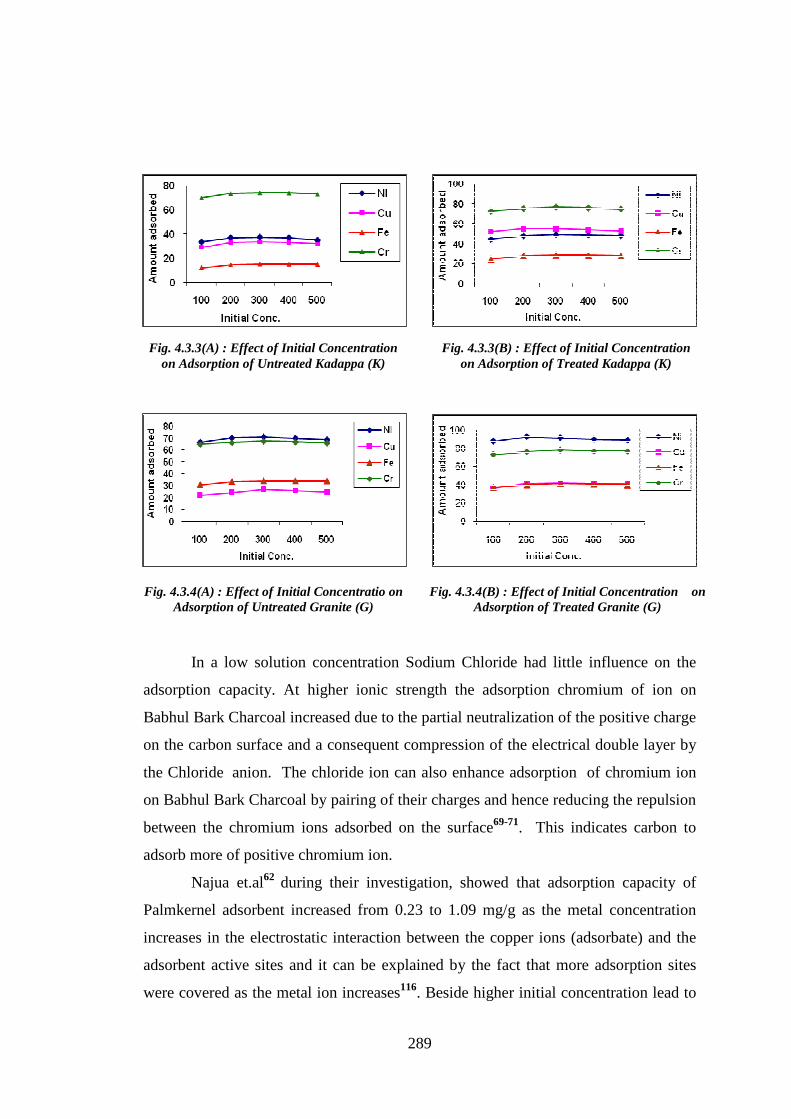
Fig. 4.3.3(A) : Effect of Initial Concentration on Adsorption of Untreated Kadappa (K)
Fig. 4.3.3(B) : Effect of Initial Concentration on Adsorption of Treated Kadappa (K)
Fig. 4.3.4(A) : Effect of Initial Concentratio on Adsorption of Untreated Granite (G)
Fig. 4.3.4(B) : Effect of Initial Concentration on Adsorption of Treated Granite (G)
290
an increase in the affinity of the copper ions towards the active sites117. The decline in
the adsorption capacity attributed to the availability of smaller number of surface sites
on the adsorbents for a relatively larger number of adsorbing species at higher
concentration81. It was in good agreement with the finding of Han et.al116 .
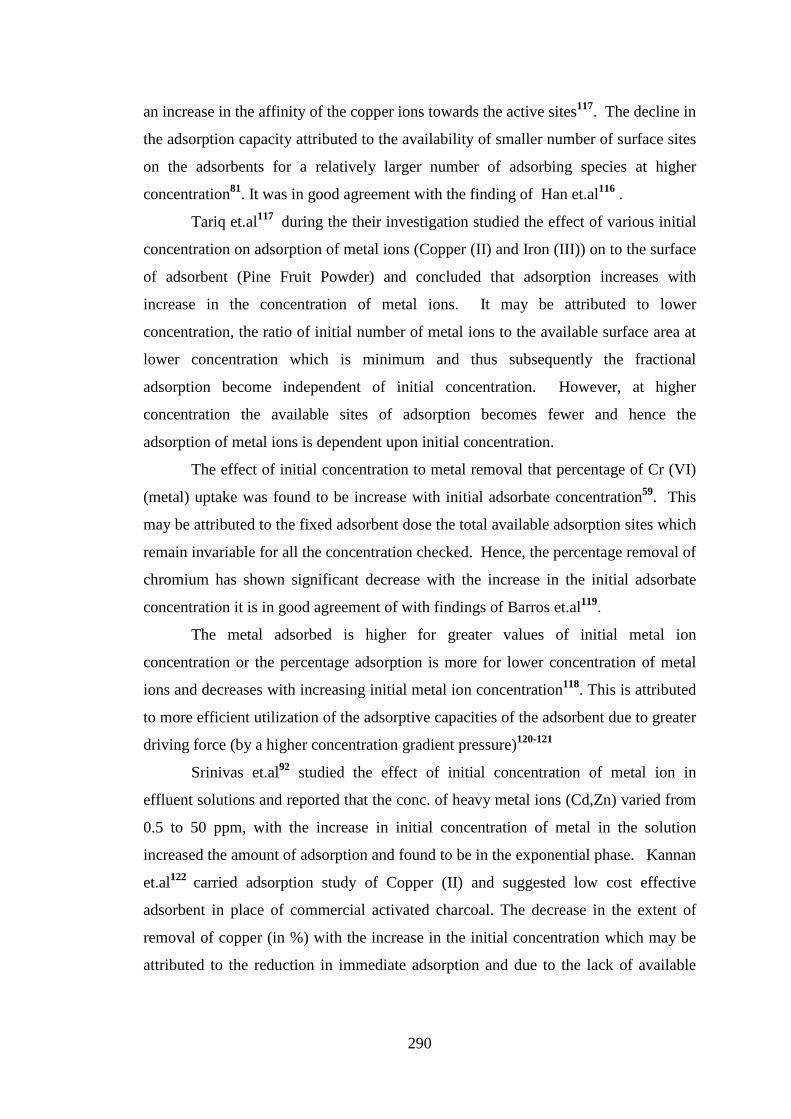
Tariq et.al117 during the their investigation studied the effect of various initial
concentration on adsorption of metal ions (Copper (II) and Iron (III)) on to the surface
of adsorbent (Pine Fruit Powder) and concluded that adsorption increases with
increase in the concentration of metal ions. It may be attributed to lower
concentration, the ratio of initial number of metal ions to the available surface area at
lower concentration which is minimum and thus subsequently the fractional
adsorption become independent of initial concentration. However, at higher
concentration the available sites of adsorption becomes fewer and hence the
adsorption of metal ions is dependent upon initial concentration.
The effect of initial concentration to metal removal that percentage of Cr (VI)
(metal) uptake was found to be increase with initial adsorbate concentration59. This
may be attributed to the fixed adsorbent dose the total available adsorption sites which
remain invariable for all the concentration checked. Hence, the percentage removal of
chromium has shown significant decrease with the increase in the initial adsorbate
concentration it is in good agreement of with findings of Barros et.al119.
The metal adsorbed is higher for greater values of initial metal ion
concentration or the percentage adsorption is more for lower concentration of metal
ions and decreases with increasing initial metal ion concentration118. This is attributed
to more efficient utilization of the adsorptive capacities of the adsorbent due to greater
driving force (by a higher concentration gradient pressure)120-121
Srinivas et.al92 studied the effect of initial concentration of metal ion in
effluent solutions and reported that the conc. of heavy metal ions (Cd,Zn) varied from
0.5 to 50 ppm, with the increase in initial concentration of metal in the solution
increased the amount of adsorption and found to be in the exponential phase. Kannan
et.al122 carried adsorption study of Copper (II) and suggested low cost effective
adsorbent in place of commercial activated charcoal. The decrease in the extent of
removal of copper (in %) with the increase in the initial concentration which may be
attributed to the reduction in immediate adsorption and due to the lack of available
291
active sites for the high initial concentration of copper similar results were also
reported by Ramprasad et.al123.
4.4 Effect of Contact Time
The adsorption process, contact time plays a vital role, irrespective of the
other, experimental parameters that affects the adsorption Kinetics124. The removal of
copper by adsorption on low cost carbonaceous adsorbents was found to be rapid at
the initial stage of contact time and then it becomes slow and stagnant with increase in
the contact time. A major proportion of the total copper removal may be attributed to
immediate solute adsoption on to the surface of adsorbent with subsequent slow
removal of the remaining amount of Copper125.
Oboh et.al126 during their adsorption study of Copper, Nickel, Zinc and Lead
showed that adsorption process gets affected as the percentage removal of metal ions
from synthetic waste water increases with time.
Madhavakrishnan et.al127 during their finding studied the effect of agitation
time on the percent removal of Ni (II) by Ricinus Communis Pericap Activated
Carbon (RCP) carbon and showed that the percent removal increase with increase in
agitation time and attains equlibrium within 70 min for all the concentration studied
(10mg./L to 40mg/L). The curves obtained were single, smooth and continous till the
saturation of Ni(II) on activated carbon surface.
The effect of agitation time on various concentration of Chromium solution
(25 to 125 mg/L) were carried by Dhanakumar et.al128 and reported that the removal
rate was rapid during first 10 minutes of agitation. Then the rate slowed down
gradually until it attained an equilibrium beyond which there was no significant
increase in the rate of removal.
In the present investigation during the adsorption of Nickel (II), Copper (II),
Iron (III) and Chromium (IV) on the surface of MRKG adsorbent by varying contact
time is given in the Table No.s 1.0.1, 2.0.1, 3.0.1, 4.0.1, 5.0.1, 6.0.1, 7.0.1 and 8.0.1
for adsorption of Nickel, Table No.s 1.1.1, 2.1.1, 3.1.1, 4.1.1, 5.1.1, 6.1.1, 7.1.1 and
8.1.1 for adsorption of Copper, Table No.s 1.2.1, 2.2.1, 3.2.1, 4.2.1, 5.2.1, 6.2.1, 7.2.1
and 8.2.1 for adsorption of Iron, Table No.s 1.3.1, 2.3.1, 3.3.1, 4.3.1, 5.3.1, 6.3.1,
7.3.1 and 8.3.1 for adsorption of Chromium given in tabular form as in Chapter 3.
292
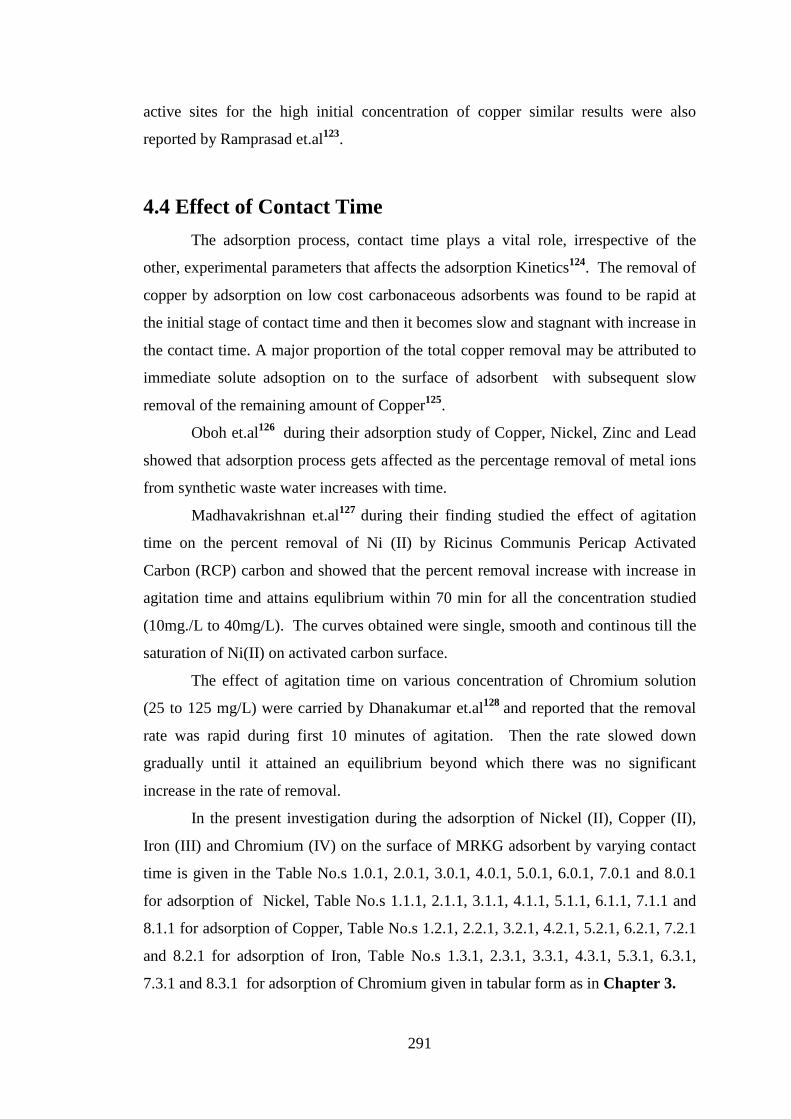
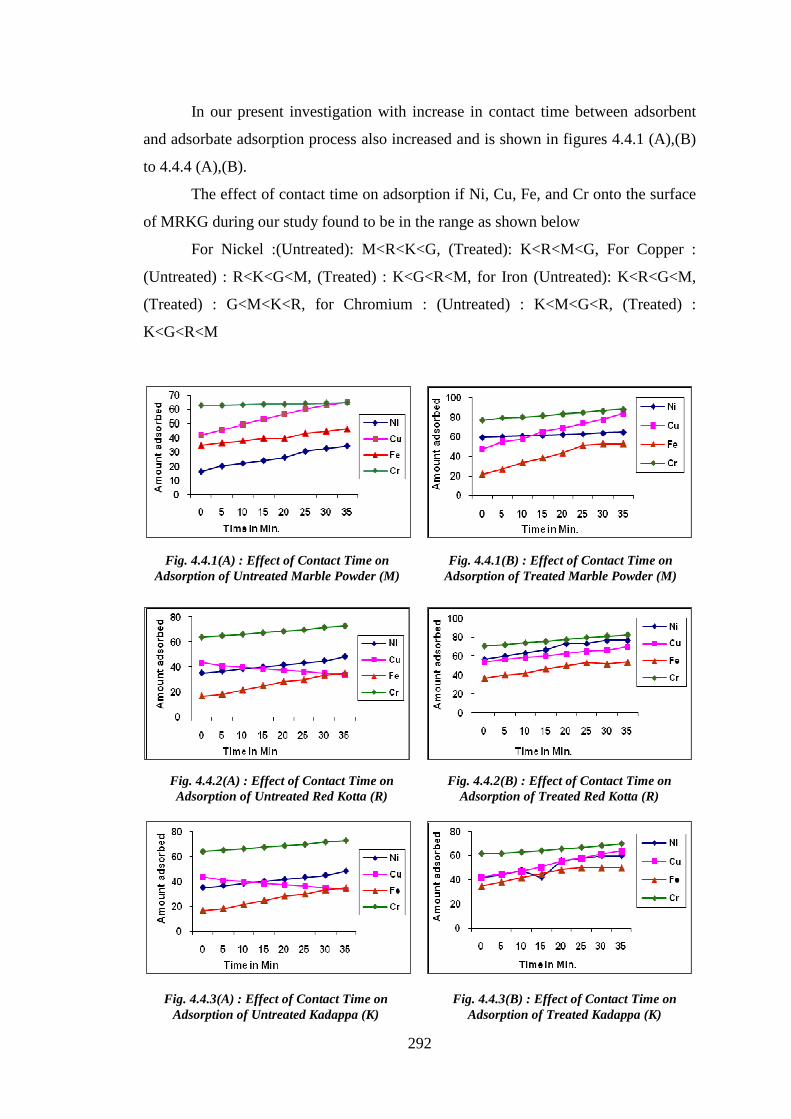
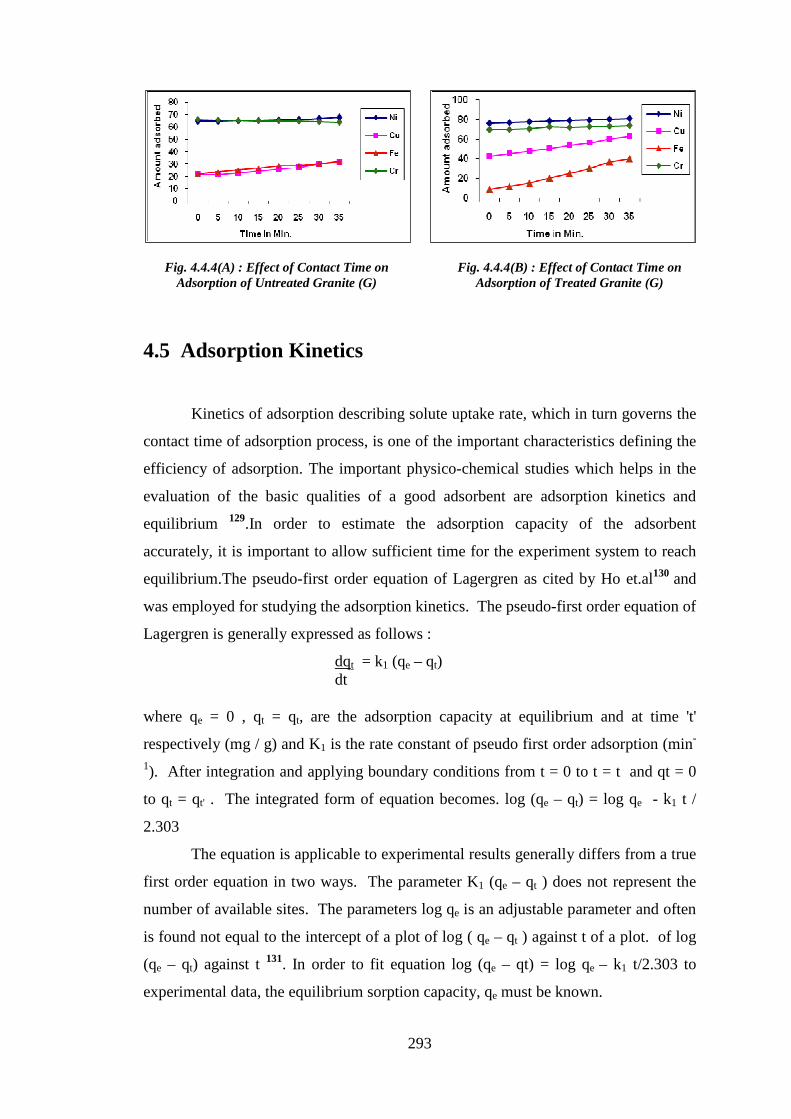
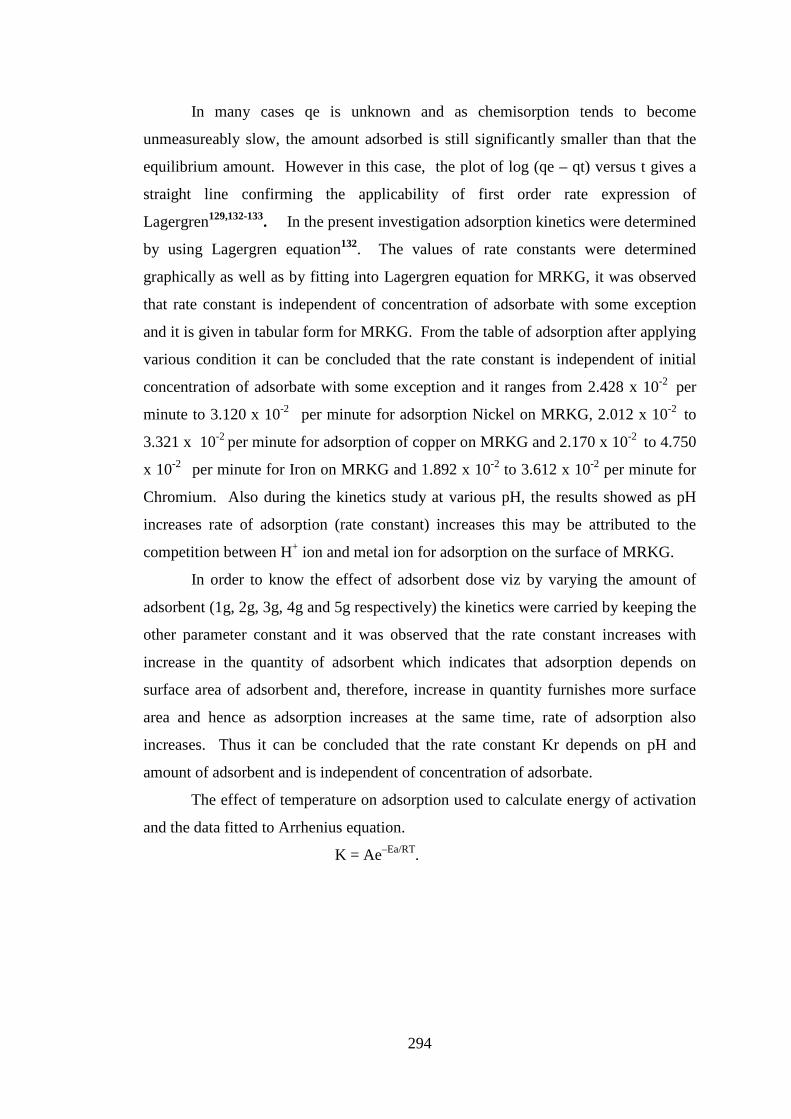
In our present investigation with increase in contact time between adsorbent
and adsorbate adsorption process also increased and is shown in figures 4.4.1 (A),(B)
to 4.4.4 (A),(B).
The effect of contact time on adsorption if Ni, Cu, Fe, and Cr onto the surface
of MRKG during our study found to be in the range as shown below
For Nickel :(Untreated): M<R<K<G, (Treated): K<R<M<G, For Copper :
(Untreated) : R<K<G<M, (Treated) : K<G<R<M, for Iron (Untreated): K<R<G<M,
(Treated) : G<M<K<R, for Chromium : (Untreated) : K<M<G<R, (Treated) :
K<G<R<M
Fig. 4.4.1(A) : Effect of Contact Time on Adsorption of Untreated Marble Powder (M)
Fig. 4.4.1(B) : Effect of Contact Time on Adsorption of Treated Marble Powder (M)
Fig. 4.4.2(A) : Effect of Contact Time on Adsorption of Untreated Red Kotta (R)
Fig. 4.4.2(B) : Effect of Contact Time on Adsorption of Treated Red Kotta (R)
Fig. 4.4.3(A) : Effect of Contact Time on Adsorption of Untreated Kadappa (K)
Fig. 4.4.3(B) : Effect of Contact Time on Adsorption of Treated Kadappa (K)
293
4.5 Adsorption Kinetics
Kinetics of adsorption describing solute uptake rate, which in turn governs the
contact time of adsorption process, is one of the important characteristics defining the
efficiency of adsorption. The important physico-chemical studies which helps in the
evaluation of the basic qualities of a good adsorbent are adsorption kinetics and
equilibrium 129.In order to estimate the adsorption capacity of the adsorbent
accurately, it is important to allow sufficient time for the experiment system to reach
equilibrium.The pseudo-first order equation of Lagergren as cited by Ho et.al130 and
was employed for studying the adsorption kinetics. The pseudo-first order equation of
Lagergren is generally expressed as follows :
dqt = k1 (qe – qt) dt
where qe = 0 , qt = qt, are the adsorption capacity at equilibrium and at time 't'
respectively (mg / g) and K1 is the rate constant of pseudo first order adsorption (min-
1). After integration and applying boundary conditions from t = 0 to t = t and qt = 0
to qt = qt' . The integrated form of equation becomes. log (qe – qt) = log qe - k1 t /
2.303
The equation is applicable to experimental results generally differs from a true
first order equation in two ways. The parameter K1 (qe – qt ) does not represent the
number of available sites. The parameters log qe is an adjustable parameter and often
is found not equal to the intercept of a plot of log ( qe – qt ) against t of a plot. of log
(qe – qt) against t 131. In order to fit equation log (qe – qt) = log qe – k1 t/2.303 to
experimental data, the equilibrium sorption capacity, qe must be known.
Fig. 4.4.4(A) : Effect of Contact Time on Adsorption of Untreated Granite (G)
Fig. 4.4.4(B) : Effect of Contact Time on Adsorption of Treated Granite (G)
294
In many cases qe is unknown and as chemisorption tends to become
unmeasureably slow, the amount adsorbed is still significantly smaller than that the
equilibrium amount. However in this case, the plot of log (qe – qt) versus t gives a
straight line confirming the applicability of first order rate expression of
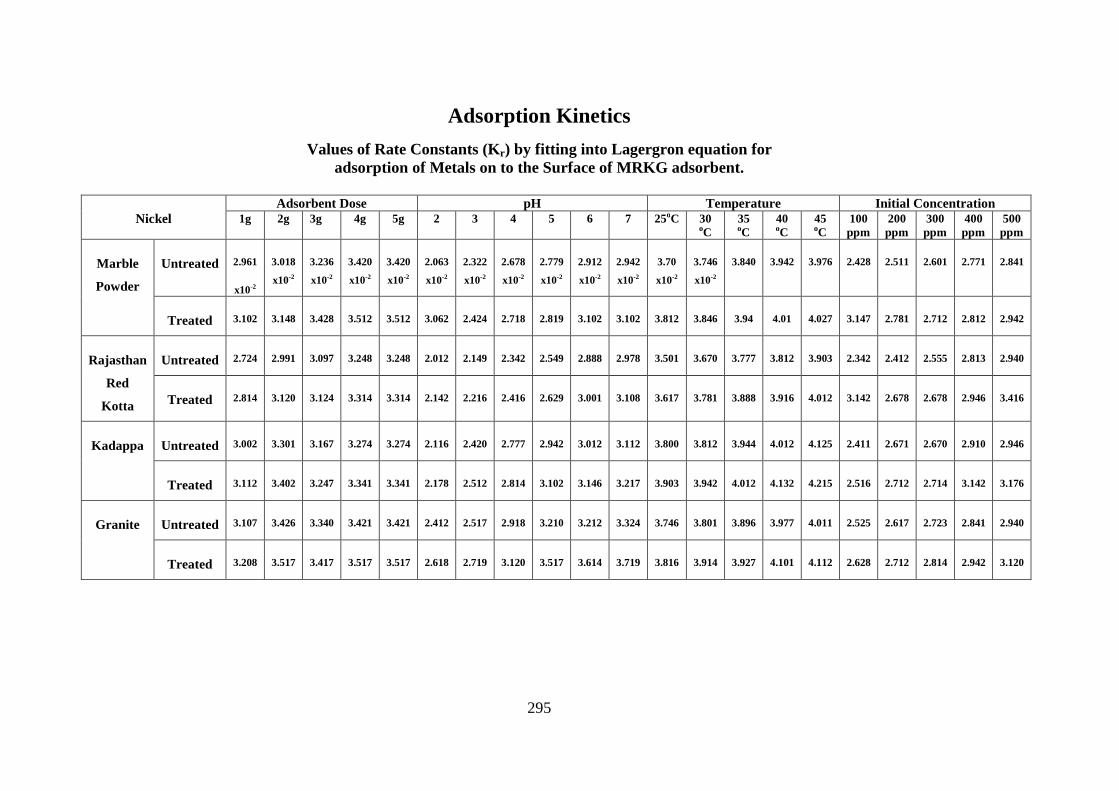
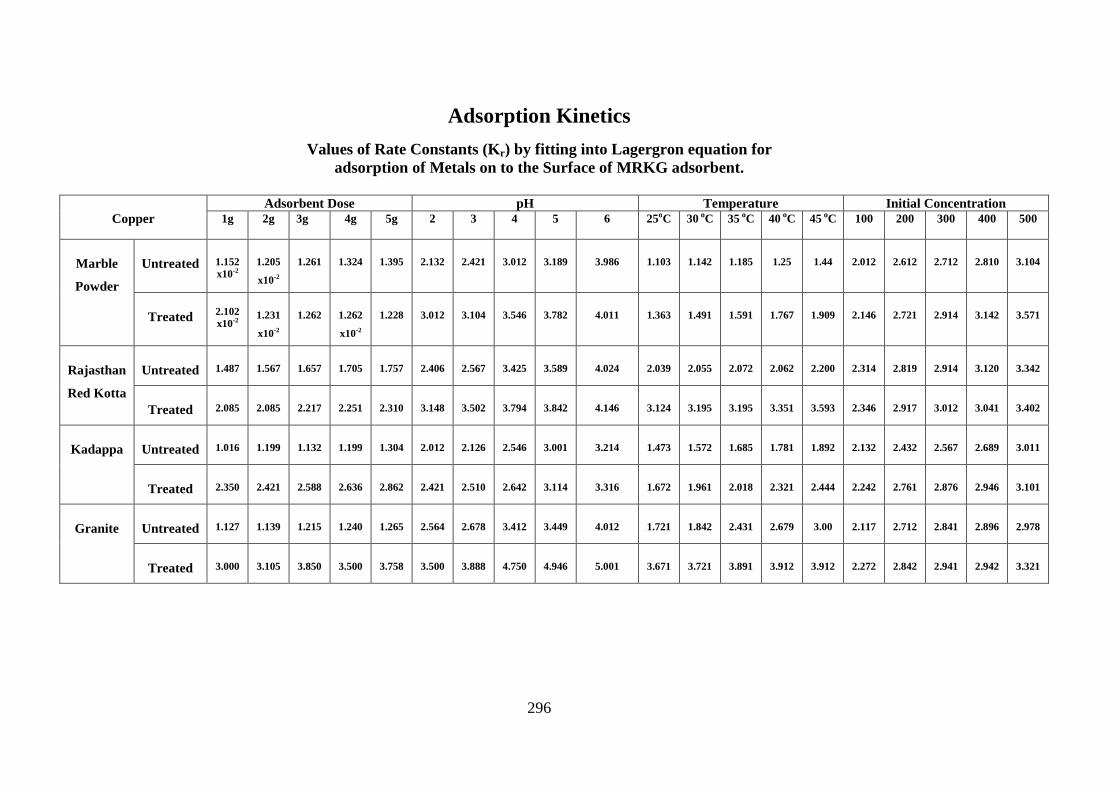
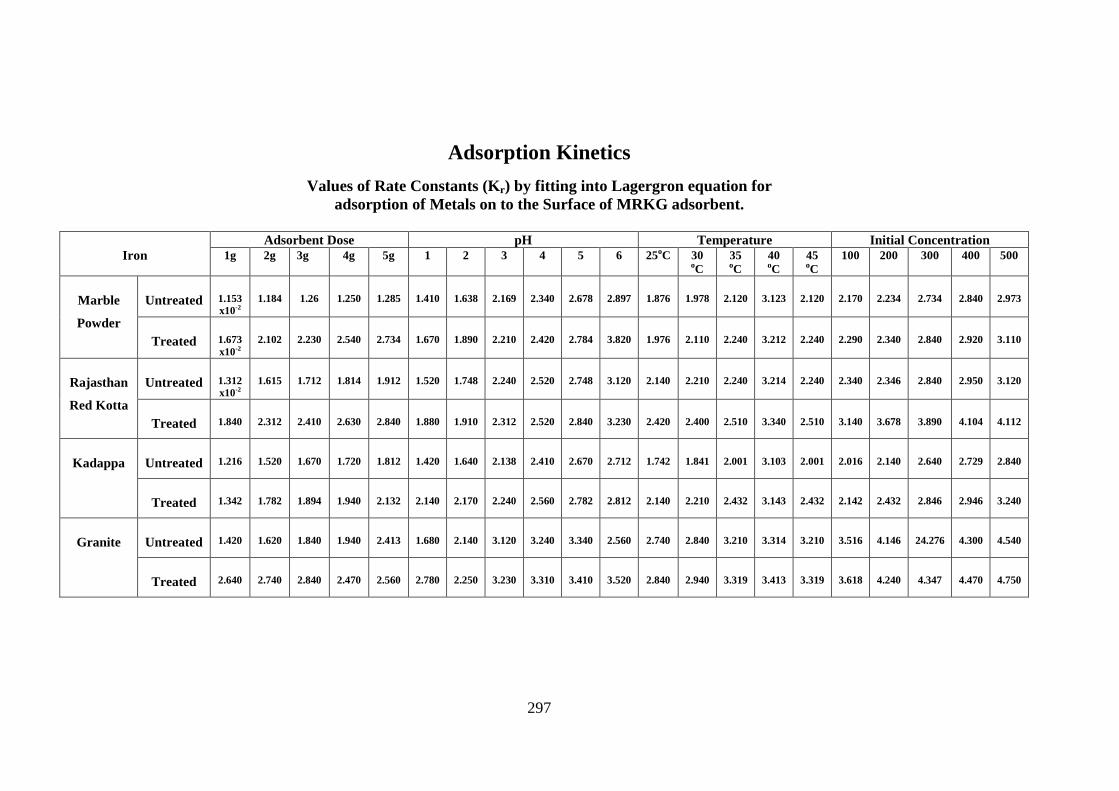
Lagergren129,132-133. In the present investigation adsorption kinetics were determined
by using Lagergren equation132. The values of rate constants were determined
graphically as well as by fitting into Lagergren equation for MRKG, it was observed
that rate constant is independent of concentration of adsorbate with some exception
and it is given in tabular form for MRKG. From the table of adsorption after applying
various condition it can be concluded that the rate constant is independent of initial
concentration of adsorbate with some exception and it ranges from 2.428 x 10⁻² per
minute to 3.120 x 10⁻² per minute for adsorption Nickel on MRKG, 2.012 x 10⁻² to
3.321 x 10⁻² per minute for adsorption of copper on MRKG and 2.170 x 10⁻² to 4.750
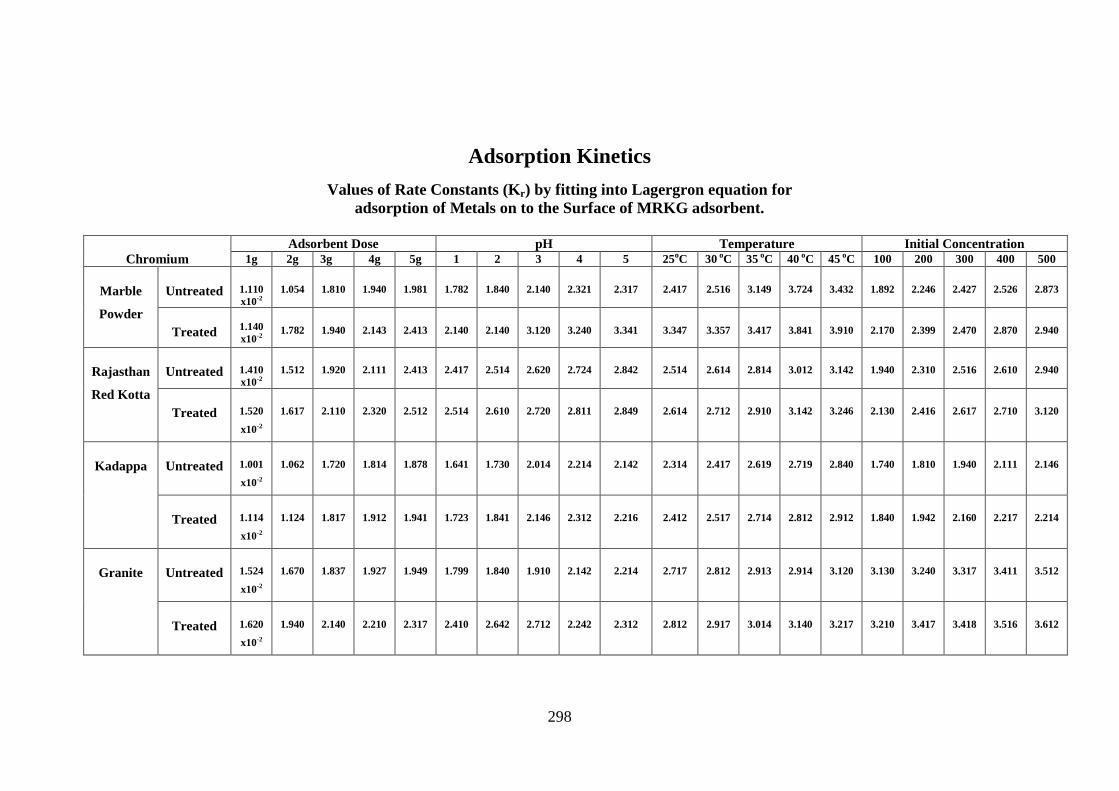
x 10-2 per minute for Iron on MRKG and 1.892 x 10⁻² to 3.612 x 10⁻² per minute for
Chromium. Also during the kinetics study at various pH, the results showed as pH
increases rate of adsorption (rate constant) increases this may be attributed to the
competition between H+ ion and metal ion for adsorption on the surface of MRKG.
In order to know the effect of adsorbent dose viz by varying the amount of
adsorbent (1g, 2g, 3g, 4g and 5g respectively) the kinetics were carried by keeping the
other parameter constant and it was observed that the rate constant increases with
increase in the quantity of adsorbent which indicates that adsorption depends on
surface area of adsorbent and, therefore, increase in quantity furnishes more surface
area and hence as adsorption increases at the same time, rate of adsorption also
increases. Thus it can be concluded that the rate constant Kr depends on pH and
amount of adsorbent and is independent of concentration of adsorbate.
The effect of temperature on adsorption used to calculate energy of activation
and the data fitted to Arrhenius equation.
K = Ae–Ea/RT.
295
Adsorption Kinetics
Values of Rate Constants (Kr) by fitting into Lagergron equation for adsorption of Metals on to the Surface of MRKG adsorbent.
Nickel Adsorbent Dose pH Temperature Initial Concentration
1g 2g 3g 4g 5g 2 3 4 5 6 7 25oC 30
oC 35
oC 40
oC 45
oC 100 ppm
200 ppm
300 ppm
400 ppm
500 ppm
Marble
Powder
Untreated 2.961
x10-2
3.018
x10-2
3.236
x10-2
3.420
x10-2
3.420
x10-2
2.063
x10-2
2.322
x10-2
2.678
x10-2
2.779
x10-2
2.912
x10-2
2.942
x10-2
3.70
x10-2
3.746
x10-2
3.840 3.942 3.976 2.428 2.511 2.601 2.771 2.841
Treated 3.102 3.148 3.428 3.512 3.512 3.062 2.424 2.718 2.819 3.102 3.102 3.812 3.846 3.94 4.01 4.027 3.147 2.781 2.712 2.812 2.942
Rajasthan
Red
Kotta
Untreated 2.724 2.991 3.097 3.248 3.248 2.012 2.149 2.342 2.549 2.888 2.978 3.501 3.670 3.777 3.812 3.903 2.342 2.412 2.555 2.813 2.940
Treated 2.814 3.120 3.124 3.314 3.314 2.142 2.216 2.416 2.629 3.001 3.108 3.617 3.781 3.888 3.916 4.012 3.142 2.678 2.678 2.946 3.416
Kadappa Untreated 3.002 3.301 3.167 3.274 3.274 2.116 2.420 2.777 2.942 3.012 3.112 3.800 3.812 3.944 4.012 4.125 2.411 2.671 2.670 2.910 2.946
Treated 3.112 3.402 3.247 3.341 3.341 2.178 2.512 2.814 3.102 3.146 3.217 3.903 3.942 4.012 4.132 4.215 2.516 2.712 2.714 3.142 3.176
Granite Untreated 3.107 3.426 3.340 3.421 3.421 2.412 2.517 2.918 3.210 3.212 3.324 3.746 3.801 3.896 3.977 4.011 2.525 2.617 2.723 2.841 2.940
Treated 3.208 3.517 3.417 3.517 3.517 2.618 2.719 3.120 3.517 3.614 3.719 3.816 3.914 3.927 4.101 4.112 2.628 2.712 2.814 2.942 3.120
296
Adsorption Kinetics
Values of Rate Constants (Kr) by fitting into Lagergron equation for adsorption of Metals on to the Surface of MRKG adsorbent.
Copper Adsorbent Dose pH Temperature Initial Concentration
1g 2g 3g 4g 5g 2 3 4 5 6
25oC 30 oC 35 oC 40 oC 45 oC 100 200 300 400 500
Marble
Powder
Untreated 1.152 x10⁻²
1.205
x10-2
1.261 1.324 1.395
2.132 2.421 3.012 3.189 3.986 1.103 1.142 1.185 1.25 1.44 2.012 2.612 2.712 2.810 3.104
Treated
2.102 x10⁻²
1.231
x10-2
1.262 1.262
x10-2
1.228 3.012 3.104 3.546 3.782 4.011 1.363 1.491 1.591 1.767 1.909 2.146 2.721 2.914 3.142 3.571
Rajasthan
Red Kotta
Untreated 1.487 1.567 1.657 1.705 1.757 2.406 2.567 3.425 3.589 4.024 2.039 2.055 2.072 2.062 2.200 2.314 2.819 2.914 3.120 3.342
Treated 2.085 2.085 2.217 2.251 2.310 3.148 3.502 3.794 3.842 4.146 3.124 3.195 3.195 3.351 3.593 2.346 2.917 3.012 3.041 3.402
Kadappa Untreated 1.016 1.199 1.132 1.199 1.304 2.012 2.126 2.546 3.001 3.214 1.473 1.572 1.685 1.781 1.892 2.132 2.432 2.567 2.689 3.011
Treated 2.350 2.421 2.588 2.636 2.862 2.421 2.510 2.642 3.114 3.316 1.672 1.961 2.018 2.321 2.444 2.242 2.761 2.876 2.946 3.101
Granite Untreated 1.127 1.139 1.215 1.240 1.265 2.564 2.678 3.412 3.449 4.012 1.721 1.842 2.431 2.679 3.00 2.117 2.712 2.841 2.896 2.978
Treated 3.000 3.105 3.850 3.500 3.758 3.500 3.888 4.750 4.946 5.001 3.671 3.721 3.891 3.912 3.912 2.272 2.842 2.941 2.942 3.321
297
Adsorption Kinetics
Values of Rate Constants (Kr) by fitting into Lagergron equation for adsorption of Metals on to the Surface of MRKG adsorbent.
Iron Adsorbent Dose pH Temperature Initial Concentration
1g 2g 3g 4g 5g 1 2 3 4 5 6 25oC 30
oC 35
oC 40
oC 45
oC 100 200 300 400 500
Marble
Powder
Untreated 1.153 x10⁻²
1.184 1.26 1.250 1.285 1.410 1.638 2.169 2.340 2.678 2.897 1.876 1.978 2.120 3.123 2.120 2.170 2.234 2.734 2.840 2.973
Treated 1.673 x10⁻²
2.102 2.230 2.540 2.734 1.670 1.890 2.210 2.420 2.784 3.820 1.976 2.110 2.240 3.212 2.240 2.290 2.340 2.840 2.920 3.110
Rajasthan
Red Kotta
Untreated 1.312 x10⁻²
1.615 1.712 1.814 1.912 1.520 1.748 2.240 2.520 2.748 3.120 2.140 2.210 2.240 3.214 2.240 2.340 2.346 2.840 2.950 3.120
Treated 1.840 2.312 2.410 2.630 2.840 1.880 1.910 2.312 2.520 2.840 3.230 2.420 2.400 2.510 3.340 2.510 3.140 3.678 3.890 4.104 4.112
Kadappa Untreated 1.216 1.520 1.670 1.720 1.812 1.420 1.640 2.138 2.410 2.670 2.712 1.742 1.841 2.001 3.103 2.001 2.016 2.140 2.640 2.729 2.840
Treated 1.342 1.782 1.894 1.940 2.132 2.140 2.170 2.240 2.560 2.782 2.812 2.140 2.210 2.432 3.143 2.432 2.142 2.432 2.846 2.946 3.240
Granite Untreated 1.420 1.620 1.840 1.940 2.413 1.680 2.140 3.120 3.240 3.340 2.560 2.740 2.840 3.210 3.314 3.210 3.516 4.146 24.276 4.300 4.540
Treated 2.640 2.740 2.840 2.470 2.560 2.780 2.250 3.230 3.310 3.410 3.520 2.840 2.940 3.319 3.413 3.319 3.618 4.240 4.347 4.470 4.750
298
Adsorption Kinetics
Values of Rate Constants (Kr) by fitting into Lagergron equation for adsorption of Metals on to the Surface of MRKG adsorbent.
Chromium Adsorbent Dose pH Temperature Initial Concentration
1g 2g 3g 4g 5g 1 2 3 4 5 25oC 30 oC 35 oC 40 oC 45 oC 100 200 300 400 500
Marble
Powder
Untreated 1.110 x10⁻²
1.054 1.810 1.940 1.981 1.782 1.840 2.140 2.321 2.317 2.417 2.516 3.149 3.724 3.432 1.892 2.246 2.427 2.526 2.873
Treated
1.140 x10⁻²
1.782 1.940 2.143 2.413 2.140 2.140 3.120 3.240 3.341 3.347 3.357 3.417 3.841 3.910 2.170 2.399 2.470 2.870 2.940
Rajasthan
Red Kotta
Untreated 1.410 x10⁻²
1.512 1.920 2.111 2.413 2.417 2.514 2.620 2.724 2.842 2.514 2.614 2.814 3.012 3.142 1.940 2.310 2.516 2.610 2.940
Treated 1.520
x10-2
1.617 2.110 2.320 2.512 2.514 2.610 2.720 2.811 2.849 2.614 2.712 2.910 3.142 3.246 2.130 2.416 2.617 2.710 3.120
Kadappa Untreated 1.001
x10-2
1.062 1.720 1.814 1.878 1.641 1.730 2.014 2.214 2.142 2.314 2.417 2.619 2.719 2.840 1.740 1.810 1.940 2.111 2.146
Treated 1.114
x10-2
1.124 1.817 1.912 1.941 1.723 1.841 2.146 2.312 2.216 2.412 2.517 2.714 2.812 2.912 1.840 1.942 2.160 2.217 2.214
Granite Untreated 1.524
x10-2
1.670 1.837 1.927 1.949 1.799 1.840 1.910 2.142 2.214 2.717 2.812 2.913 2.914 3.120 3.130 3.240 3.317 3.411 3.512
Treated 1.620
x10-2
1.940 2.140 2.210 2.317 2.410 2.642 2.712 2.242 2.312 2.812 2.917 3.014 3.140 3.217 3.210 3.417 3.418 3.516 3.612
299
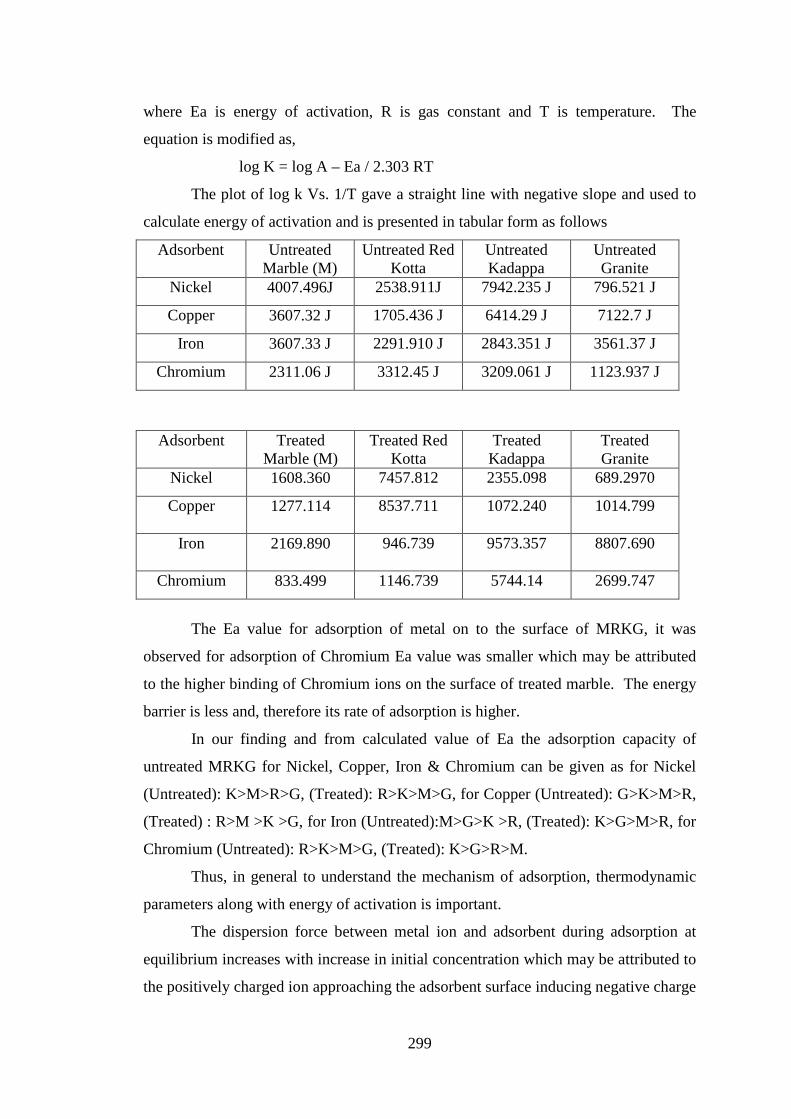
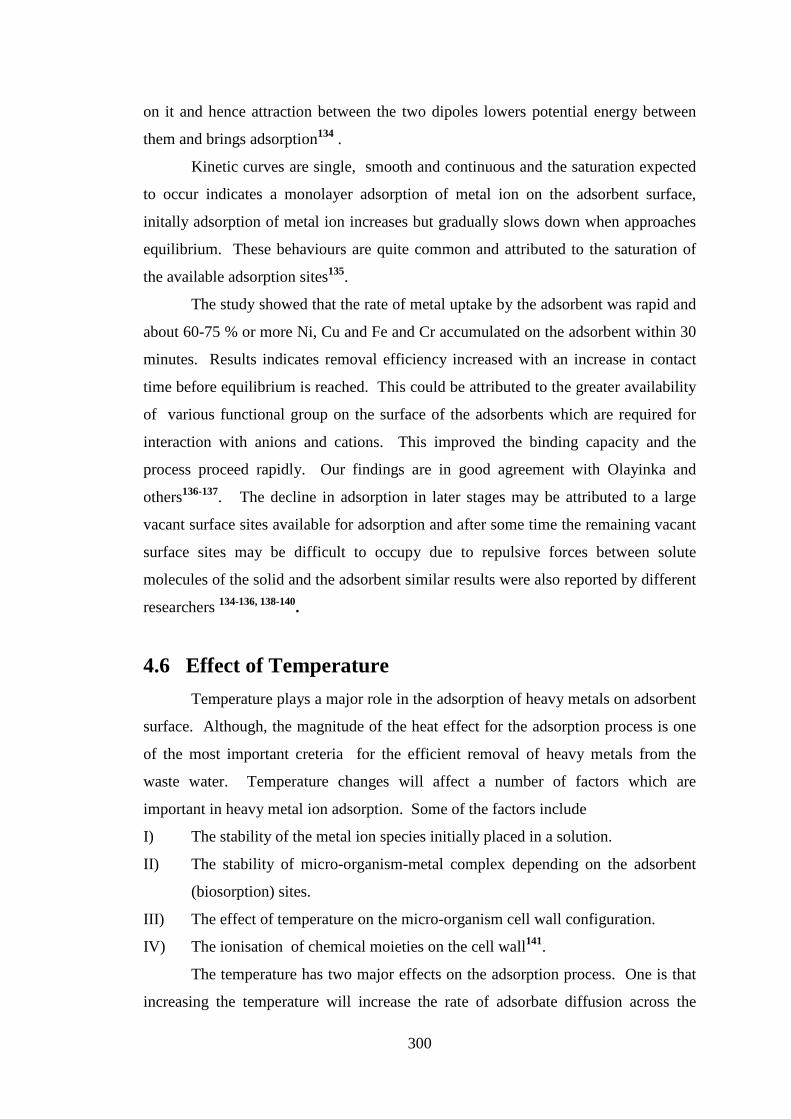
where Ea is energy of activation, R is gas constant and T is temperature. The
equation is modified as,
log K = log A – Ea / 2.303 RT
The plot of log k Vs. 1/T gave a straight line with negative slope and used to
calculate energy of activation and is presented in tabular form as follows
Adsorbent Untreated Marble (M)
Untreated Red Kotta
Untreated Kadappa
Untreated Granite
Nickel 4007.496J 2538.911J 7942.235 J 796.521 J
Copper 3607.32 J 1705.436 J 6414.29 J 7122.7 J
Iron 3607.33 J 2291.910 J 2843.351 J 3561.37 J
Chromium 2311.06 J 3312.45 J 3209.061 J 1123.937 J
Adsorbent Treated Marble (M)
Treated Red Kotta
Treated Kadappa
Treated Granite
Nickel 1608.360 7457.812 2355.098 689.2970
Copper 1277.114 8537.711 1072.240 1014.799
Iron 2169.890 946.739 9573.357 8807.690
Chromium 833.499 1146.739 5744.14 2699.747
The Ea value for adsorption of metal on to the surface of MRKG, it was
observed for adsorption of Chromium Ea value was smaller which may be attributed
to the higher binding of Chromium ions on the surface of treated marble. The energy
barrier is less and, therefore its rate of adsorption is higher.
In our finding and from calculated value of Ea the adsorption capacity of
untreated MRKG for Nickel, Copper, Iron & Chromium can be given as for Nickel
(Untreated): K>M>R>G, (Treated): R>K>M>G, for Copper (Untreated): G>K>M>R,
(Treated) : R>M >K >G, for Iron (Untreated):M>G>K >R, (Treated): K>G>M>R, for
Chromium (Untreated): R>K>M>G, (Treated): K>G>R>M.
Thus, in general to understand the mechanism of adsorption, thermodynamic
parameters along with energy of activation is important.
The dispersion force between metal ion and adsorbent during adsorption at
equilibrium increases with increase in initial concentration which may be attributed to
the positively charged ion approaching the adsorbent surface inducing negative charge
300
on it and hence attraction between the two dipoles lowers potential energy between
them and brings adsorption134 .
Kinetic curves are single, smooth and continuous and the saturation expected
to occur indicates a monolayer adsorption of metal ion on the adsorbent surface,
initally adsorption of metal ion increases but gradually slows down when approaches
equilibrium. These behaviours are quite common and attributed to the saturation of
the available adsorption sites135.
The study showed that the rate of metal uptake by the adsorbent was rapid and
about 60-75 % or more Ni, Cu and Fe and Cr accumulated on the adsorbent within 30
minutes. Results indicates removal efficiency increased with an increase in contact
time before equilibrium is reached. This could be attributed to the greater availability
of various functional group on the surface of the adsorbents which are required for
interaction with anions and cations. This improved the binding capacity and the
process proceed rapidly. Our findings are in good agreement with Olayinka and
others136-137. The decline in adsorption in later stages may be attributed to a large
vacant surface sites available for adsorption and after some time the remaining vacant
surface sites may be difficult to occupy due to repulsive forces between solute
molecules of the solid and the adsorbent similar results were also reported by different
researchers 134-136, 138-140.
4.6 Effect of Temperature
Temperature plays a major role in the adsorption of heavy metals on adsorbent
surface. Although, the magnitude of the heat effect for the adsorption process is one
of the most important creteria for the efficient removal of heavy metals from the
waste water. Temperature changes will affect a number of factors which are
important in heavy metal ion adsorption. Some of the factors include
I) The stability of the metal ion species initially placed in a solution.
II) The stability of micro-organism-metal complex depending on the adsorbent
(biosorption) sites.
III) The effect of temperature on the micro-organism cell wall configuration.
IV) The ionisation of chemical moieties on the cell wall141.
The temperature has two major effects on the adsorption process. One is that
increasing the temperature will increase the rate of adsorbate diffusion across the
301
external boundary layer and in the internal pores of the adsorbate particles because
liquid viscosity decreases as temperature increases and the other one is that it effects
the equilibrium capacity of the adsorbate depending on whether the process is
exothermic or endothermic142-143.
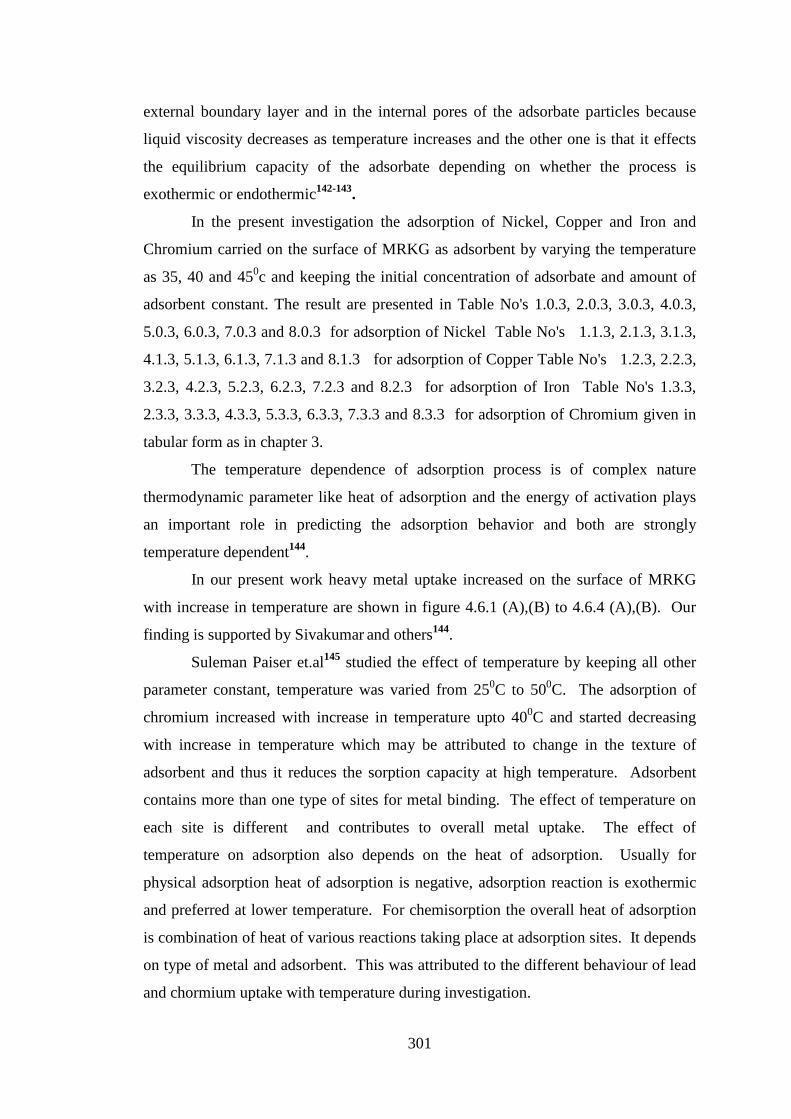
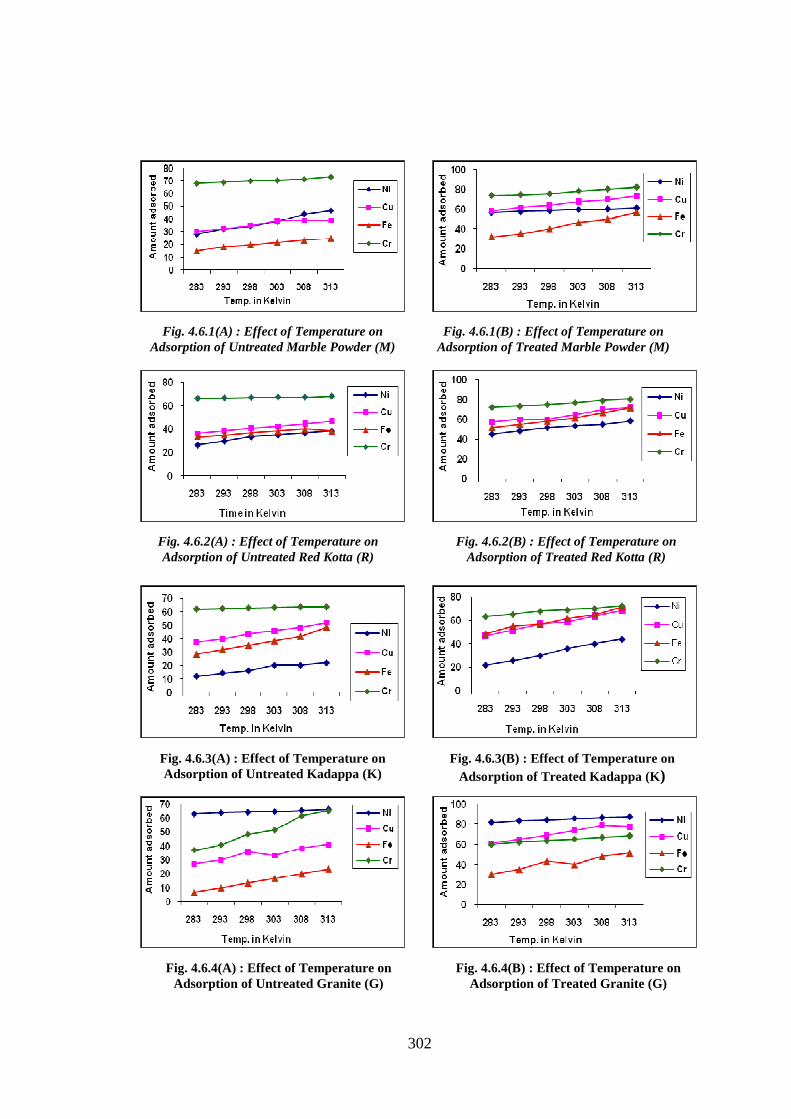
In the present investigation the adsorption of Nickel, Copper and Iron and
Chromium carried on the surface of MRKG as adsorbent by varying the temperature
as 35, 40 and 450c and keeping the initial concentration of adsorbate and amount of
adsorbent constant. The result are presented in Table No's 1.0.3, 2.0.3, 3.0.3, 4.0.3,
5.0.3, 6.0.3, 7.0.3 and 8.0.3 for adsorption of Nickel Table No's 1.1.3, 2.1.3, 3.1.3,
4.1.3, 5.1.3, 6.1.3, 7.1.3 and 8.1.3 for adsorption of Copper Table No's 1.2.3, 2.2.3,
3.2.3, 4.2.3, 5.2.3, 6.2.3, 7.2.3 and 8.2.3 for adsorption of Iron Table No's 1.3.3,
2.3.3, 3.3.3, 4.3.3, 5.3.3, 6.3.3, 7.3.3 and 8.3.3 for adsorption of Chromium given in
tabular form as in chapter 3.
The temperature dependence of adsorption process is of complex nature
thermodynamic parameter like heat of adsorption and the energy of activation plays
an important role in predicting the adsorption behavior and both are strongly
temperature dependent144.
In our present work heavy metal uptake increased on the surface of MRKG
with increase in temperature are shown in figure 4.6.1 (A),(B) to 4.6.4 (A),(B). Our
finding is supported by Sivakumar and others144.
Suleman Paiser et.al145 studied the effect of temperature by keeping all other
parameter constant, temperature was varied from 250C to 500C. The adsorption of
chromium increased with increase in temperature upto 400C and started decreasing
with increase in temperature which may be attributed to change in the texture of
adsorbent and thus it reduces the sorption capacity at high temperature. Adsorbent
contains more than one type of sites for metal binding. The effect of temperature on
each site is different and contributes to overall metal uptake. The effect of
temperature on adsorption also depends on the heat of adsorption. Usually for
physical adsorption heat of adsorption is negative, adsorption reaction is exothermic
and preferred at lower temperature. For chemisorption the overall heat of adsorption
is combination of heat of various reactions taking place at adsorption sites. It depends
on type of metal and adsorbent. This was attributed to the different behaviour of lead
and chormium uptake with temperature during investigation.
302
Fig. 4.6.1(A) : Effect of Temperature on Adsorption of Untreated Marble Powder (M)
Fig. 4.6.1(B) : Effect of Temperature on Adsorption of Treated Marble Powder (M)
Fig. 4.6.2(A) : Effect of Temperature on Adsorption of Untreated Red Kotta (R)
Fig. 4.6.2(B) : Effect of Temperature on Adsorption of Treated Red Kotta (R)
Fig. 4.6.3(A) : Effect of Temperature on Adsorption of Untreated Kadappa (K)
Fig. 4.6.3(B) : Effect of Temperature on Adsorption of Treated Kadappa (K)
Fig. 4.6.4(A) : Effect of Temperature on Adsorption of Untreated Granite (G)
Fig. 4.6.4(B) : Effect of Temperature on Adsorption of Treated Granite (G)
303
Farooqui et.al91 during their study on low cost processed adsorbent concluded
that temperature increase the adsorption properties decreases. At 250C the adsorption
decreases to 77 % by the leaves of cauliflower, it may attributed the to process being
exothermic. The decreases in adsorption with rise of temperature may be due to the
enhanced capacity of the Fe(II) ion from the surface of adsorbent. Gundugan et.al146
also study the effect of temperature by varying it between 100C to 300C on adsorption
of copper onto peat at constant concentration and reported that with increase in
temperature from 120C to 300C very small amount (1.033%) adsorbed indicating the
negligible effect of temperature on copper adsorption on to the surface of peat.
Bansal et.al147 studied the effect of temperature on adosorption of Chromium from the
sample solution with different temperature ie. 28,32 and 420C respectively, it was
observed that adsorption of heavy metal (chromium) increases with the decrease in
temperature this is in agreement with Farooqui et.al91, The low temperature gave
maximum adsorption and adsorption increases in the order as 200C > 320C > 400C.
The increased adsorption at higher temperature during the present
investigation may be attributed to acceleration of some originally slow step, creation
of some new activation sites on adsorbent surface, decrease in the size of adsorbing
species, this could well occur due to progressive desolution of the metal ion as the
solution temperature increases our findings is in good agreement with the finding of
different researchers115,148-149.
4.7 Adsorption Isotherm
The capacity of adsorption isotherm is fundamental and plays an important
role in determination of the maximum capacity of adsorption. It also provides a
panorama of the course taken by the system under study in a concise form, indicating
how efficiently a adsorbent will adsorb and allows an estimate of the economic
viability of the adsorbents commercial applications for the specified solute62. It is a
graphical representation showing the relationship between the amount adsorbed by a
unit weight of adsorbent and the amount of adsorbate remaining in a test medium at
equilibrium115. It maps the distribution of adsorbable solute between the liquid and
solid phases at various equilibrium concentration150. The Langmuir and Freundlich
models are the most widely used models in the case of adsorption of metal ions by
adsorbents even though the metal uptake may not exactly follows the monolayer
304
adsorption mechanism. The Langmuir adsorption isotherm has been used
traditionally to quantify and contrast the performance of different adsorbents. The
Langmuir Isotherm is based on the assumptions:
I) All sites are equivalent
II) Adsorption results in a monomolecular layer of coverage.
III) A molecule is adsorbed on a site independent of the neighbouring adsorbed
molecules.
IV) Coverage is independent of binding energy145. and
V) Constant temperature.
The rate of attachment to the surface should be proportional to a driving
force times an area. The driving force is the concentration of fluid and the area is the
amount of bare surface. The affinity between the adsorbent and the different metals
quantified by fitting the obtained adsorption values to the Langmuir isotherm. In this
case, the following form of the Langmuir equation is applied
q = qmax ( b Ce ) 1 + b Ce
Where qmax is the maximum adsorption uptakes per unit mass of adsorbent in mg/g,
Ce is the equilibrium concentration of heavy metals ion in mg/C and b is the
Langmuir constant of adsorption, qmax and b calculated from the intercept and the
slope of plots.
The Freundlich modell51 is perhaps the most popular adsorption model for a
single solute system and is an empirical relation equation based on the distribution of
solute between the solid phase and aqueous phase at equilibrium.
The linear form of the Freundlich equation is x/m = K Ce1/n
Where x is concentration of metal ion adsorbed, Ce is equilibrium concentration of
metal ion in solution. K and 1/n are empirical constants and have been calculated
from intercept and slope of the plots. A larger value for 1/n indicates a larger change
in effectiveness over different concentration. Also, when 1/n >1,O. The change in
adsorbed concentration is greater than the change in the solute concentration152. The
Freundlich equation is empirical equation with no basis in theory which assumes an
305
exponential variation in site energies and also assumed that surface adsorption is not
rate limiting step153.
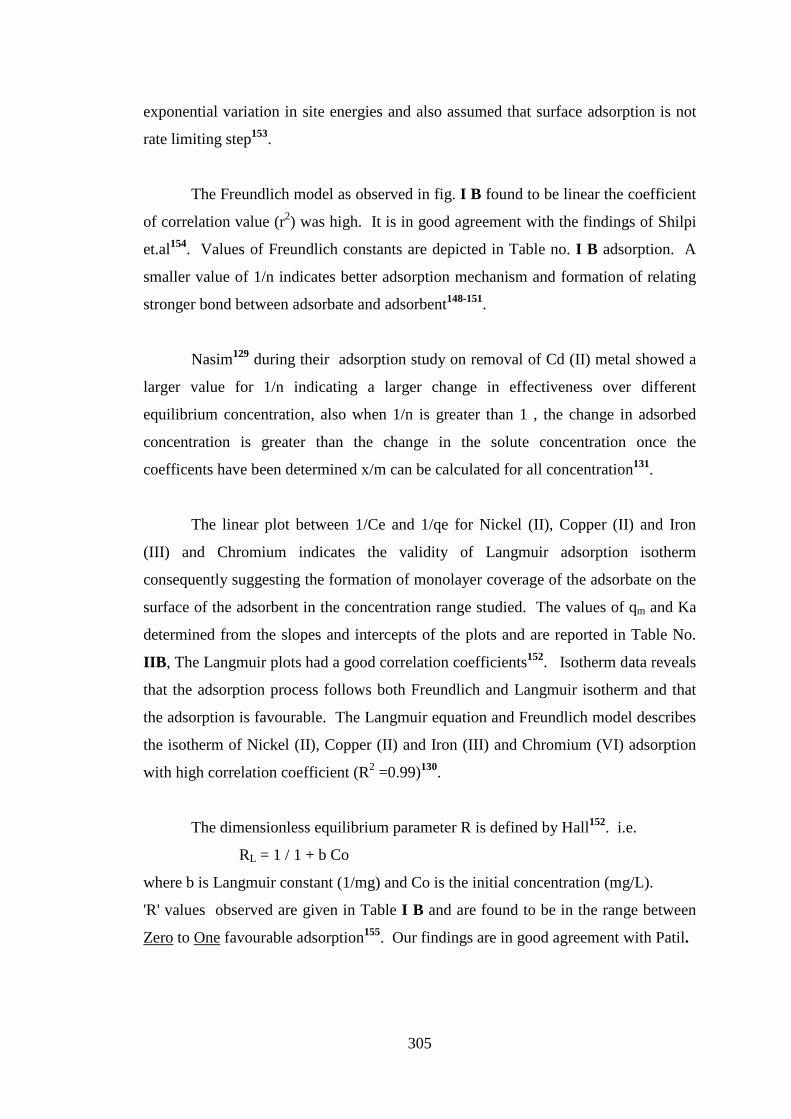
The Freundlich model as observed in fig. I B found to be linear the coefficient
of correlation value (r2) was high. It is in good agreement with the findings of Shilpi
et.al154. Values of Freundlich constants are depicted in Table no. I B adsorption. A
smaller value of 1/n indicates better adsorption mechanism and formation of relating
stronger bond between adsorbate and adsorbent148-151.
Nasim129 during their adsorption study on removal of Cd (II) metal showed a
larger value for 1/n indicating a larger change in effectiveness over different
equilibrium concentration, also when 1/n is greater than 1 , the change in adsorbed
concentration is greater than the change in the solute concentration once the
coefficents have been determined x/m can be calculated for all concentration131.
The linear plot between 1/Ce and 1/qe for Nickel (II), Copper (II) and Iron
(III) and Chromium indicates the validity of Langmuir adsorption isotherm
consequently suggesting the formation of monolayer coverage of the adsorbate on the
surface of the adsorbent in the concentration range studied. The values of qm and Ka
determined from the slopes and intercepts of the plots and are reported in Table No.
IIB, The Langmuir plots had a good correlation coefficients152. Isotherm data reveals
that the adsorption process follows both Freundlich and Langmuir isotherm and that
the adsorption is favourable. The Langmuir equation and Freundlich model describes
the isotherm of Nickel (II), Copper (II) and Iron (III) and Chromium (VI) adsorption
with high correlation coefficient (R2 =0.99)130.
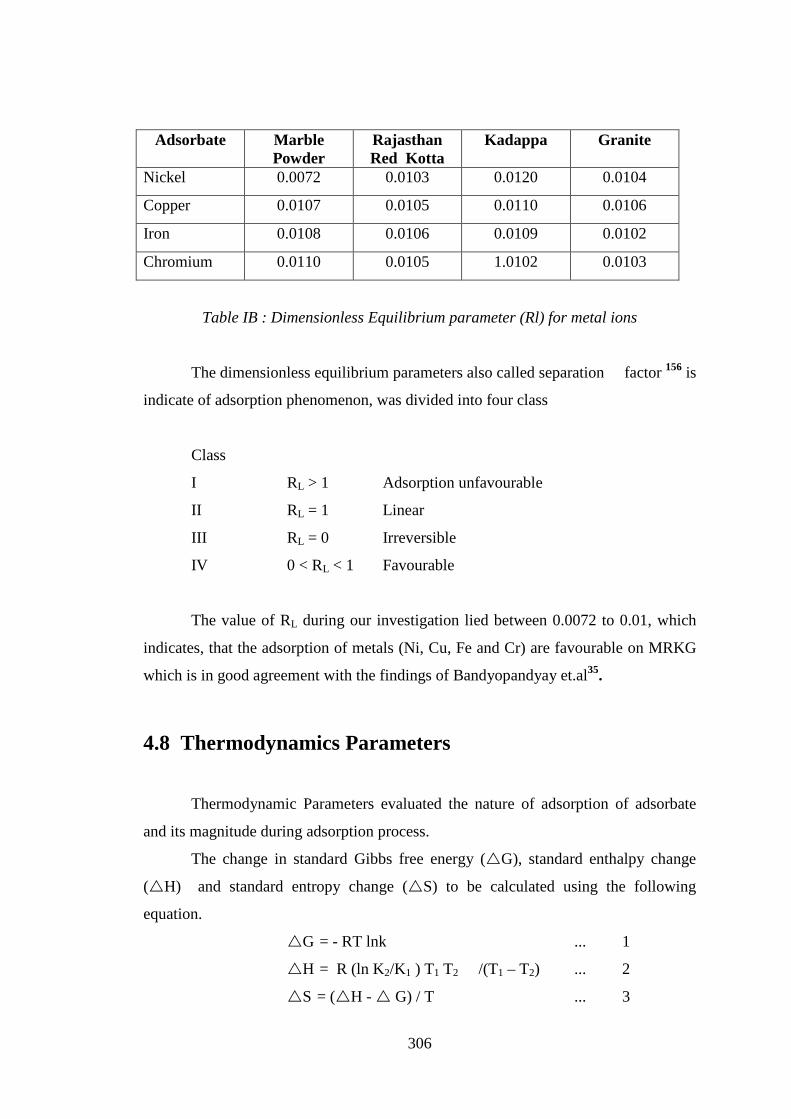
The dimensionless equilibrium parameter R is defined by Hall152. i.e.
RL = 1 / 1 + b Co
where b is Langmuir constant (1/mg) and Co is the initial concentration (mg/L).
'R' values observed are given in Table I B and are found to be in the range between
Zero to One favourable adsorption155. Our findings are in good agreement with Patil.
306
Adsorbate Marble Powder
Rajasthan Red Kotta
Kadappa Granite
Nickel 0.0072 0.0103 0.0120 0.0104
Copper 0.0107 0.0105 0.0110 0.0106
Iron 0.0108 0.0106 0.0109 0.0102
Chromium 0.0110 0.0105 1.0102 0.0103
Table IB : Dimensionless Equilibrium parameter (Rl) for metal ions
The dimensionless equilibrium parameters also called separation factor 156 is
indicate of adsorption phenomenon, was divided into four class
Class
I RL > 1 Adsorption unfavourable
II RL = 1 Linear
III RL = 0 Irreversible
IV 0 < RL < 1 Favourable
The value of RL during our investigation lied between 0.0072 to 0.01, which
indicates, that the adsorption of metals (Ni, Cu, Fe and Cr) are favourable on MRKG
which is in good agreement with the findings of Bandyopandyay et.al35.
4.8 Thermodynamics Parameters
Thermodynamic Parameters evaluated the nature of adsorption of adsorbate
and its magnitude during adsorption process.
The change in standard Gibbs free energy (�G), standard enthalpy change
(�H) and standard entropy change (�S) to be calculated using the following
equation.
�G = - RT lnk ... 1
�H = R (ln K2/K1 ) T1 T2 /(T1 – T2) ... 2
�S = (�H - � G) / T ... 3
307
where R is the gas constant, K, K1 and K2 are equilibrium constants at temperature T,
T1 and T2 respectively. Numerical values of equilibrium calculated by using equation
K = CBe / CAe
where Be and Ae are the equilibrium concentrations of heavy metals cations on the
adsorbent and adsorbate respectively. The calculated thermodynamics parameters for
the adsorption of Nickel (II), Copper(II) and Iron(III) and Cromium (VI) on to the
surface of MRKG are given in the Table No. IIIB.
The negative values of �G are indicative of the spontaneous nature of the
process. Entropy has been defined as the degree of chaos of the system and the
positive of �S reflects adsorption of Nickel (II), Copper(II) and Iron(III) and
Cromium (VI).
The negative value of �H shows the exothermic nature of Nickel (II),
Copper(II) and Iron(III) and Cromium (VI) on to the surface of MRKG. Our
observation are supported by the work carried by Soon–Yong et.al158.
The large negative value of �G shows the spontaneity of the adsorption
process of heavy metal ions. The decrease in the value of �G with increase in
temperature indicates adsorption process in endothermic and thus it is favoured with
increase in temperature159. The negative values of �G validate the feasibility of the
adsorption process and the spontaneity of adsorption of adsorbate on to adsorbent160.
The positive values of �S if positive suggest increase in randomness at the
solid / solution interface during the adsorption similar results were observed during
present investigation. The positive value of �H shows endothermic nature of
adsorption process observed by Kavitha160-61 and the negative value of �H shows
exothermic nature of adsorption process.
According to Laura162
(I) �G value upto – 15 KJ/ Mole are connected with the physical interaction
between adsorption sites and metal ion (Physical adsorption)
308
(II) �G values more than –30 KJ/mole involves charge transfer from
adsorbent surface to the metal ion to form a co-ordination bond.
(Chemical adsorption).
The �G values obtained in this study for metals ions Nickel (II), Copper(II)
and Iron(III) are below than – 15 KJ / mole. indicating that the adsorption
mechanism is the physical interaction between adsorption sites and metal ion
(physical adsorption) which is in good agreement with the findings of Laura et.al162.
The positive values of �S suggest increased randomness at the solid-liquid
interface during the adsorption of metal ion. The adsorbed solvent (water) molecules,
which are displaced by the adsorbed species, gain more translational entropy than is
lost by the adsorbate ion. Furthermore, before the adsorption process takes place the
adsorbate ions are heavily solvated (The system is more ordered) and this order is lost
when the ions are adsorbed on the surface, due to the release of solvated water
molecules.
309
REFERENCE
1 Prabhavathi Nagarajan and R.
Lakshmi (2006)
... Indian Journal of Environmental
protection 26 (12) : pp 1108-1111.
2 Sehgal, R and Saxena, A.B
(1986)
... Bull. Environ. contam. Toxicol.36 :
pp 888-894
3 Mason C.F. ... Biology of Fresh Water Pollution,
Second Edition, Longman Group
UK Ltd. England p 351 (1991)
4 Witeska, M.; Jezierska, B and
Chaber J
... Aquaculture 129
pp 129-132 (1995)
5 Vilijoen, A. ... M.Sc. Thesis, Rand Afrikaans
University, South Africa.
6 Pelgram, S.M.G.J.; Lock
R.A.C.; Balm; P.H.M. and
Wedelaar Bonga, S.E.
... Environ Toxicol. Chem 16 (4) :
pp 770-774. (1997)
7 Wepener, V; Van Vuren, J.H.J.
and Du Preez, H.H.
... Water S.A. 27 (1) : pp 99-108
(2001)
8 Nussey, G. ... Ph.D. Thesis, Rand Afrikaans
University, South Africa. (1998)
9 Biney, C; Amazu, A.T.,
Calomari, D; Kaba, N; Mbome,
I.L; Naeve, H ochumba P.B.O.;
Osibanjo, O.; Radegonde, V and
Saad M.A.H.
... Ecotoxicology and Environmental
Safety 31 : pp 134-159 (1997)
10 Bennet - Chambers, M; Davies P
and Knott, B
... Journal of Environmental
Management 57 : pp 283-295
(1999)
11 Abel, P.D. ... Water Pollution Biology, Ellis
Horwood Publishers Chichester -
p 231 (1989)
310
12 Seymore, T ... M.Sc. Thesis Rand AfriKaans
University, South Africa (1994)
13 Zou, E and Bu, S ... Bull. Environ Cotam Toxical, 52
pp 742-748 (1994)
14 Zou, E ... Bull Environ, Contam Toxical 58 :
pp 437-441 (1997)
15 Tulasi, S.J. Reddy P.U.M. and
Ramanrao J.V.
... Bull Environ Contaim Toxicol 43 :
pp 858-863 (1989)
16 Rishi, K.K. and Jain M. ... Bull. Environ Contam Toxicol 60 :
pp 323-328 (1998)
17 James R; Sampath, K and
Selvamani, P.
... Bull. Environ Contam Toxicol 60 :
pp 487-493 (1998)
18 Kotze,P; Du Prez, H.H. and Van
Vuren J.H.J.
... Water S.A. 25 (1) :
pp 99-110. (1999)
19 Skidmore, J.F. ... The quarterly review of Biology
39 (3) : pp 227-247. (1964)
20 Mount D.I. ... Water Research 2 :
pp 215-233. (1968)
21
Dallas, H.F. and Day J.A.
…
.
A review water research
commission project No. 351 Water
Research Commission, pretoria,
south Africa, pp 240.(1993)
22 Rayms, Keller, A; Olson, K.E.;
Mc Graw, M; Oray C; Carlson,
J.O. and Beaty B.J.
... Ecotoxicology and Environmental
Safety 39 : 41-47 (1998)
23 Brezonik, P.L., King S.O. and
Mach, C.E.
... Metal ecotoxicology, concept and
application Eds. Newman M.C. and
Mc-Intosh, A.W., Lewis
Publication Michigan pp 379
(1991)
24 Sharma, Y.C., Prasad, G., and
Rupainwar, D.C.
... Intern. J. Environ Studies 40 :
pp 41-53 (1992)
311
25 Parker, S.P., Ed. ... Encyclopaedia of Environmental
Sciences, 2nd Ed. Mc Graw Hill,
New York (1980)
26 K. Periasamy and C.
Namasivayam
... Waste Management, Vol. 15, No. 1
pp 63-68 (1995)
27 Blaylock B.G, Frank M.L. ... Bull. Environm. Contam. Toxicol.
21 : pp 604-611 (1979)
28 Nebekar, A.V., Savonen, C and
Stevens, D.G.
... Environmental Toxicology and
Chemistry : pp 233-239 (1985)
29 DWAF (Department of Water
Affairs and Forestry)
... South African Water Quality
Guidelines Second Edition Vol 7:
Aquatic Ecosystem pp 59 (1996)
30
Steeman Nielsen, and Wium
Andersen, S.
...
Marine Biology 6 :
pp 93-97 (1970)
31
Sorensen E.M.B.
...
Metal Poisoning in fish CRC Press,
Boca Ration Florida. (1978)
32 EIFAC ... Water Research 12 :
pp 277-280 (1978)
33 Welsh P.G. , Skidmore, J.F. ;
Sprey D.J., Dixon D.G. ,
Hodson, P.V
... Can. J. Fish. Sci. 50 : 1356 - 1362
34 Bis, 1991 ... Bureau of Indian Standards, New
Delhi, 1st pp – 10-500 (1991)
35 A. Bandyopadhyay and M.N.
Biswas
... IJEP 18 (9) : pp-662-671 (1998)
36 Browning, Prabavathi Nagarajan
and R. Lakshmi
... 1969, IJEP 26 (12) :
pp – 1108-1111 (2006)
312
37 NEQS ... National Environmental Quality
Standard for municipal and liquid
Industrial effluents revised
December 28, 1999.
38 Kaneco, S, Inomatta, K, Itoh, K,
Funasakak, Masuyama,K, Itoh,
S, Suzuki,T, Ohta, K
... Development of economical
treatment system for plating factory
wastewater - Scikatsu Eisei, 44 :
211-215 (2000)
39 Volesky, B, Holan ZR ... Biotechnol Prog. 11 :
pp 235-250 (1995)
40 Gavrilescu, M ... Engr . In life sci 4 (3) :
pp 219-232. (2004)
41 Gardea - Torresday JL, Tong L,
Salvador JM
... J. Hazard matter & 8 : pp 191-206.
(1996)
42
Gang, S, Weixing, S
...
Ind. Eng. Chem. Res. 37 -
pp 1324-1328. (1998)
43 Gonzalez P.E., Sonchez, M.V.;
Garcia,A.V.and Viciana, M.S.
... J. Chem. Tech. Biotech & 2 : 105-
123. (1988)
44 Jazefacink, Gozegorz, Hoffmann
Cristian, Ranger, Manfried
... Plant Nutr - Soil Sci. - 163 (3) :
595 - 601. (2000)
45 Giles, C.H., Nacevano,T.H.,
Nakhawa, S.W. and Smith, D.J.
... Chem. Soc. 3973. (1966)
46 S.Y. Quek, DAJ Wase adn C.F.
Forster
... Water SA Vol. 24 No.-3. (1998)
pp 251-256. (1998)
47 Salim, R; Al-Subu, M.M. and
Qashoo, S
... J. Environ. Sci. Health A 29 pp
2087-2114 (1994).
48 Ozer, Aksu,Z, Kutsal, T and
Caglar, A
... Environ. Technol. 15 ( pp 439-448)
(1994)
49 Mohammad Adil ... M.Sc. (Dissertation), Universiti
Teknologi Malaysia... pp 103-104.
(2006)
313
50 Apipreeya Kongsuwan and
Phussad Patnukao
... Proceeding "The second joint
International conference on "
Sustainable Energy and
Environment (SEE - 2006) 21-23
Nov. 2006 Bangkok (Thailand)
51
Low, K.S, Lee C.K. and Leo
A.C
...
Bioresour. Technol. 51 pp 227-231
(1995).
52
Korshin, G.V.; Frenkel, A.I.
Stern, E.A.
...
Environ Sci. Technol. 32,
2699. (1998)
53 Gardea, T.J.L.; Tieman, K.J.;
Gonzalez, J.H.; Heanning, J.A.
... Solvent Extraction and Ion
Exchange 14, 119, (1996)
54 Wase, D.A.J.; Forster, C.F. ... Tayler and Francis UK 1; (1997)
55 Zeljka, F. K.; Laszlo, S; Felicita,
B.
... Food Technol. biotechnol, 38(3),
211, (2000)
56 Habib-ur-Rehman, Mohammad
Shakirullah, Imtiaz Ahmad,
Shershah and Hameedullah
... Journal of the chinese chemical
society, 53, pp 1045-1052 (2006)
57 Patil S.J.; Bhole A.G. and
Natarajan G.S.
... Journal of Environ Science &
Engg. Vol. 48, No. 3, pp 203-208,
July (2006)
58 D.K. Singh, S.K. Garg and R.K.
Bharadwaj
... Ind. Jour. Env. Prot. Vol. 21(7) pp
604-610. (2001).
59 Weber, W.J. , and H.S. Posselt ... Aq. Environmental Chemistry of
Metals p 88 (1974).
60 Panday, K.K., G. Prasad and
V.N. Singh
... Water Res. 19 pp 869-873 (1985)
61 Kannan, N. and A.
Vanangemudi
... Ind. Jour. Env. Prot. Vol 11 (3)
pp 193-196 (1996)
62 Najua Delaila Tumin, A Luqman
Chaugh, Z. Zawani and Suraya
Abdul Rashid ..
... Journal of Engineering Science and
Technology Vol. 3 No. 2 pp 180-
189 (2008)
314
63 Ajmal M., Rao, R. A.K. Ahmad
and R. Ahmad
... Hazardous Materials 79 pp 117 -
131 (2000).
64
Wong, K.K., Lee C.K., Low,
K.S. and Haron, M.J
...
Chemosphere 50 pp 23-28 (2003)
65 A. Saeed, Muhammed Iqbal and
M. Wahid Akhtar
... Hazardous Materials 117, 113 pp
65-73 (2004).
66 H.A. Elliot and C.P. Huang ... Water Resources 15, 849 (1981)
67 D.K. Singh, S.K. Garg and R.K.
Bharadwaj
... Ind. Jour. Env. Prot. vol 21 (7) pp
604-610. (2001)
68 S. Madhava Krishnan, K.
Manickckavasagam, K.
Rasappan, P.S.Syed Shabudeen,
R. Venkatesh and S. Pattabhi
... E Journal of Chemistry Vol. 5, No.
4, pp 761-769, October (2008)
69 S Arivoli, Krishnan, Deva
prasath and M. Thenkuzhali
... Electronic Journal of
Environmental and food chemistry
Che, 6 (9), pp 2323-2340 (2007)
70 Arivoli S, ... Ph.D., Thesis, Gandhiji Rural
University, Gandhigran (2007)
71 Arivoli S and Hema M. ... Intern J Phy Sci. 2,
pp - 10-17 (2007)
72 Arivoli S, Venkatraman B.R.,
Rajachandrasekhar T and Hema
M.
... Res. J Chem Environ 17,
pp – 70-78 (2007)
73 Arivoli S, Kalpana K, Sudha R
and Rajachandrasekhar T.
... E. J. Chem, 4,
pp 238-254 (2007)
74
A. Esmaeili, S. Ghasemi and A.
Rustaiyan
...
American Eurasian. J. Agric and
Env. Sci. 3(6) pp 810-813 (2008)
75
Asmal, M, A. H. Khan, S.
Ahmad and A. Ahmad
...
Water Research 32 pp 3085-3091
(1998)
315
76 Kalyani, S.P., Srinivasa Rao and
A. Krishnaiah
... Chemosphere 57 pp 1225-1229
(2004)
77 Oboh,O.I. and Aluyor E.O. ... African Journal of Biotechnology
Vol. 7 (24) pp 4508-4511 (2008)
78 Leon, Y. Leon C.A., Solar J M
Calemma, V. and Radovic, LR
... Carbon 30, pp 797 - 811 (1992)
79 Radovic, L.R. , Silva I.F., Ume
J.I. Menendez J.A., Leon Y, and
Scaroni, A.W.
... Carbon 35 pp 1339-1348 (1997)
80 Faria P C C, Orfao J J M, and
Pereira M F R
... ... Water Res. 38. pp 2043-2052
(2004)
81 NT Abdel - Ghani, M. Hefny,
and G.A.F.El Chaghaby
... Ind. J. Env. Sci. Tech. Vol. 4 (1)
pp 67-73 (2007).
82 Luef, E, Prey. T. , and Kubicek,
C.P.
... Applied Microbiol. Biotechnol 34
p 688 (2004)
83 Aldor, I, Fourest, E, Volesky, B ... Can. J. Chem Eng. 73, P 516
(1995)
84 Saeed, A. Iqbal M. , and
Akhtar,M.V.
... .. Pakistan J.Sci. : Ind. Res. 45,206
(2002)
85 Chang J.S., Low, R. and Chang
C.C.
... Water Res. 31 (7) pp 1651-1658
(1997)
86 Kacar, Y., C Arpa, S.Tan A.
Denizli, O. Genc and M.Y.
Africa
... Process, Biochem 37
pp – 601-610, (2002)
87 M.A.K. Megat Hanafiah, M.Z.A.
Yahya, H.Zakaria and S.C.
Ibrahim.
... Journal of Applied Sciences 7 (4);
pp – 489-493 (2007)
88 Igwe, J.C. and Abia, A.A ... African Journal of Biotechonology
vol 5 (12) pp 1167-1179 (2006)
316
89 Motoyuki, S. ... Adsorption Engineering, Elsevier
Sci. Publishers pp 5-61 (1990)
90 Igwe, J.C., Abia, A.A. ... African Journal of Biotechnology
Vol 4(6) pp 509-515 (2005).
91 Mazhar Farooqui, Sayyed
Sultan, Magdoom Farooqui, and
S.H. Quadri
... Indian J. Chem. Tech : Vol. 11,
pp 190-193 (2004)
92 T.Srinivas, and V.S.R.K. Prasad ... Ind. Jour. Env. Prot. Vol. 22 (12)
pp 1226-1230 (2002).
93 Bikerman, J.J. ... Surface Chemistry Theory and
Application Academic Press. Inc.
New York pp 294 (1985)
94 A. Bangyopadhyay and M.N.
Biswas
... Ind. Jour. Env. Prot. Vol. 18 (9) pp
662-671 (1998)
95 N. Kannan and T. Shrivasan ... Ind. J. Env. Prot. Vol. 18 (3) pp
194-198 (1997)
96 Panday, K.K., G. Prasad and
V.N. Singh
... Air Soil and Water Poll. - 27,
pp 287-296 (1986)
97 Babel, S and Kurniawan, T.A. ... Chemosphere 54, pp 951-967
(2004)
98 Faurest, E and Roux J.C. ... Applied Microbiology
Biotechnology 37 pp (399-403)
(1992)
99 Mashitah, M.D., Zulfadhly, Z
and Bhatia, S.
... Biotechnology 27, Sand (5 & 6 )
pp 429-433 (1999).
100 Garg, V.K. , Gupta R. , Yadhav
A.B. and Kumar R.
... Bioresource Technology 89,
pp 221-124 (2003)
101 Pons, M.P. and Fuste, C.M. ... Appli. Microb. Biotech. 39, pp
661-665 (1993)
102 S.J. Patil, A.G. Bhole, and G.S.
Natarajan
... Journal of Env. Science and Engg.
Vol. 48. No.3 pp 203-208 (2006).
317
103 S. Dhana Kumar, G.Solaraj, R.
Mohanraj and S. Pattabhi
... Indian J. Sci. and Tech. Vol. 1 (2),
pp 1-6 (2007)
104 Kadirvelu, K., Palanivel, M.,
Kalpana, R. and Rajeshwari, S.
... Bioresour. Techol. 74 pp. (263-
265) (2000).
105 Gong, R., Ding, Y., Liu. H. and
Chen. Q., Liu. Z.
... Chemosphere 58(1) pp 125-130
(2005).
106 Viriya, Madacha, Ronbanchob
Apiratikul and Prasert Pavasant
... Second Joint International
Conference on 'Sustainable Energy
and Environment (SEE 2006) 21-
23 Nov. 2006. BangKok (Thailand)
107 Nuhoghu, Y and Oguz, E ... Biochem 38 pp 1627-1631 (2003).
108 Holan, Z.R. and Volesky, V ... Appl. Biochem. Biotechnol 53 pp
133-146 (1995).
109 S. Madhavakrishnan, K.
Manickovasagam K.Rasappan,
P.S. Syed, Shabudeen
R.Venkatesh and S. Pattabhi
... E. Journal of chemistry Vol. 5,
No.4, pp 761-769 (2008)
110
M.A.K. Megat Hanafiah, M.Z.A.
Yahya, H.Zakaria and S.C.,
Ibrahim.
...
J. of Appl-Sci. 7 (4) :
pp 489-493 (2007).
111 Shukal, A, Y.H. Zhang, P.
Dubey, J.L. Margrave and S.S.
Shukla
... J. Hazard Mater B. 95
pp 137-152 (2002)
112 S. Larous, A.H. Menial and M.
Bencheikh Lehocine
... Desalination 185
pp 483 – 490 (2005)
113 Al-Ashesh, R. Banat, Z.AI
Omari
... Cleaner Production 11
pp – 321-326 (2003)
114 Khalid N., Ahmads, Toheed A.
and Ahmed J.
... Applied Radiation and Isotopes 52
pp 31-38 (2000)
115 Addagalla Venkata Ajaykumar
Naif A. Darwish and Nilal Hilal
... World Applied Science Journal 5
pp 32-40 (2009)
318
116 R. Han, J. Zheog, W. Zou, H.
Xiao, J. Shi, and H. Liu
... J. Hazard Mater 133
pp 262-288 (2005)
117 Tariq S. Najim, Nazik J. Elais
and Alya A. Dawood
... E Journal of Chemistry Vol. 6(1)
pp 161-168 (2009)
118
Villaeseusa I., Martinez M. and
Miralles N.
...
Jour of Chemistry Techno. and
Biotechno 75 pp 812-816 (2000)
119 Barros, A.J.M., S. Prasad, V.D.
Leite and A.G. Souza
... Bioresour Techno 98
pp 1418-1425 (2007)
120 C.K. Jain and D. Ram ... Hydrological sciences Journal des
sciences, Hydrologue 42 (2005)
121 Soong, K.L. ... Ph.D. Thesis, University of
Heidelber, Germanny (1974)
122 N. Kannan ... Ind. Jour. Env. Prot. Vol. 18(3)
pp 194-198 (1998)
123 Ramprasad G. ... Ph.D. Thesis S.V. University,
Triupathi (1984)
124 K.A. Emmanuel and A.
Veerabhadra Rao
... Rasayan J. Chem. Vol. 1, No. (4) :
pp 840-850, (2008)
125 N. Kannan and T. Srinivasan ... Inter. Jour Env. Prot. Vol. 18 (3) :
pp 194-198 (1998)
126 Oboh, O.I. and Aluyor, E.O. ... African Journal of Biotechnology
Vol. 7 (24), pp 4508-4511, (2008)
127 S. Madhavakrishnan, K.
Manichavasagam
... E-Journal of Chemistry Vol. 5,
No.4, pp 761-769, (2008)
128 S. Dhanakumar, G. Solaraj, R.
Mohanraj, S. Pattabhi
... Indian Journal of Science and
Technology Vol. 1, No. 2
(Dec. 2007)
129 Nasim Ahmed Khan and Wan
Hanani Won Mohamad Amin
... Water and Waste Water Asia
(2005)
130 Ho Y.S. and Mc Kay G. ... Tans. Institution of Chemicals
Engineers Vol. 76, Part B.
319
131 Ng. C. Losso, J.N, and Marshell,
W.E.
... Bioresource Technology Vol. 85
pp. 131-135 (2002)
132 Khana, S.K. Pandey, K.K.
Srivastava, R.M. and Singh V.N.
... J. Chem. Tech. Biotech 30
p 99 (1987)
133 Poots, V.J.L. Mckay, G. and
Healy, J.J.
... JWPCF 50 926
(1978)
134 Kim, D.S. ... Chemosphere 53, (2003)
135 Yardin, M.F. Budinova, T.
Ekinici, E. Petrov, W.
... Chemosphere 53
pp 835-841 (2003)
136 K.O. Olayinka, B.I., Alo and T.
Adu
... Journal of Applied Science Vol. 7
(16) pp 2307-2313 (2007)
137 Rao, M.A., V. Parwalt and A.G.
Bhole
... Waste Manage 22
pp 821-830 (2002)
138 Chand , S. ... Indian J. Envir, Health. 48
pp 151-158 (1999)
139 Saravanne, R and T. Sundarajan ... Ind. J. Env. Health 44
pp 78-81 (2002)
140 Narsi, R.B., B. Mani, S. Nivedita
and G. Asha
... Bioresour Technol. 91
pp 305-307 (2004)
141 Sag Y and Y. Katsal ... Biochem Eng. J. 6
pp 145-151 (2000)
142 Al – Qodah Z. ... Desoalination , 196
pp 167-176 (2006)
143 C. Ramesh Babu, P.
Raghunandan and K.N.
Jayaveera
... Asian Journal of Chemistry, Vol.
16, No. 2, pp 617-622 (2004)
144 P. Sivakumar and P.N.
Palanisamy
... Rasayan Journal of Chemistry
Vol. 1, No. 4
pp 871-883 (2008)
145 Suleman Quaisar Anwar Salemi
and Muhammad Mahmmod
Ahmad
... Electronic Journal of
Biotechnology Vol. 10, No. 3
(2007)
320
146 Recap Gundogan, Bilal
Acemiloglu and Mehmet Hakki
Alma
... Journal of Colloidal and Interface
Science 269, pp – 303-309 (2004)
147 R.C. Bansal, J.B. Donnet and F.
Stoech and D. Rivin
... Carbon 35
p - 1295 (1997)
148 Aksu, Z and A.K. Pinar ... Separation and Purification
Technology 21 (1-2) pp 87-91
(2000)
149 Yasemin B. and Z. Tez ... J Hazar Mater 149 (1)
pp 35-41 (2001)
150 Zeng, C. X., i, and J. Liu ... Water Res. 38,
pp 1318-1326 (2004)
151 Freundlich I.H. ... Colloid and capillary chemistry
New York (1928)
152 Hall, K.R. ... Ind. Engg. Chem. Fundam. 5,
pp 212-220 (1966)
153 Roungerol F, J. Rouguerol and K
Sing.
... Adsorption by powders and porous
solids principles, methodology and
Applications, New York,
Academic press Inc. (1999)
154 Shilpi Kushwaha, Suparna
Sodaye
... Proc. of World Academy of
Science Engg. and Technology
Vol. 33 ( 2008)
155 Faust, S.D. and Osman, M.A. ... Adsorption process for treatment
Butter worths, London (15) 1987.
156 Langmuir I. ... J. American Chem. Soc. 40
pp. 1361-1403 (1918)
157 Bereket, G; Arogaz, A.Z. and
Ozel M.Z.
... J. Colloid and Interface science
pp – 187-338 (1997)
158 Soon Young Jeong
and Jung – Min Lee
... Bull. Korean Chem. Soc. Vo. 19
No. pp 218-222 (1996)
159 N.A. Adesola Babarinde J. ... J. of Applied science Research &
(11) pp 1420-1427 (2008)

321
160 Kavita, D. and C. Nama
Sivayam
... Bioresour, Technol 98 ;
pp 14-21 (2007)
161 Goel, J.K., K. Kardirvelu, C.
Rajagopal and K Garg
... Int. J. Environ Sci. Tech. 4 (1)
pp 11-17 (2007)
162 Laura Balgariu, Mioura Ratoi,
Dumitru Bulgariu and Matei
Macoveanu
... Environment Engineering and
Management Journal Vol. 7 (5)
pp 551-516 (2008)
322
Dyes are chemicals which on binding with a material will give colour to the
material. Dyes are ionic, aromatic organic compounds with structures including aryl
rings which have delocalised electron systems. The colour of a dye is provided by the
presence of chromophore group. A chromphore is a radical configuration consisting
of conjugated double bonds containing delocalized electrons. Other common
chromophoric configurations includes azo (-N-N-), carbonyl (=C=O); carbon
(=C=C=); carbon-nitrogen (>C=NH or –CH=N-); nitroso (-NO or N-OH); nitro (NO2
or = NO-OH); and sulphur (C=S). The chromogen, which is the aromatic structure
normally containing benzene, naphthalene or anthracene rings, is part of a
chromogen-chromophore structure along with an auxochrome. The presence of
ionising groups known as auxochromes results in a much stronger alteration of the
maximum absorption of the compound and provides a bonding affinity. Some
common auxochrome groups include – NH2, -COOH, -HSO3, -OH1. A detailed
classification of dyes including some structures is provided in The Colour Index
(C.I.)2.
Coloured dye wastewater arises as a direct result of the production of the dye
and also as a consequence of its use in the textile and other industries. There are more
than 100,000 commercially available dyes with over 7 x10⁵ tonnes of dyes produced
annually3. It is estimated that 2% of dyes produced annually are discharged in effluent
from manufacturing operations whilst 10% was discharged from textile and associated
industries4. Use of reactive dyes is increasing5 . The rapid growth rate in the use of
reactive dyes is due to the increasing use of cellulosic fibres and the technical and
economic limitations of other dyes used for these fibres5-6.
Neglecting the aesthetic problem, the greatest environmental concern with
dyes is their absorption and reflecting of sunlight entering the water which interferes
with the growth of bacteria to level insufficient to biologically degrade impurities in
the water7. Colour in effluents can cause problems in several ways: dyes can have
actual and/or chronic effects on exposed organisms depending on the exposure time
and dye concentration; dyes are inherently highly visible meaning that concentrations
as low as 0.005 ppm capture the attention of both the public and the authorities8; dyes
absorb and reflect sunlight entering water and so can interfere with the growth of
bacteria and hinder photosynthesis in aquatic plants9.
323
4.9 Colour Adsorption
Adsorption techniques for wastewater treatment have become more popular in
recent years owing to their efficiency in the removal of pollutants to stable for
biological methods. Adsorption can produce high quality water while also being a
process that is economically feasible10. Decolourisation is a result of two mechanisms
– adsorption and ion exchange9 and is influenced by many factors including
dyes/sorbent interaction, sorbent surface area, particle size, temperature, pH and
contact time.
Consequently, the removal of pollutants from aqueous effluents is of
significant environmental, technical and commercial importance. Different process for
removal of dye from industrial wastewaters has been reported in the past11-14. Over the
years the adsorption process has emerged as a viable and effective alternative to most
of these conventional treatment techniques which are rather expensive. A large
number of low-cost adsorbents have been utilized for the removal studies of dyes and
the search for more cheaper and effective adsorbents still continues unabated.
In the present work, the adsorption studies of some dyes namely Methylene
Blue, Methylene Red and Malachite Green were carried on to naturally occuring and
easily available low cost adsorbents viz. Marble (M.), Rajasthan Red Kotta (R),
Kadappa (K), Granite (G) building waste material naturally dried, powered, processed
and finally used as adsorbent for the removal of these dyes. Literature survey reveals
that the work carried by different researchers15-16 showed the effective and efficient
adsorbative capacity of acid treated adsorbent. It gives us an idea whether acid treated
can work and give good adsorption results. Surprisingly acid treated MRKG showed
encouraging results of adsorption of acid dyes from solution. It appears, acid
treatment of adsorbent MRKG increase surface porosity, surface area, surface activity
and surface roughness. The observation also corroborated by the studies of acid
treatment on bentonite and soil17-18 The adsorption efficiency depends on interfacial
tension between acid dye, and MRKG, surface activity of the adsorbent. Our studies
on MRKG shows that there is an great increase in adsorption capacity of adsorbent in
removal of an ionic dye solution after treatment of adsorbent. This can be attributed to
increase in surface activity of adsorbent and the dye solution in contact with surface
of adsorbent, initially the intermolecular forces of dye, and surface of the adsorbent
are strong and becomes weak towards saturation. It was confirmed from 'L' type
324
Giles19 isotherm. The present study is aimed to find the effect of treatment of
adsorbent with mineral acids viz. H2SO4 creates an ideal condition for facile
adsorption of acid dyes to the surface.
4.10 Effect of pH
The pH of the medium has been found to play an important role in deciding
not only the extent but some times even the actual nature of adsorption of given
system20. It is therefore, necessary to make the proper adjustment in the pH of a
system to obtain the desired results. Studies employing dyes or ionic species as the
adsorbate and various adsorbents of common use (e.g. metal, their oxides and
hydroxides, clay, mineral, charcoal and plant material) indicate that the choice of the
pH range for favourable adsorption depends on the adsorbate-adsorbent pair. Both
acidic and basic media of pH range were found to be suitable for different adsobate-
adsorbent system. With some system large adsorption was seen in acidic medium
while with some other system basic medium was found suitable. The acidic medium
favoured21-22 the adsorption of chloride, sulphate onto soil and number of paraffin
chains onto cotton and wool. Similar results have also been observed using dyestuffs
as the adsorbate. The large adsorption of Acid Green Anthraquinone onto the surface
of organo silicia23 crystal violet onto polymer24 chrome dye onto activated carbon25 ,
fly ash26, acid dyes on neutral alumina27 and acid dyes on rice husk ash28.
On the other hand, in many cases especially with cationic types of adsorbate,
basic medium was found to be favourable for large desorption. Examples of such are
the adsorption of bromocresol green and bromothymol blue onto polymer23 synthetic
basic dyes onto activated sludge29 several heavy cations (dodecyltrimenthyl
ammonium and cetyltrimethyl ions) onto silica. An increase in adsorption of Acid Red
– 14 and Reactive blue –14 onto silica-magnesia mix gel30as well as in the adsorption
of basic dyes Methylene blue, Crystal violet, Malachite green and Rhodamine B on
iron oxide, silica and other materials31-35. In some cases the adsorption was found to
be maximum at a certain pH value. Such result have been observed by the adsorption
of congo red onto wollastonite36 ostrazone blue BG-onto polyester. The results show
two maxima37 as well as no marked variation in the amount adsorbed over an
appreciable pH range are also known. It has been reported38 that there is no such
325
change in the amount adsorbed in the adsorption of acid dyes onto polymer as a result
of variation in the pH of solution.
In the present investigation a known amount of the adsorbent was kept in
contact with a fixed volume of dye solution of which the pH was pre-adjusted for
definite value. The necessary pH of the solution was obtained using hydrochloric acid
and sodium hydroxide respectively for acidic and basic range of pH. For the
adjustment of pH of the dye solution, calculated volumes of standard solution of acid
or alkali were used. The volume were adjusted in such a way, which on addition to a
fixed volume, that were excepted to give required pH in the resulting dye solution.
Before use in the adsorption experiments the pH of the experimental solution was
measured using a glass electrode with the help of an electronic digital pH meter
(Equiptronic 203). The sample solutions withdrawn at various time intervals were
used for measuring the corresponding concentration of the residual dye solution, value
then obtained were employed for the estimation of the amount adsorbed on to the
surface. As the adsorbent is treated with dilute acid, the residual pH lies in between 5
to 5.5. Hence necessary precautions were taken while adjusting the pH of the solution
during experiment. For sake of, convenience the experiment were carried out using
pH electrode deep in the solution to get perfect value of pH. Experiments at higher pH
(7.20) were carried out by adding little quantity of base to adjust the pH properly with
desired value.
As the aim of the present experiments was to see the influence of pH on the
time rate study of adsorption, the necessary precaution were taken while adjusting the
pH of solution i.e. there was no change in colour appearance of the dye under these
extreme conditions40-41. Therefore, for the present study as all the dyes are acidic
dyes, the selection of the pH value were restricted with a conveniently small range 2
to 7. However the selection is based on trial experiments of colour appearance and
change in concentration. In the present investigation the adsorption of Methylene
Blue, Methylene red and Malachite Green onto the surface of MRKG. The
consolidated results for adsorption of acid dyes with change in pH are summarised in
table No.9.0.3, 10.0.3, 11.0.3, 12.0.3, 13.0.3, 14.0.3, 15.0.3, 9.1.3, 10.1.3, 11.1.3,
12.1.3, 13.1.3, 14.1.3, 15.1.3, 9.2.3, 10.2.3, 11.2.3, 12.2.3, 13.2.3, 14.2.3, 15.2.3
respectively in section B of chapter 3.
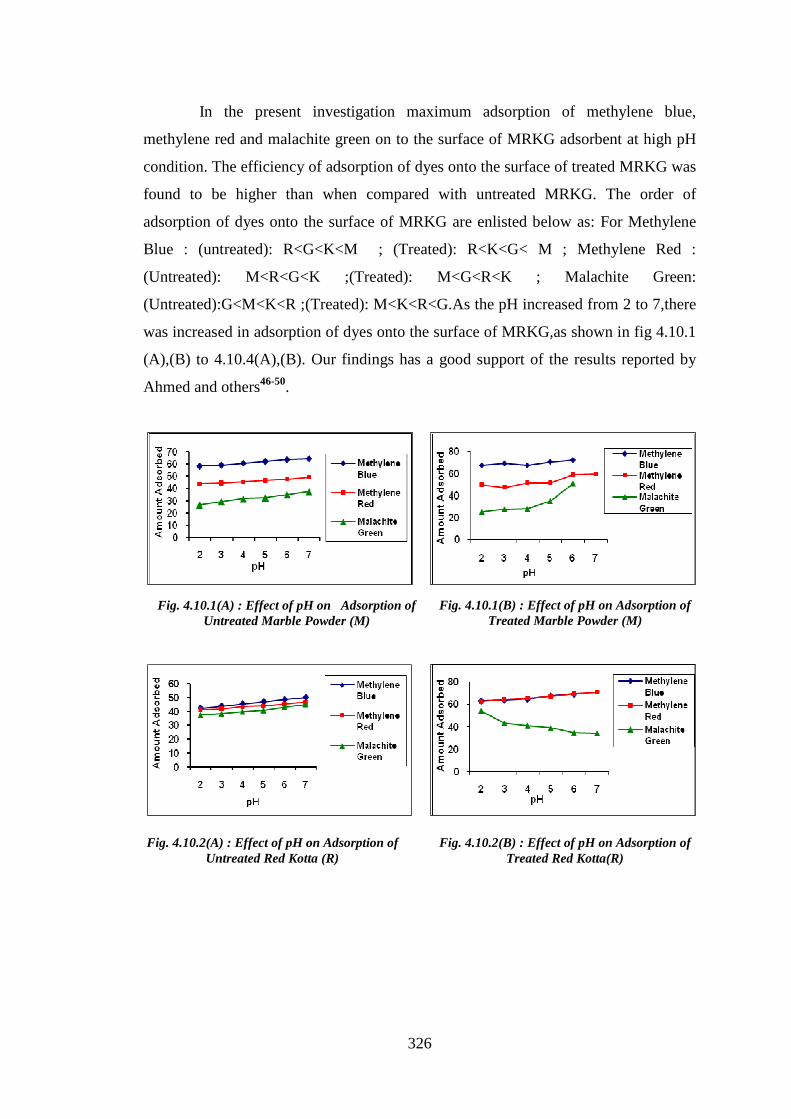
326
In the present investigation maximum adsorption of methylene blue,
methylene red and malachite green on to the surface of MRKG adsorbent at high pH
condition. The efficiency of adsorption of dyes onto the surface of treated MRKG was
found to be higher than when compared with untreated MRKG. The order of
adsorption of dyes onto the surface of MRKG are enlisted below as: For Methylene
Blue : (untreated): R<G<K<M ; (Treated): R<K<G< M ; Methylene Red :
(Untreated): M<R<G<K ;(Treated): M<G<R<K ; Malachite Green:
(Untreated):G<M<K<R ;(Treated): M<K<R<G.As the pH increased from 2 to 7,there
was increased in adsorption of dyes onto the surface of MRKG,as shown in fig 4.10.1
(A),(B) to 4.10.4(A),(B). Our findings has a good support of the results reported by
Ahmed and others46-50.
Fig. 4.10.1(A) : Effect of pH on Adsorption of Untreated Marble Powder (M)
Fig. 4.10.1(B) : Effect of pH on Adsorption of Treated Marble Powder (M)
Fig. 4.10.2(A) : Effect of pH on Adsorption of Untreated Red Kotta (R)
Fig. 4.10.2(B) : Effect of pH on Adsorption of Treated Red Kotta(R)
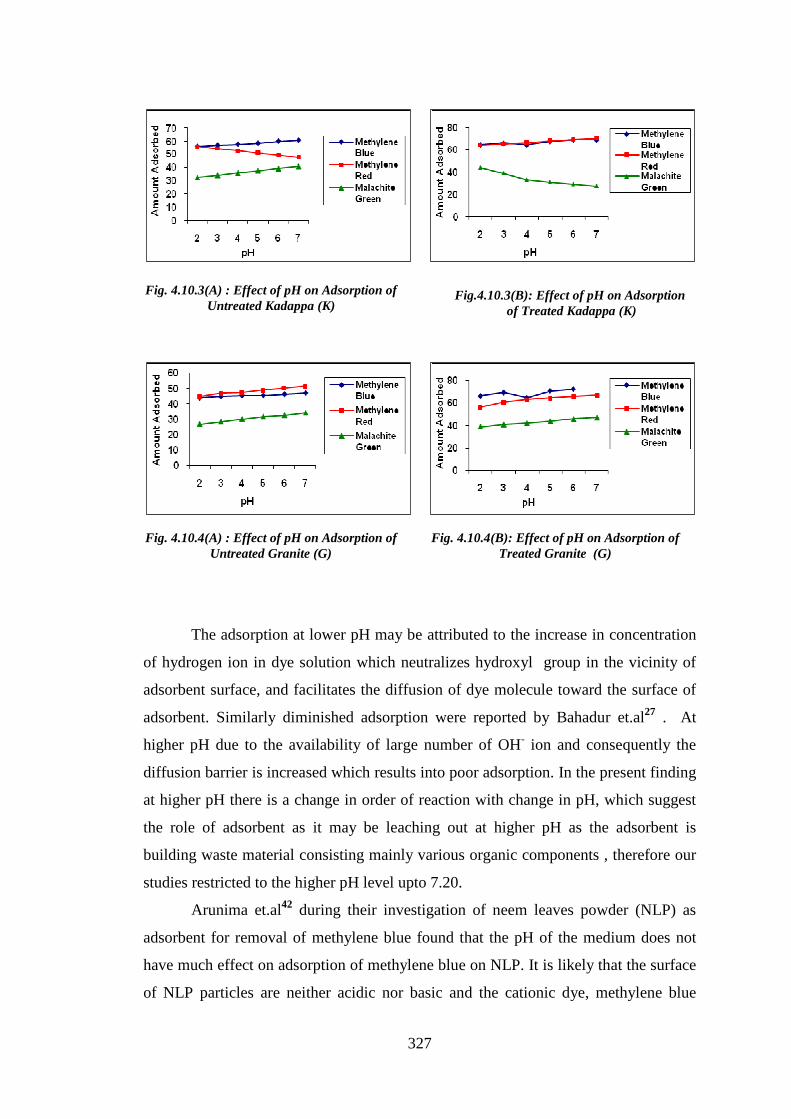
327
The adsorption at lower pH may be attributed to the increase in concentration
of hydrogen ion in dye solution which neutralizes hydroxyl group in the vicinity of
adsorbent surface, and facilitates the diffusion of dye molecule toward the surface of
adsorbent. Similarly diminished adsorption were reported by Bahadur et.al27 . At
higher pH due to the availability of large number of OH- ion and consequently the
diffusion barrier is increased which results into poor adsorption. In the present finding
at higher pH there is a change in order of reaction with change in pH, which suggest
the role of adsorbent as it may be leaching out at higher pH as the adsorbent is
building waste material consisting mainly various organic components , therefore our
studies restricted to the higher pH level upto 7.20.
Arunima et.al42 during their investigation of neem leaves powder (NLP) as
adsorbent for removal of methylene blue found that the pH of the medium does not
have much effect on adsorption of methylene blue on NLP. It is likely that the surface
of NLP particles are neither acidic nor basic and the cationic dye, methylene blue
Fig.4.10.3(B): Effect of pH on Adsorption of Treated Kadappa (K)
Fig. 4.10.4(A) : Effect of pH on Adsorption of Untreated Granite (G)
Fig. 4.10.4(B): Effect of pH on Adsorption of Treated Granite (G)
Fig. 4.10.3(A) : Effect of pH on Adsorption of Untreated Kadappa (K)
328
seems to have equal preference for the adsorption sites at all pH values. Mehmet
Dogan et.al43 studied adsorption isotherms at various pH's (3,5,7,9, and 11) and
reported that the adsorbed amount of acid yellow 49 on decreased with increase in pH
values. The surface is positive at low pH and is negative at higher pH. As the pH of
dye solution becomes lower than pH = 6.6, the association of dye anion with more
positively charge surface.
Alok Mittal et.al44 during their investigation carried pH measurements in the
pH range 2-6 and found that with increase in pH a decrease in the adsorption of the
dye over feathers (adsorbent) was observed. The maximum uptake of the dye took
place around pH 2.0 and beyond pH 4.0 the adsorption of the dye was almost
negligible. Thus pH 2.0 was selected for all subsequent studies. A continuous
decrease in the adsorption with increasing pH indicates possibility of development of
positive charge on the Hens feathers, which inhibits the adsorption of dye over it.
Ubale et.al45 during their adsorptions study of phenol on Goda sand found that
there is increased adsorption with increase in pH which may be attributed to the
binding of phenol molecules to the Goda sand (adsorbent) whereas lower adsorptions
may be attributed to the presence of excess hydrogen ion which lowers binding of
phenol molecules on Goda Sand.
4.11 Effect of adsorbent dose
Effect of adsorbent dose plays an important role in standardising the
adsorption process with quantification of adsorbate solution and the adsorbent. The
series of experiments with different amount of approximate concentration. The
adsorbent treated with acid due to its increase high adsorption capacity moderate
amount of adsorbent ranging from 1.0 g to 5.0 g required for 100 ml. The actual
amounts adsorbed at equilibrium with saturation time is given in table No. 9.0.2,
10.0.2, 11.0.2, 12.0.2, 13.0.2, 14.0.2, 15.0.2, 16.0.2, 9.1.2, 10.1.2, 11.1.2, 12.1.2,
13.1.2, 14.1.2, 15.1.2, 16.1.2, 9.2.2, 10.2.2, 11.2.2, 12.2.2, 13.2.2, 14.2.2, 15.2.2,
16.2.2 of section B Chapter 3.
The adsorption of Methylene Blue, Methylene Red and Malachite Green on to
the surface of various dose of MRKG adsorbent and its removal in percentage after 60
minutes is shown in figures 4.11.1 (A),(B) to 4.11.4 (A),(B).
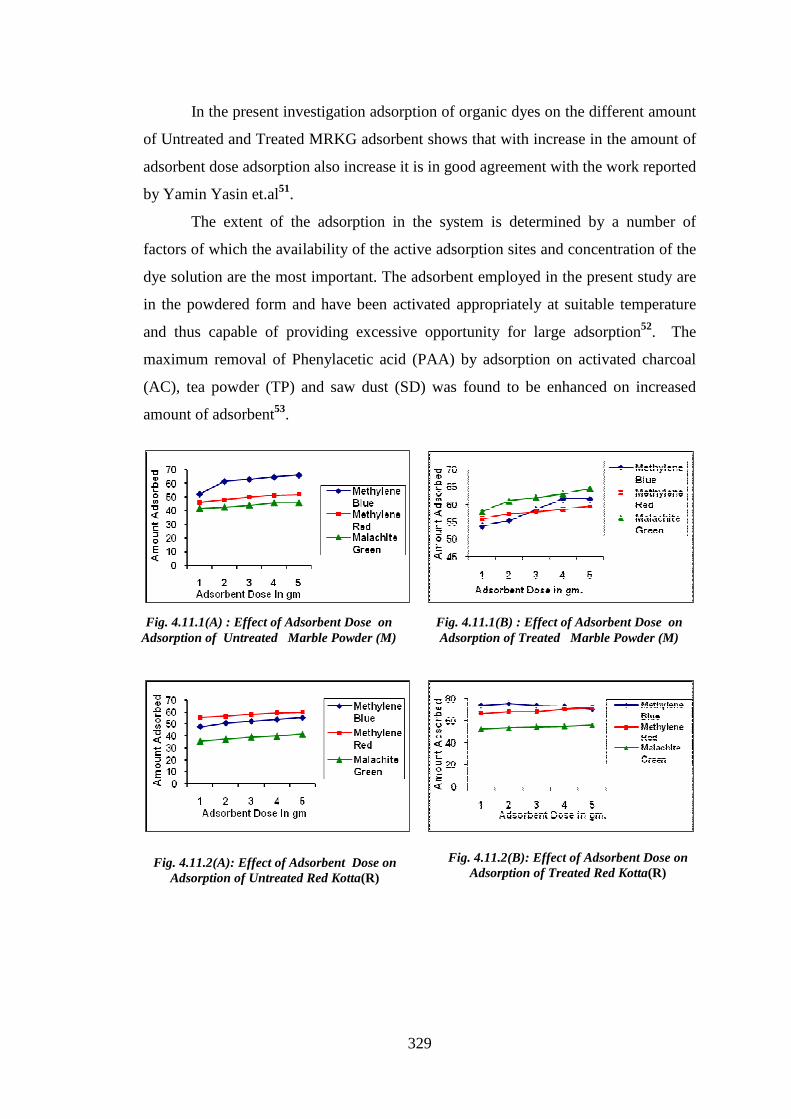
329
In the present investigation adsorption of organic dyes on the different amount
of Untreated and Treated MRKG adsorbent shows that with increase in the amount of
adsorbent dose adsorption also increase it is in good agreement with the work reported
by Yamin Yasin et.al51.
The extent of the adsorption in the system is determined by a number of
factors of which the availability of the active adsorption sites and concentration of the
dye solution are the most important. The adsorbent employed in the present study are
in the powdered form and have been activated appropriately at suitable temperature
and thus capable of providing excessive opportunity for large adsorption52. The
maximum removal of Phenylacetic acid (PAA) by adsorption on activated charcoal
(AC), tea powder (TP) and saw dust (SD) was found to be enhanced on increased
amount of adsorbent53.
Fig. 4.11.1(A) : Effect of Adsorbent Dose on Adsorption of Untreated Marble Powder (M)
Fig. 4.11.1(B) : Effect of Adsorbent Dose on Adsorption of Treated Marble Powder (M)
Fig. 4.11.2(A): Effect of Adsorbent Dose on Adsorption of Untreated Red Kotta(R)
Fig. 4.11.2(B): Effect of Adsorbent Dose on Adsorption of Treated Red Kotta(R)
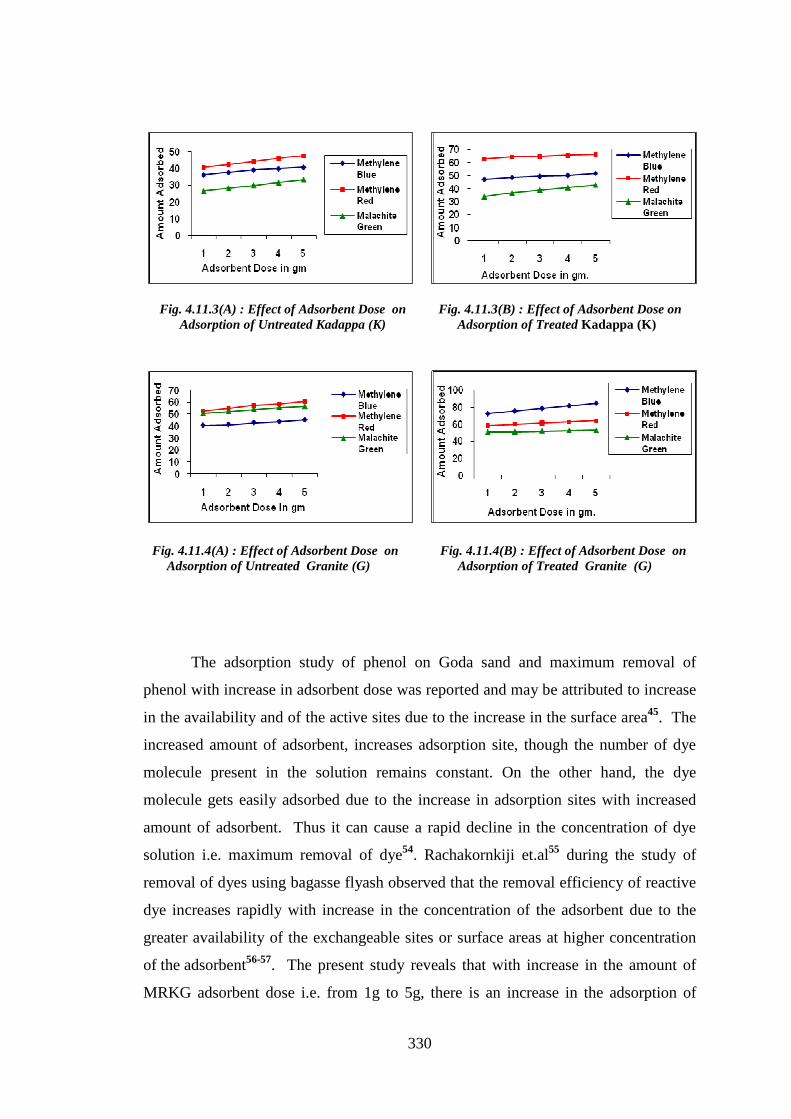
330
The adsorption study of phenol on Goda sand and maximum removal of
phenol with increase in adsorbent dose was reported and may be attributed to increase
in the availability and of the active sites due to the increase in the surface area45. The
increased amount of adsorbent, increases adsorption site, though the number of dye
molecule present in the solution remains constant. On the other hand, the dye
molecule gets easily adsorbed due to the increase in adsorption sites with increased
amount of adsorbent. Thus it can cause a rapid decline in the concentration of dye
solution i.e. maximum removal of dye54. Rachakornkiji et.al55 during the study of
removal of dyes using bagasse flyash observed that the removal efficiency of reactive
dye increases rapidly with increase in the concentration of the adsorbent due to the
greater availability of the exchangeable sites or surface areas at higher concentration
of the adsorbent56-57. The present study reveals that with increase in the amount of
MRKG adsorbent dose i.e. from 1g to 5g, there is an increase in the adsorption of
Fig. 4.11.3(B) : Effect of Adsorbent Dose on Adsorption of Treated Kadappa (K)
Fig. 4.11.3(A) : Effect of Adsorbent Dose on Adsorption of Untreated Kadappa (K)
Fig. 4.11.4(A) : Effect of Adsorbent Dose on Adsorption of Untreated Granite (G)
Fig. 4.11.4(B) : Effect of Adsorbent Dose on Adsorption of Treated Granite (G)
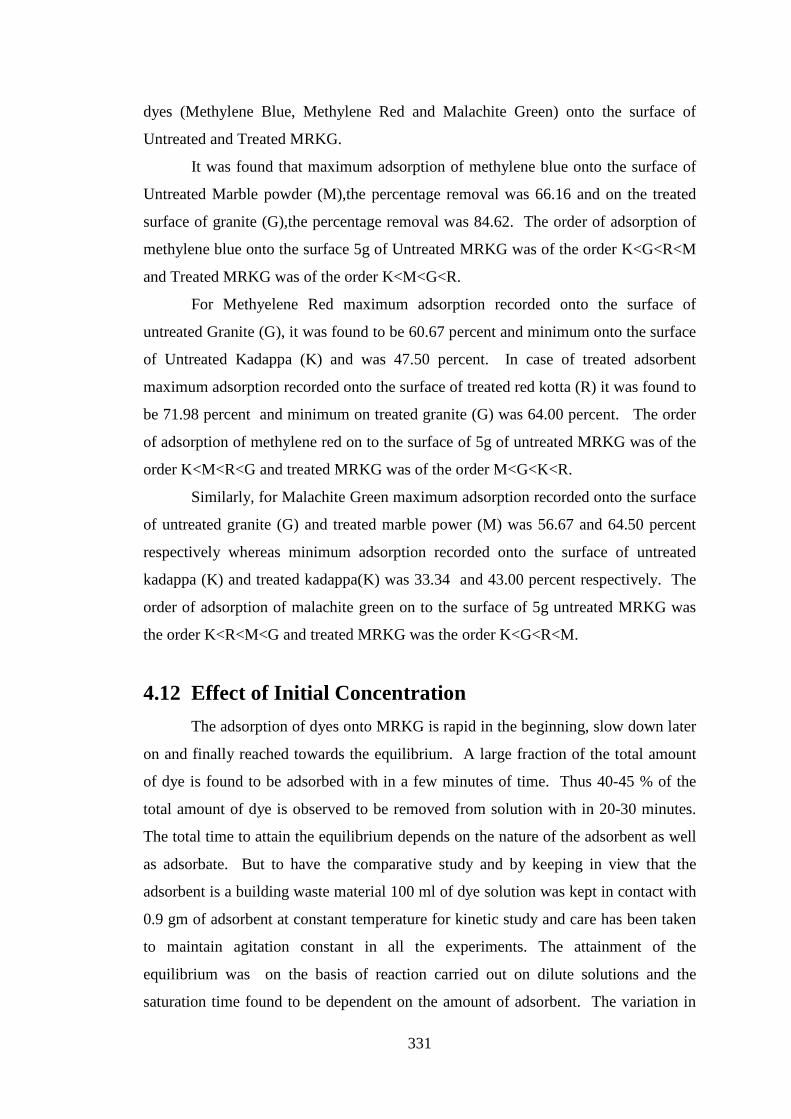
331
dyes (Methylene Blue, Methylene Red and Malachite Green) onto the surface of
Untreated and Treated MRKG.
It was found that maximum adsorption of methylene blue onto the surface of
Untreated Marble powder (M),the percentage removal was 66.16 and on the treated
surface of granite (G),the percentage removal was 84.62. The order of adsorption of
methylene blue onto the surface 5g of Untreated MRKG was of the order K<G<R<M
and Treated MRKG was of the order K<M<G<R.
For Methyelene Red maximum adsorption recorded onto the surface of
untreated Granite (G), it was found to be 60.67 percent and minimum onto the surface
of Untreated Kadappa (K) and was 47.50 percent. In case of treated adsorbent
maximum adsorption recorded onto the surface of treated red kotta (R) it was found to
be 71.98 percent and minimum on treated granite (G) was 64.00 percent. The order
of adsorption of methylene red on to the surface of 5g of untreated MRKG was of the
order K<M<R<G and treated MRKG was of the order M<G<K<R.
Similarly, for Malachite Green maximum adsorption recorded onto the surface
of untreated granite (G) and treated marble power (M) was 56.67 and 64.50 percent
respectively whereas minimum adsorption recorded onto the surface of untreated
kadappa (K) and treated kadappa(K) was 33.34 and 43.00 percent respectively. The
order of adsorption of malachite green on to the surface of 5g untreated MRKG was
the order K<R<M<G and treated MRKG was the order K<G<R<M.
4.12 Effect of Initial Concentration
The adsorption of dyes onto MRKG is rapid in the beginning, slow down later
on and finally reached towards the equilibrium. A large fraction of the total amount
of dye is found to be adsorbed with in a few minutes of time. Thus 40-45 % of the
total amount of dye is observed to be removed from solution with in 20-30 minutes.
The total time to attain the equilibrium depends on the nature of the adsorbent as well
as adsorbate. But to have the comparative study and by keeping in view that the
adsorbent is a building waste material 100 ml of dye solution was kept in contact with
0.9 gm of adsorbent at constant temperature for kinetic study and care has been taken
to maintain agitation constant in all the experiments. The attainment of the
equilibrium was on the basis of reaction carried out on dilute solutions and the
saturation time found to be dependent on the amount of adsorbent. The variation in
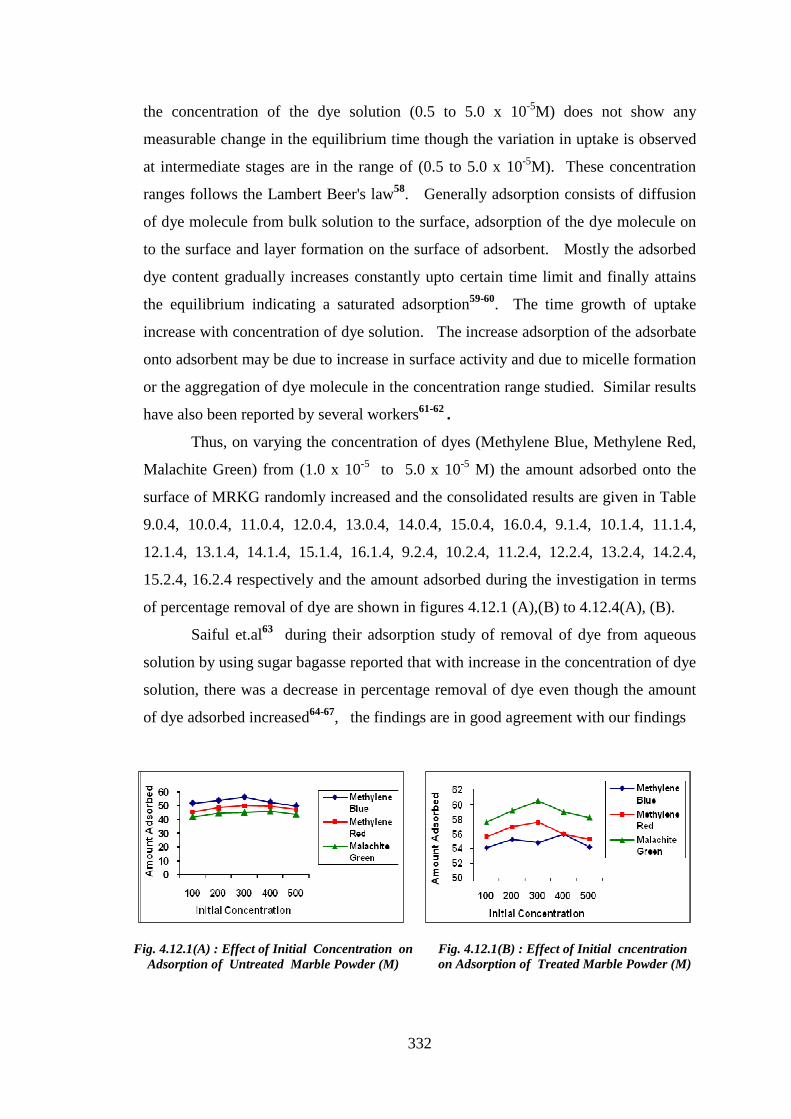
332
the concentration of the dye solution (0.5 to 5.0 x 10⁻⁵M) does not show any
measurable change in the equilibrium time though the variation in uptake is observed
at intermediate stages are in the range of (0.5 to 5.0 x 10⁻⁵M). These concentration
ranges follows the Lambert Beer's law58. Generally adsorption consists of diffusion
of dye molecule from bulk solution to the surface, adsorption of the dye molecule on
to the surface and layer formation on the surface of adsorbent. Mostly the adsorbed
dye content gradually increases constantly upto certain time limit and finally attains
the equilibrium indicating a saturated adsorption59-60. The time growth of uptake
increase with concentration of dye solution. The increase adsorption of the adsorbate
onto adsorbent may be due to increase in surface activity and due to micelle formation
or the aggregation of dye molecule in the concentration range studied. Similar results
have also been reported by several workers61-62 .
Thus, on varying the concentration of dyes (Methylene Blue, Methylene Red,
Malachite Green) from (1.0 x 10⁻⁵ to 5.0 x 10⁻⁵ M) the amount adsorbed onto the
surface of MRKG randomly increased and the consolidated results are given in Table
9.0.4, 10.0.4, 11.0.4, 12.0.4, 13.0.4, 14.0.4, 15.0.4, 16.0.4, 9.1.4, 10.1.4, 11.1.4,
12.1.4, 13.1.4, 14.1.4, 15.1.4, 16.1.4, 9.2.4, 10.2.4, 11.2.4, 12.2.4, 13.2.4, 14.2.4,
15.2.4, 16.2.4 respectively and the amount adsorbed during the investigation in terms
of percentage removal of dye are shown in figures 4.12.1 (A),(B) to 4.12.4(A), (B).
Saiful et.al63 during their adsorption study of removal of dye from aqueous
solution by using sugar bagasse reported that with increase in the concentration of dye
solution, there was a decrease in percentage removal of dye even though the amount
of dye adsorbed increased64-67, the findings are in good agreement with our findings
Fig. 4.12.1(A) : Effect of Initial Concentration on Adsorption of Untreated Marble Powder (M)
Fig. 4.12.1(B) : Effect of Initial cncentration on Adsorption of Treated Marble Powder (M)
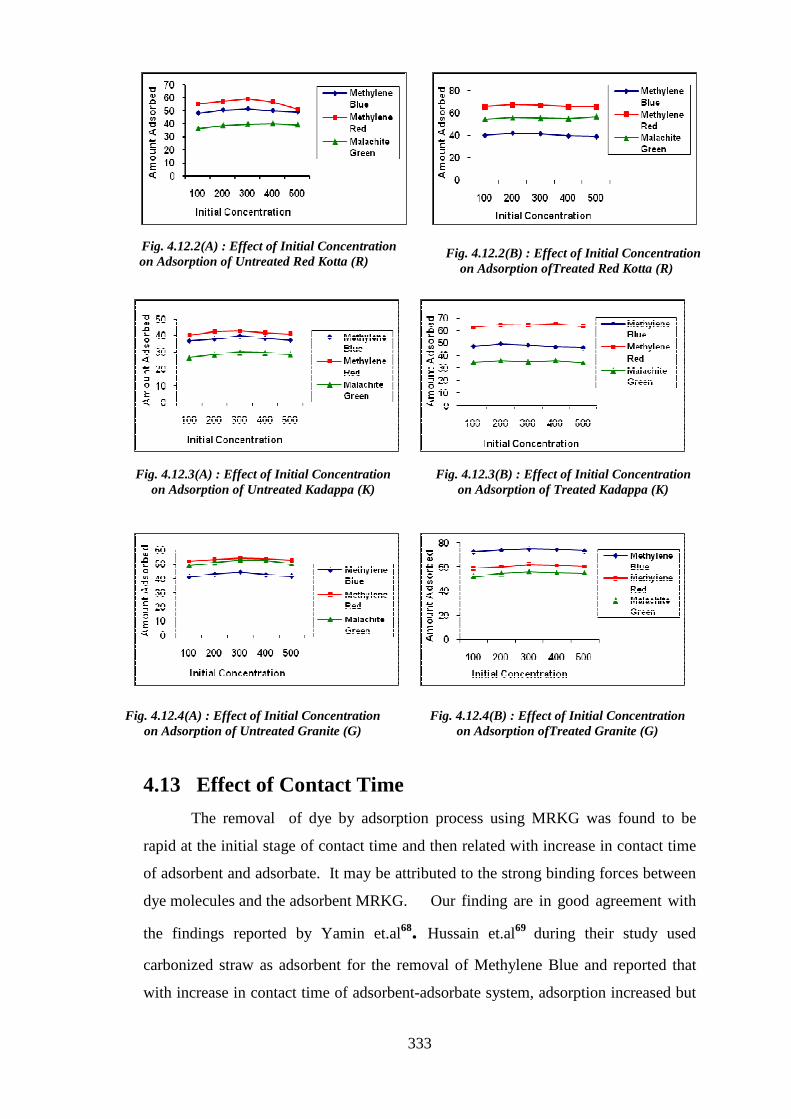
333
4.13 Effect of Contact Time
The removal of dye by adsorption process using MRKG was found to be
rapid at the initial stage of contact time and then related with increase in contact time
of adsorbent and adsorbate. It may be attributed to the strong binding forces between
dye molecules and the adsorbent MRKG. Our finding are in good agreement with
the findings reported by Yamin et.al68. Hussain et.al69 during their study used
carbonized straw as adsorbent for the removal of Methylene Blue and reported that
with increase in contact time of adsorbent-adsorbate system, adsorption increased but
Fig. 4.12.2(A) : Effect of Initial Concentration on Adsorption of Untreated Red Kotta (R)
Fig. 4.12.2(B) : Effect of Initial Concentration on Adsorption ofTreated Red Kotta (R)
Fig. 4.12.3(A) : Effect of Initial Concentration on Adsorption of Untreated Kadappa (K)
Fig. 4.12.3(B) : Effect of Initial Concentration on Adsorption of Treated Kadappa (K)
Fig. 4.12.4(A) : Effect of Initial Concentration on Adsorption of Untreated Granite (G)
Fig. 4.12.4(B) : Effect of Initial Concentration on Adsorption ofTreated Granite (G)
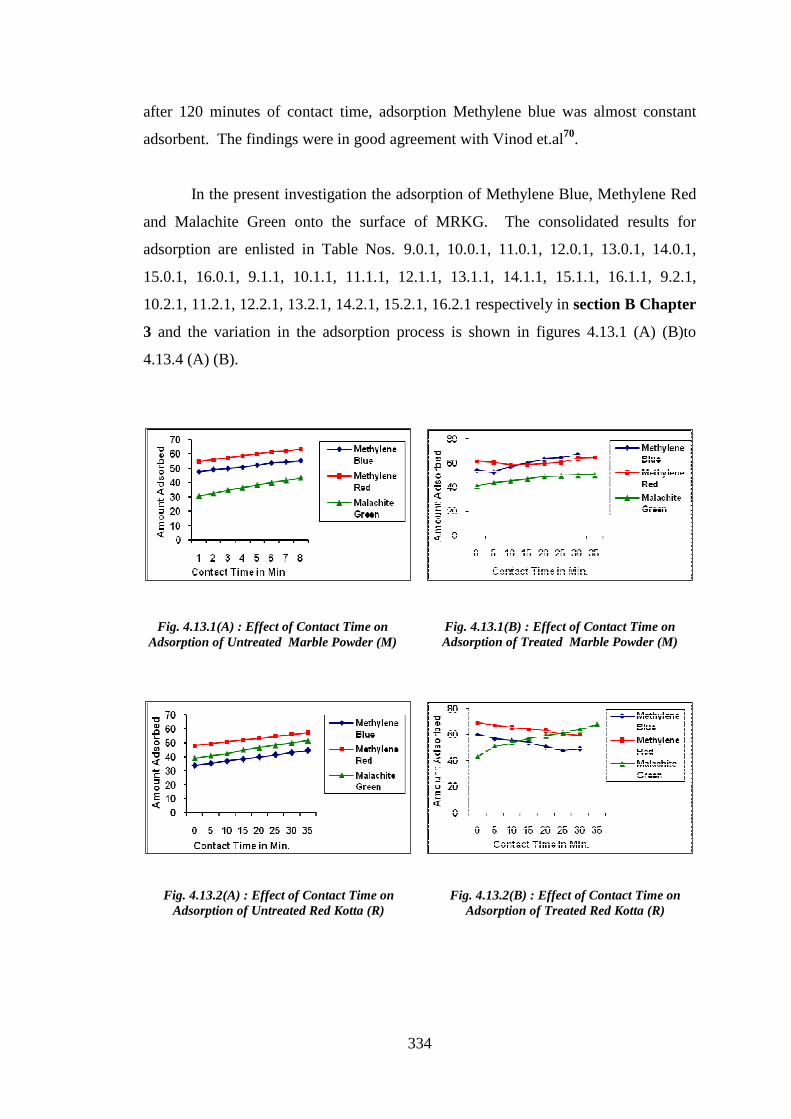
334
after 120 minutes of contact time, adsorption Methylene blue was almost constant
adsorbent. The findings were in good agreement with Vinod et.al70.
In the present investigation the adsorption of Methylene Blue, Methylene Red
and Malachite Green onto the surface of MRKG. The consolidated results for
adsorption are enlisted in Table Nos. 9.0.1, 10.0.1, 11.0.1, 12.0.1, 13.0.1, 14.0.1,
15.0.1, 16.0.1, 9.1.1, 10.1.1, 11.1.1, 12.1.1, 13.1.1, 14.1.1, 15.1.1, 16.1.1, 9.2.1,
10.2.1, 11.2.1, 12.2.1, 13.2.1, 14.2.1, 15.2.1, 16.2.1 respectively in section B Chapter
3 and the variation in the adsorption process is shown in figures 4.13.1 (A) (B)to
4.13.4 (A) (B).
Fig. 4.13.1(A) : Effect of Contact Time on Adsorption of Untreated Marble Powder (M)
Fig. 4.13.1(B) : Effect of Contact Time on Adsorption of Treated Marble Powder (M)
Fig. 4.13.2(A) : Effect of Contact Time on Adsorption of Untreated Red Kotta (R)
Fig. 4.13.2(B) : Effect of Contact Time on Adsorption of Treated Red Kotta (R)
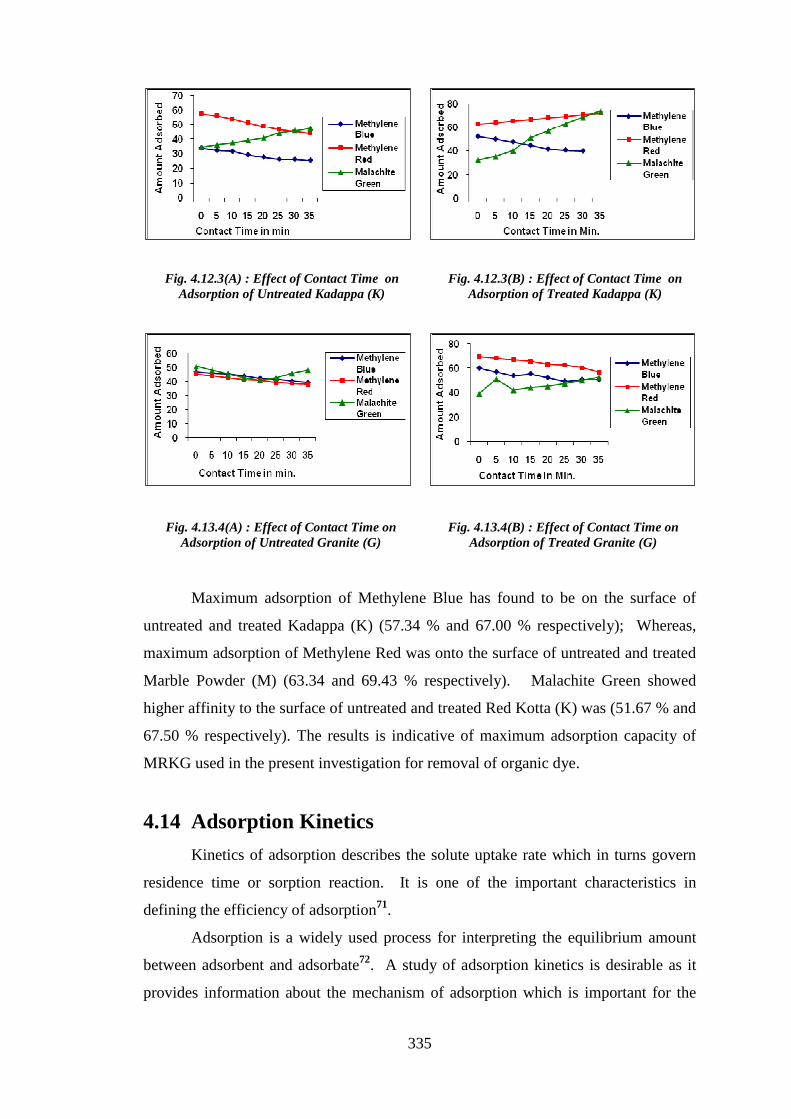
335
Maximum adsorption of Methylene Blue has found to be on the surface of
untreated and treated Kadappa (K) (57.34 % and 67.00 % respectively); Whereas,
maximum adsorption of Methylene Red was onto the surface of untreated and treated
Marble Powder (M) (63.34 and 69.43 % respectively). Malachite Green showed
higher affinity to the surface of untreated and treated Red Kotta (K) was (51.67 % and
67.50 % respectively). The results is indicative of maximum adsorption capacity of
MRKG used in the present investigation for removal of organic dye.
4.14 Adsorption Kinetics
Kinetics of adsorption describes the solute uptake rate which in turns govern
residence time or sorption reaction. It is one of the important characteristics in
defining the efficiency of adsorption71.
Adsorption is a widely used process for interpreting the equilibrium amount
between adsorbent and adsorbate72. A study of adsorption kinetics is desirable as it
provides information about the mechanism of adsorption which is important for the
Fig. 4.12.3(A) : Effect of Contact Time on Adsorption of Untreated Kadappa (K)
Fig. 4.13.4(A) : Effect of Contact Time on Adsorption of Untreated Granite (G)
Fig. 4.13.4(B) : Effect of Contact Time on Adsorption of Treated Granite (G)
Fig. 4.12.3(B) : Effect of Contact Time on Adsorption of Treated Kadappa (K)
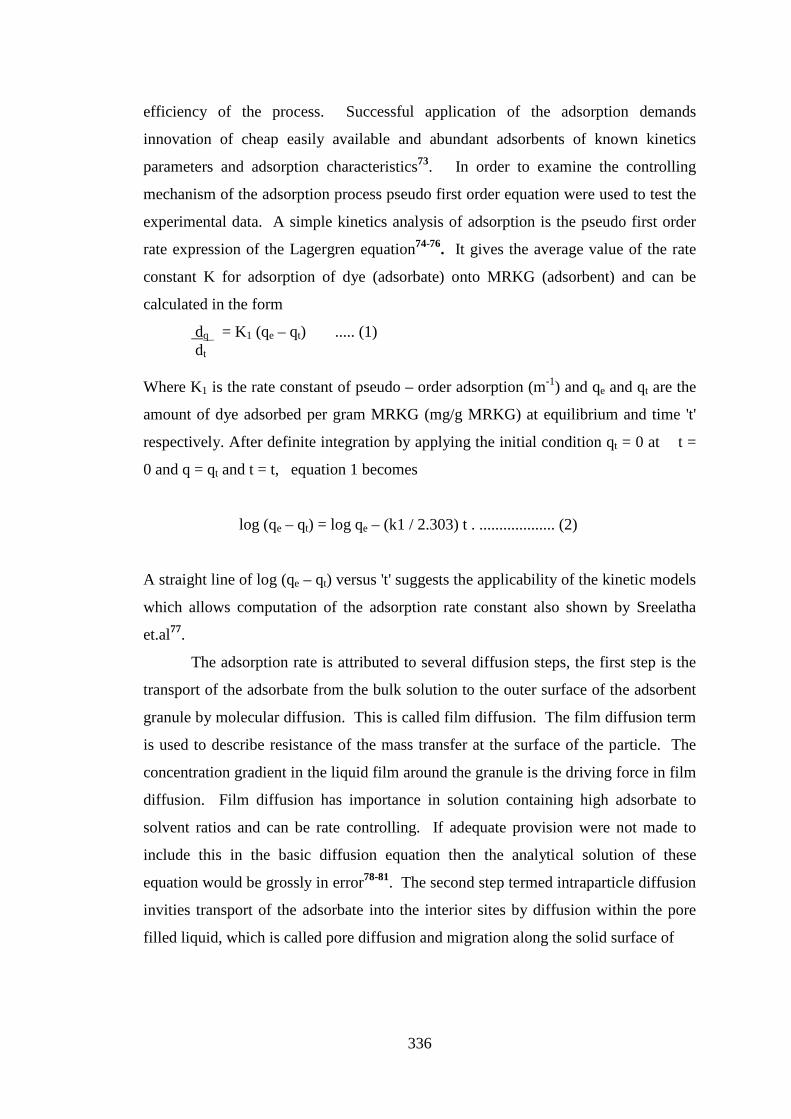
336
efficiency of the process. Successful application of the adsorption demands
innovation of cheap easily available and abundant adsorbents of known kinetics
parameters and adsorption characteristics73. In order to examine the controlling
mechanism of the adsorption process pseudo first order equation were used to test the
experimental data. A simple kinetics analysis of adsorption is the pseudo first order
rate expression of the Lagergren equation74-76. It gives the average value of the rate
constant K for adsorption of dye (adsorbate) onto MRKG (adsorbent) and can be
calculated in the form
dq = K1 (qe – qt) ..... (1) dt
Where K1 is the rate constant of pseudo – order adsorption (m-1) and qe and qt are the
amount of dye adsorbed per gram MRKG (mg/g MRKG) at equilibrium and time 't'
respectively. After definite integration by applying the initial condition qt = 0 at t =
0 and q = qt and t = t, equation 1 becomes
log (qe – qt) = log qe – (k1 / 2.303) t . ................... (2)
A straight line of log (qe – qt) versus 't' suggests the applicability of the kinetic models
which allows computation of the adsorption rate constant also shown by Sreelatha
et.al77.
The adsorption rate is attributed to several diffusion steps, the first step is the
transport of the adsorbate from the bulk solution to the outer surface of the adsorbent
granule by molecular diffusion. This is called film diffusion. The film diffusion term
is used to describe resistance of the mass transfer at the surface of the particle. The
concentration gradient in the liquid film around the granule is the driving force in film
diffusion. Film diffusion has importance in solution containing high adsorbate to
solvent ratios and can be rate controlling. If adequate provision were not made to
include this in the basic diffusion equation then the analytical solution of these
equation would be grossly in error78-81. The second step termed intraparticle diffusion
invities transport of the adsorbate into the interior sites by diffusion within the pore
filled liquid, which is called pore diffusion and migration along the solid surface of
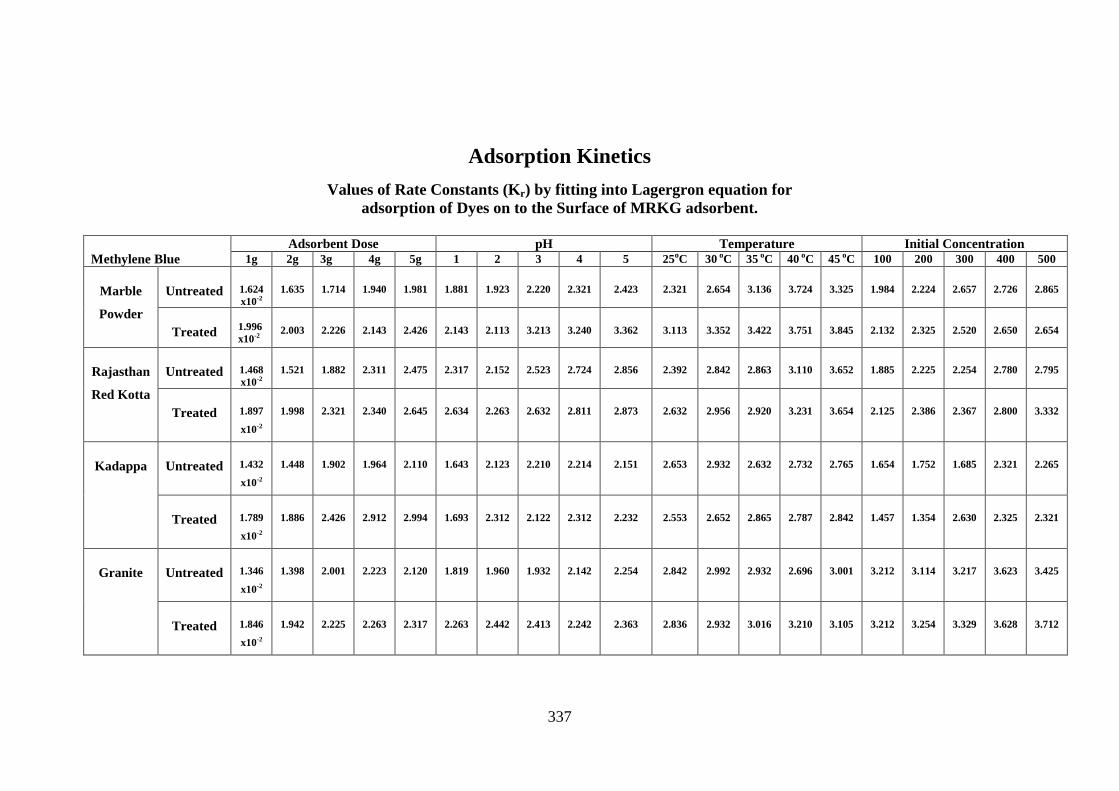
337
Adsorption Kinetics
Values of Rate Constants (Kr) by fitting into Lagergron equation for adsorption of Dyes on to the Surface of MRKG adsorbent.
Methylene Blue Adsorbent Dose pH Temperature Initial Concentration
1g 2g 3g 4g 5g 1 2 3 4 5 25oC 30 oC 35 oC 40 oC 45 oC 100 200 300 400 500
Marble
Powder
Untreated 1.624 x10⁻²
1.635 1.714 1.940 1.981 1.881 1.923 2.220 2.321 2.423 2.321 2.654 3.136 3.724 3.325 1.984 2.224 2.657 2.726 2.865
Treated 1.996 x10⁻²
2.003 2.226 2.143 2.426 2.143 2.113 3.213 3.240 3.362 3.113 3.352 3.422 3.751 3.845 2.132 2.325 2.520 2.650 2.654
Rajasthan
Red Kotta
Untreated 1.468 x10⁻²
1.521 1.882 2.311 2.475 2.317 2.152 2.523 2.724 2.856 2.392 2.842 2.863 3.110 3.652 1.885 2.225 2.254 2.780 2.795
Treated 1.897
x10-2
1.998 2.321 2.340 2.645 2.634 2.263 2.632 2.811 2.873 2.632 2.956 2.920 3.231 3.654 2.125 2.386 2.367 2.800 3.332
Kadappa Untreated 1.432
x10-2
1.448 1.902 1.964 2.110 1.643 2.123 2.210 2.214 2.151 2.653 2.932 2.632 2.732 2.765 1.654 1.752 1.685 2.321 2.265
Treated 1.789
x10-2
1.886 2.426 2.912 2.994 1.693 2.312 2.122 2.312 2.232 2.553 2.652 2.865 2.787 2.842 1.457 1.354 2.630 2.325 2.321
Granite Untreated 1.346
x10-2
1.398 2.001 2.223 2.120 1.819 1.960 1.932 2.142 2.254 2.842 2.992 2.932 2.696 3.001 3.212 3.114 3.217 3.623 3.425
Treated 1.846
x10-2
1.942 2.225 2.263 2.317 2.263 2.442 2.413 2.242 2.363 2.836 2.932 3.016 3.210 3.105 3.212 3.254 3.329 3.628 3.712
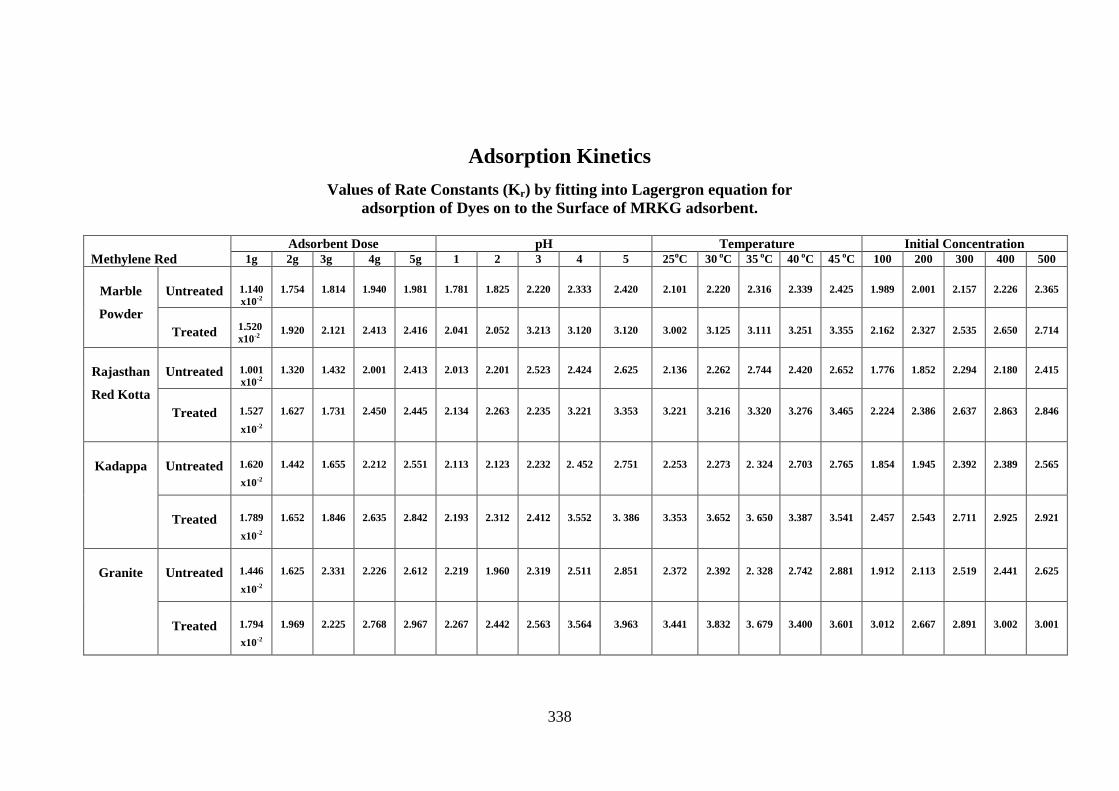
338
Adsorption Kinetics
Values of Rate Constants (Kr) by fitting into Lagergron equation for adsorption of Dyes on to the Surface of MRKG adsorbent.
Methylene Red Adsorbent Dose pH Temperature Initial Concentration
1g 2g 3g 4g 5g 1 2 3 4 5 25oC 30 oC 35 oC 40 oC 45 oC 100 200 300 400 500
Marble
Powder
Untreated 1.140 x10⁻²
1.754 1.814 1.940 1.981 1.781 1.825 2.220 2.333 2.420 2.101 2.220 2.316 2.339 2.425 1.989 2.001 2.157 2.226 2.365
Treated 1.520 x10⁻²
1.920 2.121 2.413 2.416 2.041 2.052 3.213 3.120 3.120 3.002 3.125 3.111 3.251 3.355 2.162 2.327 2.535 2.650 2.714
Rajasthan
Red Kotta
Untreated 1.001 x10⁻²
1.320 1.432 2.001 2.413 2.013 2.201 2.523 2.424 2.625 2.136 2.262 2.744 2.420 2.652 1.776 1.852 2.294 2.180 2.415
Treated 1.527
x10-2
1.627 1.731 2.450 2.445 2.134 2.263 2.235 3.221 3.353 3.221 3.216 3.320 3.276 3.465 2.224 2.386 2.637 2.863 2.846
Kadappa Untreated 1.620
x10-2
1.442 1.655 2.212 2.551 2.113 2.123 2.232 2. 452 2.751 2.253 2.273 2. 324 2.703 2.765 1.854 1.945 2.392 2.389 2.565
Treated 1.789
x10-2
1.652 1.846 2.635 2.842 2.193 2.312 2.412 3.552 3. 386 3.353 3.652 3. 650 3.387 3.541 2.457 2.543 2.711 2.925 2.921
Granite Untreated 1.446
x10-2
1.625 2.331 2.226 2.612 2.219 1.960 2.319 2.511 2.851 2.372 2.392 2. 328 2.742 2.881 1.912 2.113 2.519 2.441 2.625
Treated 1.794
x10-2
1.969 2.225 2.768 2.967 2.267 2.442 2.563 3.564 3.963 3.441 3.832 3. 679 3.400 3.601 3.012 2.667 2.891 3.002 3.001
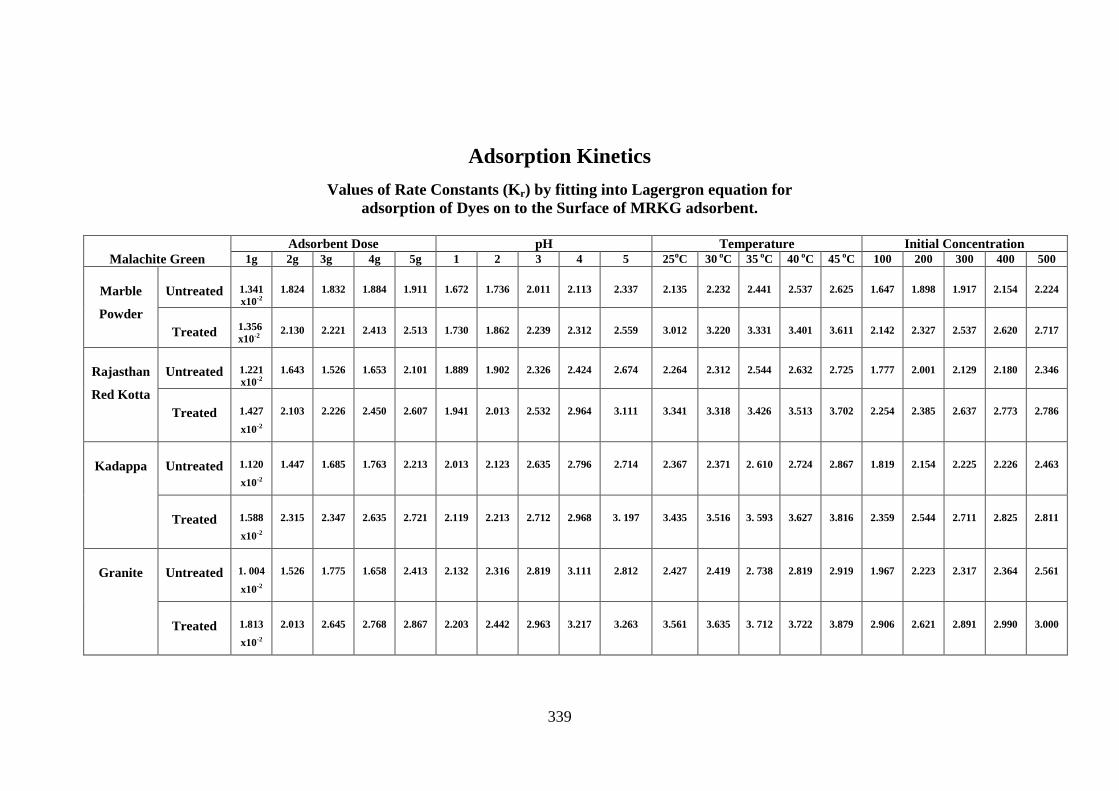
339
Adsorption Kinetics
Values of Rate Constants (Kr) by fitting into Lagergron equation for adsorption of Dyes on to the Surface of MRKG adsorbent.
Malachite Green Adsorbent Dose pH Temperature Initial Concentration
1g 2g 3g 4g 5g 1 2 3 4 5 25oC 30 oC 35 oC 40 oC 45 oC 100 200 300 400 500
Marble
Powder
Untreated 1.341 x10⁻²
1.824 1.832 1.884 1.911 1.672 1.736 2.011 2.113 2.337 2.135 2.232 2.441 2.537 2.625 1.647 1.898 1.917 2.154 2.224
Treated 1.356 x10⁻²
2.130 2.221 2.413 2.513 1.730 1.862 2.239 2.312 2.559 3.012 3.220 3.331 3.401 3.611 2.142 2.327 2.537 2.620 2.717
Rajasthan
Red Kotta
Untreated 1.221 x10⁻²
1.643 1.526 1.653 2.101 1.889 1.902 2.326 2.424 2.674 2.264 2.312 2.544 2.632 2.725 1.777 2.001 2.129 2.180 2.346
Treated 1.427
x10-2
2.103 2.226 2.450 2.607 1.941 2.013 2.532 2.964 3.111 3.341 3.318 3.426 3.513 3.702 2.254 2.385 2.637 2.773 2.786
Kadappa Untreated 1.120
x10-2
1.447 1.685 1.763 2.213 2.013 2.123 2.635 2.796 2.714 2.367 2.371 2. 610 2.724 2.867 1.819 2.154 2.225 2.226 2.463
Treated 1.588
x10-2
2.315 2.347 2.635 2.721 2.119 2.213 2.712 2.968 3. 197 3.435 3.516 3. 593 3.627 3.816 2.359 2.544 2.711 2.825 2.811
Granite Untreated 1. 004
x10-2
1.526 1.775 1.658 2.413 2.132 2.316 2.819 3.111 2.812 2.427 2.419 2. 738 2.819 2.919 1.967 2.223 2.317 2.364 2.561
Treated 1.813
x10-2
2.013 2.645 2.768 2.867 2.203 2.442 2.963 3.217 3.263 3.561 3.635 3. 712 3.722 3.879 2.906 2.621 2.891 2.990 3.000
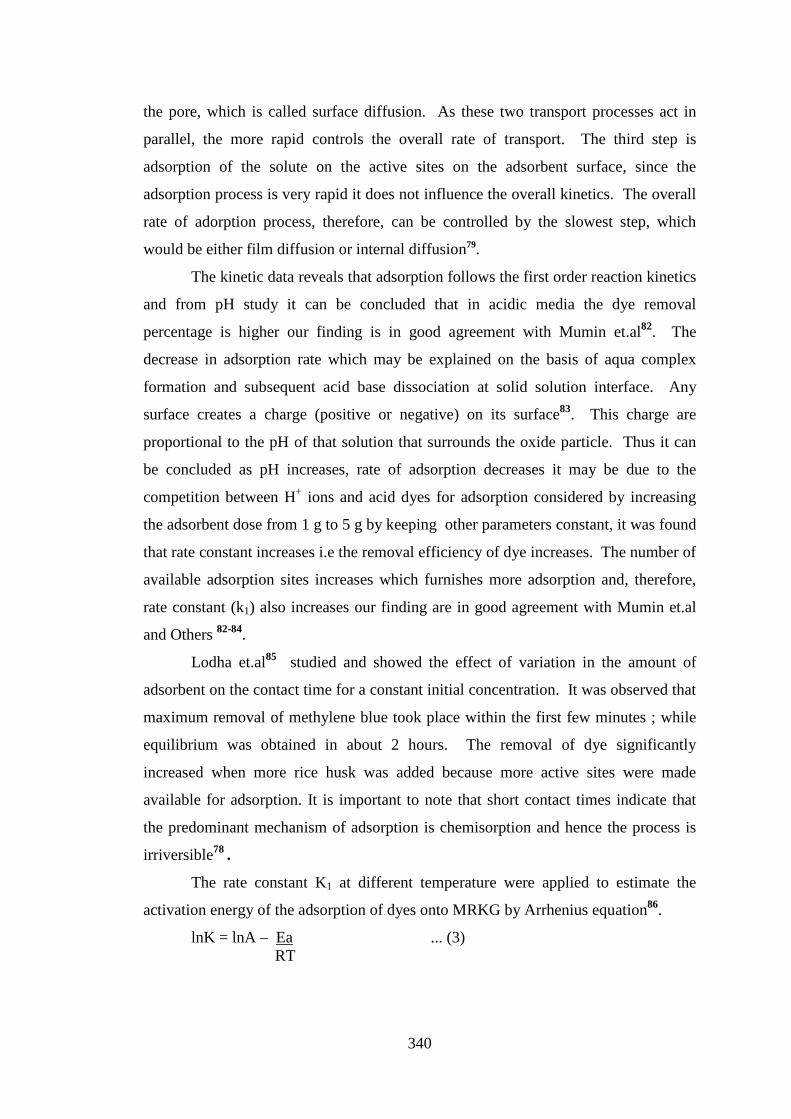
340
the pore, which is called surface diffusion. As these two transport processes act in
parallel, the more rapid controls the overall rate of transport. The third step is
adsorption of the solute on the active sites on the adsorbent surface, since the
adsorption process is very rapid it does not influence the overall kinetics. The overall
rate of adorption process, therefore, can be controlled by the slowest step, which
would be either film diffusion or internal diffusion79.
The kinetic data reveals that adsorption follows the first order reaction kinetics
and from pH study it can be concluded that in acidic media the dye removal
percentage is higher our finding is in good agreement with Mumin et.al82. The
decrease in adsorption rate which may be explained on the basis of aqua complex
formation and subsequent acid base dissociation at solid solution interface. Any
surface creates a charge (positive or negative) on its surface83. This charge are
proportional to the pH of that solution that surrounds the oxide particle. Thus it can
be concluded as pH increases, rate of adsorption decreases it may be due to the
competition between H+ ions and acid dyes for adsorption considered by increasing
the adsorbent dose from 1 g to 5 g by keeping other parameters constant, it was found
that rate constant increases i.e the removal efficiency of dye increases. The number of
available adsorption sites increases which furnishes more adsorption and, therefore,
rate constant (k1) also increases our finding are in good agreement with Mumin et.al
and Others 82-84.
Lodha et.al85 studied and showed the effect of variation in the amount of
adsorbent on the contact time for a constant initial concentration. It was observed that
maximum removal of methylene blue took place within the first few minutes ; while
equilibrium was obtained in about 2 hours. The removal of dye significantly
increased when more rice husk was added because more active sites were made
available for adsorption. It is important to note that short contact times indicate that
the predominant mechanism of adsorption is chemisorption and hence the process is
irriversible78 .
The rate constant K1 at different temperature were applied to estimate the
activation energy of the adsorption of dyes onto MRKG by Arrhenius equation86.
lnK = lnA – Ea ... (3) RT
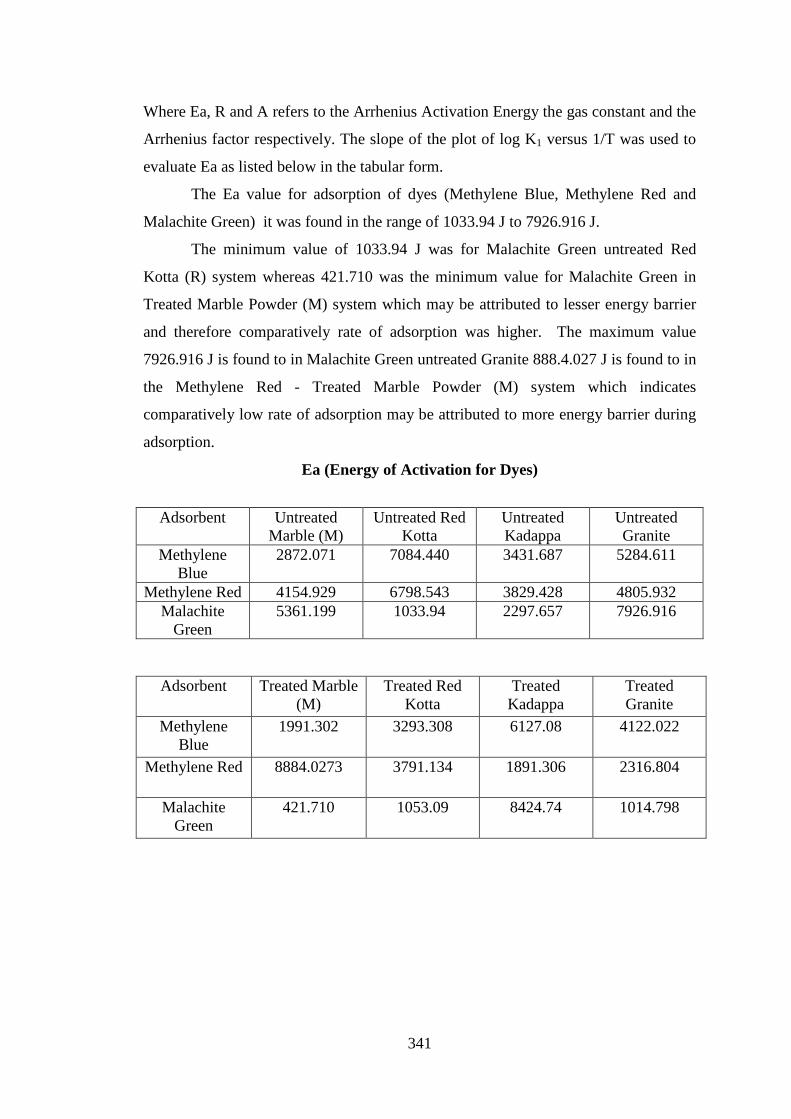
341
Where Ea, R and A refers to the Arrhenius Activation Energy the gas constant and the
Arrhenius factor respectively. The slope of the plot of log K1 versus 1/T was used to
evaluate Ea as listed below in the tabular form.
The Ea value for adsorption of dyes (Methylene Blue, Methylene Red and
Malachite Green) it was found in the range of 1033.94 J to 7926.916 J.
The minimum value of 1033.94 J was for Malachite Green untreated Red
Kotta (R) system whereas 421.710 was the minimum value for Malachite Green in
Treated Marble Powder (M) system which may be attributed to lesser energy barrier
and therefore comparatively rate of adsorption was higher. The maximum value
7926.916 J is found to in Malachite Green untreated Granite 888.4.027 J is found to in
the Methylene Red - Treated Marble Powder (M) system which indicates
comparatively low rate of adsorption may be attributed to more energy barrier during
adsorption.
Ea (Energy of Activation for Dyes)
Adsorbent Untreated
Marble (M) Untreated Red
Kotta Untreated Kadappa
Untreated Granite
Methylene Blue
2872.071 7084.440 3431.687 5284.611
Methylene Red 4154.929 6798.543 3829.428 4805.932 Malachite
Green 5361.199 1033.94 2297.657 7926.916
Adsorbent Treated Marble (M)
Treated Red Kotta
Treated Kadappa
Treated Granite
Methylene Blue
1991.302 3293.308 6127.08 4122.022
Methylene Red 8884.0273 3791.134 1891.306 2316.804
Malachite Green
421.710 1053.09 8424.74 1014.798
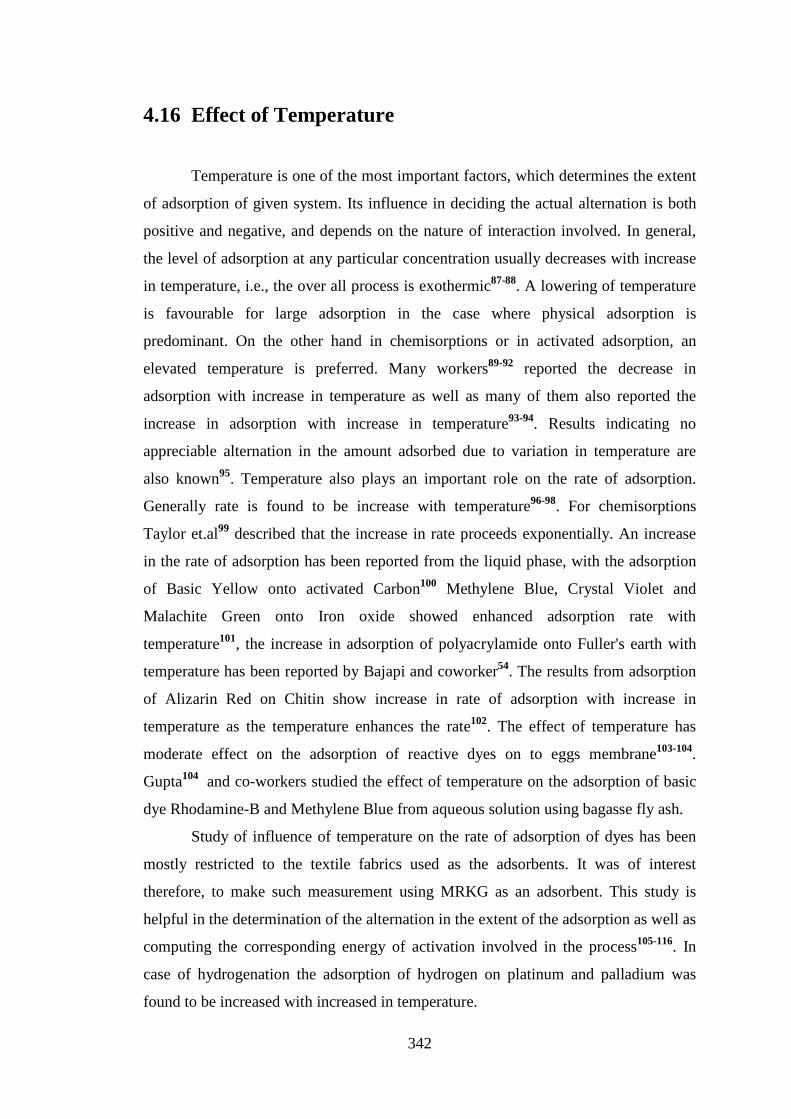
342
4.16 Effect of Temperature
Temperature is one of the most important factors, which determines the extent
of adsorption of given system. Its influence in deciding the actual alternation is both
positive and negative, and depends on the nature of interaction involved. In general,
the level of adsorption at any particular concentration usually decreases with increase
in temperature, i.e., the over all process is exothermic87-88. A lowering of temperature
is favourable for large adsorption in the case where physical adsorption is
predominant. On the other hand in chemisorptions or in activated adsorption, an
elevated temperature is preferred. Many workers89-92 reported the decrease in
adsorption with increase in temperature as well as many of them also reported the
increase in adsorption with increase in temperature93-94. Results indicating no
appreciable alternation in the amount adsorbed due to variation in temperature are
also known95. Temperature also plays an important role on the rate of adsorption.
Generally rate is found to be increase with temperature96-98. For chemisorptions
Taylor et.al99 described that the increase in rate proceeds exponentially. An increase
in the rate of adsorption has been reported from the liquid phase, with the adsorption
of Basic Yellow onto activated Carbon100 Methylene Blue, Crystal Violet and
Malachite Green onto Iron oxide showed enhanced adsorption rate with
temperature101, the increase in adsorption of polyacrylamide onto Fuller's earth with
temperature has been reported by Bajapi and coworker54. The results from adsorption
of Alizarin Red on Chitin show increase in rate of adsorption with increase in
temperature as the temperature enhances the rate102. The effect of temperature has
moderate effect on the adsorption of reactive dyes on to eggs membrane103-104.
Gupta104 and co-workers studied the effect of temperature on the adsorption of basic
dye Rhodamine-B and Methylene Blue from aqueous solution using bagasse fly ash.
Study of influence of temperature on the rate of adsorption of dyes has been
mostly restricted to the textile fabrics used as the adsorbents. It was of interest
therefore, to make such measurement using MRKG as an adsorbent. This study is
helpful in the determination of the alternation in the extent of the adsorption as well as
computing the corresponding energy of activation involved in the process105-116. In
case of hydrogenation the adsorption of hydrogen on platinum and palladium was
found to be increased with increased in temperature.
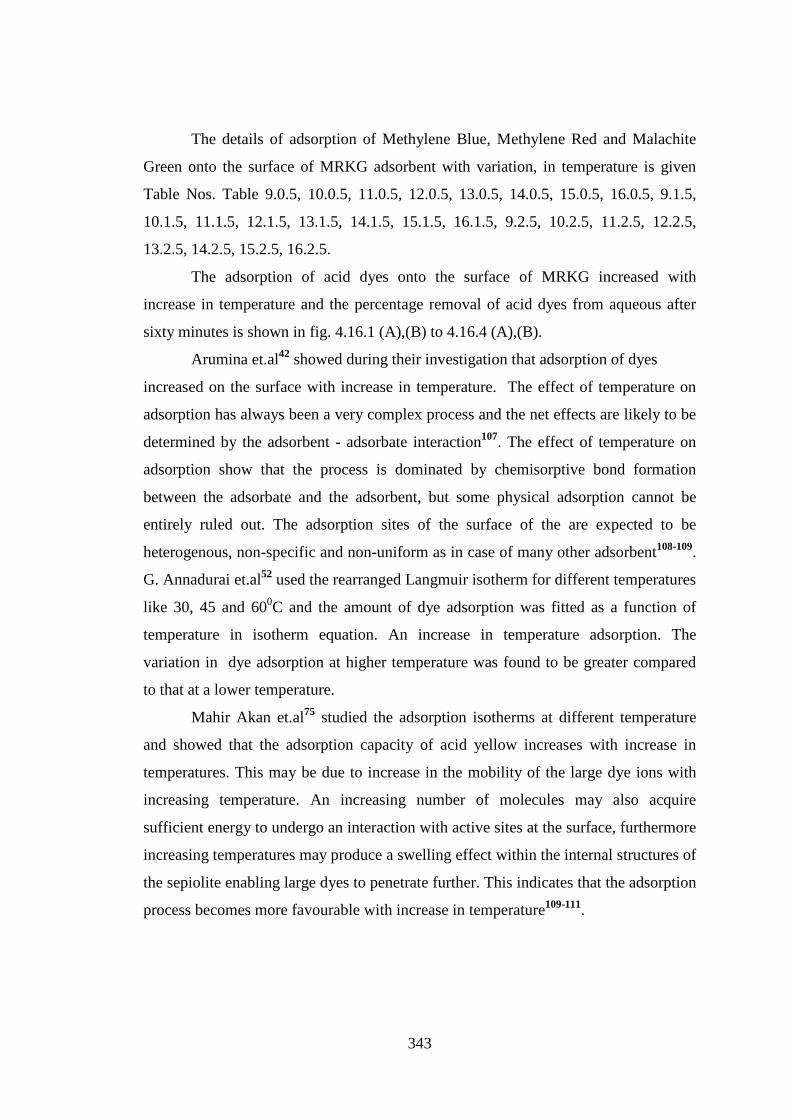
343
The details of adsorption of Methylene Blue, Methylene Red and Malachite
Green onto the surface of MRKG adsorbent with variation, in temperature is given
Table Nos. Table 9.0.5, 10.0.5, 11.0.5, 12.0.5, 13.0.5, 14.0.5, 15.0.5, 16.0.5, 9.1.5,
10.1.5, 11.1.5, 12.1.5, 13.1.5, 14.1.5, 15.1.5, 16.1.5, 9.2.5, 10.2.5, 11.2.5, 12.2.5,
13.2.5, 14.2.5, 15.2.5, 16.2.5.
The adsorption of acid dyes onto the surface of MRKG increased with
increase in temperature and the percentage removal of acid dyes from aqueous after
sixty minutes is shown in fig. 4.16.1 (A),(B) to 4.16.4 (A),(B).
Arumina et.al42 showed during their investigation that adsorption of dyes
increased on the surface with increase in temperature. The effect of temperature on
adsorption has always been a very complex process and the net effects are likely to be
determined by the adsorbent - adsorbate interaction107. The effect of temperature on
adsorption show that the process is dominated by chemisorptive bond formation
between the adsorbate and the adsorbent, but some physical adsorption cannot be
entirely ruled out. The adsorption sites of the surface of the are expected to be
heterogenous, non-specific and non-uniform as in case of many other adsorbent108-109.
G. Annadurai et.al52 used the rearranged Langmuir isotherm for different temperatures
like 30, 45 and 600C and the amount of dye adsorption was fitted as a function of
temperature in isotherm equation. An increase in temperature adsorption. The
variation in dye adsorption at higher temperature was found to be greater compared
to that at a lower temperature.
Mahir Akan et.al75 studied the adsorption isotherms at different temperature
and showed that the adsorption capacity of acid yellow increases with increase in
temperatures. This may be due to increase in the mobility of the large dye ions with
increasing temperature. An increasing number of molecules may also acquire
sufficient energy to undergo an interaction with active sites at the surface, furthermore
increasing temperatures may produce a swelling effect within the internal structures of
the sepiolite enabling large dyes to penetrate further. This indicates that the adsorption
process becomes more favourable with increase in temperature109-111.
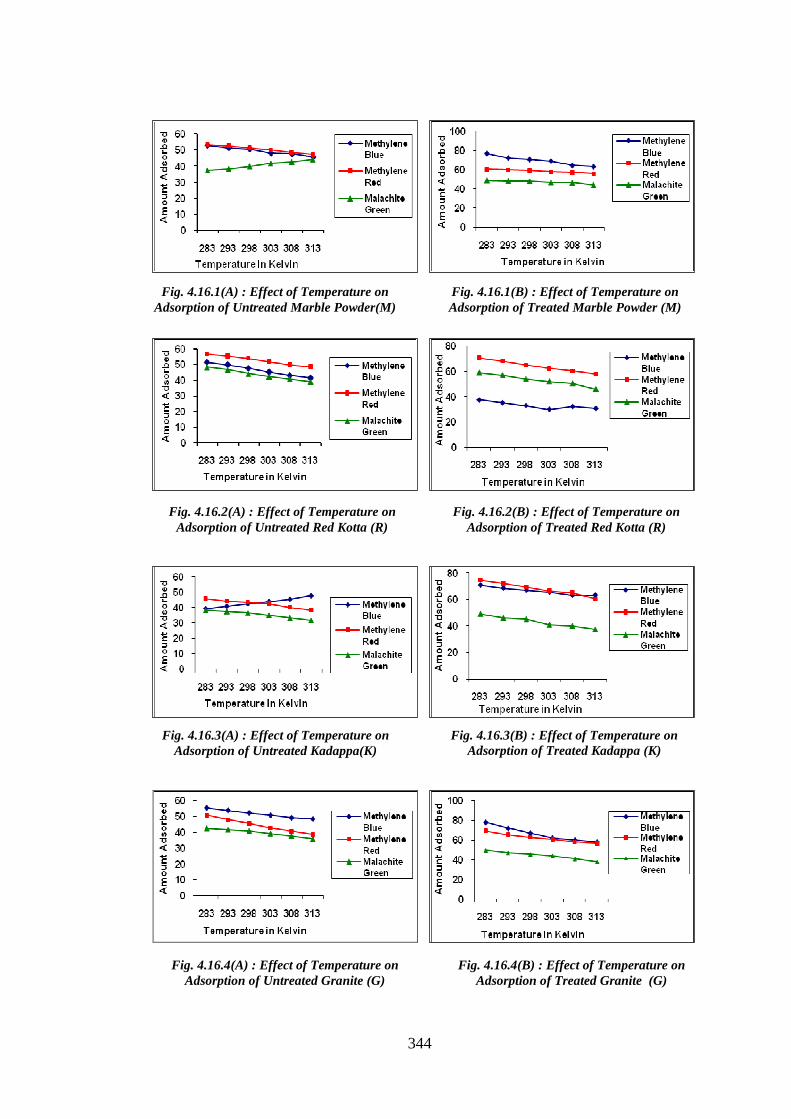
344
Fig. 4.16.1(A) : Effect of Temperature on Adsorption of Untreated Marble Powder(M)
Fig. 4.16.1(B) : Effect of Temperature on Adsorption of Treated Marble Powder (M)
Fig. 4.16.2(A) : Effect of Temperature on Adsorption of Untreated Red Kotta (R)
Fig. 4.16.2(B) : Effect of Temperature on Adsorption of Treated Red Kotta (R)
Fig. 4.16.3(A) : Effect of Temperature on Adsorption of Untreated Kadappa(K)
Fig. 4.16.3(B) : Effect of Temperature on Adsorption of Treated Kadappa (K)
Fig. 4.16.4(A) : Effect of Temperature on Adsorption of Untreated Granite (G)
Fig. 4.16.4(B) : Effect of Temperature on Adsorption of Treated Granite (G)
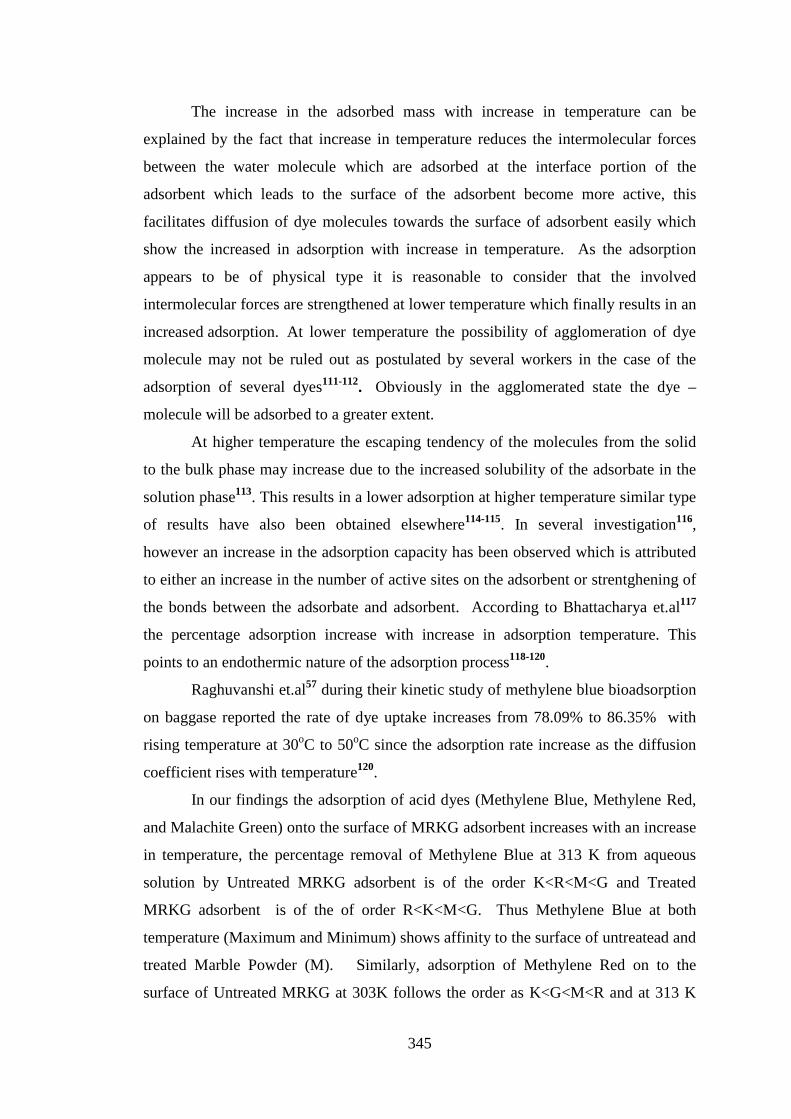
345
The increase in the adsorbed mass with increase in temperature can be
explained by the fact that increase in temperature reduces the intermolecular forces
between the water molecule which are adsorbed at the interface portion of the
adsorbent which leads to the surface of the adsorbent become more active, this
facilitates diffusion of dye molecules towards the surface of adsorbent easily which
show the increased in adsorption with increase in temperature. As the adsorption
appears to be of physical type it is reasonable to consider that the involved
intermolecular forces are strengthened at lower temperature which finally results in an
increased adsorption. At lower temperature the possibility of agglomeration of dye
molecule may not be ruled out as postulated by several workers in the case of the
adsorption of several dyes111-112. Obviously in the agglomerated state the dye –
molecule will be adsorbed to a greater extent.
At higher temperature the escaping tendency of the molecules from the solid
to the bulk phase may increase due to the increased solubility of the adsorbate in the
solution phase113. This results in a lower adsorption at higher temperature similar type
of results have also been obtained elsewhere114-115. In several investigation116,
however an increase in the adsorption capacity has been observed which is attributed
to either an increase in the number of active sites on the adsorbent or strentghening of
the bonds between the adsorbate and adsorbent. According to Bhattacharya et.al117
the percentage adsorption increase with increase in adsorption temperature. This
points to an endothermic nature of the adsorption process118-120.
Raghuvanshi et.al57 during their kinetic study of methylene blue bioadsorption
on baggase reported the rate of dye uptake increases from 78.09% to 86.35% with
rising temperature at 30oC to 50oC since the adsorption rate increase as the diffusion
coefficient rises with temperature120.
In our findings the adsorption of acid dyes (Methylene Blue, Methylene Red,
and Malachite Green) onto the surface of MRKG adsorbent increases with an increase
in temperature, the percentage removal of Methylene Blue at 313 K from aqueous
solution by Untreated MRKG adsorbent is of the order K<R<M<G and Treated
MRKG adsorbent is of the of order R<K<M<G. Thus Methylene Blue at both
temperature (Maximum and Minimum) shows affinity to the surface of untreatead and
treated Marble Powder (M). Similarly, adsorption of Methylene Red on to the
surface of Untreated MRKG at 303K follows the order as K<G<M<R and at 313 K
346
the order of adsorption on Treated MRKG follows the order as M<G<R<K. The
adsorption of Malachite Green onto the surface of Untreated MRKG at 303 K was
found to be in the order as K<G<R<M and at 313 K the order of adsorption on
Treated MRKG surface was observed in the sequence as K<M<G<R. In short it can
be concluded with increase in temperature adsorption of acid dyes increase onto the
surface of MRKG adsorbent which is in good agreement with Mahir and
Others43,75,119,120.
4.17 Adsorption Isotherm
Among the factors, which determine the extent of adsorption, the
concentration of the adsorbate solution is one of the chief determinants. Any change
in this factor is seen to affect not only the extent but in some cases also the nature of
adsorption. The actual variation of the amount adsorbed with concentration (Pressure
in case of gases) at a constant temperature is expressed by relation usually known as
adsorption isotherm. The adsorption isotherm is graphical representation of amount
of substance adsorbed against the residual concentration of the adsorbate in the
solution. Several such isotherms both obtained empirically as well as derived on
theoretical basis have been proposed from time to time; represent the observed results.
Many of these, despite their successful adsorption in specific cases, are found
inadequate in system of diverse nature or in simple cases also specially when applied
over wide range of experimental parameters.
Initially most of the isotherms were derived for the adsorption of gases onto
solid surface118 but they were also found successful in representing the other
adsorption process, especially the adsorption of dyes onto solids surfaces28,34,122. The
amount of solute adsorbed by one gram of the adsorbent under a given set of
condition is expressed usually as,
X = f (C) or f (P)
Where C = concentration (P is pressure in case of gas) of the adsorbate solution. In
the adsorption of dyes by commonly used solid adsorbents isotherm of different
nature have been reported by several workers123. This includes even those showing
regular and then sometimes a rise again, as well as those showing interrupted rise well
defined constant adsorption isotherm all showing an increase in the amount
347
adsorbed123. In the present study a small variation in temperature (i.e.50C) is
considered for each run. Such a small change in temperature does not appear to
affect the general nature of the isotherm though individual values of the amount
adsorbed varied. MRKG as adsorbent at higher temperature is favourable for large
adsorption for Methylene Blue, Methylene Red and Malachite green as the
temperature increased from 35oC to 45oC.
The adsorption data for a wide range of adsorbate concentration and adsorbent
doses were analyzed using Langmuir and Freundlich isotherms in order to find the
adsorption capacity of MRKG adsorbate.
Freundlich Theory :
A fairly satisfactory empirical isotherm, which can be applied to adsorption of
gases with considerable successes but have been used principally for adsorption from
solution, has been discussed by H. Freundlich124. He suggested that the ratios of the
amount of solute adsorbed onto a given mass of adsorbent to the concentration of the
solute in the solution are not constant at different concentration of solutions. If qe is
the amount of solute adsorbed mg per gram of adsorbent and Ce is the equilibrium
concentration in the solution, the empirical relation is;
x m = qe = KFCe
1/n
Where,
KF = rough measure of adsorption capacity (intensity of adsorption)
n = empirical constant.
The linear form of the equation is;
log qe = log KF + 1 log Ce
n The values of KF and 1/n are calculated from the intercept and slope of the plot of
log qe Vs. log Ce respectively.
According to Lodha85, the Freundlich log plot is linear which may be
attributed to the fact that Freundlich equation the concentration of dye on the
adsorbent increases as the dye concentration in liquid increases. The experimental
observation reported too suggests that the isotherm plateau is not reached even at very
high concentration of the adsorbent. The favourable adsorption process reported is
348
also indicated by the fact the value of n is less than 1. Moosa et.al125 studied the
sorption capacities of rice bran for benzene, toluene, etheylbenzene and cumene for
different isotherms and accordingly the Freundlich adsorption isotherm gave an
empirical expression encompassing the surface heterogeneity and the exponential
distribution of energies82. The Freundlich isotherm124 tested and was found that for
each BTEC components, a straight line was obtained. The slope of the straight line
gave the values of 1/n which were less than 1 indicating the intensity of adsorption.
The value of 1/n showed that the removal of BTEC by rice bran was effective at lower
concentration and the intercept yield the adsorption capacity.
The result obtained tested for the applicability of Freundlich adsorption
isotherm. The straight line plots of log qe Vs. log Ce for the adsorbent MRKG and
show its applicability. The values for the Freundlich constants KF and 1/n calculated
from the intercepts and slopes of the above-mentioned plots are given in Table No.
1A. The Freundlich isotherm was verified by using least square fit and regression
analysis and computer programming in EXCEL. The value of regression co-efficient
r2 was calculated and represented in the following Table I-A. The value are very
close to 1.0 which indicate that good corelation exists, between log x/m and log C.
Langmuir Theory :
Langmuir121 suggested a theory to describe the adsorption of gaseous
molecules. on a metal surface. The Langmuir adsorption isotherm has been found
suitable to many sorption processes and it can used to explain the sorption of dyes on
to solid surfaces. According to this theory, it is that the surface of solid is made up of
elementary sites. For the solid liquid interface the saturated monolayer can be
represented by the following expression,
Ce = 1 + Ce qe Qob Qo
Where,
Qo and b = are Langmuir constant related to capacity and energy of adsorption,
respectively. The values of Qo and b are calculated form the slope and intercept of
plot of Ce/qe Vs. Ce, respectively.
The basic assumption in the Langmuir isotherm is that adsorption takes place
at specific sites on the adsorbent and once a site is occupied no further adsorption can
take place at that site. This implies that at saturation the adsorbent is covered
uniformly by a layer of molecules126.
349
The Langmuir model121 represents monolayer adsorption on a set of distinct
localized adsorption sites having the same adsorption energies no interaction between
adsorbed molecules. The plot yield a straight line for all the organics investigated,
indicating that the Langumuir sorption model is followed by the sorption data very
well. The values of maximum adsorption capacity calculated from the slopes of the
linear plots whereas the values of enthalpy of adsorption (b) estimated from the
intercepts of the plot. Hussain et.al127 during their adsorption study of organic acid on
to the surface of chemically processed animal charcoal reported the data obtained
during findings was fitted for Langmuir Isotherm and found to be linear indicative of
applicability of Langmuir equation.
The data obtained from the present isotherm study of most the systems also fit
well the modified Langmuir isotherm. The linear plots of Ce / qe Vs. Ce (Fig. IIA) for
MRKG at various temperatures suggests the applicability of Langmuir isotherm. The
values of Langmuir isotherm constant Qo and b are determined from the slopes and
intercepts of the respective plots and are given in Table No. II A. The isotherm
constant Qo is a measure of the amount of dye adsorbed when the monolayer is
completed. Theoretically the values of Qo should remain constant over the
temperature studied. However, a small variation in Qo values is seen with rise of
temperature. The values of Qo are also related to capacity of adsorption. The values
of b are related the energy of adsorption. From above data of Langmuir isotherm
constants the formation of monolayer has been confirmed in the present system.
The essential characteristic of the Langmuir isotherm is expressed in terms of
dimensionless constant separation factor or equilibrium factor R1
R L = 1___
1 + b Ce
This parameters indicates the nature of the isotherm as under
RL value Type of Isotherm
RL > 1 Unfavourable
RL = 1 Linear
O < RL < 1 Favourable
R = 0 Irreversible
350
The adsorption of acid dyes is favourable onto the surface of MRKG as the
RL value in the present study falls in the type 0 < RL < 1 and the range found to
0.009 to 0.010 and is in good agreement with findings of Lodha et.al85.
4.18 Thermodynamic Parameters
The term Gibbs free energy (∆G) is the fundamental criterion of
spontaneity128. It is calculated from isotherm curves indicates the adsorption of dyes
onto MRKG. The negative value of free energy (∆G) indicates high affinity of dye to
the MRKG surface and indicate feasibility of the process and the spontaneous nature
of the adsorption128-133.
For adsorption of dye on to MRKG surface the negative values of ∆H gives
the idea about the nature of reaction i.e. exothermicity134-135. And the positive value
indicates that adsorption process in them is not a exothermic reaction which it is a
physical adsorption or weak chemical adsorption. The positive value of ∆H during
adsorption process may be attributed to the disruption of water-water hydrogen
bonding in the structural water cluster142 . A entropy change (∆S) found to be positive
for adsorption of dye onto the surface of MRKG it may be attributed to the dye
molecules which are highly solvated in solution and on adsorption on MRKG leads to
release the solvent molecule136. Also when acid dyes are dissolved in water. Water
molecules tend to form more structural cluster surrounding the hydrophobic nonpolar
moiety (NPM) of the acid dyes and plays a significant role in determining the
adsorption capacity of a specific system137-138. Thereby, when acid dyes is moved
from water to the resin phase, the water cluster surrounding the NPM of the acid dyes
anion breaks down and may lead to an increase of overall entropy130. Positive value
of ∆S indicates increased randomness at the interface, this could also be attributed to
the size of the dye molecules as a single dye molecule displaces lot of water
molecules from the adsorbent surface, as it is very large in size compared to water
molecule132.
The negative value of entropy change (∆S) during adsorption process may be
attributed in terms of restriction of the moment of the molecule to two dimension on
351
the surface as against three dimension in the table. In other words a decrease in
entropy change is indicative of the decrease in randomness of the system132-135.
The values of thermodynamics parameters are given in Table No.III. reveals
that dye adsorption MRKG is favour at lower temperature130. The thermodynamic
parameter calculated from isotherm curves indicate that the adsorption of dyes onto
MRKG with negative values of free energy (∆G) indicating high affinity of dye to the
surface, and negative values of enthalpy (∆H) gives the idea about the nature of
reaction i.e. exothermicity and randomness can be explained on the basis of negative
values of entropy (∆S).
Lodha et.al85 during their investigation calculated and reported the average
values of thermodynamics parameters ∆H, ∆S and ∆G. The values demonstrates a
spontaneous and favourable adsorption process found positive indicating endothermic
process. The relatively small values point to the formation of weak chemisorptive
bonds between methylene blue and rice husk surface. Similarly the value of standard
entropy change (∆So) are also not very large which indicates that the interaction does
not lead to a considerable change in surface configuration upon the adsorption. The
negative values of standard Gibbs energy change (∆Go) in all the cases are indicative
of the spontaneous nature of the interaction without requiring large activation energy
of adsorption. Each of the thermodynamic parameter is in narrow range of values for
all adsorbent and therefore, it may be concluded that the thermodynamic process
involved in the dye / husk interaction for all the adsorbents are more or less uniform
in nature.
Daruwala et.al111 showed during their investigation the negative value of ∆H,
∆S and ∆G. indicative of exothermic and spontaneous process and suggesting no
structural changes at the solid-liquid interface with weak bond formation between
adsorbent and adsorbate139. The observation reported indicates that rice bran is very
effective for the removal of fat soluble substances and has potential application for the
removal of organic compounds. The negative values of ∆G is a indicative of a
spontaneous process with high affinity of the dye to the surface of the adsorbent128.
Exothermicity may be explained on the basis of negative values of the enthalpy
change (∆H) in the adsorption phenomenon. A negative entropy change (∆S) may
be understood in terms of restriction of the movement of the molecules to two
dimension on the surface as against three dimensions in the bulk. In other words a
352
decrease in entropy change is indicative of the decrease in the randomness of the
system.
Daniel et.al140 reported brilliant red H.E. – 38 dye sorption mechanism on
activated charcoal as a spontaneous process. The apparent entropy change values
were almost constant over the temperature range the positive entropy characterized an
increased disorder of the system, due to the loss of water which is surrounding the dye
molecule at the sorption on the activated charcoal. It can be suggested that the
driving force for sorption process is an entropy effect. This observation were
demonstrated by other experimental results concerning organic compound sorption
mechanism141.
The adsorption enthalpy in our findings for MRKG system found to negative
indicative of exothermic process, ∆G decreases from -3.22 KJ to 4.0 KJ/mole with
increase in temperature from 30o C to 45oC Negative value of ∆Go indicates that the
adsorption process is favourable and spontaneous in nature. Our finding is in good
agreement with the findings of Sivakumar et.al134. Mishra et.al142 during their
adsorption study of dyes on low cost Mahna cake (MOC) reported that an increase in
∆G with temperature suggested high adsorption of dye at lower temperature. The
negative values of ∆H for dye adsorption indicates that the reaction is exothermic143.
Rasheed Khan144 during their adsorption study of methylene blue and malachite
green from aqueous solution on the surface of wool carbonizing waste reported values
of ∆G and ∆S were random for both dyes adsorption process and found to be
spontaneous at lower temperature145. According to Smith et.al143 the positive values
of ∆H indicates adsorption process endothermic and negative value of ∆S suggest the
probability of favourable adsorption.
According to Jayswal147 ∆G value depends on several factors such as
temperature and heat consumed released upon the uptake of the cationic dye. In their
study the ion exchanger used was amorphous in nature, thus it was expected that all
sorption sites may be energetically equivalent. The incoming cationic dye could first
occupy most favourable sites. As adsorption proceeds the sites becomes progressively
less favourable. The overall ∆G values is a result from the contribution of the above
mentioned factors. Depending on the predominant factors ∆G values vary in each
case. The negative value of ∆H indicates adsorption of dyes are exothermic in
nature148. Jayswal et.al147 also concluded that the decrease in the value of ∆S was

353
attributed to higher uptake of the dyes which is a result of high ∆S in the external
aqueous phase and a lower ∆S in adsorbent phase149-150.
354
REFERENCES
1 M.A.S. Al - Ghouti,
... Ph.D. Thesis, Queen University of
Belfast - 2004. Mechanism and
Chemistry of dye adsorption on
diatomite and modified diatomite,
(2004)
2 The Colour Index International ... 4th Ed. Soc. Dyers, Colurists, 2002.
3 T. Robinson, and G. Mcmulla,
R.Marchant, P.Nigam
... Biores. Technol., 77, pp (247-255)
2001
4 J.R. Easton ... Colur in dye house effluent, Ed.P.
Cooper, Soc. Dyers colorist. The
Alden Press, Oxford, 1995.
5 C.O. Neill, F.R. Hawkes, D.L.
Hawkes, N.D. Lourenco, and H.M.
Pinheiro
... J. Chem. Technol, Biotechnol,
pp 1009-1018 (1999)
6 M.C. Bonneau ... J. Chem. Edn. 72,
pp 742-725, (1995)
7 A.F. Strickland and W.C. Perkins ... Textile Chemist and Colorists, 27,
5, (11-15) (1995)
8 J. Pierce ... J.Soc. Dyers Color., 10, 1994,
pp 131-133
9 Y.M. Slokar and M.Le Marechal
Dyes
... Pigment, 37, 57-71 (994)
10 K.K.H. choy G Mckay, J.F. Porter, ... Resour. Conserv. Rec. 27
pp 57-71 (1999)
11 Rochester, C.H. ... Adv. Colloidal Interfae Sci.
pp 12,43 (1980)
12 Allen S.J., Mckay G and Khader
K.Y.H.
... J. Collo. Interface Sci.
pp 126, 517, (1988)
13
P. Bahadur Mihir Desai, Aarti
Dorg,
...
Indian Journal of chemistry, Vol.
36 A, PP 938-944 (1999)
355
14 D. Patil, S.P. Moulik ... Indian Journal of Chemistry, Vol
39(A), PP 611-617 (2000)
15
Mishra, R.K., Mundhara, G.L. and
Tiwari, J.J.
...
J. Colloidal Interface Sci. Vol 129
No.1.(1989)
16 Ahmed Nuruddin ... Ph.D. Thesis, M.S. University of
Baroda (1991).
17 P.E. Gonzalaz Sanchez M.V.
Garcia, A.V. and Vicianan, M.S.
... J.Chem. Tech. Biotech. 42
pp (105-122) (1988)
18 Joz facik Hoffomann Christian,
Ranger, Manfriend, Marcheme
Brend
... J. Plant Nutri. Soil. Sci 163(3), pp
595-601 (2000)
19 Giles, C.H., MacEva, T.H.,
Nukhawa, S.W. and Smith, D.J.
... Chem.. Soc. 3973 (1960)
20 Parafit, G.D. and Rochester C.H. ... Adsorption from solution at the
solid liquid interface, Academic
Press Inc (1983)
21 Gebharot H. and Coleman N.J., ... Soil science Soc. Am. Proc., 38
255(1974)
22 Evans H.C. ... J. Colloid Sci.,. 13, 537 (1958)
23 Dondisova I.J., Meleshavich S.T.
and Misch Chenko zh
... Prink Khim (Leinguard) 57, 2548
(1964) C.A. L 102 : 33081 e
24 Podlesnyuk V.V, and Lovchenk
T.M.,
... Khim, Techno Vody 7, 3 (1985) :
C.A. : 103, 7721g.
25
Gupta G.S. Prasad G and Sing
V.N.
...
Res. and Ind. 33, 132 (1988)
26 Gupta G.S., Prasad G., Pandy K.K.
and Singh V.N.
... Water,Air and Soil Pollution, 37,
13 (1998)
27 Bahadur P. Desai, M., Dogra, A.
Vora S. and Ram R.N.
... Indian Joournal of Chemistry, Vol.
36 A PP 938 944 (November -
1997)
356
28 Prasad Sumanjit N. ... Indian J. Chem. 40(A4), 388-391
(2001)
29 Nakola, M., Tamura, S. Maeda, Y
and Azumi, T.
... Gakkaishi, 39 T-69 (1989)
30 Kaneko S., Satoh H., Maejina, Y
and Nakamara, M.,
... Analytical Letters, 22 631 (1989)
31 Bagne Mohammed and Guiza
Sami
... Ann. Chem. 25 (8), 615-656 (2000)
C.A. : vol. 1115194t
32 Ricoh – Hoeffer P, Heqvet, V.,
Lecuper I., Arid – Le Chloriee P
... Water Sci. Techno. 42, 79-84
(2000)
33 Patil D and Moulik, S.P., ... Indian J. of Chem Vol. 39A, 611-
617 (2000)
34 Singh, P.K. and Srivastava
Bhavana
... India Journal of Chem Tech. 8(2),
133-139 (2001)
35 Taki Monitaka, Kitubayashi,
Shigeaki, shido sekiyu
... Gakkaishi, 44 (1), 11-17 (2001) :
C.A. : 134 vol. 13 183928m
36 Singh V.N. Mishra, G and Pandey
K.K.
... Indian J. Techo., 22,77 (1984)
37 Johanson P.G. and Buckman A.S. ... Aust J. Chem. 10, 392 and 398 and
398 (1957)
38 Chan K.M. and Wana, P.Y. ... Hsin. Wei. 29, 3 (1962) : C.A. 98 :
199700e
39 Beckmann W, and Hilderbrand
D.J.
... Soc. of Dyes \ Colourist 81, 11
(1965)
40 Finar I.C. ... Organic Chem. Vol.1 6th Ed. ELBS
and Langmann Group Ltd. 888
(1973)
41 Gile C.H. and D'Silva A.P.Thons ... Faraday, Soc. 65 2516 (1969)
42 Arumina Sarma, K.G.
Bhatacharyya
... Ind. J. Env. 41th Proct. Vol. 21
No.10, pp 899-902 (2001)
43 Mehmet Dogan, Mahir Alkan ... Fresenius Environmental Bulletin
Vo. 13. No. 11 a
pp 1112-1121 (2004)
357
44 Alok Mittal ... Electronic Journal of
Environmental Agricultural and
Food Chemistry EJEAF Che. 5 (2)
pp 1296-1305 (2006)
45
Ubale, M.B., Bharad J.V.,
Farooqui, M.N.
...
Material Science Research India.
Vol. 2 (2) pp 115-120 (2004)
46 Rais Ahmad, Rajeev Kumar ... J. Iran Chem. Res. 1 pp 85-94
(2008)
47 Donnaperna Lucio, Duclauxlaurent ... Carbon Science and Technology
1/2 pp 66-71 (2008)
48 Nevine Kamal Amin ... Desalination 223,
pp 152-161 (2008)
49 P.Nigam, G. Armour, I.M. Banat,
O. Singh and R. Merchant
... Bioresour, Technol. 72
pp 219-226 (2000)
50 S. Senthilkumar, P. Kalaamani, K.
Porkodi P.R. Varadrajan and C.V.
Subburaam
... Bioresour. Technol. 97
pp 1618-1625 (2006)
51 Yamin Yasin, Mohd Zobir
Hussein, Faujan Hj Ahmad
... The Malaysian Journal of
Analytical Sciences Vol. 11,
pp 400-406 (2007)
52 G. Annadurai, M. Chellpandian,
M.R.V. Krishnan
... Ind. J. Env. Health Proct. Vol. 17
(2) pp 95-98 (1997)
53 N.Kannan, K. Karruppasamy ... Ind. Jour. Env. Proct. Vol. 18 (9)
pp 683-688 (1998)
54 Bajpai, V and Vishwakarma, N. ... Ind. Jour. of Chemistry vol. 39 A
pp 1248-1257 (2000)
55 Racha Kornkij, M. Songklanakarin ... J.Sci. Technol Vol. 26 (Suppl. 1)
Environmental Hazardous
Management pp 14-24 (2004)
56 M. Husseien, A.A. Amer, Azza El-
Maghraby, Nahla A. Taha
... Journal of Applied Science
Research 3 (11)
pp 1352-1358 (2007)
358
57 S.P. Raghuvanshi, R. Singh C.P.
Kaushik
... Applied Ecology and
Environmental Research 2(2)
pp 35-43 (2004)
58 Mall I.D. and Upadhyay, S.N. ... Ind. J.Env. Health 40
pp. 177-188 (1998)
59 Mckay, G. ... Chem. Engg. Res. Des. 61
pp 29-35 (1964)
60 Mckay, G. Blair H.S., and Garden
J.R.
... J. App. Poly Sci. 27
pp 3043-3057 (1982)
61 Stephen J.A. G. Mckay and
K.Y.H. Kadar
... J. Chem. Tech. Biotech. 45
pp 291-302 (1989)
62 Giles C.H. ... Society of chemical Industry
London pp 242-246 (1970)
63 S. Saiful Azhar, A. Ghaniey Liew,
D. Subhardy, K. Farizul Hafiz,
M.D. Irfan Hatim
... American Journal of Applied
Science 2 (11)
pp 1499-1503 (2005)
64 Grag, V.K, Raksh Kumar and
Renuka Gupta
... Dyes and Pigments 62
pp 1-10 (2004)
65 Grag, V.K, Renuka Gupta Anu
Bala Vadar and Rakesh Kumar
... Bioresource Tech. 89
pp 121-124 (2003)
66 Shaobin Wang, Y. Boyjoo, A
Choueib and Z.H. zhu
... Water Res. 39
pp 129-138 (2005)
67 Sajjala Sreedhar Reddy, Bijjam
Kotaiah Nanaga Siva Prasad
Reddy, Muthukumara Velu.
... Turkish. J. Eng. Env.Sci. 30
pp 367-373 (2006)
68 Yamin Yasin, Mohd. Zobir
Hussien and Faujan Hj Ahmad
... The Malaysian Journal of
Analytical Sciences, Vol II, No. 11,
pp 400-406 (2007)
69 M. Hussain, A.A. Amer, Azza El-
Maghraby, Nahla A. Taha
... Journal of Applied Sciences
Research, 3(11), pp 1352-1358
(2008)
359
70 Vinod K. Gupta, Alok Mittal,
Rajeev Jain, Megha Mathur,
Shalini Sikarwar
... Journal of Colloid and Interface
Science pp 1-7 (2006)
71 S. Arivoli, M. Thenkuzhali ... E. Journal of Chemistry Vol.
S.No.2 pp 187-200 (2008)
72 Deniz Caparkaya and Levent
Cavas
... Acta Chim. Slov. 55
pp 547-553 (2008)
73
A. Maximova, B. Koumanova
...
Jour. of the University of Chemical
Technology and Metallurgy 43, 1
pp 101-108 (2008)
74 Chiou, M.S., Li H.Y. ... Journal of Hazardous Materials B9
pp 233-48 (2002)
75 Dogen, M., Alkan M. ... Chemosphere 50;
pp 517-528 (2003)
76 Wu, F.C., Tseng R.L., Juang R.S. ... Water Research 35 (3)
pp 613-8 (2001)
77 G. Sreelatha, P. Padmaja ... Journal of Environmental
Protection Science Vol.2
pp 63-71 (2008)
78 Aly, O.M., Faust, S.D. ... Adsorption process for water
treatment pp 67-69 (1987)
79 Bhaskar, G.V., Bhamidimarri,
R.S.M.
... Chem. Tech. Biotechno 53
pp 297-300 (1992)
80 Fritz W., Schlunder, E.U. ... Chem. Eng. Sci. 36
p 721 (1981)
81 Furusawa, T and Smith, J.M. ... Ind. Eng. Chem. Fundam 12 (2)
p 197 (1973)
82 M.A. Mumin, M.M.R. Khan K.F.
Akhtar, M.J. Uddin
... Int. J. Environ Sci. Tech. 4(4)
pp 525-527 (2007)
83 Netpradita, S. Thiravetyanb, P
Towprayoon, S.
... Water Res. 37
pp 763-767 (2003)
360
84 Al. Degs, Y. Kharaisheh, M.A.
Ahmed, M.N.
... Jordan International Chemistry
Engineering Conference 1.
pp 159-167 (2000)
85 A. Lodha, K. Bohra, S.V. Singh,
A.B. Gupta
... Ind. J.Env. Proct. Vol. 17 No. 9
pp 675-679 (1997)
86 Montra Chairot, Saowane
Rattanaphani John B Bremmer,
Vichitr Rattanphani
... Dyes and Pigments 64
pp 231-241 (2005)
87 Mckay. G. Otterburn, M.S.,
Sweeney A.G.
... Water Res. 14
p 21 (1980)
88 Gupta,G.S. Prasad, G. Pathak,
K.C. and Singh V.N.
... Proc. Conf. Thermal System
Varanasi 14 (1986)
89 Gupta, G.S., Prasad G. and Singh
V.N.
... Environ. Techno Letters 9,
p 153 (1988)
90 Gupta G.S., Prasad G., Pathak
K.C. and Singh V.N.
... Water Res. 24, 25 (1990)
91 Ram, R.N. and Prasad P.P. ... Indian J.Chem. 24A, 25 (1985)
92 Mills, A.K. and Hockey J.A. ... J. Chem. Soc. Faraday Trans1
p 71,2392 (1975)
93 Ewing W.W. and Lin F.W. ... J. Colloidal Sci. 8, 204 (1953)
94 Gile C.H. and D.Silva A.P. ... Trans Faraday Soc. 65 (1943)
95 Alligham, M, Cullen, J.M., Gile
C.H. Jain, S.K., and Wood J.C.
... J. Applied Chem. 8 p 108 (1958)
96 Mckay, G and Other burn, M.S. ... Anal. Proc. 17 p 406 (1980)
97 Griffin R.A. and Juzinale J.J. ... Soil Sci. Soc.Am. Proc. 38
p 75 (1974)
98 Pignon,H., Brusguet C, Le clovec
P.
... Water Sci. Tech. 42 (5.6) (2000)
99 Taylor, H.S. ... J.Am. Chem. Soc. 53 p 578 (1931)
100 Mckay G and Ottenburn, M.S. and
Sweeney, A.G.
... CEW Chem. Eng. World -15
p 41 (1980)
101 Ram R.N., and Prasad, P.P. ... Proc. Ind. Notr. Sci. Acad 48 (A) p
92 (1982)
361
102 Singh, A and Shukla Ram ... Poll. Res. 19 (2)
pp 179-184 (2000)
103 Allen, S.J., Mccallen, Michell Hely
Micheal, G. Wolki
... Adsor. Sci. Technol. Proc. Basin
Conf. 2nd pp 46-50 (2000)
104 Gupta V., Mohan,D., Sharma . ... Sep. Sci. Technol 35 (13)
pp 2097-2113 (2000)
105 Bajpai, A.K., Rajpoot K. ... Indian Journal of Chemistry Vol.
35, (A) pp 560-565 (1996)
106 Giles, C.H. Easton, I.A., Mckay,
R.B.
... J. Chem. Soc. 4
pp 4495 (1964)
107 Singh D.K. and Srivastava, B. ... Ind. J. Env. Health Proct. 41
pp 333-345 (1999)
108 Tran, H.H., F.A. Roddick and
J.A.O' donnell
... Water Res. 33
pp 2992-3000 (1999)
109
Rengaraj S.A., Banumathi and
V.M. Murugesan
...
Ind. J. Env. Health Proct. 41
pp 16-23 (1999)
110 Asfour, H.M. Fadali, O.A. Nassar,
M.M. and El Geundi, M.S.
... J. Chem. Tech. Biotechnol. 35 A
p 21 (1985)
111 Daruwala, A and D'silva A. ... Textile Res. J. 33
p 40 (1963)
112 Giles E and Hassan, M. ... J. Soc. Dyeres colourists 70
p 442 (1954)
113 Gupta, G.S., Shukla, S.P. Prasad,
G. and Singh, V.W.
... Env. Tech. 13
p 925 (1992)
114 Tewari, P.H., Compbell,A.B. and
Lee, W.
... J. Chem. Tech. 50
p 1672 (1972)
115 Chaudhary, V.R. Sansare, S.N. and
Thite, G.A.
... J. Chem. Tech. Biotech. (1996)
116 Singh, B.K. and Rawal, N.S. ... J. Chem. Tech. Biotech. (1996)
117 Krishna, D.G. and Battacharya, G. ... Appl. Clay. Sci. 20
p 295 (2002)
362
118 Singh, D. k and B. Srivastava ... Ind. J. Env. Health 41
pp 333-345 (1999)
119 Mahesh S. ... Indian J. Env. Health 41
pp 317-325 (1999)
120 Mckay, G. Elgundi, M. Nassar
M.M.
... Water Res. 22 (12)
pp 1527-1533 (1988)
121 Langmuir I. ... J. Am. Chem 38
p 2221 (1916)
122 Mckay G and AP Duri B. ... Chem. Eng. Sci. 43, 1133 (1988)
123 Giles C.H. ... Adsorption from solution at solid-
liquid interface academic press,
London 356 (1983)
124 H. Freundlich ... Colloidal and Capillary Chemistry
Methuer, London U.K. pp 397-414
(1926)
125
Mubeena Akhtar, M.J. Bhanger,
Shahid Iqbal S. Moosa Hassany
...
J. Agric Food Chem. 53
pp 8655-8662 (1980)
126 Knaebal, K.S. ... Chem. Engg. 102 (9)
pp 92-102 (1995)
127 Sayyed Hussian, Mazhar Farooqui
Maqdoom Farooqui
... Ultra Science Vol. 20 (3)
pp 569-574 (2008)
128 V.A. Oladoja, C.O. Aboluwaye
Y.B. Oladimeje
... Turkish J. Eng. Env. Sci. 33
pp 1-10 (2009)
129 Allen, S.J., Mckay G, Khader
K.Y.H.
... J. Colloid Interface Sci. 126 (1988)
130 Chao Long, Quon-Xing Zhang,
Aimin Li and Jin Long Chen
... Chinese Journal of Polymer Science
Vol. 22 No.6,
pp 533-542 (2004)
131 U. Hameed ... M.Sc. Thesis, University of Karachi
132 A.Edwin Vasu ... E. Journal of Chemistry Vol. 56
No. 4 pp 844-852 (2008)
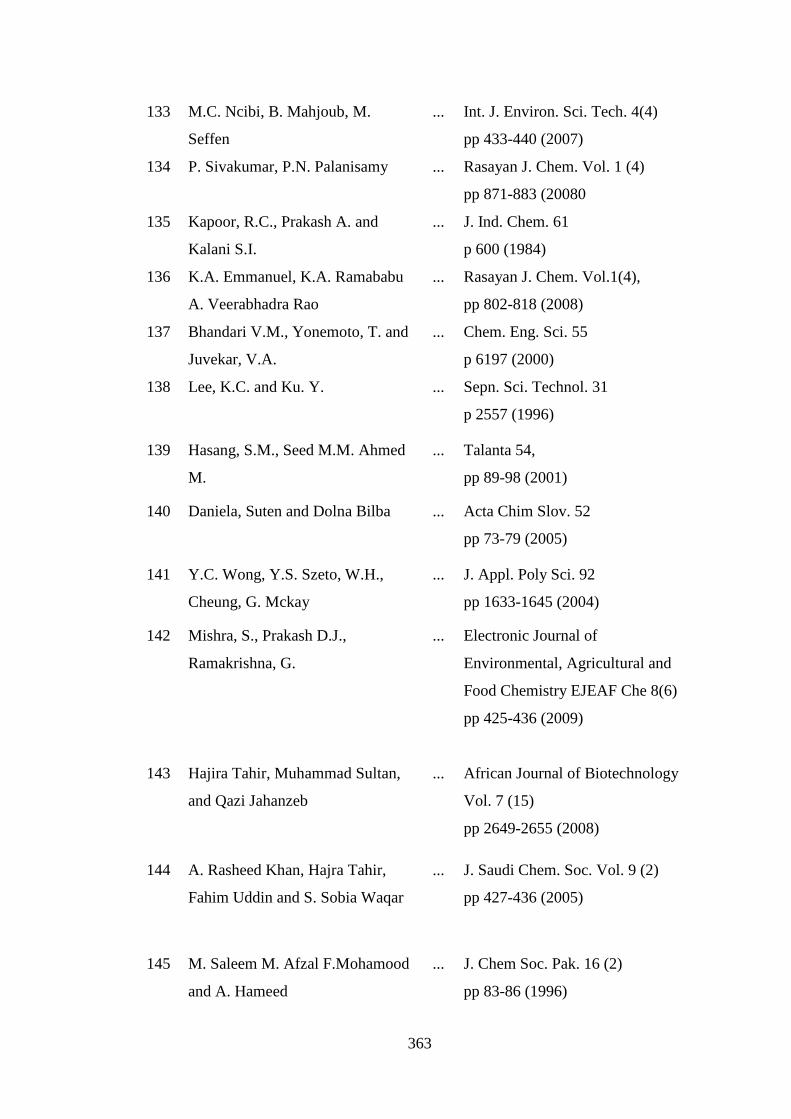
363
133 M.C. Ncibi, B. Mahjoub, M.
Seffen
... Int. J. Environ. Sci. Tech. 4(4)
pp 433-440 (2007)
134 P. Sivakumar, P.N. Palanisamy ... Rasayan J. Chem. Vol. 1 (4)
pp 871-883 (20080
135 Kapoor, R.C., Prakash A. and
Kalani S.I.
... J. Ind. Chem. 61
p 600 (1984)
136 K.A. Emmanuel, K.A. Ramababu
A. Veerabhadra Rao
... Rasayan J. Chem. Vol.1(4),
pp 802-818 (2008)
137 Bhandari V.M., Yonemoto, T. and
Juvekar, V.A.
... Chem. Eng. Sci. 55
p 6197 (2000)
138 Lee, K.C. and Ku. Y. ... Sepn. Sci. Technol. 31
p 2557 (1996)
139 Hasang, S.M., Seed M.M. Ahmed
M.
... Talanta 54,
pp 89-98 (2001)
140 Daniela, Suten and Dolna Bilba ... Acta Chim Slov. 52
pp 73-79 (2005)
141 Y.C. Wong, Y.S. Szeto, W.H.,
Cheung, G. Mckay
... J. Appl. Poly Sci. 92
pp 1633-1645 (2004)
142 Mishra, S., Prakash D.J.,
Ramakrishna, G.
... Electronic Journal of
Environmental, Agricultural and
Food Chemistry EJEAF Che 8(6)
pp 425-436 (2009)
143
Hajira Tahir, Muhammad Sultan,
and Qazi Jahanzeb
...
African Journal of Biotechnology
Vol. 7 (15)
pp 2649-2655 (2008)
144 A. Rasheed Khan, Hajra Tahir,
Fahim Uddin and S. Sobia Waqar
... J. Saudi Chem. Soc. Vol. 9 (2)
pp 427-436 (2005)
145 M. Saleem M. Afzal F.Mohamood
and A. Hameed
... J. Chem Soc. Pak. 16 (2)
pp 83-86 (1996)
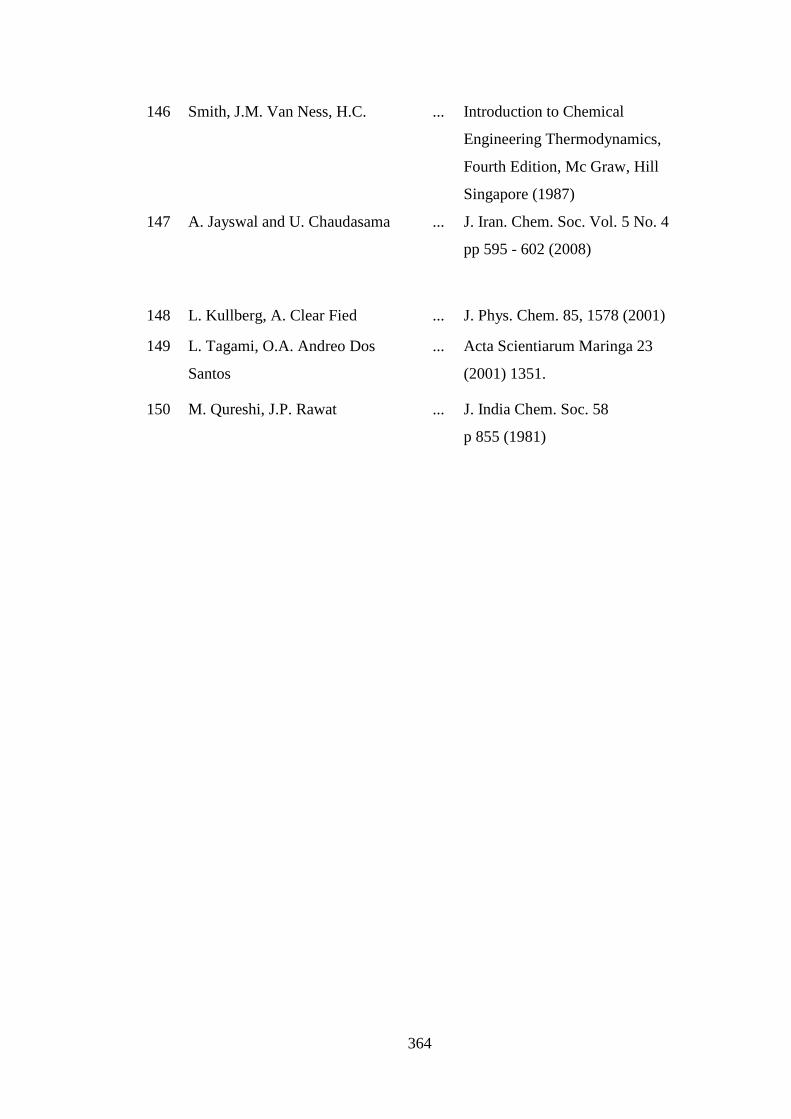
364
146 Smith, J.M. Van Ness, H.C. ... Introduction to Chemical
Engineering Thermodynamics,
Fourth Edition, Mc Graw, Hill
Singapore (1987)
147 A. Jayswal and U. Chaudasama ... J. Iran. Chem. Soc. Vol. 5 No. 4
pp 595 - 602 (2008)
148 L. Kullberg, A. Clear Fied ... J. Phys. Chem. 85, 1578 (2001)
149 L. Tagami, O.A. Andreo Dos
Santos
... Acta Scientiarum Maringa 23
(2001) 1351.
150 M. Qureshi, J.P. Rawat ... J. India Chem. Soc. 58
p 855 (1981)