Embed Size (px)
Citation preview
Pollination services of the local insect community of
Oil palm (Elaeis guineensis) in Sumatra, Indonesia
Msc Thesis
Jonathan Tien-Yi Fung
Supervisors:
Prof. Dr. Teja Tscharntke, University of Göttingen
Prof. Dr. Marko Rohlfs, University of Bremen
2
Acknowledgements
This study is supported by the Collaborative Research Centre 990 (Ecological and
Socioeconomic Functions of Tropical Lowland Rainforest Transformation Systems),
funded by the DFG (German Research Foundation)
I would like to thank Kevin Li, for helping me setting up my research project in
Indonesia, introducing me to the members of CRC990 and the local assistants, also for
the constant support in statistics, as well as the always-positive attitude. Without his
help and understanding this thesis wouldn’t exist.
Furthermore, I would like to thank my assistants, Nurman, who did a lot of hard labor
building the nets, taught me a lot about oil palm and made sure everything is running
as planned, Ayu, as well as Rico, who identified over a hundred petri dishes, each
containing hundreds of insects. Thanks to Ibu Aiyen for all the administrative works,
and my counterpart supervisor Ibu Dami Buchori.
I would like to thank my supervisors, Marko Rohlfs and Teja Tscharntke for their
support and feedback on my text.
3
Table of contents
Acknowledgements ................................................................................................... 2
Table of contents ....................................................................................................... 3
Abstract ..................................................................................................................... 4
1. Introduction....................................................................................................... 4
2. Methods and materials ...................................................................................... 8
3. Results ............................................................................................................. 14
3.1. Sticky traps ............................................................................................ 14
3.2. The impact of distance on insect abundance.......................................... 15
3.2.1 Order .......................................................................................... 15
3.2.2 Family ......................................................................................... 16
3.3. Species richness ..................................................................................... 18
3.4. Fruit set: ................................................................................................ 19
3.4.1. Distance and Fruit set .................................................................. 21
3.4.2. Insect abundance and fruit set .................................................... 22
3.4.3 Diversity and fruit set ...................................................................... 24
4. Discussion ........................................................................................................ 25
4.1 Distance and insect abundance: ............................................................. 25
4.2 distance and fruit set ............................................................................. 25
4.3 distance and diversity/effective richness ................................................ 26
4.4 insect abundance and fruit set ............................................................... 26
4.5 Treatments ............................................................................................ 27
Conclusion ............................................................................................................... 28
References:.............................................................................................................. 29
4
Abstract
Oil palm (Elaeis guineensis) is an important cash crop for the tropical countries such as
Indonesia and Malaysia, and also a strong driving force behind deforestation in these
regions. Its pollination relied almost solely on Elaeidobius kamerunicus, a weevil that
feeds on its pollen and decaying flowers that was introduced in the 1980s. Since then,
the weevil population has fluctuated in recent years, which posed as a risk for the
industry. But what about the local pollinators? The interaction between them and oil
palm and are still poorly understood, and this study aims to look into ecological
services provided by the local pollinators, trying to answer 5 questions: 1. Do
pollinators appear more when closer to the forest? 2. Is there a pattern of which
insects react to distance to local rainforests differently? 3. Do more pollinators mean
more yield? 4. Is yield linked to the distance to forest? 5. Does exclusion of pollinators
affect the yield? By answering these questions, we hope to find the linkage between
the local community and oil palm, trying to find a balance between economical
development and rainforest preservation.
Results show that distance has no impact on most insect groups, fruit set does improve
when it is closer to the forest, and the abundance of Diptera and Hymenoptera do in
fact improve the yield. Semi-exclusion nets that blocks off bigger pollinators and
predators in fact improve the pollination rate, even more than hand pollination.
1. Introduction
Pollinators play a pivotal role in the global food supply. Out of 115 of the leading food
crops, 87 are dependent on pollinators, accounting for 35% of the global production
(14). However, Potts et al.(2010) reported that both domesticated and wild pollinators
are on the decline in recent decades, and Hallmann et al. (2017) states that there are
up to 82% decline in insect biomass in Germany since the past 27 years. Therefore,
conservation of these pollinators may also favor the economical service they provide.
5
However, most researches in this field emphasize on bees and their favored crops, the
other pollinators as well as the plants they pollinate are not well looked at yet.
African Oil palm Elaeis guineensis, which originates from the west and southwest of
Africa, together with American Oil palm Elaeis oleifera are the two species under genus
Elaeis, belongs to the palm family Arecaceae. It is a large, pinnate-leaved palm,
usually monoecious with male or female (and occasionally, hybrid) inflorescences
developing in the axils of the leaves. Approximately 4.5 to 6 months after pollination,
the female inflorescences are transformed into a large, compact bunch consisting of
500-4000 fruits, weighing a total of 5 to 25 kg, depending on the age of the tree. The
fruit pulp, which is rich in oil contents, surrounds a nut, the shell of which encloses the
palm kernel. (2).
While originated from West Africa, today it is widely planted in Southeast Asia
(especially Indonesia and Malaysia), central and south America, and Central Africa,
where rainfall is sufficient and the temperature is warm all year around (3). Sharing its
ecological niche with tropical rainforests, which means that the rapid expansion of oil
palm plantations in developing countries not only leads to deforestation, but also
biodiversity loss, peat degradation, forest fires, and more. (4)
What makes oil palm fruits special is their oil content. Crude palm oil can be extracted
from the fruit, and kernel oil from the seed. The former is used largely in foods, while
the latter is more common in industrial and agricultural chemicals, such as detergents,
herbicides, plastics (5). The development of biofuel also further drives the demand for
palm oil, because It produces 3-8 times more oil content than any other oil crop.
In 2012, Indonesia and Malaysia combined accounts for about 85% of the total palm
oil production, and since 1980 the planted areas have grown 5-fold until 1991, and
another 6-fold in the next 10 years in Indonesia alone (2). It is reported that from 1990
until 2005, at least 56% of the expansions is at the expense of forests, and if the rate
of this expansion is unchanged, by 2100 three quarters of the forest cover, as well as
up to 42% of species will be lost in this region (3).
Before the introduction of weevils, the main pollinator of oil palm plantations is the
Thysanoptera species Thrips hawaiiensis. They mainly visit male inflorescences, with
around 200,000 individuals estimated to be visiting, and also visiting female
6
inflorescences, up to 7.3 thrips per flower is estimated. Each individual can carry 4-5
pollen grains which have a good viability rate of 76%. (7)
However, in newly established oil palm plantations thrips are usually absent, this may
due to their limited ability to disperse in open areas (7). Thus, hand pollination is
carried out to improve fruit set before the introduction of E. kamerunicus. (8)
In 1981, E. kamerunicus was chosen for introduction into Southeast Asia due to their
better performance under wet conditions (compared to other Elaeidobius species),
high pollen carrying capabilities and host specificity to the oil palm.
The weevils mainly feed on the male flowers, ingesting the pollen and soft tissues.
Later they lay eggs on the inflorescence and let the larvae feed on decaying materials.
Generation time is 19.4 days on average, with numbers of larvae peaking at 6-8 days
after anthesis (9). They visit the female flower and stay briefly due to the smell being
similar to male flowers, albeit weaker (2).
In 1982, just one year after the introduction of E.kamerunicus in Malaysia, the fruit set
increased from 47.8% to 76% in young palms, and 52.4% to 71.2% in 15-22 year old
palm trees, fruit to bunch ratio and mean bunch weight increased as well (2). Donough
and Law confirmed this trend by examining the yield, 4 years before and after the
introduction of E. kamerunicus (8). In Pamol, Sabah, where T. hawaiiensis is not present,
oil produced per bunch and total bunch yield improved, however, in Johore, where
thrips are present, bunch and oil yield increased by a small margin, the biggest
difference being bunches became bigger but less bunches are formed(2)(ch5.5.3.1).
Since then, the effect and pollination services of local pollinators of rainforest has been
mostly overlooked. However, there is a huge risk when a single crop relies on one single
pollinator species, especially when the pollination of oil palm is still not well
understood. For instance, Donough et al. reported that there are declines in fruit set
in Malaysia since the 1990s (11), Rao and Law wrote that the reason for poor fruit sets
in East Malaysia may be population reduction of E.kamerunicus, due to nematode
parasitism (12).
7
The aim of this study is to investigate the role of local rain forest insects, and their
contributions to the pollination of oil palm Elaeis guineensis in Indonesia. Do these
pollinators spillover into oil palm plantations next to rainforest? Is their abundance
correlated to the distance from nearby forest? How much ecological service do they
offer, compared to E. kamerunicus? If some pollinators are blocked off, will this affect
the pollination rate of oil palm? Here are our research questions and hypothesis:
1. Do pollinators appear more when closer to the forest?
Local indigenous insects would be living in the rainforest, the closer to the
forest, the more exposure to spill over organisms should be found in the farm.
2. Is there a pattern of which insects react to distance to local rainforests
differently?
Different insect groups have different abilities to disperse, so it would be logical
to see a diversity of which insect abundance react differently to distance to
forest.
3. Do more pollinators mean more yield?
The more pollinators visiting, the higher probability that pollen will be
delivered to the flower, thus having a higher pollination rate.
4. Is yield linked to the distance to forest?
If pollinator abundance is linked to distance to forest, and more pollinator
means more yield, then the closer it gets, the higher the fruit set should be.
5. Does exclusion of pollinators affect the yield?
8
2. Methods and materials
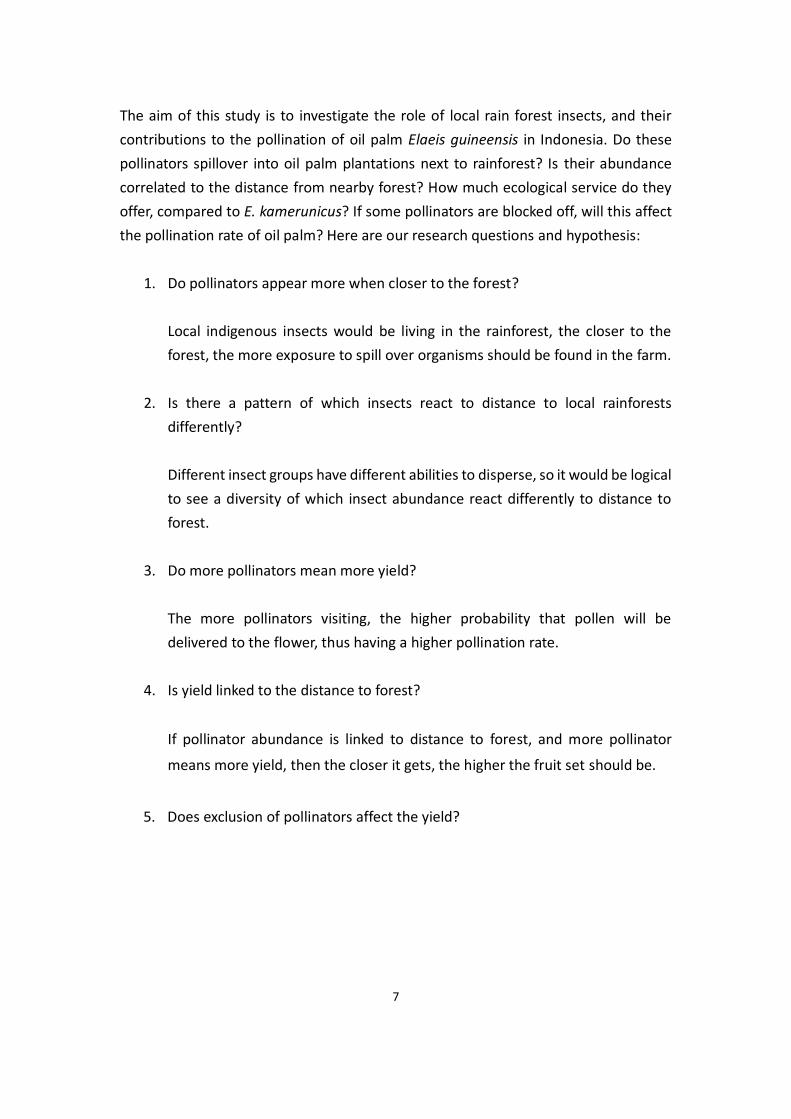
For this study we chose a site that is a small holder farm 1 hectare in size, neighboring
a large natural rainforest that is 5 Ha on the east, and another smaller forest that is 2
Ha southeast of our farm. On the west there is a big plantation from a local corporation,
and to the north there is another small holder farm (Figure 1).
Figure 1. Map of study site. White polygon marks the farm we use as our plot. Tags M1-5 marks the
corners of this plot, B1-13 marks the border of adjacent rainforest from north to southeast.
Most oil palms on this site are 3 years old, a handful of them are 4 years old and some
of them are planted recently to replace low- yield trees. We have chosen trees that are
at least 3 years old and marked 138 in total. Further surveillance discovered that
around 1/3 of these selected trees were in fact another strain of oil palm, thus they
were taken out of the study.
9
In the end we used 46 trees for the study, based on availability of inflorescences, age,
and also fertility of trees. They were divided into 3 groups (near, mid, far) based on
their distance to the neighboring forest and evenly distributed among our treatments.
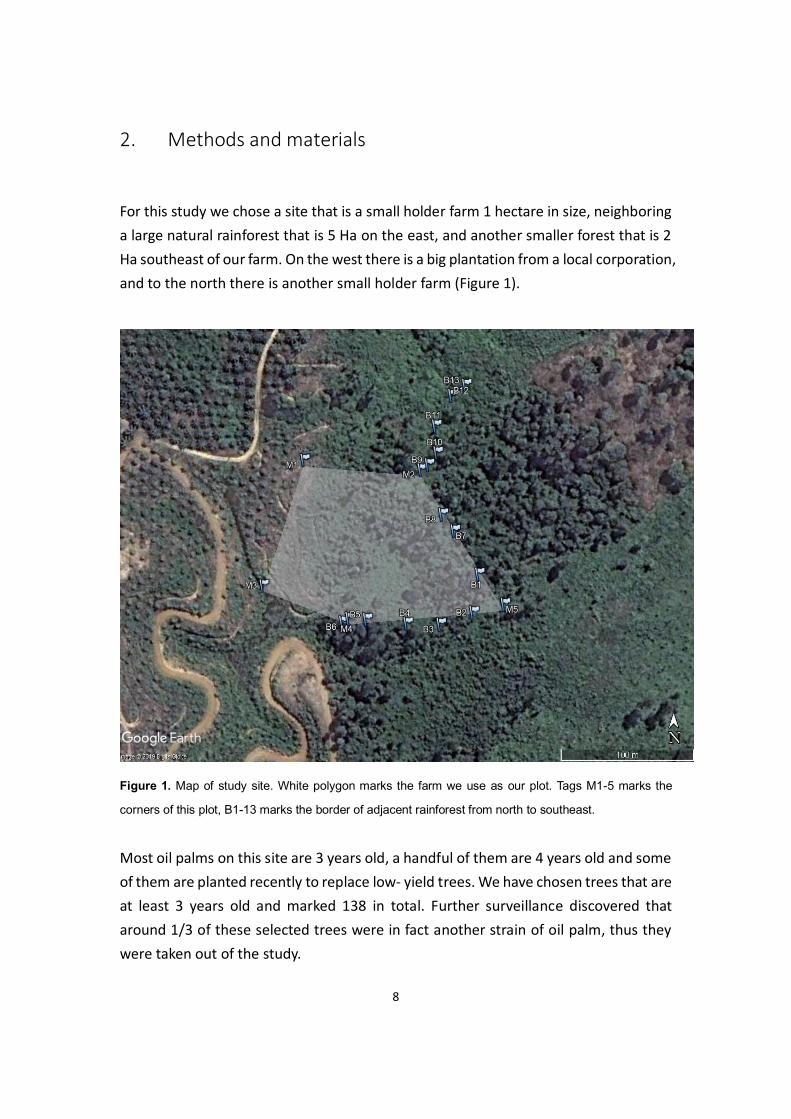
For testing contribution of specific insect group towards yield of oil palm, we selected
2 different sizes of mesh net (Figure 2): one very fine net (<0.1mm) for exclusion of all
insects, which simulates the fruit set with all pollinators absent, and another net of
1x1mm that will in theory only allow small pollinators such as the weevil E.
kamerunicus and the thrips Thrips hawaiiensis to pass through, excluding larger
pollinators.
Figure 2. Exclusion treatments. Left: full exclusion net, during anthesis. Incoming visitors can be clearly
seen. Right: Partial exclusion net right after installment. The inflorescence has not starting to open yet. )
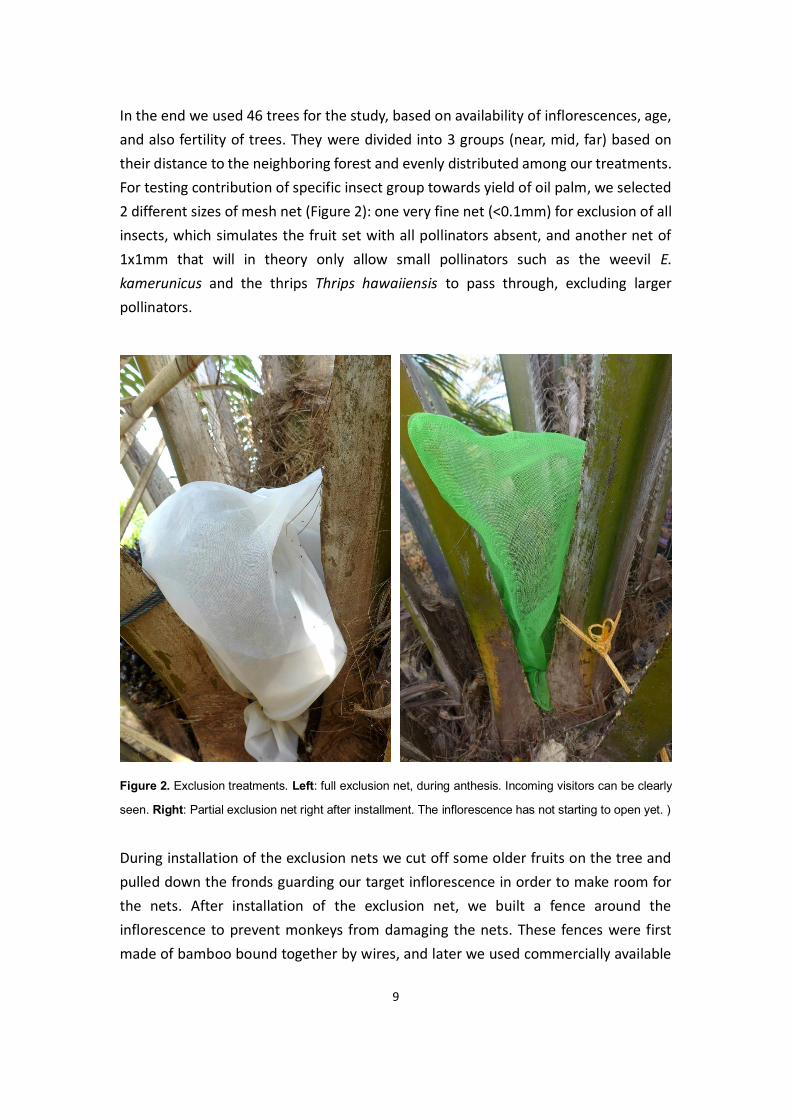
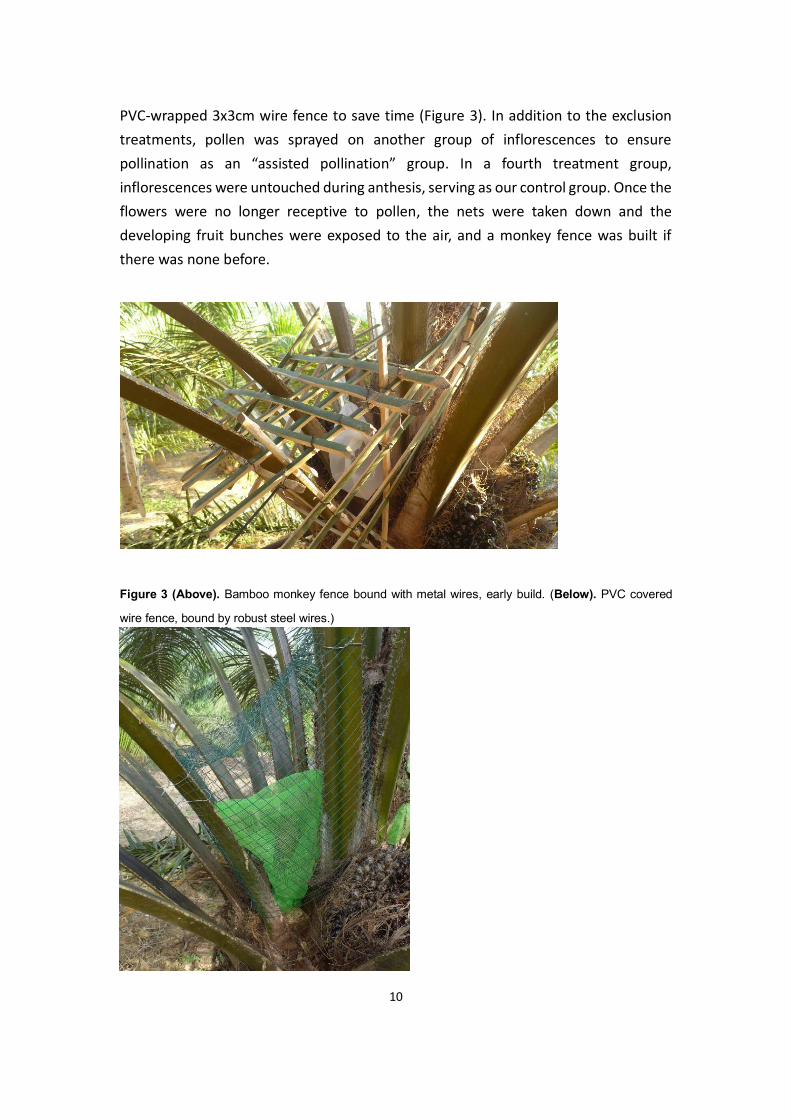
During installation of the exclusion nets we cut off some older fruits on the tree and
pulled down the fronds guarding our target inflorescence in order to make room for
the nets. After installation of the exclusion net, we built a fence around the
inflorescence to prevent monkeys from damaging the nets. These fences were first
made of bamboo bound together by wires, and later we used commercially available
10
PVC-wrapped 3x3cm wire fence to save time (Figure 3). In addition to the exclusion
treatments, pollen was sprayed on another group of inflorescences to ensure
pollination as an “assisted pollination” group. In a fourth treatment group,
inflorescences were untouched during anthesis, serving as our control group. Once the
flowers were no longer receptive to pollen, the nets were taken down and the
developing fruit bunches were exposed to the air, and a monkey fence was built if
there was none before.
Figure 3 (Above). Bamboo monkey fence bound with metal wires, early build. (Below). PVC covered
wire fence, bound by robust steel wires.)
11
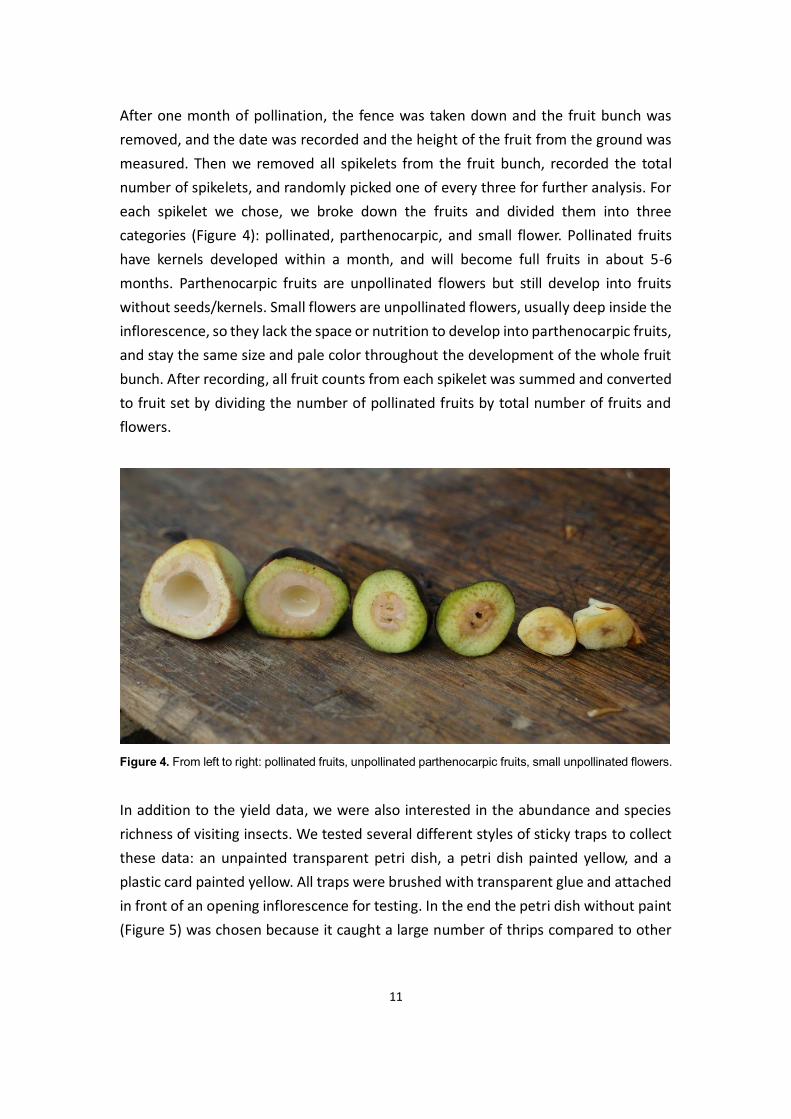
After one month of pollination, the fence was taken down and the fruit bunch was
removed, and the date was recorded and the height of the fruit from the ground was
measured. Then we removed all spikelets from the fruit bunch, recorded the total
number of spikelets, and randomly picked one of every three for further analysis. For
each spikelet we chose, we broke down the fruits and divided them into three
categories (Figure 4): pollinated, parthenocarpic, and small flower. Pollinated fruits
have kernels developed within a month, and will become full fruits in about 5-6
months. Parthenocarpic fruits are unpollinated flowers but still develop into fruits
without seeds/kernels. Small flowers are unpollinated flowers, usually deep inside the
inflorescence, so they lack the space or nutrition to develop into parthenocarpic fruits,
and stay the same size and pale color throughout the development of the whole fruit
bunch. After recording, all fruit counts from each spikelet was summed and converted
to fruit set by dividing the number of pollinated fruits by total number of fruits and
flowers.
Figure 4. From left to right: pollinated fruits, unpollinated parthenocarpic fruits, small unpollinated flowers.
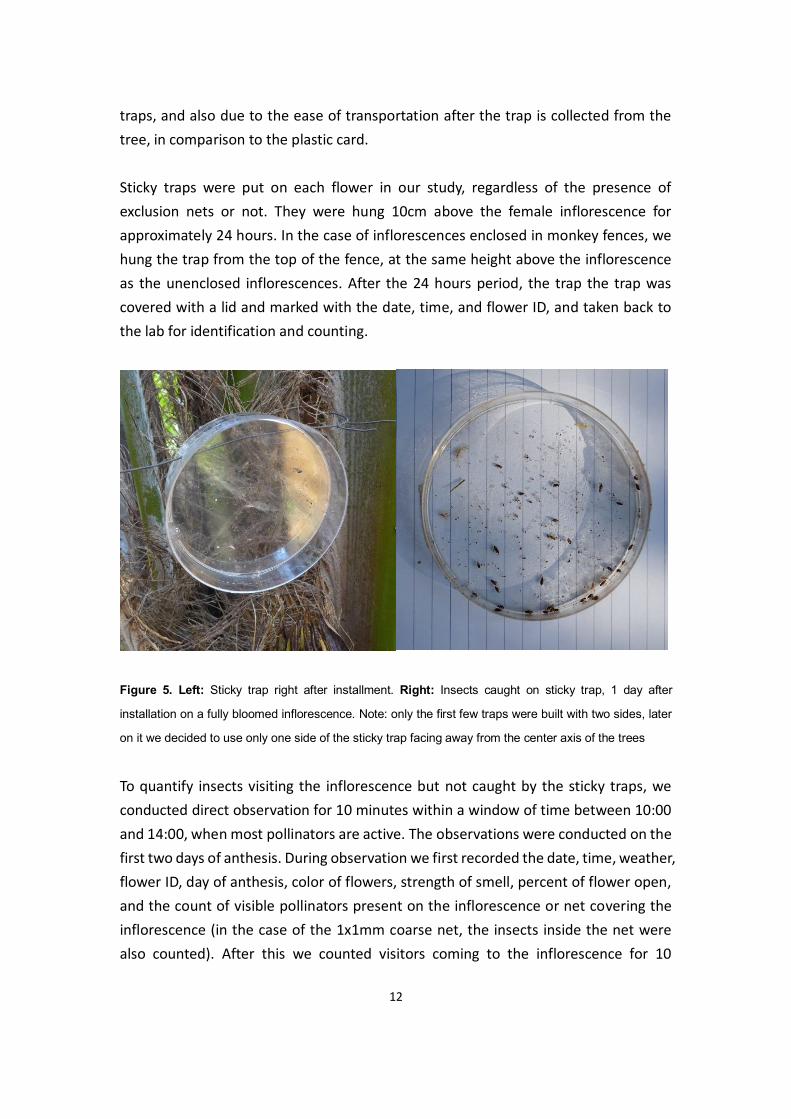
In addition to the yield data, we were also interested in the abundance and species
richness of visiting insects. We tested several different styles of sticky traps to collect
these data: an unpainted transparent petri dish, a petri dish painted yellow, and a
plastic card painted yellow. All traps were brushed with transparent glue and attached
in front of an opening inflorescence for testing. In the end the petri dish without paint
(Figure 5) was chosen because it caught a large number of thrips compared to other
12
traps, and also due to the ease of transportation after the trap is collected from the
tree, in comparison to the plastic card.
Sticky traps were put on each flower in our study, regardless of the presence of
exclusion nets or not. They were hung 10cm above the female inflorescence for
approximately 24 hours. In the case of inflorescences enclosed in monkey fences, we
hung the trap from the top of the fence, at the same height above the inflorescence
as the unenclosed inflorescences. After the 24 hours period, the trap the trap was
covered with a lid and marked with the date, time, and flower ID, and taken back to
the lab for identification and counting.
Figure 5. Left: Sticky trap right after installment. Right: Insects caught on sticky trap, 1 day after
installation on a fully bloomed inflorescence. Note: only the first few traps were built with two sides, later
on it we decided to use only one side of the sticky trap facing away from the center axis of the trees
To quantify insects visiting the inflorescence but not caught by the sticky traps, we
conducted direct observation for 10 minutes within a window of time between 10:00
and 14:00, when most pollinators are active. The observations were conducted on the
first two days of anthesis. During observation we first recorded the date, time, weather,
flower ID, day of anthesis, color of flowers, strength of smell, percent of flower open,
and the count of visible pollinators present on the inflorescence or net covering the
inflorescence (in the case of the 1x1mm coarse net, the insects inside the net were
also counted). After this we counted visitors coming to the inflorescence for 10
13
minutes, categorizing them into morphologic groups. Finally, we evaluated the
presence of ants on the inflorescence as the last step into two categories: maximum
and constant abundance of ants. The former is the most ants observed at a certain
time, and the latter being how many ants are usually in sight at any time during the
observation.
According to the literature, thrips are most active during mornings and evenings, but
due to their small size and logistical reasons, we chose not to conduct observations
during these times. On our trial tests of the sticky traps we were able to capture
hundreds of thrips, so even though we cannot count them in our observations, the
presence of thrips was accounted for in the sticky traps.
Pollen was collected by wrapping male inflorescence in fine mesh nets before anthesis,
cut down and collected into a clear container once it has reached maximum bloom.
The collected pollen was tested in 15% sucrose and 1.6mM boric acid solution, which
resulted in 100% viability in 2 out of 3 repetitions (76.4% average). 1 portion of pollen
is mixed with 4 portion baby powder, sprayed equally onto female inflorescence on
their second day of anthesis. Insect traps were only collected on the first day for these
inflorescences in assisted pollination treatment.
Statistics and data analysis
Insects captured by sticky traps were identified into family level in our lab, each order
and family that has a significant abundance (more than 100 individuals in total) was
ran with a generalized mixed model with negative binomial distribution, and tree ID as
random effect. Fruit set/Yield was also run with GLMM and tree ID as random term,
using a binomial distribution. All analyses were carried out with R 3.6.2.
14
3. Results
Starting from 24.08.2018 until 08.10.2018, in the course of 42 days, we have collected
149 ticky traps out of 49 trees, including 143 traps from female flowers on our trees
chosen for exclusion treatments, and 6 traps from male flowers on 3 additional trees
not part of the experiment. A weather station was also erected on 31.08 to collect
valuable temperature and humidity data. To better explain the weather fluctuations
across the span of our experiment, I chose the readings recorded at mid-day (12pm)
to represent the weather conditions of the day. Median temperature is 33.085 ⁰C,
ranging from lowest 24.09 to highest 36.081⁰C. Since it was the dry season during our
experiment, there was not a lot of instances which we have encountered rain, heavy
precipitation still happened a number of times and we were unable to perform
sampling. Median humidity is 63.2525%, ranging from 48.362 to 97.413%. Full weather
data is shown in supplemental data.
3.1. Sticky traps
In our traps we have found a great variety of insects and other Arthropods, thrips from
the two families (Thripidae, Phlaeothripidae) of order Thysanoptera are the most
abundant, with both families exceeding 10,000 individuals counted in total (34391
individuals of family Phlaeothripidae, and 19150 individuals of Thripidae). Coleoptera
is the second most abundant order present on our traps, according to our observations
in the field, the oil palm specific pollinator E. kamerunicus is the only species found in
the family Curculionidae, with a total of 3246 individuals. 21 other families from order
Coleoptera were also caught, however they had much less presence in our traps, with
81 Nitidulidae, 54 Ptiliidae, and the rest less than 50 individuals. The third group is
Diptera, 2217 individuals from 21 families were caught. Most notably, Phoridae (667
individuals), Psychodidae (628), Drosophilidae (461), and Cecidomyiidae (255
individuals). All orders are listed in table 3.1. List of families discovered is in
supplemental data.
15
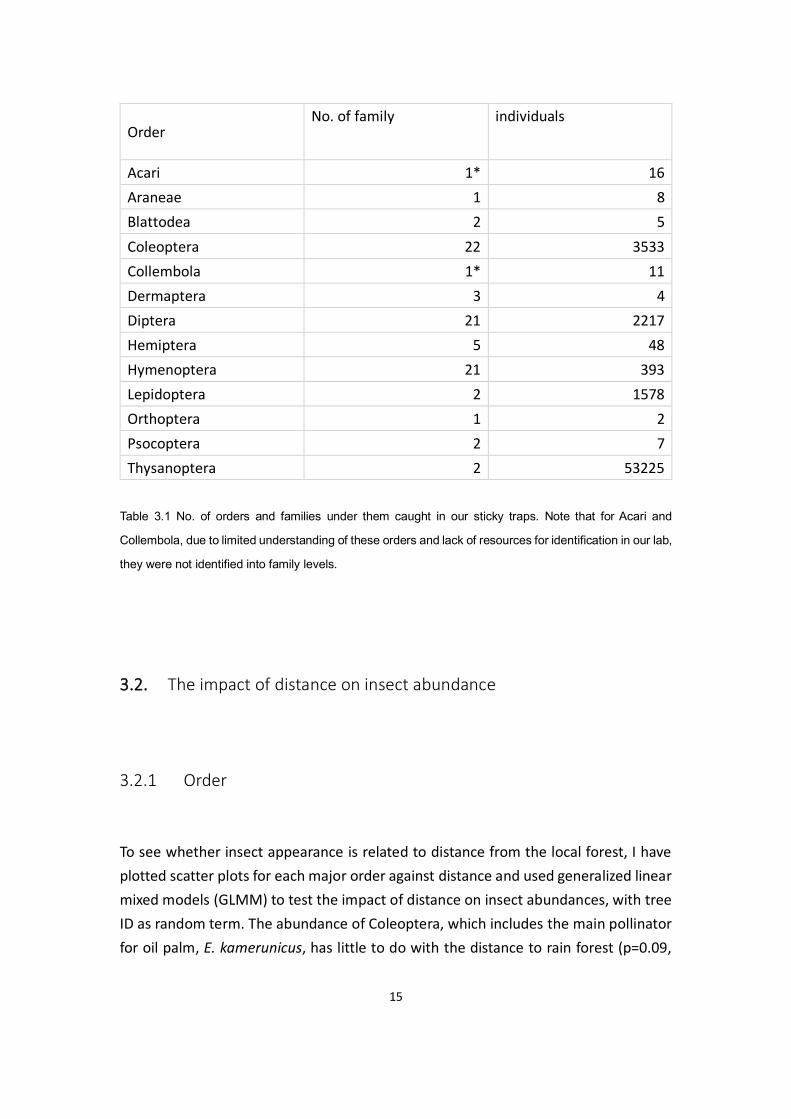
Order No. of family individuals
Acari 1* 16
Araneae 1 8
Blattodea 2 5
Coleoptera 22 3533
Collembola 1* 11
Dermaptera 3 4
Diptera 21 2217
Hemiptera 5 48
Hymenoptera 21 393
Lepidoptera 2 1578
Orthoptera 1 2
Psocoptera 2 7
Thysanoptera 2 53225
Table 3.1 No. of orders and families under them caught in our sticky traps. Note that for Acari and
Collembola, due to limited understanding of these orders and lack of resources for identification in our lab,
they were not identified into family levels.
3.2. The impact of distance on insect abundance
3.2.1 Order
To see whether insect appearance is related to distance from the local forest, I have
plotted scatter plots for each major order against distance and used generalized linear
mixed models (GLMM) to test the impact of distance on insect abundances, with tree
ID as random term. The abundance of Coleoptera, which includes the main pollinator
for oil palm, E. kamerunicus, has little to do with the distance to rain forest (p=0.09,
16
GLMM), and neither does treatment of nets (Type II Wald chisquare tests, p=0.94).
Thysanoptera, another major group of insects contributing to the pollination of Elaeis
guineensis before the introduction of E. kamerunicus. However, our GLMM showed
that neither distance (p=0.25) nor treatment (p~0.05) had affected the presence of
Thysanoptera. Hymenoptera is another potential pollinator group, however neither
distance (p=0.96) nor treatment (p=0.1) had a significant impact on their abundance
either. Diptera was not affected by distance either (p=0.4), however there is a
significant difference between open and full exclusion treatment (-0.672, p=0.0111).
As for Lepidoptera, distance has shown a slight positive correlation (0.0088) with a p
value of 0.0138.
Overall, most major orders found on the sticky traps doesn’t show a clear pattern
according to the distance to forest, Only Lepidoptera has a slight correlation with such
parameter. For Diptera, there is a distinct difference between control and full-exclusion
treatments.
3.2.2 Family
Diving deeper into family level, we can isolate Curculionidae (weevils) and check if the
number of individuals of E. kamerunicus are also not affected by distance or treatment,
since they are the only species of weevils caught by the traps. With the help of same
GLMM, it is clear that their abundance was not affected by either distance (p>0.15)
nor treatment (Type II Wald chisquare tests, p=0.94).
Next we look at the two families under Thysanoptera, which are Thripidae and
Phlaeothripidae, both are not affected by the distance, however, treatment has a
significant impact on Phlaeothripidae (p<0.0001), Assisted pollination has less
abundance than semi-exclusion (-1.389, p=0.0009, EMM) and open pollination (-0.731,
17
p<0.0001, EMM), however this could not be seen in Thripidae (p=0.097, Type II Wald
chisquare tests). For Leipidoptera, Gelechiidae is the most abundant family. There is a
slight positive correlation (0.009431) between distance and its abundance (p=0.0112).
However, the treatments do not influence its appearance on traps (table 3.2).
After removing data collected from netted treatments (semi- and full- exclusion nets)
from the analysis, the results are the same when it comes to the distance to forest.
Speaking of treatment as a response to insect abundance, For Phlaeothripidae, assist
treatment has less individuals than semi and open treatment, there is no such
difference in Thripidae. Formicidae has significantly more presence in open treatment
than assist and Semi. Phoridae has less individuals in semi than assist and full exclusion.
For Drosophilidae, there is less abundance in open than the other 3 treatments.
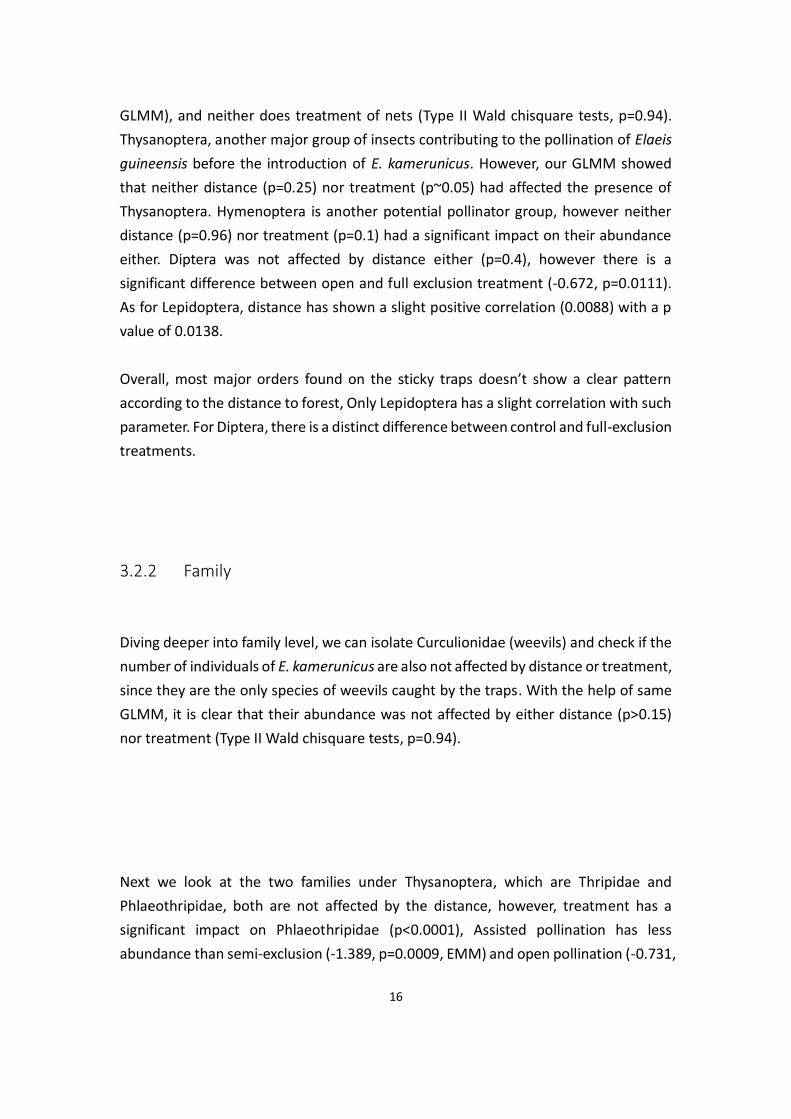
Order Family Parameter Estimate P. value
Coleoptera Curculionidae - - -
Thysanoptera Phlaeothripidae Assist - Semi -1.389 0.0009
Assist - Open -0.731 <.0001
Thripidae - - -
Lepidoptera Gelechiidae Distance 0.009431 0.0112
Hymenoptera Formicidae Assist - Open -2.6949 0.0036
Semi - Open -1.4624 0.0432
Diptera Cecidomyiidae - - -
Phoridae Assist - Semi 1.015 0.0290
Semi - Full -1.339 0.0020
Drosophilidae Assist - Open 2.0199 0.0077
Semi - Open 1.7796 0.0158
Open - Full -2.1017 0.0028
Psychodidae - - -
Table 3.2, parameters correlated to abundance of major families caught in sticky traps, Type II
Wald Chisquare tests for distance, and estimated marginal means adjusted by tuckey method
for treatments.
18
3.3. Species richness
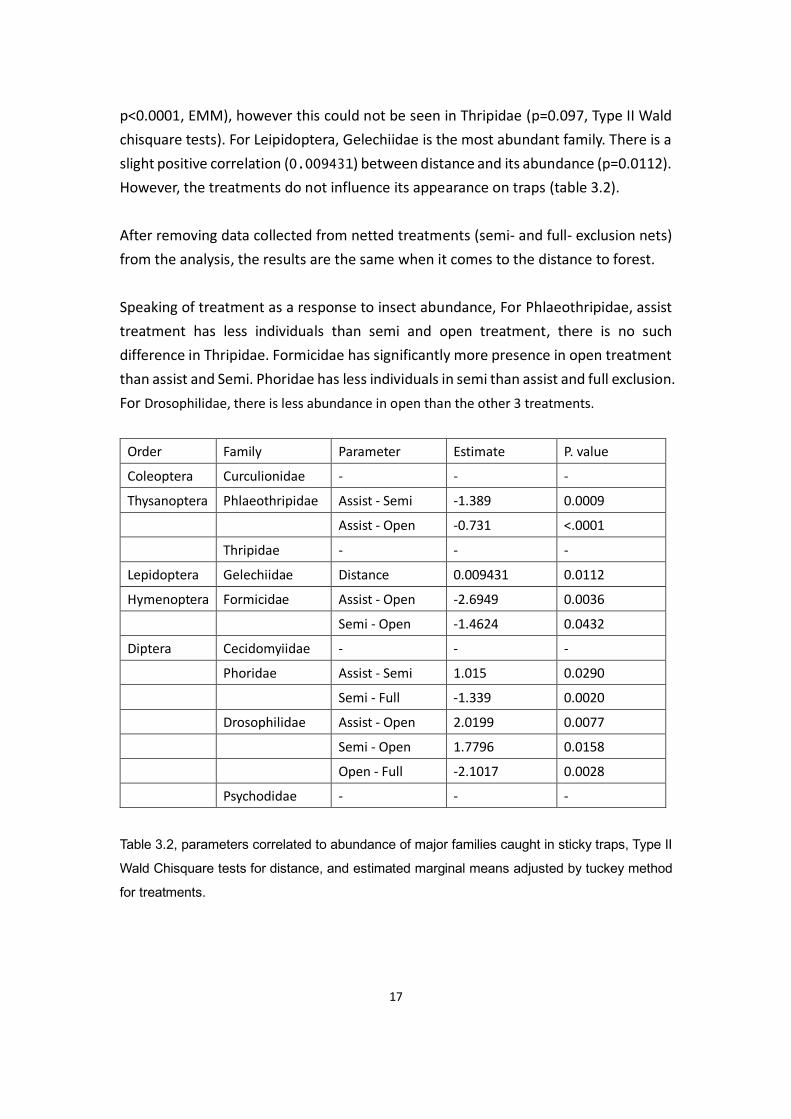
Here we have calculated the Shannon diversity index of each sticky trap and used
linear mixed models to evaluate the relation between distances to forest. However,
distance has no significant effect on Shannon diversity index (p>0.9). Notably, the
Shannon index is significantly different between Assisted pollination and semi-
exclusion nets (p=0.0152, estimated marginal means), there are no significant
difference between other treatments (figure 3.1).
Figure 3.1 Box plot for Shannon diversity index between treatments.
19
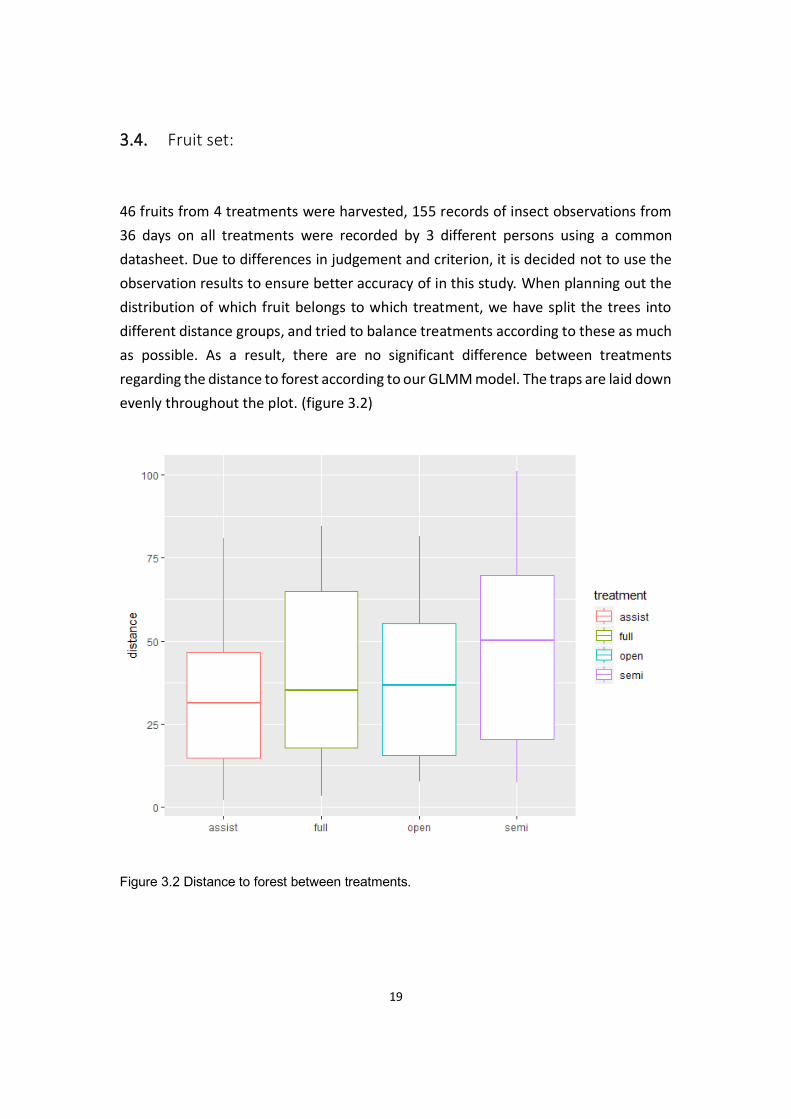
3.4. Fruit set:
46 fruits from 4 treatments were harvested, 155 records of insect observations from
36 days on all treatments were recorded by 3 different persons using a common
datasheet. Due to differences in judgement and criterion, it is decided not to use the
observation results to ensure better accuracy of in this study. When planning out the
distribution of which fruit belongs to which treatment, we have split the trees into
different distance groups, and tried to balance treatments according to these as much
as possible. As a result, there are no significant difference between treatments
regarding the distance to forest according to our GLMM model. The traps are laid down
evenly throughout the plot. (figure 3.2)
Figure 3.2 Distance to forest between treatments.
20
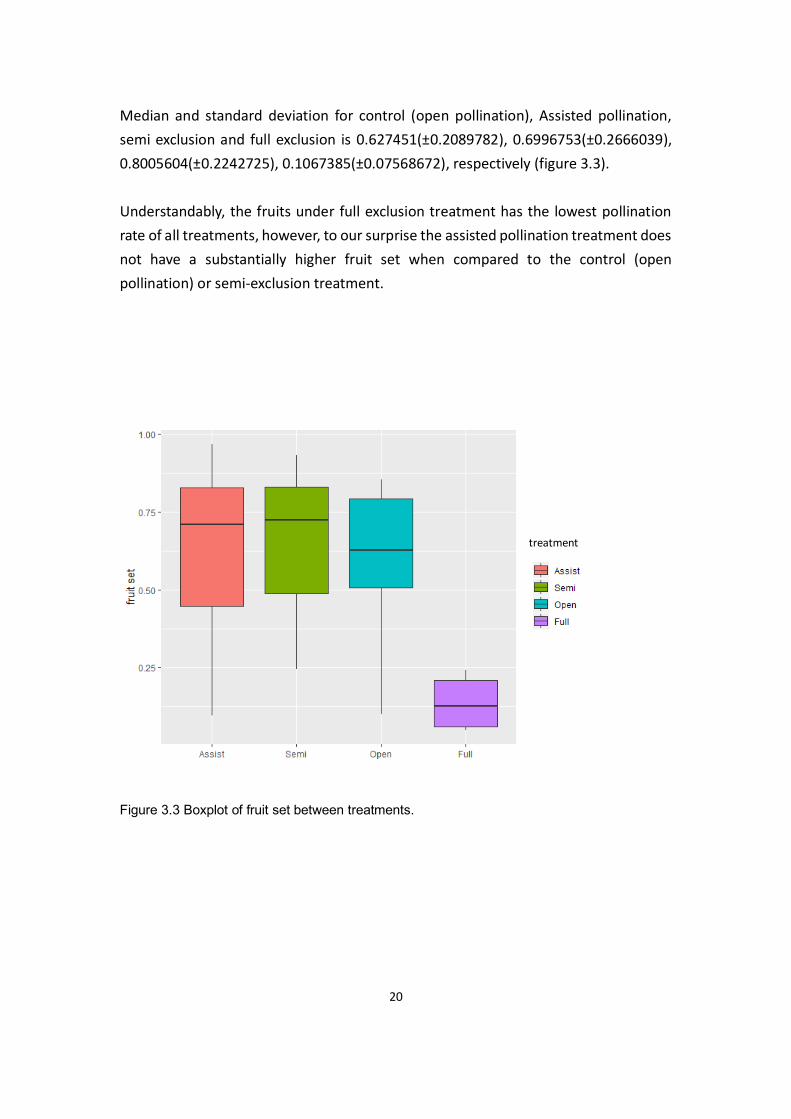
Median and standard deviation for control (open pollination), Assisted pollination,
semi exclusion and full exclusion is 0.627451(±0.2089782), 0.6996753(±0.2666039),
0.8005604(±0.2242725), 0.1067385(±0.07568672), respectively (figure 3.3).
Understandably, the fruits under full exclusion treatment has the lowest pollination
rate of all treatments, however, to our surprise the assisted pollination treatment does
not have a substantially higher fruit set when compared to the control (open
pollination) or semi-exclusion treatment.
Figure 3.3 Boxplot of fruit set between treatments.
treatment
21
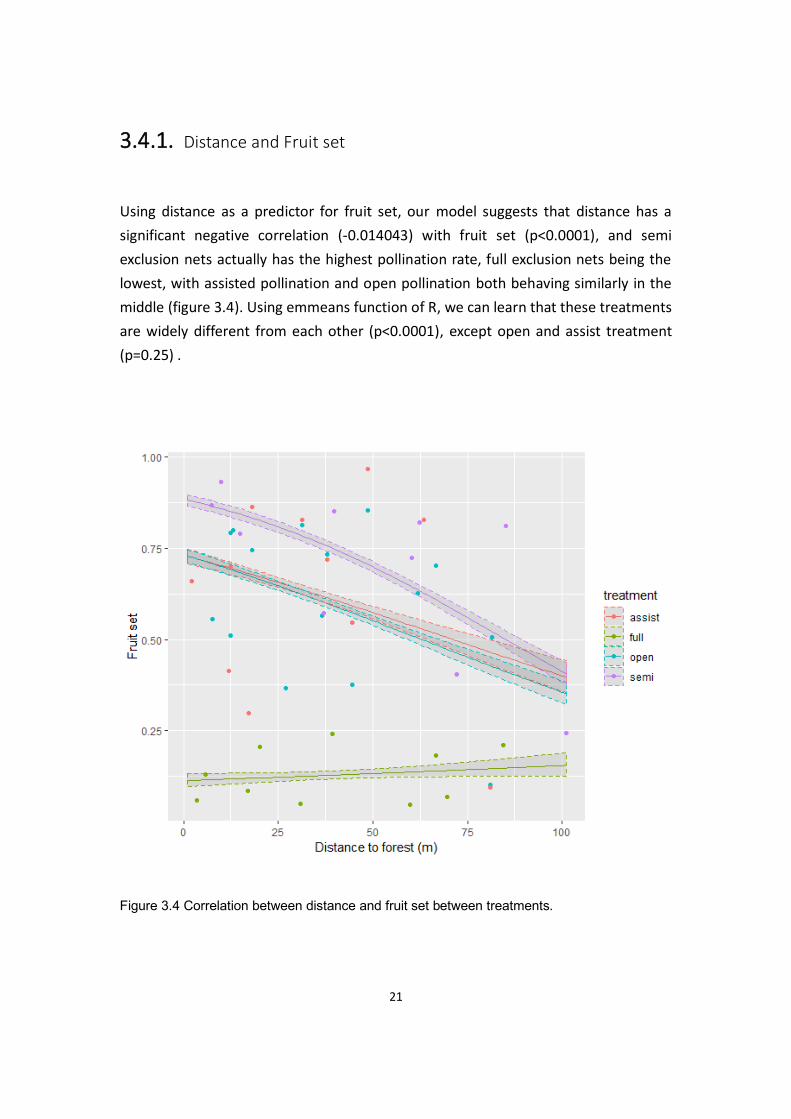
3.4.1. Distance and Fruit set
Using distance as a predictor for fruit set, our model suggests that distance has a
significant negative correlation (-0.014043) with fruit set (p<0.0001), and semi
exclusion nets actually has the highest pollination rate, full exclusion nets being the
lowest, with assisted pollination and open pollination both behaving similarly in the
middle (figure 3.4). Using emmeans function of R, we can learn that these treatments
are widely different from each other (p<0.0001), except open and assist treatment
(p=0.25) .
Figure 3.4 Correlation between distance and fruit set between treatments.
22
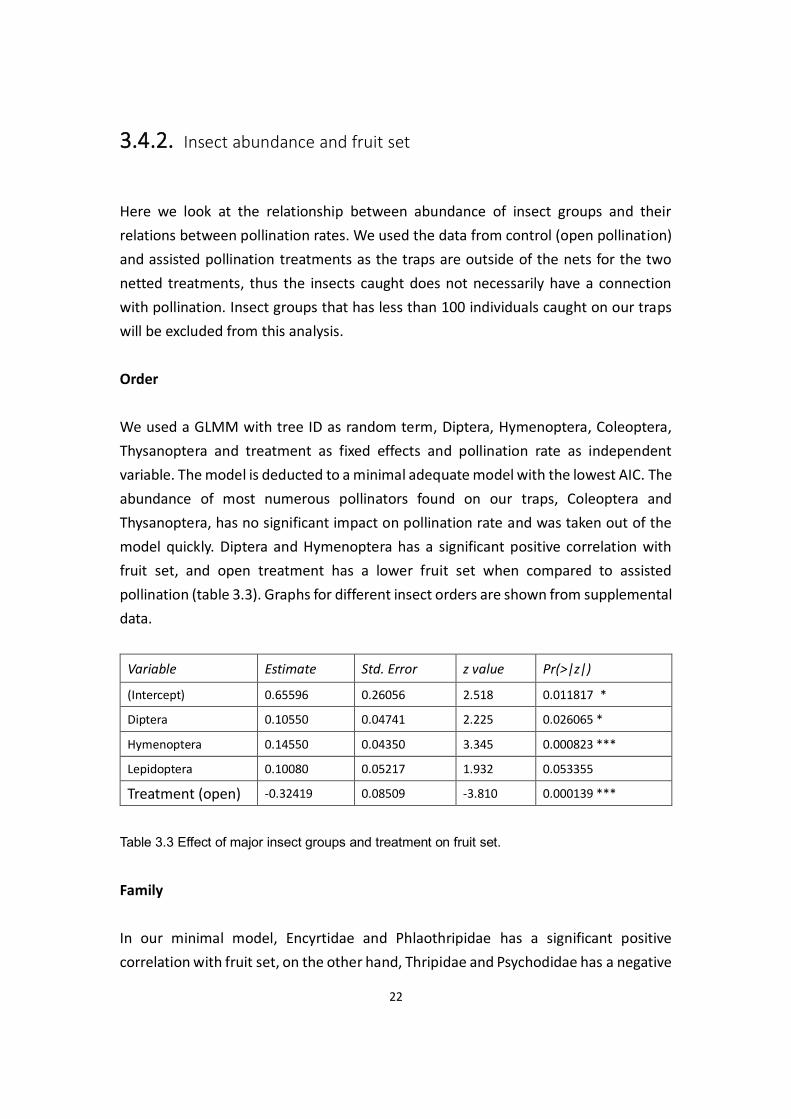
3.4.2. Insect abundance and fruit set
Here we look at the relationship between abundance of insect groups and their
relations between pollination rates. We used the data from control (open pollination)
and assisted pollination treatments as the traps are outside of the nets for the two
netted treatments, thus the insects caught does not necessarily have a connection
with pollination. Insect groups that has less than 100 individuals caught on our traps
will be excluded from this analysis.
Order
We used a GLMM with tree ID as random term, Diptera, Hymenoptera, Coleoptera,
Thysanoptera and treatment as fixed effects and pollination rate as independent
variable. The model is deducted to a minimal adequate model with the lowest AIC. The
abundance of most numerous pollinators found on our traps, Coleoptera and
Thysanoptera, has no significant impact on pollination rate and was taken out of the
model quickly. Diptera and Hymenoptera has a significant positive correlation with
fruit set, and open treatment has a lower fruit set when compared to assisted
pollination (table 3.3). Graphs for different insect orders are shown from supplemental
data.
Variable Estimate Std. Error z value Pr(>|z|)
(Intercept) 0.65596 0.26056 2.518 0.011817 *
Diptera 0.10550 0.04741 2.225 0.026065 *
Hymenoptera 0.14550 0.04350 3.345 0.000823 ***
Lepidoptera 0.10080 0.05217 1.932 0.053355
Treatment (open) -0.32419 0.08509 -3.810 0.000139 ***
Table 3.3 Effect of major insect groups and treatment on fruit set.
Family
In our minimal model, Encyrtidae and Phlaothripidae has a significant positive
correlation with fruit set, on the other hand, Thripidae and Psychodidae has a negative

23
impact on fruit set. Open treatment has lower fruit set when compared to Assist (table
3.4).
Estimate Std. Error Z value Pr(>|z|)
(Intercept) 0.58069 0.24870 2.335 0.019549 *
Encyrtidae 0.20892 0.09549 2.188 0.028686 *
Formicidae -0.07310 0.04129 -1.770 0.076662
Phlaeothripidae 0.35170 0.12025 2.925 0.003447 **
Thripidae -0.49918 0.21484 -2.323 0.020155 *
Psychodidae -0.16321 0.03926 -4.158 3.22e-05 ***
Treatment (open) -0.24374 0.06678 -3.650 0.000263 ***
Table 3.4 Effect of major insect families and treatment on fruit set.
24
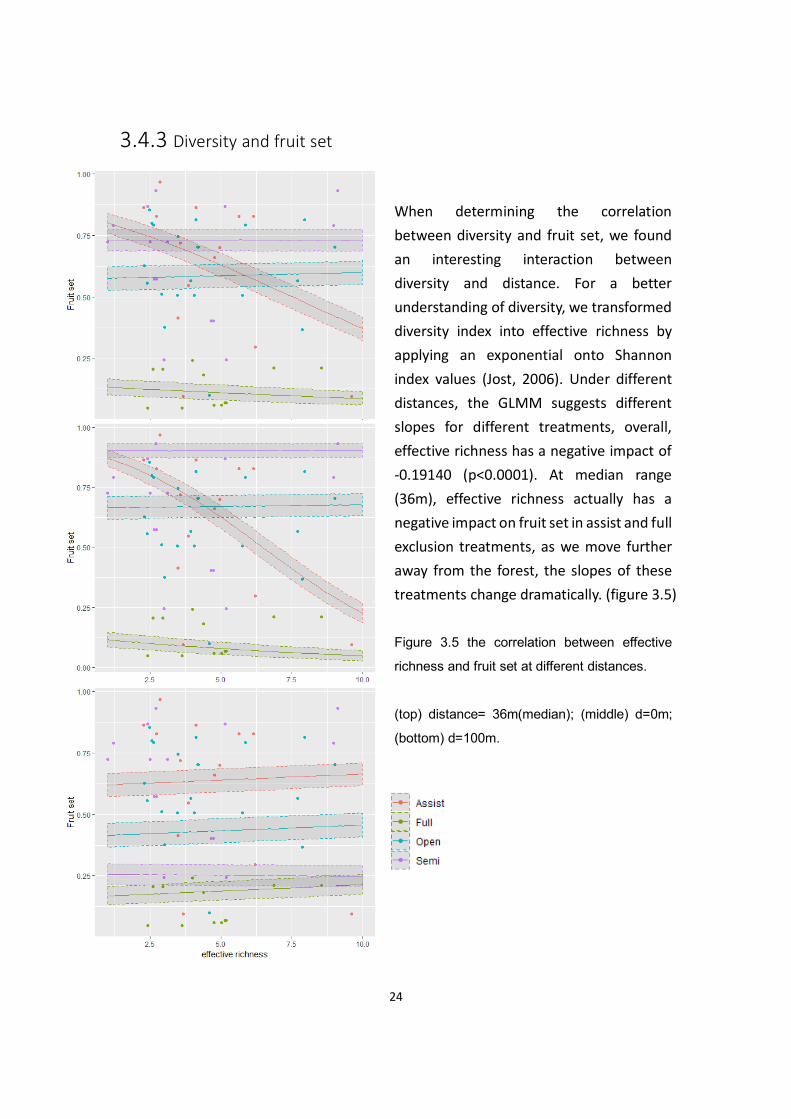
3.4.3 Diversity and fruit set
When determining the correlation
between diversity and fruit set, we found
an interesting interaction between
diversity and distance. For a better
understanding of diversity, we transformed
diversity index into effective richness by
applying an exponential onto Shannon
index values (Jost, 2006). Under different
distances, the GLMM suggests different
slopes for different treatments, overall,
effective richness has a negative impact of
-0.19140 (p<0.0001). At median range
(36m), effective richness actually has a
negative impact on fruit set in assist and full
exclusion treatments, as we move further
away from the forest, the slopes of these
treatments change dramatically. (figure 3.5)
Figure 3.5 the correlation between effective
richness and fruit set at different distances.
(top) distance= 36m(median); (middle) d=0m;
(bottom) d=100m.

25
4. Discussion
4.1 Distance and insect abundance:
Oil palm plantation is a very monotonous environment, and our site has just been
sprayed with herbicides, which pales in comparison with the think cover offered by
nearby rainforests. My hypothesis is that indigenous insects must have been living in
the rainforest, and the closer to the forest, the more exposure to spill over organisms
should be found, thus a distinct drop off of local insects should be observed as distance
to forest increase.
Of all the major insect groups in our traps, only Gelechiidae of Lepidoptera has a
significant response to distance, even so, its abundance increases slightly over the
distance. For others, Perhaps the range of 100m in our selected plot is too small, and
easy for most insect groups to disperse through without problems. The lack of cover
does not help with this either. Another explanation would be that the insects have
adapted to the plantation since the introduction of oil palm 40 years ago. However,
this is highly unlikely, as the plantation provides far less hideouts, and our site has been
sprayed not long ago. It would be interesting to see if there were insect traps
positioned directly inside the rainforest, however the dense brush prohibited us from
doing so. I am not quite sure why Gelechiidae has a positive response to distance, as
the other side of our site is a huge corporate-owned plantation. Many Twirler moths
are considered as pests (12), as their larvae feed internally on their host plants, so
there is a possibility that these moths feed on oil palm, although we have not observed
this phenomenon in the field.
4.2 distance and fruit set
from section 3.4.1 one can conclude that distance in fact has a slight negative effect
on fruit set (-0.014043), however, as pollinator abundance was not affected by
26
distance, our assumption that more visitors mean more yield has been proven wrong.
The higher fruit set closer to forest might be attributed to environmental factors, such
as nutrition, elevation, soil, or the state of the tree itself. One of our trees has a very
low pollination rate, both of its fruits come from different treatments (control and
assisted), however the resulting pollination rate is almost identically low (9-10%).
4.3 distance and diversity/effective richness
Distance wise, the Shannon diversity index is spread out pretty evenly throughout the
site, this could also due of the limited range of our site. Effective richness has the same
result as Shannon diversity, no significant correlation with distance. However, the
values are not even between the treatments, I’ll go back to this in the treatment
section.
4.4 insect abundance and fruit set
In my hypothesis, I would theorize that the more pollinators there are, the higher the
pollination rate should be. The presence of more pollinators will bring in more pollen,
which in turn contribute to more flowers being pollinated in the inflorescence.
However, only Diptera and Hymenoptera has a significant positive effect on fruit set.
The main pollinators, Coleoptera and Thysanoptera, both showed no response to
pollination rate. The reason for this might be, that a sufficient amount of E.
kamerunicus is already enough for most of the pollination to take part, for other
species carry little pollen, or have low pollen viability. (1)
Hymenoptera is known for being good pollinators, and we have seen some stingless
bees visiting the inflorescence during observation. In our traps, we mostly got smaller
species, in a wide variety of different families. Ants (Formicidae) are also caught,
however they have no significant contribution to pollination in our model. The most
abundant family, Encyrtidae, a group of parasitic wasps, has a significant positive
27
correlation, they may be interested in the pollen of oil palm, or, they are here to hunt.
Psychodidae is the only family in Diptera that has a significant effect, however its
correlation is the opposite, being a negative to fruit set. More interestingly, the two
families in Thysanoptera, Thripidae and Phlaeothripidae has opposite effects on yield.
Thripidae contains our main local pollinator, Thrips hawaiiensis, has a negative
response, while its more abundant cousin, Phlaeothripidae, has a positive response.
This might explain why the order Thysanoptera itself bears no significance on order
level. These findings are hard to explain, as publications on local pollinators are rare,
but it could also be the result of small sample size. Because I am also interested in the
effect of distance on insect abundance, the insect traps are placed outside of the nets,
which means only the pollination rate from treatments without nets (control, assist)
can be paired with abundance data and analyzed, taking away almost half of the
sample size. This is a flaw of the experiment design.
4.5 Treatments
I expect the highest yield to be occurring on the assisted pollination treatment,
followed by our control group, open pollination. Semi-exclusion nets should be lower,
since we exclude some larger pollinators. Semi-nets also block larger predators from
gaining access to the flowers, when pollinators are most vulnerable. And then the least
yield would come from fully netted inflorescences, expected to be close to 0.
To my surprise, Semi-exclusion nets actually has the highest pollination rate (80%) of
all, more than assisted pollination (62.7%) and open pollination/control (69.9%). It
appears that the effect of blocking predators is even greater than denying larger
pollinators into the inflorescence. During observation, we spotted several assassin
bugs (Reduviidae) prey on E. kamerunicus on full-bloom male inflorescences.
For insect abundance between treatments (section 3.2), there shouldn’t be
differences between assisted pollination and control, due to the hand pollination
applied after the sample collection. Phlaeothripidae, Formicidae, Drosophilidae all has
this kind of difference between the two, which suggests there may be other factors
28
contributing to this. Phoridae has the least presence in Semi treatment, suggesting
that there might be something about the green PVC nets that are repelling them.
Assisted pollination also has higher Shannon diversity than semi-exclusion (section
3.3), which further suggests this possibility, but then, the other treatments has no
significant difference with Semi either, making it hard to prove such theory. Another
possibility, may be that the assist treatment was more concentrated in the later half of
the experiment, owing to some complications with obtaining the pollen earlier, while
the rest of the treatments are spread out more evenly throughout the duration of this
experiment.
In section 3.4.3, according to our GLMM, in closer distances, the pollination rate
actually drops off significantly with more insect diversity, while at further ranges, the
model predictions are closer to what I have originally hypothesized: Assisted
pollination has more yield, followed by control, semi, then Full exclusion on the bottom.
This may indicate that the scale of this site is indeed too small, and other factors may
have impacted the fruit set, but not covered by this experiment.
Conclusion
In conclusion, the original research question can be answered as: 1. Pollinators doesn’t
appear more frequent when closer to forest border; 2. Other than Gelechiidae, one
cannot tell if there is a pattern that insects react to distance to forest differently; 3.
Hymenoptera and Diptera are positively correlated with fruit set, however more
samples are needed for better accuracy; 4. Yes, Fruit set is linked to the distance from
forest. It is slightly higher when closer to the forest; 5. Treatment does affect yield,
however, semi-exclusion nets out perform assisted pollination and other treatments!
It is quite surprising but understandable to see that insect diversity and abundance
isn’t linked to the distance to forest, and yet the fruit set still has a negative correlation
with distance. It would be nice to see if put on a larger scale, would we see a clear
pattern? This is just one small step towards understanding the community of
pollinators and oil palm, hopefully we can understand more about their relationship
and find a balance between rainforest and oil palm plantations.
29
References:
1. Jost, L. (2006). Entropy and diversity. Oikos, 113(2), 363–375.
https://doi.org/10.1111/j.2006.0030-1299.14714.x
2. Corley, R. H. V., Tinker, P. B. (2016). The Oil Palm, fifth edition. John Wiley & Sons
3. Hoboken, NJ.Koh, L. P., & Wilcove, D. S. (2008). Is oil palm agriculture really
destroying tropical biodiversity?. Conservation letters, 1(2), 60-64.
4. D., S., A., C., E., M., M., van N., J., G., J., S.-G., … M., K. (2009). The impacts and
opportunities of oil palm in Southeast Asia: What do we know and what do we
need to know? The impacts and opportunities of oil palm in Southeast Asia: What
do we know and what do we need to know? Center for International Forestry
Research (CIFOR). https://doi.org/10.17528/cifor/002792Mohd, Basri Wahid, Nor
Siti, and I. E. Henson. "Oil palm-achievements and potential." Oil Palm Bulletin 50
(2005): 1-13.
5. Wahid, M. B., Abdullah, S. N. A., & IE, H. (2005). Oil palm. Plant Production Science,
8(3), 288-297.
6. Maley, J. (2001). Elaeis guineensis Jacq.(oil palm) fluctuations in central Africa
during the late Holocene: climate or human driving forces for this pioneering
species?. Vegetation history and Archaeobotany, 10(2), 117-120.Syed, R. (1979).
Studies on oil palm pollination by insects. Bulletin of Entomological Research, 69(2),
213-224. doi:10.1017/S0007485300017673
7. Donough, C. R., & Law, I. H. (1987). The effect of wevil pollination on yield and
profitability at Pamoil Plantation. In International Oil/Palm/Palm Oil Conferences.
30
Progress and Prospects.(Agriculture) ProceedingsJune 29-July 1Kuala Lumpur (No.
L-0115). PORIM.
8. Prasetyo, A. E., Purba, W. O., & Susanto, A. (2014). Elaeidobius kamerunicus:
application of hatch and carry technique for increasing oil palm fruit set. Journal of
Oil Palm Research, 26(3), 195-202.
9. Koh, L. P., & Wilcove, D. S. (2008). Is oil palm agriculture really destroying tropical
biodiversity?. Conservation letters, 1(2), 60-64.
10. Donough, C. R., Chew, K. W., & Law, I. H. (1996). Effect of fruit set on OER and KER:
results from studies at Pamol Estates (Sabah) Sdn Bhd. Planter, 72(841), 203-219.
11. Rao, V., & Law, I. H. (1998). The problem of poor fruit set in parts of East Malaysia.
Planter, 74(870), 463-483.
12. Syed, R. A. (1982). Insect pollination of oil palm: feasibility of introducing
Elaeidobius spp. into Malaysia. In The oil palm in the eighties. A report of the
Proceedings of the International Conference on Oil Palm in Agriculture in the
Eighties, Kuala Lumpur, 17-20 June 1981. Volume I (pp. 263-289). Incorporated
Society of Planters.
13. Chailleux, A., Biondi, A., Han, P., Tabone, E., & Desneux, N. (2013). Suitability of the
pest–plant system Tuta absoluta (Lepidoptera: Gelechiidae)–tomato for
Trichogramma (Hymenoptera: Trichogrammatidae) parasitoids and insights for
biological control. Journal of Economic Entomology, 106(6), 2310-2321.
14. Klein, A. M., Vaissiere, B. E., Cane, J. H., Steffan-Dewenter, I., Cunningham, S. A.,
Kremen, C., & Tscharntke, T. (2007). Importance of pollinators in changing
landscapes for world crops. Proceedings of the royal society B: biological sciences,
274(1608), 303-313.