Embed Size (px)
Citation preview

POLLINATION AND POLLEN LIMITATION IN MAYAPPLE(PODOPHYLLUM PELTATUM L.),
A NECTARLESS SPRING EPHEMERAL
by
James E. Crants
A dissertation submitted in partial fulfillmentof the requirements for the degree of
Doctor of Philosophy(Ecology and Evolutionary Biology)
in the University of Michigan2008
Doctoral Committee:
Associate Professor Beverly J. Rathcke, ChairProfessor Deborah E. GoldbergProfessor Ivette PerfectoProfessor Earl E. Werner

© James E. Crants 2008
ii
DEDICATION
This dissertation is dedicated to my parents, Duane and Diana, and my wife, Ginny,
all of whom have supported me and encouraged me to work hard for my dreams.
I hope to return the favor.

iii
ACKNOWLEDGEMENTS
My wife, Ginny Zawistowski, has supported me through my graduate school
adventures and misadventures for seven years at Michigan, plus two years at Wisconsin.
She has been my counselor, my cheerleader, and, when necessary, my boss.
My parents, Duane and Diana Crants, taught me to face life and people with
patience, humility, and an open mind. They took me to the mountains, where I learned to
love nature. They taught me integrity and the value of hard work, with wisdom and good
sense, and I believe this is why I have the fortune to be writing this dissertation today.
I thank Beverly Rathcke, my advisor and mentor for all of these years. We have
had many meetings about many projects, and with her guidance, I have learned vastly
more than I had realized I didn’t know. Graduate school can deeply challenge one’s self-
confidence, and I know I’m not the only one to discover this. I could not have made it
without Beverly advising me and pushing me to do more than I thought I could.
My other committee members have made invaluable contributions to my research,
though I have never made as much use of their wisdom and experience as I should have.
Deborah Goldberg, Earl Werner, and Ivette Perfecto have all provided useful advice,
particularly because they see things from a different perspective than I do. Meetings with
each of them regularly yielded insights that I wished I’d had years earlier.
I also want to thank a number of my fellow graduate students for reading drafts,
commenting on talks, discussing research, and offering advice. Foremost in this group is
Ben Montgomery with whom I shared an office for five years. He always had useful
advice and insights into how to conduct research and operate in an academic setting.
Jonathan Rosenthal, Radka Wildova, Shalene Jha, and David Allen have all been good
friends over the years, and I have learned a lot from talking with them and watching them
work. I also benefitted greatly from the experience of Sheila Schueller, Carol Landry,
Daniel DeJoode, and Jacqueline Courteau, particularly in my early years in the program
iv
The EEB office staff, particularly Julia Eussen, Barbara Klump, and LaDonna
Walker, navigated me safely through the treacherous seas of university bureaucracy.
My field and lab assistants, Kara Vogel, Ran Tao, and Max Heitner, made it
possible for me to accomplish far, far more than I could alone. They also never
complained, which is a very big deal when you’re getting swarmed with mosquitoes or
counting seeds and ovules under a microscope for hours on end. I have been blessed to
have such hard-working intelligent, professional assistants.
Knute Nadelhoffer, Don Zak, and Deborah Goldberg were all kind enough to
allow me to use space and equipment in their labs. Dr. Zak also provided guidance on
soil testing, and Dr. Nadelhoffer and his lab technician, Jim LeMoine, allowed me the use
of their LAI-2000 leaf-area index meter, as well as instructions in its use.
I have spent the past year working and corresponding from an office at the
University of Minnesota, and I have Ruth Shaw of the Department of Ecology, Evolution,
and Behavior, to thank for that. She has made me feel most welcome here. Ed Cushing
provided me with access to a compound microscope, without which it would have been
quite challenging to identify pollen collected from bees.
EEB provided me with support in the form of teaching assistantships, block
grants, and a botanical garden research grant. Matthaei Botanical Gardens provided
greenhouse access, bench space, supplies, and expert advice in my efforts to document
inbreeding depression in seeds produced through self-pollination. Rackham Graduate
School provided support in the form of a one-term fellowship.
Finally, I want to thank the land owners who gave me permission to work on their
property, including the Nature Conservancy, whose Nan Weston Preserve was both a
valuable study site and an inspiration to be in.

v
TABLE OF CONTENTS
DEDICATION……………………………………………………………………...iiACKNOWLEDGEMENTS………………………………………………………...iiiLIST OF TABLES………………………………………………………………….viABSTRACT……………………………………………………………………….. viii
CHAPTER
I. Introduction……………………………………………………………1
II. Self-incompatibility, ovule abortion, and resource availability
in mayapple (Podophyllum peltatum L.): do self-compatible
plants appear self-incompatible when resources are scarce? …. 7
III. Pollinator-mediated interactions between a nectarless species
(Podophyllum peltatum L.) and its co-flowering neighbors:
a test of the benefits of having attractive neighbors……………. 38
IV. Facilitation of pollination among pollinator-sharing plants:
overview and prescriptions for future study……………………. 103
V. Conclusions…………………………………………………………….141
Appendix…………………………………………………………….…………..…148
vi
LIST OF TABLES
TABLE
2.1 Proportions of fruits retained and mean widths of fruits in each
treatment in June, July, and when collected……………………………….. 33
2.2 Fit of linear regression models against fruit set per flower and estimated
seed set per fruit in July and collected (“final”) fruits per flower and
seeds per collected fruit……………………………………………………. 33
2.3 Differences in environmental traits, patch traits, and reproductive success
between the self-compatible patches in Site 5 and the self-incompatible
patches in the other four sites……………………………………………….34
3.1 Number of final models from backward and forward stepwise regressions that
included each variable (rows) to explain variation in pollen limitation
of fruit set and seed set in each year (columns)............................................. 91
3.A.1 Final models produced by backward and forward stepwise regressions
of PLfruit on measurements of patch, environmental, and neighborhood
floral characteristics………………………………………………………...97
3.A.2 Final models produced by backward and forward stepwise regressions
of PLseed on measurements of patch, environmental, and neighborhood
floral characteristics………………………………………………………...99
vii
3.A.3 Final models produced by backward and forward stepwise regressions of
PLfruit on measurements of patch, environmental, and neighborhood floral
characteristics, excluding site mean PLfruit.................................................... 101
3.A.4 Final models produced by backward and forward stepwise regressions
of PLseed on measurements of patch, environmental, and neighborhood
floral characteristics, excluding site mean PLseed........................................... 102
viii
ABSTRACT
POLLINATION AND POLLEN LIMITATION IN MAYAPPLE(PODOPHYLLUM PELTATUM L.),
A NECTARLESS SPRING EPHEMERAL
by
James E. Crants
Chair: Beverly J. Rathcke
Mayapple (Podophyllum peltatum L.) is a common clonal understory herb in
temperate eastern North America. Its fecundity is pollen-limited because its flowers
are nectarless, and native pollinators do not collect its pollen. I conducted field
studies in southeastern Michigan to determine mayapple’s compatibility system and
whether neighboring plants facilitated its pollination. I tested for facilitation by
correlating the degree of pollen limitation with the abundances of neighbors and
measuring whether the removal of neighboring flowers increased pollen limitation of
fecundity.
Mayapple populations in four sites were self-incompatible (SI), but all clones in one
site were self-compatible (SC). This difference could reflect genetic differences or
possibly differences in inbreeding depression due to resources. The site with SC had
the highest light availability and outcross fruit set, suggesting that abortion of inbred
ovules may be lower under high resources, resulting in expression of SC.
Visitation to mayapple flowers was consistently low (0.03-0.06 visits/flower/hour),
and fruit set was pollen-limited (pollen supplementation increased fruit set 3 – 18-
fold) in all three years of this study. Based on regressions of pollen limitation violets

ix
facilitated fruit set in 2005 and 2007 but reduced seed set in 2005. Garlic mustard
and spring beauty reduced fruit set in 2005. Except for violets in 2007, co-flowering
species did not affect pollen limitation in 2006 or 2007. Floral removal did not
change pollination success in 2006, confirming that neighbors neither facilitated nor
competed with mayapple for pollination in that year.
Neighboring plants could also reduce mayapple fecundity through interspecific pollen
transfer (IPT). The addition of Phlox divaricata pollen did depress fruit set, but
Geranium maculatum pollen did not. However, foreign pollen was rare on mayapple
stigmas suggesting that IPT is unlikely to be important in the field.
Mayapple could also facilitate or compete with neighboring plants for pollination.
However, correlations showed no effect of mayapple on the pollination success of
wild geranium, and hand-pollination with mayapple pollen did not significantly
depress fruit or seed set.
In a review of studies on pollination facilitation, I propose that future studies employ
similar methods and measure effect sizes for comparisons and meta-analyses.
1
Chapter I
Introduction
Mayapple (Podophyllum peltatum L.) is a common forest understory herb in
temperate deciduous forests of eastern North America. It has an unusual combination of
traits related to sexual reproduction. Most notably, it does not reward its native
pollinators. Laverty (1992) and Laverty and Plowright (1988) found that, while exotic
honeybees (Apis mellifera L., Apidae) gather its copious pollen, native bumblebee queen
(Bombus spp., Apidae) only probe for nectar, which it lacks. Consequently, it has a very
low pollinator visitation rate, and its fruit and seed production are severely pollen-limited
(Swanson and Sohmer 1976, Rust and Roth 1981, Laverty and Plowright 1988, Laverty
1992, Whisler and Snow 1992).
Because its native pollinators find it unrewarding, mayapple has been said to be
pollinated by “deceit” (Laverty 1992), but I find this term, at best, marginally useful. A
deceptive species is an animal-pollinated species that has evolved to provide no reward to
its pollinators. In cases where it is unclear whether the lack of reward has arisen through
natural selection for that trait, I believe that the term “unrewarding” is a better choice,
because it suggests only that pollinators do not find in the species’ flowers the rewards
for which they are foraging. (It also does not imply an intention on the part of the
unrewarding species; “deceit” is a morally laden term that seems inappropriate for the
life-history strategies of amoral organisms.) Honeybees collect pollen from mayapple
and thus find it rewarding, and it is not clear that native pollinators never collect
mayapple pollen, nor that pollen did not serve as a pollinator reward prior to the
introduction of honeybees to mayapple’s range. I will use the terms “unrewarding” and
“nectarless,” not “deceptive,” to describe mayapple’s flowers.
Outside of the Orchidaceae, there are few species for which all flowers produced
are unrewarding, probably because most species incur costs for failing to reward their
2
pollinators both in low visitation and in high prevalence of heterospecific pollen transfer
(see Renner 2006 for overview). Rewardlessness may be common in the Orchidaceae
because this family possesses adaptations for increased pollen transfer efficiency (Nilsson
1992, Harder and Johnson 2008). Pollinia (sticky packets of tens or hundreds of pollen
grains), in particular, can increase pollen transfer efficiency by reducing the loss of pollen
to grooming by the pollinator or deposition on surfaces other than the stigmas of
conspecific flowers (Harder and Johnson 2008). Many non-orchids may increase pollen
transfer efficiency through bilateral symmetry and placement of nectar at the bases of
spurs or tubes. This allows them to place and intercept pollen on particular parts of a
pollinator’s body, since the pollinator must orient itself with the flower in a particular
way to reach the nectar (e.g., Stiles 1975, Waser 1978, Campbell et al. 1996). However,
mayapple lacks all of these adaptations to low pollinator visitation, and therefore seems
poorly adapted to having unrewarding flowers.
Animal-pollinated plants that are unattractive to pollinators have little potential to
influence the local density of pollinators. Their visitation rate and pollination success
may thus depend on external influences on pollinator density. According to the “magnet
species hypothesis” (Thomson 1978), highly attractive flowers improve the visitation
rates of nearby, less attractive flowers by drawing pollinators to their vicinity. This effect
has been demonstrated to improve visitation and reproductive success for mayapple in
one study system (Laverty 1992), but it is not clear whether this effect is generally
relevant to mayapple’s pollination success. Furthermore, while the positive effects of
magnet species on the pollinator visitation rates of less attractive species have been
demonstrated more than once (Thomson 1978, Johnson et al. 2003, Juillet et al. 2007),
this benefit may be diminished or reversed if it results in a high frequency of interspecific
pollen transfer. Given mayapple’s lack of obvious adaptations to heterospecific pollen
receipt, it is possible that the effects of rewarding neighbors on its visitation rate are often
negated by any detrimental effects of their pollen on ovule fertilization in mayapple.
In addition to its low visitation rate, a further hindrance to successful pollination
for mayapple is that it is both extensively clonal and (usually) self-incompatible
(Swanson and Sohmer 1976, Rust and Roth 1981, Policansky 1983, Laverty and
Plowright 1988, Whisler and Snow 1992). This ensures that much of the conspecific

3
pollen its stigmas receive is genetically incompatible. Thus, mayapple receives very few
pollinator visits, and the visits it does receive carry a high risk of improper pollen transfer
(sensu Rathcke 1983), in the form of both heterospecific pollen transfer and self-
pollination.
The mechanism of self-incompatibility in mayapple is unknown, though moist
stigmas and the ability of self pollen to germinate on the stigma indicate that the genetic
mechanism is gametophytic (Whisler and Snow 1992). Studies on mayapple’s breeding
system have demonstrated self-incompatibility based on the inability of a plant to
produce seeds when self-pollinated (Swanson and Sohmer 1976, Policansky 1983,
Motten 1986, Laverty and Plowright 1988, Whisler and Snow 1992), but a plant may fail
to produce seeds from self-pollination either because it is genetically self-incompatible or
because ovules fertilized by self pollen die before maturing into seeds due to inbreeding
depression.
Plants often produce more ovules than they can mature into seeds. One
mechanism proposed to explain this phenomenon is the “selective ovule abortion”
hypothesis, which says that plants preferentially abort the least fit embryos when more
ovules are fertilized than can be matured (Janzen 1971, Korbecka et al. 2002). The
ability of an ovule with low vigor to reach may depend on a combination of the resources
available to the maternal parent, the presence and abundance of ovules with greater vigor
being supported by the same maternal plant, and active abscission by the maternal plant
of fruits and ovules that are developing slowly. Thus, self-fertilized ovules, which may
have severe inbreeding depression, would be more likely to develop into mature seeds if
the maternal plant has more resources and if few or no outcross-fertilized ovules are
competing with them for resources. If this is the case, then self-compatible plants with
very limited resources could appear to be self-incompatible, since self-fertilized ovules
borne by such plants would be less likely to be able to obtain the resources to develop
into seeds. In contrast, the same plant might be demonstrably self-compatible if
resources were abundant; in the absence of competing outcrossed ovules, a self-pollinated
ovule may be vigorous enough to obtain resources if they were readily available within
the mother plant.

4
In the chapters that follow, I consider the traits that make sexual reproduction in
mayapple puzzling. I first investigate whether mayapples in my study system are self-
compatible and whether the expression of self-compatibility depends on resource
availability, as expected if resource limitation results in an increased stringency of
selective ovule abortion. I then test whether the magnet species hypothesis improves
mayapple’s reproductive success, whether any benefit from the magnet species effect is
potentially counter-balanced by the elevated rate of interspecific pollen transfer that this
mechanism entails, and whether mayapple, in turn, affects the pollination success of one
potential magnet species. Finally, I review the current hypotheses for facilitation of
pollination in the literature.
5
Literature cited
Campbell, D. R., N. M. Waser, and M. V. Price. 1996. Mechanisms of hummingbird-mediated selection for flower width in Ipomopsis aggregata. Ecology 77:1463-1472.
Harder, L. D. and S. D. Johnson. 2008. Function and evolution of aggregated pollen in angiosperms. International Journal of Plant Sciences 169:59-78.
Janzen, D. H. 1971. Herbivores and the number of tree species in tropical forests. The American Naturalist 104:501-528.
Johnson, S. D., C. I. Peter, A. Nilsson, and J. Ågren. 2003. Pollination success in a deceptive orchid is enhanced by co-occurring rewarding magnet plants. Ecology 84:2919-2927.
Juillet, N., M. A. Gonzalez, P. A. Page, and L. D. B. Gigord. 2007. Pollination of the European food-deceptive Traunsteinera globosa (Orchidaceae): the importance of nectar-producing neighbouring plants. Plant Systematics and Evolution 265:123-129.
Korbecka, G., P. G. L. Klinkhamer, and K. Vrieling. 2002. Selective embryo abortion hypothesis revisited - a molecular approach. Plant Biology 4:298-310.
Laverty, T. M. 1992. Plant interactions for pollinator visits: a test of the magnet species effect. Oecologia 89:502-508.
Laverty, T. M. and R. C. Plowright. 1988. Fruit and seed set in mayapple (Podophyllum peltatum): influence of intraspecific factors and local enhancement near Pedicularis canadensis. Canadian Journal of Botany 66:173-178.
Motten, A. F. 1986. Pollination ecology of the spring wildflower community of a temperate deciduous forest. Ecological Monographs 56:21-42.
Nilsson, A. 1992. Orchid pollination biology. Trends in Ecology & Evolution 7:255-259.Policansky, D. 1983. Patches, clones and self-fertility of mayapples (Podophyllum
peltatum L.). Rhodora 85:253-256.Rathcke, B. 1983. Competition and facilitation among plants for pollination. Pages 305-
329 in L. Real, editor. Pollination Biology. Academic Press, Inc., Orlando, FL.Renner, S. S. 2006. Rewardless flowers in the angiosperms and the role of insect
cognition in their evolution. Pages 123-144 in N. M. Waser and J. Ollerton, editors. Plant-Pollinator Interactions: From Specialization to Generalization. University of Chicago Press, Chicago.
Rust, R. W. and R. R. Roth. 1981. Seed production and seedling establishment in the mayapple, Podophyllum peltatum L. American Midland Naturalist 105:51-60.
Stiles, F. G. 1975. Ecology, flowering phenology, and hummingbird pollination of some Costa Rican Heliconia species. Ecology 56:285-301.
Swanson, S. D. and S. H. Sohmer. 1976. The biology of Podophyllum peltatum L. (Berberidaceae), the may apple. II. The transfer of pollen and success of sexual reproduction. Bulletin of the Torrey Botanical Club 103:223-226.
Thomson, J. D. 1978. Effects of stand composition on insect visitation in two-species mixtures of Hieracium. American Midland Naturalist 100:431-440.
Waser, N. M. 1978. Competition for hummingbird pollination and sequential flowering in two Colorado wildflowers. Ecology 59:934-944.
6
Whisler, S. L. and A. A. Snow. 1992. Potential for the loss of self-incompatibility in pollen-limited populations of mayapple (Podophyllum peltatum). American Journal of Botany 79:1273-1278.
7
Chapter II
Self-incompatibility, ovule abortion, and resource availability in mayapple (Podophyllum peltatum L.): do self-compatible plants
appear self-incompatible when resources are scarce?
Introduction
The predominance of self-incompatibility in mayapple (Podophyllum peltatum L.)
presents a conundrum. The fruit and seed set of mayapple are strongly pollen-limited
throughout much of its range, apparently because it lacks nectar, for which its native
pollinators forage (Krochmal et al. 1974, Rust and Roth 1981, Laverty and Plowright
1988, Laverty 1992, Whisler and Snow 1992). This should selectively favor self-
compatibility, yet mayapple is predominantly or consistently self-incompatible in most of
the populations that have been examined to date (Policansky 1983, Motten 1986, Laverty
and Plowright 1988, Whisler and Snow 1992). In addition, mate limitation may also be
severe for mayapple, since it is extensively clonal, and many cases of pollen transfer may
therefore be geitonogamous. Like pollen limitation, mate limitation favors self-
compatibility, since the ovules of a self-compatible plant may be fertilized by pollen
grains with which the plant shares S-alleles, which is not true of self-incompatible plants
(Busch and Schoen 2008).
More recently, habitat destruction and fragmentation may have genetically
isolated mayapple populations while reducing their size, imposing stronger selection for
self-compatibility through the limited availability of genetically compatible mates. While
this has not been demonstrated for mayapple, reduced fecundity through mate limitation
has been demonstrated for other species in fragmented habitats (Wagenius et al. 2007,
Busch and Schoen 2008). Even if S-allele diversity is high, self-incompatible mayapples
may experience strong mate limitation because extensive clonal growth ensures that most
of the neighbors of any given flower are genetically incompatible mates (Honnay and
Jacquemyn 2008). If current mayapple populations frequently experience mate limitation
8
as well as pollinator limitation, self-compatible individuals may have higher fitness than
self-incompatible ones, and this difference may be particularly pronounced in small,
isolated populations.
The mechanism of self-incompatibility in mayapple is unknown (Whisler and
Snow 1992). Self pollen produces pollen tubes, and the stigma is moist, indicating that a
gametophytic self-incompatibility mechanism is at work (Whisler and Snow 1992).
However, a careful investigation of the self-incompatibility mechanism has not been
conducted. Rather, self-incompatibility has been verified by determining whether
outcross-pollinated and self-pollinated flowers in the same clone produce seeds. If
outcrossed flowers produce seeds and selfed ones do not, the clone is taken to be self-
incompatible. Mayapple is presumed self-incompatible because it consistently produces
more fruits and seeds when hand-outcrossed than when hand-selfed, and it usually fails to
set seed when selfed (Swanson and Sohmer 1976, Policansky 1983, Motten 1986,
Laverty and Plowright 1988, Whisler and Snow 1992).
While these results almost certainly indicate that a genetic self-incompatibility
mechanism is at work, testing for self-compatibility based on seed set cannot distinguish
true genetic self-incompatibility from severe inbreeding depression expressed as ovule
abortion. Clones that produce seeds from self-pollination exhibit clear signs of reduced
seed set due to inbreeding depression. Whisler and Snow (1992) found that seed set per
fruit for self-pollinated flowers was 10% as high as outcross seed set in three highly self-
compatible patches, and fruit set per flower from selfing was slightly over half as high as
fruit set from outcrossing. Given that overall seed set per flower for demonstrably self-
compatible clones was about 6% as great for selfed flowers as for outcrossed ones, it is
possible that other clones had self-compatibility coupled with inbreeding depression so
severe that no self-fertilized ovules matured into seeds. Indeed, low seed set per fruit
when self-pollinated is a recognized indication of “pseudo self-compatibility,” of which
inbreeding-induced ovule abortion is one form (Busch and Schoen 2008).
Inbreeding depression may manifest itself during seed development, particularly
in plants with multi-seeded fruits (Helenurm and Schaal 1996, Keller and Waller 2002).
If developing seeds compete with each other for maternal resources, those that contain
embryos (and endosperms) with low genetic fitness may be at a disadvantage and
9
therefore more likely to die early in development, and fruits with few viable embryos
may be likely to be aborted for similar reasons (Helenurm and Schaal 1996). Even if
embryos do not compete for maternal resources, inbred embryos are more likely than
embryos produced by outcrossing to be unviable, resulting in low seed set for self-
pollinated flowers, even if the parent plant is self-compatible.
Strong inbreeding depression may be mistaken for genetic self-incompatibility.
Both inbreeding depression and self-incompatibility result in reduced fruit and seed set
for self-pollinated flowers relative to outcrossed flowers (Wiens 1984, Helenurm and
Schaal 1996, Sage et al. 2001, Vaughton and Ramsey 2003). If inbreeding depression is
a significant cause of low reproductive success in self-pollinated flowers, and if the
probability that an ovule is aborted depends on both the severity of its inbreeding
depression and the resources available to it through the maternal plant (Helenurm and
Schaal 1996, Ågren et al. 2008), a maternal plant with more resources to mature ovules
into seeds would appear to be more self-compatible than a plant with fewer resources.
In this study, I address the hypothesis that apparent self-compatibility, measured
by seed set for self-pollinated flowers, can vary in response to the resources available to
the maternal plant because the probability that an inbred ovule is aborted before it
develops into a mature seed depends on its access to resources. I contrast the predictions
of this hypothesis with those of the hypothesis that the ability to produce seeds from self-
pollination is entirely dependent on the presence or absence of self-compatibility.
Two resources appear to limit mayapple reproduction in my system: as an
understory herb, mayapple’s growth and reproduction is likely to be limited by light, and
based on high ramet senescence during summer dry spells, reproduction may be limited
by soil moisture. The effect of these resources on fecundity was determined by
regressing fruit and seed set for bagged, outcross-pollinated flowers on measures of light,
soil moisture, and soil texture. If the maturation of inbred seeds and fruits depends on
resource availability, three predictions follow: (1) the fruit and seed production of self-
pollinated flowers should co-vary with the limiting resource. (2) Because the fecundity
of outcross-pollinated flowers should be limited by the same resource, fruit and seed
production for selfed flowers should be positively related to fruit and seed set for
outcrossed flowers in the same environment. (3) Similarly, because the vegetative
10
growth of the maternal plant should be limited by the same resource as fecundity, plants
that produce more seeds from self-pollination should be taller than those that do not.
Distance to the nearest forest edge varied among the study patches because they
were initially selected to test for an edge effect on pollen limitation. Proximity to the
forest edge may affect fecundity and plant height both through edge effects on light and
moisture and through edge effects for which I did not test, such as drift of fertilizers,
herbicides, and pesticides from neighboring crops, decreased relative humidity, or
increased wind speed near edges. Therefore, I also compared fecundity of selfed and
outcrossed flowers between plants within 30 meters of the forest edge and those over 100
meters from the edge.
Materials and Methods
Study organism:
Mayapple is a common understory herb of deciduous forests in the eastern United
States and Canada. It is extensively clonal, spreading by branching rhizomes. Ramets
that are physiologically connected by their rhizomes are well-integrated, but most ramets
are not physiologically connected to other ramets (Landa et al. 1992).
Vegetative ramets and flowering ramets of mayapple are morphologically distinct.
The above-ground portion of a vegetative ramet is a single peltate leaf with two to eight
deep lobes, and the above-ground portion of a flowering ramet is a stem with two
opposite leaves. A single flower typically emerges in mid to late May, from the fork
where the leaves meet the stem.
The flower is large (3-6 cm in diameter), white, fragrant, bowl-shaped, and
nodding, with 6 to 10 petals, 12 to 24 stamens, and a single, unilocular pistil with 15-100
ovules (pers. obs.). The flower lacks nectar but has abundant pollen (Laverty and
Plowright 1988, and pers. obs., Laverty 1992). The flowers are protandrous; the anthers
often dehisce before the flower has opened, but the stigmas are generally not receptive
until one to two days later (Swanson and Sohmer 1976). Stigmas remain receptive even
as the stamens and petals begin to fall from the flower, approximately one to two weeks
after anthesis (pers. obs.).
11
Study sites:
Five study sites, identified here as sites 1-5, were selected on four fragments of
second-growth deciduous forest in Washtenaw County, Michigan, between 42°13.65’ N
and 42°15.00’ N and between 83°54.15’ W and 83°56.45’ W. Each fragment was
between 9 and 40 ha in area and had an extensive and evident history of logging; stumps
and logging trails were common in each fragment. Site 3 was selectively logged in April
2005 (the first month of this study), and Sites 2 and 4 were selectively logged in April
2007. Sites 3 and 4 and a portion of Site 2 had forest canopies composed largely of oaks
(Quercus rubra L. and Q. velutina Lam., Fagaceae), hickories (Carya ovata [Mill.]
K.Koch, C. cordiformis [Wangenh.] K.Koch, and C. glabra [Mill.] Sweet., Fagaceae),
and black cherries (Prunus serotina Ehrh., Rosaceae). These species were also present in
Sites 1 and 5, but the canopy of Site 1 was dominated by basswood (Tilia americana L.,
Tilliaceae), and Site 5 had emergent oaks, hickories, cherries, and basswoods over a
dense, low canopy of sugar maples (Acer saccharum Marshall., Aceraceae). In addition,
a portion of Site 2 had a canopy of red maples (A. rubrum L.).
I selected ten to thirteen mayapple patches for study in each site (60 patches in
total), with half of the patches within 30 meters of the forest edge and half over 100
meters from the edge. In each of these groups, half of the patches had wild geraniums
(Geranium maculatum L., Geraniaceae) within 5 meters and half did not. These selection
criteria were used because a parallel study evaluated the effects of wild geraniums and
forest edges on pollen limitation in mayapple. Three patches per site were selected for
the mating system experiments, with one patch selected randomly from among the forest
edge patches, one from the interior patches, and one from the full set of study patches.
Mating system experiments
In 2005, in each of the three patches selected for the mating system study, I
marked twelve forked (i.e., reproductive) ramets with apparently healthy buds for four
treatments. Two ramets were marked to have their flower buds bagged with no other

12
treatments (hereafter, the “autogamy group”), to determine whether mayapples in my
sites were capable of self-pollination without pollinator visitation. Two were marked to
be bagged and emasculated to test for agamospermy (the “agamospermy group”). Four
were marked to be bagged, emasculated, and self-pollinated by hand (the “selfed group”),
and four to be bagged, emasculated, and outcross-pollinated by hand (the “outcrossed
group”), to measure the degree of self-compatibility for mayapples in my sites. A bag of
fine nylon tulle was tied over the bud of each of these ramets.
Emasculation and pollination treatments were applied on one of two visits to each
patch between 17 and 29 May 2005, the first and last days when open flowers with
receptive stigmas were commonly observed in the study patches. When open flowers
were found in bags, the bags were opened to remove the bud scales, regardless of
treatment group. I emasculated flowers by plucking the stamens from the flower with a
pair of tweezers. The stamens were large and turgid and could typically be removed
cleanly at the base. Self pollinations were performed by applying three of the flower’s
own anthers to the stigma. Two flowers receiving this treatment lacked healthy anthers,
and these were pollinated with anthers from adjacent ramets. I performed outcross
pollinations by applying three anthers from three other patches within the fragment to the
stigma of the treated flower. The pollen source patches were at least 50 meters away
from the patch to which the treatment was applied. Pollen could be seen as yellow
streaks on the stigma, with individual grains visible through a hand lens, so successful
pollination could be confirmed.
One patch marked for mating system treatments did not produce viable flowers
inside any of the bags and could not be treated or used for analysis. Another produced
only eight viable flowers, and only the self- and outcross-pollination treatments were
applied in this patch. Several patches were missing single flowers from one or more
treatment groups. In cases where flowers were missing from treatment groups or where
treatment groups had to be dropped, flowers had undeveloped pistils or failed to open, or
ramets were destroyed during the flowering season, after all unbagged flowers had
opened.
After the flowering season, the pistils of all unbagged flowers within the patches
used for this experiment were removed to reduce the likelihood of resources from self-

13
pollinated flowers in bags being diverted to open-pollinated flowers that received
outcross pollen. Thus, the probability that a self-compatible clone would produce fruits
from self-pollination instead of selectively aborting them was increased, thereby
increasing the probability that self-compatibility would be detected where it occurred.
Environmental measurements
To determine whether environmental factors limited the reproductive success of
the flowers in any of my four treatment groups, I made environmental measurements in
each patch and performed regressions of fruit and seed set on these measurements or on
principal component axes derived from them (see “Data Analysis” below).
In September 2005, I measured canopy openness above each patch at
approximately one meter above the ground using a spherical densiometer. I also
collected a 30-cm soil core from the center of each patch for analyses of soil moisture,
texture, and organic content. Soil moisture was determined within a day after collection
using the gravimetric method. Soil texture was determined in June to August 2007 by the
Bouyoucos hydrometer procedure (Bouyoucos 1936), and soil carbon was measured by
the Walkley–Black wet combustion method (Walkley and Black 1934).
I revisited the patches in 2006, when all patches that flowered were incorporated
into a study on pollination limitation. Mean ramet height, mean anther number per
flower, and mean flower diameter were determined for a subset of the patches. In August,
the leaf-area index was determined for each patch at 80 cm above the ground using an
LAI-2000 Plant Canopy Analyzer (LI-COR Biosciences).
In 2007, the pollination limitation study was continued, and mean ramet height,
mean anther number per flower, and mean flower diameter were determined for most of
the patches that flowered. Data on anther number and floral diameter were missing for
two and one patches, respectively, in Site 3. Site 5 could not be revisited in 2007. Leaf-
area index was measured for a subset of the patches in July, and percent canopy cover
was determined for all patches in sites 1-4. Measurements of flower diameter, anther
number, leaf-area index, and canopy openness were found to correlate strongly and
positively among years (e.g., large-flowered patches in 2005 also had large flowers in

14
2007). Thus, the measurements of leaf-area index and ramet height from 2006 and the
measurements of anther number and flower diameter from 2007 were considered relevant
to the 2005 study and were used in the data analysis.
Fruit and seed set
The presence, length (peduncle to stigma), and width (across the placentated wall)
of each fruit in the study patches were determined on 6-15 June, 8-21 July, and 2-15
August 2005. Fruits were collected when ripe or abscised in July, and all remaining
fruits that could be found were collected in August. Collected fruits were measured in
three linear dimensions (length, width, and depth from the placentated wall to the
opposite wall), weighed, and dissected for seed counts.
Several fruits disappeared between the July and August surveys. Fruits were at or
near their maximum sizes in July, and some were ripe toward the end of the July survey.
Few of the fruits that disappeared between the July and August surveys could have been
aborted due to unsuccessful pollination, and the missing fruits should thus be included in
measurements of fruit and seed set.
To account for mature fruits that disappeared between July and August, I
estimated the number of seeds present in each uncollected fruit using curve estimation
regression of seed counts as a function of the July length and width of all 172 fruits
collected in 2005, including 22 fruits collected for this study, 102 fruits collected for a
concurrent pollen limitation study (Chapter 3), and 48 fruits found in non-study patches.
Fruit width proved to be a better indicator of final seed set than fruit length or the product
of length and width, best fitting final seed set through the following equation:
S = 0.0007 w 2.9632 – 1, (Eq. 1)
where S is the number of seeds in the fruit and w is the width of the fruit. Equation 1 fit
the data for the 172 collected fruits well (p < 0.001, R2 = 0.640, df = 171). This equation
was used to estimate seed number in the fruits that were not collected but were present in
the July fruit survey, while actual seed numbers were used for all the collected fruits. For
15
the purposes of the data analyses described below, “fruit set” and “seed set” refer to fruit
set per flower and best-estimate seed set per fruit in July. Analyses were also performed
on fruit and seed set based only on collected fruits, but these will only be reported if they
are different from the results based on fruit and seed set in July.
Statistical analyses
All statistical analyses were performed using the statistical program SPSS for
Windows 11.0, Graduate Pack, ©2001, SPSS Inc.
Effect of pollination treatment
The unit of replication was the individual mayapple patch. The dependent
variables were fruit set per flower and seed set per fruit. The data for these variables
were non-normally distributed, due to very low fruit set in all treatment groups except for
the outcross pollination group. Data transformation could not rectify the non-normal
distributions of fruit and seed set data for the bagged, bagged and emasculated, or
bagged, emasculated, and selfed treatment groups. Therefore, I used non-parametric tests
to determine the effect of treatment on reproductive success. Measurements of
reproductive success were compared among the four treatments using Kruskal-Wallis
tests, and pairwise between treatments using Mann-Whitney U tests. These comparisons
were made for fruit presence and fruit width in June and fruit set and estimated seeds per
fruit and per flower in July (table 2.1).
Effect of environmental, patch and floral characteristics
To determine which resources limited the fecundity of outcrossed flowers, I tested
for the effects of environmental factors on outcross fruit set per flower and seed set per
fruit. Based on Pearson correlations performed on the 15 patches included in this study
and 58 patches used in a concurrent pollen-limitation study, several of these measured
environmental variables were strongly correlated with others. Because of these
16
correlations and the large number of environmental variables relative to the sample size,
multiple regressions could not be performed using the raw measurements. The small
sample size and large number of variables also made data reduction by factor analysis of
the full set of independent variables an unviable option, as principal components analyses
performed with sample sizes below 100 have a high risk of producing unrepresentative
axes, particularly when many independent variables are involved (Allison 1999).
To reduce the number of variables and increase their independence while
minimizing the probability of generating unrepresentative principal components, I
performed principal components analyses on the most strongly correlated groups of
biologically-related variables to generate composite variables for multiple regression. In
each case, patches from the pollination limitation study, including those added to the
study in 2006, were included to increase the probability that the axes generated were
representative for mayapple patches in the region as a whole. All soil variables (soil
moisture, soil carbon content, and soil clay, silt, and sand content) were combined to
produce a “soil moisture” component (strongly correlated with moisture, carbon and clay)
and a sand-silt component. These two components explained 84.5% of the variation in
soil characteristics. Because soil texture could not be measured for two patches that
occurred on peaty soils, soil moisture and carbon content were used to generate a
principal component for a separate regression model. This component explained 95.4%
of the variation in these two variables. Densiometer readings from 2005 and leaf-area
index readings from 2006 were combined to produce a “light” component, which
explained 68.4% of the variation in these components.
For outcrossed flowers, data for both fruit set per flower and seed set per fruit had
distributions that did not differ significantly from normality, based on Kolmogorov-
Smirnov tests (P ≥ 0.445 for both fruit and seed set), and data transformation did not
greatly improve their fit to a normal distribution. Therefore, linear regressions on
principal components were performed using untransformed fruit and seed set data. Fruit
set per flower and seed set per fruit were each analyzed with two regression models: (1)
a model including soil moisture (including clay content), soil silt/sand, light, and
proximity to the forest edge, and (2) a model including only soil moisture (not including
clay content), light, and proximity to the forest edge.
17
In addition, the same measures of reproductive success were analyzed in a
multiple regression model including mean ramet heights and numbers of vegetative and
reproductive ramets in patches, to determine whether larger patches or taller ramets were
indicative of greater resources for fruit and seed maturation. Finally, reproductive
success variables were regressed on patch mean flower diameter and patch mean anther
number per flower separately, to see whether greater investment in these floral organs
comes at a cost to maximum potential female fitness.
For each multiple regression, a backward stepwise regression was performed to
determine which, if any, of the environmental or patch variables most strongly
determined reproductive success of outcrossed flowers.
If patches with greater resources for fruit and seed maturation are more likely to
produce mature seeds and fruits from self-fertilization, then (1) outcross fruit and seed set
should be higher in self-compatible patches, and (2) self-compatible patches should have
vegetative and environmental characteristics that are associated with high outcross fruit
and seed set. To test these predictions, outcross reproductive success, environmental
characteristics, and patch characteristics were compared between self-compatible patches
and self-incompatible patches. None of the variables compared was significantly non-
normally distributed, either for all patches pooled or for the self-compatible and self-
incompatible groups separately, based on one-sample Kolmogorov-Smirnov tests.
Therefore, independent-samples t-tests were used for these analyses. However, soil
moisture/carbon had a marginally non-normal distribution (P = 0.064; all other variables
P > 0.3). A Mann-Whitney U test was performed with this variable to determine whether
the t-test’s assumption of normality affected the statistical significance of the results.
Results
Pollination experiments: self-compatibility, autogamy, and apomixis
Most flowers in all four treatments initiated fruit development. Of 151 flowers
included in the experiment, 143 (94.7%) had not abscised their ovaries by the time of the
early-season June survey of fruit sizes (6 to 15 June). Although the outcross treatment

18
was the only treatment that initiated fruit on all flowers, the difference in fruit initiation
among treatments was not significant overall, and fruit initiation did not differ
significantly between any two groups (table 2.1). Fruit width did vary significantly with
treatment overall, and outcross fruits were significantly wider than those in any of the
other three groups (table 2.1), indicating that outcross fruits had higher ovule fertilization
success and were maturing more ovules.
Most ovaries had abscised (i.e., were aborted) by the time of the mid-season July
survey (8 to 21 July). By this time, only 21.0% of the flowers bore fruits. Fruit set per
flower differed significantly with treatment, with fruit set for the outcross group being
significantly greater than that for any other group (table 2.1). Similarly, the best estimate
of seeds per fruit in July was significantly greater for outcrossed flowers than for selfed
ones (table 2.1).
Plants produced fruits from flowers in the autogamous treatment group in only
two patches (patches 9 and 11 in Site 3), with each of these patches producing one fruit
from two flowers in this group. Using the allometric equation described above (Eq. 1),
these fruits were estimated to be seedless, and they had abscised by the time of the
August survey.
Plants bore fruits on bagged, emasculated, unpollinated flowers in just one patch
(patch 10 in Site 3) in July. This patch had two fruits from two flowers in this treatment
group. Both had abscised and disappeared by August, and each was estimated to have
had a single seed based on its width.
Plants in three patches (patches 9, 10, and 11, all in Site 3) bore fruits on bagged,
emasculated, self-pollinated flowers in July. Patch 9 bore two fruits from four selfed
flowers in July, one of which was collected. The collected fruit was seedless, and the
other fruit was estimated to be seedless based on its small size. Patch 10 bore one fruit
from three selfed flowers in July. This fruit was collected and found to contain ten seeds.
Patch 11 bore three fruits from four flowers in July. Two were collected and found to
have one and three seeds. The remaining fruit was estimated to have contained twelve
seeds.

19
Do current resources limit reproductive success of outcrossed flowers?
The regression model that included soil texture characteristics explained a
marginally significant amount of variation in fruit set per hand-outcrossed flower, and the
model that excluded them explained a significant amount of variation (table 2.2). In both
of the regression analyses, the light component was the only variable included in the final
model of the backward stepwise regression; fruit set increased significantly with light
whether the two patches that occurred on peaty soils were included (P = 0.007, adjusted
R2 = 0.423, total df = 13) or not (P = 0.022, adjusted R2 = 0.367, total df = 11). Although
no other variables were included in the final model of the backward stepwise regression
when all fruits present in the July survey were considered, proximity to the forest edge
was retained in the final model considering only collected fruits per flower, when the
patches on peaty soil were included. Proximity to the edge, by itself, explained a
marginally significant amount of variation in fruit set based only on collected fruits (P =
0.089, adjusted R2 = 0.157, total df = 13), with fruit set being higher near edges, but the
difference was not significant for fruit set based on all fruits present in July (P = 0.276,
adjusted R2 = 0.023, total df = 13).
Both regression models of environmental variables failed to explain a significant
amount of the variation in seed set per outcrossed fruit (table 2.2). Backward stepwise
regressions did not produce a significant model. The final variable removed from the
model that included soil texture was soil silt/sand; seed set per fruit tended to increase
with soil silt content (P = 0.117, adjusted R2 = 0.189, total df = 9). The last variable left
in the backward regressions from the model that excluded soil texture was proximity to
the forest edge, which was not significantly related to seed set (P = 0.595, adjusted R2 = -
0.075, total df = 10).
Is outcross reproduction related to patch traits or allocation to floral traits?
Mean ramet height and the numbers of reproductive and vegetative ramets
explained a marginally significant amount of variation in July fruit set (table 2.2). Mean
ramet height and the number of reproductive ramets in the patch were left in the final
20
model of the backward stepwise regression, which was a statistically significant model (P
= 0.020, adjusted R2 = 0.422, total df = 13). In this model, the number of reproductive
ramets was significantly related to fruit set (P = 0.036, beta = -0.507), while mean ramet
height was marginally significantly related to fruit set (P = 0.054, beta = 0.457). Fruit set
decreased significantly with increasing number of reproductive ramets in a univariate
regression (P = 0.041, adjusted R2 = 0.246, total df = 13) and increased marginally
significantly with mean ramet height (P = 0.065, adjusted R2 = 0.194, total df = 13).
However, the negative relationship between outcross fruit set and the number of
reproductive ramets in the patch was due largely to two patches with many reproductive
ramets that set no outcross fruit.
Seed set per fruit was not significantly explained by mean ramet height and the
numbers of reproductive and vegetative ramets (table 2.2). No variables were retained in
the backward stepwise regression, and the last variable removed, mean ramet height, was
far from statistically significant (P = 0.725, adjusted R2 = -0.095, total df = 10). The full
model also failed to explain significant variation in the number of seeds found in
collected outcrossed fruits alone, but backward stepwise regression found that seed set
increased marginally significantly with mean ramet height for collected fruits (P = 0.091,
adjusted R2 = 0.262, total df = 8).
Mean floral diameter and mean number of anthers per flower both failed to
significantly explain both fruit set and seed set (table 2.2). Considering only collected
fruits, seed set per fruit increased significantly with mean floral diameter (P = 0.024,
adjusted R2 = 0.607, total df = 6).
How do self-compatible patches differ from other patches?
Three patches, all in Site 3, bore fruits from self-pollinated flowers. However,
only two of these patches produced seeds. The third patch bore two fruits from four self-
pollinated flowers, one of which was collected and found to be empty, and the other
presumed seedless based on its small size.
Because all self-compatible patches were in one site, it is not possible to
determine whether patches in Site 3 were found to be self-compatible because this
21
population has a high frequency of alleles for weakened self-incompatibility or because
environmental conditions in the site were more favorable for fruit production than
conditions in other sites. Environmental conditions varied more among sites than within
sites, so Site 3 had both a different population and a different environment from the other
sites.
Within Site 3, the patch that bore seedless fruits differed noticeably from the other
two in two ways. The seedless patch had the most vegetative ramets of the three (116
versus 24 and 83), and it grew on the siltiest soil (41% versus 35% and 27% silt). Neither
of these differences explained much variation in outcross fruit or seed set, and it therefore
seems unlikely that they explain differences in measured self-compatibility.
Because all self-compatible patches were aggregated in one site, I compared the
reproductive success of outcrossed flowers, as well as the environmental, vegetative, and
floral traits of patches between Site 3 and the other four sites.
Patches in Site 3 tended to have more outcross fruits per flower, seeds per fruit,
and seeds per flower than those that lacked fruits on selfed ramets (table 2.3), consistent
with the hypothesis that mayapple’s ability to mature inbred seeds is resource-limited.
The difference was significant for seeds per flower (table 2.3). In addition, marginally
significantly more fruits were collected per outcrossed flower in Site 3 than in the other
sites (independent samples t-test: P = 0.086, t = -1.869, total df = 12).
The patches in Site 3 also scored significantly higher on the light axis than the
other sites as a group (independent samples t-test: P = 0.033, t = -1.2966, total df = 13)
and had significantly taller ramets (t-test: P < 0.001, t = -5.202, total df = 12.970). Site 3
was significantly brighter than sites 1, 2, and 5 in pairwise comparisons (Mann-Whitney
U tests: P < 0.005), and marginally brighter than site 4 (Mann-Whitney U Test: P =
0.078). Ramets in Site 3 were significantly taller than ramets in each of the other four
sites, pairwise (Mann-Whitney U tests: P < 0.02). Both light and ramet height were
significantly related to July and final fruit set per flower (see above).

22
Discussion
A plant that produces seeds from outcross-pollinated flowers but not from self-
pollinated flowers is assumed to be self-incompatible. However, while a flower may fail
to produce seeds when self-pollinated because a self-incompatibility mechanism prevents
self pollen from fertilizing the ovules, it may also fail because self-fertilized ovules do
not reach maturity due to inbreeding depression. If this is the case, the ability of inbred
ovules to develop into mature seeds may depend on the resources available to the
maternal plant. This would be true if developing ovules must compete for resources with
other structures of the maternal plant (e.g., rhizomes, roots, and other fruits). Ovules
containing inbred embryos may not be able to obtain enough resources to develop unless
the maternal plant has abundant resources.
The presence or absence of a genetic self-incompatibility system could not be
determined in this study. However, it is possible to address the hypothesis that self-
fertilized ovules are more likely to obtain the resources to mature into seeds when the
maternal plant has abundant resources, and the evidence from this study is consistent with
the predictions of this hypothesis. Plants that demonstrated self-compatibility had higher
fruit and seed set when outcrossed, as well as taller ramets, than those that did not,
indicating that they had more resources available for both growth and reproduction. They
occurred in the site with the highest light availability, which points to light as the
resource that limits the ability of a mayapple plant to mature self-fertilized seeds, and
they occurred on sandy soils with low organic content and low soil moisture, suggesting
that water availability does not restrict seed set from self-pollination.
The importance of light, rather than water, as a limiting resource is further
supported by the higher fruit set of outcrossed flowers in well-lit patches and patches near
the forest edge. Edge patches receive light from the nearby open habitat, which may not
be accounted for in measurements of leaf-area index and openness of the canopy above
the patch. Edge patches and better-lit patches also have lower soil moisture. Because the
outcrossed flowers were heavily hand-pollinated with a mixture of pollen from three
other genets, the probability that they produced fruit was presumably limited by resources
other than pollen, and the positive relationship between outcross fruit set and both
23
measured light availability (canopy openness and leaf-area index) and proximity to the
forest edge suggests that light limits fruit set when pollen does not.
This is not the only study to find that self-fertile mayapple patches have higher
fruit set from outcrossed flowers than patches that do not produce fruits when self-
pollinated. I found that just 47.7% (+/- 11.1% SE) of outcrossed flowers bore fruits in
July for self-incompatible patches, versus 83.3% (+/- 8.3% SE) outcross fruit set for self-
compatible patches. Similarly, Whisler and Snow (1992) classified patches into three
self-compatibility groups based on percent fruit set from self-pollination (0%, 1-50%, 51-
100%) and found that more self-compatible categories had higher fruit set from
outcrossed flowers (81%, 88%, and 94% for the three groups, respectively). The authors
do not comment on this relationship, and since the range in mean outcross fruit set among
self-compatibility classes was small, it is likely that the relationship was not statistically
significant. Nevertheless, it may be noteworthy that patches that had higher fruit set from
self pollination also had higher fruit set from outcross pollination in both studies. This
suggests that patches that produce fruits from self-pollinated flowers have more resources
for fruit maturation than those that do not, consistent with the hypothesis that apparent
self-incompatibility in mayapple is often a result of inbreeding depression coupled with
resource limitation. In contrast, if apparent self-incompatibility were perfectly equivalent
with the presence of a functioning self-incompatibility mechanism, hand-pollination with
a mixture of pollen from three or more mates (as used in my study and that of Whisler
and Snow 1992) should not be substantially more likely to provide compatible pollen to
self-compatible flowers than to self-incompatible ones, unless the population has
extremely low S-allele diversity.
Nevertheless, the hypothesis that self-incompatibility in mayapple is strictly or
partly genetically determined is in no way inconsistent with the results of this study.
Alleles that confer weakened self-incompatibility may simply be more common in Site 3
than in the other sites, which could occur through natural selection or genetic drift, if
historical habitat disturbance caused a genetic bottleneck. Self-compatible clones could
have been well-represented during the bottleneck period, or self-compatible mayapples
may have had a selective advantage in re-colonizing disturbed habitats, as strict
outcrossers failed to set seed due to a lack of mates (Baker 1955). This historical
24
selection for self-compatibility may not be evident under current conditions, with higher
population densities and widespread infection by mayapple rust (Puccinia podophylii;
Parker 1989) or other pathogens.
While my data do not permit a definitive conclusion on the degree to which
apparent self-incompatibility depends on a true self-incompatibility mechanism versus
inbreeding depression, the two possibilities are certainly distinguishable. Self-
incompatibility prevents pollen from germinating or prevents pollen tubes from reaching
and fertilizing ovules (Castric and Vekemans 2004), while inbreeding depression does
not take effect until after fertilization has occurred. It is known that self pollen on a
mayapple stigma can germinate (Whisler and Snow 1992), but it is not known whether
pollen tubes from self pollen can reach the ovules. If a genetic incompatibility
mechanism is at work, mayapple pistils fixed at a range of times following pollination
with self or outcross pollen would show that pollen tubes from self pollen are stopped
short of ovule fertilization. This would also reveal whether self-compatible patches are
fully self-compatible (pollen tube growth rate and ovule fertilization probability are
independent of whether the pollen is self or outcross pollen) or have “leaky” self-
incompatibility (self pollen tubes have slower growth rates than outcross tubes).
Agamospermy and Autogamy
The patches in Site 3 were also the only ones to produce fruits in the pollination
treatments intended to test for autogamy and apomixis. However, all of these fruits were
abscised between July and August, and allometric estimates indicated that none produced
more than one seed. Mayapple is protandrous, with anthers sometimes dehiscing before
anthesis (Whisler and Snow 1992 and pers. obs.), and it is possible that any seeds
produced in the apomixis treatment were the result of autogamous pollination that
occurred before the emasculation treatment was performed. To date, only one apomictic
population of mayapple has been reported, in western New York State (Bernhardt 1975,
as cited by Swanson and Sohmer 1976), and the evidence that Site 3 represents the
second such population is extremely weak. Given that no seeds were collected from
either the autogamy or apomixis groups in Site 3, and that many of the fruits I have
25
collected in this system in three years have proved to be barren, it is safest to assume that
the patches in Site 3 are neither apomictic nor autogamous.
Geographic variability in the prevalence of self-compatibility in mayapple
If self-compatibility is favored by genetic bottlenecks due to decreased S-allele
diversity (Baker 1955), it may be more prevalent near the expanding edges of a species’
range or in portions of its range in which populations have a history of instability
(Pannell and Barrett 1998, Busch and Schoen 2008). S-allele diversity can be lower in
recently-established populations (Brennan et al. 2006), and populations near the limits of
a species range can have lower S-allele diversity and higher prevalence of self-
compatibility (Busch 2005). In the case of mayapple, the northern frontier may be
particularly likely to harbor self-compatible populations, since populations near this limit
are among the last to have been re-colonized following the most recent Pleistocene
glaciation. Western populations, those in the pre-settlement transition zone from forest to
savanna to prairie, may have also a high prevalence of self-compatibility, due to habitat
disruption and fragmentation by anthropogenic fires since the last ice age. The
southeastern limit of mayapple’s range is potentially also of interest, as it is apparently
less common near this boundary than it is near much of the northern limit, but no studies
on mayapple’s mating system have been conducted in this region. To determine whether
mayapple’s mating system differs between frontier and core populations, I will briefly
review the studies, in addition to my own, that have attempted to determine mayapple’s
mating system.
The current study was conducted near the northern edge of mayapple’s range, in a
region that was dominated by oak-hickory forests at the time of the U.S. government’s
General Land Office survey of Michigan (ca 1816-1856). At the maximum of the
Wisconsin glaciation (about 18,000 years BP), all of Michigan was covered in ice. The
glaciers had retreated beyond Washtenaw County by about 14,000 years BP. Since that
time, mayapple’s range has expanded to approximately 170 km north of my study sites,
but it is uncertain how long it has been present in the vicinity of my study. Perhaps the
study system’s location near, but not at, the northern limit of mayapple’s range explains

26
why the mating system for my populations as a whole was mixed, with self-compatibility
present but less common than self-incompatibility.
Three other studies focused on populations similarly close to the northern limit of
mayapple’s range, and one of these was also close to the western limit. Swanson and
Sohmer (1976) studied populations in southwestern Wisconsin and adjacent Minnesota,
in the far northwestern limit of mayapple’s range. They found that geitonogamously-
pollinated flowers did not set seed, while outcross-pollinated flowers did. Laverty and
Plowright (1988) worked in a population on Amherst Island at the northeastern end of
Lake Ontario. They found no fruit set among twenty hand-selfed, bagged flowers in each
of four patches, while all ten hand-outcrossed flowers in each patch produced fruit and
seeds. Finally, Policansky (1983) detected self-compatible patches near Weston,
Massachusetts, but he does not make it clear whether how many clones he tested or
whether any were self-incompatible. Overall, self-incompatibility dominates near the
northern and western limits of mayapple’s range.
Even given that most populations that have been studied near the northern and
western limits of mayapple’s range have been self-incompatible, it is possible that self-
compatibility is more common in these locations than closer to the center of the species’
range. To date, five studies have tested for self-compatibility in mayapple at least 300
km from its northern, western, and southeastern limits. Policansky (1983) found self-
compatible plants near Oak Ridge, Tennessee, while none of the autogamous pollinations
he performed near Princeton, New Jersey yielded fruit. In North Carolina, Motten (1986)
bagged and self-pollinated twelve mayapple flowers, none of which set fruit, while open-
pollinated flowers receiving supplemental outcross pollen by hand had 31.3% fruit set
(Motten 1986). In Delaware, Rust and Roth (1981) found that ten flowers that were
autogamously hand-pollinated had all abscised their ovaries by five weeks later, while 20
geitonogamously-pollinated flowers gradually abscised their fruits over three months, and
22 of 34 cross-pollinated flowers retained their fruits until they were collected. Finally,
Whisler and Snow (1992) found that 74% of the mayapple patches in their seven sites in
central and northeastern Ohio were completely self-incompatible, while 6% were highly
self-compatible (over 50% fruit set from self-pollination) and 20% were moderately self-
compatible (non-zero fruit set from selfing, but less than 50%; Whisler and Snow 1992).
27
Overall, there is no evidence that self-compatibility is more common at the
northern or western frontiers of mayapple’s range than in the interior. Two of four
studies conducted near the northern and western limits of mayapple’s range found no
self-compatible clones, while three of five studies conducted far from these boundaries
found the same. This is inconsistent with the hypothesis that rapid range expansion after
the last glacial maximum has selected for increased self-compatibility in mayapple
populations at the northern limit of its range.
Whether sparse or recently established mayapple populations are more likely to
have self-compatible patches cannot be determined from studies published to date, few of
which provide details about population density or age. For the current study, I
specifically selected forest fragments in which mayapple was common. Previous studies
were probably similarly biased against sparse populations, since organisms are easier to
study in places where they are abundant. Fruiting failure can be complete in sparse
populations (pers. obs.), potentially increasing the strength of selection favoring self-
compatibility in such populations. However, small, sparse populations with very limited
sexual reproduction would have limited potential to evolve in response to selection, and it
is therefore doubtful whether such populations are likely to evolve a greater prevalence of
self-compatibility than denser populations. Indeed, given that self-compatible individuals
are better at stably colonizing new habitats and expanding their populations (Baker
1955), the sparsest populations may be those that lack self-compatibility.
The bias toward dense populations may produce a bias toward relatively old
populations. However, the effect of this bias on detected prevalences of self-
compatibility is unclear. Older populations have had more time to evolve in response to
selection, but the direction of selection on self-compatibility in such populations may
depend on the diversity of S-alleles present. If diversity is low, mate limitation will more
strongly favor self-compatibility, while if it is high, mate limitation is a weaker factor in
reproductive success, and selection for self-incompatibility through inbreeding
depression may dominate.

28
The paradox of self-incompatibility in the face of chronic pollen limitation
The apparent paradox of self-incompatibility in a chronically pollen-limited
species may be explained in at least five ways.
(1) Pollen limitation in mayapple is an artifact of anthropogenic disruption of
pollinator networks. For example, mayapple may have lost its most common pollinators
in most habitats, or the phenological fit between the time mayapple’s flowering time and
its pollinators’ pollen foraging times may have been altered by anthropogenic changes in
habitat or climate. This explanation for the combination of chronic pollen limitation and
self-incompatibility could also explain why mayapple flowers are fragrant and do not (to
human eyes) resemble other flowers in much of mayapple’s habitat. Pollinators learn to
avoid deceptive flowers much more rapidly if those flowers have an odor unlike any
familiar rewarding flowers (Kunze and Gumbert 2001).
This hypothesis is also compatible with mayapple’s lack of morphological
adaptations to reduce interspecific pollen transfer. A deceptive flower, being unable to
win pollinator loyalty, can only be visited by inconstant pollinators. It will therefore both
receive heterospecific pollen on its stigmas and lose pollen to heterospecific stigmas if it
has no adaptations to increase pollen transfer efficiency and reduce interspecific pollen
transfer. The evolution of universal deceit (that is, pollinator deceit by every individual
in the species) is highly improbable for any species that is not pre-adapted for low
pollinator constancy.
(2) If populations are not highly genetically structured (due, for example, to
frequent long-distance seed dispersal), then biparental inbreeding may be rare. Between
self-incompatibility and low biparental inbreeding, recessive, deleterious alleles may be
exposed to selection too rarely to be purged from the population. This would maintain
strong selection against self-compatibility because the fitness of progeny produced by
selfing will be greatly reduced by inbreeding depression. This hypothesis found support
from Whisler and Snow (1992), who found that mean seed set for open-pollinated
flowers of self-compatible mayapples was not conspicuously higher than mean seed set
for open-pollinated flowers of self-incompatible mayapple; the increase in fruit set due to
self-compatibility was apparently compensated for by the loss in seed set per fruit due to
29
inbreeding depression. If inbreeding depression also greatly decreased the fitness of
seeds produced from self-pollination, the production of similar numbers of seeds by self-
compatible and self-incompatible individuals would favor self-incompatibility despite the
genetic transmission advantage of self-compatibility (Fisher 1941).
(3) Mayapple’s reproduction, and the reproduction of nearly any species, may not
be truly pollen-limited (Haig and Westoby 1988). No studies have tested whether overall
seed set is improved for mayapple patches in which every flower receives supplemental
outcross pollen every year. The degree of pollen limitation may thus be inflated by re-
allocation of resources from naturally-pollinated flowers to outcross-supplemented ones,
which presumably receive a higher quality and quantity of pollen (Ashman et al. 2004).
The minority of mayapple ramets that remain physically connected to each other are
strongly physiologically integrated and draw resources from each other (Landa et al.
1992). Similarly, increased fruit and seed production in one year may mean fewer stored
resources are available for future reproductive effort (Ashman et al. 2004). Consistent
with this hypothesis, fruit production in mayapple in one year diminishes the probability
of flower production in the following year (Sohn and Policansky 1977). Thus, a
mayapple patch in which reproductive output was never limited by pollen would produce
fewer flowers each year, and may not be more fit in the long term than one with chronic
pollen limitation.
A proper evaluation of this hypothesis would require varying degrees of pollen
supplementation. Applying supplemental pollen to every receptive flower a mayapple
patch produces every year may eventually depress seed set for that plant below that
observed in naturally-pollinated plants, but this would only show that it is possible for
pollination success to be so high that resource limitation depresses seed set below natural
levels. The same result may never be obtained if only half of the flowers received
supplemental outcross pollen each year, which would indicate that pollination success
truly does limit mayapple’s long-term fitness.
(4) Mayapple’s failure to provide the reward sought by its pollinators may be
selectively favored because it encourages pollinators to leave the patch after visiting one
or a few flowers, thus promoting outcrossing (Dressler 1981, Laverty 1992). By this
argument, rewardlessness is an adaptive response to the combination of self-
30
incompatibility and clonal growth. Pollen limitation is simply a by-product of this
adaptation.
This hypothesis is not particularly compelling for mayapple. For a self-
incompatible species, self-pollination is simply a form of improper pollen transfer (sensu
Rathcke 1983), like interspecific pollen transfer. Certainly, self-pollination can impose
selection against increased pollinator rewards (Heinrich and Raven 1972); a balance
between attracting pollinators and convincing them to leave is desirable. However, that
balance generally lies somewhere above zero reward and the near-complete failure to
attract pollinators that results from not rewarding them. Given that pollen is carried over
across more than one flower visit, it is doubtful that any increase in self-pollination that
resulted from modest nectar provisioning, plus the cost of nectar production, could not be
compensated for by increased visitation and decreased interspecific pollen transfer, for
some range of non-zero investments in nectar production.
(5) Selection does not strongly favor mutations that increase seed set in mayapple
due to the long life of the adult stage. Mayapple is extensively clonal, and, while little is
known about its potential life span, genets clearly persist for decades and possibly
centuries (Bierzychudek 1982). It may be that reproduction by seed is simply not
important to the fitness of such a long-lived plant. This argument depends on the fitness
gains of increased seed production through the sexual production of more offspring being
exceeded by the fitness costs through decreased survivorship or lower future sexual
reproductive success.
For mayapple, the validity of this hypothesis is currently difficult to assess,
though relevant data are accumulating. Understanding the costs and benefits of increased
seed production depends on knowing the probabilities of seed germination, seedling
survivorship to the stage of initiating clonal growth, transitions between the flowering
and vegetative stages, and the branching of mature rhizomes. The effect of increased
nectar production can only be assessed through nectar addition experiments, but it is
much more difficult to estimate the cost of nectar production in a species that produces
none.

31
Future directions for research
To date, six studies (including this one) have addressed mayapple’s mating
system, yet none has determined how self-incompatibility is enforced. The pollination
biology of this species is of interest for several reasons: (1) It seems to be a deceptively-
pollinated plant that is not well-adapted to pollination by deceit (e.g., it has loose pollen,
unspecialized pollen placement, and extensive clonality). (2) Its pollination may be
facilitated by rewarding neighbors (Laverty 1992; Chapter 3). (3) It is predominantly
self-incompatible, yet its seed production is typically limited by pollination success
(Swanson and Sohmer 1976, Rust and Roth 1981, Laverty and Plowright 1988, Laverty
1992, Whisler and Snow 1992, Chapter 3). And (4) it is a source of podophyllotoxin,
which is used to synthesize effective drugs for lung cancer, various leukemias, and other
solid tumors (Van Uden et al. 1989). Understanding mayapple’s mating system would be
both valuable and interesting, but until the mechanism of self-incompatibility is
understood, it will be difficult to progress further in this direction.
The patterns of self-compatibility in mayapple should be determined across a
broad range of spatial scales. As described above, it does not appear, based on the
studies published to date, that mayapple is more likely to be self-compatible near the
northern edge of its range than further south. Mating system tests must be performed in
places where theory would predict a high prevalence of self-compatibility (where
populations are small and isolated, where habitats have a history of instability, or at the
extreme northern, western, and southeastern frontiers of the species’ range) and where
self-incompatibility should be favored (in old, undisturbed habitats with large populations
near the core of the species’ range). At finer spatial scales, Whisler and Snow (1992)
found variations in self-compatibility within populations and across central and
northeastern Ohio, and I found variation in self-compatibility among populations
separated by 0.5 to 3.0 km. I found evidence that variation in self-compatibility at this
scale was related to light abundance, indicating that inbreeding depression and resource
limitation, not a genetic self-incompatibility mechanism, explains some of the cases of
apparent self-incompatibility in this and other studies.
32
The most straightforward way to test the hypothesized relationship between the
expression of inbreeding depression and resource availability more rigorously would be
to perform reciprocal transplant or common garden experiments, so that ramets of both
self-compatible and apparently self-incompatible clones co-occur in a range of different
environments. If, for example, artificial mixed-genotype patches of mayapple were
established under different degrees of light availability, an effect of light abundance on
the probability of seed maturation from highly inbred ovules would reveal itself in a
positive relationship between measured self-compatibility and light abundance. Sample
sizes (number of clones) should be larger than those employed in this study, since some
apparently self-incompatible clones may be truly self-incompatible; inbreeding can only
affect apparent self-incompatibility for self-compatible clones.
Another prediction of the proposed relationship between expression of inbreeding
depression and resource availability is that plants with severe pathogen infections should
appear to be less self-compatible than those without them. Mayapple patches heavily
infected with a species-specific rust (Puccinia podophylii ) have much lower fruit and
seed set and shorter ramets than uninfected plants (Zach Miller, pers. com.) and
presumably have fewer resources for fruit and seed maturation. If outcrossing increases
the probability that some of a plant’s offspring are resistant to the pathogen strains
infecting the parent, a decreased expression of self-compatibility by infected plants would
result in a smaller proportion of that plant’s maternally-produced offspring being
susceptible to its own pathogens. To my knowledge, however, no relationship between
self-compatibility and pathogenic (or parasitic) infection has been reported in plants.
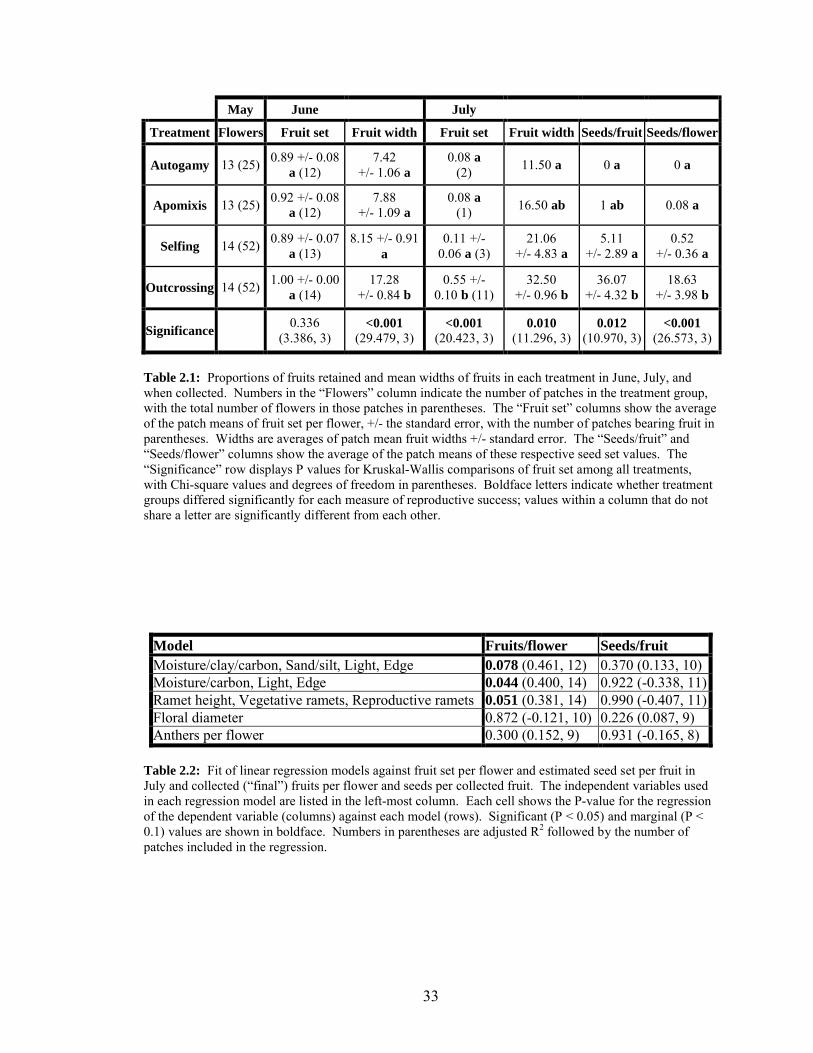
33
May June July
Treatment Flowers Fruit set Fruit width Fruit set Fruit width Seeds/fruit Seeds/flower
Autogamy 13 (25)0.89 +/- 0.08
a (12)7.42
+/- 1.06 a0.08 a
(2)11.50 a 0 a 0 a
Apomixis 13 (25)0.92 +/- 0.08
a (12)7.88
+/- 1.09 a0.08 a
(1)16.50 ab 1 ab 0.08 a
Selfing 14 (52)0.89 +/- 0.07
a (13)8.15 +/- 0.91
a0.11 +/-
0.06 a (3)21.06
+/- 4.83 a5.11
+/- 2.89 a0.52
+/- 0.36 a
Outcrossing 14 (52)1.00 +/- 0.00
a (14)17.28
+/- 0.84 b0.55 +/-
0.10 b (11)32.50
+/- 0.96 b36.07
+/- 4.32 b18.63
+/- 3.98 b
Significance0.336
(3.386, 3)<0.001
(29.479, 3)<0.001
(20.423, 3)0.010
(11.296, 3)0.012
(10.970, 3)<0.001
(26.573, 3)
Table 2.1: Proportions of fruits retained and mean widths of fruits in each treatment in June, July, and when collected. Numbers in the “Flowers” column indicate the number of patches in the treatment group, with the total number of flowers in those patches in parentheses. The “Fruit set” columns show the average of the patch means of fruit set per flower, +/- the standard error, with the number of patches bearing fruit in parentheses. Widths are averages of patch mean fruit widths +/- standard error. The “Seeds/fruit” and “Seeds/flower” columns show the average of the patch means of these respective seed set values. The “Significance” row displays P values for Kruskal-Wallis comparisons of fruit set among all treatments, with Chi-square values and degrees of freedom in parentheses. Boldface letters indicate whether treatment groups differed significantly for each measure of reproductive success; values within a column that do not share a letter are significantly different from each other.
Model Fruits/flower Seeds/fruitMoisture/clay/carbon, Sand/silt, Light, Edge 0.078 (0.461, 12) 0.370 (0.133, 10)Moisture/carbon, Light, Edge 0.044 (0.400, 14) 0.922 (-0.338, 11)Ramet height, Vegetative ramets, Reproductive ramets 0.051 (0.381, 14) 0.990 (-0.407, 11)Floral diameter 0.872 (-0.121, 10) 0.226 (0.087, 9)Anthers per flower 0.300 (0.152, 9) 0.931 (-0.165, 8)
Table 2.2: Fit of linear regression models against fruit set per flower and estimated seed set per fruit in July and collected (“final”) fruits per flower and seeds per collected fruit. The independent variables used in each regression model are listed in the left-most column. Each cell shows the P-value for the regression of the dependent variable (columns) against each model (rows). Significant (P < 0.05) and marginal (P < 0.1) values are shown in boldface. Numbers in parentheses are adjusted R2 followed by the number of patches included in the regression.
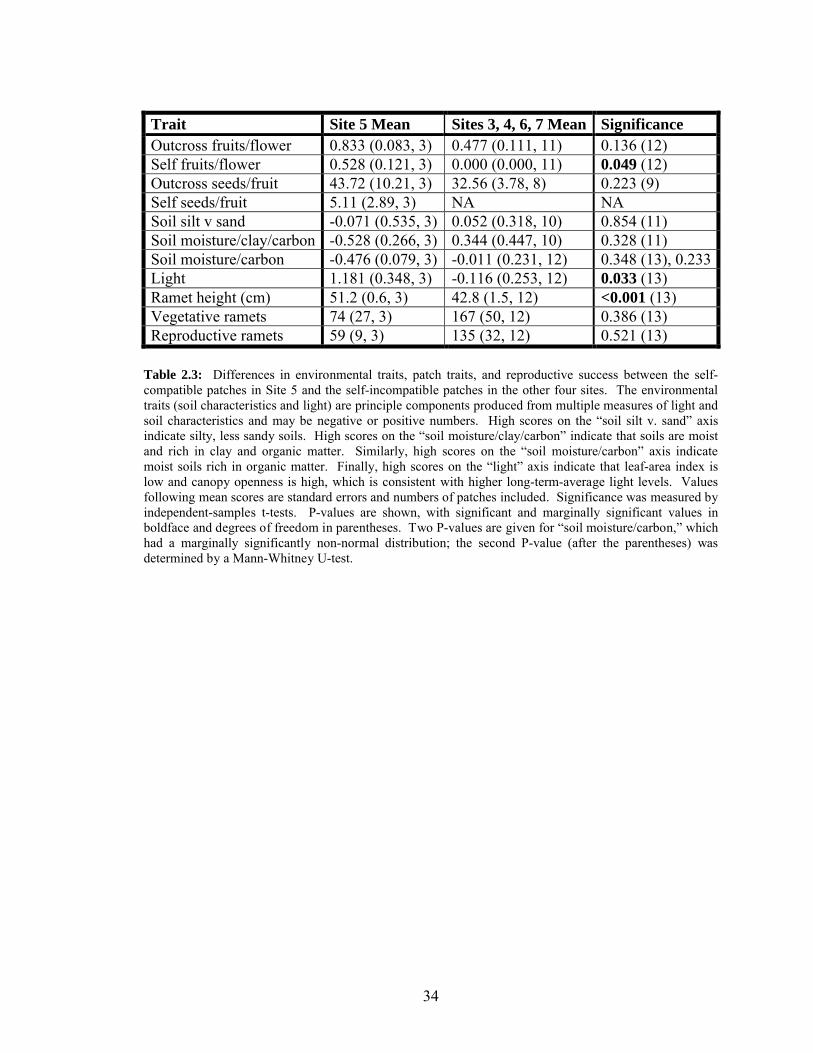
34
Trait Site 5 Mean Sites 3, 4, 6, 7 Mean SignificanceOutcross fruits/flower 0.833 (0.083, 3) 0.477 (0.111, 11) 0.136 (12)Self fruits/flower 0.528 (0.121, 3) 0.000 (0.000, 11) 0.049 (12)Outcross seeds/fruit 43.72 (10.21, 3) 32.56 (3.78, 8) 0.223 (9)Self seeds/fruit 5.11 (2.89, 3) NA NASoil silt v sand -0.071 (0.535, 3) 0.052 (0.318, 10) 0.854 (11)Soil moisture/clay/carbon -0.528 (0.266, 3) 0.344 (0.447, 10) 0.328 (11)Soil moisture/carbon -0.476 (0.079, 3) -0.011 (0.231, 12) 0.348 (13), 0.233Light 1.181 (0.348, 3) -0.116 (0.253, 12) 0.033 (13)Ramet height (cm) 51.2 (0.6, 3) 42.8 (1.5, 12) <0.001 (13)Vegetative ramets 74 (27, 3) 167 (50, 12) 0.386 (13)Reproductive ramets 59 (9, 3) 135 (32, 12) 0.521 (13)
Table 2.3: Differences in environmental traits, patch traits, and reproductive success between the self-compatible patches in Site 5 and the self-incompatible patches in the other four sites. The environmental traits (soil characteristics and light) are principle components produced from multiple measures of light and soil characteristics and may be negative or positive numbers. High scores on the “soil silt v. sand” axis indicate silty, less sandy soils. High scores on the “soil moisture/clay/carbon” indicate that soils are moist and rich in clay and organic matter. Similarly, high scores on the “soil moisture/carbon” axis indicate moist soils rich in organic matter. Finally, high scores on the “light” axis indicate that leaf-area index is low and canopy openness is high, which is consistent with higher long-term-average light levels. Values following mean scores are standard errors and numbers of patches included. Significance was measured by independent-samples t-tests. P-values are shown, with significant and marginally significant values in boldface and degrees of freedom in parentheses. Two P-values are given for “soil moisture/carbon,” which had a marginally significantly non-normal distribution; the second P-value (after the parentheses) was determined by a Mann-Whitney U-test.
35
Literature cited
Ågren, J., J. Ehrlén, and C. Solbreck. 2008. Spatio-temporal variation in fruit production and seed predation in a perennial herb influenced by habitat quality and population size. Journal of Ecology 96:334-345.
Allison, P. D. 1999. Multiple regression: a primer. Pine Forge Press, Thousand Oaks, California.
Ashman, T.-L., T. M. Knight, J. A. Steets, P. Amarasekare, M. Burd, D. R. Campbell, M. R. Dudash, M. O. Johnston, S. J. Mazer, R. J. Mitchell, M. T. Morgan, and W. G. Wilson. 2004. Pollen limitation of plant reproduction: ecological and evolutionary causes and consequences. Ecology 85:2408-2421.
Baker, H. G. 1955. Self-compatibility and establishment after "long-distance" dispersal. Evolution 9:347-349.
Bell, G. 1985. On the function of flowers. Proceedings of the Royal Society of London. Series B, Biological Sciences 224:223-265.
Bernhardt, P. 1975. The pollination ecology of four species of local vernal herbaceous angiosperms. SUC at Brockport, Brockport, New York.
Bierzychudek, P. 1982. Life histories and demography of shade-tolerant temperate forest herbs: a review. New Phytologist 90:757-776.
Bouyoucos, G. J. 1936. Directions for making mechanical analyses of soils by the hydrometer method. Soil Science 42:225-230.
Brennan, A. C., S. A. Harris, and S. J. Hiscock. 2006. The population genetics of sporophytic self-incompatibility in Senecio squalidus L. (Asteraceae): The number, frequency, and dominance interactions of S alleles across its British range. Evolution 60:213-224.
Brothers, T. S. 1993. Fragmentation and edge effects in central Indiana Old-Growth Forests. Natural Areas Journal 13:268-275.
Brothers, T. S. and A. Springarn. 1992. Forest fragmentation and alien plant invasion of central Indiana old-growth forests. Conservation Biology 6:91-100.
Busch, J. W. 2005. The evolution of self-compatibility in geographically peripheral populations of Leavenworthia alabamica (Brassicaceae). American Journal of Botany 92:1503-1512.
Busch, J. W. and D. J. Schoen. 2008. The evolution of self-incompatibility when mates are limiting. Trends in Plant Science 13:128-136.
Castric, V. and X. Vekemans. 2004. Plant self-incompatibility in natural populations: a critical assessment of recent theoretical and empirical advances. Molecular Ecology 13:2873-2889.
Charnov, E. L. 1979. Simultaneous hermaphroditism and sexual selection. Proceedings of the National Academy of Sciences 76:2480-2484.
Chen, J., J. F. Franklin, and T. A. Spies. 1992. Vegetation responses to edge environments in old-growth Douglas-fir forests. Ecological Applications 2:387-396.
Chen, J., J. F. Franklin, and T. A. Spies. 1995. Growing-season microclimatic gradients from clearcut edges into old-growth Douglas-fir forests. Ecological Applications 5:74-86.

36
Dahir, S. E. and C. G. Lorimer. 1996. Variation in canopy gap formation among developmental stages of northern hardwood stands. Canadian Journal of Forest Research 26:1875-1892.
Dressler, R. L. 1981. The orchids: natural history and classification. Harvard University Press, Cambridge, MA.
Fisher, R. A. 1941. Average excess and average effect of a gene substitution. Annals of Eugenics 11:53-63.
Haig, D. and M. Westoby. 1988. On limits to seed production. The American Naturalist 131:757-759.
Halpern, C. B. and T. A. Spies. 1995. Plant species diversity in natural and managed forests of the Pacific Northwest. Ecological Applications 5:913-934.
Heinrich, B. and P. H. Raven. 1972. Energetics and pollination ecology. Science 176:597-602.
Helenurm, K. and B. A. Schaal. 1996. Genetic load, nutrient limitation, and seed production in Lupinus texensis (Fabaceae). American Journal of Botany 83:1585-1595.
Honnay, O. and H. Jacquemyn. 2008. A meta-analysis of the relation between mating system, growth form and genotypic diversity in clonal plant species. Evolutionary Ecology 22:299-312.
Keller, L. F. and D. M. Waller. 2002. Inbreeding effects in wild populations. Trends in Ecology and Evolution 17:230-241.
Krochmal, A., L. Wilkins, D. Van Lear, and M. Chien. 1974. Mayapple (Podophyllum peltatum L.). NE-296, Forest Service, United States Department of Agriculture, Upper Darby, PA.
Kunze, J. and A. Gumbert. 2001. The combined effect of color and odor on flower choice behavior of bumble bees in flower mimicry systems. Behavioral Ecology 12:447-456.
Landa, K., B. Benner, M. A. Watson, and J. Gartner. 1992. Physiological integration for carbon in mayapple (Podophyllum peltatum), a clonal perennial herb. Oikos 63:348-356.
Laverty, T. M. 1992. Plant interactions for pollinator visits: a test of the magnet species effect. Oecologia 89:502-508.
Laverty, T. M. and R. C. Plowright. 1988. Fruit and seed set in mayapple (Podophyllum peltatum): influence of intraspecific factors and local enhancement near Pedicularis canadensis. Canadian Journal of Botany 66:173-178.
Matlack, G. R. 1994. Vegetation dynamics of the forest edge--Trends in space and successional time. Journal of Ecology 82:113-123.
Motten, A. F. 1986. Pollination ecology of the spring wildflower community of a temperate deciduous forest. Ecological Monographs 56:21-42.
Pannell, J. R. and S. C. H. Barrett. 1998. Baker's Law revisited: reproductive assurance in a metapopulation. Evolution 52:657-668.
Parker, M. A. 1989. Disease impact and local genetic diversity in the clonal plant Podophyllum peltatum. Evolution 43:540-547.
Policansky, D. 1983. Patches, clones and self-fertility of mayapples (Podophyllum peltatum L.). Rhodora 85:253-256.
37
Rathcke, B. 1983. Competition and facilitation among plants for pollination. Pages 305-329 in L. Real, editor. Pollination Biology. Academic Press, Inc., Orlando, FL.
Roberts, T. L. and J. L. Vankat. 1991. Floristics of a chronosequence corresponding to old field--deciduous forest succession in southwestern Ohio. II. Seed banks. Bulletin of the Torrey Botanical Club 118:377-384.
Ruben, J. A., D. T. Bolger, D. R. Peart, and M. P. Ayres. 1999. Understory herb assemblages 25 and 60 years after clearcutting of a northern hardwood forest, USA. Biological Conservation 90:203-215.
Rust, R. W. and R. R. Roth. 1981. Seed production and seedling establishment in the mayapple, Podophyllum peltatum L. American Midland Naturalist 105:51-60.
Sage, T. L., S. R. Griffen, V. Pontieri, P. Drobac, W. W. Cole, and S. C. H. Barrett. 2001. Stigmatic self-incompatibility and mating patterns in Trillium grandiflorum and Trillium erectum (Melanthiaceae). Annals of Botany 88:829-841.
Sohn, J. J. and D. Policansky. 1977. The costs of reproduction in the mayapple Podophyllum peltatum (Berberidaceae). Ecology 58:1366-1374.
Swanson, S. D. and S. H. Sohmer. 1976. The biology of Podophyllum peltatum L. (Berberidaceae), the may apple. II. The transfer of pollen and success of sexualreproduction. Bulletin of the Torrey Botanical Club 103:223-226.
Vaughton, G. and M. Ramsey. 2003. Self-compatibility and floral biology in subdioecious Wurmbea dioica (Colchicaceae). Australian Journal of Botany 51:39-45.
Wagenius, S., E. Lonsdorf, and C. Neuhauser. 2007. Patch aging and the S-allele effect: breeding system effects on the demographic responses of plants to habitat fragmentation. The American Naturalist 169:383-397.
Walkley, A. and I. A. Black. 1934. An examination of the Degtjareff method for determining soil organic matter, and a proposed modification of the chromic acid titration method. Soil Science 37:29-38.
Whisler, S. L. and A. A. Snow. 1992. Potential for the loss of self-incompatibility in pollen-limited populations of mayapple (Podophyllum peltatum). American Journal of Botany 79:1273-1278.
Wiens, D. 1984. Ovule survivorship, brood size, life history, breeding systems, and reproductive success in plants. Oecologia 64:47-53.
Willson, M. F. 1979. Sexual selection in plants. The American Naturalist 113:777-790.

38
Chapter III
Pollinator-mediated interactions between a nectarless species(Podophyllum peltatum L.) and its co-flowering neighbors:
a test of the benefits of having attractive neighbors
Introduction
Approximately 6% of all animal-pollinated angiosperm species provide no
rewards to pollinators that visit their flowers (Renner 2006). These species typically have
very low visitation rates and low reproductive success. Thus, while withholding
pollinator rewards presumably allows the resources that would have gone into rewards to
be used for other fitness-promoting functions (e.g., growth, survival, and seed
maturation), the cost of doing so is probably more substantial than these benefits. This
unfavorable cost-benefit ratio for withholding rewards explains why so few animal-
pollinated plant species follow this strategy, but it begs the question: why are any
animal-pollinated plant species unrewarding?
One mechanism that may weaken selection against unrewarding flowers is
Thomson’s (1978) “magnet species” hypothesis, which proposes that a species whose
flowers fail to attract many pollinators experience greater visitation rates, and perhaps
greater reproductive success, in the presence of a species that pollinators find highly
attractive. Given that unrewarding species are exceptionally ineffective at attracting
pollinators, it is not surprising that this hypothesis has found support in studies involving
such species (Laverty and Plowright 1988, Laverty 1992, Johnson et al. 2003, Juillet et
al. 2007).
To examine the magnet species phenomenon, I chose mayapple (Podophyllum
peltatum L., Berberidaceae) as an ideal study system because it is unrewarding to its
native North American pollinators, bumblebee queens (Bombus spp.), and accordingly, it

39
has a low pollinator visitation rate and low fruit and seed production (Swanson and
Sohmer 1976, Rust and Roth 1981, Laverty and Plowright 1988, Laverty 1992). Unlike
many other unrewarding species, however, it lacks any mechanisms to reduce
interspecific pollen transfer (as found in the Orchidaceae; Nilsson 1992, Harder and
Johnson 2008) and has fragrant flowers, which facilitates learned avoidance in pollinators
(Kunze and Gumbert 2001, Galizia et al. 2005). While the combination of the absence of
pollinator rewards and the presence of floral fragrance results in a very low visitation
rate, the combination of extensive clonality and self-incompatibility (Swanson and
Sohmer 1976, Policansky 1983, Laverty and Plowright 1988, Whisler and Snow 1992)
reduce the probability that pollen transfer among flowers results in fertilization. Thus,
mayapple presents an enigma in that it does not reward its native pollinators yet appears
to be poorly adapted to compensate for the low visitation rate and low pollinator
constancy that result from this trait.
The magnet species effect has previously been demonstrated for this species
(Laverty 1992). However, this study involved a magnet species with an exceptionally
high visitation rate per flower (Pedicularis canadensis L., Scrophulariaceae) that does not
typically occur near mayapple populations, concentrated in a narrow area within a single
study site. The magnet species effect can only be relevant to the evolution of
unrewarding flowers in mayapple if it mitigates the reproductive costs of withholding
rewards in a wide variety of contexts, including contexts where potential magnet species
are only moderately attractive to pollinators or occur in numerous, widely-distributed,
small patches.
In this study, I tested for the effects of common, co-flowering, nectar-producing
species on mayapple’s pollination success in six study sites in southeastern Michigan. I
considered four potential interactor species that commonly co-flowered with mayapple:
wild geranium (Geranium maculatum L., Geraniaceae), violets (Viola spp.,Violaceae),
spring beauty (Claytonia virginica L., Portulacaceae), and the invasive exotic herb garlic
mustard (Alliaria petiolata [Bieb.] Cavara and Grande, Brassicaceae). I tested for effects
of the abundance of each species on mayapple’s pollinator visitation, fruit set per flower,
and seed set per fruit, using both natural variation in floral abundance and neighbor
removal experiments. To see if mayapple shared pollinators with these and other species,
40
I collected pollinators to determine which species’ pollen were found on pollinators that
carried mayapple pollen. In addition, because mayapple lacks obvious adaptations to
reduce interspecific pollen transfer, yet the effect of heterospecific pollen on mayapple’s
mating success has not been examined previously, using hand-pollinations, I tested
whether the pollen of wild geranium and wild blue phlox (Phlox divaricata L,
Polemoniaceae) on mayapple stigmas had the potential to interfere with ovule
fertilization by mayapple pollen. Finally, I tested for effects of mayapple on fruit and
seed set of wild geranium, and I tested whether mayapple pollen on wild geranium
stigmas had the potential to interfere with ovule fertilization for this species. While
several studies have investigated the effects of rewarding neighbors on the pollination of
unrewarding species (e.g., Laverty and Plowright 1988, Johnson 2000, Johnson et al.
2003), few have considered the interaction in the opposite direction (Anderson and
Johnson 2006). Any effect of unrewarding species on the pollination success of a
rewarding species may influence the ecological and evolutionary trajectories of
populations of the rewarding species (see Rathcke 1983).
In addition to these potential pollinator-mediated interactions between mayapple
and its rewarding neighbors, I examined the potential for habitat edge effects on
mayapple’s pollination success. Forest edges are better-lit and warmer than forest
interiors (Matlack 1993, Chen et al. 1995), possibly allowing pollinators with high
minimum flight temperatures to operate there (Herrera 1995). They also have greater
plant diversity (Chen et al. 1992, Fraver 1994), and many forest species flower in greater
abundance in well-lit environments such as edges (Moore and Vankat 1986, Collins and
Pickett 1988), which may attract abundant and diverse pollinators. If the magnet species
effect operates because visitation to unrewarding species is simply a function of the local
abundance of effective pollinators, then mayapple will have higher visitation near forest
edges if edges have a higher abundance of effective pollinators than interiors.
This study addresses the following questions: Does pollen receipt limit fruit and
seed production in mayapple in my system; can fruit and seed set be increased by adding
outcross pollen to mayapple stigmas by hand? If so, is pollen limitation attributable to a
low pollinator visitation rate, as expected if pollinators avoid flowers they find
unrewarding? Does pollinator visitation increase, and does pollen limitation decrease,
41
with increasing abundance of nectar-producing, co-flowering neighbors, as predicted by
the magnet species hypothesis? Is pollination success related to floral abundances at the
scale of entire study sites (hectares)? Does visitation rate increase, and does pollen
limitation decrease, near forest edges or in brightly-lit patches, as expected if pollinators
preferentially forage in warmer, brighter environments cool days? Do the diversity and
abundance of flowers vary with distance to the forest edge? Do mayapple and its nectar-
producing neighbors share individual pollinators, as predicted by the magnet species
hypothesis? Does interspecific pollen transfer between mayapple and its neighbors
potentially depress pollination success for either? What effect, if any, does mayapple
have on its neighbors’ pollinator visitation rate and pollen limitation? Do larger
mayapple patches have higher pollen limitation, as expected if clonal growth promotes
geitonogamous self-pollination? Do conspecific neighbors decrease pollen limitation
without affecting visitation rate, as expected if mate availability limits mayapple’s
reproductive success?
Methods
Study species:
Mayapple (Podpophyllum peltatum L.) is a common herb in eastern North
American temperate deciduous forests. It is self-incompatible and extensively clonal.
The above ground portion of each vegetative ramet is a single peltate, lobed leaf, while
reproductive ramets have two leaves emerging from one node on vertical stem, with a
single large (3-7 cm), white, nodding flower at this node. The flowers have no nectar,
abundant pollen, and a sweet fragrance. They are typically open for one to two weeks in
mid to late May, with the total flowering period lasting about three weeks.
Nectar-seeking bumblebee queens (Bombus sp.) are the most commonly observed visitors
to mayapple flowers, though pollen-foraging honeybees (Apis melifera) also visit
(Swanson and Sohmer 1976, Rust and Roth 1981, Laverty and Plowright 1988, and pers.
obs.).
42
Study sites
The study was conducted in forest fragments in western Washtenaw County,
Michigan, in the southeastern portion of the state. In April of 2005, I located 10 to 13
mayapple patches in each of 5 sites (identified as sites 1 through 5), totaling 60 patches.
Each site was located in an upland forest fragment at least 300 meters long by 300 meters
wide. The fragments were located in an agricultural matrix dominated by fields of corn,
soybeans, and wheat, and sheep pastures. Each had secondary forest that had been
cleared of trees at least once, and sites 2, 3, and 4 were selectively logged by their
landowners during the study. The forest in each site had large (~ 30-40 m tall) oaks
(mostly Quercus rubra), hickories (Carya ovata, C. glabra, and C. cordiformis), and
black cherries (Prunus serotina). These co-occurred with similarly large basswoods
(Tilia americana) in site 1 and with a dense subcanopy of small (~10 m tall) sugar maples
(Acer saccharum) in site 5. Half of site 2 occurred on moist, very peaty soils under a
canopy of large red maples (A. rubrum).
In 2006, to increase sample size and to test whether an older forest would provide
a better pollination environment for mayapple, I added another site with 13 patches to the
study, for a total of six sites with 73 patches. The new site was in the Nan Weston
Preserve at Sharon Hollow (NWP), a 100-ha natural area owned and managed by The
Nature Conservancy. The mayapple patches used in this site were in upland mesic
forests dominated by beech (Fagus grandifolia) and sugar maple, with a high diversity of
less dominant tree species. Unlike the forests of the other five sites, NWP’s forests have
never been cleared, and selective logging was light even before the Conservancy acquired
the property and halted logging entirely (Douglas Pearsall, pers. comm.).
Mayapple study patches
Mayapple patch characteristics
To test whether forest edges or wild geraniums facilitate mayapple pollination, in
April 2005, I selected mayapple patches within each of five second-growth sites to be

43
divided approximately evenly among four groups, determined by proximity to the edge
(less than 30 meters or more than 100 meters from the edge) and the presence or absence
of geranium within five meters. 21 of 32 edge patches and 16 of 28 interior patches had
geranium flowers within five meters. The patches with geranium outnumbered those
without it because geraniums near some patches were not detected before they began
flowering. The number of reproductive and vegetative ramets and the length and width
of the patch were measured. The location of the patch was determined using a Magellan
SporTrak MAP GPS unit. The approximate distance of the patch from the nearest forest
edge was estimated by pacing, and most distances could be checked against distances
along the edge-to-interior transects used to quantify site floras in 2005 (see below), which
were measured with tapes.
In 2006, reproductive and vegetative ramets were again counted and the length
and width were measured for all patches. For all patches, mayapple ramets with healthy
flowers were marked with individual numbers to reduce the probability of miscounting
flowers. The GPS locations of the patches in NWP were determined, and the distance of
each of these patches to the edge was determined by pacing, if possible. Some patches
were quite far from the nearest edge, and the distance of each such patch to the edge was
estimated on a map. Between 24 and 26 August, I measured the mean height of
reproductive ramets in each patch to the nearest half decimeter.
In 2007, in each patch, I marked the stem of each ramet bearing an open flower
with a vertical stripe, counting the flowers in the patch as I did so. This was much faster
than numbering stems, while still serving to reduce miscounts. I also measured the
heights, floral diameters, and anther counts for three ramets in each patch. I did not count
ramets, except in four patches that had died back dramatically between years. Site 5 was
eliminated from the study due to lack of access. Therefore, floral diameter and mean
number of anthers per flower were not measured in this site.
Environmental characteristics
Between 24 and 25 September 2005, I measured the openness of the forest canopy
over the center of each colony in Sites 1 through 5 using a spherical densiometer. I also
44
collected a 30-centimeter-deep soil core from the center of each colony and measured its
moisture content using the gravimetric method.
Between 24 and 26 August 2006, I measured the leaf-area index for each patch in
all sites using an LAI-2000 (Licor Corporation). Leaf-area index and canopy openness as
measured by densiometer were significantly negatively related (linear regression, p <<
0.0001, R2 = 0.182, adjusted R2 = 0.170, beta = -0.426, df = 72), confirming that the two
methods measure similar but not identical phenomena. The leaf-area index readings were
presumed to be less subject to observer error and bias, and, therefore, these were used in
the statistical analyses described below, with densiometer readings excluded to maximize
the independence of factors.
In 2007, I collected 30-centimeter soil cores from the patches in Site NWP in June
and determined their percentage moisture with the gravimetric method. From June to
August 2007, I measured soil organic content for all 73 soil samples by the Walkley-
Black wet combustion method (Walkley and Black 1934) and soil texture for 65 samples
by the Bouyoucos hydrometer method (Bouyoucos 1936). Eight samples from Site 2
were collected from very peaty soils, and valid soil texture analyses could therefore not
be performed on them (Donald Zak, pers. comm.).
Soil texture analysis produced three interdependent variables: percent sand,
percent silt, and percent clay. Because these must sum to 100%, they are strongly
correlated with each other, and including together as explanatory variables in statistical
analyses would substantially diminish the apparent explanatory power of each of them.
Therefore, soil texture was reduced to a single axis using a principal components analysis
(PCA). This axis explained 77.2% of the variation in soil texture components and
correlated positively with soil percent silt (r = 0.902) and clay (r = 0.718) and negatively
with soil percent sand (r = -0.994).
45
Neighborhood floral displays
In 2005, all plants known to produce showy flowers within five meters of each
patch were identified between 2 and 6 May. The abundance of each flowering species
was described in qualitative terms (“few,” “many,” etc.).
Presence/absence data for geraniums and other species that co-flowered with
mayapple did not explain a significant amount of the variation in pollination success
among patches, and qualitative abundance categories were too ambiguous to reliably test
for an effect on pollen limitation. Therefore, between 17 and 27 May 2006, all showy
flowers were counted and identified (1) inside the patch, (2) 0 to 1 meters from the patch,
and (3) 1 to 5 meters from the patch. The survey included all 73 patches (70 of which
flowered) in all six sites.
Information on floral displays was not collected in 2007.
In the statistical analyses described below, flower abundances measured in 2006
were used for all three years, on the assumption that flower abundances were strongly
correlated between consecutive years. This assumption is supported for at least some
species by the positive correlations found when the subjective categories of flower
abundance in 2005 were given ordinal classifications and floral abundances within 5
meters in 2006 were regressed on them. Geranium and violet abundances were
particularly strongly correlated between years (R2 > 0.50), while garlic mustard
abundance was less consistent (R2 = 0.274), and spring beauty abundance was poorly
correlated (R2 = 0.114).
The poor correlation for spring beauty is related to the difference in the times
when floral abundances were estimated or quantified in 2005 and 2006. Peak flowering
for spring beauty occurred about a week to two weeks before mayapple began flowering,
at about the time when abundances were estimated in 2005. By the time floral
abundances were quantified in 2006, spring beauty floral abundance had begun to
decline, with more dramatic declines near some mayapple patches than others. In
contrast, the violet species were at peak flower from approximately two weeks before
mayapple flowered into the first week of flowering, and floral abundances of geranium
and garlic mustard were estimated in 2005 based on the number of individuals with pre-

46
reproductive morphologies, which was probably strongly related to the number of flowers
present when mayapple flowered.
Removal of potential facilitators
To test whether correlations between abundances of nectar-producing neighbors
and mayapple’s pollinator visitation or pollen limitation were attributable to the presence
of those neighbor’s flowers, I removed the flowers on all plants within one meter of each
of three mayapple patches per site. Neighboring flowers were removed twice during
mayapple’s flowering season, early in the first week of flowering and again early in the
second week. Flowers were counted and identified before they were removed.
Floral abundance on edge-to-interior transects:
To test whether the floral environment of the forest edge differed from that of the
forest interior, I surveyed the flowering displays of Sites 1 through 5 between 1 and 9
June 2005. In each site, flowers or inflorescences were counted along two 150-meter
transects running from the forest edge to the forest interior. In sixteen 2 m x 2 m plots on
each transect, I counted flowers for species with large, distinct flowers and inflorescences
for species with small flowers in compact inflorescences. Because the goal of the survey
was to create a description of the site flora that was relevant to mayapple, and because the
survey was conducted in the two weeks after the end of peak mayapple flowering, fruits,
flower pedicel scars, and infructescences were included in the counts. Floral displays
were surveyed on herbaceous species and shrubs below two meters above the ground.
Geranium patches
In 2006, I selected 20 geranium patches in four sites (Sites 1 through 4) to test for
effects of mayapple on wild geranium pollination. These were divided into two groups:
patches with one of the mayapple patches used in the study within 5 meters and patches
47
with no mayapple flowers within 15 meters. The locations of these geranium patches
were determined by GPS, but they were not further characterized.
Within each geranium patch, I outcross-pollinated 5 flowers (6 in one patch) by
hand, marking each with red paint on the pedicel immediately after pollination, and
marked an equal number with white paint as control flowers. In 15 of the patches, I
pollinated 5 flowers with mayapple pollen immediately followed by outcross pollen and
marked them with yellow paint. Each flower was on a separate ramet, but multiple
flowers may have been selected in the same genet in some cases. Flowers were selected
that had open stigmas and still had ample pollen in at least one of their two whorls of
anthers. This ensured that the stigmas were receptive but had not been open for much
more than one day.
Pollen voucher slides
In 2006 and 2007, I collected flowers of 31 species that co-flowered with
mayapple in my sites that were likely to be biotically pollinated, based on floral
morphology. These were identified and collected during mayapple flowering,
refrigerated until the end of mayapple flowering or until inclement weather prevented
fieldwork, and used to make pollen voucher slides in the lab. To produce pollen voucher
slides, the anthers of flowers of each collected species were blotted with a small (~ 3mm
X 3mm) block of 0.2 mg/mL gelatin stained with basic fuchsin (Beattie 1971, as
described in Kearns and Inouye 1993). The gelatin was melted onto glass slides and
covered with a coverslip, and the edges were sealed with fingernail polish. The pollen on
these slides was used to identify the pollen on collected bees and floral stigmas
(described below).
48
Pollinators
Pollinator observations
In 2005, I observed pollinator visits to one haphazardly selected mayapple patch
(1-63 flowers visible, mean = 12.67 flowers) for 10 minutes every hour in the field during
the flowering season, from 17 to 31 May. As often as feasible, I alternated between
patches near the forest edge and patches in the interior. A total of 97 observations were
conducted in 2005.
In 2006, pollinator observations were conducted every one to two hours from 9 to
25 May. Due to the continued extremely low rate of pollinator visitation, I allocated
more time to other, more data-productive field methods in 2006. A large storm system
brought cool, wet weather from 11 through 16 May, further reducing the number of
pollinator observations. However, in this year, during approximately half of the
observation times, two field assistants observed visitation to mayapple or to neighboring
flowers of other species during my observation periods. Overall, 52 observations of
mayapple were conducted in 2006.
In 2007, few formal observations were conducted once it became apparent that
visitation rates were comparable to those of the previous two years. Observations were
conducted on 11, 18, and 19 May, with a single observation on 21 May. A total of 29
observations were conducted in 2007.
Several times each day, generally following each pollinator observation period, I
determined the temperature and relative humidity using a sling psychrometer.
Pollinator collections
Bees visiting mayapple were collected whenever possible in 2006 and 2007. In
addition, one beetle and two moths found on mayapple flowers (but not moving among
them) were collected in 2006. Insects visiting neighbors of mayapple were collected
haphazardly in 2006, as were Bombus queens observed searching for nest sites. In 2007,
I attempted to capture all Apis workers and approximately half of all Bombus queens and
49
workers that I observed within the study sites during the period of mayapple flowering.
Capture efficiency increased through the flowering season, and the vast majority of
captures occurred in the second week of mayapple flowering, but capture efficiency
remained well below 50% throughout the season.
All captured insects were blotted for pollen using gelatin with basic fuchsin, and
the pollen was mounted on microscope slides, as described for the pollen voucher slides
above. Mayapple pollen was counted along five uniformly-spaced transects at 400X
magnification on each slide, and other pollen was counted and identified to the narrowest
taxonomic category possible. The coverslips were 41.5 fields of view (21 mm) across,
and pollen counting transects were placed at 7, 14, 21, 28, and 35 fields of view from the
top of the coverslip.
Pollen limitation
To determine whether low pollen deposition limits fruit and seed production for
mayapple and whether pollen limitation of reproductive success was lower near forest
edges and in the presence of wild geranium and other co-flowering plants, I added
outcross pollen to a subset of the flowers in each patch, where patch size permitted.
From 17 to 29 May 2005, I pollinated up to 5 flowers in 32 mayapple patches with
outcross pollen, marking the remainder as controls (the full flowering season ran from 17
to 31 May). The outcrossed flowers received pollen by hand in addition to any natural
pollen receipt that may have occurred. The pollen was applied with a nylon-bristled
paintbrush using pollen from at least three unmarked patches at least ten meters away,
and the same brush was used for all pollinations. Enough pollen was added to lend a
yellow coloration to the stigmatic ridges. In each patch, at least one ramet with an
apparently healthy flower was marked as a control and otherwise not manipulated.
Controls were also marked in 5 patches in which no flowers received supplemental
outcross pollen. (The remaining patches were used in a study on mayapple’s mating
system, described in Chapter 2, failed to flower, or were severely damaged after
flowering.)
50
In 2006, all pollinations were applied from 17 to 24 May (the full flowering
season ran from 9 to 25 May). Outcross pollen was added by hand to up to seven flowers
per patch, but no more than half of the flowers in the patch, for 62 of the patches (the
other eight patches did not produce sufficient flowers, or their flowers were too old for
pollination on the day when hand pollinations were applied). Pollen was deposited on the
stigmas by applying the anthers of flowers from three patches at least ten meters away
directly to the stigma. This method deposited pollen much more efficiently than the
paintbrush. As I pollinated each flower, I noted the number written on the ramet (see
“Mayapple patch characteristics” above).
In 2007, I hand-outcrossed 3 to 5 flowers per patch (fewer than 1/2 of the flowers
in the patch) in any patch with at least 7 flowers. Each flowering ramet was marked with
a vertical stripe on its stem, and after crossing a flower, I added a horizontal stripe
crossing the vertical one. Crosses were performed by applying three anthers from
mayapple patches at least ten meters from the recipient patch. All crosses were
performed from 11 to 17 May (the full flowering season ran from 11 to 22 May).
In all three years, all control and outcrossed flowers were inspected for the
apparent good health of the stamens and ovaries. Flowers with pistils that seemed
unviable (moldy, dark-colored, absent, or very small) were excluded from flower counts.
All healthy flowers were examined without magnification for nectar, and several flowers
in different patches were inspected for nectar with a 10X hand lens throughout each day.
Heterospecific pollen transfer
Because mayapple has loose pollen, unspecialized floral morphology, and
unrewarding flowers, I predicted that it would have a high ratio of heterospecific pollen
to outcross conspecific pollen. If heterospecific pollen interferes with the ability of
mayapple pollen to fertilize ovules after reaching the stigma, this could depress fruit and
seed set even below the limitation due to lack of pollinator visits. To determine whether
heterospecific pollen can interfere with the successful outcross pollination of mayapple
flowers, in 2006, in any mayapple patch with at least 12 flowers, I pollinated 3 to 5
flowers, but not more than one third of the patch, with heterospecific pollen followed
51
immediately by outcross pollen. If pollen-bearing Geranium maculatum flowers could be
found near the patch but over 5 meters away, I applied entire geranium flowers to the
stigmas of the treated mayapple flowers until the stigmatic ridges became yellow. If
geranium was not available, I applied pollen of Phlox divaricata in similar fashion,
opening the floral tubes and applying the anthers within to the mayapple stigmas.
Application of geranium or phlox pollen was followed by pollination with mayapple
pollen using three anthers from three patches at least 10 meters away. Overall, I applied
this treatment using geranium pollen in 33 patches and using phlox pollen in 8 patches.
Reproductive success
In mid to late July 2005, I measured the length and width, in millimeters, of all
mayapple fruits present on ramets in the marked patches and collected all ripe, abscised
fruits. In August 2005, I collected all remaining fruits. In the lab, I measured the length
and width of each fruit in millimeters, weighed it (fresh) to the nearest tenth of a gram,
and counted the seeds. Fruit width in July was found to be related to seed number by the
equation:
Seed number = 0.0007 * width (mm) ^ 2.9430 – 1. (1)
This equation fit the data for 173 fruits collected in 2005 well (R2 = 0.629), and it was
used to estimate the number of seeds in fruits that disappeared between July and August.
Fruits that had continued to develop into mid July, by which time fruits were approaching
their maximum volume, had presumably been successfully pollinated.
In 2006, I collected all mayapple fruits between 24 and 27 July and stored them in
a refrigerator. The length, width, and depth of each fruit were measured to the nearest
millimeter, and the fresh weight of each fruit was determined to the nearest tenth of a
gram. Beginning in late August, approximately half of the fruits were dissected and the
seeds, empty seed coats, and undeveloped ovules were counted. Thus, for these fruits, I
was able to determine not only fruit set per flower and seed set per fruit, but also seed set
per ovule, which may be a better measure of pollen limitation. However, because initial
52
analyses did not indicate that seed set per ovule produced different statistical results than
seed set per fruit, and because fruits began to decompose by the end of October, halfway
through the seed/ovule/empty coat counts, only developed seeds were counted for the
other half of the fruits.
In 2007, I collected fruits from 24 to 29 July. Only 155 fruits were found in this
year, and all were dissected and their seeds counted on 30 July. Their lengths, widths,
and weights were not determined because there was no obvious need for additional
allometric data.
Statistical analyses
The unit of replication for each treatment group was the individual patch. One to
three pollination treatment groups were represented in each patch: (1) control flowers,
receiving only natural pollination service, (2) outcross-supplemented flowers, receiving
outcross pollen by hand, in addition to natural pollination service, and (3) HPT flowers,
receiving heterospecific pollen followed by outcross pollen by hand, in addition to
natural pollination service.
All statistical tests were performed using SPSS 11.01 for Windows (SPSS Corp.
© 1989-2001). The significance of each result is categorized as significant (p < 0.05),
marginally significant (p < 0.10), or non-significant (p > 0.10). Trends are reported
where for non-significant results where p < 0.11. Whenever p < 0.11, p-values are
reported in the text.
Pollen limitation
Pollen limitation was assessed using an index of pollen limitation developed by
Larson and Barrett (2000):
PLfruit = 1 – Fo / Fs, (2)
53
where Fo is the percent fruit set of open-pollinated controls and Fs is the percent fruit set
of outcross-supplemented flowers. This index is given a lower bound of zero, on the
assumption that cases where control flowers have higher fruit set than outcross-
supplemented flowers are probably the result of experimental or Type I statistical error.
This assumption is not valid in populations for which pollen receipt limits fruit set only
weakly or not at all; if adding supplemental outcross pollen by hand has little effect on
fruit set, then control fruit set should exceed outcross fruit set about as frequently as the
reverse, and rounding negative values to zero produces a bias in favor of positive pollen
limitation. In this study, equation (2) produced negative values in only 6 cases out of
104, so Larson and Barrett’s (2000) assumption that negative values are the result of error
is both reasonable and unlikely to greatly alter the distribution of values of PLfruit.
The distribution of pollen limitation values for fruit set calculated by this index
did not deviate significantly from a normal distribution in any year, when neighbor-
removal patches were excluded (one-sample Kolmogorov-Smirnov tests, p = 0.148,
0.208, 0.410, N = 21, 32, 16, for 2005, 2006, and 2007 respectively). When neighbor-
removal patches were included, the PLfruit data became marginally significantly non-
normal for 2005 and 2006, but not for 2007 (p = 0.055, 0.097, 0.370, N = 26, 43, 21 for
2005, 2006, and 2007, respectively). However, no transformation of PL data
substantially improved the normality of the distribution, and the untransformed index was
used for analyses.
I calculated a similar pollen limitation index for seed set per fruit:
PLseed = 1 – So / Ss, (3)
where So is the number of seeds per fruit for open-pollinated control flowers and Ss is the
number of seeds per fruit for outcross-supplemented flowers.
For the same reason that Larson and Barrett’s (2000) index may not be
appropriate for populations with low pollen limitation of fruit, the analogous equation (3)
for seed set per fruit would not be appropriate for populations with low pollen limitation
of seeds per fruit. Fruit set may be pollen-limited, but if the relatively few naturally
pollinated flowers that set fruit generally have sufficient pollen for maximum seed
54
production, then control fruits should have higher seed set than outcross-supplemented
ones about as often as not. Variation in seeds per fruit can be increased by the fact that
seed production is limited not only by pollen and resources, but also by ovule number. In
mayapple, ovule number is highly variable among flowers (I counted between 15 and 96
total ovules, including seeds, empty seed coats, and undeveloped ovules, in 235 fruits in
2006). Thus, even if pollen generally limited seed set, control seed set may exceed
outcross seed set in some patches for reasons other than experimental or statistical error.
PLseed, as calculated by equation (3), was negative in 13 of 61 cases, indicating a
high risk of bias toward detecting significant pollen limitation if all negative values of
pollen limitation were rounded to zero. Therefore, I modified PLseed to allow for negative
values. Because the index in equation (3) may have infinitely negative values if these are
not rounded up to 0, I calculated a different index for negative values:
PLseed = – (1 – Ss / So). (4)
This index, which cannot fall below -1, was applied to any case where PLseed fell below
zero when calculated by the conventional index. When equation (3) is applied whenever
PLseed is positive and equation (4) whenever it is negative, PLseed ranges from -1 to 1,
with 0 indicating no pollen limitation. This index is also normally distributed for all three
years (one-sample Kolmogorov-Smirnov tests, p = 0.556, 0.981, 0.407, N = 14, 33, 14,
for 2005, 2006, and 2007, respectively; p = 0.999, 0.962, 0.464, N = 12, 23, 12, if
neighbor-removal patches are excluded).
Overall pollen limitation
To assess overall pollen limitation, I conducted one-sample t-tests to determine
whether the pollen limitation indices of fruit set and seed set were significantly greater
than zero. Patches from which neighboring flowers were removed in 2006 were excluded
from that year’s analyses.
55
Effects of pollination date
If any of my hand-pollinations were applied before or after period when the
stigma was receptive, they may have been ineffective, and this would depress the
measured degree of pollen limitation. If this occurred, then pollen limitation would vary
with pollination date, with greater pollen limitation near the middle of the flowering
season than early or late in the season. To test for such an effect, I regressed pollen
limitation of fruit and seed set on date of hand pollination for each study season.
Neighborhood floral displays and mayapple reproductive success
I performed backward and forward stepwise linear regressions to determine
whether patch traits, environmental characteristics, and flowering neighbors affected
pollen limitation of fruit and seed set. I used both backward and forward regression
because the significance of a variable often depends on whether other variables are
included in the model. For each year (2005-2007), I performed two sets of regressions
for both PLfruit and PLseed, one for early-season flowering neighbors (slightly before and
into the first week of mayapple flowering) and one for late-season flowering neighbors
(in the second week of mayapple flowering). Cases with missing values were excluded
listwise. The criterion for exclusion from the backward stepwise regressions was p >
0.10, and the criterion for inclusion in the forward stepwise regressions was p < 0.05.
Both sets of regressions included patch traits (mean ramet height, floral diameter,
and anthers per flower, and log-transformed flowers per patch) and environmental
characteristics (distance to the forest edge, leaf-area index, soil organic content, and soil
texture). In addition, to control for effects of site, I included site mean pollen limitation
as a factor in the analysis (using mean PLfruit when testing for effects on PLfruit and mean
PLseed when testing for effects on PLseed). The effect of including site mean PL is to
factor out variability in pollen limitation among sites, so that the remaining variables
explain only variability within sites. This is desirable to the extent that inter-site
variability is due to factors not included in the regression model, but not desirable to the
extent that the factors in the model explain variation among sites. Unfortunately, there is

56
no way of knowing what percentage of inter-site variation in PL is attributable to the
variables included in the regression models. Therefore, in each case where the final
model produced by forward or backward stepwise regression did not include site mean
PL, I produced a model that was identical to the final model, but with the addition of site
mean PL. In addition, I repeated all forward and backward stepwise regressions without
site mean PL as a variable, leaving the remaining variables to explain all within- and
among-site variation in PL.
In addition to site mean PL, patch traits, and environmental characteristics, the
regressions for early-season floral displays included the log-transformed abundances of
garlic mustard, spring beauty, geranium, and violets during the first floral survey.
Because few mayapples were flowering during the early-season floral survey, few
patches had flowering conspecific neighbors at this time, and the abundances of
neighboring conspecific flowers were therefore not included in these regression models.
Removal patches were excluded from the analyses for 2006, but not for 2005 and 2007.
Neighbor removal did not affect the abundances measured in the early survey, since floral
abundance was determined prior to flower removal, and removal of neighboring flowers
in 2006 presumably affected the floral neighborhood in 2006 but not in 2005 or 2007.
The regressions for late-season floral displays included the log-transformed
abundances of neighboring mayapples, garlic mustard, geranium, and violets. Spring
beauty flowers had become too uncommon to be included in the late-season regression
models. Removal patches were excluded from analysis in all three years because the
floral abundances measured in the late-season survey in 2006 were influenced by the
removal of neighboring flowers after the first survey (floral abundances were only
quantified in 2006, and these measurements were applied to all three years).
Not all independent variables were measured for all patches. Soil texture could
not be measured for eight patches in Site 2 that occurred on deep peat, and floral diameter
and anther number were not measured in the ten patches of Site 5 because these variables
were only measured for all study patches in 2007, when access to Site 5 could not be
obtained. To determine whether the exclusion of these 18 patches affected the outcome
of the regression analyses, the regressions were repeated without soil texture, floral
diameter, and anther number.
57
Neighbor removal
ANOVAs were used to test whether the removal of neighbors after the first
survey of floral displays affected the floral abundances in the second survey. The
abundance of each species within one meter of the patch in the second survey was treated
as the dependent variable, with first-survey abundance as a covariate and neighbor-
removal treatment as a fixed effect. If the neighbor removal treatment was effective, then
there should be a significant effect of the interaction between removal treatment and first-
survey abundance, in a direction consistent with neighbor-removal patches having lower
second-survey floral abundances than expected based on their first-survey floral
abundances.
To test whether the removal of neighboring flowers depressed pollination success,
I used independent-samples t-tests to compare PLfruit and PLseed between removal
treatments in 2006.
Patches for neighbor removal were selected semi-randomly; in each site, one
patch was selected at random among the forest interior patches, one from among the
forest edge patches, and one from the full set. However, it is possible that the patches
thus selected were not representative of the full population of study patches. If neighbor-
removal patches were in naturally poor or favorable pollination environments relative to
unmanipulated patches, this could affect the apparent effect of neighbor removal on
pollen limitation of reproduction. To see whether these two sets of patches were in
significantly different pollination environments apart from any effect of my
manipulations of floral abundance, I also performed t-tests to see whether the same
patches differed in pollen limitation in 2005 and 2007.
Flora of sites
Linear and curve estimation regressions had little power to determine whether
species richness, species diversity, total flower number, or the abundances of flowers of
particular species varied with distance to the edge. The ten-meter increments of distance
58
along the survey transects were also not directly related to the distance classes used to
select mayapple patches for study (< 30 meters and > 100 meters from the edge), so
analyses based on 10-meter increments do not necessarily assess whether the habitat of
the “edge” patches was floristically different from that of the “interior” patches.
Therefore, to test whether floral communities varied with distance from the forest edge
using a method consistent with that used to select patches, I used one-way ANOVAs to
test whether species richness, diversity, total flower counts, and flower counts for each
species varied significantly among three distance classes. These classes were (1) 0 to 30
meters from the forest edge (the first four plots of each transect), (2) 40 to 90 meters from
the forest edge (the next six plots), and (3) 100 to 150 meters from the edge (the last six
plots). In addition, independent samples t-tests were used to compare the flora of the
edge distance class with that of the interior distance class, since all of the mayapple
patches used in this study were in one of these two classes.
Site mean pollen limitations of fruit set per flower and seed set per fruit were
regressed on the mean abundances of flowers of garlic mustard, geranium, mayapple, and
violets per 4m2 plot in the transects for each site. Site 5 had a much higher abundance of
violets than the other four sites surveyed, and regressions on violet abundance were
therefore repeated with this site excluded. Regressions were performed for all three
years’ pooled data to determine whether any species had a consistent effect over an
extended period, as well as for 2005 and 2006 separately. There were only three sites for
which both mean pollen limitation and mean site floral abundances were available in
2007 because site 5 was dropped from the study and pollen limitation could not be
calculated for any patches in site 1 in that year, and because NWP was not part of the
study in 2005, when the transect surveys were performed. Consequently, regressions of
site mean pollen limitation in 2007 on site floral abundances are not reported (though
data from this year were included in the regressions on pooled data for all three years).
Heterospecific pollination of mayapple
To test for effects of pollination treatment on the probability of fruit set, I
performed binary logistic regressions of fruit presence or absence within a pollination

59
treatment group in a patch as a function of pollination treatment. If heterospecific pollen
interferes with ovule fertilization and thus reduces the effectiveness of outcross
pollination by hand, then fruit and seed set for HPT flowers will be lower than for
outcross-supplemented flowers. If hand-pollination with heterospecific pollen rendered
all outcross pollen received later ineffective at fertilizing ovules, then flowers receiving
the HPT treatment would have even lower fruit and seed set than control flowers (only
outcross pollen received naturally prior to hand-pollination could fertilize ovules).
However, not all heterospecific pollen may be equally effective at suppressing
fertilization success, and the comparison between flowers pollinated with geranium
pollen and those pollinated with phlox pollen is also of interest.
Because the comparisons of interest are all comparisons between two pollination
treatments, treatments were compared pairwise: HPT with geranium vs. HPT with phlox,
outcross vs. HPT with geranium, outcross vs. HPT with phlox, control vs. HPT with
geranium, and control vs. HPT with phlox.
For treatment groups bearing fruit, I compared arcsine-transformed fruit set and
untransformed seed set between the HPT treatment with wild geranium pollen and the
one with phlox pollen using t-tests. I also compared fruit and seed set between outcross-
supplemented flowers and each of the two HPT groups, and between control flowers and
each of the HPT groups. Patches from which neighboring flowers were removed were
included in these analyses because neighbor removal was not expected to modify the
effects of heterospecific pollen receipt.
Geranium patches
The effects of pollination treatment and presence or absence of mayapple flowers
within five meters on geranium’s fruit set per flower, seed set per fruit, and seed set per
flower were analyzed using t-tests and ANOVAs. None of these response variables
required transformation to achieve normality in this species. ANOVAs were performed
to test for an overall effect of pollination treatment on fruit set per flower, seed set per
fruit, and seed set per flower. Separate t-tests were also performed to compare control
60
treatment groups with outcross-supplemented and HPT treatment groups and to compare
the outcross-supplemented and HPT groups with each other.
T-tests were performed to compare fruit set, seed set per flower, and seed set per
fruit within five meters of mayapple versus over fifteen meters from mayapple for each
pollination treatment group. ANOVAs were used to test for a significant effect of the
interaction between proximity to mayapple and pollination treatment on all three
measures of fecundity, with control and outcross-supplemented treatments compared to
test for effects of mayapple on pollen limitation, and outcross-supplemented and HPT
treatments compared to test whether heterospecific pollen interfered with outcrossing
success.
Insect pollen loads
Nine bumblebee queens and two honeybee workers were collected in 2005, and
sixteen bumblebee queens, one bumblebee worker, and five honeybee workers were
collected in 2006. For each of these insects, mayapple pollen grains were counted and
the average numbers of pollen grains carried were calculated for both insect taxa and for
each of the floral taxa from which they were collected (including the ground as a floral
taxon). These averages were used as rough estimates of the importance of each insect
taxon as a pollinator of mayapple and the strength of the interaction through pollinators
between each floral taxon and mayapple.
Results
Pollen limitation
Overall pollen limitation
Flowers that received supplemental outcross pollination by hand produced more
fruits than naturally-pollinated control flowers, with more seeds per fruit, in 2005, 2006,
and 2007 (table 3.1). The yearly average values for PLfruit, an index of pollen limitation

61
of fruit set that ranges from 0 (no pollen limitation) to 1 (total fruiting failure due to
pollen limitation), ranged from 0.60 to 0.84. PLfruit was significantly greater than zero in
all years (one-sample t-test, p << 0.001 in all years, df = 25, 31, 20 in 2005, 2006, and
2007, respectively).
PLseed is an index of pollen limitation of seed set per fruit that ranges from -1 to 1,
with all values at or below 0 indicating no pollen limitation. Its mean in each year ranged
from 0.24 to 0.64, indicating that pollen limitation of fecundity was expressed more
strongly in depressed fruit set than in depressed seed set. However, PLseed was still
significantly greater than zero in all three years (one-sample t-test, p << 0.001, = 0.039, =
0.0008, df = 13, 22, 13 in 2005, 2006, and 2007, respectively).
Effects of date of hand pollination on apparent pollen limitation
PLfruit was not significantly related to pollination date or patch flower number in
any year (linear regressions, p = 0.183, 0.441, 0.205, adjusted r2 = 0.034, -0.013, 0.035,
df = 25, 31, 20, in2005, 2006, and 2007, respectively).
PLseed increased significantly with pollination date in 2005 (linear regression, p =
0.015, adjusted r2 = 0.351, df = 13), indicating that the earliest hand-pollinations in that
year were applied too early to be efficacious. Pollen limitation of seed set was not
significantly related to pollination date in the other two years (p = 0.818, 0.455, adjusted
r2 = -0.045, -0.032, df = 22, 13, for 2006 and 2007, respectively).
Regression models for pollen limitation of fecundity
Sixteen regression models were produced for each year, including all
combinations of (1) forward and backward stepwise regressions, (2) models including or
excluding variables that were not measured in every patch (soil texture and floral traits),
(3) models using floral abundances in the first or second week of mayapple flowering,
and (4) models including or excluding site mean pollen limitation as a factor. The full
models are shown in tables A1-A4 in the appendix I discuss the importance of each
variable that occurred in more than 25% of the models it could have occurred in when

62
site mean pollen limitation was excluded, noting cases where the inclusion of site mean
pollen limitation changed a variable’s importance.
In 2005, pollen limitation of fruit set increased with the abundances of garlic
mustard and spring beauty and with increasing silt and clay content in the soil, while it
decreased with the abundance of violets (table 3.1). Pollen limitation of seed set in that
year increased with the abundance of violets in every model produced, and it increased
with the number of flowers in the patch in two of six models and decreased with soil
carbon content in three models (table 3.1).
In 2006, floral abundances had no substantial relationship to pollen limitation.
The two models that included the abundance of any species’ flowers were large (5 or 7
variables) relative to the sample size (21 and 19 total degrees of freedom, respectively),
and their, and these models thus have low reliability. Instead, pollen limitation of fruit
set in 2006 was best explained by site mean pollen limitation, ramet height (when site
mean pollen limitation was included in the model), and leaf-area index (especially when
site mean pollen limitation was excluded). Pollen limitation of seed set
In 2007, the abundances of neighboring flowers again appeared in few models.
Spring beauty was positively related to pollen limitation of fruit set in one of four models
(its flowering had waned too much by the time of the second floral survey to be included
in the models based on that survey). Violet abundance was negatively related to pollen
limitation of fruit set, but was excluded from all models that included site mean pollen
limitation. It was also negatively related to pollen limitation of seed set. In addition to
these relationships to floral abundance, pollen limitation of seed set declined with
increasing leaf-area index of the forest canopy above the patch, except when site mean
pollen limitation was included in the model, and pollen limitation of fruit set was
significantly positively related to site mean pollen limitation in almost every model in
which this variable was included.
Effects of neighbor removal on pollen limitation
For Alliaria petiolata, the most abundant neighbor to mayapple, abundance in the
late-season survey declined in both removal and non-removal patches, with the overall
63
decline being significant (ANOVA, p < 0.0001, F1 62 = 17.902). Abundance declined
more for removal patches than for non-removal patches, resulting in a significant effect
of the interaction between removal treatment and floral survey (p = 0.030, F1 62 = 4.912),
consistent with successful suppression of the abundance of garlic mustard flowers. For
the next most abundant species, Geranium maculatum, flower abundance tended to
increase from the early survey to the late survey, and it increased much more for non-
removal patches than for removal patches. Accordingly, there were significant effects of
survey (p = 0.017, F1 30 = 6.372), removal (p = 0.014, F1 30 = 6.747), and the interaction
between the two (p = 0.043, F1 30 = 4.462). Overall, floral abundance declined between
surveys (p = 0.004, F1 84 = 8.900), and it declined faster for the removal patches than for
the non-removal patches, resulting in a significant effect of the interaction between
removal treatment and survey (p = 0.017, F1 84 = 5.984), indicating that the removal
treatment was effective at reducing floral abundance overall. This effectiveness hinged
largely on reductions of garlic mustard abundance in the removal patches. Considering
only species other than A. petiolata, the overall reduction in flower number from the early
to the late survey was marginally significant (p = 0.098, F1 76 = 2.814), and though this
reduction was largely confined to the removal patches, the effect of the removal x survey
interaction was not significant (p = 0.204, F1 76 = 1.639). This may be because
blackberries (Rubus allegheniensis) began flowering between surveys, producing up to
~240 flowers within a meter of the nine patches in which it was present and increasing
variability in floral abundance for both treatment groups.
On average, patches with neighboring flowers removed had PLfruit equal to 0.71
+/- 0.29 (mean +/- S.E.), while PLfruit for unmanipulated patches was 0.57 +/- 0.40.
PLseed was 0.33 +/- 0.44 for removal patches and 0.20 +/- 0.45 for unmanipulated patches.
Thus, mean pollen limitation of both fruit set per flower and seed set per fruit was
somewhat higher for the neighbor-removal patches than the unmanipulated patches in
2006. However, these differences were not significant for either fruit set (independent
samples t-test, p = 0.217, t = -1.266, df = 24.507) or seed set (p = 0.473, t = -0.726, df =
31).
PLfruit and PLseed also did not differ between the removal patches and
unmanipulated patches in 2005 or 2007, when neighbor removal treatments were not
64
performed (all p > 0.31), indicating that the two groups did not differ in pollen limitation
for reasons unrelated to removal treatment. As was true in 2006, PLfruit was
insignificantly higher in the removal patches in both 2005 and 2007, indicating that the
removal treatment in 2006 had even less effect on pollen limitation of fruit set than
comparison between removal and non-removal patches in that year seems to indicate.
There was also no significant effect of the interaction between year and the neighbor
removal treatment on PLfruit (ANOVA: p = 0.876, F2 84 = 0.133). In both 2005 and 2007,
PLseed could only be calculated for two patches in the removal treatment group,
preventing meaningful comparison between either of these years and 2006.
Nan Weston Preserve versus second-growth fragments
In 2006, neither PLfruit nor PLseed differed significantly between NWP, the largest,
least disturbed forest fragment, and the remaining sites, all smaller, second-growth forest
fragments (independent-samples t-tests: t = -0.561, 0.229, df = 30, 21, P = 0.579, 0.821,
for PLfruit and PLseed, respectively). The same was true in 2007 (t = 1.238, 0.862, df = 19,
12, P = 0.231, 0.405).
Flora of sites
Total floral abundance did not vary significantly among the three categories of
distance from the forest edge (0-30 m, 40-90m, 100-150 m; ANOVA, p = 0.160, F2 164 =
1.852), though the plots with the highest floral abundance were within 10 meters of the
edge. Similarly, distance category did not explain significant variation in species
richness (p = 0.789, F2 164 = 0.238) or Simpson’s reciprocal diversity index (p = 0.671, F2
140 = 0.401).
Alliaria petiolata was less common in the intermediate distance class than in the
other two, producing a marginally significant effect of distance on its abundance (p =
0.053, F2 41 = 3.158). Gallium aparine, which was most abundant within 30 meters of the
edge, was also marginally significantly affected by distance class (p = 0.076, F2 50 =
2.715). There was an outlier plot in Site 4 in which there were approximately 1500 G.
65
aparine flowers (all other plots with this species had between 2 and 210 flowers). When
this plot was excluded, the abundance of G. aparine flowers was significantly affected by
distance from the edge (p = 0.0003, F2 49 = 9.521), with more flowers near the edge and
fewer flowers in the intermediate class than in the interior. Viola abundance tended to
increase with distance from the forest edge, and its abundance was significantly related to
distance class (p = 0.012, F2 10 = 7.071). The abundances of the remaining species that
were common enough for statistical analysis did not vary significantly with distance
class, and most species were not common enough for statistical analysis.
Site mean PLfruit increased with site mean abundance of garlic mustard flowers in
2005 (linear regression, p = 0.015, R2 = 0.895, adjusted R2 = 0.859, beta = 0.946, df = 4).
Site mean PLfruit declined significantly with mean geranium abundance in 2006 (p =
0.047, R2 = 0.780, adjusted R2 = 0.706, beta = -0.883, df = 4) and for all three years
pooled (p = 0.030, R2 = 0.361, adjusted R2 = 0.302, beta = -0.601, df = 12). Site mean
PLfruit tended to decline with the abundance of violets in the transects in the pooled data
as well, when site 5 was excluded from analysis, but this tendency was not significant (p
= 0.100, R2 = 0.271, adjusted R2 = 0.191, beta = -0.0521, df = 10), and it was eliminated
entirely with the inclusion of site 5 (p = 0.689, R2 = 0.015, adjusted R2 = -0.074, beta =
0.123, df = 12). All other regressions of site mean pollen limitation of fruit and seed set
on site floral abundances were insignificant (all p > 0.14).
The abundances of garlic mustard and geranium tended to be negatively related.
This relationship was far from significant when all five of the sample sites were
considered (linear regression, p = 0.500, R2 = 0.163, adjusted R2 = -0.115, beta = -0.404,
df = 4), but became significant when site 5, which had few flowers of either species, was
excluded (p = 0.028, R2 = 0.945, adjusted R2 = 0.917, beta = -0.972, df = 3). It is likely
that this relationship partially explains why PLfruit increased with the abundance of garlic
mustard and decreased with the abundance of geranium. It is impossible, based on this
study, to determine the causal relationships among geranium abundance, garlic mustard
abundance, and pollen limitation of fruit set per flower for mayapple with certainty.
66
Effects of heterospecific pollination of mayapple
The probability that heterospecifically-pollinated treatment groups within patches
bore fruit was not significantly affected by the species used in the heterospecific
treatment (logistic regression, p = 0.644, Nagelkerke R2 = 0.007). However, among the
treatment groups that bore fruit, fruit set differed significantly with the species used for
heterospecific pollination (independent samples t-test: p = 0.015, t22.011 = 2.642), with
flowers pollinated using phlox pollen having lower fruit set than those pollinated sing
geranium pollen. Seed set per fruit did not differ significantly between the two groups (p
= 0.539, t26 = -0.622).
The probability that a treatment group bore fruit did not differ significantly
between the outcross-supplemented treatment and the HPT treatment using geranium
pollen (logistic regression, p = 0.8875, Nagelkerke R2 = 0.0004). Among treatment
groups that bore fruit, fruit set for outcross-supplemented flowers did not differ
significantly from fruit set for the flowers pollinated with wild geranium before
outcrossing (independent samples t-test, p = 0.863, t63 = -0.173). Seed set was also not
significantly different between these two groups (p = 0.892, t63 = 0.136).
The outcross treatment groups did not have a higher probability of bearing fruit
than the HPT treatment group pollinated with phlox pollen (logistic regression, p = 0.692,
Nagelkerke R2 = 0.003). However, among treatment groups that bore fruit, fruit set was
significantly lower for flowers pollinated with wild blue phlox prior to outcrossing than
for flowers receiving only outcross pollen (independent samples t-test, p = 0.007, t13.632 =
3.178). Seed set per fruit was not significantly different between these treatment groups
(p = 0.637, t47 = -0.475).
Treatment groups pollinated with geranium followed by outcross pollen were not
more likely to bear fruit than control treatment groups (logistic regression, p = 0.426,
Nagelkerke R2 = 0.009). However, among treatment groups that bore fruit, control fruit
set was lower that the HPT fruit set (independent samples t-test, p < 0.001, t72 = -4.475),
as was control seed set (p = 0.003, t72 = -3.116).
The probability of fruit set for the control treatment groups was not significantly
lower than that for groups of flowers heterospecifically pollinated with phlox pollen
67
(logistic regression, p = 0.965, Nagelkerke R2 < 0.001). Fruit set among treatment groups
that set fruit did not differ significantly between the two treatments (independent samples
t-test, p = 0.381, t56 = -0.882), but seed set per fruit was significantly lower for the control
treatment (p = 0.020, t56 = -2.397).
Geranium maculatum pollination
Fruit set was not significantly higher for outcross-supplemented geranium flowers
(66.7 +/- 6.6% fruit set, mean +/- SE) than for unmanipulated control flowers (54.7% +/-
6.7% fruit set; t-test: P = 0.210, t38 = -1.275). However, seed set per fruit was higher in
fruits from outcross-supplemented flowers (4.49 +/- 0.13 seeds per fruit) than for fruits
from control flowers (3.87 +/- 0.23 seeds per fruit; P = 0.026, t26.77 = - 2.357). Overall,
outcross-supplemented flowers produced significantly more seeds (3.44 +/- 0.32 seeds
per flower) than did control flowers (2.38 +/- 0.31 seeds per flower; P = 0.023, t38 = -
2.379).
Geranium flowers treated with mayapple pollen prior to outcross pollination had
56.7 % +/- 8.3% fruit set (mean +/- SE) and produced 4.26 +/- 0.17 seeds per fruit and
2.86 +/- 0.38 seeds per flower. Although these values were lower than the corresponding
values for flowers that received supplemental outcross pollen without heterospecific
pollen, they were not significantly so (fruit set: p = 0.347, t33 = 0.953; seeds per fruit: p
= 0.269, t30 = 1.126; seeds per flower: p = 0.258, t33 = 1.152). Fruit and seed set for HPT
flowers were also not significantly higher than they were for unmanipulated control
flowers (fruit set: p = 0.850, t33 = -0.190; seeds per fruit: p = 0.214, t29 = -1.271; seeds
per flower: p = 0.324, t33 = -1.001).
Proximity to mayapple patches had no effect on control fruit set (t-test: p = 0.794,
t18 = 0.265), seed set per fruit (p = 0.477, t12.71 = -0.734), or seed set per flower (p =
0.663, t18 = -0.443). The same was true for outcross-supplemented flowers (fruit set: p =
0.627, t18 = -0.494; seeds per fruit: p = 0.589, t17 = -0.551; seeds per flower: p = 0.462,
t18 = -0.751) and for HPT flowers (fruit set: p = 0.639, t13 = 0.480; seeds per fruit: p =
0.106, t11 = 1.761; seeds per flower: p = 0.370, t13 = 0.929).
68
Proximity to mayapple had no significant effect on pollen limitation of fruit set
per flower (ANOVA: pollination x mayapple p = 0.595, F1 36 = 0.287), seed set per fruit
(p = 0.714, F1 33 = 0.137), or seed set per flower (p = 0.815, F1 36 = 0.056). It also did not
influence the effectiveness of heterospecific pollen in suppressing fruit set (p = 494, F1 31
= 0.478) or seed set per flower (p = 0.240, F1 31 = 1.433). There was a trend toward a
greater effect of heterospecific pollen on seed set per fruit when mayapples were within
five meters (p = 0.104, F1 28 = 2.816). HPT seed set was significantly lower than outcross
seed set in geranium patches with mayapple flowers nearby (t-test, p = 0.046, t16 =
2.161), but not in patches without nearby mayapples (p = 0.678, t12 = 0.678).
Pollinator observations
Overall, 36 hours and 10 minutes of 10-minute floral observations (217
observations total) were conducted over the three years of the study, including all species
observed. An average of 12.65 flowers were observed in each period, for a total of
457.67 flower-hours of observations. Pollinator visits were observed on 16 of the 217
total observations, with a total of 83 flower visits observed.
178 observations were conducted on mayapple, with an average of 12.67 flowers
observed in each 10-minute period, for a total of 375.8 flower-hours of observations of
mayapple. Insects were seen to land or rest on mayapple flowers in 7 observations over
the three years of the study, with 8 insects making a total of 18 visits to individual
flowers.
Two of these visitors were honeybees foraging for pollen on 26 May 2005 in Site
5. They conducted 12 of the 18 observed visits to mayapple, while each of the remaining
six insects visited one flower apiece. These included a medium (~1 cm) fly, a white moth
(Tetracis cachexiata: Geometridae), a small (~5 mm) beetle (Carabidae), a mosquito, a
small (~1 cm), dark moth, and a bumblebee queen. Of these, only the bumblebee queen
is large relative to the distance between the anthers and the stigma, mobile enough to visit
many flowers per day, and possessed of hairs that acquire and retain pollen. She touched
the stigma of a single flower in Site 4 on 21 May 2005, without gathering pollen or
probing for nectar.

69
Overall mayapple’s average visitation rate was 0.062 +/- 0.029 visits per flower
per hour (mean +/- SE). When only bumblebees and honeybees are included, this rate is
reduced to 0.035 +/- 0.026 visits per flower per hour, or one visit per flower per 28.6
daylight hours.
Several visits to mayapple were recorded outside of the ten-minute observation
periods. In 2005, a honeybee was observed gathering pollen from several flowers at Site
5 on 26 May, the same date and site where the two honeybee foraging bouts were
recorded during 10-minute observations.
In 2006, a bumblebee queen visited six flowers in a patch in Site 4 on 9 May,
neither gathering pollen (the anthers had not yet dehisced) nor probing for nectar, before
switching to wild geranium. A honeybee was observed gathering pollen from six flowers
in Site 5 on 17 May, in the same patch where two of the foraging bouts in 2005 had been
recorded. Another honeybee was captured from a study patch in Site 3 on 20 May, and a
bumblebee queen briefly visited two mayapple flowers in two patches in the same site
later that day. Again, the honeybee was gathering pollen, while the bumblebee queen
visited flowers with indehiscent anthers, neither gathering pollen nor probing for nectar.
On 23 May, a bumblebee queen foraging for nectar on geraniums visited a single
mayapple flower in a study patch in Site 1, gathering pollen from it, before switching
back to geranium. The following day, a honeybee worker was seen gathering pollen from
three flowers in a patch in Site 2.
In 2007, a honeybee worker was captured from an unmarked mayapple patch in
Site 3 after it had been observed visiting eight flowers within the patch and gathering
pollen from them. This patch was across a logging trail from the patch in which a
honeybee was captured in Site 3 the previous year.
In addition to honeybees and bumblebee queens, insects found in mayapple
flowers outside of observation periods included numerous small carabid beetles,
geometrid moths (T. cachexiata), several mosquitoes, a medium-sized (~1 cm) fly that
had been captured by a crab spider, and an unidentified small (~1 cm) bee.
Although no insect is a definitively demonstrated pollinator of mayapple, it is
likely that honeybees and bumblebees are effective pollinators of the species, as both
have been previously observed visiting sequences of several mayapple flowers (Swanson
70
and Sohmer 1976, Laverty and Plowright 1988), and both are large, highly motile, and
capable of carrying large amounts of pollen on their bodies. In contrast, most of the other
visitors to mayapple observed in this study used the flowers as temporary landing
platforms, much as they might use a leaf or twig. The two exceptions were T. cachexiata
and the caribid beetles. The former were only found resting inside mayapple flowers,
where they were well-camouflaged; they were never detected flying or resting on another
surface, and they only moved if disturbed. The latter were commonly found in mayapple
and trillium flowers, where they ate pollen and floral organs. They did not leave the
flowers unless disturbed, and they were not seen entering flowers. Neither species
retained pollen well, based on the number of mayapple pollen grains found on specimens
collected from mayapple flowers. Only nine mayapple pollen grains were found on the
bodies of two T. cachexiata, and only eight on the body of a beetle, all of which were
collected directly from mayapple flowers. In contrast, a honeybee foraging on mayapple
was found to carry approximately 3600 pollen grains, and care was taken not to collect
pollen from her corbiculae for this sample.
Finally, several bumblebee queens approached mayapple flowers, hovering in
front of them without contacting them. This happened seven times over the three years of
the study: three times on 17 May 2005, once on 26 May 2005, once on 9 May 2006, once
on 17 May 2006, and once on 11 May 2007.
Overall, honeybees visited mayapple flowers on seven occasions, and bumblebees
visited mayapple flowers on four occasions and approached flowers without contacting
them on seven occasions. All honeybee visits occurred between 10:00 and 15:30 Eastern
Standard Time, all bumblebee visits between 11:00 and 14:00, and all bumblebee
approaches without contact between 11:30 and 16:30. Observers were present in the field
most frequently between 8:00 and 17:30 EST, with abrupt declines in observation effort
before and after those times.
The air temperature when honeybees were observed foraging on mayapple ranged
from 17.5° C to 23°C. Bumblebee visits to mayapple flowers occurred from 17.5° C to
21.5°C, while approaches without visiting occurred between 19°C to 26°C (however, no
temperature readings were made on 17 May 2005, when three approaches to flowers were
recorded). The mean air temperature recorded in the field was 17.9°C (+/- 0.5 °C, SE).
71
Honeybees visited mayapples between the eight and fifteenth days of the
flowering season, while bumblebees visited (i.e., contacted flowers) from the first to the
fourteenth day, with the one observed case of pollen foraging by a bumblebee occurring
on the fourteenth day of the 2006 mayapple flowering season. Bumblebees approached
mayapple without contacting them on the first day of the season in five cases, with the
other approaches occurring on the ninth and tenth days.
Between the sole occurrence of bumblebee foraging occurring on the fourteenth
day of the 2006 flowering season and the occurrence of all honeybee visits between the
eighth and fifteenth days of flowering, there was a significant tendency for foraging on
mayapple to occur later in the season than contacts without foraging or approaches
without contact (ANOVA: p = 0.005, F2 15 = 7.889). However, among bumblebees
alone, this change in behavior throughout the flowering season was not statistically
significant (p = 0.113, F2 8 = 2.895). Behavior at flowers was not affected by air
temperature (p = 0.624, F2 14 = 0.490) but was marginally affected by time of day (p =
0.098, F2 15 = 2.724), with approaches without contact tending to occur later in the day
than approaches with contact.
To see whether pollinators preferentially visited patches with certain
characteristics, I tested whether patches visited by honeybees or bumblebees differed
from unvisited patches in their floral neighborhoods, environments, or patch traits. The
leaf-area index above visited patches was lower (4.03 +/- 0.16, mean +/- SE) than above
other patches (4.35 +/- 0.07), and this difference was marginally significant (independent
samples t-test, p = 0.064, t71 = 1.885). Patches that were visited had more conspecific
neighboring flowers within five meters (14.4 +/- 4.2) than those that were not observed
receiving visits (5.4 +/- 1.3), and this difference was significant (p = 0.042, t46 = -2.094).
Not only did visited patches have more mayapple flowers nearby, they also bore more
flowers themselves (67.0 +/- 12.3) than patches not observed to receive visits (32.4 +/-
3.9), and this difference was highly statistically significant (p = 0.006, t71 = -2.825).
To determine whether observed pollinator visitation was related to pollination
success, I used t-tests to compare PLfruit and PLseed between patches that were visited and
those that for which no visits were observed and ANOVAs to test for effects of the
interaction between patch visitation (visited or not) and pollination treatment (control
72
versus outcross-supplemented) on fruit and seed set. However, no significant effects
were detected (all p > 0.12).
In 26 observations of wild geranium (2 in 2005 and 24 in 2006), the average
visitation rate was 1.9300 +/- 1.6678 visits per flower per hour (mean +/- SE). Andrenid
bees accounted for 49 of 51 visits observed in geranium, with a small beetle and a fly
accounting for the remaining two. Andrenids visited geraniums in four of the
observations, and the fly and beetle both visited in a single observation. The two
observations in 2005 included the fly/beetle observation and a later observation in which
29 andrenid visits were observed. When these unusual observations are excluded, the
2006 observations showed a visitation rate of 0.2449 +/- 0.1387 visits per flower per
hour, which is 5.4 times as great as mayapple’s visitation rate in 2006 (0.0457 +/- 0.0390,
including only a mosquito and a geometrid moth).
All observations of geraniums were conducted between 6:30 and 14:30. This was
not representative of the active period of andrenid bees, as all four andrenid visits that
occurred during the ten-minute observations occurred after 13:00. However, when all
observations of andrenid activity are considered, whether or not they were recorded
during ten-minute observation periods, activity occurred from 7:30 to 17:00.
Insect pollen loads
Only one mayapple pollen grain was detected on a bee not collected from
mayapple, and only two non-mayapple pollen grains (one Alliaria petiolata and one
Taraxacum officinale) were found on bees collected from mayapple (figure 3.1). Bees
collected from flowers generally bore large numbers of pollen grains belonging to the
species from which they were collected, but five bees caught on Geranium maculatum
and one caught on Elaeagnus umbellata carried little or no pollen from these species.
The nineteen bumblebee queens caught from the ground carried few pollen grains,
but these grains came from a wide variety of species. This diversity was a result of large
sample size; bees on flowers bore pollen from an average of 3.9 +/- 0.5 species (mean +/-
S. E., n = 14), while bees on the ground bore pollen from 3.2 +/- 0.5 species (n = 19), but
bees on flowers were subdivided by the species on which they were caught, with no more
73
than five bees being caught on a single species. The difference in pollen richness
between bees caught on flowers and those caught on the ground is not significant
(independent samples t-test, p = 0.345, df = 31, t = 1.003).
Bees caught on flowers carried more pollen grains per bee (586.9 +/- 233.5) than
those caught on the ground (27.2 +/- 11.8), and this difference was significant (p = 0.032,
df = 13.066, t = 2.394). (These pollen counts come from five transects per microscope
slide covering approximately 1/6 of the slide’s total area, and some pollen undoubtedly
remained on the bees after blotting with gelatin to produce the slides, so the actual
quantities of pollen carried were presumably at least six times as great as the numbers
reported.)
Discussion
Pollen limitation, pollinator visitation, and fragment size
As found in previous studies, fruit and seed set of mayapple were strongly limited
by pollen receipt in my study system. Overall seed production per flower was between
2.7 and 18 times as high in outcross-supplemented flowers as in control flowers,
depending on the year. All of these values are in the range of those obtained in previous
studies, conducted in Ohio (Whisler and Snow 1992), North Carolina (Motten 1986),
Wisconsin and Minnesota (Swanson and Sohmer 1976), Delaware (Rust and Roth 1981),
and on an island in Lake Ontario (Laverty and Plowright 1988, Laverty 1992). Based on
the results of these six studies, pollen limitation is consistent and severe in mayapple, at
least across the northern and eastern fringes of its range.
This severe pollen limitation reflects very low pollinator visitation rates, in my
study and in earlier studies. I found that mayapple received just 0.035 +/- 0.026 visits per
flower by bumblebees and honeybees. This rate is very similar to that recorded by
Laverty (1992), who observed 0.037 +/- 0.012 visits per flower per hour, Laverty and
Plowright (1988), who observed 0.057 +/- 0.030 visits per flower per hour. 79% of visits
to mayapple in Laverty’s (1992) study were conducted by Bombus vagans queens, but
only 37% of the visitors that I observed on mayapple were bumblebee queens of any
74
species, the rest being honeybee workers. The greater proportional visitation by
honeybees in my system may be explained by the presence of commercial beehives near
Site 4, but it is not clear why bumblebee queens had a lower absolute visitation rate in my
system than in Laverty’s (1992) system.
I predicted that pollen limitation would be lower for mayapple in larger, less
disturbed forest fragments, if forest disturbance and fragmentation decrease mayapple’s
pollination success by disrupting natural pollination networks in which it is involved.
Such an effect might explain why bumblebee visitation was higher in the fragment
studied by Laverty and Plowright (1988) and Laverty (1992), which was about 75 ha in
area, than in my Sites 1 through 5, which were on fragments each less than 40 ha in area.
If so, pollen limitation of fruit and seed set should have been lower in NWP, 100 ha in
area, than in my other study sites. This was not the case.
If natural pollinator networks in southeastern Michigan were sensitive to forest
fragmentation, these networks have been similarly disrupted in both small, highly
disturbed forest fragments and in slightly larger, less disturbed fragments. However, it is
more likely that mayapple would not have a high pollinator visitation rate even if its
habitat were pristine. Mayapple flowers remain intact and receptive for up to ten days, as
found in this study and by Swanson and Sohmer (1976); species with very low visitation
rates often have long-lived flowers, increasing the number of visits each flower receives
in its lifetime despite low visitation per hour (Rathcke 1988, Ashman and Schoen 1994).
In addition, the fitness of a mayapple plant is probably not highly sensitive to seed
production. The clones are long-lived (Bierzychudek 1982), and the fitness of seeds is
inhibited by limited fruit dispersal and high seedling mortality (Rust 1980). Thus,
selection may simply have favored clones that invested fewer resources in pollinator
rewards in favor of greater allocation to growth and survival.
Facilitation of mayapple pollination
The effects of co-flowering neighbors on mayapple’s fruit and seed set were
mostly insignificant, and no species had similar effects in all three years. Three taxa—
garlic mustard, spring beauty, and violets—significantly affected pollen limitation in

75
multiple regression models based on 2005 fecundity data, and only violets influenced
pollen limitation in 2007. Pollen limitation was not related to the abundances of nearby
flowers in 2006. Similarly, removing the flowers of neighboring plants in 2006 had no
significant effect on fruit or seed set, though both fruit set and seed set tended to be more
pollen-limited in the neighbor-removal patches. Garlic mustards negative effect on
mayapple’s pollination success and the facilitative effects of violets, based on fruit set,
were also seen in whole-site surveys of floral abundance. Mayapple’s fruit set was more
strongly pollen-limited in sites with more garlic mustard in 2005, and it tended to be less
pollen-limited in sites with more violets for all years pooled, if site 5 was excluded from
analysis. Pollen limitation of fruit set also declined with site mean abundance of
geranium in 2006 and for all three years pooled.
There are four likely explanations for the weak effects of heterospecific neighbors
on mayapple’s pollination success. (1) Positive effects of co-flowering neighbors on
mayapple’s visitation rate were negated by negative effects on ovule fertilization due to
heterospecific pollen transfer (HPT). (2) Mayapple’s visitation patterns were those of a
rewarding species. (3) The magnet species in this system were not attractive enough to
greatly influence mayapple’s visitation rate. (4) The magnet species were too diffusely
distributed to produce large variations in pollinator density, or similarly, pollinator
density did not vary substantially across the spatial scales used in this study. These
explanations are not mutually exclusive, and each probably contributed in reducing the
significance of my results.
The results of the HPT pollination treatments in 2006 demonstrate that other
species’ pollen potentially inhibits ovule fertilization by outcross pollen in mayapple.
Adding phlox pollen prior to outcrossing resulted in depressed fruit set relative to
outcrossing alone, but it did not affect seed set, and wild geranium pollen had no effect
on fruit set or seed set. Phlox pollen may have been a more effective inhibitor of
fertilization because of its small diameter relative to geranium pollen. Geranium pollen
grains were 60 to 100 microns in diameter, as opposed to 23 to 25 microns for phlox
pollen and 30 to 33 microns for mayapple pollen. Coarser pollen may interfere less
effectively with fertilization because there are larger gaps between pollen grains on a
stigma if the grains are quite large or because larger grains are more likely to be brushed

76
aside during subsequent hand-outcrossing. Consistent with the latter explanation, just 2.2
geranium pollen grains were counted per bee collected from geranium flowers,
suggesting that geranium pollen does not adhere well to the bodies of bees and may also
adhere poorly to mayapple stigmas.
The other three explanations for a weak magnet species effect in my system may
also explain why the previous study of pollination facilitation in mayapple detected
strong results in multiple years (Laverty and Plowright 1988, Laverty 1992). While the
dominant visitors to mayapple flowers in my system were honeybees that foraged for
pollen and found the flowers rewarding, the dominant visitors in their system were
bumblebee queens that foraged for nectar and found the flowers unrewarding. The
honeybees I collected from mayapple carried very little pollen from other species but
heavy loads of mayapple pollen. Those observed visiting mayapple visited many flowers
per patch and never switched to another species, similar to the behavior of honeybee
foragers on mayapple described by Laverty and Plowright (1988). In contrast,
bumblebee queens visiting mayapple flowers never visited many of them at a time, and
two of them switched between mayapple and wild geranium flowers, which was also
consistent with observations by Laverty and Plowright (1988), except that the bees in
their system switched between mayapple and common lousewort (Pedicularis canadensis
L., Scrophularicaceae), which was very rare in my system.
The potential magnet species in my system were either too uncommon to test for
their effects on mayapple pollination (e.g., lousewort) or too rarely visited by bumblebee
queens to strongly influence mayapple’s visitation rate (apparently true of all four species
tested). Garlic mustard and spring beauty were not expected to be effective magnets,
since bumblebee queens were seen very rarely on the former (as also observed by Cruden
et al. 1996) and never on the latter, but both geranium and violet were plausible potential
magnets, since both are visited by bumblebee queens and both offer nectar as a reward. I
observed 0.25 visits per flower per hour in wild geraniums. I did not conduct as many
ten-minute observations of violets, and I observed no visits during these observations, but
Laverty (1992) observed 0.71 visits per flower per hour to this taxon. Both of these
visitation rates are much higher than those recorded for mayapple (0.035-0.057
visits/flower/hour), but much lower than the visitation rate for lousewort in Laverty’s
77
(1992) study (3.53 visits/flower/hour). Also, none of the visitors recorded for wild
geranium were honeybees or bumblebees (though both taxa were collected from
geranium flowers), so this species may not have been visited by mayapple’s visitors
much more frequently than mayapple was.
The importance of magnet strength in explaining why my results were less
significant than those of the previous study is further demonstrated by removal
experiments conducted in this study and in Laverty’s (1992) study. I found that patches
from which I removed neighboring flowers within one meter had insignificantly higher
pollen limitation than those with neighboring flowers left in place. In contrast, Laverty
(1992) found that mayapples within 25 meters of louseworts from which he removed
flowers, unlike those with intact louseworts within 25 meters, did not have significantly
greater fruit set than mayapples over 50 meters from the nearest lousewort (he does not
say whether removal patches had significantly lower fruit set than patches with lousewort
flowers left in place within 25 meters). The great attractiveness to pollinators of
lousewort flowers relative to the flowers of the potential magnets in my system probably
explains the stronger effect of his removal treatments. However, given that I performed
my removal treatments in the year when neighbor abundance had the least effect on
pollen limitation, within just one meter of the manipulated patches, removing neighbors
that had both positive and negative effects on pollen limitation in other years, it may be
noteworthy that pollen limitation even showed a trend in the predicted direction.
Removing only facilitator species across a larger distance in a year when neighbor
abundance significantly influences mayapple pollination might have produced a
significant effect of removal.
All of the potential magnet species I tested were included in my analyses because
they were widespread and common, but this is also a reason to expect that they may not
greatly affect pollinator densities greatly. The abundances of spring beauty and garlic
mustard varied greatly among sites, so that some study patches were very far removed
from flowers of these species, but the distance from any study patch to the nearest violet
or geranium was rarely more than about 30 meters. Furthermore, geranium and violet
abundance were not positively correlated, so many patches that were far from one of
these taxa were nearby the other. In contrast, Laverty (1992) measured visitation, fruit
78
set, and seed set for mayapples within 25 meters of large patches of lousewort to the
same variables for patches over 50 meters from the nearest lousewort. The lousewort
itself was concentrated in the middle of their study site, while the potential magnets in my
system were scattered throughout most of the sites where they occurred.
Because mayapple’s pollination success is so low, I did not expect any species to
significantly depress it, yet the abundance of both garlic mustard and spring beauty were
related to high pollen limitation of fruit set. Garlic mustard is rarely visited by
mayapple’s major pollinators (Cruden et al. 1996), and I never saw honeybees or
bumblebees on spring beauty, making both competition for visits and HPT unlikely
mechanisms for their interactions with mayapple. Garlic mustard may negatively affect
mayapple’s pollination success through its effect on the visibility of mayapple flowers to
pollinators. Mayapple flowers are only visible from the side, beneath the leaf canopy of
the plant, and garlic mustard may simply block this view. In contrast, short-statured
plants such as violets and geraniums may facilitate mayapple pollination because their
flowers are at or below the height of mayapple flowers. Pollinators approaching or
departing from violets or geraniums would be well-positioned to perceive mayapple
flowers, or the presence of the flowers of short-statured plants may be correlated with the
absence of garlic mustard. The effect of spring beauty may be a byproduct of a positive
correlation between its abundance and that of garlic mustard (linear regression, p = 0.001,
adjusted R2 = 0.193, total df = 48).
Conspecific neighbors were not significant facilitators of mayapple pollination in
any of the regression models, at either the patch scale or the site scale. This result was
unexpected, since flowers produced by conspecific neighbors were expected to be a
source of compatible pollen and thus improve pollination quality. Conspecific neighbors
may not have been as beneficial to fecundity because (1) many patches may have been
polyclonal, providing a source of outcross pollen in patches that I assumed to be isolated
from other genets, and (2) neighboring ramets that appeared to belong to different genets
may have been part of genet in the study patch, thus providing self pollen when I
assumed that they were providing outcross pollen. Alternatively, conspecific neighbors
may have had little effect on receipt of compatible pollen. If visitation to each flower is
uncommon, pollen transfer between flowers of different genets may be quite rare.

79
Effects of edges and light on mayapple pollination success
I predicted that pollen would be less limiting to mayapple fecundity near forest
edges because forest edges are bright and warm, with high plant diversity (Chen et al.
1992, Matlack 1993, Fraver 1994), and many forest species flower in greater abundance
in bright microhabitats (Moore and Vankat 1986, Collins and Pickett 1988). This may
attract abundant and diverse pollinators. If so, and if the magnet species effect operates
because magnet species increase the local density of pollinators, mayapple should have
higher visitation near forest edges. This prediction was not supported; PLfruit and PLseed
did not varied significantly with distance only in regression models too large to be
considered meaningful. Pollen limitation of fruit and seed set declined with increasing
leaf-area index (i.e., patch shadiness), so pollinators apparently preferred well-lit
microenvironments, as expected. However, leaf-area index did not vary with distance to
the forest edge. This may mean that edges were not better-lit than forest interiors, though
leaf-area index measurements are more sensitive to light entering the understory from
above than from the side. The assumption that edges would have more flowers and
greater floral diversity was also not met, based on edge-to-interior floral surveys in 2005.
Pollinator abundance near the forest edge versus the interior was not quantified, but while
small-bodied pollinators appeared to be much more abundant near the edge and under
open canopy, there was no conspicuous relationship between the density of honeybees or
bumblebees and the brightness of the understory. Apparently, pollen limitation for
mayapple was not a function of distance from the forest edge because mayapple’s
pollinators were not more abundant near edges because edges did not have more open
canopies than interiors or because honeybees and bumblebees are both somewhat
endothermic and did not tend to aggregate in well-lit microenvironments as expected.
Pollinator behavior
Insects were seen to land or rest on mayapple flowers in 7 of 178 observation
periods. However, these visitors included some insects that were probably not
80
consistently recorded as visitors, such as mosquitoes and small beetles, while others that
were consistently noted were probably not effective pollinators, such as moths of the
species Tetracis cachexiata (Geometridae), a white moth occasionally found resting on
the floral parts of mayapple flowers. These moths were never observed to leave a
mayapple flower unless disturbed, and two specimens collected directly from mayapple
flowers bore very little pollen.
Honeybees were only observed visiting mayapples late in the mayapple flowering
season, after mayapple had been flowering for at least a week. In some mayapples, the
anthers do not dehisce and present pollen until several days into the flowering season
(pers. obs.). However, this probably does not explain the delay in pollen foraging by
honeybees. In other clones, the anthers dehisce before the flowers open. Thus, pollen
appears to be available on the first day of the flowering season, and increasingly so
through the first week, after which pollen availability appears to decline. I did not
quantify pollen availability, however, and it has not yet been determined whether the
quantity, quality, or accessibility of mayapple pollen as a food source changes during the
flowering season. The composition of mayapple pollen may change over time, or
mayapple flowers may become more appealing to honeybees’ innate aesthetics by the end
of the first week of flowering. For example, mayapple flowers may become more
fragrant, or their petals may produce or degrade pigments that are visible in the UV
portion of the bee visual spectrum. The lag between anthesis and earliest honeybee
visitation was not perfectly related to the minimum flight temperatures of honeybees.
The lowest temperature at which honeybees were observed foraging on mayapple was
17.5 degrees, but in all three years, air temperatures exceeded this about a week before
the first honeybee foragers were observed.
There was a strong tendency for bumblebee queens to approach flowers without
contact early in the flowering season. Bumblebees contacted mayapple stigmas without
landing both early and late in the flowering season, and the only bumblebee observed
foraging on mayapple visited very late in the flowering season in 2006. Thus, the longer
the flowering season progressed, the more closely bumblebee behavior toward mayapple
flowers resembled that of honeybees foraging for pollen, though this shift was not
statistically significant. This may indicate that bumblebees were increasingly likely to

81
forage for pollen as the season progressed, either because more bumblebee queens had
established nesting sites and required pollen for their brood or because mayapple pollen
became more usable as a resource as it aged. This could happen if podophyllotoxin
concentrations in pollen declined with pollen age, provided that bees are sensitive to this
particular poison. The tendency for approaches without contact to occur later in the day
than approaches with contact might be due to a learned association between unrewarding
flowers and mayapple’s scent (Gumbert and Kunze 2001, Kunze and Gumbert 2001),
which is stronger and can be detected at a greater distance, at least to the human nose,
when temperatures are warmer (pers. obs.).
Patches in which honeybee or bumblebee visits were observed had more
conspecific neighboring flowers and bore more flowers themselves than did patches that
were not observed to receive visits. This is consistent with the pollen foraging behavior
of the honeybees (and one bumblebee), since pollinators visit resource-dense patches
more frequently than resource-poor ones (Thomson 1981, Kunin 1993, Ohashi and
Yahara 2002, Feldman 2006). In contrast, visitation to an unrewarding flower is
expected to decline with the flower’s abundance (Ferdy et al. 1998, Castillo et al. 2002).
Pollen foragers represented a majority of the observed visitors to mayapple in this study,
and it is therefore not surprising that the overall pattern of visitation is more consistent
with what would be expected for rewarded pollinators than for unrewarded ones.
Alternatively, the greater mayapple floral abundance in and around the patches
that were visited could reflect a preference of bees for well-lit environments. The
canopies over patches in which visits were observed had marginally significantly lower
leaf-area indices than those over patches in which honeybees and bumblebees were never
observed to visit mayapple flowers. The number of flowers a patch produced was
significantly negatively correlated with leaf-area index, as well. Thus, the apparent
preference of pollinators for patches with many flowers could reflect a preference of
pollinators for well-lit patches coupled with the tendency for better-lit patches to bear
more flowers. However, this explanation does not seem likely, given that the difference
in leaf-area index between visited and unvisited patches was much less statistically
significant than the differences in patch flower number and the number of conspecific
neighboring flowers.
82
A third explanation for the relationships between large numbers of mayapple
flowers in the patch and within five meters, low leaf-area index, and higher probability of
observing honeybee and bumblebee visits is that rewarded pollinators found patches
more easily when flowers released fragrance when warmed by direct sunlight. Just as
mayapple’s scent may repel unrewarded pollinators, it may be used by pollen-foraging
bees to locate mayapple patches and flowers.
Mayapple’s effects on geranium pollination
The degree of pollen limitation for wild geranium plants was not significantly
affected by whether the nearest mayapple flowers were within five meters or over ten
meters away, and mayapple pollen added by hand did not significantly reduce geranium’s
fecundity relative to that obtained from outcross-supplementation alone. However,
among only those patches that had mayapple within five meters, flowers that received
hand-pollination with mayapple pollen prior to outcrossing did have significantly lower
seed set per fruit than flowers that were only outcrossed. The biological significance of
this difference in the effect of mayapple pollen on geranium seed set with proximity to
mayapple patches is challenging to imagine. Perhaps geraniums further from mayapple
were more likely to have already been pollinated naturally prior to hand-pollination.
Geranium flowers selected for hand-pollination were pollinated on the day their stigmas
opened, yet each of several stigmas I observed with a hand lens prior to pollination
already bore geranium pollen. If geraniums near mayapple were less likely to be
naturally pollinated prior to hand-pollination, pollen limitation should have been higher
for these flowers than for those far removed from mayapple. While there was a trend
toward greater pollen limitation of fruit set near mayapple, it was far from significant,
and fruit set was not significantly pollen-limited near mayapple.

83
Future directions
The magnet species effect, population growth, and individual fitness
The benefits of the magnet species effect for the population growth of the
beneficiary species are not understood. The effect has been documented in several
studies to date (Thomson 1978, Laverty 1992, Johnson et al. 2003, Juillet et al. 2007), but
few studies have evaluated whether facilitation of pollination results in an increase in
population growth or in the genetic fitness of the individual plant. Increased fecundity
may have some effect on population growth if the survival of early life-history stages
limits population growth, but if the survival of adults is more critical for population
growth, then increased fecundity will have little positive effect, and it may even decrease
population growth if survival trades off against fecundity. Future studies on facilitation
of pollinator visitaiton should consider the effect of improved pollinator visitaiton on
outcrossing rates and adult survival and not assume that increased fecundity will mean
increased fitness or population growth.
Would a mayapple plant that rewarded pollinators have higher fitness?
The cost of not rewarding pollinators seems clear; unrewarding species have low
visitation rates and low mating success relative to otherwise similar rewarding species
(Neiland and Wilcock 1998). However, the assumption that unrewarding species incur
this cost is underlain by the assumption that unrewarding species are just like rewarding
species, but without the rewards. However, rewardlessness may evolve and be
maintained only when rewarding pollinators results in very little or no increase in
fecundity (e.g., Ackerman 1986). A straightforward way to test whether unrewarding
species currently exist in environments in which pollinator rewards do not increase
fecundity is to add artificial nectar or nectaries to naturally rewardless flowers. Similarly,
removing pollinator rewards from rewarding species may reveal whether rewards
improve the fecundity of these species.
84
There is a shortcoming inherent to reward supplementation and removal
experiments, which is that they assess what the effect on fitness would be of producing
more or fewer pollinator rewards if doing so entailed no change in the allocation of
energy or other resources. The energetic costs of nectar production have been estimated
in a few species (Pleasants and Chaplin 1983, Harder and Barrett 1992), but it may be
impossible to determine how nectar-producing species would re-allocate their resources if
they became nectarless, how nectarless species would re-allocate resources to produce
nectar, and what net effect a change in nectar production would have on adult growth and
survival. While some species are polymorphic for nectar production (see Renner 2006
for review), rewarding and unrewarding morphs of these species co-occur in the same
populations, and the costs and benefits of reward production must be affected in
important ways by this difference in context from purely rewarding or purely
unrewarding species. Only in species whose natural populations vary greatly in their
ratio of rewarding to unrewarding morphs might the true costs of nectar production be
estimated. For example, while cardinal flower (Lobelia cardinalis L., Campanulaceae)
usually has nectar-rich flowers, at least one nectarless population has been found (Brown
and Kodric-Brown 1979). Some insight into the costs of nectar production in this species
might be gained by comparing the fitness of plants in this population to that of plants in
nectar-producing populations and by conducting reciprocal transplant or common garden
experiments to determine the conditions under which nectar-producing or nectarless
morphs have a fitness advantage.
Is the magnet species effect a random and meaningless phenomenon?
As described above, several studies have documented clearly that unrewarding
species may benefit from the magnet species effect. This is a curious phenomenon in its
own right, but the relevance of the magnet species effect to anything else is not made
obvious by the mere fact of its existence. Thus far, it has been neither suggested nor
demonstrated that this form of facilitation is typical for unrewarding species, that it
affects the reproduction of any rewarding species, or that it has any predictable influence
on the evolution of a species. This may explain why, despite the existence of several
85
empirical tests of the magnet species effect (Thomson 1978, Laverty and Plowright 1988,
Laverty 1992, Gumbert and Kunze 2001, Johnson et al. 2003, Juillet et al. 2007), the
theory behind it has not yet developed beyond Thomson’s (1978) verbal model. To date,
the magnet species effect seems to have been taken as something that occurs sometimes
when a highly attractive species and a less attractive species happen to co-flower in close
proximity. Perhaps it is time to ask not only whether the magnet species effect occurs,
but when it can be expected to occur and how it can be expected to influence the
evolutionary trajectories of the species involved.
Predicting the occurrence of the magnet species effect would be trivial were it not
for the fact that it was initially proposed to explain the behavior of pollinators on two
rewarding species of Hieracium (Thomson 1978). Every subsequent demonstration of
this effect has involved an unrewarding species and one or more rewarding species
(Laverty and Plowright 1988, Laverty 1992, Johnson et al. 2003, Juillet et al. 2007),
including the present study, which might suggest that it is relevant only to unrewarding
species. If, however, a highly attractive species of Hieracium can increase the visitation
rate of a slightly less attractive species of Hieracium that co-flowers with it, then the
magnet species effect apparently occurs in at least some cases where asymmetrical
competition for pollinator visits might be predicted instead. What determines whether
facilitation or competition occurs? Relevant factors can be proposed, of course. Perhaps
facilitation is more likely if the species in question have similar colors in the visual
systems of their pollinators (Gumbert and Kunze 2001, Kunze and Gumbert 2001,
Galizia et al. 2005). Perhaps competition for pollinator visits is more likely when the
relevant pollinators are relatively scarce (Tepedino and Stanton 1981, Klein et al. 2003)
or when population densities are high (Kunin 1997). However, until the theory and
empirical study of the magnet species effect proceeds beyond its absence or presence in a
system, the occurrence of the magnet species effect will remain unpredictable, beyond its
likely relevance to any unrewarding flowering plant species.
This leaves the question of the evolutionary implications of the magnet species
effect. For unrewarding species, there is one obvious implication, namely that facilitation
of pollination by rewarding neighbors reduces the costs of being unrewarding and
therefore reduces selection for reward provisioning. Similarly, selection may favor

86
mimicry of rewarding neighbors by unrewarding species. However, many species lack
the morphological variation to evolve mimicry of their rewarding neighbors, and the
direction of selection may be too variable to result in resemblance to any one model.
How facilitation of visitation by rewarding neighbors affects the evolution of
unrewarding species undoubtedly depends on the facilitating species and their similarities
to each other and to the unrewarding species. The question of the evolutionary
implications of the magnet species effect is further complicated by its occurrence in
rewarding species. In general, selection favors a degree of distinctiveness in rewarding
species to promote pollinator constancy (Kunze and Gumbert 2001); does this rule of
thumb break down when one rewarding species’ pollinator visitation is promoted by
another species?
Theory has not come so far as to speculate how the magnet species effect might
favor the evolution of rewardlessness. I would argue that the presence of abundant
neighbors with rich pollinator rewards may favor evolution toward rewardlessness in a
less-rewarding species that does not compete effectively with these neighbors for
pollinator service. Individuals of a species that consistently loses in competition for
pollination may sacrifice little fecundity by investing less in rewards and gain little by
investing more, within the range of the species’ variation in reward provisioning
strategies. If the fitness costs of allocating resources to reward provisioning change more
rapidly with changes in allocation to rewards than do the benefits, selection will favor
diminished reward provisioning. Thus, interactions with superior competitors for
pollinator attention potentially promote and maintain rewardlessness as a reproductive
strategy.
Is mayapple truly and consistently unrewarding?
It is possible that mayapple is not consistently unrewarding to bumblebee queens.
Honeybees make regular use of its pollen (Laverty and Plowright 1988, and personal
observation). I observed one bumblebee queen gathering mayapple pollen from a single
flower, interrupting a foraging bout on wild geranium. Two other queens contacted
several mayapple flowers that had indehiscent anthers, briefly grappling the stigma with
87
their forelegs, without attempting to gather nectar or pollen. These queens may have
simply proceeded further than others I observed along the behavioral pathway for nectar
gathering before recognizing the unrewarding flower, or they may have been seeking
pollen and been unable to determine that it was absent before contacting the flowers.
Most of the bumblebee queens I observed were not foraging on flowers, but searching for
nest sites. Bumblebee queens do not require pollen until they have a nest; adults do not
consume pollen, but it is an important nutrient source for developing brood.
Alternatively, rewardlessness in mayapple may be favored due to its effects on the
frequency of outcross pollination relative to geitonogamy. Mayapple lacks the
adaptations to low pollinator constancy that are evident in the Orchidaceae (though it
does have long-lived flowers), but since it is both extensively clonal and self-
incompatible, it may be advantageous for a mayapple genet to encourage bees to fly to
other patches without visiting many flowers. A bee that finds mayapple rewarding will
visit many flowers, but much of the pollen it deposits on stigmas will be self pollen. In
contrast, an unrewarded pollinator will engage in long inter-floral flight distances
promoting outcrossing (Laverty and Plowright 1988). One test of the hypothesis that
rewardlessness is favored in mayapple because it reduces geitonogamy would be a nectar
addition experiment, as suggested above. A patch with artificial nectar in its flowers
should have lower fruit and seed set, or lower overall offspring fitness, than an
unmanipulated patch.
Other effects on pollinator abundance and, hence, pollination success
The magnet species hypothesis proposes that highly attractive flowering plants
increase the visitation rate of their less attractive neighbors by drawing a greater number
of pollinators to their vicinity than would otherwise congregate there (Thomson 1978),
but rewarding flowers are not alone in promoting the aggregation of pollinators. Among
the motivations of this study was the hypothesis that, all else being equal, pollinators in
forest habitats in cool weather would preferentially forage in well-lit microhabitats to
minimize the risk of being forced to cease foraging by becoming too cold to fly. This
hypothesis was not supported for mayapple’s pollinators, but andrenid and halictid bees

88
and bombylid flies were conspicuously more active in well-lit patches of Claytonia
virginica, Geranium maculatum, and Alliariai petiolata than in shady patches.
Pollinators may also aggregate near water sources, nesting sites, breeding grounds, or
aggregations of prey species (some plants are pollinated by wasps). Pollination of
carrion-mimicking flowers may be related to the local abundance of carrion, in a manner
very analogous to the magnet species effect.
In many cases, the local abundance of non-floral resources may be more difficult
to determine than the abundance of floral resources. Bumblebee nests are notably
difficult to locate, partly because of the bees’ aversion to foraging very near the nest
(Dramstad et al. 2003). Nests of solitary bees that do not have highly aggregated nesting
sites could be even more difficult to locate, since only one bee uses the nest, and many
solitary bees construct multiple nests in a season (Krombein 1967, Wcislo and Cane
1996). Certainly, potential nest sites must be even more difficult to identify, as would be
potential breeding grounds. However, very large aggregations of nesting sites for solitary
bees are sometimes quite easy to locate (Wcislo and Cane 1996), and larger aggregations
are more likely to have detectable effects on the pollination success of plants. Thus, a
preliminary study of the effects of nest sites, or anything else that causes pollinators to
aggregate, on pollination success should begin by locating pollinator aggregations and
then proceed to testing for effects of distance from the aggregations on pollen limitation,
competition among pollinators, or other phenomena of interest.
Conclusions
In contrast to a previous study on pollination facilitation in mayapple, I found that
the effects of mayapple’s neighbors on its pollination success were weak in most years
and inconsistent from year to year. Accordingly, neighbor removal experiments had no
significant effect on the pollen limitation of mayapple patches. However, based on the
relationship between pollen limitation of fruit set and the floral abundances of co-
flowering species both within five meters of my study patches and along edge-to-interior
sampling transects for entire study sites, garlic mustard has a negative effect on
mayapple’s pollination success, while violets have a positive effect. Wild geranium had

89
a weak positive effect, and spring beauty had a weak negative effect, but both species’
effects are potentially due to correlations between their abundances and the abundance of
garlic mustard. Pollination facilitation may have been weaker in this study than in a
previously published study because the magnet species in this system were less attractive
and more diffusely distributed, because positive effects through increased visitation were
negated by negative effects through interspecific pollen transfer, or because most visitors
to mayapple foraged for pollen, moving strictly within the species instead of moving
between neighboring flowers and mayapple flowers.
Contrary to expectation, mayapple’s pollination success was not related to the
number of conspecific flowers present on neighbors within five meters of a patch. This
may be due to difficulties in determining whether nearby ramets belonged to different
genets, or it may be that mayapple’s low visitation rate prevents nearby compatible mates
from promoting its reproductive success substantially.
It is possible that heterospecific pollen receipt negatively affects the ability of
mayapple pollen to fertilize ovules. Wild geranium pollen did not interfere with outcross
pollination success, but hand-pollination with phlox pollen prior to outcrossing depressed
outcross fruit set.
Very few studies on pollination facilitation consider interactions in two directions,
though an understanding of the two-way interaction is necessary to understand the
ecological and evolutionary implications. I tested whether mayapple affected the
pollination success of wild geranium and whether mayapple pollen potentially interferes
with the ability of geranium pollen to fertilize ovules. Pollen limitation for geranium was
insignificantly higher within five meters of a mayapple patch than over ten meters from
the nearest one. Hand-pollination with mayapple pollen did not significantly depress
fruit or seed set for wild geranium overall, but it did depress fruit set for geraniums
growing within five meters of a mayapple patch, possibly because these geranium
flowers were less likely to have been naturally pollinated prior to hand-pollination.
I predicted that pollinators would be more abundant near forest edges and that
mayapple’s fecundity would therefore be less pollen-limited near edges, but I did not find
this to be the case. This may be because mayapple’s pollinators were not highly sensitive
to the difference in air temperature between forest edges and forest interiors.
90
Future studies on the magnet species effect should investigate its relevance to
rewarding species and to the evolution of rewardlessness. It is possible that mayapple in
my system did not benefit greatly from the magnet species effect precisely because it was
rewarding to most of its visitors. Whether pollinators find mayapple unrewarding in most
systems in most years should be investigated more thoroughly. In addition, the effects of
other factors that influence pollinator density should be investigated for their effects on
the pollination success of unrewarding plants.

91
Factor 2005 2006 2007Fruit Seed Fruit Seed Fruit Seed
Alliaria + 6 (5) (+ 1) + 1 / 6Claytonia + 2 / 4 (+ 1) / 3 (– 1) + 1 / 4Geranium + 1 (2) (– 1) – 1 / 7 (+ 1) / 6Viola – 3 + 6 / 6 (+ 1) – 3 (0) / 7 – 2 / 6Podophyllum in (– 1) + 2 / 6 (+ 1) – 6 (3) / 7 – 1 / 6Podophyllum outRamet height + 1 (0) – 1 / 6 (– 5)Flower diameter (– 1) / 4Anther number + 1 / 4Edge (– 1) + 1 (– 1) + 1 (0) / 7LAI – 1 / 6 + 8 (4) – 1 (0) – 3 (1) / 6Soil carbon – 1 – 3 / 6 + 1 (0) / 7 (– 1) / 6Soil texture + 3 / 4 + 1 / 4 (+ 1) / 4Site mean PL (+ 1) (+ 8) (+ 6) / 7 (– 1) / 6
Table 3.1: Number of final models from backward and forward stepwise regressions that included each variable (rows) to explain variation in pollen limitation of fruit set and seed set in each year (columns). In each cell, the direction of the effect of each variable on pollen limitation is indicated by + or –. The number of models that included that variable when site mean pollen limitation was not part of the initial regression model follows. If this number was different when site mean pollen limitation was included, it is followed by the number of models in which the variable was included when site mean pollen limitation was included, in parentheses (e.g., “– 6 (3)”). In most cases, a variable could be included in up to eight models. If the maximum possible number of models was less than eight, this is indicated by a slash and the maximum number of models (e.g., “– 3 / 6”)

92
Figure 3.1: Pollen transport web based on honeybees and bumblebees collected in 2006 and 2007. Taxa listed across the bottom are plant species whose pollen was found on the collected bees. Taxa across the top (including “Ground”) are taxa from which bees were collected. The width of each bar is proportional to the square root of the average number of pollen grains of each plant taxon (bottom) found on honeybees, bumblebee queens, or a bumblebee worker collected from each taxon or the ground (top).
92
93
Literature cited
Ackerman, J. D. 1986. Mechanisms and evolution of food-deceptive pollination systems in orchids. Lindleyana 1:108-113.
Anderson, B. and S. D. Johnson. 2006. The effects of floral mimics and models on each others' fitness. Proceedings of the National Academy of Sciences 273:969-974.
Ashman, T.-L. and D. J. Schoen. 1994. How long should flowers live? Nature 371:788-791.
Bierzychudek, P. 1982. Life histories and demography of shade-tolerant temperate forest herbs: a review. New Phytologist 90:757-776.
Bouyoucos, G. J. 1936. Directions for making mechanical analyses of soils by the hydrometer method. Soil Science 42:225-230.
Brown, J. H. and A. Kodric-Brown. 1979. Convergence, competition, and mimicry in a temperate community of hummingbird-pollinated flowers. Ecology 60:1022-1035.
Castillo, R. A., C. Cordero, and C. A. Domínguez. 2002. Are reward polymorphisms subject to frequency- and density-dependent selection? Evidence from a monoecious species pollinated by deceit. Journal of Evolutionary Biology 15:544-552.
Chen, J., J. F. Franklin, and T. A. Spies. 1992. Vegetation responses to edge environments in old-growth Douglas-fir forests. Ecological Applications 2:387-396.
Chen, J., J. F. Franklin, and T. A. Spies. 1995. Growing-season microclimatic gradients from clearcut edges into old-growth Douglas-fir forests. Ecological Applications 5:74-86.
Collins, B. S. and S. T. A. Pickett. 1988. Response of herb layer cover to experimental canopy gaps. American Midland Naturalist 119:282-290.
Cruden, R. W., A. M. McClain, and G. P. Shrivastava. 1996. Pollination biology and breeding system of Alliaria petiolata (Brassicaceae). Bulletin of the Torrey Botanical Club 123:273-280.
Dramstad, W. E., G. L. A. Fry, and M. J. Schaffer. 2003. Bumblebee foraging--is closer really better? Agriculture, Ecosystems and Environment 95:349-357.
Feldman, T. S. 2006. Pollinator aggregative and functional responses to flower density: does pollinator response to patches of plants accelerate at low-densities? Oikos 115:128-140.
Ferdy, J.-B., P.-H. Gouyon, J. Moret, and B. Godelle. 1998. Pollinator behavior and deceptive pollination: learning process and floral evolution. The American Naturalist 152:696-705.
Fraver, S. 1994. Vegetation responses along edge-to-interior gradients in the mixed hardwood forests of the Roanoke River Basin, North Carolina. Conservation Biology 8:822-832.
Galizia, C. G., J. Kunze, A. Gumbert, A.-K. Borg-Karlson, S. Sachse, C. Markl, and R. Menzel. 2005. Relationship of visual and olfactory signal parameters in a food-deceptive flower mimicry system. Behavioral Ecology 16:159-168.
94
Gumbert, A. and J. Kunze. 2001. Colour similarity to rewarding model plants affects pollination in a food deceptive orchid, Orchis boryi. Biological Journal of the Linnean Society 72:419-433.
Harder, L. D. and S. C. H. Barrett. 1992. The energy cost of bee pollination forPontederia cordata (Pontederiaceae). Functional Ecology 6:226-244.
Harder, L. D. and S. D. Johnson. 2008. Function and evolution of aggregated pollen in angiosperms. International Journal of Plant Sciences 169:59-78.
Herrera, C. M. 1995. Floral biology, microclimate, and pollination by ectothermic bees in an early-blooming herb. Ecology 76:218-228.
Johnson, S. D. 2000. Batesian mimicry in the non-rewarding orchid Disa pulchra, and its consequences for pollinator behaviour. Biological Journal of the Linnean Society 71:119-132.
Johnson, S. D., C. I. Peter, A. Nilsson, and J. Ågren. 2003. Pollination success in a deceptive orchid is enhanced by co-occurring rewarding magnet plants. Ecology 84:2919-2927.
Juillet, N., M. A. Gonzalez, P. A. Page, and L. D. B. Gigord. 2007. Pollination of the European food-deceptive Traunsteinera globosa (Orchidaceae): the importance of nectar-producing neighbouring plants. Plant Systematics and Evolution 265:123-129.
Kearns, C. A. and D. W. Inouye. 1993. Techniques for Pollination Biologists. The University Press of Colorado, Niwot, CO.
Klein, A.-M., I. Steffan-Dewenter, and T. Tscharntke. 2003. Fruit set of highland coffee increases with the diversity of pollinating bees. Proceedings of the Royal Society of London. Series B, Biological Sciences 270:955-961.
Krombein, K. V. 1967. Trap-nesting Wasps and Bees: Life Histories, Nests, and Associates. Smithsonian Press, Washington, DC.
Kunin, W. E. 1993. Sex and the single mustard: population density and pollinator behavior effects on seed-set. Ecology 74:2145-2160.
Kunin, W. E. 1997. Population size and density effects in pollination: pollinator foraging and plant reproductive success in experimental arrays of Brassica kaber. Journal of Ecology 85:225-234.
Kunze, J. and A. Gumbert. 2001. The combined effect of color and odor on flower choice behavior of bumble bees in flower mimicry systems. Behavioral Ecology 12:447-456.
Laverty, T. M. 1992. Plant interactions for pollinator visits: a test of the magnet species effect. Oecologia 89:502-508.
Laverty, T. M. and R. C. Plowright. 1988. Fruit and seed set in mayapple (Podophyllum peltatum): influence of intraspecific factors and local enhancement near Pedicularis canadensis. Canadian Journal of Botany 66:173-178.
Matlack, G. R. 1993. Microenvironment variation within and among forest edge sites in the eastern United States. Biological Conservation 66:185-194.
Moore, M. R. and J. L. Vankat. 1986. Responses of the herb layer to the gap dynamics of a mature beech-maple forest. American Midland Naturalist 115:336-347.
Motten, A. F. 1986. Pollination ecology of the spring wildflower community of a temperate deciduous forest. Ecological Monographs 56:21-42.
95
Neiland, M. R. M. and C. Wilcock. 1998. Fruit set, nectar reward, and rarity in the Orchidaceae. American Journal of Botany 85:1657-1671.
Nilsson, A. 1992. Orchid pollination biology. Trends in Ecology & Evolution 7:255-259.Ohashi, K. and T. Yahara. 2002. Visit larger displays but probe proportionally fewer
flowers: counterintuitive behaviour of nectar-collecting bumble bees achieves an ideal free distribution. Functional Ecology 16:492-503.
Pleasants, J. M. and S. J. Chaplin. 1983. Nectar production rates of Asclepias quadrifolia: causes and consequences of individual variation. Oecologia 59:232-238.
Policansky, D. 1983. Patches, clones and self-fertility of mayapples (Podophyllum peltatum L.). Rhodora 85:253-256.
Rathcke, B. 1983. Competition and facilitation among plants for pollination. Pages 305-329 in L. Real, editor. Pollination Biology. Academic Press, Inc., Orlando, FL.
Rathcke, B. 1988. Interactions for pollination among coflowering shrubs. Ecology 69:446-457.
Renner, S. S. 2006. Rewardless flowers in the angiosperms and the role of insect cognition in their evolution. Pages 123-144 in N. M. Waser and J. Ollerton, editors. Plant-Pollinator Interactions: From Specialization to Generalization. University of Chicago Press, Chicago.
Rust, R. W. 1980. Pollen movement and reproduction in Arisaema triphyllum. Bulletin of the Torrey Botanical Club 107:539-542.
Rust, R. W. and R. R. Roth. 1981. Seed production and seedling establishment in the mayapple, Podophyllum peltatum L. American Midland Naturalist 105:51-60.
Swanson, S. D. and S. H. Sohmer. 1976. The biology of Podophyllum peltatum L. (Berberidaceae), the may apple. II. The transfer of pollen and success of sexual reproduction. Bulletin of the Torrey Botanical Club 103:223-226.
Tepedino, V. J. and N. L. Stanton. 1981. Diversity and competition in bee-plant communities on short-grass prairie. Oikos 36:35-44.
Thomson, J. D. 1978. Effects of stand composition on insect visitation in two-species mixtures of Hieracium. American Midland Naturalist 100:431-440.
Thomson, J. D. 1981. Spatial and temporal components of resource assessment by flower-feeding insects. Journal of Animal Ecology 50:49-59.
Walkley, A. and I. A. Black. 1934. An examination of the Degtjareff method for determining soil organic matter, and a proposed modification of the chromic acid titration method. Soil Science 37:29-38.
Wcislo, W. T. and J. H. Cane. 1996. Floral resource utilization by solitary bees (Hymenoptera: Apoidea) and exploitation of their stored foods by natural enemies. Annual Review of Entomology 41:257-286.
Whisler, S. L. and A. A. Snow. 1992. Potential for the loss of self-incompatibility in pollen-limited populations of mayapple (Podophyllum peltatum). American Journal of Botany 79:1273-1278.
96
Appendix to Chapter 3
Tables of regression models
Tables A.1 through A.4 below show the results of backward and forward stepwise
regression models of PLfruit (pollen limitation of fruit set per flower) and PLseed (pollen
limitation of seed set per fruit) as functions of neighborhood floral abundances,
environmental variables, and the vegetative and floral traits of the patches.
The methods behind the models are explained in detail, and their results
summarized, in Chapter III, but I present brief explanations here and in the legends of the
tables.. For each year, models were generated for early- and late-season floral
abundances, including and excluding variables that were not measured in all patches, and
including and excluding site mean pollen limitation as a factor. Only sites 1 – 5 were
studied in 2005. The Nan Weston Preserve at Sharon Hollow was added in 2006. In
2007, site 5 was removed from the study.
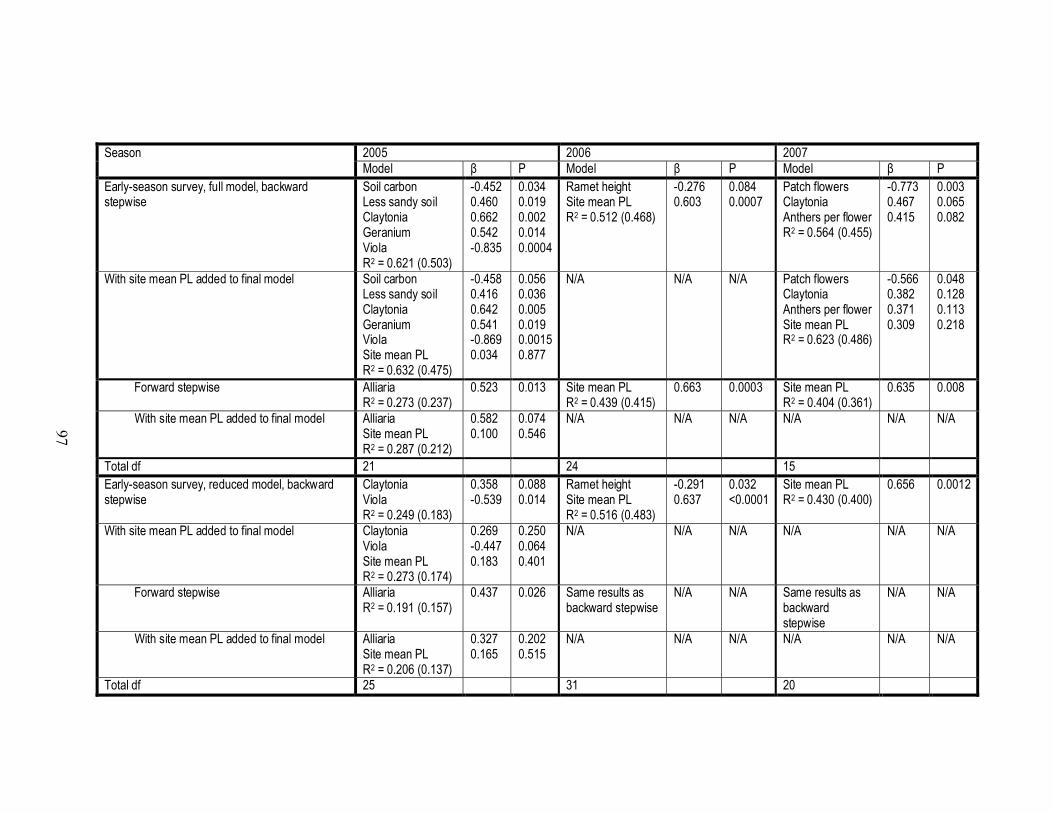
97
2005 2006 2007SeasonModel β P Model β P Model β P
Early-season survey, full model, backward stepwise
Soil carbonLess sandy soilClaytoniaGeraniumViolaR2 = 0.621 (0.503)
-0.4520.4600.6620.542-0.835
0.0340.0190.0020.0140.0004
Ramet heightSite mean PLR2 = 0.512 (0.468)
-0.2760.603
0.0840.0007
Patch flowersClaytoniaAnthers per flowerR2 = 0.564 (0.455)
-0.7730.4670.415
0.0030.0650.082
With site mean PL added to final model Soil carbonLess sandy soilClaytoniaGeraniumViolaSite mean PLR2 = 0.632 (0.475)
-0.4580.4160.6420.541-0.8690.034
0.0560.0360.0050.0190.00150.877
N/A N/A N/A Patch flowersClaytoniaAnthers per flowerSite mean PLR2 = 0.623 (0.486)
-0.5660.3820.3710.309
0.0480.1280.1130.218
Forward stepwise AlliariaR2 = 0.273 (0.237)
0.523 0.013 Site mean PLR2 = 0.439 (0.415)
0.663 0.0003 Site mean PLR2 = 0.404 (0.361)
0.635 0.008
With site mean PL added to final model AlliariaSite mean PLR2 = 0.287 (0.212)
0.5820.100
0.0740.546
N/A N/A N/A N/A N/A N/A
Total df 21 24 15Early-season survey, reduced model, backward stepwise
ClaytoniaViolaR2 = 0.249 (0.183)
0.358-0.539
0.0880.014
Ramet heightSite mean PLR2 = 0.516 (0.483)
-0.2910.637
0.032<0.0001
Site mean PLR2 = 0.430 (0.400)
0.656 0.0012
With site mean PL added to final model ClaytoniaViolaSite mean PLR2 = 0.273 (0.174)
0.269-0.4470.183
0.2500.0640.401
N/A N/A N/A N/A N/A N/A
Forward stepwise AlliariaR2 = 0.191 (0.157)
0.437 0.026 Same results as backward stepwise
N/A N/A Same results as backward stepwise
N/A N/A
With site mean PL added to final model AlliariaSite mean PLR2 = 0.206 (0.137)
0.3270.165
0.2020.515
N/A N/A N/A N/A N/A N/A
Total df 25 31 20
97
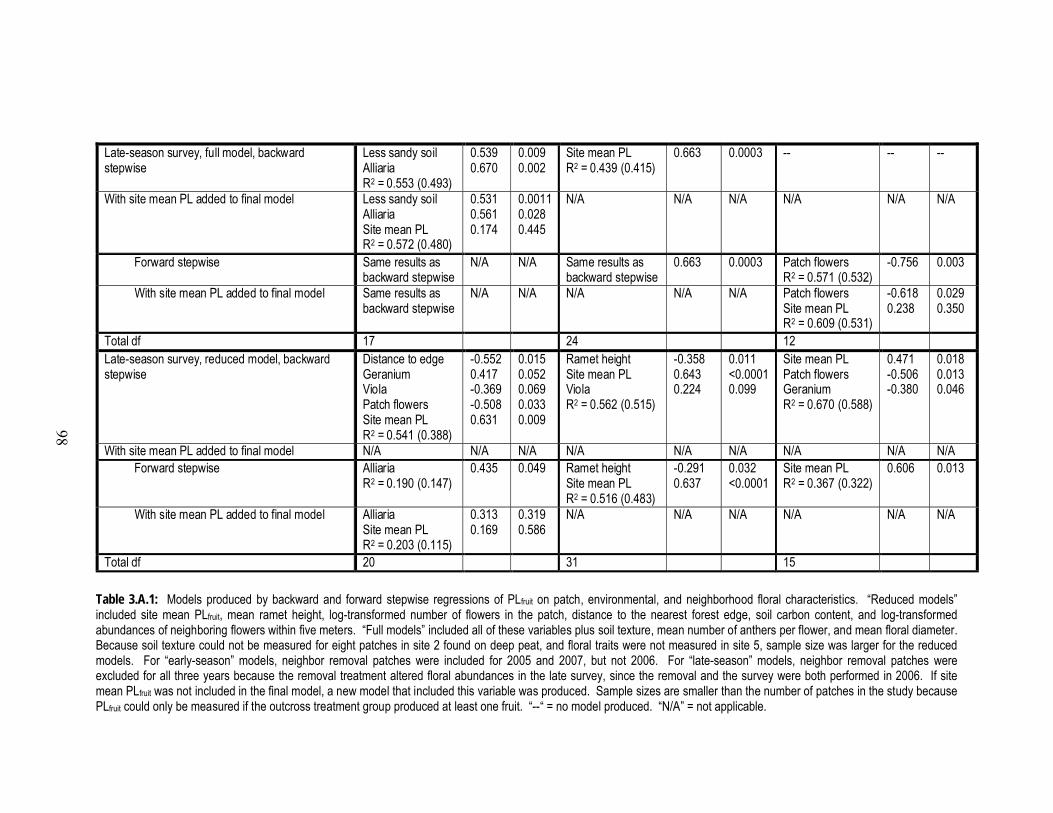
98
Late-season survey, full model, backward stepwise
Less sandy soilAlliariaR2 = 0.553 (0.493)
0.5390.670
0.0090.002
Site mean PLR2 = 0.439 (0.415)
0.663 0.0003 -- -- --
With site mean PL added to final model Less sandy soilAlliariaSite mean PLR2 = 0.572 (0.480)
0.5310.5610.174
0.00110.0280.445
N/A N/A N/A N/A N/A N/A
Forward stepwise Same results as backward stepwise
N/A N/A Same results as backward stepwise
0.663 0.0003 Patch flowersR2 = 0.571 (0.532)
-0.756 0.003
With site mean PL added to final model Same results as backward stepwise
N/A N/A N/A N/A N/A Patch flowersSite mean PLR2 = 0.609 (0.531)
-0.6180.238
0.0290.350
Total df 17 24 12Late-season survey, reduced model, backward stepwise
Distance to edgeGeraniumViolaPatch flowersSite mean PLR2 = 0.541 (0.388)
-0.5520.417-0.369-0.5080.631
0.0150.0520.0690.0330.009
Ramet heightSite mean PLViolaR2 = 0.562 (0.515)
-0.3580.6430.224
0.011<0.00010.099
Site mean PLPatch flowersGeraniumR2 = 0.670 (0.588)
0.471-0.506-0.380
0.0180.0130.046
With site mean PL added to final model N/A N/A N/A N/A N/A N/A N/A N/A N/A Forward stepwise Alliaria
R2 = 0.190 (0.147)0.435 0.049 Ramet height
Site mean PLR2 = 0.516 (0.483)
-0.2910.637
0.032<0.0001
Site mean PLR2 = 0.367 (0.322)
0.606 0.013
With site mean PL added to final model AlliariaSite mean PLR2 = 0.203 (0.115)
0.3130.169
0.3190.586
N/A N/A N/A N/A N/A N/A
Total df 20 31 15
Table 3.A.1: Models produced by backward and forward stepwise regressions of PLfruit on patch, environmental, and neighborhood floral characteristics. “Reduced models” included site mean PLfruit, mean ramet height, log-transformed number of flowers in the patch, distance to the nearest forest edge, soil carbon content, and log-transformed abundances of neighboring flowers within five meters. “Full models” included all of these variables plus soil texture, mean number of anthers per flower, and mean floral diameter. Because soil texture could not be measured for eight patches in site 2 found on deep peat, and floral traits were not measured in site 5, sample size was larger for the reduced models. For “early-season” models, neighbor removal patches were included for 2005 and 2007, but not 2006. For “late-season” models, neighbor removal patches were excluded for all three years because the removal treatment altered floral abundances in the late survey, since the removal and the survey were both performed in 2006. If site mean PLfruit was not included in the final model, a new model that included this variable was produced. Sample sizes are smaller than the number of patches in the study because PLfruit could only be measured if the outcross treatment group produced at least one fruit. “--“ = no model produced. “N/A” = not applicable.
98
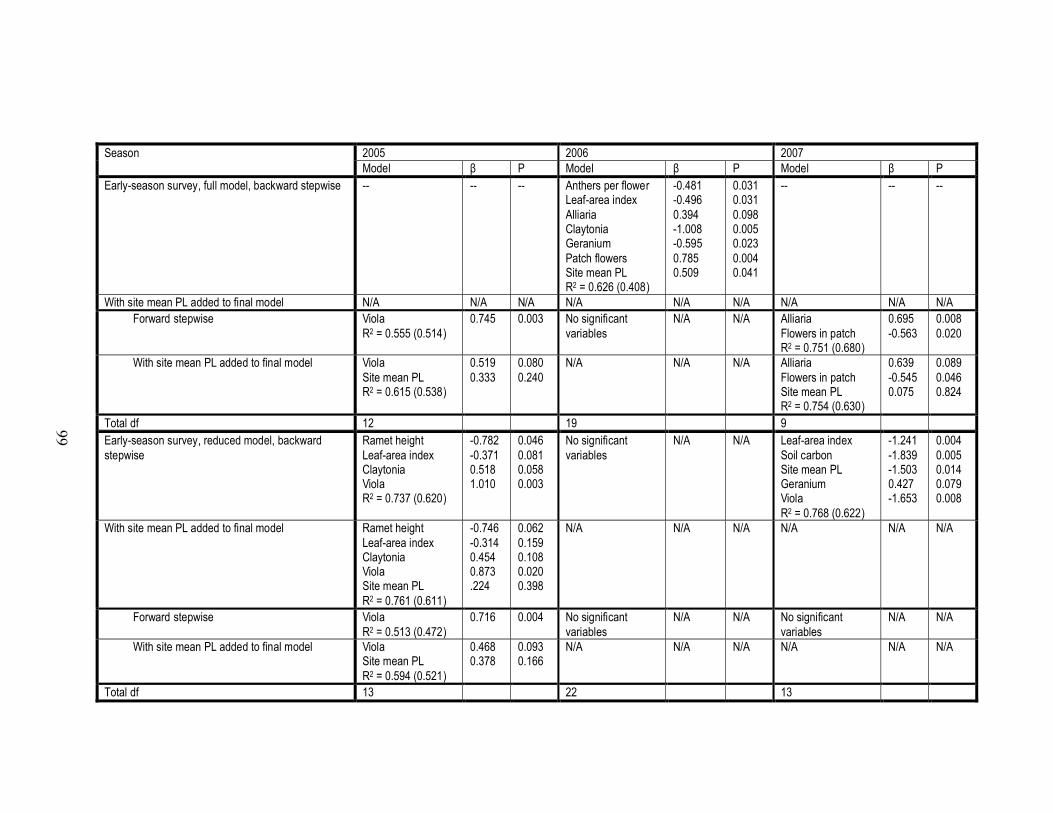
99
2005 2006 2007SeasonModel β P Model β P Model β P
Early-season survey, full model, backward stepwise -- -- -- Anthers per flowerLeaf-area indexAlliariaClaytoniaGeraniumPatch flowersSite mean PLR2 = 0.626 (0.408)
-0.481-0.4960.394-1.008-0.5950.7850.509
0.0310.0310.0980.0050.0230.0040.041
-- -- --
With site mean PL added to final model N/A N/A N/A N/A N/A N/A N/A N/A N/A Forward stepwise Viola
R2 = 0.555 (0.514)0.745 0.003 No significant
variablesN/A N/A Alliaria
Flowers in patchR2 = 0.751 (0.680)
0.695-0.563
0.0080.020
With site mean PL added to final model ViolaSite mean PLR2 = 0.615 (0.538)
0.5190.333
0.0800.240
N/A N/A N/A AlliariaFlowers in patchSite mean PLR2 = 0.754 (0.630)
0.639-0.5450.075
0.0890.0460.824
Total df 12 19 9Early-season survey, reduced model, backward stepwise
Ramet heightLeaf-area indexClaytoniaViolaR2 = 0.737 (0.620)
-0.782-0.3710.5181.010
0.0460.0810.0580.003
No significant variables
N/A N/A Leaf-area indexSoil carbonSite mean PLGeraniumViolaR2 = 0.768 (0.622)
-1.241-1.839-1.5030.427-1.653
0.0040.0050.0140.0790.008
With site mean PL added to final model Ramet heightLeaf-area indexClaytoniaViolaSite mean PLR2 = 0.761 (0.611)
-0.746-0.3140.4540.873.224
0.0620.1590.1080.0200.398
N/A N/A N/A N/A N/A N/A
Forward stepwise ViolaR2 = 0.513 (0.472)
0.716 0.004 No significant variables
N/A N/A No significant variables
N/A N/A
With site mean PL added to final model ViolaSite mean PLR2 = 0.594 (0.521)
0.4680.378
0.0930.166
N/A N/A N/A N/A N/A N/A
Total df 13 22 13
99

100
Late-season survey, full model, backward stepwise
-- -- -- No significant variables
N/A N/A -- -- --
With site mean PL added to final model N/A N/A N/A N/A N/A N/A N/A N/A N/A Forward stepwise Viola
Soil carbonR2 = 0.802 (0.752)
0.810-0.536
0.00100.010
No significant variables
N/A N/A ViolaR2 = 0.629 (0.576)
-0.793 0.011
With site mean PL added to final model ViolaSoil carbonSite mean PLR2 = 0.814 (0.734)
0.883-0.674-0.181
0.0030.0380.527
N/A N/A N/A ViolaSite mean PLR2 = 0.632 (0.510)
-0.7370.079
0.0800.830
Total df 10 19 8Late-season survey, reduced model, backward stepwise
ViolaSoil carbonPatch flowersR2 = 0.855 (0.801)
0.988-0.5250.395
0.00030.0060.043
No significant variables
N/A N/A Leaf-area indexR2 = 0.268 (0.195)
-0.518 0.085
With site mean PL added to final model ViolaSoil carbonPatch flowersSite mean PLR2 = 0.863 (0.784)
1.045-0.6380.383-0.143
0.00100.0310.0620.561
N/A N/A N/A Leaf-area indexSite mean PLR2 = 0.311 (0.158)
-0.4080.235
0.2260.473
Forward stepwise Same results as backward stepwise
N/A N/A No significant variables
N/A N/A No significant variables
N/A N/A
With site mean PL added to final model Same results as backward stepwise
N/A N/A N/A N/A N/A N/A N/A N/A
Total df 11 22 11
Table 3.A.2: Final models produced by backward and forward stepwise regressions of PLseed on measurements of patch, environmental, and neighborhood floral characteristics. See legend of Table A.1 for a full explanation. Sample sizes for PLseed are smaller because this variable could only be measured on the subset of patches included in Table A.1 that produced fruits in both the outcross-supplemented and unmanipulated control treatment groups.
100
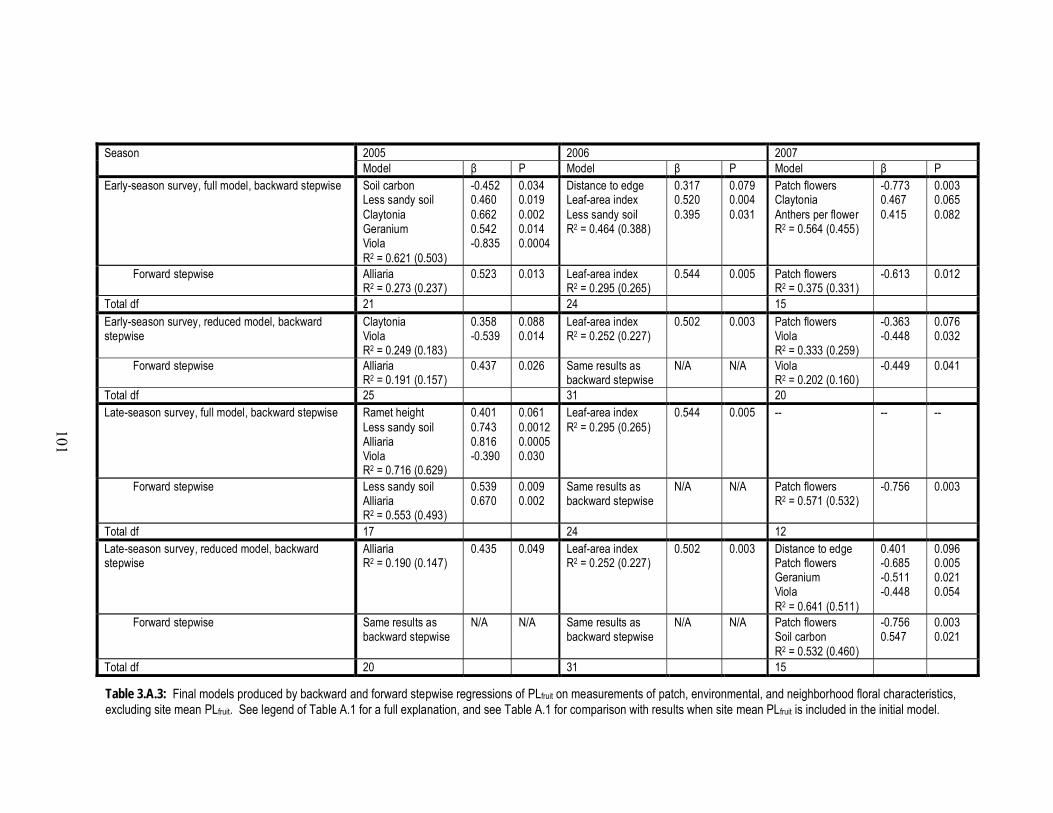
101
2005 2006 2007SeasonModel β P Model β P Model β P
Early-season survey, full model, backward stepwise Soil carbonLess sandy soilClaytoniaGeraniumViolaR2 = 0.621 (0.503)
-0.4520.4600.6620.542-0.835
0.0340.0190.0020.0140.0004
Distance to edgeLeaf-area indexLess sandy soilR2 = 0.464 (0.388)
0.3170.5200.395
0.0790.0040.031
Patch flowersClaytoniaAnthers per flowerR2 = 0.564 (0.455)
-0.7730.4670.415
0.0030.0650.082
Forward stepwise AlliariaR2 = 0.273 (0.237)
0.523 0.013 Leaf-area indexR2 = 0.295 (0.265)
0.544 0.005 Patch flowersR2 = 0.375 (0.331)
-0.613 0.012
Total df 21 24 15
Early-season survey, reduced model, backward stepwise
ClaytoniaViolaR2 = 0.249 (0.183)
0.358-0.539
0.0880.014
Leaf-area indexR2 = 0.252 (0.227)
0.502 0.003 Patch flowersViolaR2 = 0.333 (0.259)
-0.363-0.448
0.0760.032
Forward stepwise AlliariaR2 = 0.191 (0.157)
0.437 0.026 Same results as backward stepwise
N/A N/A ViolaR2 = 0.202 (0.160)
-0.449 0.041
Total df 25 31 20Late-season survey, full model, backward stepwise Ramet height
Less sandy soilAlliariaViolaR2 = 0.716 (0.629)
0.4010.7430.816-0.390
0.0610.00120.00050.030
Leaf-area indexR2 = 0.295 (0.265)
0.544 0.005 -- -- --
Forward stepwise Less sandy soilAlliariaR2 = 0.553 (0.493)
0.5390.670
0.0090.002
Same results as backward stepwise
N/A N/A Patch flowersR2 = 0.571 (0.532)
-0.756 0.003
Total df 17 24 12Late-season survey, reduced model, backward stepwise
AlliariaR2 = 0.190 (0.147)
0.435 0.049 Leaf-area indexR2 = 0.252 (0.227)
0.502 0.003 Distance to edgePatch flowersGeraniumViolaR2 = 0.641 (0.511)
0.401-0.685-0.511-0.448
0.0960.0050.0210.054
Forward stepwise Same results as backward stepwise
N/A N/A Same results as backward stepwise
N/A N/A Patch flowersSoil carbonR2 = 0.532 (0.460)
-0.7560.547
0.0030.021
Total df 20 31 15
Table 3.A.3: Final models produced by backward and forward stepwise regressions of PLfruit on measurements of patch, environmental, and neighborhood floral characteristics, excluding site mean PLfruit. See legend of Table A.1 for a full explanation, and see Table A.1 for comparison with results when site mean PLfruit is included in the initial model.
101
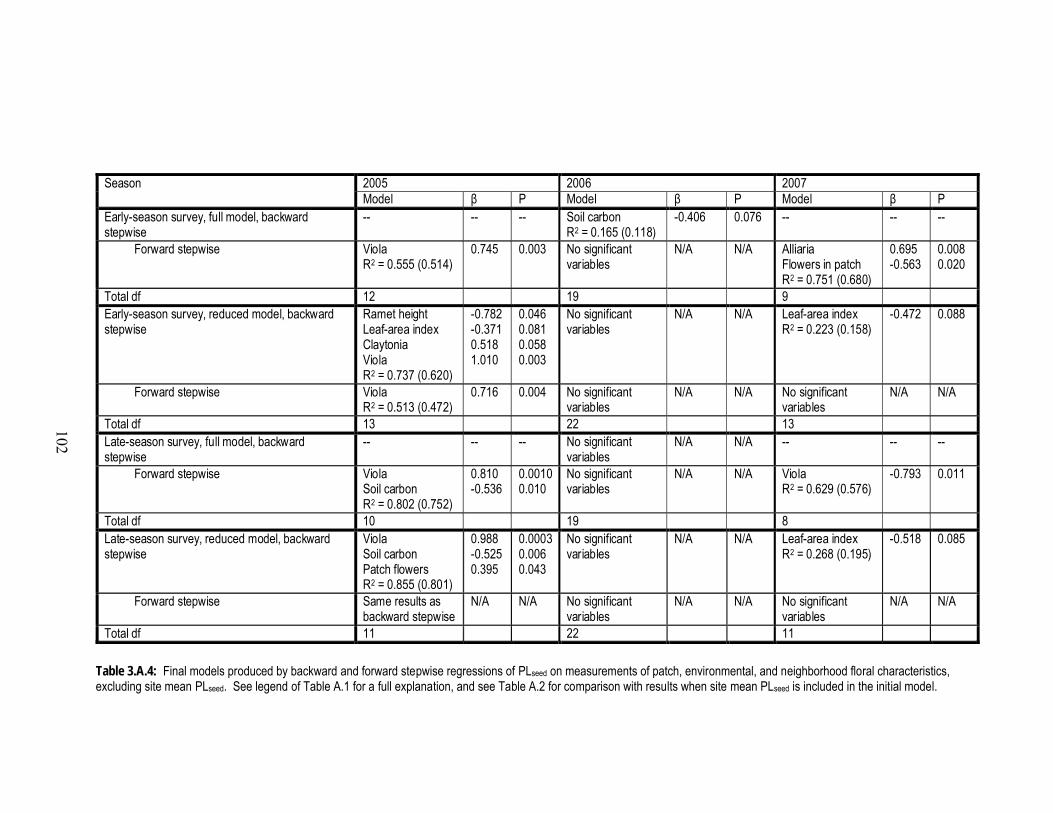
102
2005 2006 2007SeasonModel β P Model β P Model β P
Early-season survey, full model, backward stepwise
-- -- -- Soil carbonR2 = 0.165 (0.118)
-0.406 0.076 -- -- --
Forward stepwise ViolaR2 = 0.555 (0.514)
0.745 0.003 No significant variables
N/A N/A AlliariaFlowers in patchR2 = 0.751 (0.680)
0.695-0.563
0.0080.020
Total df 12 19 9Early-season survey, reduced model, backward stepwise
Ramet heightLeaf-area indexClaytoniaViolaR2 = 0.737 (0.620)
-0.782-0.3710.5181.010
0.0460.0810.0580.003
No significant variables
N/A N/A Leaf-area indexR2 = 0.223 (0.158)
-0.472 0.088
Forward stepwise ViolaR2 = 0.513 (0.472)
0.716 0.004 No significant variables
N/A N/A No significant variables
N/A N/A
Total df 13 22 13Late-season survey, full model, backward stepwise
-- -- -- No significant variables
N/A N/A -- -- --
Forward stepwise ViolaSoil carbonR2 = 0.802 (0.752)
0.810-0.536
0.00100.010
No significant variables
N/A N/A ViolaR2 = 0.629 (0.576)
-0.793 0.011
Total df 10 19 8Late-season survey, reduced model, backward stepwise
ViolaSoil carbonPatch flowersR2 = 0.855 (0.801)
0.988-0.5250.395
0.00030.0060.043
No significant variables
N/A N/A Leaf-area indexR2 = 0.268 (0.195)
-0.518 0.085
Forward stepwise Same results as backward stepwise
N/A N/A No significant variables
N/A N/A No significant variables
N/A N/A
Total df 11 22 11
Table 3.A.4: Final models produced by backward and forward stepwise regressions of PLseed on measurements of patch, environmental, and neighborhood floral characteristics, excluding site mean PLseed. See legend of Table A.1 for a full explanation, and see Table A.2 for comparison with results when site mean PLseed is included in the initial model.
102

103
Chapter IV
Facilitation of pollination among pollinator-sharing plants:overview and prescriptions for future study
Plant-plant interactions in pollination networks
Highly specialized plant-pollinator interactions, as exemplified by interactions
between figs and fig wasps or yuccas and yucca moths, are among the most fascinating
phenomena in pollination biology and common examples in popular accounts of both
pollination biology and coevolution. Yet such specialization is quite rare among plant-
pollinator interactions. Generalization is the rule, and even plant or pollinator species
that specialize on one partner typically specialize on a highly generalized partner
(Bascompte et al. 2003, Ashworth et al. 2004). Thus, plant-pollinator interactions occur
in extended networks much more often than in simple two-partner mutualisms (e.g.,
Memmott et al. 2004).
Indirect interactions are inherent to interaction networks. In food webs, for
example, two species may compete by consuming the same prey species (exploitation
competition), or one species may indirectly support another by consuming its predators
(trophic cascade). Similarly, in pollination networks, two plant species may compete for
the services of the same pollinators, decrease each other’s reproductive success through
improper pollen transfer, or facilitate each other’s pollination success.
Rathcke (1983) reviewed the literature on interactions between plants mediated by
pollinators. At that time, competition for pollination had been repeatedly invoked as a
mechanism behind observed variation in flowering time or floral morphology, but
rigorous tests for the occurrence of competition for pollination were unusual. Studies on
facilitation of pollination were much less common. Since then, many studies have
examined competitive interactions between plants mediated by their pollinators, but
104
studies on facilitation remain relatively rare. Nevertheless, tremendous progress has been
made in elucidating some aspects of facilitation of pollination, particularly as it applies to
food-deceptive species and to conspecific interactions within rewarding species.
Here, I review the literature on facilitative interactions between plants, mediated
by their pollinators. I particularly emphasize interactions among rewarding plants, as an
excellent review of the pollination of rewardless species has been published quite
recently (Renner 2006). I begin by providing my definitions of important technical terms
that have multiple definitions in the literature. I then review the evidence for eight
recognized hypotheses for facilitation of pollination. Finally, I make recommendations
for future studies that I believe would accelerate progress in understanding the patterns
and processes of pollinator-mediated interactions among plants, including both
competition for pollination and facilitation of pollination.
Definitions
Target and associate species
Following Goldberg et al. (1999), I use the term “target” to refer to the individual
or species whose response is being measured, while a species or individual expected to
induce a response is an “associate.” Studies on competition and facilitation in pollination
systems are functionally similar to studies on these same interactions mediated by other
limited resources. Both kinds of studies involve a focal species to which focal
individuals belong. A variable that is expected to change in response to interactions with
other organisms is measured on target individuals that are exposed to different
abundances of individuals of one or more other species (the associates). In contrast to
studies on interactions for abiotic resources, however, studies on interactions for
pollination continue to have no established response variables or methods for
manipulating the abundances of associates. Perhaps a more explicit recognition of the
parallels will promote greater standardization in measurements and methods in the field
of pollination, facilitating comparisons among studies.

105
Facilitation of pollination
Most studies define facilitation of pollination loosely, and often not explicitly, as
a positive effect of one species’ flowers on the pollinator visitation, pollination success,
or reproductive success of another species with which it shares pollinators, a definition I
model after Waser’s (1978) definition of competition for pollination (below). Ideally,
this interaction would be measured in both directions, and the effect of the interaction on
demography would be measured, but studies are usually limited to one direction of
interaction and do not usually test for effects on fitness beyond pollinator visitation, fruit
set, or seed set. Studies vary in the response variable measured, the method for
measuring it, and the methods for measuring and manipulating the abundances of
associates, which also prevents the use of a more precise definition. For the purposes of
this review, I will use the loose definition above, specifying which component of
reproductive success has been used as a response variable and how the influence of
associates has been manipulated, as necessary.
Facilitation of pollination is assumed to occur through increased pollinator
visitation to the target species due to the presence of the flowers of the associate species
(though I describe some exceptions). Heterospecific neighbors are not expected to
improve the quality of the pollen that arrives on a plant’s stigmas. Nevertheless, I reserve
terms such as “facilitation of visitation” or “facilitation of pollinator visits” for cases in
which this mechanism is specified.
Competition for pollination
Although competition for pollination is not a focus of this study, it frequently
occurs in the same systems as facilitation, and some mention of it is therefore
unavoidable. As with facilitation of pollination, competition for pollination cannot be
defined narrowly without greatly limiting the number of studies that can be said to test
the phenomenon. I therefore follow the definition of Waser (1978): “If at least 1 of 2 or
more co-occurring species suffers a reproductive loss as a result of sharing a pollinator,
competition for pollination can be said to occur.” Competition for pollination can take
the form of competition for pollinator visits or improper pollen transfer (defined below).
106
Competition for pollinator visits
Competition for pollination has been divided into “exploitation competition” and
“interference competition (e.g., Brown and Kodric-Brown 1979, Pleasants 1980).” In
this terminology, exploitation competition for pollination is competition for pollinator
visits, by analogy with the broader definition of exploitation competition as competition
in which individuals or populations negatively affect each other by depleting a shared
resource. The attention of pollinators is a finite resource that synchronously flowering
plants may deplete. However, pollinators are not abiotic resources, but foraging
organisms that exhibit a preference for highly rewarding plants and a freedom to leave
them. This important difference is largely responsible for the phenomenon of facilitation
of pollination; if pollinators were not more abundant near attractive flowers, there would
be no potential for the flowers of one species to facilitate visitation to the flowers of
another species. For this reason, I follow Waser (1983) and Rathcke (1983) in avoiding
the term “exploitation competition” in this context. Instead, I will use the terms
“competition for pollinator visits,” “competition for pollinators,” or “competition for
visitation.”
Interspecific pollen transfer and improper pollen transfer
The term “interference competition” has been used synonymously with
interspecific pollen transfer (Waser 1983, and references therein), which is itself a special
case of improper pollen transfer (IPT; Rathcke 1983). IPT includes any transfer of
incompatible pollen to stigmas, including both heterospecific pollen and genetically
incompatible conspecific pollen. IPT is sometimes equated with interference competition
because it bears some relationship to the animal behaviors (e.g. territoriality) that the
term “interference competition” was intended to describe. Incompatible pollen may
interfere with compatible pollen by physically preventing it from reaching the stigmatic
surface and germinating, fertilizing ovules that would otherwise have been fertilized by
compatible pollen (e.g., Fishman and Wyatt 1999), or suppressing the germination of
compatible pollen through allelopathy (e.g., Murphy 2000). Despite these similarities
between IPT and interference competition, I will use the term “IPT” wherever applicable,
as “interference competition” can be applied to interactions that have very different
107
mechanisms from IPT, such as if mixed-species displays were less attractive to
pollinators than displays of either species alone (Rathcke 1983).
Heterospecific pollen transfer
Most studies of plant-plant interactions through pollination that involve more than
one species consider the effect of the interaction for a single target species, ignoring the
effect on any associate species. This being the case, it is useful to have a term that
specifically refers to pollen transfer between a target species and other species.
Following Murphy (1995), I use the term “heterospecific pollen transfer” (HPT) for this
purpose. I use “heterospecific pollen receipt” to refer to the receipt of other species’
pollen.
Methods
I searched ISI Web of Knowledge for papers containing the phrase “facilitation of
pollination.” To find articles relating to conspecific facilitation (e.g., as seen when Allee
effects are relevant) I then searched for papers that cited Sih and Baltus (1987), the
earliest paper in the previous search for which a list of “cited by” papers could be
generated. Rathcke (1983)’s chapter of facilitation and competition was the earliest
article in the list, but neither the references that cite it nor the references cited in it were
available. However, I did find every reference that Rathcke cited in reference to
facilitation, as well as every reference those references cited on the subject, and so on, in
an effort to both find every relevant article and trace the origin of the idea that facilitation
of pollination could occur. I also searched for “facilitate* AND pollinat*.”
Hypotheses for facilitation of pollination among rewarding species
1. Pollinator support
The assumption that competition for pollinators is a likely interaction between
two co-flowering species that share pollinators is based on a view of pollinator services

108
as a finite resource. However, as mentioned in the definitions above, pollinators are
organisms, not abiotic resources. As organisms, their interaction with flowering plants is
commonly recognized as a mutualism; the plant receives assistance in mating with others
of its species, and in exchange, the pollinator receives nectar, pollen, or some other
reward. If a plant species has a positive effect on a pollinator species, and that pollinator
species has a positive effect on another plant species, the intuitive indirect effect of the
first plant species on the second one is facilitation. This is essentially the logic behind
the pollinator support hypothesis, proposed by Rathcke (1983); the flowering plant
species in a community collectively support pollinators in greater abundance and
diversity than any one plant species could alone.
Sequential flowering—In general, competition between two species for any
resource is expected to result in selection for traits that reduce the negative fitness
consequences of the competitive interaction. Flowering plants may reduce competition
for pollination by diverging in their flowering times, as first suggested by Robertson
(1895). Beginning in the 1970s, numerous researchers began to find sequential flowering
of pollinator-sharing species wherever they looked (Mosquin 1971, Frankie et al. 1974,
Heithaus 1974, Heinrich 1975, Reader 1975, Stiles 1975, 1977). These cases of
sequential flowering with minimal overlap in flowering times were based on sorting
species’ flowering times from earliest to latest in a season and deciding whether they
looked uniformly staggered, and many may not stand up to more rigorous scrutiny (Poole
and Rathcke 1979). However, it is likely that competition for pollinators has driven
divergences in flowering times in at least some communities, and there is solid evidence
that flowering time can evolve in response to selection against interspecific pollen
transfer (e.g., Waser 1978a).
It is clear that multiple plant species are in flower throughout the active seasons of
pollinators in at least most communities. To some extent, this pattern is probably the
result of a simple rule of community assembly: species will not persist where they
cannot complete their life cycles. Many long-lived pollinators require a series of plants
coming into and fading out of bloom if they are to remain in a community (Baker 1963,
Stiles 1975). The population stability of non-migratory pollinators, in particular, may be

109
dependent on the abundance of floral resources throughout the growing season, and their
populations may vary within and between seasons in response to variations in floral
rewards (Tepedino and Stanton 1981).
Sequential mutualism—The flowering period of a single species within a season
is frequently shorter than the active foraging periods of its pollinators. Consequently,
pollinators rely on sequential flowering of different species throughout the season. If
floral resources become scarce in a community at some point during the flowering
season, the local pollinator population may decline due to increased death from
starvation, decreased reproduction, or increased migration out of the community. Thus,
the species that flower at any given time in the active period of their pollinators
effectively facilitate the pollination of later-flowering species with which they share
pollinators, a phenomenon that has been labeled “sequential mutualism” (Waser and Real
1979). This is one form of facilitation through mutual pollinator support.
Waser and Real (1979) found evidence for sequential mutualism of Ipomopsis
aggregata pollination by Delphinium nuttallianium in the Colorado Rockies. In their
study site, D. nuttallianum flowered before I. aggregata, with little overlap. Both species
were pollinated by broad-tail hummingbirds (Selasphorus platycercus), while only I.
aggregata was pollinated by rufous hummingbirds (S. rufus), which typically arrived in
the community after D. nuttallianum was finished flowering. In years when D.
nuttallianum produced relatively few flowers, the abundance of broad-tail hummingbirds
was low, and I. aggregata experienced low seed set, while rufous hummingbird
abundance was unrelated to the floral density of D. nuttallianum (Waser and Real 1979).
These facts strongly suggest that D. nuttallianum promoted the seed set of I. aggregata
by supporting one of its major pollinators prior to I. aggregata’s flowering season.
Less direct evidence for this mechanism of facilitation has been found for Clarkia
xantiana ssp. xantiana and its congeners in the southern Sierra Nevada range (Moeller
2004). Moeller (2004) found that C. x. xantiana populations with more congeners
present had higher pollinator visitation per plant and lower or equal pollen limitation of
seed set than populations without congeners. Clarkia specialist pollinators were more
sensitive to Clarkia diversity than were generalists (Moeller 2004, 2005). These results
110
may be due to the long lifespan of the specialist pollinators relative to the flowering time
of any one Clarkia species, combined with some degree of staggered flowering times
among the species (Moeller 2004).
Community stability—In theory, facilitation through pollinator support is not
limited to sequentially flowering species. If coflowering species experience
asynchronous changes in floral abundances from year to year, they may sustain larger,
more diverse, or more stable pollinator communities as a group than any one species
could sustain alone. More diverse pollinator communities will provide more reliable
service if the populations of different pollinator species fluctuate asynchronously (Potts et
al. 2001). This form of facilitation through pollinator support would be apparent as (1)
positive relationships between floral functional diversity, pollinator functional diversity,
and community stability and (2) shifts in floral dominance rank-orders among years, with
pollinators shifting their preferences accordingly. Such studies are unlikely to be
connected to the literature on facilitation of pollination, and it is likely that there are
many findings along these lines of which I am not aware.
There is evidence that functional diversity in pollination networks can lead to
greater stability. Fontaine et al. (2006) manipulated the functional diversity of plants and
pollinators in caged experimental communities. Plants had two functional groups (open
flowers and tubular flowers), as did pollinators (long-tongued and short-tongued). For
communities that contained both open and tubular flowers, species richness and total
plant abundance was higher after two years for the communities that contained both long-
and short-tongued pollinators than for communities that contained just one functional
group of pollinators (Fontaine et al. 2006). The experiment was not designed to test
whether floral functional diversity promotes the diversity and abundance of pollinators,
which would be a necessary step in facilitation through pollinator support.
2. Magnet species
Thomson (1978) tested the hypothesis that pollinator preferences between two
species of Hieracium (Asteraceae) were positively density-dependent within several
111
patches that ranged from dominance by H. auranticum to dominance by H. florentinum.
The per-head visitation to each species within a patch was expected to increase with that
species’ relative abundance within the patch. This prediction was borne out for H.
auranticum, but not for H. florentinum. Visitation to H. florentinum conformed to the
prediction except that the patch that was most heavily dominated by this species was the
one in which it received the fewest visits per flower. Visitation was higher overall for H.
auranticum. He proposed that patches with at least a moderate proportion of H.
auranticum were more attractive to pollinators than stands of nearly pure H. florentinum,
but that pollinators switched between the two species readily within a patch, possibly
because H. auranticum heads became “crowded.”
Thomson (1978) called the greater visitation to a less attractive species in patches
that contain a more attractive species the “‘magnet species’ phenomenon.” Of course, it
need not refer to systems in which the two interacting species occur in discrete, mixed-
species patches. In general, pollinator abundance can be expected to be higher near
highly rewarding flowers, and nearby flowers of less rewarding species may receive more
visits than flowers of the same species further from the rewarding display. It should also
be noted that this mechanism of facilitation may occur in systems where the overall effect
of the magnet species on pollinator visitation to the target species is competitive. The
more attractive species may out-compete the target species for pollinator visits, so that
the target’s visitation would be higher if the magnet species were completely absent from
the community, yet visitation for the target species may be higher in close proximity to
the magnet species than it is several meters distant.
The study in which Thomson (1978) first proposed the magnet species hypothesis
seems to be the only published study to explicitly invoke this mechanism to explain
interactions between two rewarding species. It is perhaps significant that Hieracium is
apomictic. Thus, while Thomson (1978) observed that pollinators collected from each
species bore mixed pollen loads and that pollinators collected from H. florentinum were
more likely to bear H. auranticum pollen than vice-versa, any interspecific pollen transfer
that might have occurred would have had no effect on the reproductive success of either
species.
112
However, several studies have detected facilitative effects of highly rewarding
species on the visitation of less rewarding species in a manner consistent with the magnet
species hypothesis. For example, Bartomeus et al. (2008) found that, for 70% of native
plants in Mediterranean shrublands in northeastern Spain, mean visitation rate was higher
in 50m x 50m plots invaded by Carpobrotus of probable hybrid origin (Aizoaceae) than
in paired uninvaded plots. In contrast, visitation was lower for 60% of native plants in
plots invaded by Opuntia stricta (Cactaceae). There were more total visits in plots with
Carpobrotus than in uninvaded plots, while plots with Opuntia did not have more total
visits than uninvaded plots. Thus, while Carpobrotus evidently drew additional
pollinators to the plots it invaded and thereby facilitated the pollination of several native
species, Opuntia simply competed with the natives for pollinator visits without increasing
the number of pollinators in the plot (Bartomeus et al. 2008). Whether the effects of the
two invaders on pollinator visitation translated into effects on reproductive success or
fitness was not tested, but the conditions for facilitation through shared pollinators may
be quite strict if the negative effects of IPT and competition for other resources are
considered (Feldman et al. 2004). In addition, while Carpobrotus increased visitation for
most native species, it decreased visitation for “a few specialized species with
zygomorphic flowers (Bartomeus et al. 2008).” The authors do not speculate on why
such species should have lower visitation in invaded plots when other species have higher
visitation. They indicate that flower-visiting beetles were especially common in plots
invaded by Carpobrotus (Bartomeus et al. 2008); perhaps this species facilitated the
visitation of plants visited by beetles, but competed for bee visits with species with
zygomorphic flowers without attracting substantially more bees to the plot.
Moragues and Traveset (2005) studied the effect of Carpobrotus on the
pollination of native species on Mallorca, the largest of the Balearic Islands, Spain, in the
Mediterranean Sea. Like Bartomeus et al. (2008), they compared invaded plots with
nearby uninvaded plots. They conducted observations of pollinator visits for each of four
native species, noting the number of insect visits, the identities of the visitors, and the
number of flowers present in groups of fifteen observed plants of one species in each
observation. Though these data are sufficient to calculate visitation per flower per hour,
they provide data only on the total number of insect visits to the group and the number of
113
flowers receiving visits. They found increased pollinator visitation to Anthyllus
cytisoides (Fabaceae) and Cistus salviifolius (Cistaceae) in invaded plots and decreased
visitation to Lotus cytisoides (Fabaceae) in the invaded plots, by at least one measure of
visitation in at least one of two years. The flowers of the Cistus species were
actinomorphic, while both legumes had zygomorphic flowers. They found no effect of
plot type on Cistus monspeliensis visitation by either measure in either year. The study
was conducted in two sites with two different species of Carpobrotus; C. acinaciformis
was associated with A. cytisoides and C. monspeliensis, while C. edulis was associated
with L. cytisoides and L. salviifolius. Differences in fruit or seed set between invaded and
uninvaded plots were not determined. However, IPT was addressed for the Cistus
species; negligible Carpobrotus pollen was found on native stigmas, and supplemental
hand-pollination with Carpobrotus pollen, alone or in mixture with conspecific outcross
pollen, did not significantly depress seed set relative to unmanipulated control flowers.
Thus, at least for the two Cistus species, it is unlikely that heterospecific pollen transfer
results in a competitive effect of Carpobrotus.
Lopezaraiza-Mikel et al. (2007) also found facilitation of pollinator visits by an
invasive species with highly rewarding flowers, based on a removal experiment in semi-
natural vegetation in Bristol, England. They collected a greater number of floral visitors
on native plants in plots where the Impatiens glandulifera flowers were left in place than
in plots where they were removed. This difference was significant even when total floral
abundance (which was higher in control plots than in removal plots) was included as a
covariate. Coleoptera, Diptera, Hymenoptera, and Hemiptera all responded similarly to I.
glandulifera, indicating that the difference in visitor abundance between treatments was
not due to the response of any single order (unlike Carpobrotus, which had a particularly
positive effect on Coleoptera abundance; Bartomeus et al. 2008). Apparently as a result
of the greater visitor abundance, visitor diversity was also higher in plots with I.
glandulifera flowers. However, I. glandulifera pollen dominated the pollen transport
network of both plot types, and it is quite possible that IPT reduces, eliminates, or even
reverses the positive effect of this species on visitation to native species (Lopezaraiza-
Mikel et al. 2007).
114
Rewarding flowers may not be all that may serve as magnet species for
pollinators. Roy (1996) found that pseudoflowers of the rust Puccinia monoica, which
infects Arabis holboelii (Brassicaceae), promoted pollinator visitation to flowers of
Anemone patens (Ranunculaceae) in sagebrush-dominated alpine habitats in the Colorado
Rockies. The study was intended to test the visitation-density curve proposed by Rathcke
(1983; below). The flowers of A. patens and the pseudoflowers of P. monoica both
provide sugary liquids as rewards, making the magnet species effect a less obvious
mechanism than it is in the case of deceptive species. Thus, visitation to both species was
expected to increase in mixed plots relative to monospecific plots at low density, with the
combined displays of the two species attracting more pollinators than the display of either
species alone, while competition was expected at high density. A. pratens experienced
higher visitation by flies in the presence of the pseudoflowers, regardless of total floral
density, but the presence of the flower had no effect on fly visitation to P. monoica
pseudoflowers. Thus, P. monoica appears to be a magnet species facilitating visitation by
flies to A. patens. In contrast, visitation per flower per hour by halictid bees declined
with increasing patch density for both species, but no significant effect of plot
composition was detected. Thus, interactions among flowers through halictid visitors
appeared to be competitive.
Facilitation by the magnet species effect depends on the tendency of generalist
pollinators to visit unfamiliar flowers to assess their value. Individual pollinators rarely
show perfect fidelity to a single species, but in many pollinator species, they do show a
strong preference for one species once they have identified it as a rewarding species (e.g.,
Heinrich 1979). Visitation to flowers outside of the preferred species is sometimes
referred to as “mistake pollination,” (Baker 1976) particularly when the new flower
belongs to an unrewarding species. However, this term discourages recognition of the
fact that it is adaptive for pollinators to occasionally visit unfamiliar flowers (Renner
2006). Pollinator inconstancy might better be regarded as “sampling,” as it allows
pollinators to periodically assess whether the flower type they are currently exploiting is
the most rewarding one available (Renner 2006).
Deviations from perfect floral fidelity may be beneficial to a highly rewarding
plant species because they make it possible to compete with other species for the loyalties
115
of pollinators. They also benefit unrewarding species by providing them with floral visits
by pollinators that have not learned or have forgotten that they are unrewarding.
Sampling visits can directly transfer pollen among conspecific flowers of a species that
offers little or no reward only if the pollinator visits a series of flowers of this species,
which may occur in a large proportion of sampling visits (e.g. Laverty and Plowright
1989, Laverty 1992). Sequential visits to a species that initially proves unrewarding is
beneficial for pollinators, since rewards may vary among flowers within a species for
many reasons unrelated to the average reward offered by flowers of that species.
Abandoning a new species after visiting a single unrewarding flower could cause a
pollinator to fail to exploit a rich resource, if it happened to visit a flower that had
recently been visited by another pollinator or one that was too young or too old to
produce rewards (Renner 2006). Thus, inconstancy will tend to benefit the less
rewarding species of a community, as well as highly rewarding species that have recently
begun to flower or to produce rewards. It cannot be expected to benefit the species to
which a pollinator was loyal before sampling other species, as members of the formerly
preferred species lose visits and pollen to the sampled species, and may receive
heterospecific pollen if the pollinator reverts to its original preference.
The magnet species hypothesis applies only to facilitation of pollinator visitation.
Because it involves pollinators switching between the plants that attract them from a
distance and the heterospecific neighbors of those plants, it is also likely to involve IPT.
The net effect may be a decrease in fitness relative to individuals located further from the
display (Waser 1978b, a, Campbell 1985, Campbell and Motten 1985).
Alternatively, if a plant places its pollen precisely and in a different location than
the preferred species, pollen transfer may occur between visits to the less rewarding
species even if many visits to the preferred species (and others) intervene. About 1/3 of
all orchid species are nectarless and thought to be pollinated “by deceit” (Cozzolino and
Widmer 2005). It is probably not coincidental that orchids often package their pollen in
pollinia, which may be placed precisely on the pollinator’s body with sticky pollinaria,
reducing losses to grooming, pollinivory, and loss to heterospecific stigmas, as well as
heterospecific pollen deposition on stigmas. These plants seem to be adapted (or
preadapted) to take advantage of occasional mistakes or sampling forays.
116
3. Density-visitation / abundance-visitation curve
When two rewarding species co-flower and share pollinators, the resulting
interactions may range from facilitation through neutrality to competition for pollination,
and all of these outcomes have been detected in various studies. There must be some
mechanism or set of mechanisms that determine what sort of interaction will occur. One
such mechanism was proposed by Rathcke (1983), who proposed that per-flower
visitation may increase, peak, and then decline as the floral density of a local display
increased. This may happen if (1) pollinators preferentially forage in patches with high
floral densities, but (2) the flowers within a patch must compete for the attentions of any
pollinators that they collectively attract. The model was developed specifically to refer to
patch density, not the number of plants or flowers in the patch, on the theory that greater
floral density would lead to decreased inter-floral flight distances within patches, so that a
dense patch would provide a higher net reward (after foraging costs are considered) than
one with an equal number of flowers more sparsely arranged. Effects of floral abundance
alone must be attributed to another mechanism and will be discussed below, under “Total
display size.”
There are multiple ways by which the assumptions of the density-visitation model
may be met. Quite often, individual pollinators preferentially visit larger displays but
visit a smaller proportion of the flowers in large displays than in small displays, a
counter-intuitive phenomenon that recent optimal foraging models have sought to explain
(Goulson 2001, Ohashi and Yahara 2002). More obviously, any community has a finite
supply of pollinators that a flower patch may attract, and this firm limit on the number
that can be attracted is presumably approached with a saturating curve of patch visitation
rate as a function of patch density. Finally, the effect of increased patch density on patch
attractiveness may decline as patch density increases. A patch with ten flowers may be
far more visible, rewarding, or innately appealing to pollinators than one with five, but an
additional doubling to twenty flowers might increase visibility, likely rewards, or innate
attractiveness to a smaller degree. Goulson (2000) suggested that pollinators may visit a
smaller proportion of the flowers in larger patches because their movement rules for
117
avoiding revisiting flowers become ineffective at high density. This not only explains
why individuals visit a smaller proportion of the flowers in a denser patch, but also might
explain why a patch with twice the density of another patch may not be twice as
attractive; if a pollinator cannot expect to collect twice the rewards from a patch with
twice as many flowers, it should not be twice as attracted to that patch.
The density-visitatation model has been tested in a small number of two-species
studies. Ghazoul (2006) found that visitation to 50 Raphanus raphanistrum
(Brassicaceae) flowers in study plots first increased with the density of flowering heads
of Cirsium arvense (Asteraceae), and then declined when more than 32 heads were
present (Ghazoul 2006). In contrast, Feldman (2006) found that pollinator visits to
patches of Brassica rapa (Brassicaceae) increased as a linear or saturating function of the
density of flowers in the patch, as did the number of plants visited by a pollinator per visit
to a patch. He argued, based on an earlier model (Feldman et al. 2004), that facilitation
of pollination by the density-visitation model would occur if only if visitation increased
as a sigmoid function of density, so that the number of pollinator visits the patch receives
increases as an accelerating function of patch density at low densities. Because neither
the aggregative response (visits to the patch as a function of patch density) nor the
functional response (number of plants visited per patch visit as a function of patch
density) was sigmoid, he concluded that facilitation of pollinator visitation is not
occurring at low density (Feldman 2006). This conclusion was supported by a decline in
the number of visits per plant per hour as patch density increased (Feldman 2006).
Notably, however, seed set per fruit and per flower increased with patch density,
indicating that, while facilitation of visitation was not occurring, facilitation of
pollination through pollination quality (below) did take place (Feldman 2006). Finally,
Bosch and Waser (1999) found that visitation and seed set were higher for denser arrays
of Aconitum columbianum (Ranunculaceae), with plant number held constant.
Total display size—Independent of patch density, a larger flower patch will
generally attract more pollinators than a small patch. If pollinator attraction increases
faster than patch size, then any additional flowers will facilitate the visitation of the
flowers already in the patch. A larger patch may attract more pollinators because it offers

118
more rewards, or it may simply be more visible. For honeybees, for example, an object
must occupy approximately 5 degrees of the pollinator’s field of view to be visible, and
15 degrees before its color can be determined (Lehrer et al. 1990, Spaethe et al. 2001).
For honeybees, which recruit nest-mates to highly rewarding floral resources, a larger
patch may be easier for recruits to locate.
The effect of display size can be expected to resemble the effect of density
because the mechanism of facilitation (or competition) is essentially the same; more
rewarding patches attract more pollinators. As such, the mechanisms by which
facilitation may occur at small display sizes, gradually disappearing and becoming
competition at large display sizes, are essentially the same as those described for the
density-visitation model.
For example, Sih and Baltus (1987) found that pollen limitation declined with
patch size in Nepeta cataria (Lamiaceae). More pollinators were attracted to large
patches, and individual pollinators were less likely to leave a large patch immediately
upon encountering it. Patch size had different effects on individual behavior in different
bee taxa. Individual honeybees visited more flowers, but a smaller proportion of them, in
larger patches. Bumblebees visited more flowers and a larger proportion of them, and
solitary bees visited fewer flowers in larger patches. A multiple regression of pollen
limitation on visitation by the three categories of bees explained 67% of the variation in
pollen limitation. The authors therefore concluded that the lower pollen limitation of
large patches was due mostly to the effect of patch size on pollinator visitation (Sih and
Baltus 1987). It is possible that higher mean pollen quality in large patches, due to the
availability of more potential mates, may have contributed to lower pollen limitation in
these patches, which would be consistent with the Allee effect hypothesis (below).
However, the high explanatory power of pollinator visitation strongly suggests that total
display size is among the relevant mechanisms behind this pattern.
Ågren et al. (2008) found that the frequency of fruit initiation per flower in
populations of Vincetoxicum hirundinaria (Asclepiadaceae) was higher in larger
populations, but they could not determine whether this was due to higher pollination
success in large populations. Similarly, Brys et al. (2007) found higher fruit set per plant
and per flower and higher seed set per ovule and per plant in larger potted populations of
119
Primula vulgaris (Primulaceae), while population density had no effect on these
variables. More isolated populations had lower seed set per ovule and per plant. Because
the plants were potted, any differences in environmental variables among populations
were not causally related to population size, and the differences in reproductive success
may reasonably be attributed to pollination.
4. Reward complementarity
Rathcke (1983) proposed that two species that share pollinators but provide
different rewards may attract or support more pollinators, and therefore experience higher
visitation rates, than either species in isolation. This mutual facilitation of visitation
would be an emergent property because the effect of each species on the other’s visitation
rate would not be predictable from information about each species’ density or its relative
attractiveness to pollinators (Rathcke 1983).
To date, this hypothesis has received little attention. In part, this may be due to its
apparently limited sphere of relevance. Pollinators that forage on flowers for only one
resource (e.g., hummingbirds, butterflies, moths, most wasps, most flies, all of which
forage on flowers only for nectar) are not amenable to this mechanism of facilitation, and
flowers that offer both pollen and nectar are intuitively less likely to benefit from sharing
pollinators with flowers that offer one or both of these rewards.
However, it is possible for facilitation to occur between two species that both
offer pollen and nectar, and reward complementarity is at least a possible mechanism for
this. Ghazoul (2006) observed that bees in his system visited the target species
(Raphanus raphanistrum: Brassicaceae) for pollen and an associate species (Cirsium
arvense: Asteraceae) for nectar, though both species produce both rewards. R.
raphanistrum is poor in nectar but rich in pollen relative to C. arvense. He also found
that groups of 50 R. raphanistrum plants received significantly more pollinator visits in
arrays with 24 C. arvense plants than in arrays with 24 conspecific plants (Ghazoul
2006), while seed set per fruit was insignificantly higher in the arrays that contained both
species. Furthermore, visitation to R. raphanistrum flowers in plots containing mixtures
50 flowers of this species and varying numbers of heads of C. arvense increased with the

120
abundance of C. arvense heads in the plot, up to 32 heads. After this point, visitation
declined with increasing abundance of C. arvense heads (Ghazoul 2006). Thus, in at
least one system, there is good reason to believe that the complementary rewards
hypothesis is relevant even in two species that both offer pollen and nectar rewards.
Facilitation of pollinator visitation by the reward complementarity mechanism
may often occur between plants that provide both nectar and pollen, for two reasons.
First, almost every flower that produces nectar also produces pollen, with the obvious
exception of unisexual female flowers. Thus, even if facilitation through complementary
rewards always involved a species that offered only pollen, the nectar-providing species
with which it interacts will generally have pollen as well as nectar, even if it has
relatively little pollen or the pollen is of low nutritional quality for the pollinator.
Second, it may not be uncommon for flowers that serve primarily as pollen sources to
provide a small quantity of nectar, as is apparently true of R. raphanistrum (Ghazoul
2006). Thus, flowers may be “cryptic” pollen flowers or nectar flowers, in the sense that
common methods for assessing available floral rewards may lead a researcher to believe
that both nectar and pollen serve as rewards when, in practice, pollinators collect one or
the other reward, exclusively or nearly so, from the species in question.
5. Mate availability
At very low abundance or density, populations may decline due to the failure of
individuals to find compatible mates or to inbreeding depression caused by low
population genetic variability (Allee 1931, 1951), a phenomenon known as the Allee
effect (e.g., Hackney and McGraw 2001, Fischer et al. 2003, Davis et al. 2004). A
corollary of this effect is that, as population size or density increases from very low
levels, the fecundity of individuals and the survival and fecundity of their offspring may
increase, reducing, halting, or reversing the population decline seen at lower abundances.
By the definition of facilitation used in this review, this is essentially a form of
conspecific facilitation.
This basic mechanism need not apply only to populations at such low abundances
or densities that deterministic extinction is a danger. A similar phenomenon may be seen
121
in the populations of many common plants. Isolated individuals or those in small or
sparse patches may experience more frequent geitonogamy than those with more
potential mates nearby. Thus, even if pollinator visitation is high in small patches,
fecundity may be low due to inbreeding depression or low diversity of self-
incompatibility alleles.
Tests of the relationship between floral density and pollination success should
preferably be conducted using experimental arrays, not natural variation in floral density.
Floral density in natural populations may reflect the suitability of microsites for plant
growth and reproduction, which may, in turn, influence fruit and seed set, as well as the
provisioning of pollinator rewards. Thus, plants on poor sites may produce fewer flowers
and provide less abundant rewards per flower, resulting in low visitation and fruit and
seed set, and low plant vigor may limit fruit and seed set even if pollinator visits do not.
The potential for microsite variation to confound experimental results was
realized in a study by Bosch and Waser (1999). These authors found that visitation and
pollen receipt in natural populations of Delphinium nuttallianum Pritzel and Aconitum
columbianum Nutt. (both Ranunculaceae) were not related to the number of flowers per
square meter, while seed set was much lower in sparse populations. Based on these
results, it is possible that the pollen received by flowers in denser populations was of
higher quality, or it may be that denser populations occurred on better microsites, which
also resulted in higher seed set per flower. To test this, they manipulated densities in
arrays of potted plants for each of the two species (Bosch and Waser 2001). They found
that both visitation and seed set were independent of the density of the array in D.
nuttallianum, as expected if microsite quality explained variation in seed set in natural
populations. Thus, the authors would have been mistaken had they assumed that
differences in pollen quality between dense and sparse populations had explained their
earlier results.
In addition to finding support for the display size hypothesis, Brys et al. (2007)
found evidence for the mate availability hypothesis. Primula vulgaris is distylous; pin
flowers, with long styles and short stamen filaments, can only cross-pollinate with thrum
flowers, with short styles and long filaments, and vice-versa. In their potted populations,
they found that pollen limitation of fruit set was greater for the more common of the two
122
morphs, with increasing pollen limitation for that morph the more biased the population
was. Thus, the more common morph in a population experienced increased pollen
limitation due to a lack of compatible mates.
Campbell and Husband (2007) found that mate availability declined in small
populations of Hymenoxys herbacea (Asteraceae), while per-head visitation increased.
However, pollen did not limit seed set per floret. Thus, while the mechanisms behind the
mate availability hypothesis of facilitation and the display size or density-visitation
hypothesis were in effect, neither facilitation nor competition for pollination occurred, as
measured by seed set.
6. Müllerian mimicry
It has been argued that rewarding species sometimes facilitate each other’s
pollination by mutual mimicry (Macior 1970, Brown and Kodric-Brown 1979, Schemske
1981), making it more likely that the same effective pollinator uses them all (“Müllerian
mimicry”). For the species, the advantage of mutual mimicry is that a pollinator is more
likely to visit the flowers of a species if they resemble the flowers of other species it
knows to be rewarding. However, this benefit comes at a cost of increased IPT if
pollinators visit co-flowering species indiscriminately as a result of their similar floral
morphologies.
Generally, it is argued that Müllerian mimicry among species with rewarding
flowers is beneficial if flower visitation is positively density-dependent. However, as
discussed above, visitation is often negatively density-dependent (Sih and Baltus 1987,
Goulson 2000, Ohashi and Yahara 2002). It is conceivable that rare species may benefit
from mutual mimicry, given that a very rare floral morph is unlikely to win pollinator
loyalty (Ackerman 1986). If two rare species are able to win loyalty by converging on a
similar floral morphs, they may experience higher visitation and reproductive success as
a result (Bobisud and Neuhaus 1975). For most species, however, convergence on a
common morphology cannot be expected to promote per-flower or per-plant visitation.
Müllerian mimicry, if it occurs in pollinator-sharing plants, should be favored by
the use of indiscriminate pollinators. Producing flowers that are morphologically distinct
123
from those of other species will not be advantageous if it decreases pollinator visitation
without increasing pollinator constancy, relative to producing flowers similar to those of
other species in the community.
Müllerian mimicry may also be more likely to benefit species with deep,
zygomorphic flowers. By controlling how pollinators approach the flower, zygomorphy
facilitates the precise placement of pollen on a pollinator’s body. This allows several
pollinator-sharing species to deposit and intercept pollen from different parts of the
pollinator’s body, a form of niche partitioning, which, in turn, reduces the cost of sharing
inconstant pollinators due to IPT.
Finally, Müllerian mimicry is more likely to be beneficial if pollinators have large
foraging ranges and long memories, such that a pollinator is likely to encounter many
different species and remember a search image even when the original model has not
been encountered in several days. Grant and Grant (1968) proposed that hummingbird-
pollinated flowers in the United States and Canada may often be red in part because
hummingbirds learn to associate red flowers with copious nectar rewards throughout their
migratory ranges. Insect pollinators are also capable of retaining search images for
extended periods (Heinrich 1976, Gegear and Laverty 2001), and Müllerian mimicry may
therefore be effective in some systems with insect pollinators. Bierzychudek (1981)
found that the hypothesis of facilitation of pollinator visitation due to greater apparent
population density not supported for the tropical butterfly-pollinated plants Asclepias
curassavica (Asclepiadaceae) and Lantana camara (Verbenaceae). However, she
proposed that mimicry may be beneficial across a broader spatial scale, so that butterflies
respond to the abundance of yellow and red flowers throughout their entire foraging
range rather than within flower patches.
For the reasons outlined above, Müllerian mimicry may be likely to occur in
hummingbird-pollinated flowers. Hummingbirds are long-lived, notoriously
indiscriminate floral visitors (Brown and Kodric-Brown 1979, Borgella et al. 2001) that
generally forage on zygomorphic flowers with deep tubes, and many species are
migratory or have broad foraging ranges (Grant and Grant 1968, Feinsinger 1976).
In short, Müllerian mimicry should be favored when pollinators have low
constancy and when IPT can be minimized by precise placement of pollen or differences
124
in flowering phenology. Müllerian mimicry is neither commonly accepted nor
commonly studied (Roy and Widmer 1999).
7. Competitor-free space for pollinators
Just as flowering plants sometimes compete for pollinator visits, pollinators
sometimes compete for floral resources (Steffan-Dewenter and Tscharntke 2000, Goulson
2003, Thomson 2004). When this occurs, some competitors may be displaced to inferior
floral resources (Gross and Mackay 1998, Goulson 2003). Flowers of less preferred
species may thus benefit from the presence of strong or aggressive competitors among
the pollinator fauna, and those that occur closest to patches of the preferred species may
benefit the most, as suggested by Ghazoul (2006). Additionally, the preferred species
may benefit from the presence of the other plant species because the “competitor-free
space” that they provide maintains the populations of the inferior competitors among the
pollinators, providing reproductive assurance for the preferred floral resource in years
when the strongest competitors among the pollinators are not abundant (Ghazoul 2006).
This hypothesis appears to be original to Ghazoul (2006), but the premise was
anticipated by earlier theoretical papers. For example, ideal free distribution theory
predicts that foragers gather more abundantly, but not exclusively, in resource-rich
patches (Fretwell and Lucas 1970, Stebbins 1970). By this model, foragers are expected
to deplete the richest resources most intensely, reducing the rewards per forager in each
patch to the same level. If additional foragers are added, additional, poorer resources
may be exploited, consistent with Ghazoul’s (2006) competitor-free space hypothesis of
facilitation. Similarly, Goulson’s (1994) model of competition for pollinator fidelity
between two plants shows that the less abundant plant may win a share of the pollinator
visits, even if it is less rewarding, if pollinators are so numerous that the flowers of the
more abundant plant are typically depleted of reward.
To my knowledge, the competitor-free space hypothesis has not yet been tested,
and Ghazoul (2006) did not indicate that he believed it applied to his study system.
However, there is evidence that pollinators will shift to less rewarding floral resources
when they lose access to their preferred resources. Rathcke (1988) found that, when Ilex
125
opaca (Aquifoliaceae) stopped flowering, bumblebees switched to foraging on Kalmia
latifolia and Gaylussacia frondosa (both Ericaceae) in greater abundance. Ilex produced
more nectar per flower than Kalmia, and it produced flowers at much greater densities
than Gaylussacia (Rathcke 1988). If inferior competitors for pollinator visits can receive
increased visitation when a superior competitor stops flowering, it is logical that they
may also receive more visits when a competitively dominant pollinator enters the system.
The competitor-free space hypothesis is not clearly distinct from the magnet
species hypothesis, except that Ghazoul (2006) suggests that aggressive displacement of
competitors from rich floral resources (true interference competition) may be involved.
Aggressive displacement occurs in territorial hummingbird species (Grant and Grant
1968) and perhaps some other vertebrate pollinators, but it may not be common among
even reputedly highly competitive invertebrate pollinators (Butz Huryn 1997). If
displacement occurs only through exploitation competition, then this hypothesis
essentially says that pollinators aggregate near rich floral resources and are more likely to
visit less rewarding species if they happen to grow near those resources; this is the
magnet species hypothesis, essentially as Thomson (1978) originally described it.
8. Complementary displays
Ghazoul (2006) also discussed a “complementary attraction” hypothesis that
similar to the pollinator support hypothesis. If different plant species attract different
generalist pollinators, then their combined display will attract a broad spectrum of
generalists (Rathcke 1988, Moeller 2004), which benefits all plant species involved by
reducing variability in total pollinator abundance and overall pollination service (Ghazoul
2006). This mechanism is distinct from the pollinator support hypothesis in that it
involves attraction to a mixed display rather than long-term support of pollinator
populations (Ghazoul 2006), and I therefore consider it a separate hypothesis. The
complementary attraction hypothesis would predict that floral patches with greater plant
species diversity would have more stable pollinator service and greater pollinator species
diversity.
126
It is not clear from Ghazoul’s (2006) limited exposition of the hypothesis whether
pollinator visitation should be expected to increase for all or most species in more diverse
patches. If it is simplistically assumed that each species is highly appealing to one
generalist pollinator and less attractive to other generalists, then each species in a diverse
patch could attract many visits by its “own” pollinator and also benefit from a magnet
species effect, receiving extra visits from the pollinators of the other species. In addition,
if one species’ primary pollinator was not abundant in one year, it would be ensured a
certain minimum level of pollinator service by being part of a multi-species display.
Whether either of these predictions is borne out in real pollination systems has not been
tested, but no real pollination system would meet my simplifying assumptions, and it is
entirely possible that any individual pollinator with a floral preference would be no more
likely to visit a diverse patch or to visit the other species in that patch.
Pollination by deceit:
The magnet species hypothesis has been tested most often with deceptively
pollinated species, which provide no rewards but depend on pollinators to facilitate
mating. Such tests have found that unrewarding flowers that are close to rewarding
neighbors receive more visits and have higher male and female fitness than those that
have few rewarding neighbors (Laverty and Plowright 1988, Laverty 1992,
Alexandersson and Ågren 1996, Johnson et al. 2003, Juillet et al. 2007), apparently
benefitting from the higher concentration of pollinators near rewarding plants. When the
magnet species effect is not detected for a deceptive species (Gumbert and Kunze 2001),
this may be attributable to the spatial scale at which the effect of rewarding plants is
tested (Johnson et al. 2003). The magnet species effect may be detected within areas on
the order of tens of square meters (Johnson et al. 2003), hundreds of square meters
(Laverty and Plowright 1988, Laverty 1992, Juillet et al. 2007), or hectares
(Alexandersson and Ågren 1996, Johnson et al. 2003). However, pollination success for
deceptive species has not been found to be related to the abundances of rewarding
flowers within square-meter plots (Gumbert and Kunze 2001, Johnson et al. 2003).
127
This mechanism is particularly relevant where the unrewarding flower does not
closely resemble the rewarding one; a pollinator is presumably decreasingly likely to
travel far to investigate an unfamiliar flower (and insect pollinators are unlikely to see
flowers more than a few meters away; Spaethe et al. 2001). However, even in cases of
Batesian mimicry (see below), the magnet species effect is likely to apply. Pollinators
are able to learn the spatial locations of rewarding and unrewarding flowers that are
morphologically indistinguishable (Makino and Sakai 2007), and it thus benefits a
Batesian mimic to flower in close proximity to its model (Gumbert and Kunze 2001).
The density-visitation model of facilitation is only likely to be relevant to
deceptive species when densities are so low that genetic isolation becomes a significant
problem. As population density decreases, there must be a point below which the
probability of cross-pollination declines due to very low encounter rates between
individual pollinators and the flowering plants of a deceptive species. At higher
densities, per-flower visitation is expected to decrease with increasing patch density for
deceptive species (Alexandersson and Ågren 1996, Castillo et al. 2002, Pellegrino et al.
2005).
Most deceptive species are in the Orchidaceae, of which approximately one in
three are deceptive, and many of the remaining deceptive species have unisexual flowers
with one deceptive sex that mimics the other, rewarding one (Cozzolino and Widmer
2005, Renner 2006). The prevalence of deception among the orchids is probably not
coincidental. Rather, bilateral symmetry, the packaging of large numbers of pollen grains
in pollinia, and the presence of a column, a reproductive structure made of fused stamens
and styles, may combine to make for efficient pollen placement on a particular part of a
pollinator’s body, rendering deception less costly for orchids than for other angiosperm
families (Nilsson 1992). A deceptive species is unable to rely on pollinator constancy to
minimize HPT, but only orchids appear to have a pre-adaptation for reducing HPT
without obtaining pollinator constancy with rewards. Deceptive non-orchids may benefit
from facilitation of pollinator visits by rewarding neighbors (Laverty and Plowright 1988,
Laverty 1992), but if deceit increases the risk of HPT too greatly, the net effect of
rewarding neighbors may be negative.
128
Perhaps the only combination of mechanisms by which universal deceit (i.e.,
deception by all flowers in the species) could evolve in a species lacking adaptations to
minimize HPT is through reduction in self-pollination combined with reduced resource
costs of reward production (Laverty and Plowright 1988). Pollinators fly further after
visiting an unrewarding flower than a rewarding one (e.g., Burd 1995, Johnson and
Nilsson 1999, Smithson 2002, Johnson et al. 2004b). If the reproductive costs of low
visitation and HPT for deceptive members of a species are smaller than the costs of self-
pollination and reward production for the rewarding members, natural selection will favor
an increasing frequency of pollinator deception.
However, universal deceit seems to be a less likely outcome than reward
polymorphism in non-orchids (e.g., Golubov et al. 1999, Castillo et al. 2002), if the
relative frequencies of the two phenomena are an indication (Renner 2006). A model by
Smithson and Gigord (2003) provides a possible explanation for this. They found that
the optimal strategy for a foraging pollinator when unrewarding plants were rare in a
population was to forage indiscriminately but abandon the unrewarding inflorescences
more quickly than the rewarding ones. If the unrewarding morph was moderately
common, however, it became more advantageous to selectively avoid the deceptive
plants. An empirical test of this model found that bumblebees followed the predicted
strategies (Smithson and Gigord 2003). If a large enough percentage of the individuals in
a species were deceptive, the best strategy must be to avoid the species altogether.
However, as deceit spreads in a population, it is the transition from the strategy of
indiscriminate visitation with rapid abandonment of unrewarding displays to
discrimination against unrewarding plants that is most likely to inhibit a further increase
in the prevalence of deceit in the plant population. Rapid abandonment of unrewarding
inflorescences can result in reduced geitonogamy (Johnson et al. 2004b), but avoidance
of unrewarding plants at a higher prevalence of deceit may more than counter-balance
this advantage. Golubov et al. (1999) found evidence inconsistent with this prediction;
nectarless honey mesquites (Prosopis glandulosa var. torreyana, Fabaceae) experienced
much lower visitation than nectarful individuals, but their female reproductive success
was similar and their male success was higher. In other systems, however,
129
rewardlessness presumably carries a penalty of the sort suggested by Smithson and
Gigord’s (2003) model.
Batesian mimicry
One aspect of facilitation of pollination in deceptive species bears special mention
is Batesian mimicry, or the selectively-favored mimicry of a rewarding model flower by
the flowers of a deceptive species. For Batesian mimicry by deceptive species to be
effective, three requirements must be met (Dafni 1984, Ackerman 1986, Johnson 1994)
(1) the mimic must be rare relative to the model, (2) the mimic and model must be
difficult or impossible for the pollinator distinguish from each other, and (3) the mimic’s
range must be a subset of the model’s range (unless pollinators have long memories;
Waldbauer 1988).
Batesian mimics essentially benefit from facilitation by the magnet species effect,
but with the important difference that, rather than receiving exploratory visits from
pollinators that recognize them as different species from the magnet species, they receive
visits from pollinators that mistake them for their rewarding model (Dafni 1984, Johnson
1994, Gumbert and Kunze 2001). This difference in morphological similarity to the
magnet species, in turn, results in two differences in pollinator behavior. First, while
pollinators that have recently encountered non-mimicking deceptive species are generally
less likely to visit them than naïve pollinators (Makino and Sakai 2007), pollinators that
have recently encountered a Batesian mimic are more likely to visit than are pollinators
that have not (Gumbert and Kunze 2001, Johnson et al. 2003). Pollinators foraging on
the model of a Batesian mimic may learn to distinguish the two, but they are still much
more likely to mistake the mimic for their forage species than are pollinators foraging on
species that do not closely resemble the mimic (Gumbert and Kunze 2001) . Second, if
the pollinator is an insect, because foragers on the model species can learn to recognize
the mimic, but their eyes lack the spatial resolution to recognize the mimic at a distance,
they may frequently approach the mimic closely without landing on it (Gumbert and
Kunze 2001). In contrast, if the pollinator’s forage plant does not resemble the deceptive
130
species, the pollinator can avoid the mimick without approaching closely (Kunze and
Gumbert 2001, Makino and Sakai 2007).
Numerous possible cases of Batesian mimicry have been described (e.g., Dafni
and Ivri 1981, Dafni 1983, Dafni and Calder 1987, Johnson 1994, 2000, Gumbert and
Kunze 2001, Gigord et al. 2002). However, few of these have tested whether a putative
mimic meets the requirements outlined above (Johnson 1994, 2000, Galizia et al. 2005).
Future directions for research on facilitation of pollination
There are standard protocols that researchers of abiotically-mediated competition
and facilitation have come to follow for measuring the direction and strength of plant-
plant interactions, greatly facilitating comparisons among studies in different systems
(e.g., Goldberg et al. 1999). In principle, studies of competition and facilitation mediated
by pollinators are no different than studies of abiotically-mediated interactions. Though
the resources involved behave quite differently (ions, photons, e.g., versus living,
pollinating organisms), the essential questions are quite similar. The goals of research on
pollinator-mediated interactions include determining: (1) how sensitive one species’
pollination success is to the presence, abundance, and density of another species, (2) how
a species’ pollination success is related to its own abundance and density, and (3) what
traits of the plant species involved determine how they interact through shared
pollinators.
Unfortunately, virtually every researcher who chooses to address one of these
questions follows a unique method of doing so. Researchers may use natural or artificial
populations. Possible effect variables include: abundance or density of target plants or
flowers, patch area, patch isolation, abundance or density of associate plants or flowers,
intermixing of target and associate plants, abundance or density of target plants or
flowers relative to associate flowers, types of rewards provided by target or associate
plants, and quantities of rewards provided by target or associate plants. Densities and
abundances may or may not be manipulated experimentally, and the areas within which
they are measured or manipulated range from 1-m2 plots to hectares. Response variables
include: pollinator visits per flower, inflorescence, plant, or patch per hour, fruit set per

131
flower, inflorescence, or plant, seed set per ovule, fruit, inflorescence, or plant, pollen
removal or deposition per flower, and pollen limitation of fruit set per flower, seed set per
ovule, or seed set per fruit. Pollen limitation may be estimated by comparing
unmanipulated, open-pollinated flowers to open-pollinated flowers to which
supplemental outcross pollen is applied by hand, or the hand-pollinated flowers may be
bagged to exclude pollinators, and, if so, bagged, unmanipulated flowers may also be
involved in calculating pollen limitation. Results are reported in widely varying ways, so
that a study on eight flower patches in a single population (Anderson and Beare 1983)
may provide more data points for comparison than a study on many patches in three
populations (Johnson et al. 2004a). Empirical research rarely attempts to explicitly test
models from theoretical work (Feldman 2006 being a notable exception) Thus, while
many studies on competition and facilitation of pollination have been published since
Rathcke’s (1983) review of these phenomena, almost no progress has been made in
synthesizing these diverse studies or understanding what determines whether pollinator-
sharing, co-flowering plants interact positively, negatively, or not at all.
The one area of great progress in the field of pollinator-mediated interactions
among plants is in the study of deceptively pollinated species. Although research in this
area suffers from the same lack of standardized methods that has hindered the study of
interactions between rewarding species, the potential outcomes of interactions with
deceptive species are reduced because (1) the deceptive species will either benefit from
rewarding neighbors are show no response to them, since it has little capacity to
experience reduced pollination success, and (2) the deceptive species is always the target
species. The effect of deceptive species on other species has only been tested in my own
study of the effect of mayapple (Podophyllum peltatum, Berberidaceae) on the pollination
of wild geranium (Geranium maculatum, Geraniaceae). Geraniums were neither more
nor less pollen limited within five meters of mayapple flowers than they were more than
fifteen meters away. This result was predictable; deceptive species interact so rarely with
pollinators that any pollinator-mediated effects they have on other species will almost
certainly be miniscule. While this may be an effective argument against investing limited
resources on investigating the effects of deceptive species on the pollination success of
their neighbors, the lack research into these effects reflects the overwhelming tendency
132
for pollinator-mediated interactions to be studied in only one direction and is probably
not indicative of any well-reasoned avoidance of the question.
It is a sign of poor focus in a field of study when progress in understanding the
fundamental patterns and processes occurs only where the possible outcomes of an
interaction are limited. I strongly recommend that future studies on pollinator-mediated
plant-plant interactions follow the model set out by studies on abiotically-mediated
interactions. Specifically, for each interaction, in each direction, the target species should
be exposed to environments in which the associate is present and environments in which
it is absent. For an individual study, it may be valuable to include a range of densities or
abundances of targets or associates, and abundances may be manipulated by arranging a
variety of different artificial arrays or by transplantation or removal in natural
populations, but at a minimum, response variables must be measured on the target in the
presence and absence of the associate.
In addition, the use of a certain minimum set of response variables would be a
tremendous boon to the enterprise of synthesizing the results of multiple studies.
Visitation per flower (or head) per hour is a valuable metric for assessing pollinator
responses to differences in plant abundances and densities. Fruit set per flower and seed
set per fruit are usually easy to measure, and while they are imperfect surrogates for
individual fitness, (Ashman et al. 2004, Knight et al. 2005), they are, nevertheless,
commonly accepted surrogates. Beyond this, measures of the degree of pollen limitation
of these variables are useful. There is a standard measure of pollen limitation of fruit set:
PL = 1 – open-pollinated-control fruit set / open-pollinated-outcross-supplemented fruit
set, with negative values of PL rounded up to zero (Larson and Barrett 2000). The same
basic equation can generally be applied to seed set, though some alternative may be
advisable if negative values of PL are frequent.
Ecological systems are enormously complex, and there is only so much that can
be accomplished using reductionist approaches. Nevertheless, it should be recognized
that such approaches are often very useful in testing specific mechanisms, bringing
suggestive patterns into clearer focus, and determining how much a mechanism or model
can explain. For example, Feldman (2006) performed a field test of a mathematically
explicit model by Feldman et al. (2004). The model predicted how a particular response

133
variable (visits to a patch per unit of time) should change with a particular effect variable
(plant density within the patch) in order for facilitation by the density-visitation curve
hypothesis to occur, and the field experiment tested for that relationship (Feldman 2006).
He did not find facilitation by this mechanism, (although he did find results consistent
with the mate availability hypothesis), but the results were clear, as was the mechanism
being tested.
Because ecological systems are extremely complex, reductionist methods of
inquiry may never be sufficient for understanding them. There is a certain value in being
able to demonstrate that, in a wide range of natural systems, plants do interact with each
other through their shared pollinators. Nevertheless, reductionist methods do have an
important role to play in ecological research. Simplified, controlled systems allow the
researcher to select a particular hypothesis for evaluation, determine how its predictions
differ from those of other hypotheses, and put it to the test. The system or replicates of it
can then be altered to perform the test again and probe the range of outcomes that the
hypothesis in question can explain.
The density-visitation curve hypothesis would seem to be highly amenable to
testing by this method. Although it is not mathematically explicit, it does predict a clear
qualitative pattern of interaction between two quantifiable variables. Visitation per
flower per hour should increase with increasing patch density, level off, then decline.
This is not a prediction about reproductive success, which may be confounded by IPT or
the mate availability effect (though data on reproductive success as a function of patch
density would certainly be valuable). It is not a prediction of visitation per plant or patch.
It is therefore a hypothesis that has almost been tested many times over (e.g., Anderson
and Beare 1983, Alexandersson and Ågren 1996, Feldman 2006, Zorn-Arnold and Howe
2007) but truly tested on few occasions (e.g., Kunin 1997, Bosch and Waser 2001, Steven
et al. 2003, Ghazoul 2006). Other hypotheses may be similarly amenable to reductionist
inquiry (the magnet species effect, complementary displays, reward complementarity,
and possibly mate availability), while others depend on whole ecological systems and are
unlikely to function in simplified model systems (pollinator support, Müllerian mimicry,
competitor-free space).
134
Finally, interactions should be evaluated in two directions, when feasible.
Different mechanisms of pollination make different predictions about two-way
interactions, but many make very similar predictions in one direction. After all, each of
these hypotheses is intended to explain the relatively narrow range of phenomena that can
be labeled “facilitation of pollination.” If a positive result is consistent with multiple
hypotheses, its power to test any one of them is diminished. Although any study that has
the power to disprove a hypothesis has scientific value, its value is enhanced if it is able
to disprove all but one of several alternative hypotheses. In studies on facilitation of
pollination, distinguishing the magnet species hypothesis from the density-visitation
curve hypothesis and the reward complementarity hypothesis depends on testing
interactions in two directions.
Each of the hypotheses presented in this review is testable, though some are
clearly more tractable than others. However, resolving which hypotheses have true
explanatory power depends on studies that are clear in defining the hypotheses they are
testing and consistent enough in their methods and measurements to facilitate
comparisons of greater sophistication than narrative reviews or vote-counting procedures.
Studies designed to test a variety of hypotheses at once and leave no more than one of
them standing would be extremely helpful, though the difficulties in designing such
experiments are considerable. The field of pollinator-mediated interactions among plants
is highly complex, but a hypothesis-driven approach, in which certain experiments are
conducted and certain measurements made in each study, has tremendous potential to
clarify how plants interact via shared pollinators and, with any luck, how plant-pollinator
interactions contribute to the structure and function of ecological communities.
135
Literature cited
Ackerman, J. D. 1986. Mechanisms and evolution of food-deceptive pollination systems in orchids. Lindleyana 1:108-113.
Ågren, J., J. Ehrlén, and C. Solbreck. 2008. Spatio-temporal variation in fruit production and seed predation in a perennial herb influenced by habitat quality and population size. Journal of Ecology 96:334-345.
Alexandersson, R. and J. Ågren. 1996. Population size, pollinator visitation and fruit production in the deceptive orchid Calypso bulbosa. Oecologia 107:533-540.
Allee, W. C. 1931. Animal aggregations. University of Chicago Press, Chicago.Allee, W. C. 1951. The social life of animals. Beacon, Boston.Anderson, R. C. and M. H. Beare. 1983. Breeding system and pollination ecology of
Trientalis borealis (Primulaceae). American Journal of Botany 70:408-415.Ashman, T.-L., T. M. Knight, J. A. Steets, P. Amarasekare, M. Burd, D. R. Campbell, M.
R. Dudash, M. O. Johnston, S. J. Mazer, R. J. Mitchell, M. T. Morgan, and W. G. Wilson. 2004. Pollen limitation of plant reproduction: ecological and evolutionary causes and consequences. Ecology 85:2408-2421.
Ashworth, L., R. Aguilar, L. Galetto, and M. A. Aizen. 2004. Why do pollination generalist and specialist plant species show similar reproductive susceptibility to habitat fragmentation? Journal of Ecology 92:717-719.
Baker, H. G. 1963. Evolutionary mechanisms in pollination biology. Science 139:877-883.
Baker, H. G. 1976. "Mistake pollination" as a reproductive system with special reference to the Caricaceae.in J. Burley and B. T. Styles, editors. Tropical trees: variation, breeding, and conservation. Academic Press, London.
Bartomeus, I., M. Vilá, and L. Santamariá. 2008. Contrasting effects of invasive plants in plant-pollinator networks. Oecologia 155:761-770.
Bascompte, J., P. Jordano, C. J. Melián, and J. M. Olesen. 2003. The nested assembly of plant-animal mutualistic networks. Proceedings of the National Academy of Sciences 100:9383-9387.
Bobisud, L. E. and R. J. Neuhaus. 1975. Pollinator constancy and survival of rare species. Oecologia 21:263-272.
Borgella, R. J., A. A. Snow, and T. A. Gavin. 2001. Species richness and pollen loads of hummingbirds using forest fragments in southern Costa Rica. Biotropica 33:90-109.
Bosch, M. and N. M. Waser. 2001. Experimental manipulation of plant density and its effect on pollination and reproduction of two confamilial montane herbs. Oecologia 126:76-83.
Brown, J. H. and A. Kodric-Brown. 1979. Convergence, competition, and mimicry in a temperate community of hummingbird-pollinated flowers. Ecology 60:1022-1035.
Burd, M. 1995. Pollinator behavioural responses to reward size in Lobelia deckenii: no escape from pollen limitation of seed set. Journal of Ecology 83:865-872.
Butz Huryn, V. M. 1997. Ecological impacts of introduced honey bees. The Quarterly Review of Biology 72:275-297.
136
Campbell, D. R. 1985. Pollen and gene dispersal: the influences of competition for pollination. Evolution 39:418-431.
Campbell, D. R. and A. F. Motten. 1985. The mechanism of competition for pollination between two forest herbs. Ecology 66:554-563.
Castillo, R. A., C. Cordero, and C. A. Domínguez. 2002. Are reward polymorphisms subject to frequency- and density-dependent selection? Evidence from a monoecious species pollinated by deceit. Journal of Evolutionary Biology 15:544-552.
Cozzolino, S. and A. Widmer. 2005. Orchid diversity: an evolutionary consequence of deception? Trends in Ecology & Evolution 20:487-494.
Dafni, A. 1983. Pollination of Orchis caspia--a nectarless plant which deceives the pollinators of nectariferous species from other plant families. Journal of Ecology 71:467-474.
Dafni, A. 1984. Mimicry and deception in pollination. Annual Review of Ecology and Systematics 15:259-278.
Dafni, A. and D. M. Calder. 1987. Pollination by deceit and floral mimesis in Thelymitra antennifera (Orchidaceae). Plant Systematics and Evolution 158:11-22.
Dafni, A. and Y. Ivri. 1981. Floral mimicry between Orchis israelitica Baumann and Dafni (Orchidaceae) and Bellevalia flexuosa Boiss. (Liliaceae). Oecologia 49:229-232.
Davis, H. G., C. M. Tayler, J. G. Lambrinos, and D. R. Strong. 2004. Pollen limitation causes an Allee effect in a wind-pollinated invasive grass (Spartina alterniflora). Proceedings of the National Academy of Sciences 101:13804-13807.
Feinsinger, P. 1976. Organization of a tropical guild of nectarivorous birds. Ecological Monographs 46:257-291.
Feldman, T. S. 2006. Pollinator aggregative and functional responses to flower density: does pollinator response to patches of plants accelerate at low-densities? Oikos 115:128-140.
Feldman, T. S., W. F. Morris, and W. G. Wilson. 2004. When can two plant species facilitate each other's pollination? Oikos 105:197-207.
Fischer, M., M. Hock, and M. Paschke. 2003. Low genetic variation reduces cross-compatibility and offspring fitness in populations of a narrow endemic plant with a self-incompatibilty system. Conservation Genetics 4:325-336.
Fishman, L. and R. Wyatt. 1999. Pollinator-mediated competition, reproductive character displacement, and the evolution of selfing in Arenaria uniflora(Caryophyllaceae). Evolution 53:1723-1733.
Fontaine, C., I. Dajoz, J. Meriguet, and M. Loreau. 2006. Functional diversity of plant-pollinator interaction webs enhances the persistence of plant communities. PLoS Biology 4:129-135.
Frankie, G. W., H. G. Baker, and P. A. Opler. 1974. Comparative phenological studies of trees in tropical wet and dry forests in the lowlands of Costa Rica. Journal of Ecology 62:881-919.
Fretwell, S. D. and H. L. Lucas. 1970. On territorial behaviour and other factors influencing habitat distribution in birds. I. Theoretical development. Acta Biotheoretica 19:16-36.

137
Galizia, C. G., J. Kunze, A. Gumbert, A.-K. Borg-Karlson, S. Sachse, C. Markl, and R. Menzel. 2005. Relationship of visual and olfactory signal parameters in a food-deceptive flower mimicry system. Behavioral Ecology 16:159-168.
Gegear, R. J. and T. M. Laverty. 2001. The effect of variation among floral traits on flower constancy of pollinators.in L. Chittka and J. D. Thomson, editors. Cognitive Ecology of Pollination. Cambridge University Press, New York.
Ghazoul, J. 2006. Floral diversity and the facilitation of pollination. Journal of Ecology 94:295-304.
Gigord, L. D. B., M. R. Macnair, M. Stritesky, and A. Smithson. 2002. The potential for floral mimicry in rewardless orchids: an experimental study. Proceedings of the Royal Society of London. Series B, Biological Sciences 269:1389-1395.
Goldberg, D. E., T. Rajaneimi, J. Gurevitch, and A. Stewart-Oaten. 1999. Empirical approaches to quantifying interaction intensity: competition and facilitation along productivity gradients. Ecology 80:1118-1131.
Golubov, J., L. E. Eguiarte, M. C. Mandujano, J. López-Portillo, and C. Montaña. 1999. Why be a honeyless honey mesquite? Reproduction and mating system of nectarful and nectarless individuals. American Journal of Botany 86:955-963.
Goulson, D. 1994. A model to predict the influence of insect flower constancy on interspecific competition between insect pollinated plants. Journal of Theoretical Biology 168:309-314.
Goulson, D. 2000. Why do pollinators visit proportionally fewer flowers in large patches? Oikos 91:485-492.
Goulson, D. 2001. Why do pollinators visit proportionally fewer flowers in large patches? Oikos 91:485-492.
Goulson, D. 2003. Effects of introduced bees on native ecosystems. Annual Review of Ecology and Systematics 34:1-26.
Grant, K. A. and V. Grant. 1968. Hummingbirds and their flowers. Columbia University Press, New York.
Gross, C. L. and D. Mackay. 1998. Honeybees reduce fitness in the pioneer shrub Melastoma affine (Melastomataceae). Biological Conservation 86:169-178.
Gumbert, A. and J. Kunze. 2001. Colour similarity to rewarding model plants affects pollination in a food deceptive orchid, Orchis boryi. Biological Journal of the Linnean Society 72:419-433.
Hackney, E. E. and J. B. McGraw. 2001. Experimental demonstration of an Allee effect in American ginseng. Conservation Biology 15:129-136.
Heinrich, B. 1975. Bee flowers: a hypothesis on flower variety and blooming times. Evolution 29:325-334.
Heinrich, B. 1976. The foraging specializations of individual bumblebees. Ecological Monographs 46:105-128.
Heinrich, B. 1979. Bumblebee Economics. Harvard University Press, Cambridge, MA.Heithaus, E. R. 1974. The role of plant-pollinator interactions in determining community
structure. Annals of the Missouri Botanical Garden 61:675-691.Johnson, S. D. 1994. Evidence for Batesian mimicry in a butterfly-pollinated orchid.
Biological Journal of the Linnean Society 53:91-104.
138
Johnson, S. D. 2000. Batesian mimicry in the non-rewarding orchid Disa pulchra, and its consequences for pollinator behaviour. Biological Journal of the Linnean Society 71:119-132.
Johnson, S. D., C. L. Collin, H. J. Wissman, E. Halvarsson, and J. Ågren. 2004a. Factors contributing to variation in seed production among remnant populations of the endangered daisy Gerbera aurantiaca. Biotropica 36:148-155.
Johnson, S. D. and L. A. Nilsson. 1999. Pollen carryover, geitonogamy, and the evolution of deceptive pollination systems in orchids. Ecology 80:2607-2619.
Johnson, S. D., C. I. Peter, and J. Ågren. 2004b. The effects of nectar addition on pollen removal and geitonogamy in the non-rewarding orchid Anacamptis morio. Proceedings of the Royal Society of London. Series B, Biological Sciences 271:803-809.
Johnson, S. D., C. I. Peter, A. Nilsson, and J. Ågren. 2003. Pollination success in a deceptive orchid is enhanced by co-occurring rewarding magnet plants. Ecology 84:2919-2927.
Juillet, N., M. A. Gonzalez, P. A. Page, and L. D. B. Gigord. 2007. Pollination of the European food-deceptive Traunsteinera globosa (Orchidaceae): the importance of nectar-producing neighbouring plants. Plant Systematics and Evolution 265:123-129.
Knight, T. M., J. A. Steets, J. C. Vamosi, S. J. Mazer, M. Burd, D. R. Campbell, M. R. Dudash, M. O. Johnston, R. J. Mitchell, and T.-L. Ashman. 2005. Pollen limitation of plant reproduction: pattern and process. Annual Review of Ecology, Evolution, and Systematics 36:467-497.
Kunin, W. E. 1997. Population size and density effects in pollination: pollinator foraging and plant reproductive success in experimental arrays of Brassica kaber. Journal of Ecology 85:225-234.
Kunze, J. and A. Gumbert. 2001. The combined effect of color and odor on flower choice behavior of bumble bees in flower mimicry systems. Behavioral Ecology 12:447-456.
Larson, B. M. H. and S. C. H. Barrett. 2000. A comparative analysis of pollen limitation in flowering plants. Biological Journal of the Linnean Society 69:503-520.
Laverty, T. M. 1992. Plant interactions for pollinator visits: a test of the magnet species effect. Oecologia 89:502-508.
Laverty, T. M. and R. C. Plowright. 1988. Fruit and seed set in mayapple (Podophyllum peltatum): influence of intraspecific factors and local enhancement near Pedicularis canadensis. Canadian Journal of Botany 66:173-178.
Lehrer, M., M. V. Srinivasan, and S. W. Zhang. 1990. Visual edge detection in the honeybee and its chromatic properties. Proceedings of the Royal Society of London. Series B, Biological Sciences 238:321-330.
Lopezaraiza-Mikel, M. E., R. B. Hayes, M. R. Whalley, and J. Memmott. 2007. The impact of an alien plant on a native plant–pollinator network: an experimental approach. Ecology Letters 10:539-550.
Macior, L. W. 1970. The pollination ecology of Pedicularis in Colorado. American Journal of Botany 57:716-728.
139
Makino, T. T. and S. Sakai. 2007. Experience changes pollinator responses to floral display size: from size-based to reward-based foraging. Functional Ecology 21:854-863.
Memmott, J., N. M. Waser, and M. V. Price. 2004. Tolerance of pollination networks to species extinctions. Proceedings of the Royal Society of London. Series B, Biological Sciences 271.
Moeller, D. A. 2004. Facilitative interactions among plants via shared pollinators. Ecology 85:3289-3301.
Moeller, D. A. 2005. Pollinator community structure and sources of spatial variation in plant-pollinator interactions in Clarkia xantiana ssp xantiana. Oecologia 142:28-37.
Mosquin, T. 1971. Competition for pollinators as a stimulus for the evolution of flowering time. Oikos 22:398-402.
Murphy, S. D. 2000. Field testing for pollen allelopathy. Journal of Chemical Ecology 26:2155-2172.
Nilsson, A. 1992. Orchid pollination biology. Trends in Ecology & Evolution 7:255-259.Ohashi, K. and T. Yahara. 2002. Visit larger displays but probe proportionally fewer
flowers: counterintuitive behaviour of nectar-collecting bumble bees achieves an ideal free distribution. Functional Ecology 16:492-503.
Pellegrino, G., D. Caimi, M. E. Noce, and A. Musacchio. 2005. Effects of local density and flower colour polymorphism on pollination and reproduction in the rewardless orchid Dactylorhiza sambucina (L.) Soò. Plant Systematics and Evolution 251:119-129.
Pleasants, J. M. 1980. Competition for bumblebee pollinators in Rocky Mountain plant communities. Ecology 61:1446-1459.
Poole, R. W. and B. Rathcke. 1979. Regularity, randomness, and aggregation in flowering phenologies. Science 203:470-471.
Rathcke, B. 1983. Competition and facilitation among plants for pollination. Pages 305-329 in L. Real, editor. Pollination Biology. Academic Press, Inc., Orlando, FL.
Rathcke, B. 1988. Interactions for pollination among coflowering shrubs. Ecology 69:446-457.
Reader, R. J. 1975. Competitive relationships of some bog ericads for major insect pollinators. Canadian Journal of Botany 53:1300-1305.
Renner, S. S. 2006. Rewardless flowers in the angiosperms and the role of insect cognition in their evolution. Pages 123-144 in N. M. Waser and J. Ollerton, editors. Plant-Pollinator Interactions: From Specialization to Generalization. University of Chicago Press, Chicago.
Robertson, C. 1895. The philosphy of flower seasons, and the phaenological relations of the entomophilous flora and the anthophilous insect fauna. The American Naturalist 29:97-117.
Roy, B. A. and A. Widmer. 1999. Floral mimicry: a fascinating yet poorly understood phenomenon. Trends in Plant Science 4:325-330.
Schemske, D. W. 1981. Floral convergence and pollinator sharing in two bee-pollinated tropical herbs. Ecology 62:946-954.
Sih, A. and M.-S. Baltus. 1987. Path size, pollinator behavior, and pollinator limitation in catnip. Ecology 68:1679-1690.

140
Smithson, A. 2002. The consequences of rewardlessness in orchids: reward-supplementation experiments with Anacamptis morio (Orchidaceae). American Journal of Botany 89:1579-1587.
Smithson, A. and L. D. B. Gigord. 2003. The evolution of empty flowers revisited. The American Naturalist 161:537-552.
Spaethe, J., J. Tautz, and L. Chittka. 2001. Visual constraints in foraging bumblebees: flower size and color affect search time and flight behavior. Proceedings of the National Academy of Sciences 98:3898-3903.
Stebbins, G. L. 1970. Adaptive radiation of reproductive characteristics in angiosperms, I: pollination mechanisms. Annual Review of Ecology and Systematics 1:307-326.
Steffan-Dewenter, I. and T. Tscharntke. 2000. Resource overlap and possible competition between honey bees and wild bees in central Europe. Oecologia 122:288-296.
Steven, J. C., T. P. Rooney, O. D. Boyle, and D. M. Waller. 2003. Density-dependent pollinator visitation and self-incompatibility in upper Great Lakes populations of Trillium grandiflorum. Journal of the Torrey Botanical Society 130:23-29.
Stiles, F. G. 1975. Ecology, flowering phenology, and hummingbird pollination of some Costa Rican Heliconia species. Ecology 56:285-301.
Stiles, F. G. 1977. Coadapted competitors: the flowering seasons of hummingbird-pollinated plants in a tropical forest. Science 198:1177-1178.
Stiles, F. G. 1979. Response to Poole and Rathcke: Regularity, randomness, and aggregation in flowering phenologies. Science 203:471.
Tepedino, V. J. and N. L. Stanton. 1981. Diversity and competition in bee-plant communities on short-grass prairie. Oikos 36:35-44.
Thomson, D. 2004. Competitive interactions between the invasive European honey bee and native bumble bees. Ecology 85:458-470.
Waldbauer, G. P. 1988. Aynchrony between Batesian mimics and their models. The American Naturalist 131:S103-S121.
Waser, N. M. 1978a. Competition for hummingbird pollination and sequential flowering in two Colorado wildflowers. Ecology 59:934-944.
Waser, N. M. 1978b. Interspecific pollen transfer and competition between co-occurring plant species. Oecologia 36:223-236.
Waser, N. M. 1983. Competition for pollination and floral character differences among sympatric plant species: a review of evidence. Pages 277-293 in C. E. Jones and R. J. Little, editors. Handbook of Experimental Pollination Biology. Van Nostrand Reinhold Company Inc., New York.
Waser, N. M. and L. Real. 1979. Effective mutualism between sequentially flowering plant species. Nature 281:670-672.
Zorn-Arnold, B. and H. F. Howe. 2007. Density and seed set in a self-compatible forb, Penstemon digitalis (Plantaginaceae), with multiple pollinators. American Journal of Botany 94:1594-1602.
141
Chapter V
Conclusions
Chapter II: Is self-compatibility in mayapple (Podophyllum peltatum L.) determined by
environmental conditions?
The results of my surveys of self-compatibility, maternal plant size, and
environmental conditions were consistent with the hypothesis that the stringency of
selective ovule abortion is greater in plants with more limited resources. All of the
patches in Site 3 produced fruits when self-pollinated (though one may not have
produced any seeds), while no patches in any other site did.
Environmental measurements suggested that light may be the resource that limits
the expression of self-compatibility in mayapple. Site 3 had the most open canopy of the
five sites used in this study. Thus, self-compatible patches were found under brighter
light conditions than self-incompatible patches. If selective ovule abortion is more
stringent when light is less available (i.e., when the maternal parent has less stored
carbohydrate available for seed maturation), then self-compatible plants in shadier sites
may abort all self-fertilized ovules and thus appear to be self-incompatible. The presence
of detectable self-compatibility only in the best-lit site is consistent with this prediction.
In contrast, water did not apparently limit the ability of inbred ovules to develop, since
Site 3 had the driest, sandiest soils with the lowest organic content of the five sites.
A role of resource availability in the expression of self-compatibility was further
supported by data on outcross fruit set and mean ramet height. If self-compatibility is
expressed only in plants with abundant resources, the high availability of resources in
these plants should also be evident in other ways. Fruit and seed set for hand-outcrossed
fruits is generally expected to be limited by resources (since pollen receipt does not limit
ovule fertilization). As expected, Site 3 had the highest mean outcross fruit set and seed

142
set of the five sites. Similarly, greater resource availability in mayapple should be
expressed in greater vegetative growth, through more rapid clonal expansion and taller
mean ramet height. While clonal expansion was not monitored, Site 3 was found to have
the tallest ramets of any site. Thus, self-compatible patches in my study system occurred
in brighter conditions and had higher fecundity from outcrossed flowers and taller ramets
than self-incompatible patches.
All of the results of this study are consistent with the hypothesis that the
probability of an inbred ovule reaching maturity depends on the resources available to it
from the maternal plant. However, particularly because all self-compatible patches were
in one site, it is impossible to conclude that variation in apparent self-incompatibility (the
inability to produce seeds from self-pollination) does not simply reflect variation in true
self-incompatibility (the presence of an effective mechanism to prevent ovule fertilization
by self pollen). Mayapple’s clonal growth should prove useful in separating these
possibilities. If patches of mayapple containing ramets from each clone in the study were
established in each site, or under a range of light intensities in a common garden, the
extent to which apparent self-incompatibility depends on genotype versus resource
availability should become clear in breeding system experiments performed after the
plants have had several years to respond to their new environmental conditions.
Chapter III: Pollinator-mediated interactions between mayapple (Podophyllum peltatum
L.) and co-flowering neighbors: a test of the benefits of having attractive neighbors
Pollen limitation of fruit set for mayapple was inconsistently affected by the local
abundance of co-flowering rewarding plants. Three species (garlic mustard, spring
beauty, and violets) significantly affected pollen limitation of fruit or seed set in 2005,
but the only effect of heterospecific neighbors on pollen limitation in 2006 or 2007 was
an effect of violet on pollen limitation of fruit set in 2007. Overall, garlic mustard and
spring beauty depressed pollination success for mayapple in 2005 based on fruit set data.
Violets facilitated pollination based on fruit set data, but depressed pollination success
based on seed set. Removing neighbors within a meter of a subset of the mayapple
patches in 2006 had no effect on pollen limitation. Pollination quality was not
143
significantly better in a large reserve with a history of light disturbance (NWP) than in
smaller fragments with histories of heavy disturbance. This suggests that habitat
disruption does not explain mayapple’s low pollination success or that the pollinator
network in NWP is disrupted as badly as the networks in the other five sites. Conspecific
flower density also had no effect on pollination success, in contrast to results of other
studies on deceptive species.
It is possible that any positive effect of neighboring flowers on mayapple’s
visitation rate was negated by negative effects of heterospecific pollen receipt. Mayapple
flowers that were hand-pollinated with wild geranium pollen prior to hand-pollination
with outcross pollen (in addition to natural pollination) did not have significantly lower
fruit or seed set than flowers receiving only the supplemental outcross pollination
treatment. However, by the same test, the pollen of woodland phlox significantly
depressed fruit set per flower. Thus, there is some potential for heterospecific pollen to
interfere with mayapple’s pollination success. Phlox pollen may have had a more
significant effect than geranium pollen because it is smaller, which would leave smaller
pore spaces for the subsequently applied mayapple pollen to contact the stigma and may
allow it to adhere more firmly to the stigma. If phlox pollen is more effective in
interfering with ovule fertilization than geranium pollen due to its smaller size, this would
suggest that most species have greater potential to interfere with fertilization than
geranium does. Geranium pollen grains were found to be 82 microns in diameter, on
average, while the pollen grains of most other species collected ranged from 16 to 45
microns (spring beauty was the one exception, averaging 72 microns).
Very few studies on pollinator-mediated interactions between plants consider the
interaction in two directions. In the case of unrewarding species, this unidirectional
perspective assumes that the unrewarding species has no effect on the pollination success
of its neighbors. However, if pollinators perceive patch quality to be lower when
unrewarding species are present, or if pollen from the unrewarding species interferes with
ovule fertilization in the flowers of its heterospecific neighbors, the species is a resource
parasite (sensu Rathcke 1983, citing personal communication from B. A. Hazlett) rather
than a commensalist. Mayapple did not significantly influence the pollination success of
wild geranium, and adding mayapple pollen to geranium stigmas by hand did not
144
significantly interfere with the effect of adding outcross pollen by hand. However, the
difference in fruit set between outcross-supplemented flowers and HPT flowers was
significant for geraniums within five meters of mayapple patches. The mechanism by
which heterospecific pollination by hand could be effective only when the pollen source
is within five meters is unclear.
Observed pollinators approaching mayapple, taken as a group, shifted from
approaching flowers without contact or contacting flowers without seeking rewards to
gathering pollen from flowers as the season progressed. However, most of this shift was
because all observations of honeybee visits occurred in the second week of mayapple
flowering. Pollinators that approached or visited mayapple were seen in patches under
canopies with low leaf-area indices, in patches with more flowers, and in patches with
more conspecific neighboring flowers within five meters. This is consistent with the
behavior of rewarded pollinators. Rewarded pollinators may use mayapple’s strong scent
to locate flowers and patches, while deceived pollinators may use it to avoid them, as
indicated by the tendency for approaches without contact to occur later in the day (when
it is warmer and the scent of mayapple flowers stronger) than approaches with contact but
without foraging attempts.
Mayapple was not less pollen limited near forest edges than it was far from them.
This may be because the assumptions that edges would be better lit and have greater
floral abundance and diversity than interiors were not met. Pollen limitation of fruit was
lower in patches under canopies with low leaf-area indices, and patches that received
observed pollinator visits had lower leaf-area indices than those that did not, suggesting
that the assumption that better-lit environments would be better environments for
pollination was valid.
Future research should evaluate when the magnet species effect is likely to be
relevant, particularly where deceptive species are not involved, at what spatial scales it
can be detected, how it affects the magnet species, and what effect it has on the evolution
and stability of reward provisioning for both the magnet species and the beneficiary of
the effect. Furthermore, the effect of facilitation of pollinator visits on heterospecific
pollen transfer and the net result of neighboring co-flowering plants’ effects on each
other’s visitation and probability of HPT need to be evaluated.
145
Chapter IV: Facilitation of pollination among pollinator-sharing plants: overview and
prescriptions for future study
There are at least eight mechanisms by which one group of plants may facilitate
another group’s pollinator visitation or pollination success. Each mechanism has clear
predictions and limitations, but it is rare that two studies test the same mechanism in the
same way. Studies use different response variables and manipulate the abundances of
target and associate species in different ways. The resultant variation in research
methodologies and data presentation greatly complicates comparison among studies and
synthesis of data from multiple sources. As a result, progress in the field of facilitation of
pollination in the past 25 years has come largely in the form of the accumulation of
studies documenting its occurrence, as well as the addition of a few new hypotheses.
Most of the hypotheses presented have been shown to work somewhere, and some have
been shown not to work somewhere, but determining why a hypothesis works in some
systems but does not work in other, similar systems has remained elusive.
The one area in which definite progress has been made is that of the facilitation of
pollinator visitation for species that deceive their pollinators. Because these species have
very low visitation rates and fecundities, the effect of rewarding, co-flowering neighbors
on these traits are unlikely to be negative. The lack of potential for competition
eliminates the need to determine what factors might determine whether the interaction is
facilitative or competitive.
In contrast, progress in defining the boundary between competition and
facilitation is badly needed for interactions between rewarding plants, but the challenges
of synthesizing studies using widely divergent methodologies and measurements have
prevented the development of any clearer idea of what determines whether a pollinator-
mediated plant-plant interaction is facilitative, competitive, or parasitic.
Researchers should look to studies of facilitation and competition among plants
outside of the realm of pollination as models on which to pattern future studies.
Although the reductionist methods used in such studies have their limitations, the dearth

146
of powerful theories of indirect interactions in pollination biology indicates that
reductionist methods also have their advantages.
Interactions must also be tested in two directions. The predictions of some of the
facilitation hypotheses are indistinguishable in one direction: the presence of species B is
expected to increase visitation (or fruit set or seed set) for species A through their
interactions with shared pollinators.
Most of the hypotheses presented in Chapter IV are amenable to testing by
reductionist methods; they make clear predictions about pairwise interactions at a spatial
scale at which manipulations of target species and associate species abundances are
feasible.
147
Literature cited
Rathcke, B. 1983. Competition and facilitation among plants for pollination. Pages 305-329 in L. Real, editor. Pollination Biology. Academic Press, Inc., Orlando, FL.

148
Appendix
Details on the natural history of mayapple and my study sites
Overview of the natural history of mayapple
Mayapple is a common understory herb of deciduous forests in the eastern United
States and Canada. It is extensively clonal, spreading by branching rhizomes. Rhizome
segments disintegrate at approximately 6-12 years of age and have, very roughly, a 50%
chance of branching in each year, with the probability of branching being lower when the
rhizome makes a vegetative ramet or a fruit-bearing sexual ramet than if it makes a non-
fruiting sexual ramet (Sohn and Policansky 1977). Ramets that are physiologically
connected by their rhizomes are well-integrated; of radiolabeled carbon fixed in a
mayapple shoot, 5 to 10% may be translocated to a connected shoot through the
rhizomes, at a distance of up to a meter, and physiological integration of mineral nutrients
and water occurs over greater distances (Landa et al. 1992). However, Landa et al.
(1992) found that almost 90% of rhizome systems they harvested were composed of a
single ramet at the tip of a chain of rhizome segments. Thus, a mayapple clone can be
considered, to a fair approximation, to be a patch of physiologically independent plants
that are genetically identical, though the few ramets that are connected are well-
integrated (Landa et al. 1992), and as many as 8 ramets may be connected to the same
rhizome network (Sohn and Policansky 1977). Clonal patches can extend up to ten or
more meters in diameter, though many patches of such size might be polyclonal. Stands
of mayapple may extend over one hundred meters, but the genotypic composition of such
stands has never been determined; they may be single clones of great age or multiple
clones that have grown together into a single patch. In most of the second-growth
fragments used in this study, where patches are rarely as much as ten meters in diameter,
149
dozens of patches were typically found within any hectare, making it highly unlikely that
any stand spanning as much as fifty meters in diameter could be a single clone.
Vegetative ramets and flowering ramets of mayapple are morphologically distinct.
The above-ground portion of a vegetative ramet is a single peltate leaf with two to eight
deep lobes, larger leaves having more lobes. Below ground, a dormant bud can be found
in what appears to be a node on the rhizome at the base of the leaf (this node is actually
several nodes and short internodes; Landa et al. 1992). The above-ground portion of a
flowering ramet is a stem with two opposite leaves that resemble the leaf of a vegetative
ramet, except that they are cordate rather than peltate. A single flower typically emerges
from the fork where the leaves meet the stem. Sexual ramets sometimes have three
leaves, one leaf, or no leaves, and they rarely have two or three small flowers instead of a
single large one. Sexual ramets do not have a dormant bud on the node at the base of the
shoot.
The flower is large (3-6 cm in diameter), white (pink in some subspecies),
fragrant, bowl-shaped, and nodding, with 6 to 10 petals, 12 to 24 stamens, and a single,
unilocular pistil with 15-100 ovules (pers. obs.). The flower lacks nectar but has
abundant pollen (Laverty and Plowright 1988, and pers. obs., Laverty 1992). Flowers
open in May, usually in the second half of the month, shedding their three to six sepals in
the process. The flowers within a clone generally open over one to three days, and a
large percentage of the flowers in a population may open in a single warm (> 18°C) day
(pers. obs.). The flowers are protandrous; the anthers often dehisce before the flower has
opened, but the stigmas are generally not receptive until one to two days later (Swanson
and Sohmer 1976). Stigmas remain receptive even as the stamens and petals begin to fall
from the flower, approximately one to two weeks after anthesis (pers. obs.). A
population’s total flowering period lasts two to three weeks (Whisler and Snow 1992).
Bumblebee queens (Bombus sp.) are the most commonly observed pollinators, though
honeybees (Apis melifera) have also been observed to visit (Swanson and Sohmer 1976,
Rust and Roth 1981, Laverty and Plowright 1988).
Immature fruits are green and poisonous, due to the presence of podophyllotoxin
(Osweiler 1996), which is apparently unique to Podophyllum and a few closely related
genera (Peng et al. 2006). They ripen in August, becoming yellow, edible, and sweet
150
smelling. The leaves, stems, rhizomes, and roots contain the same toxins found in the
unripe fruits, with the highest concentration of toxin in the rhizomes (Osweiler 1996).
The toxicity of mayapple may, in part, explain its commonness, even in habitats that
experience intense herbivory by white-tailed deer (Odocoileus virginianus). The seeds
are known to be dispersed by eastern box turtles (Terrapene carolina; Rust and Roth
1981, Braun and Brooks 1987), but are probably also dispersed by a variety of mammals
(Rust and Roth 1981), including white-tailed deer, which eat the fruits (pers. obs.).
Study sites
I conducted my research in six study sites in five forest fragments in western
Washtenaw County, Michigan. Five of these study sites were established in 2005 in four
forest fragments. The fragments on which sites 4 and 6 were located were owned by a
single family, while the remaining fragments were each divide among several families.
This multiple ownership, combined with changes in land management over time, resulted
in patchwork forests, with late-successional trees over a shady, herbaceous understory
abutting heavily thinned early-successional trees over dense shrubs and saplings. This
variability was enhanced by topographic and edaphic variability, since each fragment was
centered on rough or wet terrain (terrain that could not be farmed efficiently).
Site 1 was centered at 42°14.95’ N and 83°56.42’ W. It was bordered to the west
and northeast by crops (corn, Zea mays L., and soybean, Glycine max [L.] Merr.), to the
northwest by a closely mown road and a small creek, to the southwest by a powerline
corridor, and to the southeast and east by the remainder of the forest fragment, which was
approximately 35-40 ha in area. The soil was sandy loam. The forest canopy over this
site was dominated by large (~20 m) basswoods (Tilia americana L.), hickories
(shagbark, Carya ovata [Mill.] K.Koch, bitternut, C. cordiformis [Wangenh.] K.Koch,
and pignut, C. glabra [Mill.] Sweet.), and oaks (red, Quercus rubra L., and black, Q.
velutina Lam.). Basswood, in particular, formed a thick canopy, and the site was deeply
shaded by the end of mayapple’s flowering period. Mayapple (Podophyllum peltatum L.)
was common, as were wild geranium (Geranium maculatum L.), wood phlox (Phlox
divaricata L.), and garlic mustard (Alliaria petiolata [M. Bieb.] Cavara & Grande).

151
Violets (Viola spp.) were more common in this site than in most of the others. The site
was centered on an ephemeral pond that lost all standing water in June, after canopy leaf-
out. Two of the five interior patches were in damp soil near the pond, while the rest were
on slopes to its south and northeast. All soils were loam or sandy loam. Four edge
patches were located near the south-facing edge adjacent to the powerline corridor, and
another for were near the west-facing edge adjacent to cropland. A low ridge paralleled
the south edge, with the study patches on the south slope of the ridge. On the west edge,
the terrain sloped down from a ridge of fieldstones at the forest-field border.
Site 2 had two clusters of patches in a fragment ~ 25 ha in area. The first cluster
had eight patches centered at 42°14.76’ N and 83° 54.18’ W. Only two of these patches
were within 30 meters of the forest edge, as only two could be found so close to the edge
in this portion of the site. One of the edge patches was adjacent to a gravel road
bordering corn and soybean fields, and the other was near a particularly open portion of a
broad, ephemeral pond that ran through the middle of the cluster. Both edges faced
south. The soil in the cluster was moist and composed entirely of peat to a depth of at
least one meter. The forest canopy was dominated by large (~ 25 m) red maples (Acer
rubrum L.) with scattered black cherries (Prunus serotina Ehrh.). In 2005 and 2006, the
maple canopy was thick and summer shade was deep. However, beginning in late
summer 2006, strong storms toppled several large trees, and many more were selectively
cut by the landowner in early spring of 2007, so that some of the patches in the forest
interior were well-lit. In addition to mayapple, mayflower (Maianthemum canadensis L.)
and blackberry (Rubus allegheniensis L.) were common understory flowers. Garlic
mustard was common near the edge patches. A second cluster of five sites was centered
at 42°14.86’ N and 83°54.45’ W, with three patches near a west-facing edge adjacent to a
cornfield. This portion of the site had uneven topography, with moderately steep slopes
from the level of the adjacent farm fields down to a permanent pond in the forest interior.
The soil was loam or sandy loam, with a thick layer of leaf litter. Large (~ 25-30 m)
oaks, hickories, and black cherries dominated the canopy. Spring beauty (Claytonia
virginica L.), wild geranium, and garlic mustard were the most abundant flowers on the
forest floor.
152
Site 3 was centered at 42°14.81’ N and 83°56.01’ W, at the opposite end of the
same fragment in which Site 1 was located. All seven edge patches were near an east-
facing edge separated from a cornfield by a closely mown road. The five interior patches
were due west of the edge patches. The terrain was level through most of the site, with
occasional ephemeral ponds, but the northernmost patches were on a slight downward
slope toward the northwest. The forest was dominated by oaks, hickories, and black
cherries ranging from ~ 15 to 30 m tall. It was selectively logged in April 2005 and thus
had the most open canopy of any of the study sites. In addition to mayapple, the most
abundant herbs were garlic mustard, wild geranium, and spring beauty. Violets were
relatively abundant, as were prickly gooseberries (Ribes cynosbati L.). Multiflora rose
(Rosa multiflora Thunb.) was abundant in the site, but not in the vicinity of the study
patches. The soil was sandy loam under a thick layer of leaf litter.
Site 4 was centered at 42°13.70’ N and 83°55.87’ W, in a 9-ha forest fragment
centered on a permanent pond. The six edge patches and two interior patches were at the
same elevation as the adjacent cornfield to the north, while the other four interior patches
were approximately 10 meters lower in elevation, near a wooded swamp on the north side
of the pond. The higher-elevation forest had a canopy of small (~10-15 m tall) black
cherries, American elms (Ulmus americana L.), hickories, and oaks, with scattered oaks
and hickories emerging from the canopy (to ~ 30 m). This part of the forest had
evidently been cleared more recently than the forest near the pond and on the slope rising
up from it. This older portion of the forest had tall (~ 25-30 m) red maples, hickories,
oaks, and black cherries, with smaller (~ 15 m) elms and black cherries common on the
slopes. Mayapple, wild geranium, and garlic mustard were abundant throughout the site.
Jack-in-the-pulpit (Arisaema triphyllum [L.] Schott.) was much more common in this site
than in any other. Prickly gooseberry was also common. The soil was loam or sandy
loam, with higher soil organic content and a thinner leaf litter layer in the lower-elevation
patches.
Site 5 was centered at 42°13.71’ N and 83°55.00’ W, at the southeastern end of an
elongated 30-ha forest fragment. The five edge patches were located near an east-facing
edge adjacent to a sheep pasture, while the five interior patches were northwest of these.
The terrain was quite hilly, ranging from a broad but ephemeral pond/swamp along the
153
northeast edge of the fragment to a ridge approximately 20 m higher in the forest interior.
One interior patch was at the top of this ridge, with the rest at its base. The forest
throughout the site was composed of a low canopy (~10-15 m tall) of sugar maples (Acer
saccharum Marshall.) with scattered emergent (~25-30 m tall) hickories, basswoods,
sugar maples, oaks, and, near the ponds, red maples. The sugar maple canopy cast a very
deep shade, and the understory was sparse far from edges. Mayapples were highly
abundant, but discrete patches suitable for study were widely scattered. Instead, fields of
ramets spreading tens of meters, with no clear clonal boundaries, were typical. Wood
phlox, toothwort (Cardamine concatenata [Michx.] O. Schwarz.), anise root (Osmorhiza
longistylis [Torr.] DC.), and violets were all common. Multiflora rose was highly
abundant in places, but, as with site 5, it was not common near the study patches. It was
not apparent that multiflora rose and mayapple occupied different habitats, except that the
rose was apparently less shade-tolerant, but mayapple was rarely found near large rose
bushes in either of these sites. Soil was sandy loam with a thin layer of leaf litter.
Fruit and seed production in mayapple was found to be highly pollen-limited in
2005. It was hypothesized that the severe pollen limitation detected could be a result of
disruptions of plant-pollinator interactions caused by habitat destruction and forest
fragmentation. To determine whether mayapple pollination would be improved in a less
disturbed habitat, a site was added in a large, old-growth fragment approximately 15 km
southwest of the original five sites.
The Nan Weston Preserve at Sharon Hollow (NWP) is a 100-ha natural area
owned and managed by The Nature Conservancy. It is centered on wet forest in a
drainage that flows into the Raisin River in southwestern Washtenaw County, but
roughly half of the preserve is upland mesic forest, where the mayapple patches used in
this study were located. The study patches were widespread through the preserve, but
were centered at 42°10.96’ N and 84°6.79’ W. The five edge patches were at the north
end of the preserve, with one patch near a north-facing edge bordering a gravel road, two
near a south-facing edge bordering a powerline corridor, and two near the north-facing
edge on the other side of the corridor. The eight interior patches were approximately 200
to 400 meters southwest of the edge patches, but were often closer to other open habitats
(large ponds or fields) than they were to the powerline corridor. The forest around the
154
study patches was dominated by large (~30 m) beech (Fagus grandifolia) and sugar
maple, with a high diversity of less dominant tree species. Unlike the forests of the other
five sites, NWP’s forests have never been cleared, and selective logging was probably
light even before the Conservancy acquired the property and halted timber extraction
entirely (Douglas Pearsall, pers. comm.). Herbaceous species were highly diverse. In
addition to mayapple, anise root, sweet cicely (Osmorhiza claytonia [Michx.] C. B.), wild
geranium, wood phlox, rue anemone (Anemonella thalictroides [L.] Spach.), large-
flowered trillium (Trillium grandiflorum [Michx.] Salisb.), hairy waterleaf
(Hydrophyllum macrophyllum Nutt.), and Dutchman’s breeches (Dicentra cucullaria [L.]
Bernh.) were all common in the site. Discrete mayapple clones were difficult to find.
Rather, as with site 7, most mayapples occurred in fields of ramets spread across tens of
meters, with no clear clonal boundaries. Soils were much sandier and poorer in organic
matter than in the other sites.


![lexique homeopathique SN 2012 ver02 · [carbo vegetabilis, podophyllum]. Réveil fréquent Podophyllum Le premier remède de diarrhées transpiration pendant les douleurs à l'estomac](https://img.pdfslide.us/doc/110x75/5e7449ec2bbc257b9533bdf0/lexique-homeopathique-sn-2012-ver02-carbo-vegetabilis-podophyllum-rveil-frquent.jpg)