Embed Size (px)
Citation preview

Political Visit
Weiwei Cai1 Wenxuan Hou
2
University of Edinburgh Business School, University of Edinburgh, Edinburgh, EH8
9JS, UK
Abstract:
Chinese State leaders (i.e. Politburo Standing Committee Members) often visit firms
in their domestic inspection tours. We argue that political leaders can confer their
reputation and prestige upon visited firms and bring about certain supports from the
government. We document positive market reactions, especially for the president’s
visit. The market reaction is more positive for firms without political connection, far
away from Beijing, and located in places with good institution. Finally, based on the
matched sample after propensity scoring matching, we find that the visit is associated
with higher operating performances, higher effective tax rate, and these firms recruit
more employees and donate less in the future. The results are stronger for the Jingping
Xi Administration.
Keywords: Political visit, political connection, firm performance
1 Contact author: Weiwei Cai Email: [email protected]
2 Wenxuan Hou email: [email protected]
1. Introduction:
Governments can participate in financial market through various methods such as
establishing regulations and policies (e.g. Krueger, 1999; Johnson, 1960), providing
subsidies or directly owning the firms (La Porta, Lopez-de-silanes and Shleifer, 2002).
Political connection is one of the most frequently studied approaches through which
government can assert influences on firms (eg. Faccio, 2006; Claessens, Feijen and
Laeven, 2008). Some recent literature like the paper of Cai, Hou and Rees (2010)
point out that political endorsement (praising firms through state-controlled news
program) is also a method of government to affect the market. However, existing
literature ignore a very common strategy government use to participate in market –
political visit.
To fill this gap, this paper focuses on political visit, a new way that government
uses to influence the financial market. According to Bernhardt (1993), political visit is
defined as “a political device in which a political leader carries out all the functions
and symbolic representations of governing by periodically or constantly traveling
throughout the areas of his domination.” Under financial context, political visit in this
paper is defined as a political device in which a high-level political leader of a country
carries out all the functions and symbolic representations of governing by periodically
visiting firms in their own countries. For instance, in UK, the president David
Cameron visited London Taxi Company on May 2015, which leaded to a so-called
‘hugely exciting day’ for Coventry. For another example, President Obama visited
Apple Pay on 13th
Feb 2015, which is described as a “big win for Apple Pay” by the
CEO of Crone Consulting LLC since political visit brings about huge promotional
value. Political visit is increasing and becomes more important (Cohen & Powell,
2005; Cook, 2002). Political visit is an important opportunity for government to make
key instructions to the market. For example, Obama visited Detroit Auto Show on
January 2016 and made a speech to express government’s idea on the auto industry.

Literature on political connection and helping hand of government imply that
establishing a relationship with government can benefit firms, suggesting the positive
effects of political visit. For example, having intimate relationship with government
can help firms achieve bank loans (Khwaja and Mian, 2005) and outperform other
firms by 160% higher market-to-book ratio (Bunkanwanicha and Wiwattanakantang,
2009). Moreover, the theory of private benefits of control provides theoretical
background for the positive emotional effects of political visit. Based on Yermack
(2010), private benefits of control means people can utilize their position and power
to get not only economic benefits, but also intangible benefits such as prestige and
visibility for themselves. For instance, it is the public visibility and prestige Michelle
Obama gets from her political position as First Lady that makes her influential in
fashion industry (Yermack, 2010). Similarly, in terms of political visit, the visiting
leaders can confer their prestige and visibility they obtained as political leaders upon
the visited firms, thus leading to market reactions.
However, the resource dependence theory and the literature on political
connection also indicate the burden of political visit. According to the resource
dependence theory, firms face high probability to be controlled by the entities with
greater power (Nicholson et al., 2004; Rao et al., 2007). After the firm-government
relationship is established through political visit, government, as the entity with great
power, can control or interfere with the firm in order to reach the political goals. For
instance, government can force firms to recruit more employees. Furthermore, based
on literature on political connection, officers may pursue personal objectives at the
expense of connected firms’ value (Shleifer and Vishny, 1994, 2002). As a result, the
firm-government relationship brought by political visit is not necessarily a good thing
and can cause huge burden for the firms and lead to inferior performance and negative
market reactions.
We hand collect the data of political visit in China from Leader’s Activity
Database from 1st Jan. 2009 to 31st July 2016, covering two governments: the one led

by President Hu (1st Jan.2009 -- 1st March 2013) and the other one led by President
Xi (1st March 2013-- 31st July 2016). The data is basically balanced since there are
almost four years for each government. The results indicate that political visit can lead
to positive market reactions over different time windows, and show that the market
reactions of visit by Xi administration are more significant than those of visit by Hu
administration. When we divide the whole sample according to leaders’ different
rankings of political power, we find that the market reactions of visit by president are
the most significant.
We further investigate the firm and institution heterogeneity. We test whether
market reacts differentially across different types of firms according to the existence
of political connection, firms’ dependence on external financing, geographic
characteristics, and the institutional development level. The results show that political
visit can trigger more significant market reactions for firms without political
connection. Although we assume that the market reactions for the visited firms who
heavily rely on external financing would be larger since political leaders can confer
their credibility and prestige upon these firms and thus help them to solve the
financing problem, we find no difference in market reactions. The third firm trait to
influence the market reactions of political visit is geographic characteristics.
According to Kim, Pantzalis and Park (2012), geographic proximity implies policy
risks and accessibility of resources. We measure the proximity to political power by
using the distances of firms’ headquarters to the capital of China—Beijing. We find
that political visit to firms located far away from Beijing can lead to more significant
market reactions since these firms rarely achieve support from central government.
We also use municipality and autonomous areas to proxy the development levels of
provinces and test whether leaders will take the development levels into account when
they choose places to visit, but we didn’t find supporting evidences for this.
Furthermore, we split samples based on the development of legal institutions,
marketization and the development of banking system. The results demonstrate that
better institutions and marketization can push up the market reactions since good

institutional development can magnify governments’ positive role.
Then we examine what kinds of firms are more likely to be visited. We test a
series of connection-related factors and non-connection-related factors. A lot of
reasons can lead to political visit: it’s possible that leaders prefer to visit connected
firms; it’s also possible that companies bribe officials in return for the visit, especially
in a sole-ruling party like China with heavy corruption; and geographic characteristics
can also influence the political connection, thus influencing the probability of
achieving political visit. All of above possible reasons are connection-related, and the
results show that political connection can increase the possibility to be visited while
no evidence supports that bribery is useful to win the visit. And results reveal that
leaders prefer to visit firms located far away from Beijing and less developed. One
possible reason is that leaders can help those firms to get more social attentions and
improve the development after visiting. Non-connection-related causes include firm
size, age, leverage, and past performance. We find that larger size, younger age, less
leverage and better past performance can increase the probability of being visited.
Finally, we use the significant determining factors mentioned above to match
visited firms with non-visited firms by applying propensity scoring matching and then
test the effects of political visit on firm performance. Results reveal that visit by Xi
administration can help firms to improve future firm performance, no matter which
performance measure is used. In contrast, visit by Hu administration has no impact on
firm performance. We then examine the channel of value creation by testing the
impacts of visit on government support, social burden and firm policies. Results
indicate that visit by Hu administration has no impact on these channels. However,
after being visited by Xi administration, the effective tax rate of firms will increase,
and firms will recruit more employees while donate less. Furthermore, the earnings
management will decrease due to the increased social attention after visiting, and the
shares and salaries of managers will increase as bonus of winning political visit.

This paper contributes to the literature in a number of ways. First, this paper is the
first one to examine the role of political visit in financial market. Existing literature
about political visit or presidential travel is only restricted to politics studies and most
of the studies only focus on the impacts of political visit on leaders themselves. For
example, extant literatures point out that political visit can improve presidents’
popularity (Ostrom and Simon, 1985; Brace and Hinckley, 1992), make power more
tangible (Herbst, 2000; Mitchell, 1991) and get allegiance of local elites (Schatzberg,
2001). This paper is the first one to consider political visit from a different angle by
focusing on the impacts on financial market.
Second, this study complements the literature on political economy. Political
economy literature point out that government can participate in market through
different approaches such as issuing policies (Krueger, 1974), establishing political
connections (e.g. Faccio Masulis and McConnell, 2006; You and Du, 2012), directly
owing the firms (La Porta, Lopez-de-silanes and Shleifer, 2002), and providing
political endorsements (Cai, Hou and Rees, 2017). This paper explores a new
approach through which government can participate in the market– political visit.
Different from political connection, both connected and non-connected firms can be
the target of political visit. Additionally, the political leaders who visit the firms are
usually in a position which is much higher than the government officials firms
generally connect with. For example, firms are usually visited by president while
firms rarely have connections with such high level political leaders. And different
from political endorsement, political visit will cause time and money costs for the
leader and his whole team, showing the importance the leaders attach to these firms.
Third, our paper is related to the literature on the certification effects. This stream
of literature point out that reputation can be transferred and bring the firms benefits.
For instance, affiliation with prestigious underwriters (Pollock, Chen and Jackson et
al., 2010; Ramirez, 1995; Carter, Dark and Singh, 1998), venture capitals (Milanov
and Shepherd, 2013), auditors (Beatty, 1989) and authoritative third parties (Doh,
Howton, and Howton S W, et al, 2010; Corbett, Montes-Sancho and Kirsch, 2005;
Bonardo, Paleari and Vismara, 2011) can increase affiliated firms’ reputation and trust.
Affiliating with venture capitals can make firms more credible, lower information
asymmetry and increase the net proceeds of IPO (Megginson and Weiss, 1991;
Pollock et al., 2010; Gulati and Higgins, 2003).While firms have some degree of
freedom to choose which underwriter or venture capital to cooperate with, firms
haven’t the initiative to let high-level political leaders to visit the firm. Therefore,
compared with the certification from financial organizations, achieving visit from
political leaders is rarer and more valuable.
The remaining paper is organized as follows. Section two reviews literature and
hypotheses are developed in section three. Section four provides basic institutional
background and describes the sample. Results about the impacts of political visit on
market reactions and firms performances are detailed in section five and six
respectively. Section seven analyzes the channels of value creation. Finally,
conclusion is articulated in section eight in the paper.
2. Literature review
Government participates in market in both developed and developing countries.
Invisible hand, helping hand and grabbing hand models suggested by Frye and
Shleifer (1996) imply that governments of different countries play an important role
in markets but with different strategies. Invisible-hand governments are
well-organized governments with low corruption, relatively self-restraint and more
benevolent to private sectors, which is more prevalent in Eastern Europe (Sachs,
1994). Helping hand governments, commonly discussed in developing countries like
China, are closely involved in market activities, partial to connected firms but the
corruptions within these countries are still limited (Walder, 1995). In contrast, the
regulatory environment in countries with grabbing hand governments is predatory and
heavily corrupt. The power of government is stronger above law and is used for

rent-seeking (Frye and Shleifer, 1996).
Governments can participate in financial market through various methods such as
establishing regulations and policies, providing subsidies or directly owning the firms.
For example, the very pioneering work of Krueger (1999) in political economy
demonstrates governments’ policies like import restrictions can harm economic
development, showing that establishing policies is a regular approach of government
to exert impacts on market. Abundant researchers like Ramey and Ramey’s (1994),
Bhagwati (1969) and Johnson (1960) also certify that government policies such as
policies on government spending, tariffs and quotas can influence economic growth.
Directly owing firms is another approach for government to participate in market (La
Porta, Lopez-de-silanes and Shleifer, 2002). Comparing with other approaches, direct
government ownership allows governments to have overwhelming power over firms.
Government can also assert impacts on market through political connection.
According to political connection literature, there are a lot of ways to establish
connection, which can be classified as two forms: individual level or firm level.
Individual level connections are consisted of two broad categories: political
experience and political identity. Political experience is defined as top executives’ and
board members’ former occupation in parliaments, government branch, state-owned
banks, and other regulated industries (Hasan et al., 2014; You and Du, 2012; Faccio
Masulis and McConnell, 2006). The executives and board members are considered as
possessing political identity if they are party members (Li et al., 2008), deputies to
National People’s Congress or National Committee (You and Du, 2012), mayors or
deputy mayors (Calomiris Fisman and Wang, 2010), or officers of government or
military (Fan et al., 2007). Additionally, other relatively indirect indicators are also
used to identify the individual level government-firm relationship. For instance, if the
top managers have relatives with the same last name or come from the same family
serving as government officers, Faccio, Masulis and McConnell (2006) and Amore &
Bennedsen (2013) deem such managers as politically connected. Similarly, Siegel

(2007) identifies political connection if the top managers graduated from the same
high school or was born in the same region as government officers. Other indirect
indicators include governmental awards such as the award of “Model worker” (You
and Du, 2012). As to company level connection, literature identify political
connections by exploring whether the firms pay huge campaign contributions
(Claessens, Feijen and Laeven, 2008), whether the headquarters are in the birthplace
of the government officers, or whether the firm is state-owned (Faccio et al., 2006).
Besides political connection, political endorsement is another way through which
government participates in market. Cai, Hou and Rees (2017) define political
endorsement if the state-controlled news program delicate a slot to praise a firm. Such
state-controlled news program is a mouthpiece of government, so the praising from
such program can represent government’s idea. By disseminating their support to
specific firms through state-controlled news program, government can trigger market
reactions, thus participating in and influencing the market.
This paper investigates a new approach government use to participate in the
market activities --- political visit, which is largely ignored by the previous literature.
Political visit, in this paper, is defined as a political device in which a high-level
political leader of a country carries out all the functions and symbolic representations
of governing by periodically visiting firms in their own countries. For example, on
13th
Feb 2015, President Obama visited Apple Pay in Silicon Valley, which is
regarded as a big win for Apply by a lot of consulting companies. Richard Crone,
chief executive officer of Crone Consulting LLC, said. “It makes it look like the
federal government is supporting Apple Pay.” According to Brace and Hinckley
(1992), Cohen & Powell (2005) and Cook (2002), political visiting is becoming
increasingly important. Political visit has multiple objectives, within which making
key instructions to the market and making governments’ will manifest in person are
the most important functions.

3. Hypothesis development
Multiple streams of literature imply the governments’ positive role in market
development, suggesting the positive effects of political visit. Firstly, abundant
literature of helping hand of government and political connection embrace the view
that political connection is a contributing factor of performance improvement and
value enhancement. With an overwhelming advantage compared with most of the
unconnected peers in terms of intimate relationship with government, connected firms
can obtain more favorable treats. As Faccio, Masulis and McConnell (2006) suggested,
once firms belong to the cronies or families of current ruling political parties or
leaders, these connected firms can get preferential resources such as bailouts. Other
preferential treats such as tax reduction (Li, Meng and Wang, 2008; Faccio, 2010;
Bertrand, 2006), tariffs on counterparts (Goldman, Rocholl and So, 2009) and easier
access to loans (Khwaja and Mian, 2005) are common among connected firms. Under
the supporting hand of government, connected firms demonstrate higher value and
generate higher long-term returns for investors (Luo and Liu, 2009). Investors’
positive views on the promising future performances of connected firm push up the
market value. For instance, Bunkanwanicha and Wiwattanakantang (2009) point out
that the market-to-book ratio increase 242.16% after previously non-connected firms
establishing ties with government. The politically connected firms also outperform the
control groups by 160% higher market-to-book ratio. The significant positive
correlation between political connections and superior firm performances are also
testified by researchers like Hillman (2005), Calomiris Fisman, and Wang (2010), and
Siegel (2007).
Secondly, the theory about private benefits of control provides theoretical
background for the positive emotional effects of political visit. Private benefits of
control means people can get economic gains for themselves by taking advantage of
their position and power. For example, by analyzing NYSE or Amex firms, Barclay
and Holderness (1989) claim that block holders can trade at a premium to the
exchange price and get private benefits by taking advantage of their voting power.
According to Yermack (2010), not merely economic benefits, but also intangible
benefits such as reputation, prestige and public visibility can be obtained through
people’s public position. For instance, the clothing choices of the First Lady, Michelle
Obama, can create significant value for designers and retailers. It is the public
visibility and prestige she obtained from her political position as First Lady that bring
her the power to influence the market. In terms of the political visit, the visiting
political leaders such as presidents can confer their publicity and prestige obtained
from their position upon the visited firms, thus leading to market reactions, which
complies with the theory about private benefits of control.
Thirdly, literature related to presidency also provides supporting evidences for the
positive effects of political visit. Based on McHugo’s experiment (1985), political
leader’s expressive displays can lead to emotional reactions and change public
opinion. And these emotional reactions, in turn, affects vote choice and people’s
attitudes toward the leaders. (Kinder and Abelson, 1981; Abelson et al., 1982). As
mentioned previously, political leaders usually deliver a speech in the visited firm in
order to encourage firms and make key instructions to the market. And these speeches
will be published in the local and central newspapers within next several days to
disseminate government’s ideas. As a result, political visit and leaders’ speech during
the visit can lead to people’s emotional reactions, thus causing market reactions.
Ha: Political visit leads to positive market reactions and favorable future firm
performances.
Resource dependence theory, however, highlights the burden of political visit by
claiming that during the interaction with other entities to obtain resources, firms are
highly likely to be dominated by the entities that control the resources (Nicholson et
al., 2004; Rao et al., 2007), suffer from high costs (Hsu, 2004), experience conflicting
goals with their partners (Froelich, 1999) and face external pressures (Oliver, 1991;

Rowley, 1997). Political visit forms a firm-government relationship, within which
government is the entity with greater power. As a result, government can use their
power to require firms do something harmful to the firm in return for the political visit.
For instance, firms may be required to shoulder more social responsibilities.
Furthermore, literature on political connection also implies that the
firm-government relationship formed through political visit sometimes constrains firm
operations and cause higher costs. First, inefficiency can be caused by the
unreasonable diversion of firm resources and the surrender of autonomy (Shleifer and
Vishny, 2002). For example, under the informal political regulations, connected firms
are forced to invest in government infrastructure projects by using their capital raised
from IPO, and are compelled to pay dividends to release the financial problems of
government (Lawrence, 1999). Second, political officers usually pursue personal
objectives at the expense of connected firms’ value (Shleifer and Vishny, 1994, 2002).
For instance, in order to win the campaign, political officers usually force connected
firms to misallocate capital on campaign contributions, generating economic costs of
higher than 0.2% of GDP (Claessens Feijen and Laeven, 2008). As a result, politically
connected firms are characterized by higher campaign contributions and lower
returns.
Third, connected firms are hampered from adapting to the new competitive
environment due to the heavy “liability to localness” (Uzzi, 1997; Perez-Batres and
Eden, 2008). For example, after foreign banks were allowed by government to enter
the Mexican market, the domestic connected firms suffered from their liability to
government and lost their competitiveness to foreign counterparts (Perez-Batres and
Eden, 2008). Fourth, the political relationship is quite unstable which heavily depend
on political fortunes and are featured as short-term. Consequently, the short-term
relationship encourages opportunistic behaviors such as earnings management (Chen,
Lee and Li, 2008). Therefore, the firm-government relationship formed through
political visit may bring about burden for the firm and lead to negative market

reactions.
Hb: Political visit leads to negative market reactions and harm future firm
performances.
4. Background and Sample
4.1 Background of Political Visit and Politburo Standing Committee
Political visit is becoming increasingly important. According to Brace and Hinckley
(1992) and Hart (1987), presidential travel is an increasingly vital aspect of the public
presidency, with the public presidency being one of the signature developments of
modern presidential leadership. Researchers like Cohen & Powell (2005) and Cook
(2002) also certify that political visiting is increasing.
Political visit has multiple functions. Improving leaders’ popularity (Brace and
Hinckley, 1992) and making power more tangible (Mitchell, 1991) are functions
commonly discussed in the literature of politics. Under finance, one of the most
important objectives of political visit is to make governments’ will manifest in person,
and political visit is an important opportunity for government to make key instructions
to the market. For example, in USA, on 20th
Jan 2016, President Obama visited
Detroit Auto Show to showcase the auto companies his administration helped save.
By delivering the following speech: “……see the progress firsthand that the
automakers have achieved, this attributes to the plan to retool and restructure the
auto industry. I believe that every American should be proud of what our most iconic
industry has done……”, president Obama expressed government’s idea on the auto
industry, demonstrating that political visit is a good opportunity for government to
express the ideas and influence the market. As a result, political visit can be regarded
as a new approach through which government can participate in the market while it
has not been investigated before.

Besides developed countries like U.S. mentioned above, political visit is in
particular a useful device government could use to affect market in countries with
relatively powerful government such as developing countries. For example, on 7th
December 2012, Chinese president Hu visited Guizhou Changzheng Electric CO.,
Ltd., and CLP Zhenhua information Co., Ltd. During the visit, besides inspecting
product lines and management, president Hu expressed government’s will by
delivering a speech to these firms: “……The value of firms lies in innovation. I hope
you can emancipate the mind, reform with keen determination, forge ahead, and
promote the continuous development of enterprises.……” Since Chinese government
is promoting the transform from “made in China” to “created in China”, one key point
of these speech is to encourage firms to improve innovation, showing that political
leaders deem visit as an opportunity to influence the firms and market.
In China, although there is no literature or material clarifies the mechanism of
domestic political visit, we can refer to the mechanism of international political visit
to gain an insight into how it works. During international political visit, some
entrepreneurs or CEOs will be invited to form a delegation to accompany the
president. According to Jifei Wan, the president of China International Chamber of
Commerce, the choice of accompanying entrepreneurs varies from place to place and
time to time, depending on different destinations and different focusing areas of
economic and trade cooperation.
Different chambers of commerce or private trade groups are responsible for
choosing entrepreneurs to form delegation to accompany president during
international political visit according to several principals: First, according to
“Oriental Outlook Weekly”, an official newspaper, the delegation must be formed by
representative entrepreneurs. For example, if the president needs to have a talk with
the leader of the host country about anti-dumping, the CEOs of representative
enterprises in the field of anti-dumping will have a high probability of follow-up.
Second, Xiao Qiang, president of the China Small and Medium Enterprises Research

Institute, said that the decision of choosing firms depends on what the visited
countries need, and what is the purpose of our government during the visit.
Two key words mentioned in international visit can be applied to domestic
political visit: representative and purpose. As to domestic visit, local government is
responsible for recommending representative firms to be visited by the leader. It can
be assumed that big firms are more likely to be visited and this will be tested in the
later section of this paper. Since political visit is an opportunity for government to
make instructions to market, the types of visited firms will change according to the
different purposes of government. For instance, during the National People's Congress
& Chinese People's Political Consultative Conference, Premier Keqiang Li proposed
the concept of “Internet+”, demonstrating that internet is now put on the top agenda to
reach the national strategic level. Correspondingly, more and more entrepreneurs from
the field of internet are chosen as the delegation to accompany president during
international political visit. It can be assumed that internet firms are also more likely
to be chosen as the target of domestic political visit.
Political visits in China are usually executed by high-level political leaders like
members of Politburo Standing Committee of Communist Party (PSC). PSC is a
committee consisting of the top leadership of the Communist Party of China with an
officially mandated purpose to conduct policy discussions and make decisions on the
most important political issues. PSC is composed of five to nine members, and
currently Xi administration has seven members. This paper focuses on the political
visits of PSC members, who are prestige enough to transfer their reputation and
popularity to the visited firms.
4.2 Sample and Data
The data on political visit is hand collected from a database called Leader’s Activity
Database. This database integrates reports from different newspapers about political
visits of various leaders. On every report, it would clearly write the starting date and

the reporting date of the visit. In the event study, we use the starting date of the visit
rather than the reporting date as the event day in order to alleviate the information
effects brought by news release. The data is from 1st Jan. 2009 to 31st July 2016,
covering two governments: the one led by President Hu (1st Jan.2009 -- 1st March
2013) and the other one led by President Xi (1st March 2013-- 31st July 2016). The
data is basically balanced since there are almost four years for each government.
The reports in the Leader’s Activity Database reveal information about who are
the visiting leaders, where the leaders visit and what the leaders do. So we record the
places of visit (Province), whether the leader is President (President) and which
Section is the report written on (Section). We also record leaders’ names and rank
them according to their political power. Other financial data such as return on assets
and firm size can be obtained from China Securities Market and Accounting Research
Database (CSMAR), which is developed according to international standards and
focuses on Chinese market. The definitions of variables are shown in table 1.
[Insert table 1 about here]
We collected 482 political visits to firms in total from 1st Jan. 2009 to 31st July
2016. Figure 1 demonstrates the visit frequency in each month. Based on Figure 1,
leaders visit firms more frequently during the midyear, especially in June, July and
August. And it is obvious that the number of political visits decreased dramatically
after 2013 when President Xi assumed office.
[Insert Figure 1 about here]
Table 2 demonstrates the distribution of political visit from 1st March 2009 to
31st July 2016. Panel A is the distribution of provinces. It shows that firms located in
the capital are more likely to be visited by leaders (6.85%). And firms located in
northern areas such as Liaoning (7.88%), Neimenggu (6.02%) and Shandong (7.47%)
also have higher probability of being visited. One possible reason is that northern
areas are relatively less developed, so government is more inclined to visit those

places to stimulate local economic development. Panel B shows the distribution of
leaders. Compared with Xi administration, Hu administration visited firms more
frequently, with 82 and 400 visits respectively. In terms of Xi administration, 19 out
of 82 visits (23.17%) are done by President Xi, while only 28 out of 400 visits (7%)
are done by President Hu during Hu’s administration, showing that the President of Xi
administration visit firms more frequently.
Panel C is the distribution of newspaper sections. Leader’s Activity Database
integrates information about political visit from two resources: People’s Daily and
local newspapers. People’s Daily is an official newspaper of Communist Party and it
is the biggest newspaper group in China. People’s Daily has 24 sections in total,
within which sections 1 to 6 are specialized for the most important news. Based on
Panel C, most of the political visits (81.95%) are reported in the first section, meaning
that political visit is deemed as the most important news. As the official newspaper of
Communist Party, People’s Daily is required to be the mouthpiece of government. By
placing political visits in the first section of the newspaper, People’s Daily can help
government to highlight the instructions leaders made during the visits. Besides
People’s Daily, some political visits may be reported in local newspapers but the
percentage is only 3.32%.
[Insert table 2 about here]
Table 3 shows the descriptive statistics of visited firms. Since firms can be visited
for multiple times, our sample incorporates 482 visits, which incorporate 219 firms.
Panel A compares the distribution of the number of visited firms that are controlled
directly by central government (SOE_CG), by other SOEs except CG (SOE_Other)
and private firms (Private). Compare columns (2) and (4), 5% of visited firms are
directly controlled by central government while only 3% of all listed firms are
controlled by central government. Similarly, the percentage of other SOEs in visited
firms is also higher than that in all listed firms (58% and 43% respectively), meaning
that government is more likely to visit SOEs. Then in Panel B and C, we decompose

the whole sample in Panel A into two subsets: Xi administration and Hu
administration. The results show that both Xi and Hu administrations are more likely
to visit SOEs. However, compared with Hu administration, Xi administration visits
private firms more frequently since the percentage of visits to SOEs versus to private
firms are 64.58% to 35.42% for Hu administration and 48.15% to 51.85% for Xi
administration.
Panel D reveals the industry distribution of visited firms. Some industries such as
energy and information technology have higher probability to be visited. Panel E
compares the mean differences between visited & non-visited firms, showing that
firms with political connection have higher probability to be the target of visiting. For
example, firms controlled by central government or other SOEs and firms with higher
state shares or with directors with political background are more likely to be visited.
Geography also has a say in determining which firms to visit. Based on Panel E, firms
in municipalities or in autonomous areas have higher probability to be visited. In
addition, visited firms also show the following characteristics: larger size, younger
age, less leverage and better past performance.
[Insert table 3 about here]
5. Political Visit and Market Reaction
5.1 Market reactions
To examine the value of political visit, we first use event study to examine cumulative
abnormal return (CAR). Abnormal return is calculated as the excess return over
market return. The reports about political visit from Leader’s Activity Database
clearly write the starting date and the reporting date of the visit. In the event study, we
use the starting date of the visit rather than the reporting date as the event day in order
to alleviate the information effects brought by news release. Figure 2 shows the
significant market reactions of political visit, which almost reaches 2.5%. The market
starts to react 10 days before, which is caused by the information leakage since

leaders’ visiting plans are determined in advance and the local government will be
informed about the visit in advance in order to let them have enough time to prepare
for the visit.
[Insert Figure 2 about here]
Figure 3 decomposes political visits into two parts: visits by Hu administration
and visits by Xi administration. According to Figure 3, the market reactions of Xi
administration are much greater, which approaches 7%. One plausible reason is that
compared with Hu administration, the Xi administration is more powerful. For
instance, after a key four-day meeting of top-level party officials in Beijing,
Communist Party has elevated Xi Jinping to the "core" of its leadership. "The core of
the Chinese Communist party” is not just a new title but very symbolic in China and
implies the power of President Xi. Moreover, after Xi launched the anti-corruption
campaign, his reputation and prestige becomes more and more impressive. As a result,
people make more dramatic market reactions to the visit of the government led by
President Xi for its power and reputation. Another possible reason for the significant
market reactions is that Xi administration visits firms less frequently (82 times) if
compared with the visits of Hu administration (400 times).
[Insert Figure 3 about here]
Table 4 shows the significance of market reactions over different time windows.
Row (1) of Panel A demonstrates that political visit can trigger significant positive
market reactions over all windows. In row (2), we divide political visit into the visit of
Hu administration and the visit of Xi administration. The results show that the market
reactions of visit by Xi administration are more significant than those of visit by Hu
administration, which is consistent with figure 3. Row (3) divides the whole sample
according to leaders’ different rankings of political power. We code the rankings
according to the rankings listed on Leader’s Activity Database and rank 1 refers to
president. The results show that the market reactions of visit by president are the most
significant. This is also supported by the results in row (4) when we divide sample

into president and other positions. Panel B of table 4 demonstrates the market
reactions of political visits reported in different newspaper sections. The results
indicate that the market reactions of the visit reported on the first section of People’s
Daily are the most significant.
[Insert Table 4 about here]
5.2 Firm Heterogeneity
To address challenges and limitations of previous results, we take firm heterogeneity
into account to explore whether visit differentially affects market reactions across
different types of firms in a manner that is consistent with particular theories. We split
sample according to the existence of political connection, the dependence on external
financing, and the geographic proximity to address two interpretational and analytical
weaknesses of previous results. Firstly, through splitting samples according to firm
characteristics, we can evaluate the precision of different theoretical predictions about
whether existence of political connections, distance to political power and dependence
on external financing will influence the impacts of visit on market reactions. Secondly,
concerns about omitted variable bias can be reduced by differentiating among various
types of firms to focus on how market reacts differently to political visit across
different firms.
The first firm trait that can influence the market reactions of political visit is the
existence of political connections, which implies the existence of political supports.
Political visit, as a new kind of political support, can trigger different market reactions
for firms with and without connections. One hypothesis is that political support has
diminishing marginal effects, meaning that the effects of political visit for firms
already with political connection is not as large as the effects for firms without
connections. Consequently, market reactions for non-connected firms are higher.
Competing hypothesis is that firms already with connections can utilize their political
network to get more material preferential resources once they achieve political visit

from central government. As a result, visit for connected firms are deemed as more
valuable in the eyes of investors. To test this, we split samples according to five
proxies of political connection: (1) whether the directors of the firm has a political
background; (2)whether the firm is SOE; (3) whether the firm is CG; (4) number of
state shares; (5) the corruption level of the firm. Corruption is the ratio of
entertainment cost to the sales. Firms with higher ratio are more likely to spend
money to bribe government in return for political connection. The results of mean
tests are shown in table 5. Panel A tests the difference in CAR(-7,90), and we also test
the difference in CAR(-7,180) in panel B to make our results more robust. Rows (1)
to (5) of both panels demonstrate that the market reactions of firms without or with
relatively low connections are significantly higher, which is consistent with our first
hypothesis.
The second firm trait that the market reactions of visit are contingent on is the
dependence on external financing. The impacts of political visit on firms who heavily
rely on external financing are assumed to be larger since these firms can get easier
access to external funds after achieving more social attentions and reputation through
political visit. However, although the difference is significant in Panel A, the
significant results disappear when we extend the window in panel B.
The third firm trait to influence the market reactions are geographic
characteristics: (7) the distance of the visited firms to Beijing; (8) whether the firm is
located in municipality; and (9) whether the firm is located in autonomous areas.
According to Kim, Pantzalis and Park (2012), proximity to political power can reflect
firms’ exposure to political resources and policy risks. This paper then examines
whether the influences of political visit vary if proximity to political power changes.
We measure the proximity to political power by using the distances of firms’
headquarters to the capital of China—Beijing. One hypothesis is that firms far away
from Beijing can rarely get support from central government or at least the supports
are not as strong as those for the firms who are close to the political center. As a result,

political visits to firms far away from Beijing can lead to more dramatic market
reactions. The competing hypothesis is that firms close to political center can get
more material government supports once they are visited by taking advantage of the
close geographic distances. Row (7) of table 5 panel A and B shows that visit to firms
located far away from Beijing can trigger more significant market reactions. We also
split sample according to municipality and autonomous areas to test whether the
impacts of visit vary if the development level of cities change. Municipality refers to
four relatively developed cities: Beijing, Shanghai, Tianjin and Chongqing.
Autonomous areas are the places with a lot of minorities and relatively less developed.
The results in row (8) and (9) of table 5 indicate that there is no difference in the
market reactions.
[Insert Table 5 about here]
5.3 Institution Heterogeneity
Institution development level, like firm characteristics, can influence the market
reactions of political visit. Shleifer and Vishny (1994, 1998) and Hellman, Jones, and
Kaufmann (2000) suggest that politicians’ interventions in business activities are more
severe when institutional constraints are weak. In other words, when institutional
development is weak, the negative role of government may exceed its positive role
due to the heavy interventions. In contrast, the good institutional development can
magnify governments’ positive role.
We split samples according to the development of legal institution, marketization
and banking system in table 5. These indexes are obtained from a survey of Fan
(2011). Two proxies are used to measure the development of legal institution: (1)
Government efficiency refers to the days spent with government and (2) Helping hand
of government index. Following Fan’s (2011) method, we use the proportion of
non-state sales to proxy the marketization. The results in row (1) to (3) of panel A
table 5 indicate that visit to the firms located in provinces with better institution and

marketization can lead to higher market reactions. Panel A tests the difference in
CAR(-7,90), and we also test the difference in CAR(-7,180) in panel B to make our
results more robust. The results in panel B are consistent with panel A.
[Insert Table 6 about here]
6 Political visit and firm performance
6.1 Determinants of political visit
Since table 3 indicates that SOEs are visited more frequently, we then investigate
what types of firms are more likely to be visited. We first test 3 different
connection-related determining factors of political visit. The first one is political
connection. It’s possible that connected firms have higher possibility to be visited by
the government. Three proxies are used to measure political connection: (1) whether
the controlling shareholders of the visited firms are central government (SOE_CG) or
other SOEs (SOE_other). (2) Whether the directors of the visited firms have political
background (PB). (3) Number of state shares (State shares). The dependent variable
of Table 8 is P(visit), meaning the probability to be visited, which equals 1 if the firm
is visited by political leaders. The results shown in column (1) and (3) of table 7
demonstrate that political connection is a significant determinant of political visit.
However, the results in column (2) indicate that individual-level connections like the
political background of directors are not significant determinants.
Since it’s possible that companies bribe officials in return for the visit, especially
in a sole-ruling party like China with heavy corruption, the second possible
connection-related determinant is corruption. Firm-level corruption data is hard to
collect since firms are reluctant to disclose such unethical information, so we follow
World Bank’s method to calculate Corruption as the ratio of entertainment cost to
sales. As shown in column (4) of table 5, corruption is not a significant determinant of
political visit.

Geographic characteristics can also influence the probability of achieving
political visit. The first two geographic characteristics we test are: municipality and
autonomous areas. Municipality refers to four relatively developed cities: Beijing,
Shanghai, Tianjin and Chongqing. Autonomous areas are the places with a lot of
minorities and relatively less developed. These two geographic characteristics can
help us to investigate whether provincial development level will be taken into account
when leaders choose firms to visit. Municipality is negatively significant while
autonomous area is positively significant as shown in column (5) and (6) respectively,
meaning that government is more inclined to visit less developed areas in order to
confer credibility and attention upon those firms and regions. The third geographic
characteristic we test is the distance to the political power. We measure the proximity
to political power by using the distances of firms’ headquarters to the capital of
China—Beijing. Since the previous results show that leaders tend to visit less
developed autonomous regions more frequently, and relatively less developed regions
are usually far away from the capital, we assume that firms far away from capital is
more likely to achieve political visit. Results in column (7) provide supporting
evidences for this assumption.
We then test several non-connection-related determinants of political visit. Firstly,
government may consider the political visit as a method to win over people’s support
(Faccio, Masulis and McConnell, 2006). As a result, the more employees one firm has,
the more likely the government visits that firm. So in column (8) of Table 7, we want
to test whether logarithm of employee number (Employee) can significantly predict
the probability of political visit. The results show that the government is partial to
firms with more employees in order to draw more support.
Secondly, we test whether other common firm features at play here, including
firm size, age, leverage, and past performance. Size is defined as the logarithm of
market value, which is consistent with the method used by other researchers like
Hasan et al. (2014). Since size is certified to be the determinant of political connection

(Hasan et al., 2014), the determinant of obtaining political bailouts (Faccio, Masulis
and McConnell, 2006), and one of the determining factors of achieving third-party
endorsement (Adams, 1999), it can be assumed that firm size can influence the
probability of being visited. Since the younger the firm is, the more likely firm
pursues political visit in order to adapt to market and achieve trust from consumers,
age is included in models. Furthermore, leverage, as a proxy for solvency, and firm
past performances can also affect the probability of visit because government has
preference to visit representative firms with good financial and managerial status. All
of these possible influential firm characteristics are included in model (1) to (8), and
the results indicate that larger size, younger age, less leverage and better past
performance can increase the probability of being visited. Finally, the model in
column (9) incorporates all possible determinants mentioned above. As shown in
column (9), the number of state shares can still increase the probability of political
visit while the proxies for geographic characteristics are no longer significant, and the
results of most of the basic firm features like size and age are consistent with previous
results.
[Insert Table 7 about here]
6.2 Firm Performance
Before testing the impact of political visit on future firm performance, we use the
significant determinants of political visit shown in section 6.1 and a series of firm
basic characteristics like leverage and age to match visited firms with non-visited
firms by applying propensity scoring matching (PSM). According to table 8, most of
the differences between the variables of treatment and control group are no longer
significant after one-to-one matching.
[Insert Table 8 about here]
The matched sample has 706 observations, namely 353 pairs of visited and
non-visited firms. The same firm can be visited repeatedly in different years, so one
firm can be visited for several times by the same or different political leaders during
the eight years. In table 9, we use the matched sample to test the effects of political
visit on firm future performance. The dependent variable is firm performance and
performance is forwarded one year in order to give firms enough time to take
advantage of the political visit. We use four different measurements of performance in
order to make the results more robust: operating margin (OM), ROA, ROE and ROS.
In column (1), (4), (7) and (10), we treat all visits as a whole and test the impacts on
one-year forwarded performance. While political visit can help firms to improve
future ROA and ROE, it has no impact on OM and ROS. Then we test the influence
of political visits by different governments separately. Column (2), (5), (8) and (11)
focus on the impacts of visit by Xi administration while column (3), (6), (9) and (12)
investigate the visit by Hu administration. The results present that visit by Xi
administration can significantly improve firm performance, no matter which
performance measures are used. In contrast, visits by Hu administration have no
impact on firm performance.
[Insert Table 9 about here]
7. Chanel of Value Creation
Then we test the impacts of political visit on the government support firms can obtain
and the social burden firms need to shoulder in the future, and also on the changes of
firm policies. Matched sample is used here. According to the researchers like Hearn
(2012) and Faccio, Masulis and McConnell (2006), companies are able to get more
favorable resources after establishing relationship with government. Therefore, we
test whether government will give visited firms more supports like reduction in
effective tax rates. However, the results in panel A table 10 show that there is no
impact on the one year forwarded effective tax rate (ETR_F) or the change of
effective tax rate (δETR), and the firms are even expected to pay more tax after being
visited by Xi administration.
Based on Raff and Siming (2016), after the reintroduction of knighthoods and

damehoods of CEO, firms employ more employees in order to shoulder social
responsibility. So in our study, it can be supposed that after being visited by political
leaders and attract more attentions from the society, the visited firms need to shoulder
more social responsibilities by contributing more donations or employing more
employees. Results in panel A demonstrate that firms visited by Xi administration
need to shoulder more social responsibilities after being visited but donate less.
We further explore the impacts of political visit on corporate policies: earnings
management (EM_F orδEM), management shares (Managershares_F) and
management salaries (Salary_F). According to panel B of table 10, earnings
management decreased significantly due to the increased social attention after being
visited by Xi administration. Management shares and salaries are supposed to increase
after political visit as a bonus of winning leaders’ visiting, and the results support this
assumption. Table 10 also indicate that visit by Xi administration can influence
government support, social burden and firm policies while visit by Hu administration
almost has no impacts on firms.
[Insert Table 10 about here]
8. Conclusions:
Existing literatures investigate how government participates in market through
various approaches, but ignore a common strategy government use to influence the
market – political visit. Political visit is a pervasive phenomenon across different
countries and has traditionally been studied only in literature on politics. To fill these
gaps, political visit is introduced in this paper as a new way that government can use
to participate in the market. Political visit, under this paper, is defined as a political
device in which a high-level political leader of a country carries out all the functions
and symbolic representations of governing by periodically visiting firms in their own
countries.

The results demonstrate that political visit can lead to positive market reactions
over different time windows, especially when the firms are visited by Xi
administration or president. We also test whether market reacts differentially across
different types of firms and under different institution development level. The visit to
firms without political connection, far away from Beijing, and located in a place with
good institution can lead to higher market reactions. Moreover, results show that
government is more inclined to visit firms with connections. But political connection
is only one of the reasons for firms to achieve political visit. Firms with larger size,
younger age, less leverage, more employees, better past performance, located far
away from Beijing are also more likely to achieve political endorsements. After
matching sample through PSM, results indicate that being visited by Xi administration
can improve firm performance while being visited by Hu administration has no
impact on performance. Results also point out that after being visited by Xi
administration, the effective tax rate of firms will increase, and firms will recruit more
employees while donate less. Furthermore, the earnings management will decrease
due to the increased social attention after visiting, and the shares and salary of
managers will increase as bonus of winning political visit. However, being visited by
Hu administration has no impact on these channels.
This paper is the first one to examine the role of political visit in financial market.
Existing literature about political visit or presidential travel is only restricted to
politics studies and most of the studies only focus on the impacts of political visit on
leaders themselves while this paper visits from a different angle by focusing on the
impacts of political visit on financial market. And this study supplements the literature
on political economy by introducing political visit as a new approach that government
can use to influence the market. Different from political connection, both connected
and non-connected firms can be the target of political visit, and the political leaders to
visit firms usually have a higher-level position than the officials firms normally
connected with. And different from political endorsement, the money and time costs
for the leader and his whole team by doing political visit demonstrate the importance

the leaders attach to these firms. Furthermore, this paper is also related to the
literature on certification effects. Compared with general certification from financial
organizations, achieving visit from political leaders of central government is rarer and
more valuable.

References:
Amore, M. D., & Bennedsen, M. (2013). The value of local political connections in a
low-corruption environment. Journal of Financial Economics,110(2), 387-402.
Barclay M J, Holderness C G. Private benefits from control of public corporations[J].
Journal of financial Economics, 1989, 25(2): 371-395.
Bertrand, M., Kramarz, F., Schoar, A., & Thesmar, D. (2006). Politicians, firms and
the political business cycle: evidence from France. Unpublished working paper.
University of Chicago.
Bhagwati, "On the Equivalence of Tariffs and Quotas," in his Trade, Tariffs and
Growth, London 1969.
Brace, P., & Hinckley, B. (1992). Follow the leader: Opinion polls and the modern
presidents. New York: HarperCollins
Bunkanwanicha, P., & Wiwattanakantang, Y. (2009). Big business owners in
politics. Review of Financial Studies, 22(6), 2133-2168.
Calomiris, C. W., Fisman, R., & Wang, Y. (2010). Profiting from government stakes in
a command economy: Evidence from Chinese asset sales. Journal of Financial
Economics, 96(3), 399-412.
Claessens, S., Feijen, E., & Laeven, L. (2008). Political connections and preferential
access to finance: The role of campaign contributions. Journal of Financial
Economics, 88(3), 554-580.
Cohen J E, Powell R J. Building Public Support from the Grassroots Up: The Impact
of Presidential Travel on State ‐ Level Approval[J]. Presidential Studies
Quarterly, 2005, 35(1): 11-27.

Cook, C. (2002). The permanence of the “permanent campaign”: George W. Bush’s
public presidency. Presidential Studies Quarterly, 32, 753-764.
Faccio M. Politically connected firms[J]. The American economic review, 2006, 96(1):
369-386.
Faccio, M. (2010). Differences between Politically Connected and Nonconnected
Firms: A Cross‐Country Analysis. Financial Management,39(3), 905-928.
Faccio, M., Masulis, R. W., & McConnell, J. (2006). Political connections and
corporate bailouts. The Journal of Finance, 61(6), 2597-2635.
Fan, J. P., Wong, T. J., & Zhang, T. (2007). Politically connected CEOs, corporate
governance, and Post-IPO performance of China's newly partially privatized
firms. Journal of financial economics, 84(2), 330-357.
Frye T, Shleifer A. The invisible hand and the grabbing hand[R]. National Bureau of
Economic Research, 1996.
Goldman, E., Rocholl, J., & So, J. (2009). Do politically connected boards affect firm
value?. Review of Financial Studies, 22(6), 2331-2360.
H. G. Johnson, "The Cost of Protection and the Scientific Tariff," J. Polit. Econ., Aug.
1960, 68, 327-45.
Hart, R. P. (1987). The sound of leadership: Presidential communication in the
modern age. Chicago: University of Chicago Press.
Hasan, I., Jackowicz, K., Kowalewski, O., & Kozlowski, L. (2014). Politically
connected firms in Poland and their access to bank financing (No. 2/2014). Bank
of Finland, Institute for Economies in Transition.
Hillman, A. J. (2005). Politicians on the board of directors: do connections affect the

bottom line?. Journal of Management, 31(3), 464-481.
Jeffrey Herbst, States and Power in Africa: Comparative Lessons in Authority and
Control (Princeton: Princeton University Press, 2000), pp. 97-136.
John W. Bernhardt, Itinerant Kingship and Royal Monasteries in Early Medieval
Germany, c. 936-1075 (Cambridge: Cambridge University Press, 1993)
Khwaja, A. I., & Mian, A. (2005). Do lenders favor politically connected firms? Rent
provision in an emerging financial market. The Quarterly Journal of Economics,
1371-1411.
Krueger, Anne O. "The Political Economy of the Rent-Seeking Society." American
La Porta R, Lopez‐de‐Silanes F, Shleifer A. Government ownership of banks[J].
The Journal of Finance, 2002, 57(1): 265-301.
Lawrence, S. (1999). Too many mothers-in-law. Far Eastern Economic Review, 19(2),
12-13.
Li, H., Meng, L., Wang, Q., & Zhou, L. A. (2008). Political connections, financing
and firm performance: Evidence from Chinese private firms. Journal of
development economics, 87(2), 283-299.
Li, J. J., Poppo, L., & Zhou, K. Z. (2008). Do managerial ties in China always
produce value? Competition, uncertainty, and domestic vs. foreign firms.
Strategic Management Journal, 29(4), 383-400.
Luo, D., & Liu, X. (2009). Political relationship, entry barriers, and firm
performance. Management World, (5), 97-106.
Michael Schatzberg, Political Legitimacy in Middle Africa: Father, Family, Food
(Bloomington: Indiana University Press, 2001).

Mitchell T. The limits of the state: beyond statist approaches and their critics[J].
American political science review, 1991, 85(01): 77-96.
Ostrom, C. W., & Simon, D. M. (1985). Promise and performance: A dynamic model
of presidential popularity. American Political Science Review, 79, 334-358.
Sachs, Jeffrey. Poland's jump to a market economy. Cambridge, MA: MIT Press,
1994.
Siegel, J. (2007). Contingent political capital and international alliances: Evidence
from South Korea. Administrative Science Quarterly, 52(4), 621-666.
Walder, Andrew. "China's Transitional Econ- omy: Interpreting its Significance."
China Quarterly, December 1995, (144), pp. 963-79.
Yermack D. The Michelle Markup: The First Lady’s Impact on Stock Prices of
Fashion Companies[J]. Available at SSRN 1596803, 2011.
You, J., & Du, G. (2012). Are political connections a blessing or a curse? Evidence
from CEO turnover in China. Corporate Governance: An International
Review, 20(2), 179-194.

Table 1 Definition of Variables
Variables
Visit Dummy variable, equals one if the firm is visited by a political leader.
Xi administration Dummy variable, equals one if the firm is visited by Xi administration. Xi administration refers to the
government led by president Xi. Our sample covers 1st March 2013-- 31st July 2016.
Hu administration Dummy variable, equals one if the firm is visited by Hu administration. Hu administration refers to the
government led by president Hu. Our sample covers 1st Jan.2009 -- 1st March 2013.
SOE_CG If actual controller is central government, equals one.
SOE_Other If actual controller is other SOEs except central government, equals one.
Private If actual controller is private company or individuals, equals one.
PB PB refers to political background. If the director of a firm also works as a government official, equals
one.
State share The logarithm of number of shares owned by the state.
Corruption Equals the ratio of the entertainment costs of managers or the hospitality fees to sales. Firm-level data.
Municipality If the firm is located in municipalities (Beijing, Shanghai, Tianjin and Chongqing), equals 1.
Autonomous Autonomous equals one if that area is classified as autonomous area by government since there are a lot
of minorities
Distance Distance, as a measurement of the proximity to political power, refers to the distances of firms’
headquarters to the political center of China—Beijing.
Size Ln( Market value), where the value of non-tradable shares are calculated by using net asset value.
Age The age of the firm since established.
Leverage Total equity/total liability
Employee The logarithm of employee number
Employee_F The logarithm of employee number, forwarded one year.
ROA_F Return on asset, forwarded one year.
Return on Asset (ROA) =Net income/Ave. of beginning and ending total assets
Past performance (ROA_P) (ROA𝑡−1 + ROA𝑡−2)/2
ROS_F Return on sakes, forwarded one year.
Return on Sales (ROS) =Net income/sales
OM_F Operating margin, forwarded one year.
Operating Margin (OM)= EBIT/Sales
ROE_F Return on equity, forwarded one year.
Return on Equity (ROE) =Net income/Ave. of beginning and ending total equity
Subsidy_F Government subsidy, forwarded one year.
δETR Following Feng, Johansson and Zhang’s (2013) method, δETR represents the change in tax
burden, equaling to the difference between the annual effective tax rate before and after the
political endorsements. ETR is defined as (tax expense-deferred tax expense)/EBIT.
ETR_F Effective tax rate, forwarded one year. ETR is defined as (tax expense-deferred tax
expense)/EBIT.
Management share_F Logarithm of management shareholdings, forwarded one year.
Salary_F Logarithm of management salaries, forwarded one year.
Donation_F Donation_F means the donation, representing corporates’ social responsibilities.
Self-dealing_F Logarithm of related-party transfer.
EM_F Ratio of non-operating income relative to revenue, forwarded one year.
δEM Change in earnings management.
Government efficiency Days spent with government, obtained from a survey of Fan (2001)
Helping hand of government Obtained from a survey of Fan (2001). The survey question is : how helpful is the government during
M&A?
Marketization index Proportion of non-state sales to total sales, obtained from a survey of Fan (2001)

Table 2 Descriptive Statistics of Visit
This table shows the descriptive statistics of political visits. Panel A demonstrates the distribution of the visited provinces.
Panel B demonstrates the distribution of leaders who visit firms. Panel C is the distribution of newspaper sections which
report political visit. Leader’s Activity Database integrates information about political visit from two resources: People’s
Daily and local newspapers. People’s Daily is an official newspaper of Communist Party and it is the biggest newspaper
group in China. People’s Daily has 24 sections in total, within which sections 1 to 6 are specialized for most important
news.
Panel A Distribution of Province
Province name Freq. Percent
Anhui 19 3.940
Beijing 33 6.850
Fujian 9 1.870
Gansu 16 3.320
Guangdong 23 4.770
Guangxi 14 2.900
Guizhou 5 1.040
Hainan 4 0.830
Hebei 14 2.900
Henan 18 3.730
Heilongjiang 9 1.870
Hubei 20 4.150
Hunan 25 5.190
Jilin 18 3.730
Jiangsu 32 6.640
Jaingxi 7 1.450
Liaoning 38 7.880
Neimenggu 29 6.020
Ningxixa 12 2.490
Qinghai 2 0.410
Shandong 36 7.470
Shanxi 13 2.700
Shannxi 7 1.450
Shanghai 13 2.700
Sichuan 15 3.110
Tianjin 10 2.070
Xinjiang 18 3.730
Yunnan 6 1.240
Zhejiang 7 1.450
Chongqing 10 2.070
Total 482 100

Table 2 Descriptive Statistics of Visit (Cont.)
This table shows the descriptive statistics of political visits. Panel A demonstrates the distribution of the visited provinces.
Panel B demonstrates the distribution of leaders who visit firms. Panel C is the distribution of newspaper sections which
report political visit. Leader’s Activity Database integrates information about political visit from two resources: People’s
Daily and local newspapers. People’s Daily is an official newspaper of Communist Party and it is the biggest newspaper
group in China. People’s Daily has 24 sections in total, within which sections 1 to 6 are specialized for most important
news.
Panel B Distribution of leaders during visiting
Xi administration Hu administration
Leader name Freq. Percent Leader name Freq. Percent
Jinping Xi 19 23.17 Jintao Hu 28 7
Keqiang Li 23 28.05 Jinping Xi 35 8.750
Yunshan Liu 10 12.20 Qinglin Jia 69 17.25
Zhengsheng Yu 7 8.540 Changchun Li 75 18.75
Dejiang Zhang 8 9.760 Keqiang Li 49 12.25
Gaoli Zhang 15 18.29 Jiabao Wen 67 16.75
Bangguo Wu 29 7.250
Guoqiang He 48 12
Total 82 100 Total 400 100
Panel C Distribution of Sections
Sections Freq. Percent
People’s Daily section 1 395 81.95
People’s Daily section 2 7 1.450
People’s Daily section 3 41 8.510
People’s Daily section 4 23 4.770
Local Newspaper 16 3.320
Total 482 100
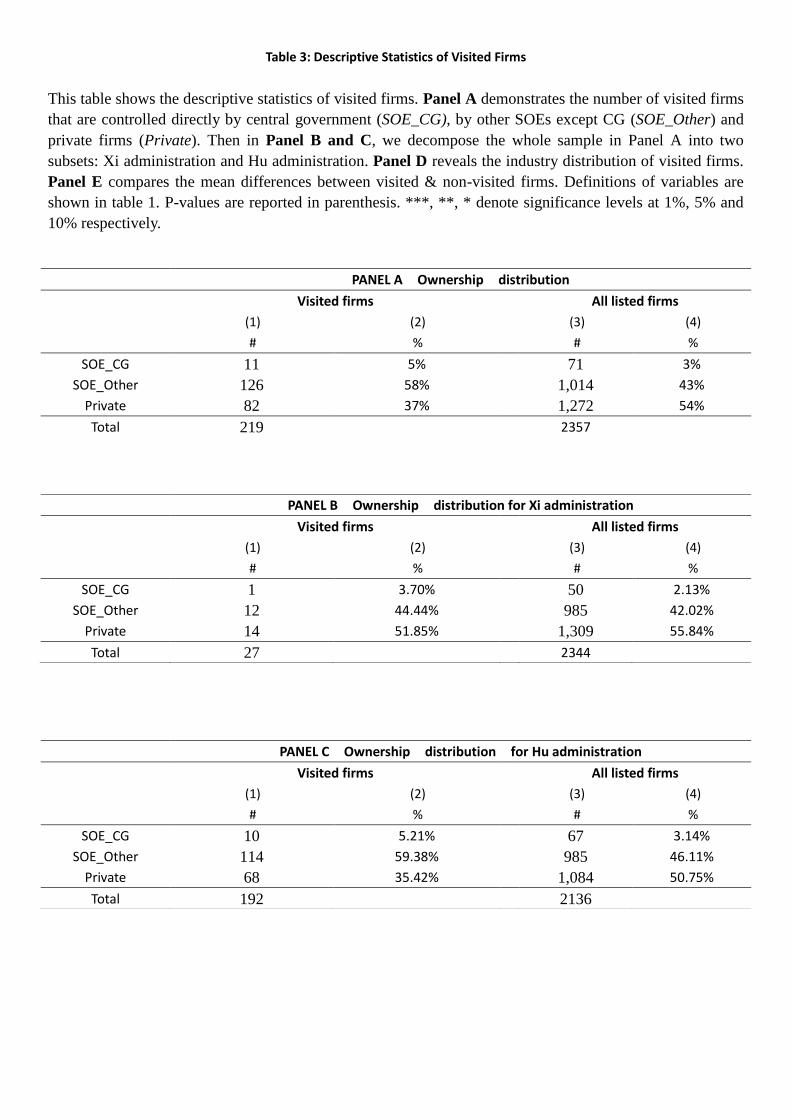
Table 3: Descriptive Statistics of Visited Firms
This table shows the descriptive statistics of visited firms. Panel A demonstrates the number of visited firms
that are controlled directly by central government (SOE_CG), by other SOEs except CG (SOE_Other) and
private firms (Private). Then in Panel B and C, we decompose the whole sample in Panel A into two
subsets: Xi administration and Hu administration. Panel D reveals the industry distribution of visited firms.
Panel E compares the mean differences between visited & non-visited firms. Definitions of variables are
shown in table 1. P-values are reported in parenthesis. ***, **, * denote significance levels at 1%, 5% and
10% respectively.
PANEL A Ownership distribution
Visited firms All listed firms
(1) (2) (3) (4)
# % # %
SOE_CG 11 5% 71 3%
SOE_Other 126 58% 1,014 43%
Private 82 37% 1,272 54%
Total 219 2357
PANEL B Ownership distribution for Xi administration
Visited firms All listed firms
(1) (2) (3) (4)
# % # %
SOE_CG 1 3.70% 50 2.13%
SOE_Other 12 44.44% 985 42.02%
Private 14 51.85% 1,309 55.84%
Total 27 2344
PANEL C Ownership distribution for Hu administration
Visited firms All listed firms
(1) (2) (3) (4)
# % # %
SOE_CG 10 5.21% 67 3.14%
SOE_Other 114 59.38% 985 46.11%
Private 68 35.42% 1,084 50.75%
Total 192 2136

Table 3: Descriptive Statistics of Visited Firms (Cont.)
This table shows the descriptive statistics of visited firms. Panel A demonstrates the number of visited firms that are controlled directly by central government
(SOE_CG), by other SOEs except CG (SOE_Other) and private firms (Private). Then in Panel B and C, we decompose the whole sample in Panel A into two
subsets: Xi administration and Hu administration. Panel D reveals the industry distribution of visited firms. Panel E compares the mean differences between
visited & non-visited firms. Definitions of variables are shown in table 1. P-values are reported in parenthesis. ***, **, * denote significance levels at 1%, 5% and 10%
respectively.
PANEL D industry distribution
GICs industry ALL Visited Firms Xi administration Hu administration All listed firms
(1) (2) (3) (4) (5) (6) (7) (8)
# % # % # % # %
10 Energy 9 4.170 2 8.00 7 3.66 57 2.74
15 Materials 39 18.06 4 16.00 35 18.32 401 19.30
20 Industrials 59 27.31 5 20.00 54 28.27 484 23.29
25 Consumer Discretionary 36 16.67 6 24.00 30 15.71 379 18.24
30 Consumer Staples 9 4.170 0 0.00 9 4.71 148 7.12
35 Health Care 13 6.020 2 8.00 11 5.76 131 6.30
40 Financials 9 4.170 2 8.00 7 3.66 171 8.23
45 Information Technology 33 15.28 4 16.00 29 15.18 230 11.07
50 Telecommunication Services 1 0.460 0 0.00 1 0.52 5 0.24
55 Utilities 8 3.700 0 0.00 8 4.19 72 3.46

Table 3: Descriptive Statistics of Visited Firms (Cont.)
This table shows the descriptive statistics of visited firms. Panel A demonstrates the number of visited firms
that are controlled directly by central government (SOE_CG), by other SOEs except CG (SOE_Other) and
private firms (Private). Then in Panel B and C, we decompose the whole sample in Panel A into two
subsets: Xi administration and Hu administration. Panel D reveals the industry distribution of visited firms.
Panel E compares the mean differences between visited & non-visited firms. Definitions of variables are
shown in table 1. P-values are reported in parenthesis. ***, **, * denote significance levels at 1%, 5% and 10%
respectively.
PANEL E Difference between visited and non-visited firms
Variables Mean
Visited Firm
Mean
Non-Visited Firm
MeanDiff
CG 0.0450 0.0230 0.022**
SOE 0.616 0.457 0.160***
Political background 0.934 0.908 0.026**
State shares 7.393 4.556 2.838***
Municipality 0.229 0.190 0.039*
Autonomous 0.112 0.0500 0.062***
Distance 1219 1446 -226.845***
Employee number 8.988 7.605 1.383***
Size 16.19 15.14 1.045***
Age 12.93 14.92 -1.989***
Leverage 2.394 3.231 -0.838***
Past performance 0.0570 0.0390 0.018***

Table 4 Market Reactions
This table shows the significance of market reactions over different time windows. In row (1) of panel A, we treat all political visits as a
whole. In row (2), we divide political visit into the visit of Hu administration and the visit of Xi administration. Row (3) divides the
whole sample according to leaders’ different rankings of political power. We code the rankings according to the rankings listed on
Leader’s Activity Database and rank 1 refers to president. Row (4) divides the sample into two categories: president and other officials.
Panel B of table 4 demonstrates the market reactions of political visits reported in different newspaper sections. Leader’s Activity
Database integrates information about political visit from two resources: People’s Daily and local newspapers. People’s Daily is an
official newspaper of Communist Party and it is the biggest newspaper group in China. People’s Daily has 24 sections in total, within
which sections 1 to 6 are specialized for most important news. In our sample, political visit can be reported in the sections 1 to 4 in
People’s Daily or in local newspaper. P-values are reported in parenthesis. ***, **, * denote significance levels at 1%, 5% and 10%
respectively.

Panel A Market reactions of political visit
CAR(-7,7) CAR(-7,14) CAR(-7,21) CAR(-7,30) CAR(-7,90) CAR(-7,180) CAR(-7,360) Observations
(1) Visit 0.009* 0.012
** 0.016
*** 0.018
*** 0.024
** 0.050
*** 0.078
*** 479
(0.053) (0.017) (0.005) (0.007) (0.012) (0.000) (0.000)
(2) Hu administration 0.000 0.004 0.010* 0.010 0.014 0.037
*** 0.067
*** 398
(0.955) (0.407) (0.077) (0.131) (0.136) (0.007) (0.001)
Xi administration 0.052***
0.053***
0.047**
0.057***
0.071**
0.122***
0.149***
81
(0.004) (0.005) (0.016) (0.007) (0.021) (0.009) (0.009)
(3) Rank1-President 0.058**
0.041* 0.057
* 0.079
** 0.074
** 0.137
*** 0.208
*** 46
(0.026) (0.096) (0.074) (0.049) (0.036) (0.006) (0.003)
Rank2 0.033* 0.029 0.016 0.009 0.018 0.097 0.036 51
(0.078) (0.143) (0.303) (0.649) (0.623) (0.116) (0.623)
Rank3 0.009 0.012 0.024 0.015 0.040 0.047 0.089* 75
(0.359) (0.294) (0.108) (0.321) (0.110) (0.166) (0.066)
Rank4 0.006 0.009 0.009 0.021 0.022 0.070**
0.115**
76
(0.512) (0.376) (0.457) (0.159) (0.361) (0.039) (0.027)
Rank5 -0.019**
-0.010 -0.005 0.005 -0.000 0.010 0.048 84
(0.015) (0.295) (0.622) (0.644) (0.987) (0.707) (0.248)
Rank6 -0.025**
-0.029***
-0.029**
-0.034**
-0.035 -0.038 -0.039 50
(0.015) (0.010) (0.014) (0.013) (0.177) (0.339) (0.489)
Rank7 0.023 0.047**
0.043**
0.039* 0.070
** 0.100
*** 0.159
*** 49
(0.201) (0.031) (0.045) (0.099) (0.014) (0.005) (0.005)
Rank8 0.011 0.019* 0.034
** 0.026 0.014 -0.001 0.013 48
(0.150) (0.077) (0.028) (0.153) (0.598) (0.988) (0.806)
(4) Other 0.004 0.009* 0.012
** 0.012
* 0.018
* 0.040
*** 0.066
*** 433
(0.383) (0.069) (0.027) (0.055) (0.061) (0.004) (0.001)
President 0.058**
0.041* 0.057
* 0.079
** 0.074
** 0.137
*** 0.208
*** 46
(0.026) (0.096) (0.074) (0.049) (0.036) (0.006) (0.003)

Panel B Market reactions of different sections of newspaper
CAR(-7,7) CAR(-7,14) CAR(-7,21) CAR(-7,30) CAR(-7,90) CAR(-7,180) CAR(-7,360) Observations
People’s Daily Section 1 0.010* 0.015
*** 0.018
*** 0.019
** 0.024
** 0.051
*** 0.072
*** 392
(0.057) (0.010) (0.007) (0.016) (0.025) (0.001) (0.001)
People’s Daily Section 2 -0.016 -0.036 -0.018 0.030 0.007 -0.025 -0.003 7
(0.740) (0.472) (0.689) (0.613) (0.876) (0.690) (0.977)
People’s Daily Section 3 -0.010 -0.012 -0.001 0.005 0.020 0.062 0.154**
41
(0.338) (0.364) (0.965) (0.737) (0.588) (0.179) (0.039)
People’s Daily Section 4 0.010 0.010 -0.007 0.009 0.006 0.024 0.049 23
(0.657) (0.730) (0.778) (0.728) (0.856) (0.528) (0.490)
Local newspaper 0.041**
0.035 0.070**
0.041**
0.061 0.057 0.108 15
(0.033) (0.167) (0.015) (0.028) (0.102) (0.408) (0.350)

Table 5 Firm Heterogeneity
This table tests whether political visits differentially affect market reactions across different types of firms. From row (1) to row (5), we
split sample according to the existence of political connection: (1) whether the directors of the firm has a political background;
(2)whether the firm is SOE; (3) whether the firm is CG; (4) number of state shares; (5) the corruption level of the firm. Corruption is the
ratio of entertainment cost to the sales. Firms with higher ratio are more likely to spend money to bribe government in return for political
connection. In row (6), we test the effects of dependence on external financing on market reactions. From row (7) to (9), we split sample
according to geographic characteristics: (7) the distance of the visited firm to Beijing; (8) whether the firm is located in municipality; and
(9) whether the firm is located in autonomous areas. Panel A tests the differences in CAR(-7,90), and we also test the difference in
CAR(-7,180) in panel B to make our results more robust. Detailed definitions of variables are shown in table 1. P-values are reported in
parenthesis. ***, **, * denote significance levels at 1%, 5% and 10% respectively.

Panel A CAR(-7,90)
Variables
Group1 Group2
Mean Diff =0/<mean =1/>mean
Explanation No. Mean Explanation No. Mean
Connection (1) Political background No background 27 0.117 With background 439 0.0170 0.100**
(2) SOE N 141 0.0490 Y 333 0.0110 0.038*
(3) CG N 433 0.0270 Y 33 -0.0320 0.0590
(4) State shares Low state shares 439 0.0290 High state shares 27 -0.0690 0.098***
(5) Corruption Low corruption 369 0.0340 High corruption 98 -0.0190 0.053**
Firm financing (6) External Financing dependence Less dependent 140 0.0480 Highly dependent 337 0.0140 0.034*
Geographic (7) Distance Close to Beijing 239 0.00500 Far away from Beijing 226 0.0430 -0.039**
(8) Municipality N 424 0.0260 Y 53 0.00700 0.0190
(9) Autonomous N 405 0.0220 Y 72 0.0360 -0.0140
Panel B CAR(-7,180)
Variables
Group1 Group2
Mean Diff =0/<mean =1/>mean
Explanation No. Mean Explanation No. Mean
Connection (1) Political background No background 27 0.182 With background 439 0.0400 0.142*
(2) SOE N 140 0.0860 Y 328 0.0320 0.054*
(3) CG N 433 0.0560 Y 33 -0.0450 0.100**
(4) State shares Low state shares 439 0.0580 High state shares 27 -0.107 0.165***
(5) Corruption Low corruption 369 0.0700 High corruption 98 -0.0330 0.103***
Firm financing (6) External Financing dependence Less dependent 140 0.0760 Highly dependent 331 0.0390 0.0370
Geographic (7) Distance Close to Beijing 239 0.00400 Far away from Beijing 226 0.0960 -0.092***
(8) Municipality N 418 0.0500 Y 53 0.0520 -0.002
(9) Autonomous N 399 0.0430 Y 72 0.0880 -0.0450

Table 6 Institution Heterogeneity
This table tests whether political visits differentially affect market reactions across provinces with different institutional development and marketization. Two
proxies are used to measure the development of legal institution: (1) Government efficiency-Days spent with government and (2) Helping hand of government
index. These indexes are obtained from a survey of Fan (2011). Following Fan’s (2011) method, we use the proportion of non-state sales to proxy the
marketization and split sample in row (3). Panel A tests the differences in CAR(-7,90), and we also test the difference in CAR(-7,180) in panel B to make our
results more robust. Detailed definitions of variables are shown in table 1. P-values are reported in parenthesis. ***, **, * denote significance levels at 1%, 5%
and 10% respectively.
Panel A CAR(-7,90)
Variables
Group1 Group2
Mean Diff =0/<mean =1/>mean
Explanation No. Mean Explanation No. Mean
Legal institution (1) Government efficiency -Days
spent with government
Efficient 209 0.055 Inefficient 242 -0.0010
0
0.056***
(2) Helping hand of government Not helpful 250 0.006 Helpful 201 0.0480 -0.042**
Marketization (3) Marketization index – proportion
of non-state sales
Low marketization 226 -0.005 High marketization 239 0.0500 -0.055***
Panel B CAR(-7,180)
Variables
Group1 Group2
Mean Diff =0/<mean =1/>mean
Explanation No. Mean Explanation No. Mean
Legal institution (1) Government efficiency -Days
spent with government
Inefficient 209 0.096 Efficient 242 0.0110 0.085***
(2) Helping hand of government Not helpful 250 0.026 Helpful 201 0.0810 -0.054**
Marketization (3) Marketization index – proportion
of non-state sales
Low marketization 226 0.001 High marketization 239 0.0940 -0.094***

Table7 Determinants of Political Visit
This table tests what kinds of firms are more likely to be visited by political leaders. The dependent variable P(visit) equals 1 if the firm
achieved political visit. We first test 3 different connection-related determining factors of political visit: political connection, corruption
and geographic proximity. Three proxies are used to measure political connection: (1) whether the controlling shareholders of the visited
firms are central government (SOE_CG) or other SOEs (SOE_other). (2) Whether the directors of the visited firms have political
background (PB). (3) Number of state shares (State shares). In column (4), we follow World Bank’s method to calculate Corruption as
the ratio of entertainment cost to sales. The three geographic characteristics we test are: municipality, autonomous areas and distance.
Municipality refers to four relatively developed cities: Beijing, Shanghai, Tianjin and Chongqing. Autonomous areas are the places with a
lot of minorities and relatively less developed. Distance means the distances of firms’ headquarters to the capital of China—Beijing. We
then test several non-connection-related determinants of political visit: employee numbers, size, age, leverage and past performance.
Employee refers to the logarithm of employee numbers, Size is the logarithm of market value, Age means the years since firms’
establishment, and Past performance(ROA_P) is the average of ROA lagged one period and lagged two periods. P-values are reported in
parenthesis. ***, **, * denote significance levels at 1%, 5% and 10% respectively.

Dependent Variable: Probability of visit
Connection-related causes Non-Connection-related ALL
Political connection Corruption Geographic
(1) (2) (3) (4) (5) (6) (7) (8) (9)
Controlling
shareholder
PB intensity State shares Corruption Municipality Autonomous Distance Employee number ALL
SOE_CG 0.160 0.055
(0.263) (0.713)
SOE_other 0.157*** 0.053
(0.007) (0.411)
PB -0.342 -0.530**
(0.104) (0.016)
State shares 0.013*** 0.009***
(0.000) (0.008)
Corruption -0.000 -0.000
(0.743) (0.307)
Municipality -0.528*** -0.450
(0.002) (0.294)
Autonomous 0.528*** 0.515
(0.002) (0.174)
Distance 0.000*** -0.000
(0.002) (0.510)
Employee 0.200*** 0.191***
(0.000) (0.000)
Size 0.322*** 0.337*** 0.332*** 0.333*** 0.332*** 0.332*** 0.332*** 0.183*** 0.196***
(0.000) (0.000) (0.000) (0.000) (0.000) (0.000) (0.000) (0.000) (0.000)
Age -0.035*** -0.034*** -0.034*** -0.034*** -0.034*** -0.034*** -0.034*** -0.031*** -0.033***
(0.000) (0.000) (0.000) (0.000) (0.000) (0.000) (0.000) (0.000) (0.000)
Leverage -0.049*** -0.052*** -0.050*** -0.053*** -0.053*** -0.053*** -0.053*** -0.024 -0.022
(0.002) (0.001) (0.001) (0.001) (0.001) (0.001) (0.001) (0.103) (0.128)
Past performance 1.058** 0.920* 0.991** 0.957** 0.960** 0.960** 0.960** 1.156** 1.158**
(0.028) (0.055) (0.039) (0.045) (0.045) (0.045) (0.045) (0.021) (0.022)
_cons -6.669*** -6.713*** -6.834*** -6.711*** -6.181*** -6.709*** -6.709*** -6.293*** -5.959***
(0.000) (0.000) (0.000) (0.000) (0.000) (0.000) (0.000) (0.000) (0.000)
N 1.4e+04 1.4e+04 1.4e+04 1.4e+04 1.4e+04 1.4e+04 1.4e+04 1.4e+04 1.4e+04

Table 8 Compare treated and Control groups after PSM
This table presents the results of mean test of treated and control groups after one-to-one matching. We use the significant determinants of political visit shown in section
table 7 and a series of firm basic characteristics like leverage and age to match endorsed firms with non-endorsed firms by applying propensity scoring matching (PSM). The
treated group includes firms who are visited by political leaders, and the control group incorporates the matched non-visited firms.
Mean Mean MeanDiff
Variables Treated Group Control Group Difference t P-value
CG 0.045 0.037 0.008 0.570 0.570
SOE 0.609 0.615 -0.006 -0.150 0.877
Political background 0.932 0.912 0.020 0.980 0.326
State shares 6.781 6.343 0.438 0.630 0.529
Municipality 0.218 0.195 0.023 0.740 0.458
Autonomous 0.119 0.116 0.003 0.120 0.907
Distance 1246 1264 -17.98 -0.260 0.799
Employee number 8.977 8.937 0.040 0.330 0.739
Size 16.24 16.19 0.049 0.450 0.653
Age 13.37 13.12 0.255 0.750 0.456
Leverage 2.382 2.616 -0.235 -1.540 0.124
Past performance 0.057 0.063 -0.006 -1.290 0.198
No. of observations: 353 353

Table 9 Firm performance
This table tests the impact of political visit on firm future performance. The dependent variable is firm performance and performance is forwarded one year in order to give firms
enough time to take advantage of the political visit. We use four different measurements of performance in order to make the results more robust: operating margin (OM), ROA,
ROE and ROS. In column (1), (4), (7) and (10), we treat all visits as a whole and test the impacts on one-year forwarded performance. Then we test the influences of political visit by
different governments separately. Column (2), (5), (8) and (11) focus on the impacts of visit by Xi administration while column (3), (6), (9) and (12) investigate the visit by Hu
administration. The independent variable is political visit dummy. The definitions of all variables are shown in table 1. *,**,*** denote the significance level at 10%, 5% and 1%
respectively.
(1) (2) (3) (4) (5) (6) (7) (8) (9) (10) (11) (12)
OM1_F OM1_F OM1_F ROA1_F ROA1_F ROA1_F ROE2_F ROE2_F ROE2_F ROS1_F ROS1_F ROS1_F
visit 0.013 0.008* 0.037
** 0.014
(0.134) (0.093) (0.013) (0.101)
Xi
administration
0.013***
0.003* 0.013
*** 0.007
***
(0.000) (0.052) (0.002) (0.000)
Hu
administration
0.002 -0.004 -0.001 0.001
(0.841) (0.590) (0.940) (0.863)
Industry Y Y Y Y Y Y Y Y Y Y Y Y
Province Y Y Y Y Y Y Y Y Y Y Y Y
Firm effect Y Y Y Y Y Y Y Y Y Y Y Y
Year effect Y Y Y Y Y Y Y Y Y Y Y Y
_cons 0.094***
0.100***
0.104***
0.055***
0.037***
0.057***
0.121***
0.097***
0.131***
0.086***
0.093***
0.100***
(0.000) (0.000) (0.000) (0.000) (0.000) (0.000) (0.000) (0.000) (0.000) (0.000) (0.000) (0.000)
N 706.000 136.000 570.000 706.000 136.000 570.000 706.000 136.000 570.000 706.000 136.000 570.000
r2 0.051 0.320 0.089 0.165 0.332 0.157 0.189 0.654 0.195 0.042 0.328 0.071

Table 10 Channel of Value Creation
This table tests the impacts of political visit on the government support firms can obtain and the social burden firms need to shoulder in the future, and also on the change of firm
policies. Panel A examines the influences on government support and social burden. ETR_F refers to one-year forwarded effective tax rate. δETR means the change in effective tax
rate. Donation_F is the one-year forwarded donation and Employee_F means one-year forwarded number of employees. Panel B tests the impacts on changes in firm policies. EM_F
is one-year forwarded earnings management; δEM is the change in earnings management; Managershares_F is one-year forwarded management shares; Salary_F refers to
one-year forwarded management salaries. Matched sample is used here. Column (1) treat all visits as a whole, column (2) tests the effects of visit by Xi administration, and column
(3) focuses on the impacts of visit by Hu administration. P-values are reported in parenthesis. ***, **, * denote significance levels at 1%, 5% and 10% respectively
Panel A Impacts on government support and social burden
Government support Social Burden
ETR_F δETR Donation_F Employee_F
(1) (2) (3) (1) (2) (3) (1) (2) (3) (1) (2) (3)
visit -0.159 -0.154 -1.120**
-0.121
(0.499) (0.565) (0.013) (0.134)
Xi
administrati
on
0.152**
*
0.333***
-1.964*
**
0.179***
(0.000) (0.000) (0.000) (0.000)
Hu
administrati
on
-1.455 -1.755 -0.282 -0.018
(0.330) (0.320) (0.750) (0.697)
Industry Y Y Y Y Y Y Y Y Y Y Y Y
Province Y Y Y Y Y Y Y Y Y Y Y Y
Firm effect Y Y Y Y Y Y Y Y Y Y Y Y
Year effect Y Y Y Y Y Y Y Y Y Y Y Y
_cons 0.067 0.040**
*
0.243 -0.026 -0.154***
0.133 5.265***
4.425**
*
5.200**
*
8.878***
9.317***
8.379***
(0.454) (0.000) (0.155) (0.824) (0.000) (0.548) (0.000) (0.000) (0.000) (0.000) (0.000) (0.000)
N 587.00 89.000 528.00 514.000 77.000 448.000 264.000 49.000 231.00 620.000 89.000 569.000
r2 0.021 0.362 0.037 0.020 0.824 0.045 0.131 0.286 0.136 0.144 0.366 0.248

Table 10 Channel of Value Creation (Cont.)
This table tests the impacts of political visit on the government support firms can obtain and the social burden firms need to shoulder in the future, and also on the change of firm
policies. Panel A examines the influences on government support and social burden. ETR_F refers to one-year forwarded effective tax rate. δETR means the change in effective tax
rate. Donation_F is the one-year forwarded donation and Employee_F means one-year forwarded number of employees. Panel B tests the impacts on changes in firm policies. EM_F
is one-year forwarded earnings management; δEM is the change in earnings management; Managershares_F is one-year forwarded management shares; Salary_F refers to
one-year forwarded management salaries. Matched sample is used here. Column (1) treat all visits as a whole, column (2) tests the effects of visit by Xi administration, and column
(3) focuses on the impacts of visit by Hu administration. P-values are reported in parenthesis. ***, **, * denote significance levels at 1%, 5% and 10% respectively
Panel B Impacts on firm policies
EM_F δEM Managershares_F Salary_F
(1) (2) (3) (1) (2) (3) (1) (2) (3) (1) (2) (3)
visit 0.004 0.005 -0.026 -0.032
(0.308) (0.325) (0.952) (0.529)
Xi
administra
tion
-0.001**
*
-0.001***
0.136***
0.161***
(0.000) (0.000) (0.000) (0.000)
Hu
administra
tion
-0.002 -0.003 -0.684 0.007
(0.467) (0.352) (0.189) (0.900)
Industry Y Y Y Y Y Y Y Y Y Y Y Y
Province Y Y Y Y Y Y Y Y Y Y Y Y
Firm effect Y Y Y Y Y Y Y Y Y Y Y Y
Year effect Y Y Y Y Y Y Y Y Y Y Y Y
_cons 0.017***
0.019***
0.021***
-0.004 -0.001 -0.032***
9.327***
10.696***
10.501***
15.265*
**
15.715*
**
15.017*
**
(0.000) (0.000) (0.000) (0.343) (0.459) (0.000) (0.000) (0.000) (0.000) (0.000) (0.000) (0.000)
N 621.000 89.000 569.000 620.000 89.000 568.000 584.000 87.000 538.000 621.000 89.000 569.000
r2 0.024 0.070 0.016 0.022 0.198 0.093 0.029 0.302 0.064 0.149 0.275 0.209

Figure 1 Frequency of political visit
The figure demonstrates the visit frequency in each month. The data is from 1st Jan. 2009 to 31st July 2016, which covers two governments: the one led by
President Hu (1st Jan.2009 -- 1st March 2013) and the other one led by President Xi (1st March 2013-- 31st July 2016).
0
5
10
15
20
25
20
09
m1
m3
m5
m7
m9
m1
1
20
10
m1
m3
m5
m7
m9
m1
1
20
11
m1
m3
m5
m7
m9
m1
1
20
12
m1
m3
m5
m7
m9
m1
1
20
13
m1
m3
m5
m7
m9
m1
1
20
14
m1
m3
m5
m7
m9
m1
1
20
15
m1
m3
m5
m7
m9
m1
1
20
16
m1
m3
m5
Visit Freq.
Freq.

Figure 2 Market reactions of political visit
This figure demonstrates the 3-month market reactions of political visit. The reports about political visit from Leader’s Activity Database clearly
write the starting date and the reporting date of the visit. In the event study, we use the starting date of the visit rather than the reporting date as
the event day in order to alleviate the information effects brought by news release.
-0.5%
0.0%
0.5%
1.0%
1.5%
2.0%
2.5%
3.0%
dif -8 -5 -2 1 4 7 10 13 16 19 22 25 28 31 34 37 40 43 46 49 52 55 58 61 64 67 70 73 76 79 82 85 88
CAR
CAR

Figure 3 Market reactions of political visit caused by different government
This figure demonstrates the different 3-month market reactions of political visit caused by Xi and Hu administrations. The green line refers to
the cumulative market reactions of visit by Xi administration, and the red line shows the cumulative market reactions of political visit by Hu
administration. The reports about political visit from Leader’s Activity Database clearly write the starting date and the reporting date of the visit.
In the event study, we use the starting date of the visit rather than the reporting date as the event day in order to alleviate the information effects
brought by news release.
-1.00%
0.00%
1.00%
2.00%
3.00%
4.00%
5.00%
6.00%
7.00%
8.00%
9.00%
10.00%
dif -8 -5 -2 1 4 7 10 13 16 19 22 25 28 31 34 37 40 43 46 49 52 55 58
FormerCAR
IncumbentCAR