Embed Size (px)
Citation preview

Graduate Theses, Dissertations, and Problem Reports
2014
Political Sophistication: How Values and Social Capital Contribute Political Sophistication: How Values and Social Capital Contribute
to Political Knowledge and Cognition to Political Knowledge and Cognition
Jonathan C. Young West Virginia University
Follow this and additional works at: https://researchrepository.wvu.edu/etd
Recommended Citation Recommended Citation Young, Jonathan C., "Political Sophistication: How Values and Social Capital Contribute to Political Knowledge and Cognition" (2014). Graduate Theses, Dissertations, and Problem Reports. 270. https://researchrepository.wvu.edu/etd/270
This Dissertation is protected by copyright and/or related rights. It has been brought to you by the The Research Repository @ WVU with permission from the rights-holder(s). You are free to use this Dissertation in any way that is permitted by the copyright and related rights legislation that applies to your use. For other uses you must obtain permission from the rights-holder(s) directly, unless additional rights are indicated by a Creative Commons license in the record and/ or on the work itself. This Dissertation has been accepted for inclusion in WVU Graduate Theses, Dissertations, and Problem Reports collection by an authorized administrator of The Research Repository @ WVU. For more information, please contact [email protected].

Political Sophistication:
How Values and Social Capital Contribute to Political Knowledge and Cognition
Jonathan C. Young
Dissertation submitted to the
Eberly College of Arts and Sciences
at West Virginia University
in partial fulfillment of the requirements
for the degree of
Doctor of Philosophy
in
Political Science
Robert Duval, Ph.D., Chair
Erin Cassese, Ph.D.
Susan Hunter, Ph.D.
Neil Berch, Ph.D.
Amy Gentzler, Ph.D.
Department of Political Science
Morgantown, West Virginia
2013
Keywords: Political Sophistication, Social Capital, Values, Political Cognition, Political
Knowledge, Materialism, Post-Materialism, Value Types, Value Items, Universalism
Copyright 2013 Jonathan C. Young

i
Abstract
Political Sophistication: How Values and Social Capital Contribute to Political Knowledge and
Cognition
Jonathan C. Young
This study argues that value types defined by Shalom Schwartz should relate to social capital
and political sophistication in particular ways. Individual value types that emphasize “other-
orientation” should positively relate to social capital characteristics that increase information
flows which in turn will relate to increased political sophistication. On the other hand, it is
expected that individual value types that emphasize “self-orientation” will positively relate to
social capital characteristics that decrease information flows which in turn would correlate to
decreased political sophistication. Using post-materialism as a theoretical basis and a survey
that measures political knowledge and ideology, value orientation, social network
characteristics, and demographics (PVSN), this study attempts to quantify and explain this
relationship and develop a preliminary regression model that may be able to predict much of the
variance in political sophistication. This study finds that particular social capital characteristics
correlate with higher political sophistication and those specific characteristics are in general
related to other-oriented, self-transcendence values such as universalism and benevolence.
Alternatively, as expected, the study finds that social capital characteristics that correlate with
lower political sophistication tend to be associated with values that are self-oriented or self-
enhancing. Finally, the study shows that building a regression model that predicts a good deal of
the variance in political sophistication using demographics, political interest, and social capital
characteristics is indeed feasible.
ii
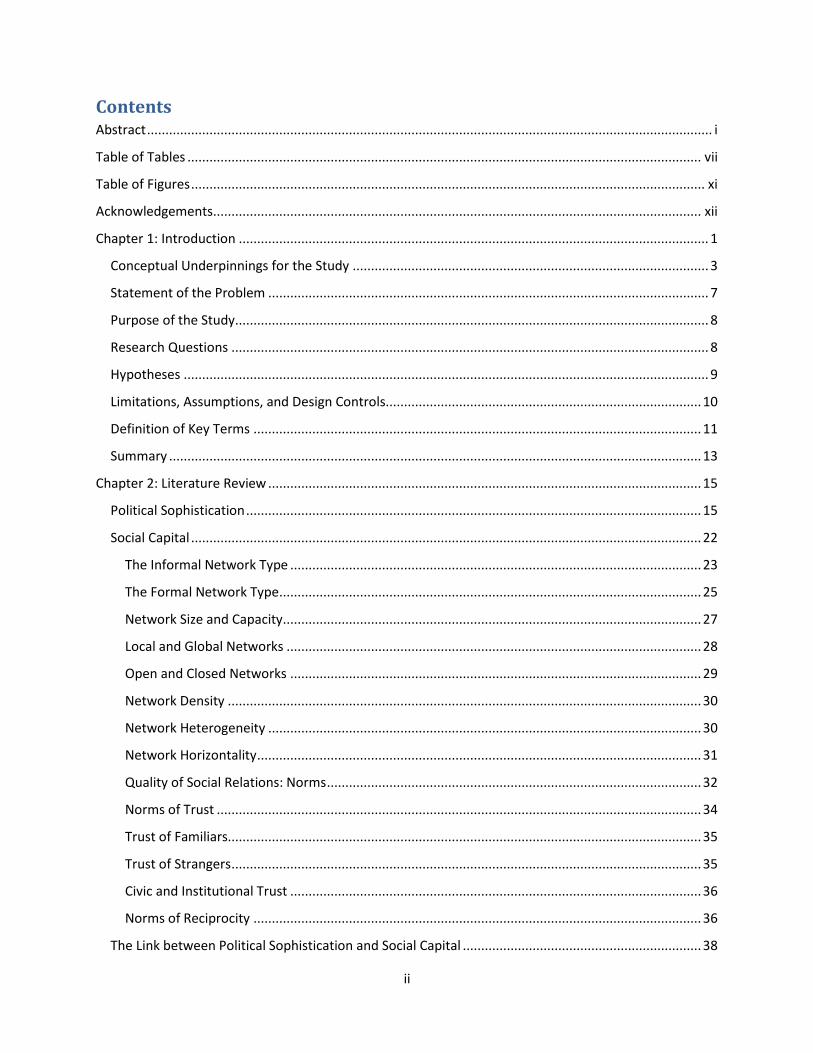
Contents Abstract .......................................................................................................................................................... i
Table of Tables ............................................................................................................................................ vii
Table of Figures ............................................................................................................................................ xi
Acknowledgements ..................................................................................................................................... xii
Chapter 1: Introduction ................................................................................................................................ 1
Conceptual Underpinnings for the Study ................................................................................................. 3
Statement of the Problem ........................................................................................................................ 7
Purpose of the Study ................................................................................................................................. 8
Research Questions .................................................................................................................................. 8
Hypotheses ............................................................................................................................................... 9
Limitations, Assumptions, and Design Controls...................................................................................... 10
Definition of Key Terms .......................................................................................................................... 11
Summary ................................................................................................................................................. 13
Chapter 2: Literature Review ...................................................................................................................... 15
Political Sophistication ............................................................................................................................ 15
Social Capital ........................................................................................................................................... 22
The Informal Network Type ................................................................................................................ 23
The Formal Network Type ................................................................................................................... 25
Network Size and Capacity .................................................................................................................. 27
Local and Global Networks ................................................................................................................. 28
Open and Closed Networks ................................................................................................................ 29
Network Density ................................................................................................................................. 30
Network Heterogeneity ...................................................................................................................... 30
Network Horizontality ......................................................................................................................... 31
Quality of Social Relations: Norms ...................................................................................................... 32
Norms of Trust .................................................................................................................................... 34
Trust of Familiars................................................................................................................................. 35
Trust of Strangers ................................................................................................................................ 35
Civic and Institutional Trust ................................................................................................................ 36
Norms of Reciprocity .......................................................................................................................... 36
The Link between Political Sophistication and Social Capital ................................................................. 38

iii
Values ...................................................................................................................................................... 40
The Link between Social Capital and Values ........................................................................................... 49
Materialism and Post-Materialism ......................................................................................................... 52
Summary ................................................................................................................................................. 53
Chapter 3: Methodology ............................................................................................................................. 56
Introduction ............................................................................................................................................ 56
The Survey Instrument ............................................................................................................................ 58
The Social Capital Battery ................................................................................................................... 58
The Values Battery .............................................................................................................................. 66
The Political Qualities Battery ............................................................................................................. 70
The Demographics Battery ................................................................................................................. 75
Factor Analysis ........................................................................................................................................ 80
Pearson Correlation Analysis .................................................................................................................. 81
Linear Regression Analysis ...................................................................................................................... 82
Chapter 4: Results ....................................................................................................................................... 83
Introduction ............................................................................................................................................ 83
Limitations Revisited ............................................................................................................................... 83
Organization of the Data Analysis ........................................................................................................... 84
Descriptive Characteristics of Respondents for Each Survey Question .................................................. 85
Social Capital Variables ....................................................................................................................... 85
Values Variables .................................................................................................................................. 99
Political Sophistication and Ideology Variables ................................................................................ 109
Demographics ................................................................................................................................... 115
Results of the Political Sophistication Factor Analysis .......................................................................... 123
Results of the Values Correlation Analysis ............................................................................................ 123
The Self-Direction Value Type ........................................................................................................... 123
The Universalism Value Type ............................................................................................................ 125
The Benevolence Value Type ............................................................................................................ 128
The Tradition Value Type .................................................................................................................. 129
The Conformity Value Type............................................................................................................... 131
The Security Value Type .................................................................................................................... 133
The Power Value Type ...................................................................................................................... 135

iv
The Achievement Value Type ........................................................................................................... 136
The Hedonism Value Type ................................................................................................................ 138
The Stimulation Value Type .............................................................................................................. 140
Value Type Factor One (Self-Enhancement) ..................................................................................... 141
Value Type Factor Two (Conservation) ............................................................................................. 144
Results of the Social Capital Correlation Analysis ................................................................................. 145
SC Factor 1: The Executive Government Trust Factor ..................................................................... 145
SC Factor 2: The Activist Organization Belonging and Trust Factor .................................................. 147
SC Factor 3: The Trust in Media Factor ............................................................................................ 149
SC Factor 4: The Trust in Representative Government Factor ........................................................ 150
SC Factor 5: The Trust in Protection Factor ..................................................................................... 152
SC Factor 6: The General Trust Factor ............................................................................................. 153
SC Factor 7: The Kinship and Religion Factor ................................................................................... 154
SC Factor 8: The Heterogeneity Factor ............................................................................................ 156
The Spatial Dimension Measure ....................................................................................................... 158
The Closure Measure ........................................................................................................................ 159
The Density Measure ........................................................................................................................ 160
The Horizontality Measure ............................................................................................................... 161
The Reciprocation Measure .............................................................................................................. 162
Correlations: Overview and Summary .............................................................................................. 163
Regression Results ................................................................................................................................ 165
Social Capital and Political Sophistication with Political Interest ..................................................... 165
Social Capital and Political Sophistication without Political Interest ................................................ 168
Social Capital and Political Interest ................................................................................................... 169
The Ten Value Types on Political Sophistication with Political Interest ........................................... 170
The Ten Values on Political Sophistication without Political Interest............................................... 171
The Two Value Factors on Political Sophistication with Political Interest ........................................ 172
The Two Value Factors on Political Sophistication without Political Interest .................................. 173
Summary of Chapter 4 .......................................................................................................................... 174
Chapter 5: Conclusion and Discussion ...................................................................................................... 175
Introduction ......................................................................................................................................... 175
Summary of the Study .......................................................................................................................... 175

v
Findings ................................................................................................................................................. 178
H1a and H1b: Informal and Formal Networks, Political Sophistication, and Self-Transcendence ... 179
H1b: Formal Networks, Political Sophistication, and Self-Transcendence ....................................... 180
H1c: Network Capacity, Political Sophistication, and Self-Transcendence ....................................... 181
H1d: Network Heterogeneity, Political Sophistication, and Self-Transcendence ............................. 182
H1e: Trust of Strangers, Political Sophistication, and Self-Transcendence ...................................... 182
H1f: Network Horizontality, Political Sophistication, and Self-Transcendence ................................ 183
H1g: Reciprocity, Political Sophistication, and Self-Transcendence ................................................. 184
H2a: Network Closure, Political Sophistication, and Self-Enhancement .......................................... 185
H2b: Network Density, Political Sophistication, and Self-Enhancement .......................................... 185
Summary of Findings............................................................................................................................. 186
Implications ........................................................................................................................................... 199
Future Research .................................................................................................................................... 200
Summary ............................................................................................................................................... 201
Bibliography .............................................................................................................................................. 202
Appendices ................................................................................................................................................ 212
Appendix A: The Circular Arrangement of Schwartz Value Types ........................................................ 213
Appendix B: Maslow’s Hierarchy of Needs ........................................................................................... 214
Appendix C: Significant One-Tailed Pearson Correlations between Value Types ................................ 215
Appendix D: SC Factor: Civic Organizations and Executive Government Demographic Charts ........... 216
Appendix E: SC Factor: Ethnic Trust Demographic Charts .................................................................... 218
Appendix F: SC Factor: Trust in Government and Major Corporations Demographic Charts .............. 220
Appendix G: SC Factor: Trust in Legal Enforcement Demographic Charts ........................................... 222
Appendix H: SC Factor: Significant Other Demographic Charts ............................................................ 224
Appendix I: SC Factor: Religiosity Demographic Charts ........................................................................ 226
Appendix J: SC Factor: Organizational Activism Demographic Charts .................................................. 228
Appendix K: SC Factor: Non-Ethnic Heterogeneity Demographic Charts ............................................. 230
Appendix L: SC Factor: Trust in Media Demographic Charts ................................................................ 232
Appendix M: SC Factor: Neighborliness Demographic Charts .............................................................. 234
Appendix N: SC Factor: Kinship Demographic Charts ........................................................................... 236
Appendix O: SC Factor: Ethnic Heterogeneity Demographic Charts .................................................... 238
Appendix P: SC Factor: Closure and Density Demographic Charts ....................................................... 240

vi
Appendix Q: SC Factor: Generic Trust Demographic Charts ................................................................. 242
Appendix R: SC Factor: Modern Networking Demographic Charts ...................................................... 244
Appendix S: SC Factor: Horizontally Reciprocal Friendship Networks Demographic Charts ................ 246
Appendix T: SC Factor: Spatial Demographic Charts ............................................................................ 248
Appendix U: SC Factor: Organizational Reliance Demographic Charts ................................................. 250
Appendix V: SC Factor: Overall Capacity Demographic Charts ............................................................. 252
Appendix W: Variable Ranges ............................................................................................................... 254
Appendix X: The PVSN Survey Instrument ............................................................................................ 255

vii
Table of Tables Table 2.1. Bonding, Bridging, and Linking Social Capital Summary ............................................................ 23
Table 2.2. Value Types and Corresponding Network Components ............................................................ 50
Table 3.1. Survey Question 1 ...................................................................................................................... 58
Table 3.2. Survey Question 2 ...................................................................................................................... 59
Table 3.3. Survey Question 3 ...................................................................................................................... 59
Table 3.4. Survey Question 4 ...................................................................................................................... 60
Table 3.5. Survey Question 5 ...................................................................................................................... 61
Table 3.6. Survey Question 6 ...................................................................................................................... 61
Table 3.7. Survey Question 7 ...................................................................................................................... 62
Table 3.8. Survey Question 8 ...................................................................................................................... 62
Table 3.9. Survey Question 9 ...................................................................................................................... 63
Table 3.10. Survey Question 10 .................................................................................................................. 63
Table 3.11. Survey Question 11 .................................................................................................................. 64
Table 3.12. Survey Question 12 .................................................................................................................. 65
Table 3.13. Survey Question 13 .................................................................................................................. 65
Table 3.14. Survey Question 14 .................................................................................................................. 66
Table 3.15. Survey Questions 15 through 24 .............................................................................................. 69
Table 3.16. Survey Questions 25 through 34 .............................................................................................. 71
Table 3.17. Survey Questions 35 and 36 ..................................................................................................... 74
Table 3.18. Survey Question 37 .................................................................................................................. 74
Table 3.19. Survey Question 38 .................................................................................................................. 75
Table 3.20. Survey Question 39 .................................................................................................................. 75
Table 3.21. Survey Question 40 .................................................................................................................. 76
Table 3.22. Survey Question 41 .................................................................................................................. 76
Table 3.23. Survey Question 42 .................................................................................................................. 77
Table 3.24. Survey Question 43 .................................................................................................................. 77
Table 3.25. Survey Questions 44 and 45 ..................................................................................................... 78
Table 3.26. Survey Question 46 .................................................................................................................. 79
Table 3.27. Survey Question 47 .................................................................................................................. 79
Table 3.28. Survey Question 48 .................................................................................................................. 80
Table 4.1. Question 1: Informal Networks Descriptives ............................................................................. 85
Table 4.2. Question 2: Formal Networks Descriptives ................................................................................ 86
Table 4.3. Question 3: Network Size and Capacity Descriptives ................................................................. 88
Table 4.4. Question 4: Spatial Dimension Descriptives .............................................................................. 89
Table 4.5. Question 7: Network Heterogeneity Descriptives ..................................................................... 92
Table 4.6. Question 10: Familiar Trust Descriptives ................................................................................... 94
Table 4.7. Question 10: Trust of Strangers Descriptives ............................................................................. 94
Table 4.8. Question 10: Trust Rankings by Mean ....................................................................................... 95
Table 4.9. Question 11: Trust of Organizations Descriptives ...................................................................... 95
Table 4.10. Question 11: Organizational Trust Rankings by Mean ............................................................. 97

viii
Table 4.11. Question 11: All Trust Rankings by Mean ................................................................................ 97
Table 4.12. Question 12: Reciprocation Descriptives ................................................................................. 98
Table 4.13. Question 14: Electronic Communication Descriptives ............................................................. 99
Table 4.14. Questions 25 through 34: Political Knowledge Descriptives ................................................. 109
Table 4.15. One-Tail Bivariate Pearson Correlations for Self-Direction Value Type ................................. 125
Table 4.16. One-Tail Bivariate Pearson Correlations for Universalism Value Type .................................. 127
Table 4.17. One-Tail Bivariate Pearson Correlations for Benevolence Value Type .................................. 129
Table 4.18. One-Tail Bivariate Pearson Correlations for Tradition Value Type ........................................ 131
Table 4.19. One-Tail Bivariate Pearson Correlations for Conformity Value Type ..................................... 132
Table 4.20. One-Tail Bivariate Pearson Correlations for Security Value Type .......................................... 134
Table 4.21. One-Tail Bivariate Pearson Correlations for Power Value Type ............................................ 136
Table 4.22. One-Tail Bivariate Pearson Correlations for Achievement Value Type ................................. 137
Table 4.23. One-Tail Bivariate Pearson Correlations for Hedonism Value Type ...................................... 139
Table 4.24. One-Tail Bivariate Pearson Correlations for Stimulation Value Type .................................... 141
Table 4.25. The Ten Factor Loadings for Value Type Factors One and Two ............................................. 142
Table 4.26. One-Tail Bivariate Pearson Correlations for Value Type Factor 1 .......................................... 143
Table 4.27. One-Tail Bivariate Pearson Correlations for Value Type Factor Two ..................................... 145
Table 4.28. Top Factor Loadings for Executive Government Trust ........................................................... 146
Table 4.29. One-Tail Bivariate Pearson Correlations for Executive Government Trust............................ 146
Table 4.30. Top Factor Loadings for Activist Organization Belonging and Trust ...................................... 147
Table 4.31. One-Tail Bivariate Pearson Correlations for Activist Organization Belonging and Trust ....... 148
Table 4.32. Top Factor Loadings for Trust in Media ................................................................................. 149
Table 4.33. One-Tail Bivariate Pearson Correlations for Trust in Media ................................................. 149
Table 4.34. Top Factor Loadings for Trust in Representative Government .............................................. 150
Table 4.35. One-Tail Bivariate Pearson Correlations for Trust in Representative Government ............... 151
Table 4.36. Top Factor Loadings for Significant Other Networks ............................................................ 152
Table 4.37. One-Tail Bivariate Pearson Correlations for Trust in Protective Services .............................. 152
Table 4.38. Top Factor Loadings for Religiosity ........................................................................................ 153
Table 4.39. One-Tail Bivariate Pearson Correlations for General Trust .................................................... 154
Table 4.40. Top Factor Loadings for Kinship and Religion ........................................................................ 155
Table 4.41. One-Tail Bivariate Pearson Correlations for Kinship and Religion ......................................... 155
Table 4.42. Top Factor Loadings for Heterogeneity.................................................................................. 156
Table 4.43. One-Tail Bivariate Pearson Correlations for Heterogeneity .................................................. 157
Table 4.44. One-Tail Bivariate Pearson Correlations for Spatial Dimension Measure ............................. 158
Table 4.45. One-Tail Bivariate Pearson Correlations for Closure ............................................................. 159
Table 4.46. One-Tail Bivariate Pearson Correlations for Density ............................................................. 160
Table 4.47. One-Tail Bivariate Pearson Correlations for Horizontality ..................................................... 161
Table 4.48. One-Tail Bivariate Pearson Correlations for Reciprocation ................................................... 162
Table 4.49. Significant Relationships w/ Political Sophistication .............................................................. 163
Table 4.50. Significant Relationships with Political Interest ..................................................................... 164
Table 4.51. Regression Results for Social Capital Regressed on Political Sophistication w/ Political Interest
as an Independent Variable ...................................................................................................................... 166

ix
Table 4.52. Regression Results for Social Capital Regressed on Political Sophistication w/o Political
Interest as an Independent Variable ........................................................................................................ 168
Table 4.53. Regression Results for Social Capital Regressed on Political Interest .................................... 169
Table 4.54. Regression Results for the Ten Value Types Regressed on Political Sophistication w/ Political
Interest ...................................................................................................................................................... 170
Table 4.55. Regression Results for the Ten Value Types Regressed on Political Sophistication w/o Political
Interest ...................................................................................................................................................... 171
Table 4.56. Regression Results for the Three Value Factors Regressed on Political Sophistication w/
Political Interest ........................................................................................................................................ 172
Table 4.57. Regression Results for the Three Value Factors Regressed on Political Sophistication w/o
Political Interest ........................................................................................................................................ 173
Table 5.1. Correlations for Informal Networks with Political Sophistication and Self-Transcendence Value
Types ......................................................................................................................................................... 179
Table 5.2. Correlations for Formal Networks with Political Sophistication and Self-Transcendence Value
Types ......................................................................................................................................................... 180
Table 5.3. Correlations for Network Capacity with Political Sophistication and Self-Transcendence Value
Types ......................................................................................................................................................... 181
Table 5.4. Correlations for Network Heterogeneity with Political Sophistication and Self-Transcendence
Value Types ............................................................................................................................................... 182
Table 5.5. Correlations for Trust of Strangers and General Trust with Political Sophistication and Self-
Transcendence Value Types ...................................................................................................................... 183
Table 5.6. Correlations for Network Horizontality with Political Sophistication and Self-Transcendence
Value Types ............................................................................................................................................... 184
Table 5.7. Correlations for Reciprocity with Political Sophistication and Self-Transcendence Value Types
.................................................................................................................................................................. 184
Table 5.8. Correlations for Network Closure with Political Sophistication and Self-Enhancement Value
Types ......................................................................................................................................................... 185
Table 5.9. Correlations for Network Density with Political Sophistication and Self-Enhancement Value
Types ......................................................................................................................................................... 186
Table 5.10. Positive Social Capital Correlations with Political Sophistication .......................................... 186
Table 5.11. Negative Social Capital Correlations with Political Sophistication ......................................... 187
Table 5.12. Value Correlations with Participation in Non-Religious Humanitarian Organizations ........... 187
Table 5.13. Value Correlations with Participation in a Political Party ...................................................... 188
Table 5.14. Value Correlations with Participation in an Environmental Organization ............................. 188
Table 5.15. Value Correlations with Participation in Professional Organizations .................................... 189
Table 5.16. Value Correlations with Participation in a Consumer Organization ...................................... 189
Table 5.12. Value Correlations with Significant Other Capacity ............................................................... 190
Table 5.15. Value Correlations with Neighbor Capacity ........................................................................... 190
Table 5.16. Value Correlations with General Trust Factor ........................................................................ 191
Table 5.16. Value Correlations with Importance of Family ...................................................................... 191
Table 5.16. Value Correlations with Importance of a Significant Other ................................................... 192
Table 5.16. Value Correlations with Participation in a Church or Religious Organization ........................ 193

x
Table 5.16. Value Correlations with Family Capacity ................................................................................ 193
Table 5.21. Value Correlations with Closure and Density ......................................................................... 194
Table 5.18. Value Correlations with Trust in the Representative Government Factor ............................ 195
Table 5.19. Value Correlations with Trust in Protective Services Factor .................................................. 196
Table 5.16. Value Correlations with Kinship and Religiosity Factor .......................................................... 197
Table 5.23. Regression Results for Social Capital Regressed on Political Interest .................................... 198

xi
Table of Figures Figure 1. Information Flow and Political Information ................................................................................. 38
Figure 2. Schwartz Value Types and Corresponding Items ......................................................................... 48
Figure 3. Values and Expected Relationships.............................................................................................. 54
Figure 4. Proposed Directional Effects ........................................................................................................ 54
Figure 5. Question 5: Network Closure Descriptives .................................................................................. 89
Figure 6. Question 6: Network Density Descriptives .................................................................................. 91
Figure 7. Question 8: Network Horizontality (Hierarchy) Descriptives....................................................... 93
Figure 8. Question 15: Self-Direction Value Type Agreement .................................................................. 100
Figure 9. Question 16: Power Value Type Agreement .............................................................................. 101
Figure 10. Question 17: Security Value Type Agreement ......................................................................... 101
Figure 11. Question 18: Hedonism Value Type Agreement ...................................................................... 102
Figure 12. Question 19: Benevolence Value Type Agreement ................................................................. 103
Figure 13. Question 20: Achievement Value Type Agreement ................................................................. 104
Figure 14. Question 21: Stimulation Value Type Agreement ................................................................... 106
Figure 15. Question 22: Conformity Value Type Agreement .................................................................... 107
Figure 16. Question 23: Universalism Value Type Agreement ................................................................. 108
Figure 17. Question 24: Tradition Value Type Agreement ....................................................................... 109
Figure 18. Question 35: Fiscal Liberalism .................................................................................................. 112
Figure 19. Question 36: Social Liberalism ................................................................................................. 113
Figure 20. Question 37: Political Affiliation .............................................................................................. 113
Figure 21. Question 38: Political Interest ................................................................................................. 114
Figure 22. Question 39: Age ...................................................................................................................... 115
Figure 23. Question 41: Gender ............................................................................................................... 116
Figure 24. Question 42: Income ................................................................................................................ 117
Figure 25. Question 43: Education ............................................................................................................ 118
Figure 26. Question 44: Length of Residence ........................................................................................... 118
Figure 27. Question 45: Residence Ownership ......................................................................................... 119
Figure 28. Question 46: Occupation Classification ................................................................................... 120
Figure 29. Question 47: Ethnicity .............................................................................................................. 120
Figure 30. Question 48: Religion ............................................................................................................... 121

xii
Acknowledgements I would like to thank several people for my success as a student and as a continuously growing
individual. I would first like to thank Dr. Bob Duval for his support throughout my graduate
studies. I have learned a great deal from him, particularly in statistics and methodology. His
experience was a great boon to my studies. I would also like to thank Dr. Erin Cassese for her
consistent emphasis on a rigorous theoretical understanding of my research topics, as well as Dr.
Amy Gentzler for her psychological perspective on values. Dr. Neil Berch also deserves great
thanks for helping to mature my understanding of state and local politics early in my studies,
with which I tempered my passion for research – such as this dissertation – that impacts local
and regional communities. Drs. Kevin Leyden and Robert DiClerico also deserve my thanks for
inspiring much of my research direction over the years.
I want to thank Dr. Susan Hunter for her passion and dedication to her own causes that often
meshed with my own. I would like to also thank her for her continued support, starting in my
undergraduate years in a policy analysis course. I will always remember the Dogtown, WV
government simulation with fondness. She also educated me in decision analysis, which largely
sparked my interest in game theory.
My friends and colleagues at the WVU Office of Research Integrity and Compliance have been
wonderful help. They have professionalized me into a great career path and have become friends
who have supported my growth and stability.
Dr. Betty Mei and the McNair Scholars family deserve a great deal of my thanks. As the leader
of the WVU McNair Scholars Program, Dr. Mei helped instill in me determination and
motivation that I needed as a first-generation, low-income college student to obtain the goals I
have always hoped to accomplish. She has been a significant driving force behind my motivation
to earn a Ph.D. and continue my research career. I will always be grateful.
I would like to thank my grandma, Peggy Summers, for her lifelong support. She has always
believed in me no matter what I wanted to do and has always made me aware that she is always
proud of me. Without her, I am almost certain that my life may not have taken the course that it
did and I owe her a great debt that can never be completely repaid.
My grandaunt Helen Summers-Strickland will always have my gratitude. Growing up, I always
heard the stories of her starting her teaching career at my great grandfather’s one-room
schoolhouse in Jordan Creek, WV at the young age of 17. She supported my academic
development when she could and she inspired me through her own life story.
My mother, Kimberly Young, also deserves my gratitude. She has always had her own passion
for research and knowledge, but unfortunately was not able to develop that in her own life. It is
because of her passion for knowledge that I became interested in learning, and she has always

xiii
been supportive of me throughout my schooling. Without her, I might have not been interested in
research at all.
Lastly, I would like to thank my sister, Stephanie Starkey, and my friends, Rob Adkins, Josh
Atkinson, and Chris Hiskey. Without their personal support and friendship, I may not have
become the person I am and may not have gotten through some tough times on this road we call
life.

1
Chapter 1: Introduction
“Move sixteen tons, and what do you get? Another day older and deeper in debt. Saint Peter don't you
call me 'cause I can't go. I owe my soul to the company store... (Travis 1955).”
In the spring of 1883, the state of West Virginia began its foray into the coal industry.
Mining companies established company towns where they controlled both housing and the
supply chain for household items. At the time, it was not out of the ordinary for coal mining
companies in the region to pay their workers in what has been termed as “scrip.” Scrip was a
currency issued by the mining companies instead of paying their workers in United States dollars.
Several attempts by the newly-formed United Mine Workers of America (UMWA) in 1892,
1894, 1895, and 1897 to unionize this region of Appalachia fell short. By 1912, the UMWA had
lost its inroads into the Kanawha River area largely due to the intimidation tactics used by the
mining companies. These and other struggles, along with the isolation of settlers in the region
have helped define what has become the Appalachian culture (West Virginia’s Mine Wars 2012).
These and other struggles, along with the isolation of settlers in the region have helped define
what has become the Appalachian culture (Appalachian Regional Commission).
The bulk of Appalachian culture is rooted in the existence of family kinship networks.
These networks are often extended and as such may include grandparents, their children,
grandchildren, and sometimes even close family friends all in one household. The family
environment and these extended kinship networks often foster a sense of belonging, but only for
those who are similar to the people who are part of the network; thus, the bonding capital within
the group and between similar people tends to be very strong. Perhaps a result of the strong

2
kinship bonds present in Appalachia, people in the culture also often tend to be xenophobic; that
is, they are highly suspicious of strangers and those who are dissimilar (McEvoy 2002).
The kinship bonds and xenophobia make it especially hard for outsiders to enter the
culture and influence its development. The xenophobia has developed as a result of decades or
even centuries of perceived exploitation by outsiders; people from outside the region who have
only sought to extract the resources located there while also oppressing the population. Because
of this, many Appalachians do not seek to leave their own state or even their own county
(McEvoy 2002).
Appalachians are also very traditionalistic, partially due to the isolated terrain. Tending to
be patriotic, most consider themselves proud Americans, but at the same time they are much less
political active and less likely to engage in political dissent than people outside the region. There
is a strong derision among Appalachians of competitiveness among the kin, perhaps largely
developed from the need to protect themselves from outside influences like the coal companies
their ancestors had to defend against (McEvoy 2002; Lewis and Billings 2009).
Today, Appalachians continue to struggle. The region is one of the most impoverished
and uneducated regions in the United States. From 2006 to 2010, the average poverty rate for
states in the Appalachian region was 16.4%, over 4% higher than the national average
(Appalachian Regional Commission). Educational attainment in 2000 was also much lower than
the national indicators. Only 17.7% of Appalachian adults had a bachelor’s degree or higher
compared with 24.4% nationally (Appalachian Regional Commission). Moreover, voter turnout
in 2008 was five percent lower in the Appalachian region when compared to the rest of the
United States (Cassese, Zimmerman, and Santoro 2012).

3
Conceptual Underpinnings for the Study
Could the values that people – such as Appalachians – hold influence their social
environment, political knowledge, and how they think about politics? The concepts of
materialism and post-materialism can help explain why this may be so. Sociological post-
materialists claim that as societies progress and modernize, they undergo a change in values from
materialist to post-materialist values. Materialist values emphasize economic and physiological
security while post-materialist values emphasize self-expression and self-direction.
The theory of post-materialism is largely composed of two general hypotheses. First, the
scarcity hypothesis states that, while there is high scarcity of resources in an individual’s
environment, materialistic goals and values will be prioritized over post-materialist goals and
values. Second, the socialization hypothesis states that groups of people who have experienced
high resource scarcity will continue to prioritize materialist values over post-materialist values
their entire lives and that long periods of resource affluence are necessary to change value
priorities from materialist to post-materialist values from one generation to the next.
In the Appalachian example, this would mean that the scarce resources Appalachians
have experienced have prevented Appalachian value priorities from shifting from materialist to
post-materialist ones. Since this resource scarcity has prevailed over time throughout most of the
Appalachian region, there has been very little shift toward post-materialist values. This may
mean that important values that could be responsible for enhancing political and social
engagement are not prioritized over materialist values.
Values concepts developed by Shalom H. Schwartz (1992) are useful in describing
overarching value types that can be utilized to further understand the link between value
priorities, political, and social engagement. Schwartz’s value typology has been used in several
4
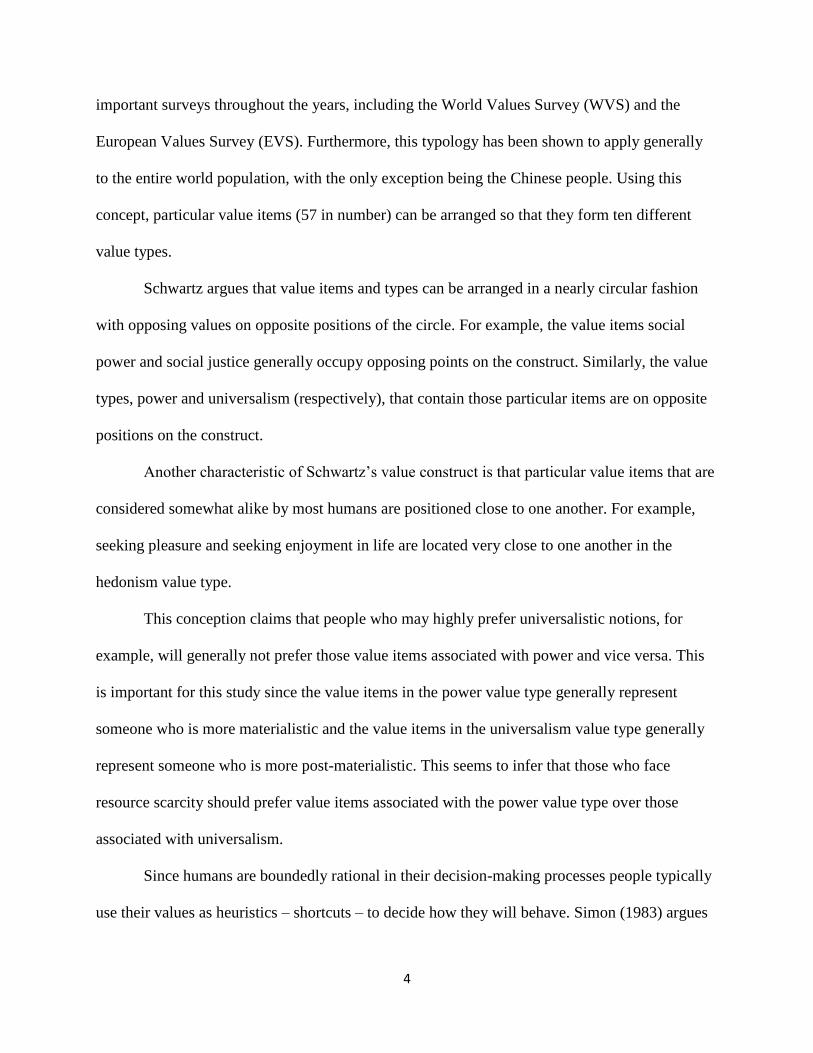
important surveys throughout the years, including the World Values Survey (WVS) and the
European Values Survey (EVS). Furthermore, this typology has been shown to apply generally
to the entire world population, with the only exception being the Chinese people. Using this
concept, particular value items (57 in number) can be arranged so that they form ten different
value types.
Schwartz argues that value items and types can be arranged in a nearly circular fashion
with opposing values on opposite positions of the circle. For example, the value items social
power and social justice generally occupy opposing points on the construct. Similarly, the value
types, power and universalism (respectively), that contain those particular items are on opposite
positions on the construct.
Another characteristic of Schwartz’s value construct is that particular value items that are
considered somewhat alike by most humans are positioned close to one another. For example,
seeking pleasure and seeking enjoyment in life are located very close to one another in the
hedonism value type.
This conception claims that people who may highly prefer universalistic notions, for
example, will generally not prefer those value items associated with power and vice versa. This
is important for this study since the value items in the power value type generally represent
someone who is more materialistic and the value items in the universalism value type generally
represent someone who is more post-materialistic. This seems to infer that those who face
resource scarcity should prefer value items associated with the power value type over those
associated with universalism.
Since humans are boundedly rational in their decision-making processes people typically
use their values as heuristics – shortcuts – to decide how they will behave. Simon (1983) argues

5
that, since the world is complex and humans are limited biological organisms, people must cope
with imperfect information; limited cognitive processing ability, and limited cognitive storage
capacity. People will therefore use heuristic shortcuts to arrive at a suboptimal solution to a
question or problem.
People use values everyday as heuristics to decide how they will behave in normal
situations. One could ask themselves if they wanted to go to church today. If that particular
person’s ranking of the “devout” Schwartz value item were high, then they would be likely to
decide to do so. However, if the value item opposing devoutness – being daring – were highly
preferred instead, this particular person would be much less likely to attend church. Similarly,
people use values to more quickly decide whether or not to support political stances, candidates,
or even to decide what information to seek.
A central question then would be whether these values affect social capital and political
sophistication. Social capital is defined in Putnam (2000) as referring to “the collective value of
all 'social networks' and the inclinations that arise from these networks to do things for each
other." James Coleman’s definition is a bit more precise. He states that social capital is anything
that facilitates individual or collective action through relationships, reciprocity, trust, and social
norms.
Social capital can be thought of as having nine key components (Stone 2001). These nine
components are network type, network size and capacity, local and global networks, open and
closed networks, dense and sparse networks, homogeneous and heterogeneous networks,
network horizontality, the norm of trust, and the norm of reciprocity. Through these nine
components, social capital operates as a medium of information exchange. The stronger a
person’s social capital is, the more information he or she should receive and transmit.

6
Values should affect a person’s propensity to develop social capital. For example, if a
person is highly concerned with security value items such as family security, as Appalachians are,
then they would be less likely to trust particular people and perhaps less likely to possess a
heterogeneous group of social ties. On the other hand, if a person is highly concerned with
universalism value items such as equality and broadmindedness, a person would be much better
suited to having a diverse group of social ties.
Political sophistication is a concept used to describe the way people think about the
political information they have, and is composed of two primary components. First, political
knowledge is needed for sophistication to develop at all. Political knowledge can be in the form
of facts and figures such as who the current President of the United States is or whether the
United States is a member of the North Atlantic Treaty Organization (NATO).
The second component of political sophistication is political cognition. Political
cognition is how, how much, and how deeply people think about the knowledge that they have.
For example, if two people learn who the President of the United States is at the same time and
one of those people never thinks about that piece of information ever again whereas the other
becomes actively involved in lobbying the President, then the second person has much greater
political cognition; they have the information and they are using that information.
Values should also affect political sophistication. While part of the effect may be due to
increasing social capital as described previously, some value items and types should also directly
affect the presence of political sophistication. For example, if a person highly values the curiosity
value item or the self-direction value type, they should be more likely to accumulate knowledge
than those who are at the opposite spectrum of the Schwartz value conception; that is, those who
accept their portion in life, or who are highly traditional.

7
Statement of the Problem
While there is anecdotal evidence to suggest that values are correlated with social capital
and political sophistication, no prior study has directly connected the concepts with one another.
This is important in order to solidify the connection between the two phenomena. If values do
affect social capital production, then this would give us better insight into how malleable social
capital may be. If social capital is highly dependent on some particular value types, then those
value types may be the best barometer for the formation of social capital. When non-profit or
governmental organizations plan to design programs to increase social capital, they would need
to take the value types in the region into consideration.
Moreover, the same goes for political sophistication. Perhaps political sophistication also
relies upon values. If that is the case, then programs designed to improve political sophistication
will need to take into consideration the value constructs people hold. This may also mean that,
since values are not typically malleable in adulthood, that people continue their preferences for
political information and cognition after they reach that developmental stage. If that is indeed the
case, then programs attempting to change preferences for political sophistication may be “going
against the grain” after adulthood.
Furthermore, social capital has been discussed extensively in the literature as being a
medium for exchange of information, yet no study has made the connection between social
capital and political sophistication in a distinct way. If social capital does indeed affect political
sophistication, efforts to improve political sophistication can be constructed to include activity
that also improves social capital. For example, if increased social network heterogeneity and
network closure positively affects political sophistication, then a comprehensive effort to

8
improve political sophistication should also include programs designed to improve heterogeneity
and closure.
Values may also perpetuate predispositions against the formation of social capital and
political sophistication. Since values are not flexible after adulthood, many people who hold
values that may hinder the formation of social capital and political sophistication may remain
“stuck” throughout the remainder of their lives. This can pose a major problem for the
advancement of social capital and political sophistication over generations; especially so if these
same people impart the same values onto their succeeding generations, creating a cycle of low
social capital and low political sophistication.
Purpose of the Study
For these reasons, conducting this study would not only enhance the body of knowledge
used by political scientists, sociologists, and psychologists, but would also advance policy and
program creation, implementation, and analysis. Literature exists in the political science
discipline that implies an association between values and larger political outcomes, and this
study should help to solidify those implications and add to the knowledge about how individuals
make social and political decisions generally. If the study findings are as expected, it could also
help contribute to a predictive model used to arrive at how much social capital and political
sophistication a person or population would have in the future. Community and political leaders
could also use the information gleaned by this study to tailor their programs and policies to
mitigate the effects of values on social capital and political sophistication.
Research Questions
The following research questions will guide the study toward a conclusion.

9
1. Are social capital characteristics that facilitate information flow significantly correlated
with particular Schwartz value types?
a. More specifically, are the “other-oriented,” self-transcendence Schwartz value
types associated with social capital characteristics that enhance information flow?
b. Also, are the “self-oriented,” self-enhancement Schwartz value types associated
with social capital characteristics that inhibit information flow?
2. Do social capital characteristics that facilitate information flow significantly correlate
with more political sophistication?
3. Can a preliminary predictive model be built for describing the relationship between social
capital and political sophistication?
Hypotheses
The following is the list of hypotheses related to the possible relationship between values
and social capital:
H1: All social capital characteristics that increase information flow will have a positive
correlation with political sophistication and a positive correlation with self-transcendence values.
a. Informal network importance will correlate positively with (i) political sophistication
and (ii) self-transcendence values
b. Formal network importance will correlate positively with (i) political sophistication
and (ii) self-transcendence values
c. Network capacity will correlate positively with (i) political sophistication and (ii)
self-transcendence values
d. Network heterogeneity will correlate positively with (i) political sophistication and
(ii) self-transcendence values

10
e. Trust of strangers will correlate positively with (i) political sophistication and (ii)
self-transcendence values
f. Network horizontality will correlate positively with (i) political sophistication and (ii)
self-transcendence values
g. Reciprocity will correlate positively with (i) political sophistication and (ii) self-
transcendence values
H2: All social capital characteristics that decrease information flow will have a negative
correlation with political sophistication and positive correlation with self-enhancement values.
a. Network closure will correlate (i) negatively with political sophistication and (ii)
positively with self-enhancement values
b. Network density will correlate (i) negatively with political sophistication and (ii)
positively with self-enhancement values
In order to test these hypotheses, this dissertation will present 5 chapters, beginning of
course with this chapter. Next, in chapter 2, applicable literature on the topics at hand will be
introduced, followed by the theoretical and operational underpinnings of the study in chapter 3.
Chapter 4 will present a thorough examination of the data gathered. Finally, chapter 5 will
present the findings and conclusions of the study.
Limitations, Assumptions, and Design Controls
The study is limited for several reasons. First, a completely representative sample was not
possible due to budget and personnel constraints. With a larger budget, this study could have
included a representative sample surveyed via phone, mail, and email, and with a larger group of
personnel, the researchers could have sampled a larger set of universities and other populations

11
not represented in the survey. For example, this study oversamples Caucasians and those with a
higher education.
Second, there were no adequate alternatives to conducting a new survey; that is, there
was no existing data available to work from. This study hypothesizes some novel connections
between social and political phenomena that have not been in the same survey together,
including the World Values Survey (WVS), the American Values Survey (AVS), or the
European Values Survey (EVS). The WVS does indeed include the Schwartz value types, but
does not include adequate measures of social capital or political sophistication. The AVS does
not measure the same value typology this study examines, does not include adequate questions
about social capital, and does not include viable measures of political sophistication.
Furthermore, the EVS, while it does incorporate the Schwartz value survey, does not include
adequate measures of social capital or political sophistication.
This study assumes that people are boundedly rational actors in any environment. Other
assumptions are that values influence decision-making, cognitive dissonance causes dichotomous
value items and types, and that materialists prefer basic values akin to the motivations indicated
in Maslow’s hierarchy of needs. Potential problems, such as measuring political cognition are
controlled for using weighting and other statistical procedures as described later in this
dissertation.
Definition of Key Terms
Many important terms are used throughout this paper. Definitions of those particular
terms are given below:
Value. “Conceptions of the desirable that influence the way people select action and evaluate
events (Schwartz 1994).”
12
Value Item. A particular value, such as social justice or cleanliness (Schwartz 1994).
Value Type. A grouping of statistically similar value items that are closely related and close
together in meaning (Schwartz 1994).
Value Dimension. A grouping of statistically similar value types that are closely related and
close together in meaning (Schwartz 1994).
Social Capital. Anything that facilitates individual or collective action through relationships,
reciprocity, trust, and social norms (Coleman 1988).
Network Relation. A particular individual’s belongingness to a particular network.
Informal Network. A network which is composed of informal relationships such as friendships,
kinships, acquaintances, etc. (Stone 2001).
Formal Network. A network composed of formal relationships primarily a construct of
organized groups such as unions, churches, political parties, environmental groups, etc. (Stone
2001).
Network Type. Whether a network relation is informal or formal (Stone 2001).
Network Globalization. How geographically extensive a network is. For example, if one’s
network extends to people living in other countries, that person’s network would be more
“globalized” than another person’s network that only extends to other states within the same
country (Stone 2001).
Network Closure. How interconnected one’s network is. For example, consider one network
where a person A knows person B, and person B knows person C; however person A does not
know person C. Now consider another network where person D knows person E and both person
D and E know person F. The latter network would be more closed than the former network
(Stone 2001).

13
Network Density. How dense a network is. If in one network, there are 5 close friends and in
another there are only 3 close friends, then the former network is denser than the latter (Stone
2001).
Network Heterogeneity. How heterogeneous a network is, specifically relating to knowing
people of varying demographics (Stone 2001).
Stranger Trust. The level of trust in people who one does not know.
Familiar Trust. The level of trust in people who one does know.
Organizational Trust. The level of trust in formal organizations such as the United States armed
forces, the local town government, environmental groups, etc.
Trust. Overall trust levels, which include stranger trust, familiar trust, and organizational trust.
Reciprocity. A feeling where if one is given or taken from, one must give or take back in return
(Putnam 2000, Stone 2001).
Political Knowledge. How much one knows about his or her political environment (Luskin 1987).
Political Cognition. How much and deeply one thinks about his or her political environment and
knowledge (Luskin 1987).
Political Sophistication. A combination of both political knowledge and political cognition
(Luskin 1987).
Summary
Groups of people, like Appalachians, have undergone significant hardship in their social
and political environments. As a result, these groups have a particular value structure which
defines their culture’s and individual’s characteristics. These values, in turn, influence how these
people and people similar to them interact with their social and political environments. Decision-
making takes place using values to help decide what outcomes should be.

14
People generally use values to help make decisions because they are boundedly rational
and wish to avoid the mental anguish caused by cognitive dissonance. For example, if someone
strongly values their security, they are very unlikely to vote for someone who strongly opposes
security; if the person did, then they would experience psychological distress in reconciling their
vote with their strongly held belief in favor of security. Values take the form of heuristic
shortcuts in decision-making in many cases. A good example is straight-ticket party-line voting.
If someone believes the Republican Party better represents their values than any other party, they
can take the heuristic shortcut and vote straight-ticket Republican.
These values should relate to social capital and political sophistication. Social capital is
anything that facilitates individual or collective action through relationships, reciprocity, trust,
and social norms (Coleman 1988), while political sophistication is how much one knows about
his or her political environment and how much and deeply one thinks about their political
environment and knowledge (Luskin 1987). Moreover, the theory of post-materialism combines
with the values literature to suggest that materialist value holders should be less likely to engage
in the creation of social capital or political sophistication.
This study uses a survey design to test whether the connections implied in the literature
do indeed exist. This study also seeks to determine whether there are directional relationships
within the data collected. Even though the study is limited by budgetary and personnel
constraints, the researchers were able to obtain a testable sample for these purposes.

15
Chapter 2: Literature Review
This chapter introduces the reader to the key concepts involved in this study. Recall that
the principal research questions focus on whether values are significantly correlated with many
of the nine social capital components and with political sophistication. This research topic will
benefit from a review and discussion of past literature in several key areas.
First, this chapter will discuss the chief dependent variable in the study – political
sophistication. Next, a discussion on social capital will occur followed by a discussion of the
values literature as it pertains to this study. Several key theories motivate the hypotheses
previously set forth herein; namely, cognitive dissonance, and post-materialism. After the key
variables and theoretical considerations are brought to light, this chapter will conclude with a
brief synopsis of the literature associated with important socioeconomic variables that will also
be included in the analysis as useful control variables, along with a summary of this chapter.
Political Sophistication
Political sophistication can be defined as the amount of political information one holds
and how one thinks about that information. Two primary components of the concept are political
knowledge and political cognition. While political knowledge is derived external of a person’s
own thoughts, cognition occurs internally in one’s mind.
Political sophistication is very important for the effectiveness and continuing operation of
any democracy. Many key facets of democracy and the political environment have been shown
to be significantly influenced by political sophistication, including interest in politics,
participation in voting and other activities of a political nature (Verba and Nie 1972; Klingemann
1979; Inglehart 1979; Luskin 1990), pursuit of political interests (Converse 1964; Chong,

16
McClosky, and Zaller 1983; Luskin 1990), blame attribution for government policies (Gomez
and Wilson 2006 and 2008; Nyhan and Reifler 2010; Rudolph 2003), resistance to political
persuasion (Scott 1991; Chaiken and Baldwin 1981; Cacioppo and Petty 1980; Luskin 1990),
resistance to agenda setting and media priming (Iyengar, Peters, and Kinder 1982; Luskin 1990),
less resistance to reasoned political arguments (Chaiken 1980; Petty and Cacioppo 1979 and
1984; Luskin 1990), use of political thinking mechanisms (Kam 2005), attitude polarization
(Taber and Lodge 2006), and increased attention to policy issues and less so to candidate
personality (Miller and Miller 1976; Wyckoff 1980; Knight 1985; Luskin 1990). Galston (2001)
noted that levels of political knowledge affect political attitudes, participation, and the
acceptance of general democratic principles.
Political knowledge and skill can positively influence the effectiveness of a citizen’s
participation, thus enhancing the citizen’s influence in the political domain overall (Verba and
Nie 1972). Political sophistication also allows people to come to conclusions based upon values;
that is, if a political event is experienced, the person can make a judgment based upon values and
knowledge to whether that event was favorable or unfavorable (Klingemann 1979; Halman 2001;
Inglehart 1979).
Coupled with age, political sophistication can also help develop a sense of political
interest or ideology, helping develop a broader view of the liberal-conservative spectrum and its
nuances (Converse 1964). Indeed, those with higher levels of political sophistication are shown
to be more politically active, especially at the grassroots level (Converse 1964; Chong,
McClosky, and Zaller 1983).
Political sophistication has also been found to correspond to blame attribution during
times of crises (Rudolph 2003). After the Hurricane Katrina disaster, many blamed federal-level
17
actors such as the president for the botched reaction to that disaster. However, Gomez and
Wilson (2008) find that people with higher levels of political sophistication tended to place
blame (correctly) on the state-level actors involved in the disaster response, and those with lower
levels of political sophistication tended to blame the president. Gomez and Wilson state that this
is so because it is much easier to use the president as a proxy for anything that goes on in the
government rather than assign blame correctly (Gomez and Wilson 2008).
Adding to the Gomez and Wilson (2008) results, Nyhan and Reifler (2010) show that
correcting information about an already held political belief was moderated by ideology. In the
study, Nyhan and Reifler find that information corrections given to those with higher ideological
tendencies actually strengthen misperceptions of particular government policies or political
issues; something they term the backfire effect. This result would suggest that those who adhere
to particular ideologies may discard factual political information because it conflicts with their
political beliefs (Nyhan and Reifler 2010).
Other literature conjectures that less sophisticated citizens do not credit or blame the
government for their own economic boon or hardship and more sophisticated citizens tend to
place blame on government actors other than the president (Gomez and Wilson 2007). Less
sophisticated individuals tend to blame actors in close proximity to themselves while more
sophisticated individuals disperse the blame on actors in close proximity and on actors who are
distant, such as Congress.
Gomez and Wilson (2006) have found that political sophistication affects economic
voting. Those with higher levels of political sophistication tend to “vote their pocketbook;”

18
meaning that they vote based upon their current financial situation. On the other hand, people
who have less political sophistication tend to vote based upon sociotropic – or broadly national –
perspectives of how the economy is doing.
Concerning political persuasion, those with better-formed political attitudes prior to the
presence of political persuasion were more likely to resist the new persuasion attempt, and
political attitudes are better-formed in people who have higher political sophistication (Chaiken
and Baldwin 1981). Even as the persuasion attempt is repeated, the target becomes more resistant
(Cacioppo and Petty 1980). Moreover, when presented with media messages meant to prime
beliefs and attitudes, people with higher levels of political sophistication are much more likely to
see through the evidence being presented and often interpret it as being one-sided or not entirely
true (Iyengar, Peters, and Kinder 1982). People who have greater political sophistication are
more accepting of reasoned arguments. Highly politically involved individuals have been shown
to be much more likely to use systematic information processing than sweeping heuristic
generalizations when making their decisions (Chaiken 1980).
Political sophistication also prompts specific types of political thinking. Higher levels of
political sophistication have been found to correspond to systematic thinking (political thinking
based upon factual evidence associated with the issue) while people who have lower levels of
political sophistication tend to think heuristically, using party identification or other cues as
proxies to determine their issue support (Kam 2005).
Taber and Lodge (2006) add to the discussion by studying bias in political opinion. They
find that people with higher levels of political sophistication tend to become more polarized on

19
issue attitudes after being allowed to choose their information on a particular topic and are
presented with counterarguments. This suggests that those among us who are the most
knowledgeable about politics may tend to be the people who are most polarized or politically
zealous.
The first component of political sophistication – political knowledge – are the bits of
political information someone has gathered overtime (Luskin 1987). These can include facts
such as who one’s current state governor is or when the country was founded. Obviously then,
political knowledge can be easily measured by asking a series of questions. However, the best
series of questions with which to measure political knowledge has several key facets. First, the
questions should cover a range of information since one person’s salient political information
may not be the same as another. For example, if you have two people who are completing a
political knowledge questionnaire and one of them is a farmer, the other an educator, then it is
unlikely the educator will get any questions correct if you only ask about farming subsidies or
grain prices.
Next, the questions must range in difficulty to capture the knowledge of someone who is
less sophisticated and also those who are more sophisticated. Consider another questionnaire
where only extremely difficult political questions are asked such as “Who is the mayor of
Harrisburg, Pennsylvania?” or “In what year was the Environmental Protection Agency
created?” There would be a slim chance that the political knowledge measured would be
applicable to any large, general public. Salient questions should also be asked (Luskin 1987).
The second major component of political sophistication – political cognition – is more
abstract and can be tricky to measure (Luskin 1987). Political cognition can be summarized as

20
how much people think of political information, how deeply they think of it, and the connections
they form between the pieces of information that they have gathered. For example, believing that
the president is “in charge” of the government and that the Federal Reserve Bank is “part of the
government” is not sufficient information to blame the president for the policies of the Federal
Reserve. The former example represents someone who may have low political cognition.
However, someone with greater cognition may find a deeper understanding of the interaction
between the Office of the President and the Federal Reserve. This person would find that the
only power that the president or Congress has over the Federal Reserve is the appointment (by
the president) and confirmation (by the Senate) of its board members.
Several demographic variables have been found to affect the presence of political
sophistication. First, educational attainment has been found to increase political sophistication
due to increased exposure to information (Luskin 1990, Galston 2001, Hillygus 2005, Neuman
1986, Delli Carpini and Keeter 1996, Hendriks-Vettehen et al. 2004). Education could also be a
proxy for differences between people prior to their political sophistication forming, such as
relative intelligence (Luskin 1990). Civic education in school has been found to correlate
positively with levels of political knowledge. Particularly, service learning which includes civic
participation and classroom reflection upon those activities has been tied to an increase in
political knowledge (Galston 2001).
Second, gender identification as a female has consistently been found to negatively affect
political sophistication, perhaps due to the traditional role of women as caretakers of the
household and deference to the male members of the household for political decisions (Campbell
et al. 1960, Delli Carpini and Keeter 1996, Frazer and Macdonald 2003, Mondak and Anderson
2004, Dow 2009, Lizotte and Sidman 2009, Dolan 2011).

21
Age has also been found to increase political sophistication because older generations
have been shown to have higher levels of political knowledge, in addition to life-cycle effects
(Jennings 1996, Luskin 1990, McAllister 1998). Generational effects are due to different
socialization effects felt by different age cohorts. Political interest and electoral turnout is often
highly positively correlated with age (Blais et al. 2004, Clarke et al 2004, Wass 2007, Prior
2010). The life-cycle effect occurs when people accumulate political knowledge and other
information over time as they age (Jennings 1996). In other words, as people age, they are
exposed to more political events and more information related to the political world that
surrounds them. People can absorb this information either consciously or not.
Income can also positively affect the presence of political sophistication (Neuman 1986,
Delli Carpini and Keeter 1996, Hendriks-Vettehen et al. 2004). Often, individuals who hold
higher positions must engage more with their political world in order to function well in their job
positions (Delli Carpini and Keeter 1996, Hendriks-Vettehen et al. 2004). Thus, self-interest can
raise political sophistication in this instance.
The results of the Kuklinski et al. (2000) study have suggested that people who have very
little political knowledge about a subject tend to demonstrate high confidence in their belief
about a particular issue. This study investigated perceptions about welfare programs and found
that people who generally had very little knowledge about the programs, but who had already
formed an opinion about them had very high confidence in their answers (Kuklinski et al. 2000).
Eveland and Hively (2009) investigate the relationship between political knowledge and
political discussion, network size, and the heterogeneity of the discussion participants. They find
that knowledge of candidate issue stances is significantly correlated with frequency of discussion
regardless of heterogeneity and network size. They also find that political participation is
22
significantly correlated with discussion frequency regardless of heterogeneity and with network
size, suggesting that formal network membership may be transitively correlated with political
knowledge (Eveland and Hively 2009).
Indeed, social orientations have been found to correlate positively with civic engagement.
Helliwell and Putnam (2004) found that higher life satisfaction is positively correlated with
participation in civic activities and volunteerism. One other study (Gil de Zuniga and Venezuela
2011) finds that both online and offline network size are positively correlated with civic
engagement and that weak-tie discussion (being able to access people and information via
discussion not normally available to an individual) helps develop political knowledge.
Political sophistication is, in essence, the accumulation and continued use of political
knowledge. This dissertation argues that increased social capital – discussed next in this chapter
– should both increase information flows and thus positively correlate with political
sophistication. Particular components of social capital can enhance the flow of information
between people and encourage the development of political cognition via political discourse,
conversation, and decision-making, for example. Furthermore, particular value types – discussed
later – create predispositions toward particular forms of social capital.
Social Capital
A significant portion of the social capital literature separates the phenomena into three
types of social capital. The first is bonding social capital which occurs if closed networks are
present and involves trust and reciprocity. Bonding social capital helps people “get by.” The
second type is bridging social capital, which normally occurs between groups and facilitates
resource and opportunities being transferred. Bridging social capital helps people “get ahead.”
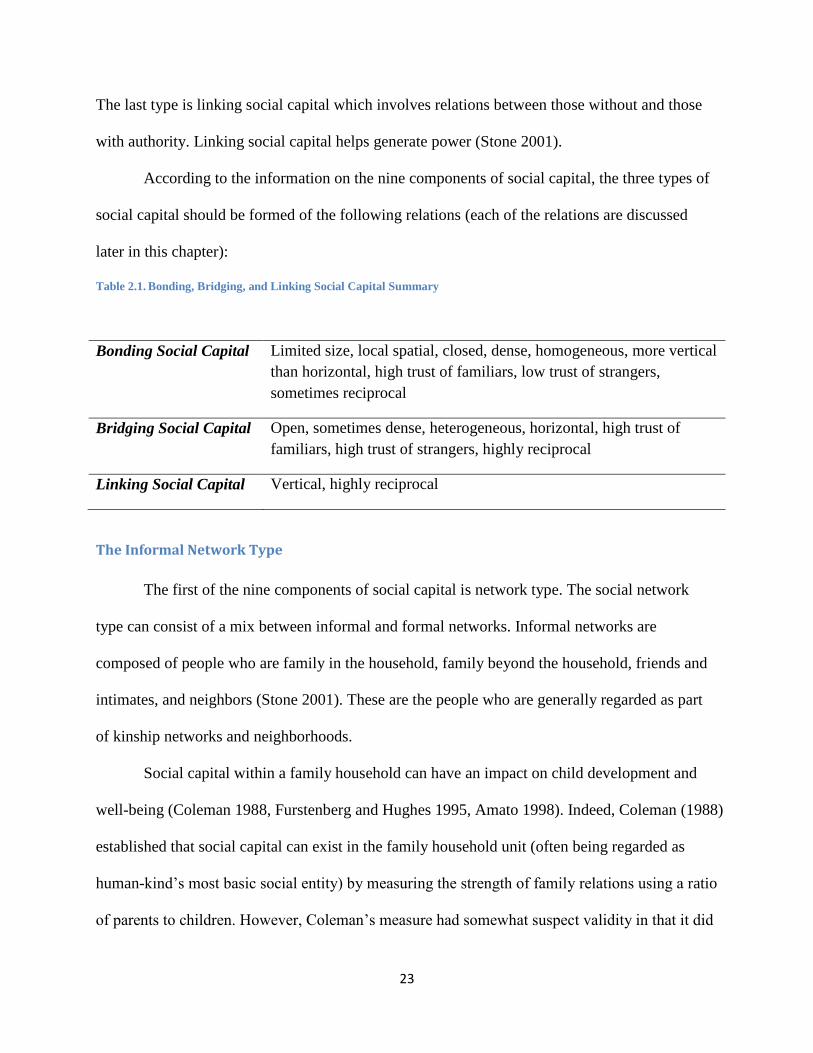
23
The last type is linking social capital which involves relations between those without and those
with authority. Linking social capital helps generate power (Stone 2001).
According to the information on the nine components of social capital, the three types of
social capital should be formed of the following relations (each of the relations are discussed
later in this chapter):
Table 2.1. Bonding, Bridging, and Linking Social Capital Summary
Bonding Social Capital Limited size, local spatial, closed, dense, homogeneous, more vertical
than horizontal, high trust of familiars, low trust of strangers,
sometimes reciprocal
Bridging Social Capital Open, sometimes dense, heterogeneous, horizontal, high trust of
familiars, high trust of strangers, highly reciprocal
Linking Social Capital Vertical, highly reciprocal
The Informal Network Type
The first of the nine components of social capital is network type. The social network
type can consist of a mix between informal and formal networks. Informal networks are
composed of people who are family in the household, family beyond the household, friends and
intimates, and neighbors (Stone 2001). These are the people who are generally regarded as part
of kinship networks and neighborhoods.
Social capital within a family household can have an impact on child development and
well-being (Coleman 1988, Furstenberg and Hughes 1995, Amato 1998). Indeed, Coleman (1988)
established that social capital can exist in the family household unit (often being regarded as
human-kind’s most basic social entity) by measuring the strength of family relations using a ratio
of parents to children. However, Coleman’s measure had somewhat suspect validity in that it did
24
not account for the quality of household relationships and saw the presence of more siblings as
having a negative effect on the social capital within the family household (Stone 2001).
Amato (1998) added to Coleman’s (1988) measure of social capital in the family
household by also considering parent-parent relationships. Amato used a measure that indicated
“marital discord” between parents and measured the quality of parent-child relations using
retrospective data about receiving help with homework, personal problems, etc (Amato 1998).
Amato’s focus was on relationship quality rather than quantity and did not measure child-child
relationships or other relationships that may exist within the family household unit (Stone 2001).
Furstenberg (1995) argues that the culture created by the parents in the family household
deserves the most attention in order to understand social capital within the family household.
Furthermore, relationships with significant members of the family outside the household walls
also deserve attention. The culture of the family is composed of phenomena including values,
habits, practices, rituals, and norms (Furstenberg and Hughes 1995).
Overall, networks composed of relationships of family and kin outside the normal family
household have received less attention in the literature than networks within the family
household (Stone 2001). Hofferth et al (1995) completed a study on the social capital between
different family households. They used a measure composed of transfers of time and money. The
following gives some examples of what measures were used in the study:
“Time stock: Suppose there were a serious emergency in your household. Is there a friend
or relative living nearby whom you could call on to spend a lot of time helping out? If
yes, would that be a relative?”
“Money stock: Suppose in an emergency you needed several hundred dollars more than
you had available or could borrow some from an institution. Would you ask either a
friend or a relative for it? If yes, is the person you would ask a relative?”
“Time investments: People sometimes have emergencies and need help from others –
either time or money. Let’s talk about time. In the last five years have you (or has anyone
living with you) spent a lot of time helping either a relative or friend in an emergency? If
yes, was the person you helped a relative of yours/anybody who lives there?”

25
“Money investments: In the last five years have you helped a friend or relative in an
emergency by giving or loaning them several hundred dollars or more? If yes, was the
person you helped a relative? (Hofferth et al 1995, p. 14; Stone 2001 p. 11)”
These measures are indeed ways of getting at relationships between members of the
family kinship group beyond the household; however, they do not give much detailed
information about the relationships in question. Measuring the details of the people in the
relationships may be best (Stone 2001).
Relationships with friends and neighbors also help compose important informal networks.
Putnam (1995) studied social networks and espoused the importance of neighborhood networks
in promoting social capital and measured networks of friends, neighbors, and acquaintances in
his analysis. Baum et al (2000) adds to Putnam’s (1995) study in that they measure networks of
friends in terms of informal, public space, and group activities. For example, Baum et al (2000)
ask if the respondent had been to a café or restaurant, a social club, the cinema or theatre, or a
party or dance on a at least a monthly basis within the past twelve months as a measure of
activity in public spaces. The measures found in Baum et al (2000) provide more precise
measures than those found in Putnam’s (1995) study (Stone 2001).
The Formal Network Type
Formal networks can include non-group based civic relations (such as good deeds or
individual community or political action), association/group based relations, work based, or
institutional groups. Association and group-based relations can include belonging to antenatal,
childcare, education, sport and leisure, music and arts, church, charity, voluntary, and self-help
organizations (Stone 2001). These organizations are often somewhat exclusive with the
exception of non-group based civic relations.

26
Non-group based civic relations have also been investigated by Baum et al (2000), who
asked about individual civic participation activities. For example, Baum et al (2000) asked
whether the respondents had signed a petition, contacted a local representative, written to the
council, contacted a local councilor, attended a protest meeting, written a letter to the editor of a
newspaper, or attended a council meeting in the past twelve months. However, non-group based
civic relations are not always necessarily political in nature. Other research instruments, such as
the UK National Survey of Voluntary Activity (1991) have asked about voluntary activity in the
community. Some of these questions ask whether the respondent has done any unpaid work in
the past twelve months in regard to activities such as visiting an elderly or sick person, looking
after a pet for someone, or babysitting or caring for children (Stone 2001).
When one thinks about formal networks, association and group-based relations are
probably the first to come to mind. Many studies collect information on formal networks by
asking questions about respondents’ membership in formally organized groups (Stone 2001).
Putnam (1995) did so, but was criticized for viewing membership in these types of organizations
in a nostalgic way, thus perhaps overestimating their importance (Pollitt 1999, Skocpol 1999).
Some examples of group-based relations include membership in political groups, civic groups,
traders’ groups, religious groups, and youth groups.
Work-based associations are also part of the formal network type. This type of
association is included even though it can facilitate the development of informal networks
involving friends and other formal networks such as group-based and non-group-based relations
(Stone 2001). Some studies tease out these effects by using surveys asking about these specific
relations in addition to other workplace relations (Onyx and Bullen 2000).

27
Institutions are also an important part of formal networks. These institutions include
government entities such as Congress, the Office of the President, and the justice system, along
with the police, military, and so on. Some studies get at institutional relations by asking
questions such as “In the last 12 months, have you or anyone in your family living her, ever
contacted a government official about some need or problem concerning the community as a
whole? (Papadakis 1998, p. 26; Stone 2001 p. 16)” Still, others ask about how much respondents
trust particular institutions (Kramer and Tyler 1996).
Network Size and Capacity
Particular characteristics of networks modify the existence of social capital. The first
characteristic is network size and capacity. Any type of network can be either limited or
extensive in size and capacity. This includes relations within the household or outside of the
household. Generally, those with large numbers of social ties will have a larger social capital
stock while those with a smaller number of social ties will have a smaller social capital stock,
depending of course on the quality of those particular relations (Stone 2001).
Some of the questions previously asked in the literature to define this characteristic
include:
“How many people did you talk to yesterday (Onyx and Bullen 2000, p. 113)?”
“Where do most of your family members and friends live [then a list of locations is
given] (Baum et al 1998)?”
“Which of the following fits your situation [I know most of the people in my
neighborhood, I know many of the people in my neighborhood, I know a few people in
my neighborhood but most are strangers, I do not know people in my neighborhood]
(Baum et al 1998)?”
28
“How would you go about looking for work if you need a job (Stewart-Weeks and
Richardson 1998)?”
“Where would you go if you were upset or ‘in trouble’ and needed personal help and
support (Stewart-Weeks and Richardson 1998)?”
The first three of the questions measure proximity, while the last two leave the question open-
ended and thus answers can be more detailed and are less likely to exclude important social ties.
A hybrid, matrix approach asks the following:
“For each name respondent provides, the following information is filled: name (first
name only, generated at the beginning) [and] Conservationist (neighborhood, relatives,
work, school, etc.). You turn to or who turns to you for baby sitting or child care (from
list). Do you turn to anyone n the list for help in times like these when you or your child
is sick? Does anyone ask you for this kind of help? Are there people on your list who you
turn to or who turn to you for advice about bringing up a young child – things like what
foods to buy or how to handle discipline problems or where to get good children’s
clothing? Are there any people on your list who lend you things or who you lend things
to like a car or a small amount of money? When things are really financially tight, who
on the list can you turn to for help? Does anyone come to you? When you are upset or
worried about other things, do you have anyone on your list who you can talk to? Are
there people on your list who you do things like sports with? Dancing parties, movies,
picnics and things like that (Cochran 1990, p. 315)?”
Local and Global Networks
The location of the network should also be of importance with regard to developing
social capital stock. The geographic scale of the network can range from the family household to

29
a large, global network. Studies that measure local network connectivity have asked questions
like “can you get help from friends when you need it,” “do you go outside your local community
to visit your family,” “do you feel part of the local geographic community where you work
(Onyx and Bullen 2000, p. 112-113),” and “length of time lived in this location (Stewart-Weeks
and Richardson 1998, p. 132).” These questions measure the extent to which the network is
located inside or outside the local area.
Open and Closed Networks
Network closure is another facet of social capital and is under-investigated in the
literature on social capital. Coleman (1988, 1990) defines network closure as networks in which
everyone knows one another. He states that network closure creates trustworthiness and
increases productive output (Coleman 1988). A typical example of a closed network is that of the
family. A family is likely to be a closed network because – normally – all members of the family
know one another. Of course, the question of whether a family exists as a closed network
becomes murkier as the family becomes more extended spread over a greater distance (Stone
2001).
Non-family networks prove more problematic to describe as either closed or open since
these networks can vary according to size and distance. For example, a formal, workplace
network is harder to define as closed because while everyone may work together in the same
physical location on most occasions, not everyone may know one another depending on the size
of the workforce in the workplace and the organizational culture, which may not allow an
intimate network to form. However, it is reasonable to assume that if a network is larger and less
geographically local, then it is less likely to be closed (Stone 2001).

30
Network Density
Another under-investigated component of social capital, network density, can be defined
as the extent to which network membership overlaps (Stone 2001). Coleman (1988) and
Gluckman (1967) distinguish between what is called simplex (sparse) and multiplex (dense)
relations within a network. Multiplex relations occur when people are linked in more than one
way. For example, two siblings may be part of the same family household, but they also may be
part of a sporting club, a political party, or some other network. This multiplex relationship
strengthens the bonds between those two siblings and allows the resources shared in one
relationship (as siblings) to be utilized in another.
Stewart-Weeks and Richardson (1998) measure network density with several questions,
including “are there people you know and have contact with that you meet in more than one
situation” and “can you think of any relationships or links you have made with people that have
gone beyond the initial reason you got to know them?” Another study by Krishna and Shrader
(1999) asks “overall, are the same people members of different groups or is there little overlap in
membership?”
Network Heterogeneity
Heterogeneous networks are networks composed of varying types of people according to
their respective characteristics, whether referring to racial, ideological, religious, or any other
sort of characteristics (Stone 2001). On the other hand, the most homogenous networks are
composed of people who are likeminded and similar in nearly every way. Families would tend to
be homogenous, especially when considering physical characteristics and personal background.
Although as the family ages, ideological differences may tend to emerge and make the same
family become more heterogeneous.

31
Increased heterogeneity in networks has been found to affect the trust of familiars and
strangers within networks and how social norms are shared within those networks (Putnam 1998,
Narayan 1999, Woolcock 2000). Nevertheless, the effect of heterogeneity on social capital is
more ambiguous. Some research has developed evidence that social capital stocks increase in the
presence of network heterogeneity (Grootaert 1998) while others have found that homogeneity is
better for the development of social capital stocks (Portney and Berry 1997, Sampson et al 1997).
Several studies have developed survey items to define a respondent’s level of network
heterogeneity. Krishna and Shrader (1999) include numerous questions that ask whether the
networks people belong to are mostly of the same extended family, religion, gender, political
viewpoint or party, occupation, age group, and level of education. Onyx and Bullen (2000)
attempt to gauge network heterogeneity by asking the question “if a stranger, someone different,
moves into your street, would they be accepted by the neighbors (Onyx and Bullen 2000, p.
114)?”
Network Horizontality
Network horizontality refers to how the leadership in a group is structured. The groups
can be any type of social network including family, friends, formal organizations, or in the work
place. Networks that are horizontally (democratically) structured allow decisions to be made by
all members. Networks that are vertically (hierarchically) structured only allow decisions to be
made from the top down. This can be exemplified in families where one or both parents are
typically the only true decision-makers in the group; this family would be considered a vertically
structured network. On the other hand, groups of friends may tend to be more horizontally
structured in that each person in the group has a part in the decision-making process (e.g., where
to go for dinner or where to go for the weekend).

32
Vertical relations have been found to be relevant when studying trust in authority while
horizontal relations have been found to be useful for the understanding of trust in civil society
(Latham 2000). The questions used in studies including measures on network horizontality
normally ask about decision-making processes inside the respective networks and some others
ask about rule enforcement in the networks. Putnam (1993) asks several questions about network
relations, including “who has influence and over what?” and “how do parties operate here?”
Krishna and Shrader (1999) also ask a few network relations questions, including “when there is
a decision to be made in the group, how does this usually come about?” Answers to the Krishna
and Shrader (1999) question were whether “the leader decides and informs the other group
members,” “the leader asks group members what they think and then decides,” “the group
members hold a discussion and decide together,” or “other; don’t know; not applicable.”
Quality of Social Relations: Norms
Norms are also very important components of social capital. Coleman (1988) defies the
norms within networks as follows:
“If A does something for B and trusts B to reciprocate in the future, this establishes an
expectation on the part of A and an obligation on the part of B. This obligation can be
conceived as a credit slip held by A for performance by B.”
Trust is one of the two major components of social capital. Trust is essentially the
“confident expectation of something; hope” as defined by the dictionary and is almost
completely encompassed by reciprocation – the act of returning a favor or a behavior with a
similar one. Much work has been done in economics concerning reciprocation and the
expectations that people place upon one another. The tit-for-tat (TFT) model of reciprocation
produced by Axelrod (1984) is the basis of the prevalent economic theory of reciprocation. The

33
TFT model can be used to adequately explain the expected relationships that values should have
on trust and why these relationships may occur; indeed, one of the value items in this study is
“reciprocation of favors” in the “security” value type. Furthermore, TFT can be used in
behavioral studies to help explain what occurs (Berg, Dickhaut, and McCabe 1995).
In sociology, trust is a necessary part of our human experience. Without trust, they say,
people would be in a state of paralysis; doing nothing because they have zero trust for others.
Thus, trust is an integral part of social capital and one can infer that without trust there would be
little or no political action or civic engagement (Dirks 1999; Good 2000). As explained in the tit-
for-tat model, people’s interactions with one another increase or diminish the level of trust those
people have for others. If a particular person has had their trust betrayed – in whatever relative or
subjective manner or magnitude they claim it to be – then they will be less likely to trust others
and thus less prone to civic engagement or simply maintaining healthy or long-lasting
relationships (Uslaner and Brown 2005).
Social capital and its formation seem to be defined in current literature by the extent to
which reciprocation occurs in social interactions between individuals or groups. A discussion on
how social capital is formed is crucial to understanding how value constructs may help determine
the extent of the formation of social capital. Indeed, social capital is formed based on the
decisions of these individuals or groups to either act cooperatively or selfishly. In the tit for tat
model, two individuals are considered where one of them provides benefits to the other in the
expectation of reciprocation. In this highly idealistic model, the second person then reciprocates
accordingly and this pattern continues indefinitely for both individuals. One person is allowed to
deviate from reciprocating (or not reciprocating) and the other person follows the lead by doing
the same. Though the tit for tat model is extremely simplistic, it does give us a basis for

34
developing more realistic models such as the one in this study (Axelrod 1984). These
interactions can be the basis for political discourse and the formation of political knowledge.
Coleman (1988) and the TFT model show that trust and reciprocity are closely related
concepts. However, the bulk of social capital studies have measured the outcomes of these two
norms rather than measuring the norms themselves (Stone 2001).
Norms of Trust
Trust is a major component of social capital and has received a great deal of attention in
the literature compared to the structural components of social capital. Trust has been found to
affect how well civil society functions along with a range of outcomes in democracy and civic
engagement (Putnam 1993, 1995, Uslaner 1999). The norm of trust encompasses three
conceptually different types of trust. The first type is trust of familiars (also called particularized
trust) (Uslaner 1999a). Trust of familiars involves how much trust exists within already
established networks such as the family unit or friendships. Next, generalized trust is trust
extended toward strangers, known hereafter in this paper as trust in strangers (Putnam 1998,
Dasgupta 1988, Uslaner 1999b, Stone 2001). Last, institutional trust is the trust one has in formal
institutions of governance. For example, the trust one has in the Congress or the court system to
perform a particular task would be considered institutional trust (Cox 1997, Stone 2001).
Since there are conceptual differences in the types of trust mentioned above, it is
necessary to measure each with different questions. Trust of familiars within the family remain
under-explored in comparison to trust of familiars outside the family (i.e., neighbors, friends, etc.)
(Stone 2001). Even more attention has been paid to civic trust in the literature (Stone 2001).

35
Trust of Familiars
Trust of familiars may apply to any social network type. In order to measure trust of
familiars, researchers have used questions that ask about social trust in neighborhoods as well as
questions using an economic perspective. Onyx and Bullen (2000) ask “if you were caring for a
child and needed to go out for a while, would you ask a neighbor for help?” This question tries to
ascertain whether the respondent trusts one of their neighbors enough to care for their child
without their supervision. Paldam and Svendsen (1999) ask the respondent to “consider the circle
of the m = 100 people (outside close family) you know best. How many in this circle would you
trust (or would trust you) with a personal loan amounting to n = 5% of your income?” Their
question – although a bit confusing for the layman to decipher – attempts to better quantify how
much a respondent trusts a familiar person to repay a loan. Using the 5% terminology, this
question also gives relative perspective to the respondent.
Trust of Strangers
Trust of strangers was investigated by Putnam (1995) who used the World Values Survey
(WVS) to argue that trust in the United States had declined from the year 1960 to 1993 (Stone
2001). The lone question Putnam used to arrive at this conclusion stated “generally speaking,
would you say that most people can be trusted, or that you can’t be too careful in dealing with
people (World Values Survey 1991)?” Indeed, that particular question has become the popular
way to measure social capital in many studies (Knack and Keefer 1997).
The Australian Community Survey (ACS) of 1997 through 1998 modified the WVS
question into four separate questions that attempted to more accurately pinpoint the kinds of
people who were or were not trusted (Hughes et al 1998, 2000, Stone 2001). Cox and Caldwell
(2000) questioned the usefulness of both the WVS and ACS measures, arguing that they

36
measured broad concepts, but not social capital in particular unless they are paired with other
social capital measures. Krishna and Shrader (1999) used questions that measured how much
people trust others in a particular geographic area such as a village, neighborhood, or an urban or
rural setting. Onyx and Bullen (2000) used questions that dealt with trust and safety to gauge
trust levels, including “do you feel safe walking down your street after dark?”
Civic and Institutional Trust
Institutional (civic) trust has experienced the most study over the years (Stone 2001).
Indeed, the WVS includes a question that asks how much confidence people had in particular
institutions, including the church, the armed forces, the education system, the legal system, the
press, trade unions, the police, federal parliament, state government, local government, the health
system, the airline system, the banking system, the telephone system, the postal system, national
companies, overseas companies, small business, and government agencies. The question has
been modified over the years to include relevant institutions of the time (World Values Survey).
Others have also used the same approach to measure institutional trust (Hogan and Owen 2000).
Questions using hypothetical situations have also been used, but less frequently (Onyx and
Bullen 1997, 2000).
Norms of Reciprocity
Reciprocity is generally regarded as the exchange of a favor with the expectation that the
favor will be returned at a later date. In essence, it is the realization of the axiom “if you scratch
my back, I’ll scratch yours.” For example, if person A gives person B a small loan and person B
gives the loan back at a later date, then the norm of reciprocity has been realized between
persons A and B. If the norm of reciprocity did not exist between persons A and B, then there
would be no expectation that person B would ever repay person A. Reciprocity within family and

37
kinship groups tends to be the strongest and is an ongoing process that can last for years or
decades, termed “familial obligation” (Finch and Mason 1993, Stone 2001). Networks in which
there are less regular and long-term exchanges when compared to families are expected to have
less reciprocity involved (Stone 2001).
Studies of reciprocation have attempted to specifically measure cultures of reciprocity,
reciprocal behavior, and benefits of network participation (Stone 2001). The first type of
measurements (those that measure cultures of reciprocity) measure the norm of reciprocity rather
than the outcomes associated with reciprocity. For example, Krishna and Shrader (1999) ask,
“people here look out mainly for the welfare of their own families and they are not much
concerned with village/neighborhood welfare. Do you agree or disagree with that statement?”
Other questions measure the willingness to help one another out (Onyx and Bullen 2000), how
often reciprocal exchanges occur (Kreuter et al 1999), and the expectation of future exchange
(Mangen and Westbrook 1988).
Simply by investigating these several components of social capital, one can begin to
expect that particular components may be affected by the more social-based values that people
hold. Imagine that one person lives in the type of community described in the introduction to this
dissertation; a community in Appalachia that is concerned with their own security as a result of
tremendous pressure from outside forces from individuals who are “not like them.” One could
then expect that this community (or at least the networks within the community) would be much
less heterogeneous, less trusting of strangers, more closed, and more household-based. One could
also argue that this expectation could also apply to other similar communities, which are
concerned with security such as urban neighborhoods with high rates of violence. Values then,
should affect the fabric, formation, and shape of social capital present within the community.
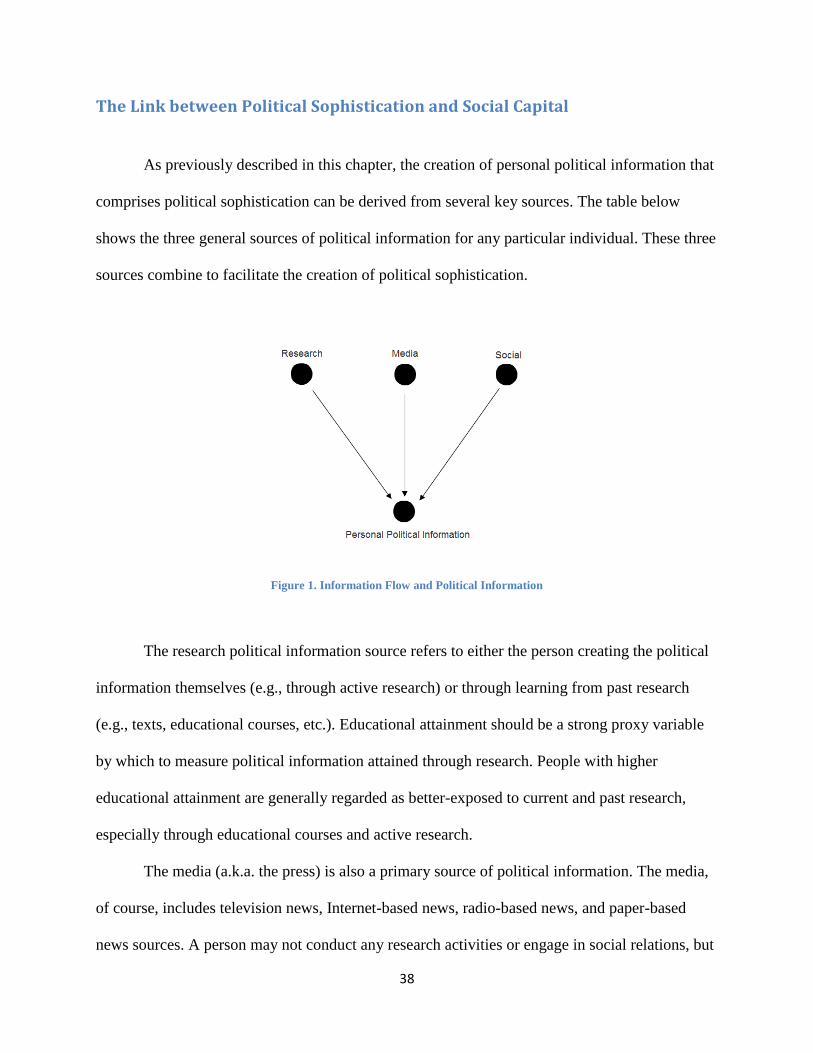
38
The Link between Political Sophistication and Social Capital
As previously described in this chapter, the creation of personal political information that
comprises political sophistication can be derived from several key sources. The table below
shows the three general sources of political information for any particular individual. These three
sources combine to facilitate the creation of political sophistication.
Figure 1. Information Flow and Political Information
The research political information source refers to either the person creating the political
information themselves (e.g., through active research) or through learning from past research
(e.g., texts, educational courses, etc.). Educational attainment should be a strong proxy variable
by which to measure political information attained through research. People with higher
educational attainment are generally regarded as better-exposed to current and past research,
especially through educational courses and active research.
The media (a.k.a. the press) is also a primary source of political information. The media,
of course, includes television news, Internet-based news, radio-based news, and paper-based
news sources. A person may not conduct any research activities or engage in social relations, but

39
as long as they expose themselves to media coverage, then they should attain a much better grasp
of political information than if they did not do so.
Social sources of information can be much more complex. Family members, friends,
colleagues, significant others, acquaintances, strangers, and organizations can be vital sources of
political information. A great example is that of “water cooler talk” whereby coworkers once
tended to gather around the water cooler and talk of political events as they refreshed themselves
during the work day. Social sources of information can be from informal and spontaneous
networks or from formal and organized networks.
Each of the key components of social capital above should play a vital role in affecting
the political information flows to and from social sources. Increased heterogeneity should
increase the information flows in social networks; this is especially so with personality
heterogeneity since different personalities can better account for opinion-related differences
(rather than using race or other demographic heterogeneity variables to account for the
differences). People who are different and who hold varying opinions are likely to also hold
different pieces of information. If someone is part of a highly heterogeneous network, then it is
more likely that the individual will receive a larger scope of political information.
Trust should also profoundly affect the information transfer between people in the social
sphere. Trust of strangers is likely to have a positive correlation with both political information
and heterogeneity. Greater trust generally allows interpersonal relationships to develop with
greater strength, thus increasing the depth of information transfers. People who trust one another
are much more likely to interact repeatedly than those who do not. Reciprocity should also have
the same effect as trust since increasing reciprocal transactions usually leads to more trust
forming between people in a network.

40
Horizontality should positively affect political information flows. In a strictly hierarchical
(vertical) social environment, all the information would come from the top down. This is not
ideal for information flow. Instead, a completely horizontal framework allows information to
flow freely from person to person rather than from one person to the remainder. This allows both
more information to be disseminated throughout the network and a chance for a greater quantity
of interactions to occur.
Similarly, networks that are not closed (or rather, that are open) will benefit information
flows between people. In a closed network, information flows generally stay within the network
and do not branch out. However, in open networks, new connections between people are formed
regularly. Hence, new information can enter and exit the open network much more freely than in
a closed one. Nevertheless, there is still the issue of relationship quality. Arguably, the quality of
the relationship and number of repeated interactions within a closed network may be greater than
that of an open network, complicating the possible effects of network closure.
Values
An investigation of the role of values is important both for an understanding of how
political attitudes are formed and how social capital may be the medium for the formation of
these attitudes, usually increasing the chance that political sophistication will develop. Schwartz
and Bilsky (1987) define values as “conceptions of the desirable that influence the way people
select action and evaluate events (Schwartz and Bilsky 1987, p. 550)” and Rokeach (1973)
defines a value as "an enduring belief that a specific mode of conduct or end-state of existence is
personally or socially preferable to an opposite or converse mode of conduct or end-state of
existence (Rokeach 1973, p. 5)." Stanley Feldman (1988) examines the role of three of these

41
values in structuring political beliefs and evaluations. The three beliefs are: support for equality
of opportunity, economic individualism, and the free enterprise system. Pertaining to this,
Converse (1964) wrote a seminal paper on mass belief systems in which he showed that most
political thinking done by the public cannot be described as ideological in that it is deductive
reasoning from a set of overarching principles about politics and the social world. Converse also
– rather than using a solely sociological perspective – employed a set of psychological
constraints. This psychological constraint is agreeable with much of the historical analysis
claiming that core values form the basis of American political behavior, including the historical
analysis written by Alexis de Tocqueville (Feldman 1988). Indeed, scholars have found that
values are more important factors than personality traits in identifying current and predicting
future political choices (Caprara et al. 2006).
Feldman (1988) seeks to understand how core beliefs are used to make political
evaluations concerning specific issues. Political evaluations may be made, at least in part, on the
basis of beliefs and values. Political sophistication factors in very little because of the existence
of a political culture or ethos that permeates all members of society. As previously stated, the
ethos is a “set of widely shared beliefs, values, and norms concerning the relationship of citizens
to their government and to one another in matters affecting public affairs (McClosky and Zaller
1984).” The public easily absorbs the important values through the ethos and its reinforcement-
socialization mechanism. There are many political values, but the three core beliefs studied by
Feldman have been directly relevant to the study of political attitudes. Devine (1972) argues that
these three constitute the Lockean liberal basis of American public opinion.
Feldman uses a LISREL study with a factor analysis to find the question that best
measures the three core values of interest. Individualism and equality are found to be significant
42
in determining support for many particular political attitudes. Free enterprise is not found to be
significant in the support for any issue attitudes (Feldman 1988). Other studies have found that
these highly important American values (individualism and egalitarianism) have affected support
for racial policies (Feldman and Huddy 2005; Kinder and Mendelberg 2000; Sears, Henry, and
Kosterman 2000).
Feldman (2003) also gives a great exposition of political attitudes, values, and ideology
in Sears, Huddy, and Jervis. During the average life of a person, he or she develops an almost
uncountable number of political attitudes. The values construct can be particularly valuable as
an approach to understanding how attitudes are organized. Many scholars argue that values are
the foundations on which attitudes are built. One positive trait of values is that they are much
fewer in number than attitudes. Unfortunately for political science, political scientists tend to
study the piecemeal effects of one or a few values while neglecting the entire structure of values,
which is something psychologists attempt to measure and define (Feldman 2003).
Values can also provide a very useful linkage between societal and individual levels of
the political process, just as social capital does by providing a medium of exchange.
Nevertheless, the operationalization and definition of values continues to be difficult. First,
scholars must be able to differentiate between values, attitudes, and beliefs. At the system level,
a value system is defined as "an enduring organization of beliefs concerning preferable modes of
conduct or end-states of existence along a continuum of relative importance (Rokeach 1973, p.
5)." So the distinction between attitudes and values is clear: attitudes are evaluations of specific
objects and values are much more general ideas used to make those evaluations. The concept of
value priorities – placing on value ahead of another in the preference ranking – is an appropriate
concept on which to build from. The ranking of values allows for trade-offs between conflicting

43
values and the placement of values into value systems (Feldman 2003).
The American ethos has been viewed as the set of values that are commonly shared by
the American public that have endured through time and have been particularly associated with
the "liberal tradition." In this liberal tradition, the European idea of aristocracy is notably absent
and the idea that each and every person is an entrepreneur in this non-aristocratic environment is
key to the American identity (McClosky and Zaller 1984; Hartz 2006).
Democracy and capitalism have been the two major components of both the liberal
tradition and the American ethos for centuries. These two belief systems have become the
umbrella concepts for many values that have developed through time. Nevertheless, even to this
day, the American nation has hardly (if ever) lived up to observing these two creeds to their
fullest extent, with most experiencing some type of cognitive dissonance in an effort to reconcile
the two often competing beliefs that democracy and capitalism embody. Even at that, one cannot
underestimate the importance of the democratic and capitalist belief systems on the direction and
political composition of the United States (McClosky and Zaller 1984; Hartz 2006).
Capitalist values tend to emphasize private ownership of the means of production, the
pursuit of profit by self-interested entrepreneurs, and the right to unlimited gain through
economic effort. Capitalism stresses competition and the determination of outcomes via laissez-
faire. The Protestant ethic which places an emphasis on hard work and achievement is also key
to the capitalist creed (McClosky and Zaller 1984; Bell 1996). Indeed, recent work suggests that
the Protestant ethic is alive and well in the United States. Campbell (2004) found that the social
networks (social capital) constructed by heavy church-goers fosters swift mobilization of
political activity when needed, although this activity cannot be maintained if the church-goers
choose to use their time for the church rather than their community as a whole. Economic

44
individualism – part of the capitalist creed – is the belief that people should get ahead on their
own through hard work; a core element in American values and beliefs. The Great Depression
and its response, the New Deal, helped temper this value later in American history (Feldman
1988).
The democratic creed rests on the notion that all people possess equal worth and have the
right to share in their own governance. The rulers are accountable to the public who gives them
the consent to rule. Rights such as the freedom of speech, press, assembly, and religion form the
basis for the consent and accountability process. Hence, equal rights and equal standing before
the law are of key importance to maintaining and advancing the democratic creed (McClosky
and Zaller 1984; Rawls 1999; Hartz 2006).
The capitalist and democratic creeds have evolved from a common root: the inequities of
Old World Europe. These two creeds are a response to the monarchism, mercantilism, and
tyranny that were the results and remnants of feudalism. Both creeds were meant to limit the
power of the rich and free the individual from the many circumstances that held him or her down
despite their abilities or talents. Despite the differences in the two concepts, they share common
values such as the commitment to freedom and individualism, limited government, equality
before the law, and rational ways of making decisions (McClosky and Zaller 1984). Economic
individualism was brought to colonial America via European settlers, many of which gained a
sense of this value from industrializing Britain (Feldman 1988).
Equality is one of the two most observed values of the democratic creed, the other being
liberty. The United States in the 18th century was considered radical in its idea that equality be
observed formally and legally (Rawls 1999). Despite major shortcomings throughout much of
its history, the United States was the first country to do away with aristocratic notions and

45
proclaim that formal equality is a right of all people, regardless of social status. The formal
equality embodied in the proclamation that "all men are created equal" was not a widely held
notion at the time. Even though equality is one of the most observed and honored in the
American democratic creed, it is still one of the most complex and elusive (McClosky and Zaller
1984; Hartz 2006).
A powerful set of values associated with the free enterprise system often conflicts with
the value of equality. For example, many Americans also believe that those who show greater
talent, possess skills that few have, and who work harder should be entitled to retain the wealth
they have established for themselves (Rawls 1999). This is only one example of how the moral
principle of equality is continuously in conflict with what occurs in the real world. As such,
equality is a broad and ambiguous concept that can be applied to multiple realms of existence
including the political, economic, moral, and legal realms (McClosky and Zaller 1984; Hartz
2006). The free enterprise system has always received strong support from Americans. Free
enterprise is the economic side of the individualistic social system, and support for the free
enterprise system is typically accompanied by distrust of big government. Popular distrust of big
business is also aimed at specific businesses rather than the free enterprise system as a whole
(Feldman 1988).
Considering the different types of equality, equality of opportunity is much more
prominent and part of the American ethos than equality of outcomes. Equality of opportunity is
the companion belief to the work ethic. This and the capitalist values do not easily coexist when
they are in their purest forms, but most Americans have resolved this by disavowing the value of
equality of outcomes (Feldman 1988). Equality came to mean parity in competition; that is, the
best competition ensues when everyone is equally able to enter into it. Equality of opportunity is
46
based in the individualist tradition (Devine 1972).
Some research has concluded that party identification is also an important consideration
(Goren 2005). Party identification can entail a sense of emotional attachment to the particular
political party and is rooted in the image they convey to the public. This is important to the
study of values and attitudes. If party identification is indeed more stable than political values
which are then more stable than political attitudes, then one could surmise that party
identification could be transitively more stable than political attitudes or even catalyze the
change and formation of specific attitudes. Indeed, this could be observed in the “real” world
during election years when party members who normally do not have much of an opinion on
particular issues begin to adamantly follow the core party stances that are communicated via the
media. Important to this study, Goren finds that party identification constrains equal opportunity
(Goren 2005).
Geography may also affect the presence and strength of core values (McClosky 1964).
The urban-rural landscape has often been at the center of attention in election years, where urban
places tend to be more ideologically aligned with Democratic notions and rural places tend to be
aligned with Republican ones. If Goren is correct, then this may be very important in the
formation of values and their alignment toward a rural-urban dichotomy.
Two of the most important contributors to the study of values have been Milton Rokeach
and Shalom Schwartz. Rokeach's largest contribution was to reveal the overall structure of value
systems. He argued that values do not exist in isolation and that attitudes and behaviors will
nearly always be the result of a combination of values, not just one. Rokeach also identified the
number of values and developed a measure for values that still resonates in today's literature.
However, his measurements were flawed in that they did not capture the entire range of values
47
(the structure) or the entire range of people who may hold those values. Nevertheless, Rokeach
had motivated most of the psychological study of values. Schwartz is becoming the new
standard in psychological research on values. Schwartz was interested in cross-cultural
differences in values and specified and tested a universal structure of values (Schwartz 1992,
1994). Using data from 20 countries, he developed a set of 10 motivational types of values.
Individual value items such as freedom and equality derive their meaning from the motivation
they represent. Schwartz's model contains 10 fundamental value types and 57 individual value
items (Schwartz 1992, 1994). Subjects were asked to rate each value item individually from -1
("opposed to my values") to 7 ("of supreme importance"). Correlations were derived for each
relationship, and the resulting conceptualization is less ad hoc than others because of the
motivation typology (Feldman 2003).
Schwartz argues empirically that each of the 57 value items do not act alone, but rather as
systems. People do not think exclusively about one value at a time, they think about many at
once, and this causes the arrangement of the items and the value types in a circular fashion (see
Appendix A). Schwartz also argues that his value system is truly universal in that it can be
applied across any individuals, cultures, or societies (Schwartz 2006). A table showing each
value type and the value items corresponding to each type follows (note that the values studied
by Feldman and colleagues can be found in the Schwartz values).

48
Figure 2. Schwartz Value Types and Corresponding Items
Many studies have found relationships between values and political attitudes. There is
clear evidence that these two concepts are related and that political sophistication may affect the
magnitude of value effects. Zaller shows that political sophistication increases strength of the
relationships between values and attitudes. However, Pollock, Lilie, and Vittes (1993) find that
sophistication may only matter depending on how "hard" or "easy" the issue is. Another factor
that may affect value-attitude relationships is the motivational basis of the attitude. Katz (1960)
proposed that there are four main attitude functions: utilitarian (maximizing benefits and
minimizing costs), ego-defensive (protecting one's ego), knowledge (deriving meaning and
understanding from one's environment), and value-expressive (expressing values and one's self-
concept).

49
The Link between Social Capital and Values
Let us consider a person who we know only one piece of information about; that he
adheres strongly to the notion of social justice (a value item in the universalism space). Let us
also consider that the following assumptions hold true generally as derived from the research
done by Schwartz (1992, 1994):
1. Value item relationships shown in previous research to be similar are likely to reoccur
throughout the entire human population
2. Value item relationships shown in previous research to be dissimilar are likewise likely to
reoccur throughout the entire human population
3. Value items can be ordered in terms of preferences
4. Value preferences are transitive
One can then derive several other pieces of information about this person’s value
structure based upon what we already know. First, that he is also very likely to adhere strongly to
proximal value items such as desiring a world at peace, inner harmony, protection of the
environment, equality, and being helpful. One can also assume that he would be much less likely
to adhere to distal values such as preserving his public image, desiring social recognition, or
desiring authority and wealth.
One can see that some of these values can be termed as social in nature. These are:
desiring a world at peace, equality, being helpful, preserving his public image, desiring social
recognition, and authority. One could then assume that this person would be more likely to
engage in social behavior that is in keeping with the proximal social values and less likely to
engage in social behavior that is not. This allows our exemplar to avoid cognitive dissonance and
the associated psychological pain associated with it.
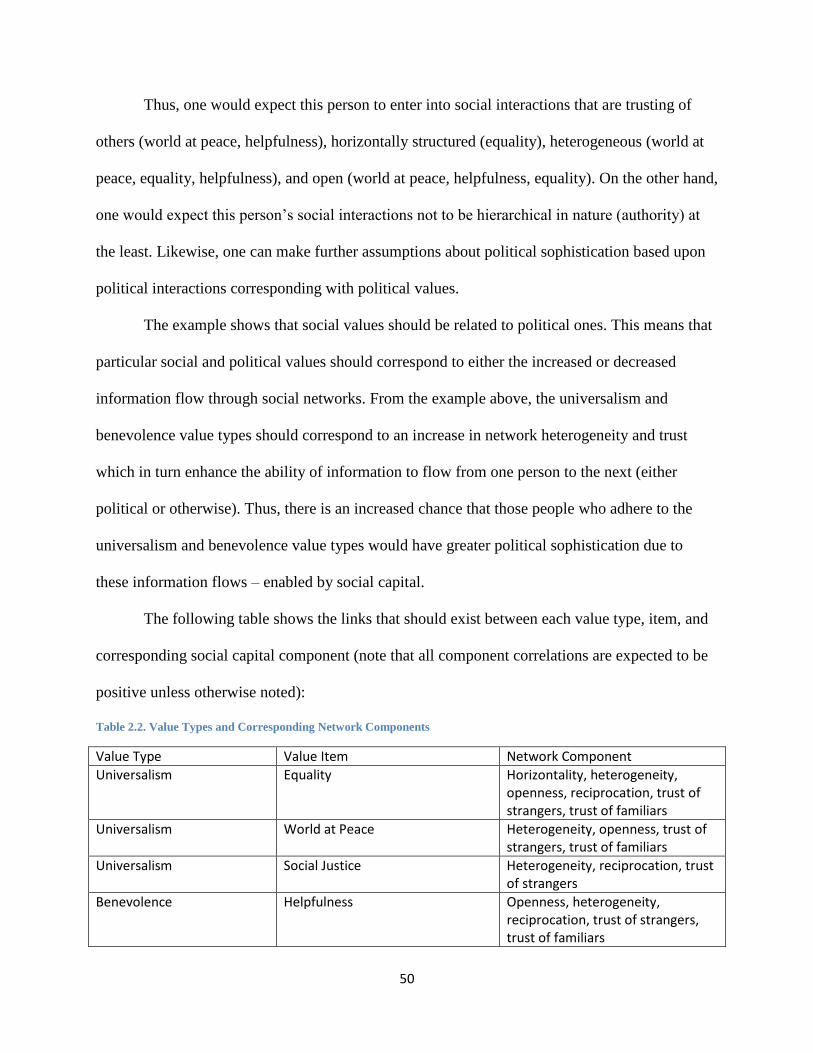
50
Thus, one would expect this person to enter into social interactions that are trusting of
others (world at peace, helpfulness), horizontally structured (equality), heterogeneous (world at
peace, equality, helpfulness), and open (world at peace, helpfulness, equality). On the other hand,
one would expect this person’s social interactions not to be hierarchical in nature (authority) at
the least. Likewise, one can make further assumptions about political sophistication based upon
political interactions corresponding with political values.
The example shows that social values should be related to political ones. This means that
particular social and political values should correspond to either the increased or decreased
information flow through social networks. From the example above, the universalism and
benevolence value types should correspond to an increase in network heterogeneity and trust
which in turn enhance the ability of information to flow from one person to the next (either
political or otherwise). Thus, there is an increased chance that those people who adhere to the
universalism and benevolence value types would have greater political sophistication due to
these information flows – enabled by social capital.
The following table shows the links that should exist between each value type, item, and
corresponding social capital component (note that all component correlations are expected to be
positive unless otherwise noted):
Table 2.2. Value Types and Corresponding Network Components
Value Type Value Item Network Component
Universalism Equality Horizontality, heterogeneity, openness, reciprocation, trust of strangers, trust of familiars
Universalism World at Peace Heterogeneity, openness, trust of strangers, trust of familiars
Universalism Social Justice Heterogeneity, reciprocation, trust of strangers
Benevolence Helpfulness Openness, heterogeneity, reciprocation, trust of strangers, trust of familiars

51
Benevolence Honest Heterogeneity, reciprocation, trust of strangers, trust of familiars
Benevolence Loyal Heterogeneity, reciprocation, trust of familiars
Benevolence True Friendship Trust of friends, reciprocation, friend capacity, informal friend networks, density, closure
Tradition Humble
Tradition Devout Closure
Tradition Moderate
Tradition Accepting Portion in Life Horizontality (-), closure, trust of familiars, spatial (-)
Conformity Obedient Horizontality (-), closure, trust of familiars, spatial (-)
Conformity Honor Parents Horizontality (-),spatial (-)
Conformity Politeness Reciprocation
Security Social Order Horizontality (-), spatial (-)
Security Family Security Trust of familiars, informal family networks, spatial (-)
Security Reciprocation of Favors Reciprocation,
Security Sense of Belonging Heterogeneity (-),
Power Preserving Public Image
Power Social Recognition Horizontality (-),
Power Authority Horizontality (-), reciprocation (-),
Power Wealth Horizontality (-), reciprocation (-),
Power Social Power Horizontality (-),
Achievement Ambitious Formal networks, spatial, informal networks (-)
Achievement Influential Horizontality (-), formal networks, informal networks (-)
Achievement Successful Reciprocation (-),
Hedonism Enjoying Life Horizontality, density (-), trust of strangers
Stimulation Varied Life Horizontality, density (-), trust of strangers
Stimulation Exciting Life Horizontality, density (-), trust of strangers
Stimulation Daring Spatial, density (-)
Self-Direction Independent Spatial
Self-Direction Curious Spatial
Self-Direction Freedom Openness, spatial, heterogeneity
Self-Direction Choosing Own Goals Spatial

52
Materialism and Post-Materialism
Materialism and post-materialism are ways in which aspects of culture can be understood.
Materialism is a value system that is related to the fulfillment of material needs such as food,
shelter, and security. Consumerist behavior can also be placed into the materialist predisposition
since it involves the satiation of the desire for material luxury.
Post-materialism is a concept developed by Ronald Inglehart (1977) encompassing the
desire to go beyond basic and luxury material needs. He argued that Western societies were
beginning to transition from an emphasis on material needs to post-material ones that
emphasized autonomy and self-expression. Inglehart (1977) derived much of his assumptions
from the work of Maslow (1987) and his development of the widely accepted hierarchy of
human needs. Maslow’s (1987) hierarchy (see Appendix B) explained a pattern that human
motivation navigates through. The hierarchy shows that people generally seek to fulfill
physiological, safety, love/belonging, and esteem needs before becoming self-actualized. The
needs prior to self-actualization do indeed correspond to both Inglehart’s (1977) definition of
post-materialism and Schwartz’s (1994) universalism, benevolence, and self-direction value
types.
Inglehart (1977) said that, according to the scarcity hypothesis, the materialist goals will
have greater priority (i.e., will be preferred) than the post-materialist goals such as morality,
creativity, and intellectual satisfaction when scarcity occurs. However, when scarcity is not
present, post-materialist goals can be fully realized. Although scarcity can introduce instability
into value preferences, research indicates that value preferences are extremely hard to change
after reaching adulthood (Rokeach 1968). Instead, adults can be arranged into “cohorts.” The
cohort with the least economic stability when they are children and adolescents tends to prefer

53
values that are materialist. This is called the socialization hypothesis. When cohorts experience
material affluence, they tend to prefer post-materialist values such as individual improvement,
personal freedom, citizen input, humanism, and environmentalism (Rokeach 1968); all of which
are located within the universalism, benevolence, and self-direction Schwartz value types.
The two major hypotheses presented in post-materialist studies (the scarcity and
socialization hypotheses) combine in such a way that as material affluence tends to grow over
generations, so do preferences for post-materialist values. The question then arises: Does the
growth in post-materialist values affect politics through the parallel rise in political knowledge
and sophistication? This study suggests that if post-materialist values are preferred, then the
people who prefer them will have attained greater political knowledge and sophistication than
those who prefer materialist values. This occurs because post-materialists prefer political
knowledge in contrast to materialists who would tend to use heuristics as a substitute simply
because materialists are prioritizing more basic needs over those of acquiring political
knowledge.
Summary
If the hypotheses examined in this dissertation are supported, then this may also give
political scientists a clue as to how political sophistication levels may persist over time.
According to the post-materialism notions (and the premises of this study), those people who
begin with values that predispose them to weak social networks should also continue to have
weak political sophistication (and correspondingly, political interest).
The following figure shows the expected relationships between values and social capital.
Please note that the abbreviations in each slice of the values circumplex are: Z for horizontality,
H for heterogeneity, O for openness, R for reciprocation, Ts for trust of strangers, Tf for trust of

54
familiars, Sp for spatial distance, INf for informal family network importance, IN for overall
informal network importance, FN for formal network importance, and D for density. The small
circles in each slice denote the net expected effects of that slice on social capital. Blue circles
indicate a net positive effect, green circles are net ambiguous or neutral, and red circles are net
negative effects.
Figure 3. Values and Expected Relationships
The following figure shows the overall directional effects posited in this dissertation:
Figure 4. Proposed Directional Effects

55
Thus, the self-direction, universalism, and benevolence value types should have a positive effect
on social capital characteristics, and these characteristics should lead to higher political
sophistication. The achievement, power, security, conformity, and tradition value types should
have a net negative effect on social network characteristics relating to information transfer and
thus should have a negative effect on political sophistication. The net effects of hedonism and
stimulation are ambiguous for both social capital and political sophistication.
In the next chapter, chapter 3, the survey instrument will be presented. The chief
motivation behind the development of the survey was the appropriate operationalization of each
of the primary sets of variables in this study. Recall that those are political sophistication, social
capital, and values.

56
Chapter 3: Methodology
Introduction
This chapter informs the reader of the methods being used in this dissertation for
examining the research questions and hypotheses and analyzing the data gathered. In doing so,
this dissertation seeks to improve our understanding of how values contribute to the development
of social capital and political sophistication.
Recall that particular values and value types are hypothesized to predispose individuals to
either positive or negative social network characteristics. In turn, these particular social network
characteristics are hypothesized to either positively or negatively affect information flow to the
individual from others or from the individual to others. The outcome of the affected information
flow is either higher or lower political sophistication. For example, a person with low
information flow due to negative, restricting network characteristics should be less likely to be
exposed to and to think about political information than those who have higher information flows.
This chapter explains the development of the measurement instrument and the subsequent
analyses. A survey was used as the primary measurement instrument. The survey included four
Sections (or batteries) consisting of varying numbers of questions that were intended to measure
specific concepts. The first survey battery measures social capital components and consists of
fourteen questions. The second survey battery measures the ten Schwartz value types and
consists of ten questions. The third battery measures political qualities of the participants and
consists of fourteen questions. The fourth and final survey battery measures demographics and is
composed of ten questions. In total, the survey contains forty-eight questions.
57
After gathering the data, factor analysis, correlation analysis, and regression analysis
were performed on the measures from the survey instrument. Since the survey contained many
multi-part questions and many of the questions attempt to measure the same concepts, factor
analysis was used to show that the measures were statistically valid in accounting for the
intended effects.
Variables were then produced based upon the original questions and the factor
analyses so that they are also theoretically-driven and correlation analyses were used to show
that the hypothesized relationships were statistically valid between the several concepts. Three
separate correlation analyses were performed. The first correlation analysis focused on the
possible relationships between the value types and the social capital components. The second
correlation analysis focused on the possible relationships between the value types and political
sophistication, and the third correlation analysis focused on the possible relationships between
the social capital components and political sophistication.
Finally, regression analyses were performed on each of the important relationships to find
whether the independent variables had a significant effect on the dependent variables, and in
order to build a possible predictive model for political sophistication. The first group of
regression models focused on the expected relationships between the value type (independent)
variables and the political sophistication (dependent) variables. The second group of regressions
focused on the expected relationships between the social capital (independent) variables and the
political sophistication (dependent) variables.

58
The Survey Instrument
The Social Capital Battery
The first battery of questions on the survey includes fourteen questions measuring social
capital variables. The first substantive question on the survey is:
Table 3.1. Survey Question 1
Question 1 - For each of the following, indicate how important it is in your life:
Not at all important Not very important Rather important Very important
Family ○ ○ ○ ○
Friends ○ ○ ○ ○
Significant Other ○ ○ ○ ○
Neighbors ○ ○ ○ ○
This question measures the importance of particular informal networks for each
individual. Informal networks encompass any relationship that is not formally recognized, such
as membership in an organization or group. Informal networks are typically kin-related (in the
case of family or a significant other) or based upon exposure or proximity (in the case of
neighbors and friends). If a respondent indicates that family is “very important,” then that
network will receive a high preference ranking for that individual. Not at all important was coded
as a 1, not very important as a 2, rather important as a 3, and very important as a 4. As such, a
higher value represents greater importance placed upon that type of informal network. It is
expected that family will be most important for people who adhere to the security, conformity,
and tradition value types and not at all important for people who adhere to the hedonism and
stimulation value types. Each row in the table above corresponds to a variable in the informal
networks construct.

59
Table 3.2. Survey Question 2
Question 2 – The following is a list of voluntary organizations. For each one, please indicate whether
you are an active member, an inactive member, or not a member of that type of organization:
Don’t belong Inactive member Active member
Church of religious org. ○ ○ ○
Non-religious humanitarian or charitable org. ○ ○ ○
Religious humanitarian or charitable org. ○ ○ ○
Sport or recreational org. ○ ○ ○
Art, music, or educational org. ○ ○ ○
Labor union ○ ○ ○
Political party ○ ○ ○
Environmental org. ○ ○ ○
Professional association ○ ○ ○
Consumer org. ○ ○ ○
Question 2 above measures the activity of each respondent according to what type of
formal network they belong to. The respondents could either not belong to the organization or be
an inactive or active member. Not belonging was coded as a 1, being inactive coded as a 2, and
being active coded as a 3 so that a higher value corresponds to greater activity in that type of
formal network. Each row in the response table above corresponds to a variable within the
formal networks construct.
Table 3.3. Survey Question 3
Question 3 – The following is a list of situations and things you may need or need to do, please
indicate who you usually rely upon to help you with those particular situations (do not answer if the
situation does not apply to you):
A friend A relative Significant A neighbor An organization No one

60
Other
Child care ○ ○ ○ ○ ○ ○
You are sick ○ ○ ○ ○ ○ ○
Advice ○ ○ ○ ○ ○ ○
When you need
to borrow
something
○ ○ ○ ○ ○ ○
Money ○ ○ ○ ○ ○ ○
Worrying ○ ○ ○ ○ ○ ○
Personal events ○ ○ ○ ○ ○ ○
Question 3 measured the size and capacity of the social networks that people are involved
in. Responses were coded such that each column represents one size and capacity variable. For
example, the first size and capacity variable was CapFri (Capacity of Friend Network). If a
respondent answered that a friend was relied upon in 2 of the situations, then the variable CapFri
would equal the value 2. The same summation was used for the other columns to create variables
CapFam (Capacity of Family Network), CapSig (Capacity of Significant Other Network),
CapNei (Capacity of Neighbor Network), CapOrg (Capacity of Organizational Networks), and
CapNo (Negative Network Capacity).
Table 3.4. Survey Question 4
Question 4 – How far away does most of your family live in comparison to where you live if you were
to drive a car to get there?
○ Within 30 minutes
○ Within 1 hour
○ Within 2 hours
○ Within 5 hours

61
○ Greater than 5 hours
Question 4 measures the spatial dimension of respondent’s family network and represents
one variable in the analysis. Within 30 minutes was coded as 1, within 1 hour as 2, within 2
hours as 3, within 5 hours as 4, and greater than 5 hours as 5.
Table 3.5. Survey Question 5
Question 5 – Which one of the following would best describe your network of friends?
○ A circle in which all friends interact with each other as well as with you
○ A wheel with spokes in which each friend is somewhat separate from the others and is primarily
connected through you as a hub
○ Somewhere in between – some friends interact while others are separate
Question 5 measures how closed a respondent’s friendship network is. The first option
corresponds to complete network closure, the second option with complete openness, and the
final option with equilibrium somewhere in between. Network closure should negatively affect
political sophistication since information flows from a smaller number of sources in those
networks.
Table 3.6. Survey Question 6
Question 6 – On a scale of 1 – 10, are the same people you are in contact with in Question 6 members
of different groups or is there a lot of overlap in membership?
1 – No overlap 2 3 4 5 6 7 8 9 10 – Complete overlap
○ ○ ○ ○ ○ ○ ○ ○ ○ ○
Question 6 measures the density of the respondent’s friendship networks. A response

62
indicating a greater number value indicates greater overlap in network membership (i.e., greater
network density). Greater network density is expected to increase political sophistication.
Table 3.7. Survey Question 7
Question 7 – Think about the people you consider to be friends, your neighbors, children, siblings,
other relatives, and good acquaintances. Would you say that this entire group of people is very
diverse according to each of the following characteristics, not diverse at all, or you don’t know?
Don’t know None at all Not very much Quite a lot A great deal
Race ○ ○ ○ ○ ○
Religions ○ ○ ○ ○ ○
Political Affiliation ○ ○ ○ ○ ○
Income Level ○ ○ ○ ○ ○
Personality ○ ○ ○ ○ ○
Occupation ○ ○ ○ ○ ○
Question 7 measures the heterogeneity of the respondent’s networks. Greater
heterogeneity is present if a person responds “a great deal.” Don’t know was coded as missing
data, none at all as 1, not very much as 2, quite a lot as 3, and a great deal as 4. Each row
corresponds to a heterogeneity variable in the analysis; heter1a is racial heterogeneity, heter2a is
religious heterogeneity, heter3a is political heterogeneity, heter4a is income heterogeneity,
heter5a is personality heterogeneity, and heter6a is occupation heterogeneity. Greater
heterogeneity is expected to contribute positively to greater political sophistication.
Table 3.8. Survey Question 8
Question 8 – Think about a social group you are often part of. On a scale of 1 to 10, 10 being the
strongest, how strongly do you feel that everyone has a say in what to do when you are part of that
group?
1 – Not at all 2 3 4 5 6 7 8 9 10 – Always
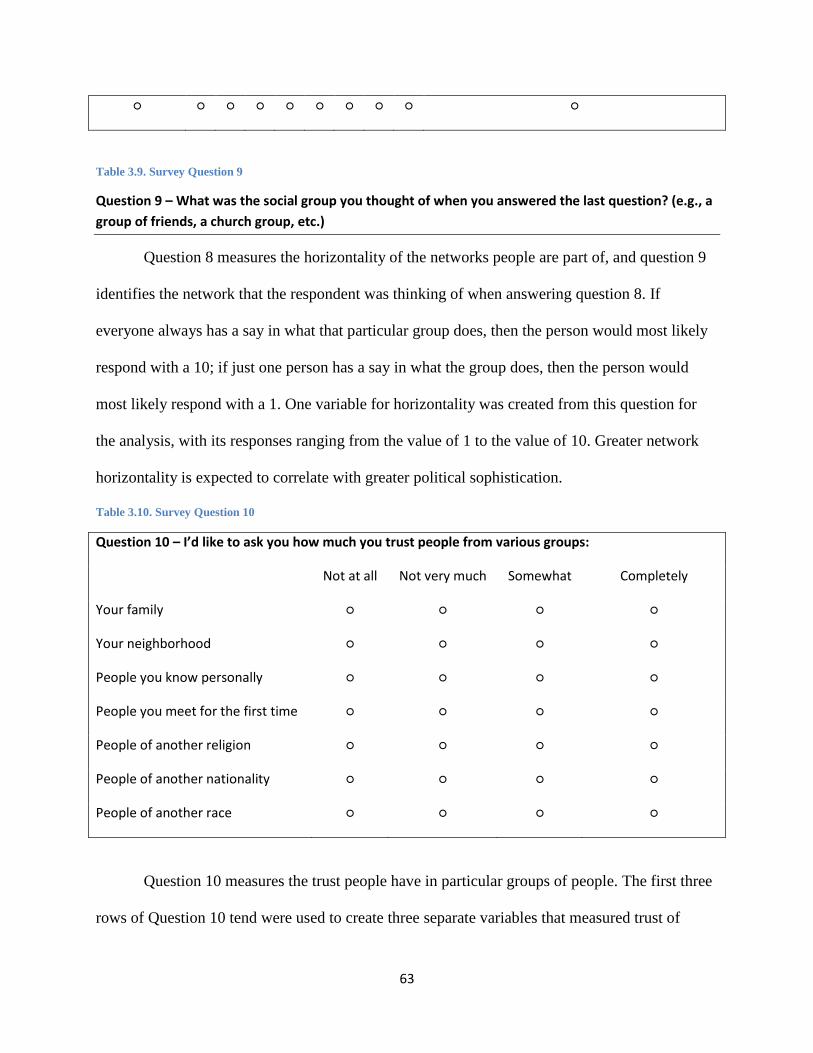
63
○ ○ ○ ○ ○ ○ ○ ○ ○ ○
Table 3.9. Survey Question 9
Question 9 – What was the social group you thought of when you answered the last question? (e.g., a
group of friends, a church group, etc.)
Question 8 measures the horizontality of the networks people are part of, and question 9
identifies the network that the respondent was thinking of when answering question 8. If
everyone always has a say in what that particular group does, then the person would most likely
respond with a 10; if just one person has a say in what the group does, then the person would
most likely respond with a 1. One variable for horizontality was created from this question for
the analysis, with its responses ranging from the value of 1 to the value of 10. Greater network
horizontality is expected to correlate with greater political sophistication.
Table 3.10. Survey Question 10
Question 10 – I’d like to ask you how much you trust people from various groups:
Not at all Not very much Somewhat Completely
Your family ○ ○ ○ ○
Your neighborhood ○ ○ ○ ○
People you know personally ○ ○ ○ ○
People you meet for the first time ○ ○ ○ ○
People of another religion ○ ○ ○ ○
People of another nationality ○ ○ ○ ○
People of another race ○ ○ ○ ○
Question 10 measures the trust people have in particular groups of people. The first three
rows of Question 10 tend were used to create three separate variables that measured trust of

64
familiars (people who are already known by the respondent). The last four rows of question 10
were used to create four more variables that measure trust of strangers (people generally not
already known by the respondent). All 7 variables were coded as 1 for not at all, 2 for not very
much, 3 for somewhat, and 4 for completely. Trust of familiars is expected to correlate positively
with the universal, benevolence, tradition, conformity, and security value types while trust of
strangers is expected to correlate to the self-direction, universalism, and benevolence value types.
Increased trust in either familiars or strangers is expected to enhance political sophistication due
to enhanced information flows stemming from the trusting relationships.
Table 3.11. Survey Question 11
Question 11 – The following is a list of organizations. For each one, could you tell me how much
confidence you have in them?
None at all Not very much Quite a lot A great deal
Religious leaders ○ ○ ○ ○
The armed forces ○ ○ ○ ○
The press ○ ○ ○ ○
Television ○ ○ ○ ○
Labor unions ○ ○ ○ ○
The police ○ ○ ○ ○
The courts ○ ○ ○ ○
The President ○ ○ ○ ○
Political parties ○ ○ ○ ○
Congress ○ ○ ○ ○
Government agencies ○ ○ ○ ○
Major companies ○ ○ ○ ○
Environmental orgs. ○ ○ ○ ○

65
Women’s orgs. ○ ○ ○ ○
Charitable orgs. ○ ○ ○ ○
The United Nations ○ ○ ○ ○
Question 11 measures civic or institutional trust. Each row is represented by one variable.
All 16 variables were coded 1 for none at all, 2 for not very much, 3 for quite a lot, and 4 for a
great deal. Expectations are that greater trust in government entities will decrease political
sophistication due to the increased deference arising from such an attitude. If people trust the
government more, they are more likely to defer decision making to those entities that decrease
the public’s desire for political information.
Table 3.12. Survey Question 12
Question 12 – On a scale of 1 to 10, 10 being the most often, how often do you help people who
help you?
1 – Not at all 2 3 4 5 6 7 8 9 10 – Always
○ ○ ○ ○ ○ ○ ○ ○ ○ ○
Question 12 measures the respondent’s adherence to the norm of reciprocation. If a
person selected a value of 10, then that means that they always reciprocate, whereas if they
selected a value of 1, then they never reciprocate. Reciprocation should increase political
sophistication since trust can be built through reciprocation. Reciprocation should also correlate
positively with the universalism, benevolence, and security value types.
Table 3.13. Survey Question 13
Question 13 – Do you have and use a social networking account (Facebook, Myspace, etc.)?
○ Yes
○ No
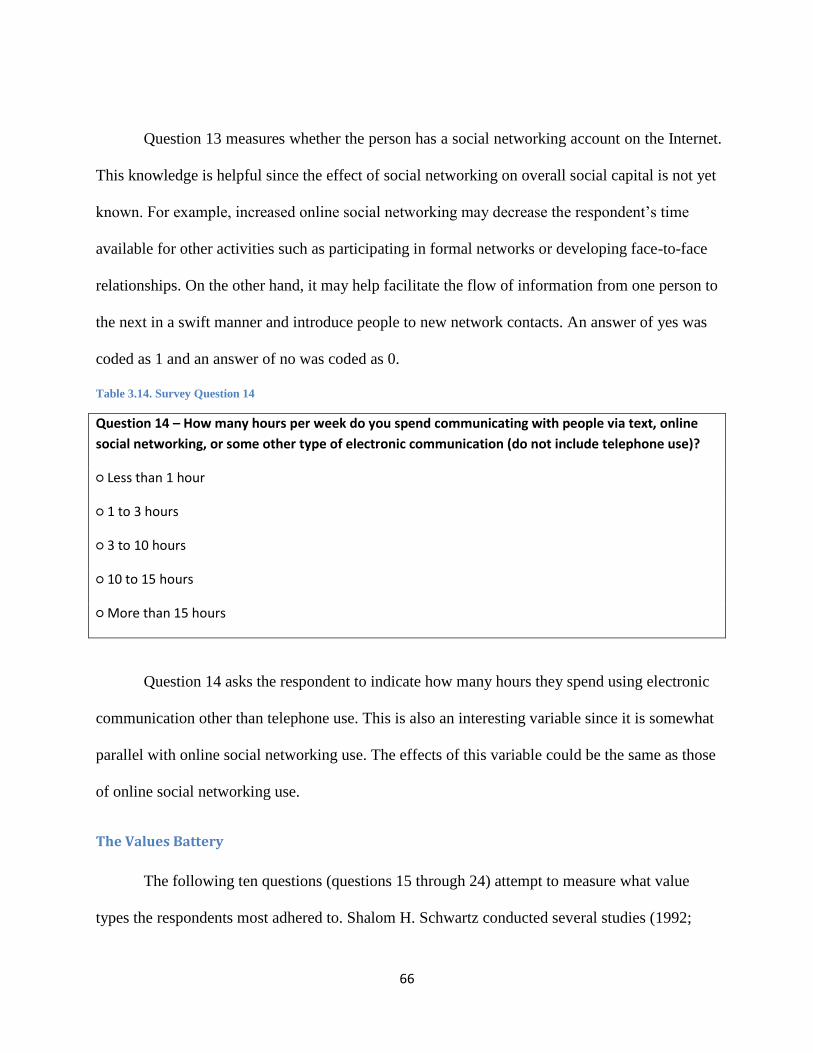
66
Question 13 measures whether the person has a social networking account on the Internet.
This knowledge is helpful since the effect of social networking on overall social capital is not yet
known. For example, increased online social networking may decrease the respondent’s time
available for other activities such as participating in formal networks or developing face-to-face
relationships. On the other hand, it may help facilitate the flow of information from one person to
the next in a swift manner and introduce people to new network contacts. An answer of yes was
coded as 1 and an answer of no was coded as 0.
Table 3.14. Survey Question 14
Question 14 – How many hours per week do you spend communicating with people via text, online
social networking, or some other type of electronic communication (do not include telephone use)?
○ Less than 1 hour
○ 1 to 3 hours
○ 3 to 10 hours
○ 10 to 15 hours
○ More than 15 hours
Question 14 asks the respondent to indicate how many hours they spend using electronic
communication other than telephone use. This is also an interesting variable since it is somewhat
parallel with online social networking use. The effects of this variable could be the same as those
of online social networking use.
The Values Battery
The following ten questions (questions 15 through 24) attempt to measure what value
types the respondents most adhered to. Shalom H. Schwartz conducted several studies (1992;

67
1994) that found the best way to measure these value types was on a Likert scale of -1 to 7. The
negative one was found to convey complete disagreement more often than simply using zero. All
ten questions were re-coded so that -1 became 1 and so on until 7 became 9. All items were
transferred from the Schwartz Value Survey and the World Values Survey to the survey used in
this dissertation exactly as they were stated in those two previous surveys in order to be sure that
the same concepts are being measured.
The first question, question 15, measures adherence to the self-direction value type. This
value type contains the freedom, independence, curiosity, creativity, choosing own goals, privacy,
and self-respect value items. Self-direction is adjacent to stimulation and universalism in
Schwartz’s value system and should thus be positively correlated with those value types. This
value type is also located opposite the conformity and tradition value types; hence, self-direction
should be negatively correlated with those two value types.
Question 16 measures the power value type. This value type contains the social
recognition, wealth, authority, preserving my public image, and social power value items. Power
is adjacent to achievement and security and should be positively correlated with them, and is
opposite of universalism, with which it should have a negative relationship.
Question 17 measures the security value type. This value type contains the health, family
security, social order, cleanliness, reciprocation of favors, national security, and sense of
belonging value items. Security is adjacent to power, conformity and tradition and should be
positively correlated with them, and is opposite self-direction and stimulation with which it
should have a negative relationship.
Question 18 measures the hedonism value type. This value type contains the pleasure,
enjoying life, and self-indulgence value items. Hedonism is adjacent to stimulation and
68
achievement and should be positively correlated with them, while it is opposite benevolence,
conformity, and tradition with which it should have a negative relationship.
Question 19 measures the benevolence value type. This value type contains the
responsible, loyal, meaning in life, true friendship, mature love, helpful, a spiritual life, forgiving,
and honesty value items. Benevolence is adjacent to conformity, tradition, and universalism and
should be positively correlated with those value types, while it is opposite from stimulation and
hedonism with which it should have a negative relationship.
Question 20 measures the achievement value type. This value type contains the
influential, successful, ambitious, capable, and intelligent value items. Achievement is adjacent
to power and hedonism and should be positively correlated with those two value types, while it is
opposite from the universalism and benevolence value types with which it should have a
negative relationship.
Question 21 measures the stimulation value type. This value type contains the daring,
variation in life, and excitement in life value items. Stimulation is adjacent to self-direction and
hedonism and should be positively correlated with those two value types, while it is opposite
from conformity, tradition, and security which it should have a negative relationship.
Question 22 measures the conformity value type. This value type contains the self-
discipline, politeness, honoring of elders, and obedient value items. Conformity is adjacent to
tradition, benevolence, and security and should be positively correlated with these three value
types. Conformity is opposite from stimulation and self-direction and thus should have a
negative relationship with those two variables.
Question 23 measures the universalism value type. This value type contains the
broadminded, unity with nature, a world of beauty, a world at peace, wisdom, equality,

69
protecting the environment, inner harmony, and social justice value items. Universalism is
adjacent to the self-direction and benevolence value types and should be positively correlated
with them. Universalism is opposite the achievement and power value types and should thus be
negatively correlated with those two value types.
Question 24 measures the tradition value type. This value type contains the respect for
tradition, humble, detachment, devout, moderate, and accepting my portion in life value items.
Tradition is adjacent to security, conformity, and benevolence with which it should be positively
correlated. However, tradition is opposite the stimulation and self-direction value types and thus
should be negatively correlated with them.
Table 3.15. Survey Questions 15 through 24
Question 15 – It is important to think up new ideas and be creative; to do things one’s own way.
-1: Strongly Disagree 0 1 2 3 4 5 6 7: Strongly Agree
○ ○ ○ ○ ○ ○ ○ ○ ○
Question 16 – It is important to be rich; to have a lot of money and expensive things.
-1: Strongly Disagree 0 1 2 3 4 5 6 7: Strongly Agree
○ ○ ○ ○ ○ ○ ○ ○ ○
Question 17 – Living in secure surroundings is important; to avoid anything that might be dangerous.
-1: Strongly Disagree 0 1 2 3 4 5 6 7: Strongly Agree
○ ○ ○ ○ ○ ○ ○ ○ ○
Question 18 – It is important to have a good time; to “spoil” oneself.
-1: Strongly Disagree 0 1 2 3 4 5 6 7: Strongly Agree
○ ○ ○ ○ ○ ○ ○ ○ ○
Question 19 – It is important to help the people nearby; to care for their well-being.
-1: Strongly Disagree 0 1 2 3 4 5 6 7: Strongly Agree
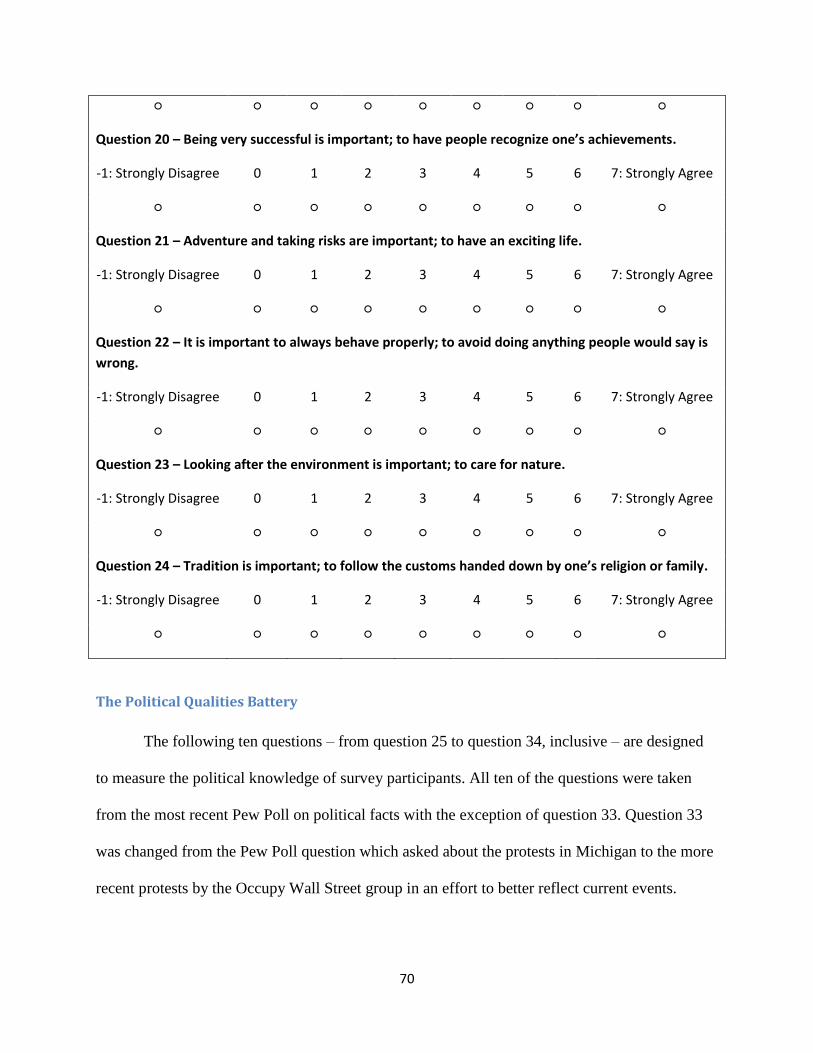
70
○ ○ ○ ○ ○ ○ ○ ○ ○
Question 20 – Being very successful is important; to have people recognize one’s achievements.
-1: Strongly Disagree 0 1 2 3 4 5 6 7: Strongly Agree
○ ○ ○ ○ ○ ○ ○ ○ ○
Question 21 – Adventure and taking risks are important; to have an exciting life.
-1: Strongly Disagree 0 1 2 3 4 5 6 7: Strongly Agree
○ ○ ○ ○ ○ ○ ○ ○ ○
Question 22 – It is important to always behave properly; to avoid doing anything people would say is
wrong.
-1: Strongly Disagree 0 1 2 3 4 5 6 7: Strongly Agree
○ ○ ○ ○ ○ ○ ○ ○ ○
Question 23 – Looking after the environment is important; to care for nature.
-1: Strongly Disagree 0 1 2 3 4 5 6 7: Strongly Agree
○ ○ ○ ○ ○ ○ ○ ○ ○
Question 24 – Tradition is important; to follow the customs handed down by one’s religion or family.
-1: Strongly Disagree 0 1 2 3 4 5 6 7: Strongly Agree
○ ○ ○ ○ ○ ○ ○ ○ ○
The Political Qualities Battery
The following ten questions – from question 25 to question 34, inclusive – are designed
to measure the political knowledge of survey participants. All ten of the questions were taken
from the most recent Pew Poll on political facts with the exception of question 33. Question 33
was changed from the Pew Poll question which asked about the protests in Michigan to the more
recent protests by the Occupy Wall Street group in an effort to better reflect current events.

71
These questions were coded so that if a question was answered incorrectly, the
respondent received a value of zero for that particular question. The same was true if the
respondent answered that they didn’t know the answer. The inclusion of a “don’t know”
response for these questions mostly eliminates the random answers produced by guessing;
instead of being forced to guess an answer, respondents can simply answer “don’t know.” Any
correct answers were coded as a one. These ten questions were included to help measure the
concept of political sophistication.
Table 3.16. Survey Questions 25 through 34
Question 25 – Bashar al-Assad is the leader of which of these countries?
○ Syria
○ Egypt
○ Saudi Arabia
○ China
○ Don’t know
Question 26 – Who is the current speaker of the U.S. House of Representatives?
○ Mitch McConnell
○ Newt Gingrich
○ John Boehner
○ Nancy Pelosi
○ Don’t know
Question 27 – The Obama administration is proposing revisions to the “No Child Left Behind” Act.
That legislation deals with which of these issues?
○ Transportation
○ Education
○ Adoption

72
○ Nutrition
○ Don’t know
Question 28 – Is the national unemployment rate as reported by the government currently closer to:
○ 5%
○ 9%
○ 15%
○ 21%
○ Don’t know
Question 29 – On which of these activities does the U.S. government currently spend the most
money?
○ Education
○ Medicare
○ Interest on the national debt
○ Scientific research
○ Don’t know
Question 30 – According t the U.S. Centers for Disease Control, what percentage of Americans are
obese?
○ 5%
○ 10%
○ 25%
○ 50%
○ Don’t know
Question 31 – In the U.S. Congress, Republicans have a majority in:
○ The House of Representatives only
○ The Senate only
○ Both the House and Senate

73
○ Neither the House nor the Senate
○ Don’t know
Question 32 – Is Hilary Clinton:
○ Secretary of State
○ A senator
○ A governor
○ An ambassador
○ Don’t know
Question 33 – What issue was the main focus of recent protests by the Occupy Wall Street group?
○ Same-sex marriage
○ Social and economic inequality
○ Union rights for public employees
○ Agriculture subsidies
○ Don’t know
Question 34 – Which source of energy provides the most electricity in the U.S.?
○ Hydroelectric
○ Nuclear
○ Coal
○ Wind
○ Don’t know
Questions 35 and 36 were included on the survey to measure the respondents’ ideological
leanings. Question 35 measures fiscal liberalism on a 10-point, self-scored Likert scale while
question 36 measures its counterpart – social liberalism – on the same scale. As mentioned in the
literature review for political sophistication, being able to self-identify as especially liberal or
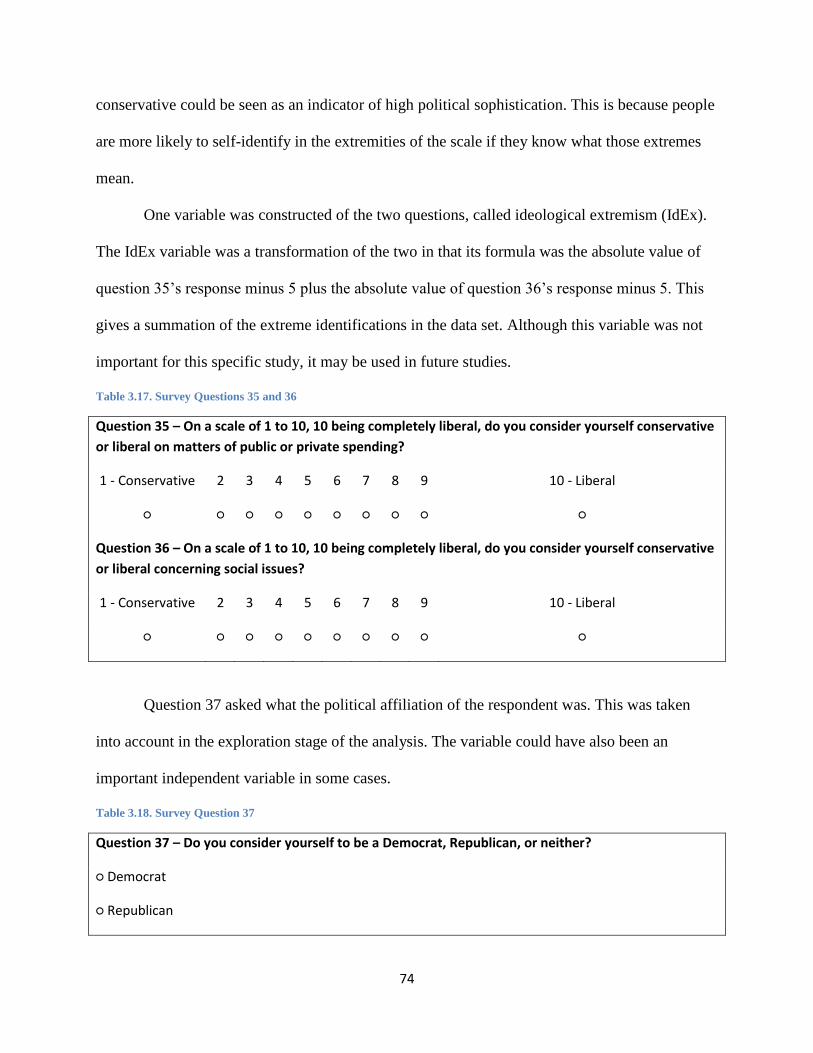
74
conservative could be seen as an indicator of high political sophistication. This is because people
are more likely to self-identify in the extremities of the scale if they know what those extremes
mean.
One variable was constructed of the two questions, called ideological extremism (IdEx).
The IdEx variable was a transformation of the two in that its formula was the absolute value of
question 35’s response minus 5 plus the absolute value of question 36’s response minus 5. This
gives a summation of the extreme identifications in the data set. Although this variable was not
important for this specific study, it may be used in future studies.
Table 3.17. Survey Questions 35 and 36
Question 35 – On a scale of 1 to 10, 10 being completely liberal, do you consider yourself conservative
or liberal on matters of public or private spending?
1 - Conservative 2 3 4 5 6 7 8 9 10 - Liberal
○ ○ ○ ○ ○ ○ ○ ○ ○ ○
Question 36 – On a scale of 1 to 10, 10 being completely liberal, do you consider yourself conservative
or liberal concerning social issues?
1 - Conservative 2 3 4 5 6 7 8 9 10 - Liberal
○ ○ ○ ○ ○ ○ ○ ○ ○ ○
Question 37 asked what the political affiliation of the respondent was. This was taken
into account in the exploration stage of the analysis. The variable could have also been an
important independent variable in some cases.
Table 3.18. Survey Question 37
Question 37 – Do you consider yourself to be a Democrat, Republican, or neither?
○ Democrat
○ Republican

75
○ Neither
Question 38 asked the respondent to indicate on a ten-point Likert scale how much they
care about politics in general. This question was used to create a ten-point (1 – 10) variable that
measured political interest. As stated in the literature on political sophistication, political interest
is an important factor of political sophistication. Thus, this variable is very important for the
analysis of political sophistication in relation to the other variables in this study. Political interest
can either be considered a part of political sophistication or a strong proxy for the presence of
political sophistication.
Table 3.19. Survey Question 38
Question 38 – How much do you care about politics?
1 – Not at all 2 3 4 5 6 7 8 9 10 – A great deal
○ ○ ○ ○ ○ ○ ○ ○ ○ ○
The Demographics Battery
The next set of questions was used to measure the control and demographic variables in
the study. The first question (question 39) asks the respondent to indicate in which year they
were born. This is to ascertain what the respondent’s age is. The final variable (Age) was
calculated by subtracting the birth year from the current year at the time of the data gathering, so
the variable would indicate years of age.
Table 3.20. Survey Question 39
Question 39 – In what year were you born?

76
Question 40 asks in what zip code the respondent lives. Using census data available via
the Internet, the data was converted from a zip code into a population density. This was done by
looking up the population for the zip code and the land area of the same zip code, then dividing
the population by the land area. The final population density measure was in units of number of
people per square mile. Population density is expected to affect the level of some social capital
variables since several psychological effects come into play as population density increases, as
discussed in the literature review.
Table 3.21. Survey Question 40
Question 40 – In what zip code do you live?
Question 41 simply asked what gender the respondent was. Female was coded as 1 in the
data set while male was coded as 0. Being female has been shown to be correlated with lower
political sophistication and lower political interest.
Table 3.22. Survey Question 41
Question 41 – What is your gender?
○ Male
○ Female
Question 42 asked about how much income each respondent earns on an annual basis.
This question follows the same format as the United States Census Bureau’s 2010 census
question on income (i.e., the same income ranges are represented in the question). The lowest
income range was coded as a 1 while the highest was coded as a 6. Income should correlate
positively with political sophistication and social capital variables since greater income can be
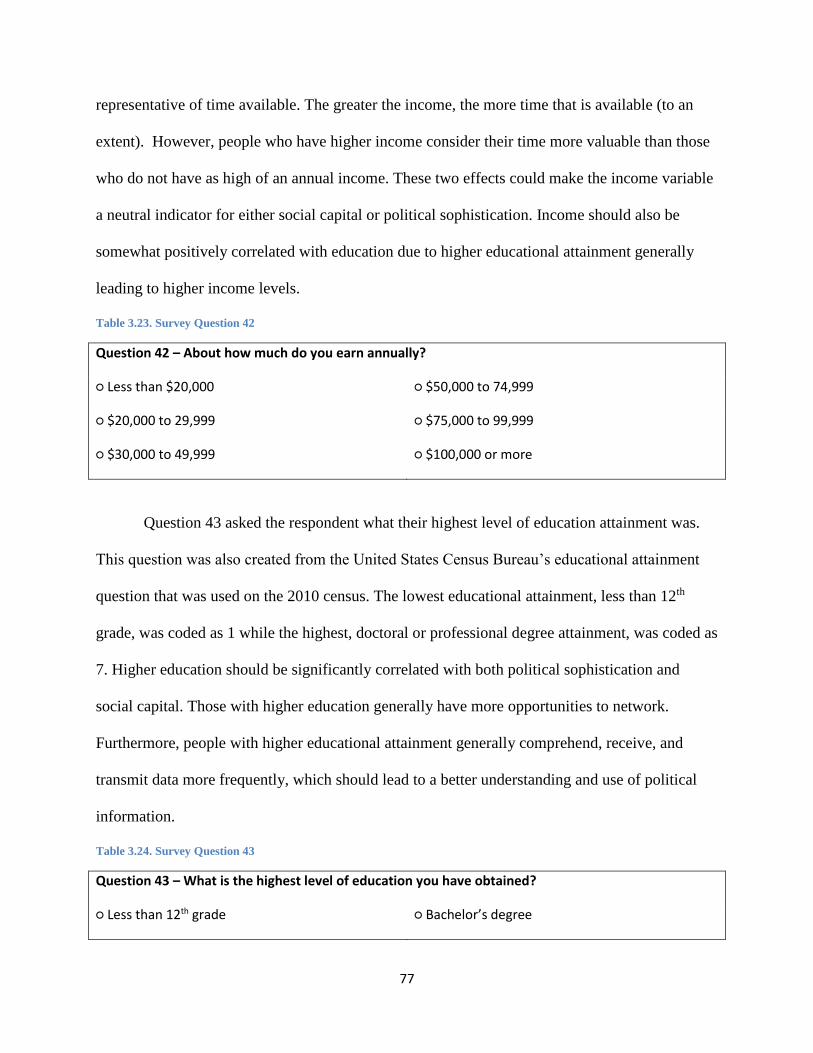
77
representative of time available. The greater the income, the more time that is available (to an
extent). However, people who have higher income consider their time more valuable than those
who do not have as high of an annual income. These two effects could make the income variable
a neutral indicator for either social capital or political sophistication. Income should also be
somewhat positively correlated with education due to higher educational attainment generally
leading to higher income levels.
Table 3.23. Survey Question 42
Question 42 – About how much do you earn annually?
○ Less than $20,000 ○ $50,000 to 74,999
○ $20,000 to 29,999 ○ $75,000 to 99,999
○ $30,000 to 49,999 ○ $100,000 or more
Question 43 asked the respondent what their highest level of education attainment was.
This question was also created from the United States Census Bureau’s educational attainment
question that was used on the 2010 census. The lowest educational attainment, less than 12th
grade, was coded as 1 while the highest, doctoral or professional degree attainment, was coded as
7. Higher education should be significantly correlated with both political sophistication and
social capital. Those with higher education generally have more opportunities to network.
Furthermore, people with higher educational attainment generally comprehend, receive, and
transmit data more frequently, which should lead to a better understanding and use of political
information.
Table 3.24. Survey Question 43
Question 43 – What is the highest level of education you have obtained?
○ Less than 12th grade ○ Bachelor’s degree

78
○ Diploma/GED ○ Master’s degree
○ Associate’s degree ○ Doctoral/Professional degree
○ Some college
Question 44 asked the respondent to indicate how long they have lived in their current
neighborhoods. This variable was measured in months of residence. Length of residence can
greatly affect social capital since a greater time spent at the current residence allows for stability
to form in neighborhood, family, and other networks. Density and trust may also be developed
through continued interactions. Question 45 asked if the person rents or owns their current
residence. Ownership of a person’s residence matters for nearly the same reasons length of
residence matters; not to mention, both of the variables measured by questions 44 and 45 should
be highly and positively correlated.
Table 3.25. Survey Questions 44 and 45
Question 44 – How long have you lived in your current neighborhood? Please estimate to the nearest
month.
Question 45 – Do you rent or own your residence?
○ Rent
○ Own
Question 46 asked the participants to indicate their current occupation. Occupations were
then coded into classes, which included administrative, arts, education, executive, financial,
health, law, research, retired, service, student, tech, trade, and unemployed. Professionalization
into particular fields can have an effect on the norms and values transmitted between individuals.
Particular professions may also be more prone to communication and networking than others.

79
For example, one would expect an executive to spend far more time networking than a similar
person who is unemployed.
Table 3.26. Survey Question 46
Question 46 – What is your current occupation?
Question 47 asked what race each participant would consider himself or herself to be part
of. This question mimics the race selections used on the 2010 census forms. Particular groups of
people may have different norms and values than other groups. For example, white Caucasians
may be less religious and less traditional than white Hispanics due to differences in the norms
and values where they were raised.
Table 3.27. Survey Question 47
Question 47 – What race would you consider yourself to be part of (circle more than one if needed)?
○ White (Caucasian) ○ Pacific Islander
○ White (Hispanic) ○ Native American
○ Black or African-American ○ Other (please specify)
○ Asian
Question 48 asked what religion individuals most identified with. Similar to race,
religious affiliation matters because of the values and norms that are generally transmitted within
groups with religious upbringing. For example, Christian Catholics may be less concerned with
self-direction and more concerned with tradition than are Christian Protestants. Each religion
may have its own set of norms and acceptable values.

80
Table 3.28. Survey Question 48
Question 48 – What religion do you most identify with?
○ Christian (Catholic) ○ Buddhism
○ Christian (Protestant) ○ Hinduism
○ Christian (Non-denominational) ○ Shinto
○ Islam (Sunni) ○ Non-religious
○ Islam (Shiite) ○ Other (please specify)
○ Judaism
Factor Analysis
The first step of analysis was to run several factor analyses using the IBM SPSS
computer software program. The purpose of the factor analysis was to reduce the number of
variables that were used in the analysis by finding latent variables that match theoretical or real-
world phenomena. For example, if all three trust of familiars variables (TrstF1, TrstF2, and
TrstF3) form only one factor, then this helps confirm that those three variables measure the same
latent item; in other words, the factor analysis would confirm that those three variables measure
trust of familiars instead of possibly measuring two or three separate effects.
The motivation for using factor analysis in this study is to ascertain what variables may
be hidden within the data. The factor analysis was expected to be especially helpful in
discovering latent factors in regards to the Schwartz value type and organizational trust variables.
Recall that there were 17 organizational trust variables, let alone all of the other variables used to
measure the components of social capital. Exploratory factor analysis would help to reduce the
amount of variables while hopefully at the same time help to maintain reliability.

81
Likewise, it was expected that several different latent factors may be present in the data
gathered for the sixteen civic trust variables. Since many of the specific civic trust variables are
very different (e.g., trust in Congress versus trust in religious leaders), there should be factors
present that describe these underlying differences and also any similarities that seem relevant and
intuitive. The same issues may also arise for the formal networks variables since many of them
differ in meaning (e.g., membership in a religious organization may not be the same as
membership in a political party). The political sophistication variable will also be created based
upon a factor analysis.
Pearson Correlation Analysis
The second step in the analysis was a correlation analysis (which also included the new
factors created in the factor analysis step) to find any novel correlations and to test for expected
correlations, including many of the hypotheses mentioned earlier in this dissertation. All possible
independent variables were correlated with the primary dependent variables. Correlations were
analyzed using SPSS’s bivariate one-tailed correlation function.
Any statistically significant relationships between the variables were examined for
whether they met expectations or not. The correlation analyses also helped determine how the
regression models – mentioned in the next step of the analysis – were specified. Unless otherwise
mentioned, all Pearson correlations were run using one-tailed significance values. One-tailed
correlations were used simply because this study makes particular assertions based upon
directional effects between the variable analyzed.

82
Linear Regression Analysis
The final step of analysis for this study was running numerous linear regression models
using the SPSS linear regression function. All the primary dependent variables were analyzed so
that partial effects of the independent variables in each model were considered for the final
conclusions. Special attention was also paid to any multicollinearity that may have been present
between independent variables in each model. Variance inflation factors (VIFs) were examined
for each model to make sure that the specific VIFs for each factor were below the value of 5.
The results of the analytical steps outlined in this chapter are shown in the following two
chapters. The next chapter exposes the results from the appropriate factor, correlation, and
regression analyses regarding the possible relationships between values, social capital, and
political sophistication. The chapter immediately following the next chapter will conclude the
study and describe findings, implications, and future research that can be derived from this study.
83
Chapter 4: Results
Introduction
Recall that the purpose of the study is to establish a measurable framework by which we
can observe how values affect social and political outcomes. If the hypotheses are confirmed,
community and political leaders could use the information found in this study to tailor their
programs and policies to mitigate the effects of particular values on social capital and political
sophistication. Perhaps in the future a predictive model could be developed from the data
presented in this study.
As mentioned in an earlier chapter, the primary research questions governing the study
are (1) whether social capital characteristics that facilitate information flow significantly
correlate with particular Schwartz value types; (2) whether social capital characteristics that
facilitate information flow significantly correlate with more political sophistication; and (3)
whether a preliminary predictive model can be built to describe the relationship between social
capital and political sophistication.
The PVSN survey was presented in the last chapter (chapter 3). This survey instrument
was developed specifically for this study in the expectation that it would help answer the
questions posed and in the belief that it may also help define the relationships between the values,
social capital, and political sophistication phenomena. The survey was distributed to participants
via the Internet to five separate university communities and was available exclusively online to
whoever wished to complete it.
Limitations Revisited

84
One of the primary limitations of the study is that a truly representative sample of the United
States could not be obtained with the limited budget. Even though this could potentially bias the
results, the relationships hypothesized to occur in this study would be maintained. For example,
higher education may bias political knowledge scores upward, however this bias should also
correlate with a bias upward in self-transcendence values as hypothesized. Relationships between
variables will be maintained even though the scale measures may be different for the sample.
Indeed, the sample was not respresentative of the United States as a whole according to the
descriptive results. Most respondents were younger, two-thirds of the sample identified as female,
nearly half of the respondents indicated that their income was below $20,000 per year, two-thirds
of the sample identified as white Caucasian or Hispanic, and 33% of the sample identified as
non-religious whereas 55% identified as Christian. According to the Census Bureau, the median
age of the U.S. population was 36.8 years, average income was $46,326, 72.4% were white
Caucasian or Hispanic, and 78.5% identified as Christian while only 16.1% identified as non-
religious.
Organization of the Data Analysis
The data analysis will begin with an overview of the descriptive data for each question,
including the distribution and mean. The demographic overview will help refresh the reader’s
memory on specific variables in the study and will also provide interesting clues as to how the
relationships between values, social capital, political sophistication, and demographics are
organized.
Next, this chapter will focus in on the correlation analysis for each social capital variable
with values, political, and demographic variables. This will help investigate the link between

85
specific Shwartz value types, social capital characteristics, and political sophistication while also
showing any links between the major demographic control variables and social capital.
Finally, the chapter investigates and presents several regression models that may be used
to predict political sophistication based upon several combinations of explanatory variables. This
helps to point the direction for future research in predictive modeling for political sophistication.
After the regression models are presented, the chapter ends with a summary and conclusion.
Descriptive Characteristics of Respondents for Each Survey Question
Social Capital Variables
This section presents and discusses the descriptive characteristics of the data for each
important question answered on the survey. There were a total of 48 substantive questions on the
PVSN survey. The first question asked “for each of the following, indicate how important it is in
your life.” For this question, the respondent ranked each of family, friends, significant others,
and neighbors in importance from “not at all important” to “very important.” A number, 1 – 4
was assigned for each answer, with 1 being “not at all important” and 4 being “very important.”
This question measured the extent of informal networks for each individual, a portion of one of
the nine key components of social capital.
Table 4.1. Question 1: Informal Networks Descriptives
Family (%) Friends (%) Sig. Other (%) Neighbors (%)
Not at all important
Not very important
Rather important
Very important
N
0.2 0 5.4 11.4
2.0 2.6 4.6 52.8
15.3 40.9 15.5 31.7
81.8 56.1 70.8 4.2
601 604 584 599
Mean 3.8 3.54 3.57 2.29
Std. Dev. 0.458 0.550 0.825 0.718

86
Concerning informal networks, the bulk of the respondents thought that both family
(81.8%) and their significant other (70.8%) were very important in their lives. In comparison, the
percent of respondents who thought friends were very important fell to 56.1%. Of the four
informal network types included, neighbors were ranked as the lowest importance, with only 4.2%
of respondents indicating that neighbors were very important in their lives; indeed, a majority
(52.8%) claimed that they were “not very important.” Overall, it seems that respondents
indicated family and friends were most important overall, followed by a significant other, then
lastly by neighbors.
The next question stated that “the following is a list of voluntary organizations. For each
one, please indicate whether you are an active member, an inactive member, or not a member of
that type of organization.” Respondents could answer with one of three responses ranging from
“don’t belong” to “active member.” “Don’t belong” was coded 1, “inactive member” was coded
2, and “active member” was coded 3. This question measures the extent to which the individual
is engaged in formal networks and when combined with question 1, measures the first key
component of social capital, network type adherence.
Table 4.2. Question 2: Formal Networks Descriptives
Church or
Religious (%)
Non-
Religious
Human. (%)
Religious Human.
(%)
Sport or Rec. (%)
Active member 27.2 24.1 8.3 20.6
Inactive member 28.8 22.4 11.3 17.1
Don't belong 44 53.5 80.4 62.3
N 600 598 591 597
Mean 1.83 1.71 1.28 1.58
Std. Dev. 0.827 0.831 0.606 0.810
Art (%) Labor (%) Political Party (%) Environmental (%)
Active member 34.7 2.9 28.6 10.1
Inactive member 17.1 6.1 36.7 17.4
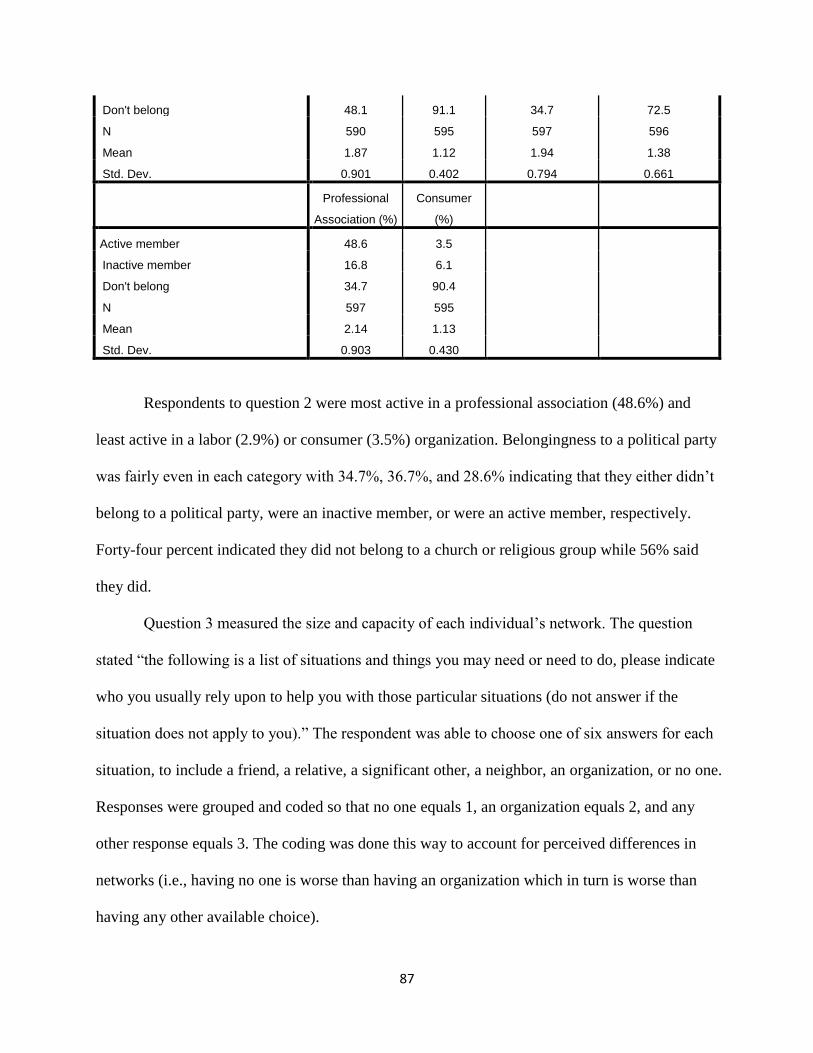
87
Don't belong 48.1 91.1 34.7 72.5
N 590 595 597 596
Mean 1.87 1.12 1.94 1.38
Std. Dev. 0.901 0.402 0.794 0.661
Professional
Association (%)
Consumer
(%)
Active member 48.6 3.5
Inactive member 16.8 6.1
Don't belong 34.7 90.4
N 597 595
Mean 2.14 1.13
Std. Dev. 0.903 0.430
Respondents to question 2 were most active in a professional association (48.6%) and
least active in a labor (2.9%) or consumer (3.5%) organization. Belongingness to a political party
was fairly even in each category with 34.7%, 36.7%, and 28.6% indicating that they either didn’t
belong to a political party, were an inactive member, or were an active member, respectively.
Forty-four percent indicated they did not belong to a church or religious group while 56% said
they did.
Question 3 measured the size and capacity of each individual’s network. The question
stated “the following is a list of situations and things you may need or need to do, please indicate
who you usually rely upon to help you with those particular situations (do not answer if the
situation does not apply to you).” The respondent was able to choose one of six answers for each
situation, to include a friend, a relative, a significant other, a neighbor, an organization, or no one.
Responses were grouped and coded so that no one equals 1, an organization equals 2, and any
other response equals 3. The coding was done this way to account for perceived differences in
networks (i.e., having no one is worse than having an organization which in turn is worse than
having any other available choice).

88
Table 4.3. Question 3: Network Size and Capacity Descriptives
Child Care
(%)
Sickness
(%)
Advice (%) Borrow (%)
Friend 4.2 10.3 42.3 54.1
Relative 29.3 23.2 22.0 26.3
Sig. Other 19.2 47.4 33.6 9.2
Neighbor 1.0 0.3 0.3 6.7
An organization 8.4 0.5 0.2 0.2
No one 38.0 18.3 1.7 3.6
N 287 595 596 586
Money (%) Worry (%) Personal (%)
Friend 3.5 25.6 24.4
Relative 59.2 19.4 19.9
Sig. Other 19.7 44.1 50.3
Neighbor 0.2 0.5 0.2
An organization 2.3 1.0 0.2
No one 15.1 9.3 5.1
N 568 581 587
In most situations for question 3, respondents overwhelmingly indicated that they relied
on a friend, relative, significant other, or neighbor to help. However, for childcare, help was not
available at all for 38% of respondents. No one was available for 18.3% and 15.1% of
respondents where the case was sickness or money problems, respectively.
Friends were relied upon more for advice (42.3%) and borrowing something (54.1%).
Relatives were relied upon for money (59.2%). A person’s significant other was relied upon most
in situations involving sickness (47.4%), worry (44.1%), and personal events (50.3%).
For question 4, the respondent was asked to indicate “how far away does most of your
family live in comparison to where you live if you were to drive a car to get there?” Respondents
could indicate one of five responses including within 30 minutes, within 1 hour, within 2 hours,
within 5 hours, and greater than 5 hours. This indicates the spatial dimension of the individual’s
network.

89
Table 4.4. Question 4: Spatial Dimension Descriptives
%
Greater than 5 hours 41.2
20.9
15.4
7.8
14.7
Within 5 hours
Within 2 hours
Within 1 hour
Within 30 minutes
N 599
Mean 2.34
Std. Dev. 1.446
Most respondents indicated that they were fairly far away from their families. Nearly half,
or 41.2%, of the sample indicated that their families lived more than 5 hours away via car while
20.9% indicated they were between 2 and 5 hours away. Only 14.7% of the sample said that their
families were within a 30 minute driving distance.
Question 5 asked “which one of the following would best describe your network of
friends?” The answer choices were three in number: “A circle in which all friends interact with
each other as well as with you,” “A wheel with spokes in which each friend is somewhat separate
from the others and is primarily connected through you as the hub,” or “Somewhere in between –
some friends interact while others are separate.” Each answer shows the relative “closedness” of
the individual’s network. For example, if someone chose the second option, their network would
be termed “open,” whereas if they chose the first answer, they would be termed “open.” Being
open was coded as 1, in between as 2, and closed as 3.
Figure 5. Question 5: Network Closure Descriptives
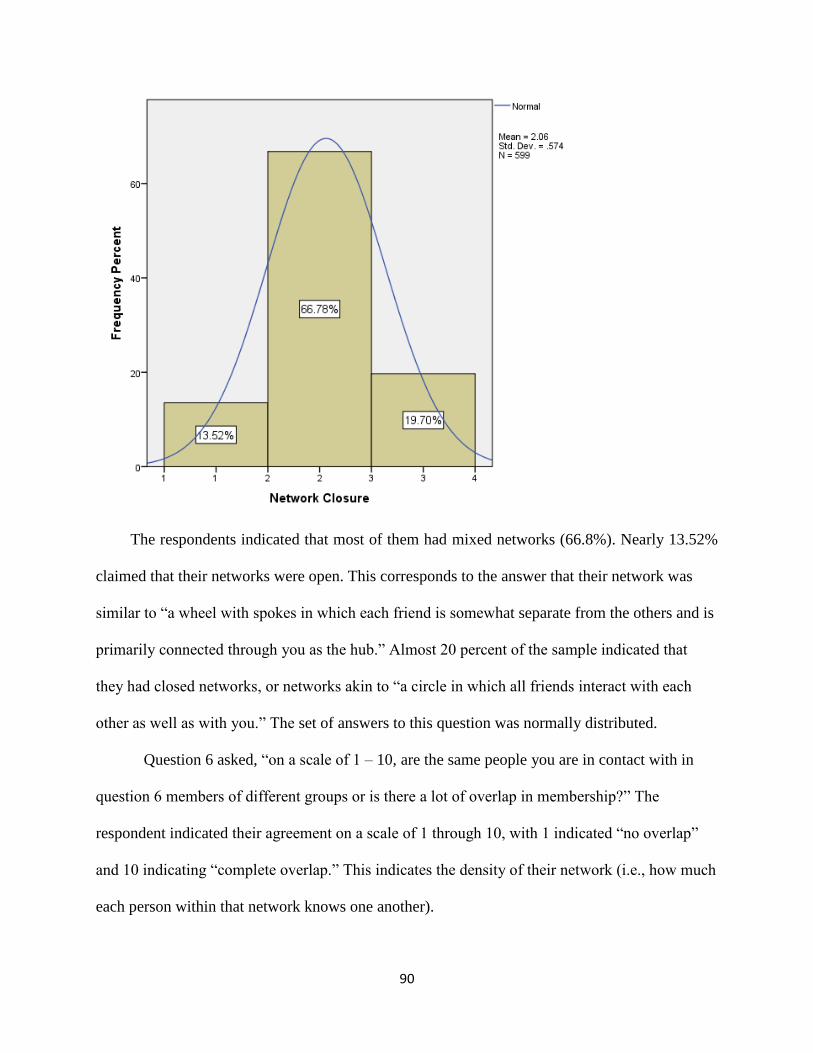
90
The respondents indicated that most of them had mixed networks (66.8%). Nearly 13.52%
claimed that their networks were open. This corresponds to the answer that their network was
similar to “a wheel with spokes in which each friend is somewhat separate from the others and is
primarily connected through you as the hub.” Almost 20 percent of the sample indicated that
they had closed networks, or networks akin to “a circle in which all friends interact with each
other as well as with you.” The set of answers to this question was normally distributed.
Question 6 asked, “on a scale of 1 – 10, are the same people you are in contact with in
question 6 members of different groups or is there a lot of overlap in membership?” The
respondent indicated their agreement on a scale of 1 through 10, with 1 indicated “no overlap”
and 10 indicating “complete overlap.” This indicates the density of their network (i.e., how much
each person within that network knows one another).
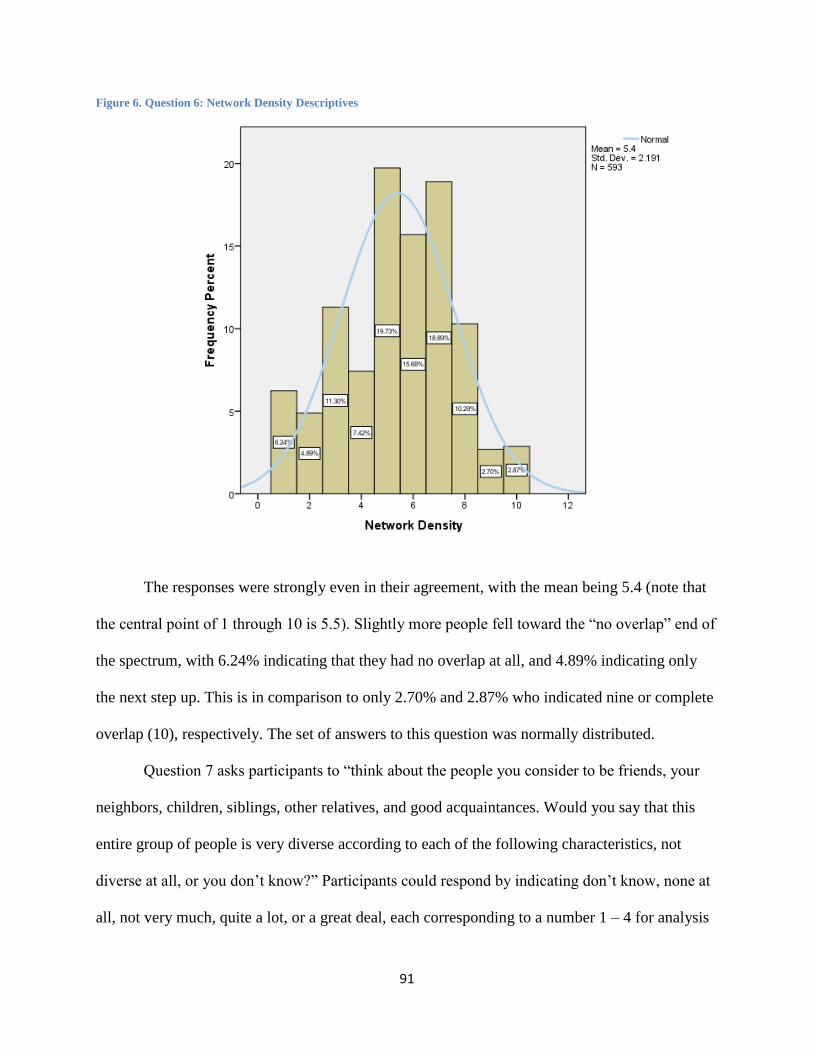
91
Figure 6. Question 6: Network Density Descriptives
The responses were strongly even in their agreement, with the mean being 5.4 (note that
the central point of 1 through 10 is 5.5). Slightly more people fell toward the “no overlap” end of
the spectrum, with 6.24% indicating that they had no overlap at all, and 4.89% indicating only
the next step up. This is in comparison to only 2.70% and 2.87% who indicated nine or complete
overlap (10), respectively. The set of answers to this question was normally distributed.
Question 7 asks participants to “think about the people you consider to be friends, your
neighbors, children, siblings, other relatives, and good acquaintances. Would you say that this
entire group of people is very diverse according to each of the following characteristics, not
diverse at all, or you don’t know?” Participants could respond by indicating don’t know, none at
all, not very much, quite a lot, or a great deal, each corresponding to a number 1 – 4 for analysis
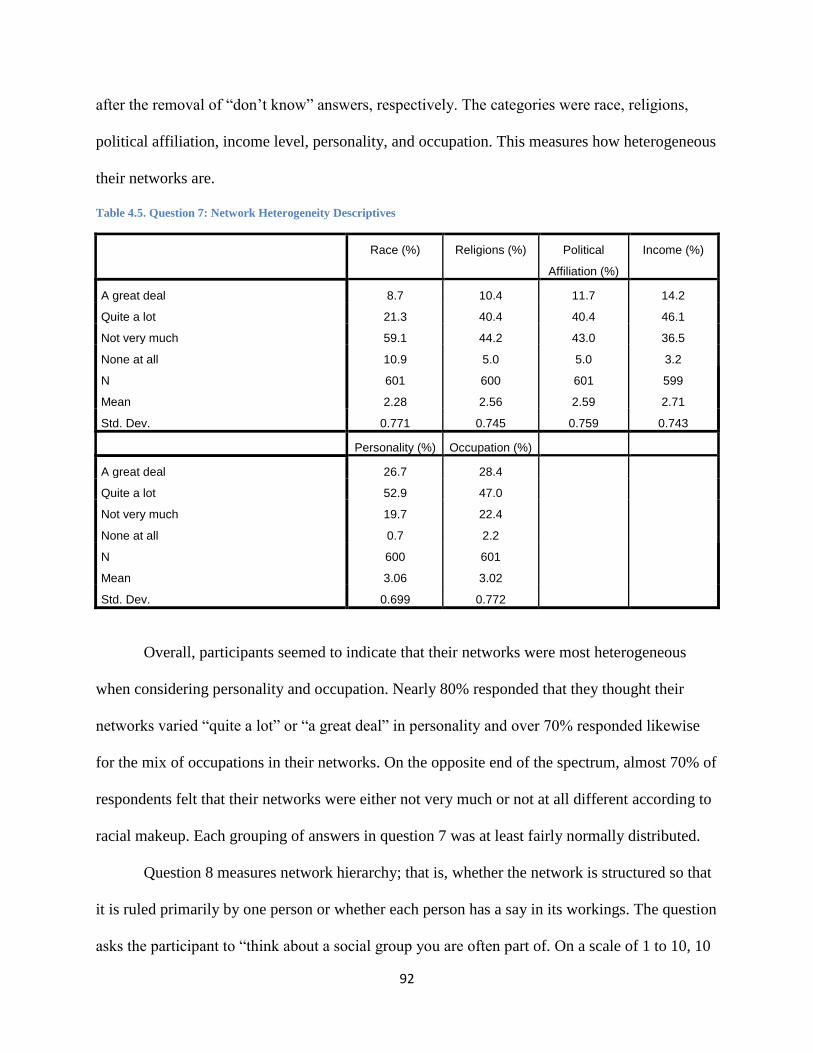
92
after the removal of “don’t know” answers, respectively. The categories were race, religions,
political affiliation, income level, personality, and occupation. This measures how heterogeneous
their networks are.
Table 4.5. Question 7: Network Heterogeneity Descriptives
Race (%) Religions (%) Political
Affiliation (%)
Income (%)
A great deal 8.7 10.4 11.7 14.2
Quite a lot 21.3 40.4 40.4 46.1
Not very much 59.1 44.2 43.0 36.5
None at all 10.9 5.0 5.0 3.2
N
Mean
601
2.28
600
2.56
601
2.59
599
2.71
Std. Dev. 0.771 0.745 0.759 0.743
Personality (%) Occupation (%)
A great deal 26.7 28.4
Quite a lot 52.9 47.0
Not very much 19.7 22.4
None at all 0.7 2.2
N
Mean
600
3.06
601
3.02
Std. Dev. 0.699 0.772
Overall, participants seemed to indicate that their networks were most heterogeneous
when considering personality and occupation. Nearly 80% responded that they thought their
networks varied “quite a lot” or “a great deal” in personality and over 70% responded likewise
for the mix of occupations in their networks. On the opposite end of the spectrum, almost 70% of
respondents felt that their networks were either not very much or not at all different according to
racial makeup. Each grouping of answers in question 7 was at least fairly normally distributed.
Question 8 measures network hierarchy; that is, whether the network is structured so that
it is ruled primarily by one person or whether each person has a say in its workings. The question
asks the participant to “think about a social group you are often part of. On a scale of 1 to 10, 10

93
being the strongest, how strongly do you feel that everyone has a say in what to do when you are
part of that group?” A response of 1 indicated “not at all” while a response of 10 indicated
“always.”
Figure 7. Question 8: Network Horizontality (Hierarchy) Descriptives
The responses to question 8 are not normally distributed in that they are slightly
negatively skewed. More than 50% of the respondents indicated that they would agree that their
networks have a great degree of horizontality, choosing 8, 9, or 10 on the scale. Relatively few
respondents indicated that they thought most people had relatively no say in what the group did
on a regular basis.
Question 9 asked what social group the respondent was thinking of in the prior question
and was answered in a textual way. However, question 10 asked how much each respondent
trusted their family, their neighborhood, people they know personally, people they meet for the

94
first time, people of another religion, people of another nationality, and people of another race.
Answers to this question could be “not at all,” “not very much,” “somewhat,” or “completely.”
In order to better define the effects of the trust variables, this question was split into two separate
variables. The first is familiar trust and encompasses trust of the family, neighborhood, and
people known personally. The second is trust of strangers and encompasses people met for the
first time, people of another religion, people of another nationality, and people of another race.
Table 4.6. Question 10: Familiar Trust Descriptives
Family (%) Neighborhood (%) People you know personally (%)
Completely
Somewhat
Not very much
Not at all
N
74.6 5.4 33.3
22.6 53.3 63.8
2.2 32.0 2.8
0.7 9.4 0
598 597 597
Mean 3.71 2.55 3.30
Std. Dev. 0.538 0.737 0.519
For familiar trust, both trust for the family and of people respondents knew personally
was negatively skewed. Trust for the family was complete in 74.6% of the cases. Though
complete trust pertaining to people they knew personally dropped to 33.3%, respondents
indicated that they somewhat trusted people they knew personally 63.8% of the time. However,
trust of people in the respondents’ neighborhood did not fair as well. Over 40% indicated that
they either do not trust people in their neighborhoods at all or not very much.
Table 4.7. Question 10: Trust of Strangers Descriptives
Just Met (%) Another Religion (%) Another Nationality (%) Another Race (%)
Completely
Somewhat
Not very much
Not at all
N
0.8 13.1 15.6 16.3
40.5 74.8 74.3 75.8
44.7 10.7 8.7 7.0
13.9 1.4 1.4 0.9
597 580 584 582

95
Mean 2.28 3.00 3.04 3.08
Std. Dev. 0.706 0.542 0.545 0.513
For trust of strangers, all values were lower on average than trust for familiars except in
the case of neighborhood trust, which was lower than all trust of stranger variables except for
people just met. Trust of people who respondents just met was the lowest of all the trust variables
in question 10; 13.9% did not trust people who they just met at all. The trust of strangers scores
were less skewed than the trust of familiars scores, but were still somewhat negatively skewed.
The table below gives the ranking of the trust variables for question 10 according to their mean
scores.
Table 4.8. Question 10: Trust Rankings by Mean
1. Family (3.71) 4. Another nationality (3.04) 7. Just met (2.28)
2. People you know personally (3.30) 5. Another religion (3.00)
3. Another race (3.08) 6. Neighborhood (2.55)
Question 11 gives the participant a list of 16 organizations and organization types and
asks “could you tell me how much confidence you have in them?” The respondent is given the
choices “none at all,” “not very much,” “quite a lot,” “or a great deal.” This question measures
organizational trust on the same scale as familiar and stranger trust.
Table 4.9. Question 11: Trust of Organizations Descriptives
Rel. Leaders
(%)
Armed Forces
(%)
The Press (%) Television (%)
A great deal 8.6 22.9 1.3 0.8
Quite a lot 24.7 45.2 18.5 7.4
Not very much 48.8 26.1 61.7 65.8
None at all 18.0 5.9 18.5 25.9
N
Mean
596
2.24
595
2.85
596
2.03
594
1.83

96
Std. Dev. 0.844 0.839 0.650 0.582
Lab. Unions (%) Police (%) Courts (%) President (%)
A great deal 3.6 13.3 9.6 15.9
Quite a lot 30.8 54.9 54.0 47.9
Not very much 53.6 27.9 33.7 26.5
None at all 11.9 3.9 2.7 9.8
N
Mean
578
2.26
594
2.78
593
2.71
594
2.70
Std. Dev. 0.711 0.720 0.674 0.851
Pol. Parties (%) Congress (%) Gov. Agencies
(%)
Maj.
Companies
(%)
A great deal 1.0 2.0 3.4 0.8
Quite a lot 13.0 16.2 38.8 18.4
Not very much 57.6 59.3 48.4 55.3
None at all 28.5 22.5 9.4 25.4
N
Mean
592
1.87
593
1.98
591
2.36
592
1.95
Std. Dev. 0.661 0.684 0.698 0.686
Env. Orgs. (%) Women’s Orgs.
(%)
Charitable
Orgs. (%)
The UN (%)
A great deal 10.5 12.4 12.9 11.0
Quite a lot 51.4 50.4 61.4 45.7
Not very much 33.3 32.6 24.5 34.5
None at all 4.9 4.6 1.2 8.8
N
Mean
589
2.67
591
2.71
591
2.86
589
2.59
Std. Dev. 0.727 0.740 0.634 0.800
When speaking of trust of organizations, charitable organizations had the largest average
score at 2.86, followed closely by the armed forces at 2.85. The president came in with a fairly
high mean trust score of 2.70, while Congress was much lower at 1.98; however, the highest
ranked branch of government was the courts at 2.71. Overall, respondents trusted television the
least (1.83) while political parties (1.87) came in only slightly more trusted. The table below
shows the ranking of mean organizational trust scores.

97
Table 4.10. Question 11: Organizational Trust Rankings by Mean
1. Charitable Orgs. (2.86) 6. Environmental Orgs. (2.67) 11. The Press (2.03)
2. Armed Forces (2.85) 7. The UN (2.59) 12. Congress (1.98)
3. Police (2.78) 8. Gov. Agencies (2.36) 13. Major Companies (1.95)
4. Courts (2.71) 9. Lab. Unions (2.26) 14. Political Parties (1.87)
4. Women’s Orgs. (2.71) 10. Religious Leaders (2.24) 15. Television (1.83)
5. The President (2.70)
The next table shows overall (trust of familiars, trust of strangers, and trust of
organizations) trust rankings. Family (3.71) is the most trustworthy and television is least
trustworthy (1.83). Neighbors (2.55) fall into the middle of the overall rankings where they are
ranked higher government agencies (2.36), religious leaders (2.24), and Congress (1.98). Even
the president (2.70), the armed forces (2.85), and the courts (2.71) are ranked higher on the trust
scale than neighbors.
Table 4.11. Question 11: All Trust Rankings by Mean
1. Family (3.71)
2. People you know personally (3.30)
3. Another race (3.08)
4. Another nationality (3.04)
5. Another religion (3.00)
6. Charitable Orgs. (2.86)
7. Armed Forces (2.85)
8. Police (2.78)
9. Courts (2.71)
10. Women’s Orgs. (2.71)
11. The President (2.70)
12. Environmental Orgs. (2.67)
13. The UN (2.59)
14. Neighborhood (2.55)
15. Gov. Agencies (2.36)
16. Just met (2.28)
17. Lab. Unions (2.26)
18. Religious Leaders (2.24)
19. The Press (2.03)
20. Congress (1.98)
21. Major Companies (1.95)
22. Political Parties (1.87)
23. Television (1.83)

98
Question 12 measures the individual’s adherence to the norm of reciprocity and asks “on
a scale of 1 to 10, 10 being the most often, how often do you help people who help you?” The
responses to this question were heavily negatively skewed; nearly all the respondents (87.7%)
indicated an answer of 8, 9, or 10. None of the respondents said that they would give an answer
of 1 or 2. Only 9.5% of the respondents indicated that they were a 6 or 7 on the scale.
Table 4.12. Question 12: Reciprocation Descriptives
%
3
4
5
6
7
8
9
10
N
Mean
Std. Dev.
0.3
0.2
2.2
1.8
7.7
23.5
33.1
31.1
595
8.75
1.214
Question 13 asked “do you have and use a social networking account (Facebook,
Myspace, etc.)?” The respondents could only answer yes or no. Only 13.2 percent indicated that
they didn’t have a social networking account, whereas 86.8 percent indicated that they did.
Question 14 asked “how many hours per week do you spend communicating with people
via text, online social networking, or some other type of electronic communication (do not
include telephone use)?” The respondents could answer “less than 1 hour,” “1 to 3 hours,” “3 to
10 hours,” “10 to 15 hours,” or “more than 15 hours.” The data for this question is fairly
normally distributed. Over 60 percent of the respondents indicated that they use electronic
communication from 1 to 10 hours a week.
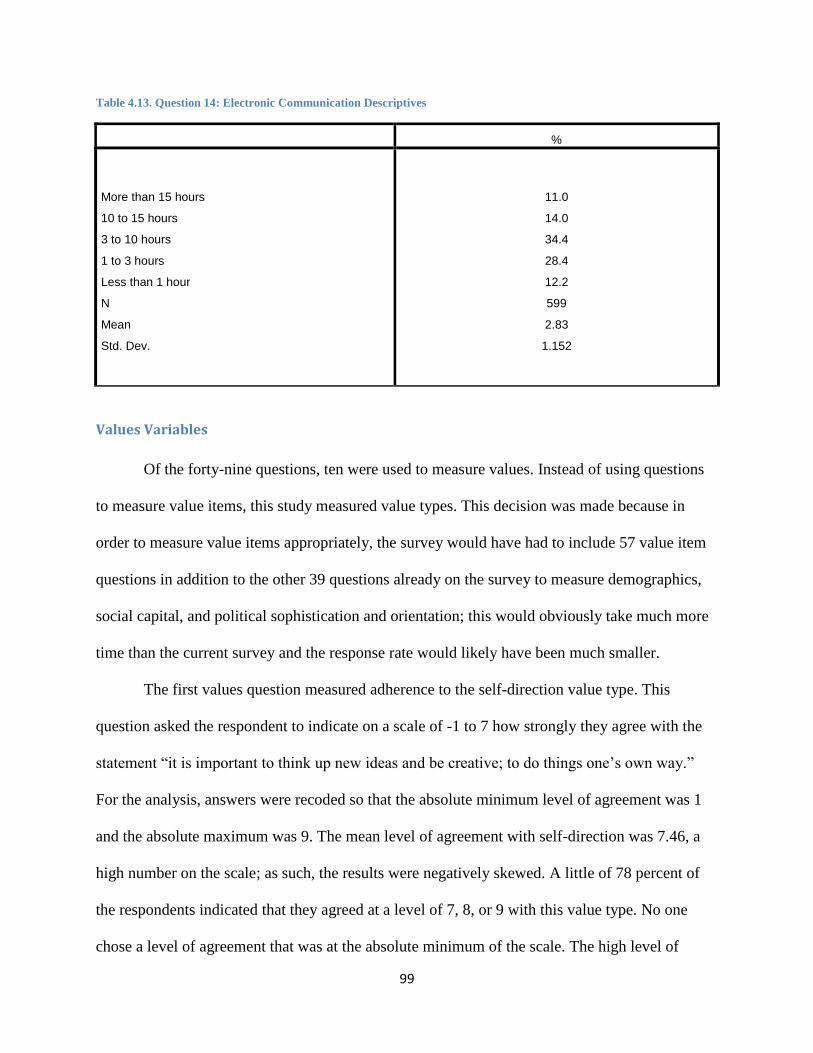
99
Table 4.13. Question 14: Electronic Communication Descriptives
%
More than 15 hours
10 to 15 hours
3 to 10 hours
1 to 3 hours
Less than 1 hour
N
Mean
Std. Dev.
11.0
14.0
34.4
28.4
12.2
599
2.83
1.152
Values Variables
Of the forty-nine questions, ten were used to measure values. Instead of using questions
to measure value items, this study measured value types. This decision was made because in
order to measure value items appropriately, the survey would have had to include 57 value item
questions in addition to the other 39 questions already on the survey to measure demographics,
social capital, and political sophistication and orientation; this would obviously take much more
time than the current survey and the response rate would likely have been much smaller.
The first values question measured adherence to the self-direction value type. This
question asked the respondent to indicate on a scale of -1 to 7 how strongly they agree with the
statement “it is important to think up new ideas and be creative; to do things one’s own way.”
For the analysis, answers were recoded so that the absolute minimum level of agreement was 1
and the absolute maximum was 9. The mean level of agreement with self-direction was 7.46, a
high number on the scale; as such, the results were negatively skewed. A little of 78 percent of
the respondents indicated that they agreed at a level of 7, 8, or 9 with this value type. No one
chose a level of agreement that was at the absolute minimum of the scale. The high level of
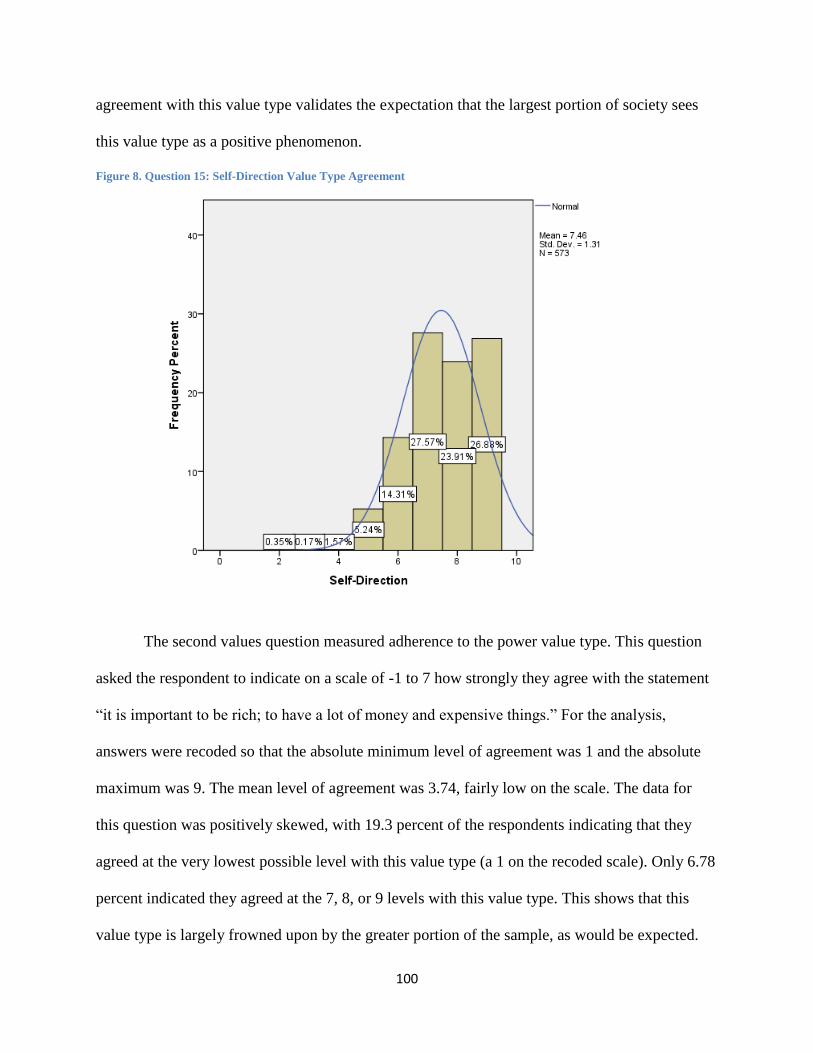
100
agreement with this value type validates the expectation that the largest portion of society sees
this value type as a positive phenomenon.
Figure 8. Question 15: Self-Direction Value Type Agreement
The second values question measured adherence to the power value type. This question
asked the respondent to indicate on a scale of -1 to 7 how strongly they agree with the statement
“it is important to be rich; to have a lot of money and expensive things.” For the analysis,
answers were recoded so that the absolute minimum level of agreement was 1 and the absolute
maximum was 9. The mean level of agreement was 3.74, fairly low on the scale. The data for
this question was positively skewed, with 19.3 percent of the respondents indicating that they
agreed at the very lowest possible level with this value type (a 1 on the recoded scale). Only 6.78
percent indicated they agreed at the 7, 8, or 9 levels with this value type. This shows that this
value type is largely frowned upon by the greater portion of the sample, as would be expected.

101
Figure 9. Question 16: Power Value Type Agreement
The third values question measured adherence to the security value type. This question
asked the respondent to indicate on a scale of -1 to 7 how strongly they agree with the statement
“living in secure surroundings is important; to avoid anything that might be dangerous.” For the
analysis, answers were recoded so that the absolute minimum level of agreement was 1 and the
absolute maximum was 9. The mean level of agreement was 6.38, a fairly high level on the scale
of 1 through 9. The data for this particular question was slightly negatively skewed, but nearly 85
percent of the respondents indicated a level of agreement from 5 through 9 that was fairly
normally distributed. This shows that security is slightly more valued than not, at least in this
sample.
Figure 10. Question 17: Security Value Type Agreement
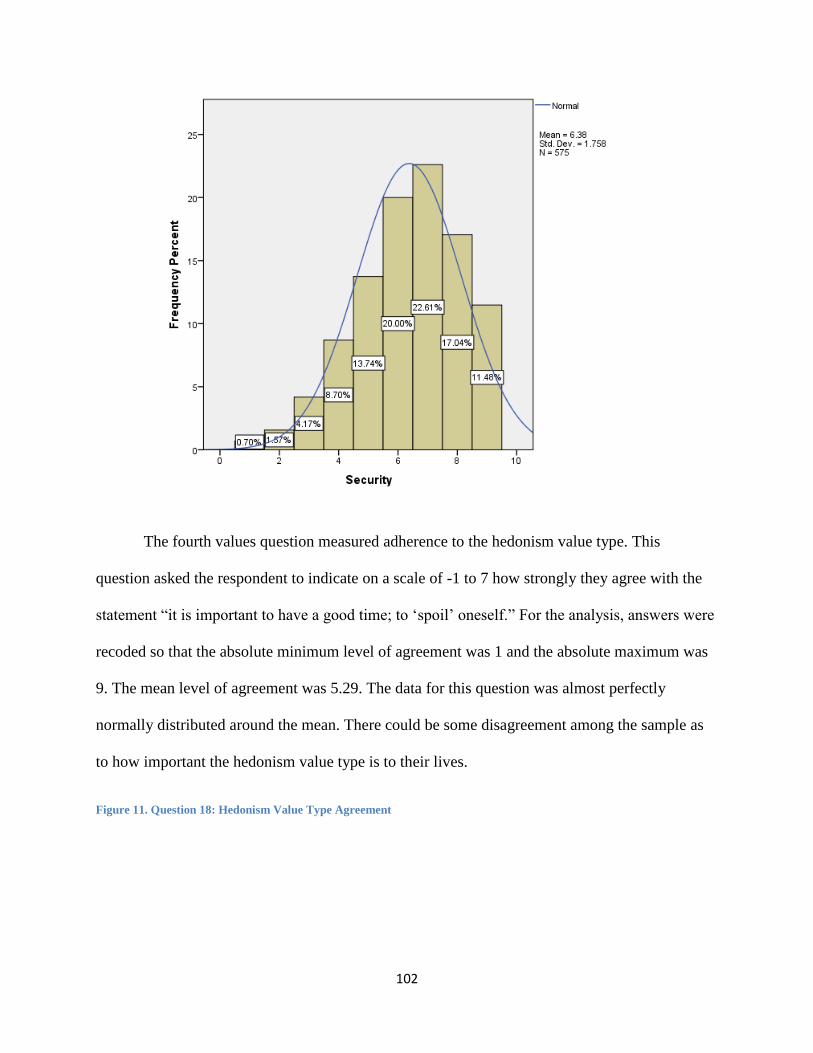
102
The fourth values question measured adherence to the hedonism value type. This
question asked the respondent to indicate on a scale of -1 to 7 how strongly they agree with the
statement “it is important to have a good time; to ‘spoil’ oneself.” For the analysis, answers were
recoded so that the absolute minimum level of agreement was 1 and the absolute maximum was
9. The mean level of agreement was 5.29. The data for this question was almost perfectly
normally distributed around the mean. There could be some disagreement among the sample as
to how important the hedonism value type is to their lives.
Figure 11. Question 18: Hedonism Value Type Agreement

103
The fifth values question measured adherence to the benevolence value type. This
question asked the respondent to indicate on a scale of -1 to 7 how strongly they agree with the
statement “it is important to help the people nearby; to care for their well-being.” For the
analysis, answers were recoded so that the absolute minimum level of agreement was 1 and the
absolute maximum was 9. The mean level of agreement was 7.46, very high for this scale.
Indeed, nearly all of the responses were between 5 and 9 for this value type. However, the
distribution had a trailing tail that made it slightly negatively skewed.
Figure 12. Question 19: Benevolence Value Type Agreement
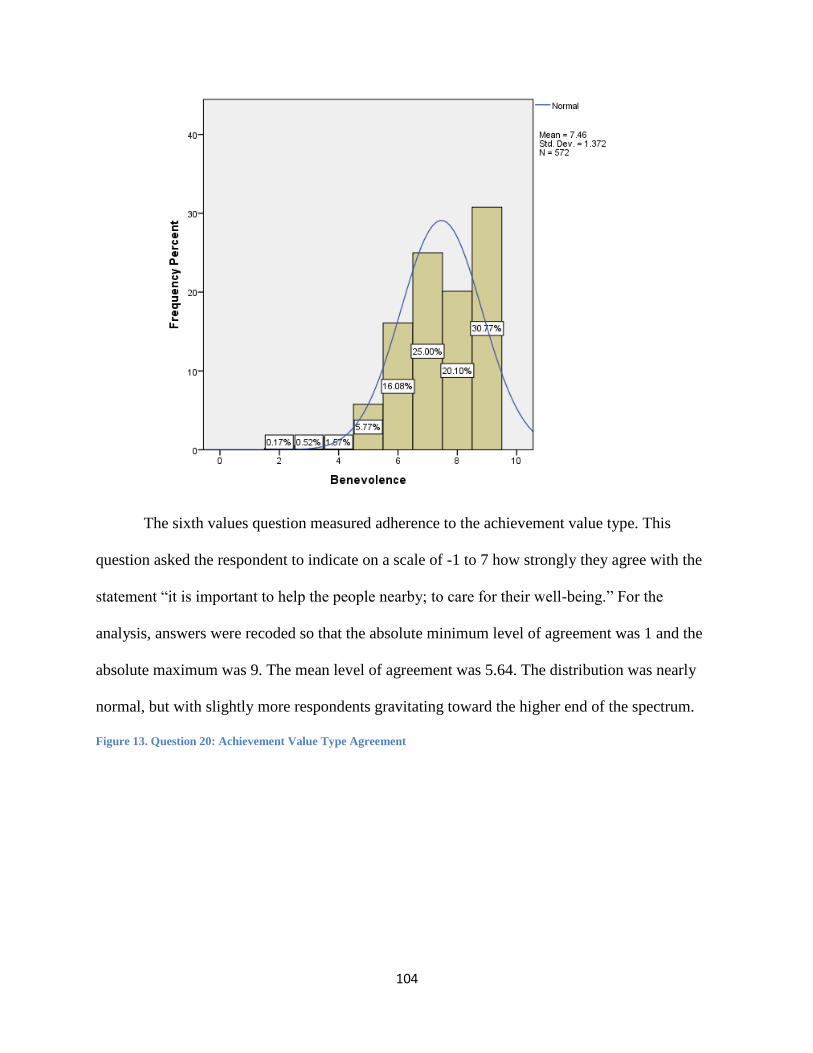
104
The sixth values question measured adherence to the achievement value type. This
question asked the respondent to indicate on a scale of -1 to 7 how strongly they agree with the
statement “it is important to help the people nearby; to care for their well-being.” For the
analysis, answers were recoded so that the absolute minimum level of agreement was 1 and the
absolute maximum was 9. The mean level of agreement was 5.64. The distribution was nearly
normal, but with slightly more respondents gravitating toward the higher end of the spectrum.
Figure 13. Question 20: Achievement Value Type Agreement
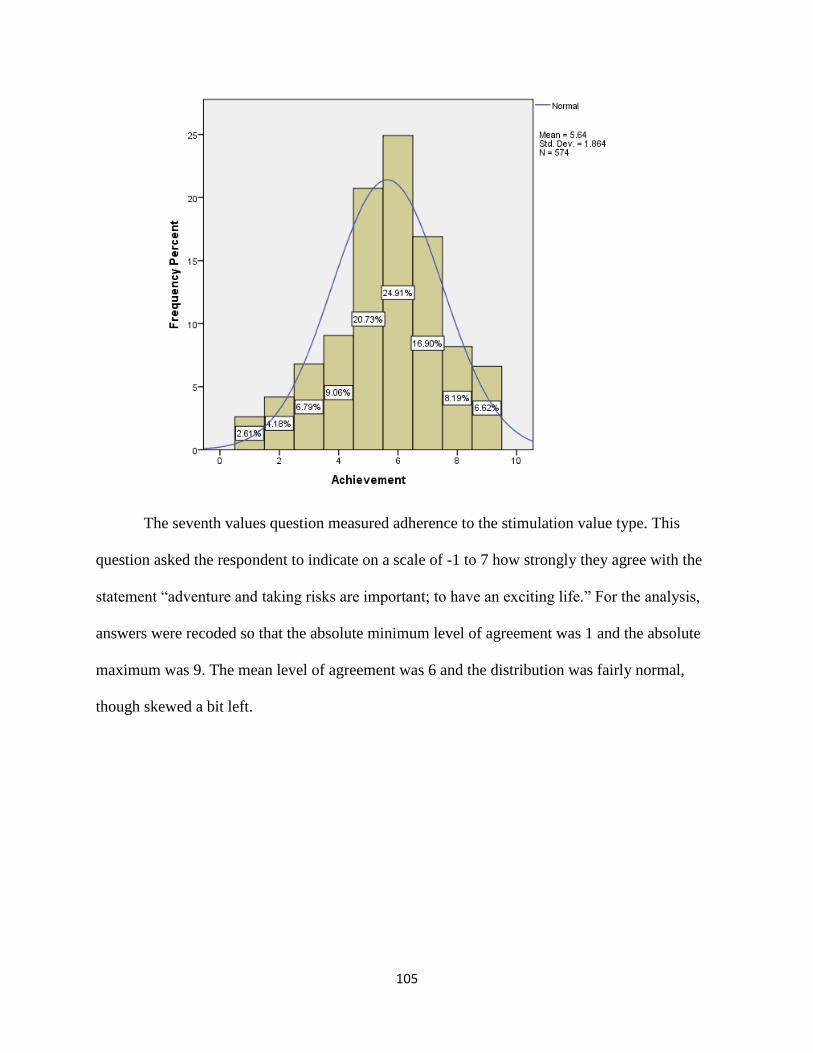
105
The seventh values question measured adherence to the stimulation value type. This
question asked the respondent to indicate on a scale of -1 to 7 how strongly they agree with the
statement “adventure and taking risks are important; to have an exciting life.” For the analysis,
answers were recoded so that the absolute minimum level of agreement was 1 and the absolute
maximum was 9. The mean level of agreement was 6 and the distribution was fairly normal,
though skewed a bit left.
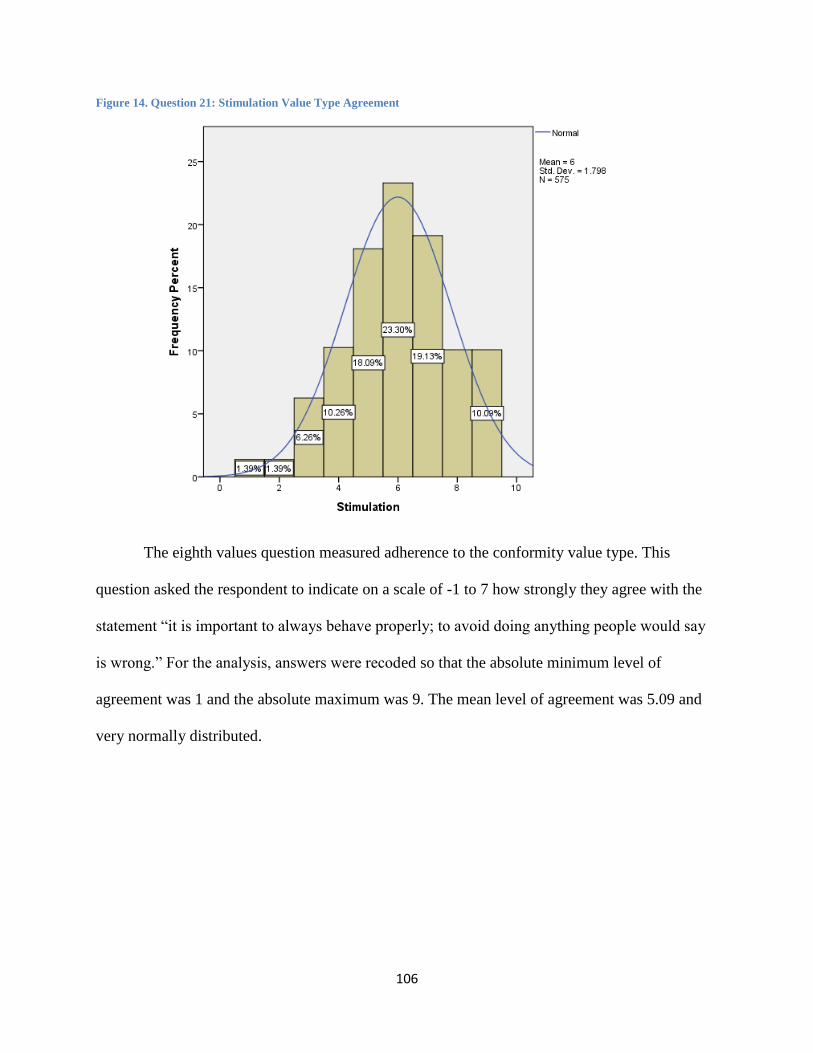
106
Figure 14. Question 21: Stimulation Value Type Agreement
The eighth values question measured adherence to the conformity value type. This
question asked the respondent to indicate on a scale of -1 to 7 how strongly they agree with the
statement “it is important to always behave properly; to avoid doing anything people would say
is wrong.” For the analysis, answers were recoded so that the absolute minimum level of
agreement was 1 and the absolute maximum was 9. The mean level of agreement was 5.09 and
very normally distributed.
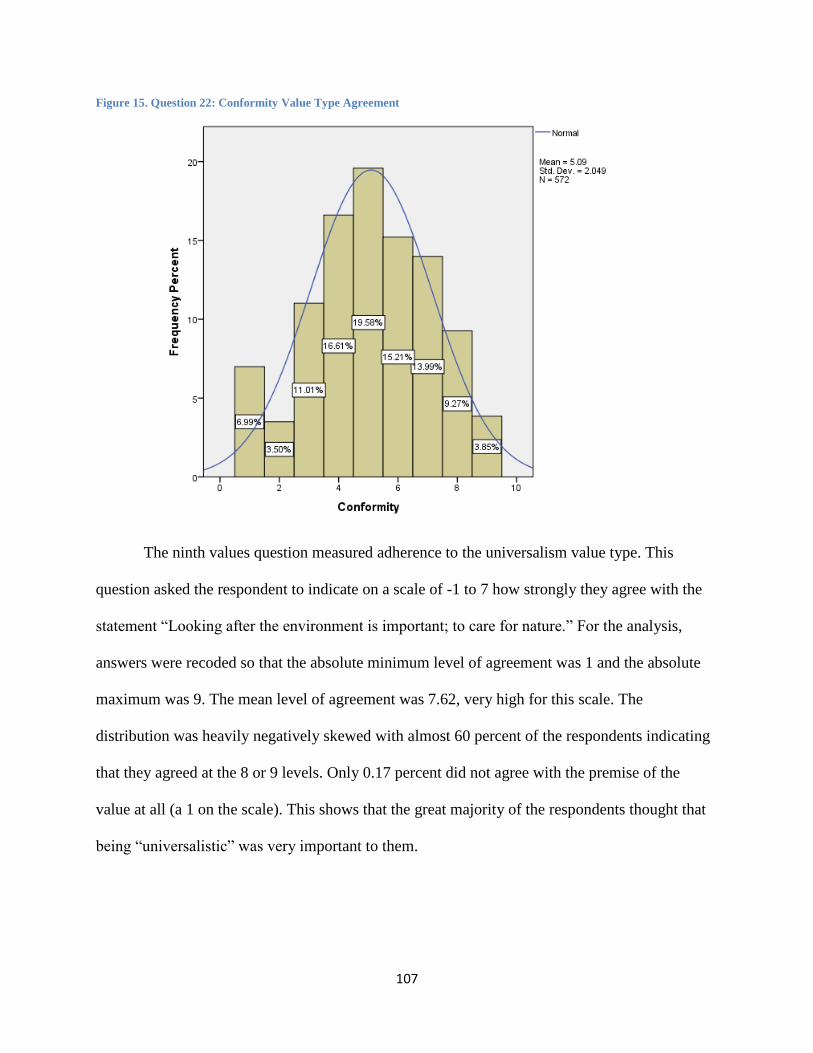
107
Figure 15. Question 22: Conformity Value Type Agreement
The ninth values question measured adherence to the universalism value type. This
question asked the respondent to indicate on a scale of -1 to 7 how strongly they agree with the
statement “Looking after the environment is important; to care for nature.” For the analysis,
answers were recoded so that the absolute minimum level of agreement was 1 and the absolute
maximum was 9. The mean level of agreement was 7.62, very high for this scale. The
distribution was heavily negatively skewed with almost 60 percent of the respondents indicating
that they agreed at the 8 or 9 levels. Only 0.17 percent did not agree with the premise of the
value at all (a 1 on the scale). This shows that the great majority of the respondents thought that
being “universalistic” was very important to them.
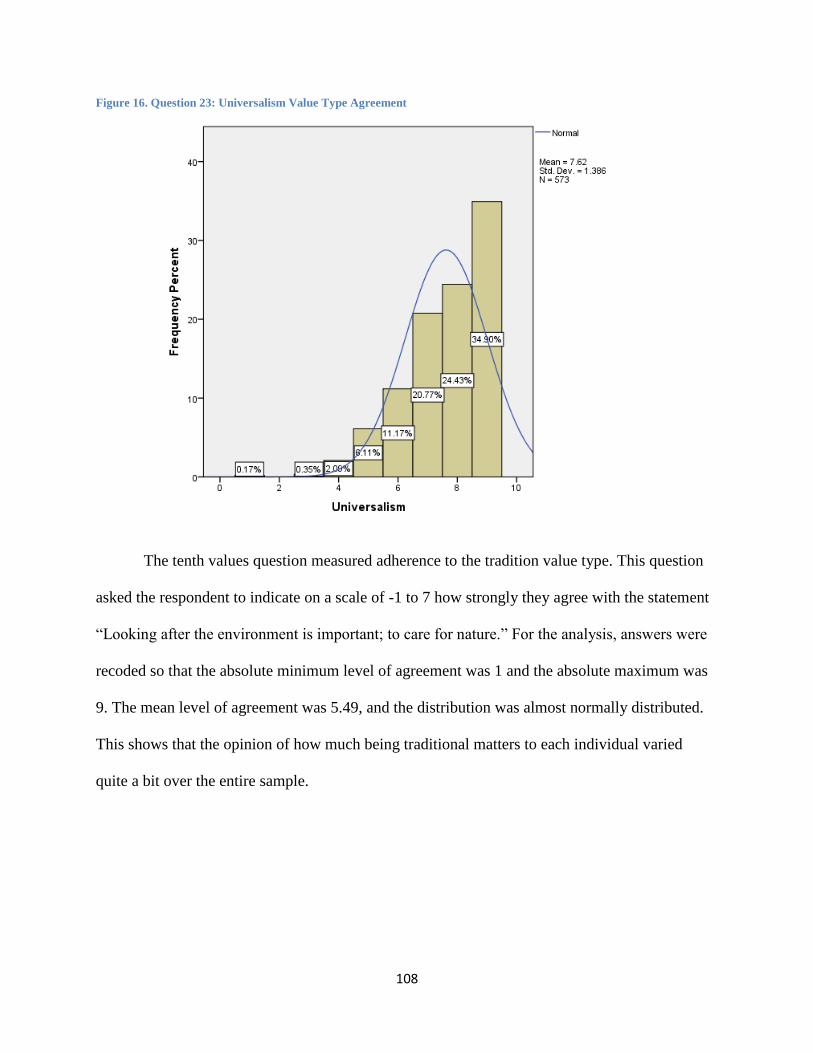
108
Figure 16. Question 23: Universalism Value Type Agreement
The tenth values question measured adherence to the tradition value type. This question
asked the respondent to indicate on a scale of -1 to 7 how strongly they agree with the statement
“Looking after the environment is important; to care for nature.” For the analysis, answers were
recoded so that the absolute minimum level of agreement was 1 and the absolute maximum was
9. The mean level of agreement was 5.49, and the distribution was almost normally distributed.
This shows that the opinion of how much being traditional matters to each individual varied
quite a bit over the entire sample.

109
Figure 17. Question 24: Tradition Value Type Agreement
Political Sophistication and Ideology Variables
The next set of questions deals with political sophistication, the primary dependent
variable in this study, and political ideology. Questions 25 through 34 – a total of ten questions –
measure each individual’s political knowledge using fact-based questions with only correct or
incorrect answers. Each of the ten questions were coded 0 for incorrect and 1 for correct. An
answer of “don’t know,” which was included as a response for each question, was coded as
incorrect, or a zero score. The ten political knowledge questions, their possible responses, and
the percent of the sample who answered each question correctly are given in the following table.
Table 4.14. Questions 25 through 34: Political Knowledge Descriptives
# Question Text Possible Answers % Correct N
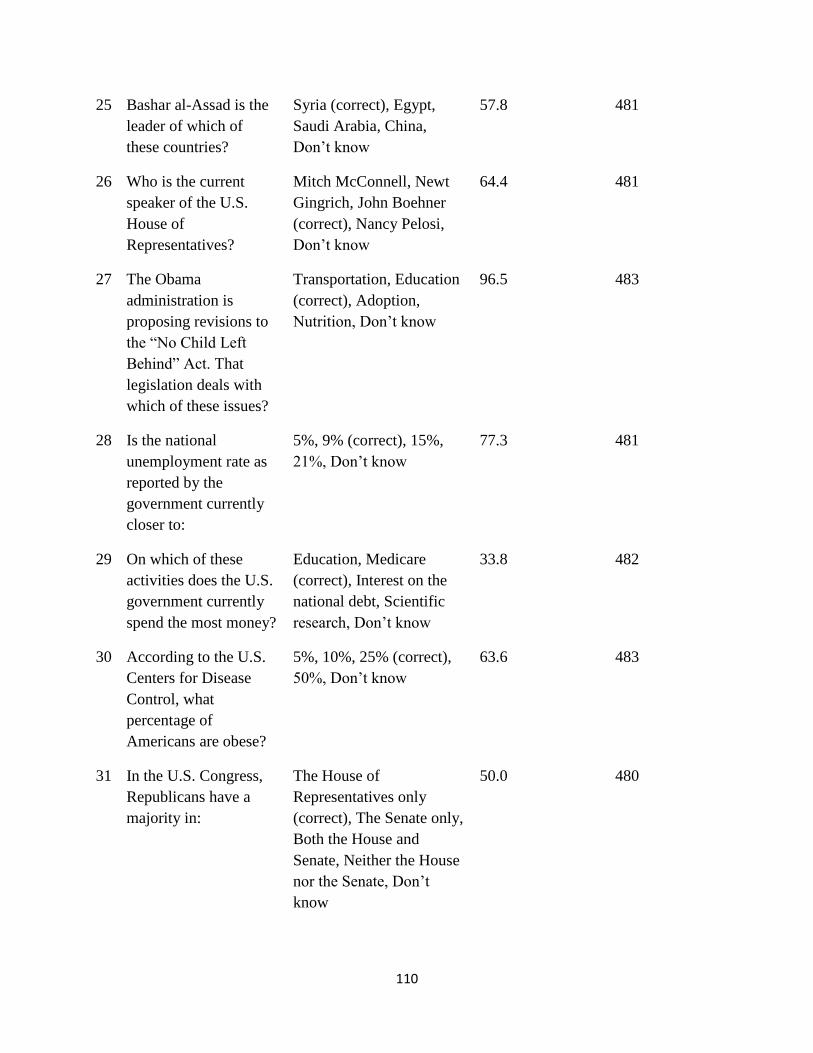
110
25 Bashar al-Assad is the
leader of which of
these countries?
Syria (correct), Egypt,
Saudi Arabia, China,
Don’t know
57.8 481
26 Who is the current
speaker of the U.S.
House of
Representatives?
Mitch McConnell, Newt
Gingrich, John Boehner
(correct), Nancy Pelosi,
Don’t know
64.4 481
27 The Obama
administration is
proposing revisions to
the “No Child Left
Behind” Act. That
legislation deals with
which of these issues?
Transportation, Education
(correct), Adoption,
Nutrition, Don’t know
96.5 483
28 Is the national
unemployment rate as
reported by the
government currently
closer to:
5%, 9% (correct), 15%,
21%, Don’t know
77.3 481
29 On which of these
activities does the U.S.
government currently
spend the most money?
Education, Medicare
(correct), Interest on the
national debt, Scientific
research, Don’t know
33.8 482
30 According to the U.S.
Centers for Disease
Control, what
percentage of
Americans are obese?
5%, 10%, 25% (correct),
50%, Don’t know
63.6 483
31 In the U.S. Congress,
Republicans have a
majority in:
The House of
Representatives only
(correct), The Senate only,
Both the House and
Senate, Neither the House
nor the Senate, Don’t
know
50.0 480

111
32 Is Hillary Clinton: Secretary of State
(correct), A senator, A
governor, An ambassador,
Don’t know
90.2 480
33 What issue was the
main focus of recent
protests by the Occupy
Wall Street group?
Same-sex marriage, Social
and economic inequality
(correct), Union rights for
public employees,
Agriculture subsidies,
Don’t know
91.1 483
34 Which source of
energy provides the
most electricity in the
U.S.?
Hydroelectric, Nuclear,
Coal (correct), Wind,
Don’t know
74.8 481
Of the ten questions, there were three that nearly everyone who responded knew the
correct answer to. The question with the most correct responses was question 27, which read “the
Obama administration is proposing revisions to the ‘No Child Left Behind’ Act. That legislation
deals with which of these issues?” Nearly 97 percent of the respondents answered question 27
correctly. The next question with the most correct responses was question 33, “what issue was
the main focus of recent protests by the Occupy Wall Street group?” which saw 91.1 percent of
respondents answer correctly. Coming in third was question 32, which asked what Hilary
Clinton’s role was in politics – this question garnered a 90.2 percent rate of correct responses.
The question that was the most difficult for the sample turned out to be question 29 “on which of
these activities does the U.S. government currently spend the most money?” The correct
response to that question was b (Medicare), but only 33.8 percent of respondents answered
correctly. A large portion of the sample (between 30 and 40 percent) did not know in which
house the Republican Party had a majority or which country Bashar al-Assad was in charge of.
112
The next three questions in this Section of the survey dealt with political ideology. The
first two question of the three (questions 35 and 36, respectively) ask “on a scale of 1 to 10, 10
being completely liberal, do you consider yourself conservative or liberal on matters of public or
private spending” and “on a scale of 1 to 10, 10 being completely liberal, do you consider
yourself conservative or liberal concerning social issues?” The third of the three (question 37)
asks “do you consider yourself to be a Democrat, Republican, or neither?” The first two
questions are meant to gauge the individual’s level of fiscal and social liberalism on a 10-point
scale. The third question simply measures the person’s political self-identification.
Overall, the respondents indicated that they were fairly fiscally liberal. The mean of the
responses to question 35 was 6.47 on a scale of 1 to 9, but the variance was large with the
standard deviation measuring 2.471. The distribution of the responses was negatively skewed
with 58.29 percent of the sample indicating a level of fiscal liberalism from 7 to 10 inclusive.
Nearly the same was true for the social liberalism measure, but those responses were even more
negatively skewed. Nearly 70 percent of the respondents indicated a level of social liberalism
from 8 to 10 inclusive and the mean was 7.78, even higher than the fiscal liberalism measure.
Since this survey was conducted at university communities, it was expected that the sample
would be biased toward liberalism which was indeed the case in the results.
Figure 18. Question 35: Fiscal Liberalism

113
Figure 19. Question 36: Social Liberalism
For question 37 which measured political affiliation, 55 percent indicated they identified
with the Democratic Party, while 34.38 percent indicated they identified with neither party; only
10.63 percent indicated that they identified as part of the Republican Party. This owes also to the
liberalness of university communities. This result was also expected due to that same liberal bias.
Figure 20. Question 37: Political Affiliation
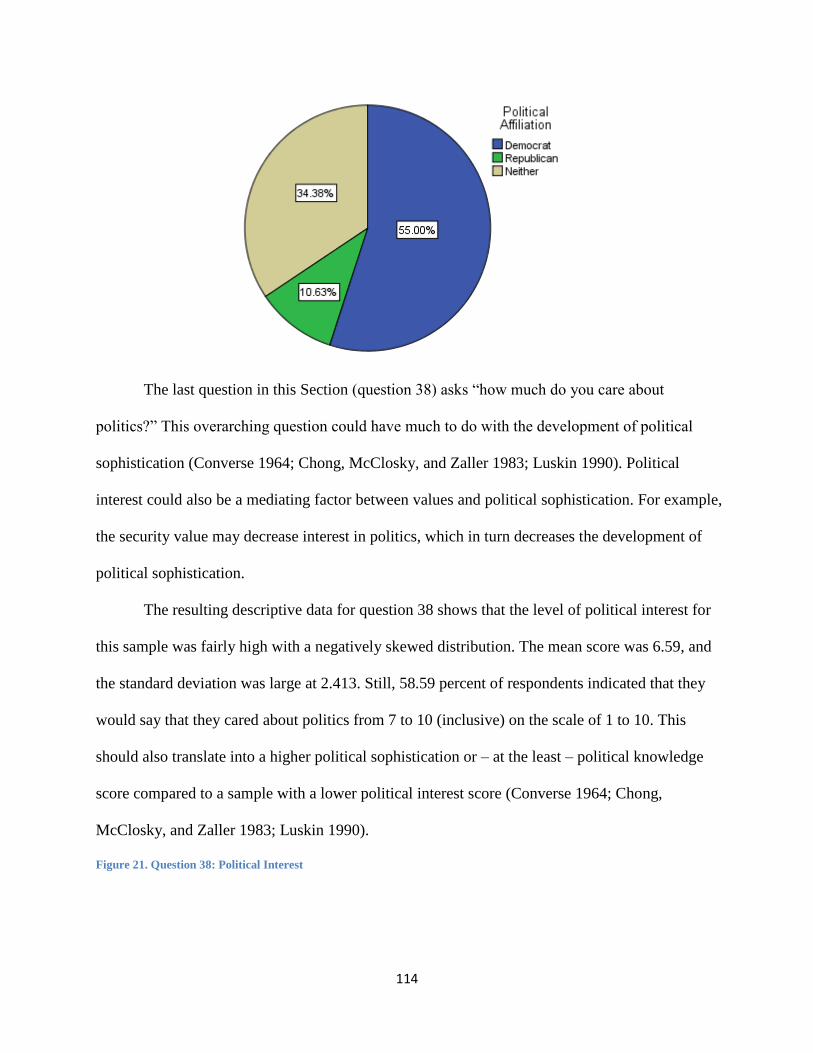
114
The last question in this Section (question 38) asks “how much do you care about
politics?” This overarching question could have much to do with the development of political
sophistication (Converse 1964; Chong, McClosky, and Zaller 1983; Luskin 1990). Political
interest could also be a mediating factor between values and political sophistication. For example,
the security value may decrease interest in politics, which in turn decreases the development of
political sophistication.
The resulting descriptive data for question 38 shows that the level of political interest for
this sample was fairly high with a negatively skewed distribution. The mean score was 6.59, and
the standard deviation was large at 2.413. Still, 58.59 percent of respondents indicated that they
would say that they cared about politics from 7 to 10 (inclusive) on the scale of 1 to 10. This
should also translate into a higher political sophistication or – at the least – political knowledge
score compared to a sample with a lower political interest score (Converse 1964; Chong,
McClosky, and Zaller 1983; Luskin 1990).
Figure 21. Question 38: Political Interest

115
Demographics
This Section of the descriptive data results presents the data from the demographics
portion of the survey. Question 39 asks what year the respondent was born. This was then
subtracted from the current year of the study in order to ascertain an age in years of each
respondent. The median age in years was 28. This is considerably younger than the median age
of the United States reported by the Census Bureau in 2012, which was 36.9 years of age. This
was expected due to the sample being from college communities in the region. Typically, these
communities are younger. Most of the respondents were between the ages of 18 and 40 years.
Figure 22. Question 39: Age
The next question asked in what zip code the person lived currently. Using the zip code
and statistics from the United States Census Bureau, the zip code provided was then converted

116
into a population density in persons per square miles. The average population density for the
sample was 2,335.42 persons per square mile. This was much larger than the United States
average of 84 persons per square mile, mostly due to the urbanized areas surveyed. Most
transient respondents, such as students would probably answer that they lived in the same or a
nearby zip code as their respective post-secondary institution. This may skew the results toward
the higher population densities even though the students didn’t consider themselves as being part
of that community. As such, the question in its current form is probably limited in its ability to
help explain deviations in social capital.
Question 41 asks the gender of each respondent. A little over 63 percent of the sample
responded that they were female compared to just 36.91 percent who responded they were male.
This obviously shows that females were overrepresented in the sample and almost doubled the
amount of respondents that were male.
Figure 23. Question 41: Gender
The next question asked the respondent to indicate how much income they make per year.
Available responses to this question were divided into six income ranges. These ranges were:
less than 20,000, 20,000 to 29,999, 30,000 to 49,999, 50,000 to 74,999, 75,000 to 99,999, and

117
100,000 or more. According to the data, lower income levels were slightly overrepresented in the
sample. The data indicated that 47.43 percent of respondents said that they made less than 20,000
a year. This contrasts with 39.80 percent who were below the 20,000 dollar personal income
level in 2010, according to the United States Census. The percent of respondents in the 20,000 to
29,999 level (15.44 percent) compared favorably to that of the US Census at 15.01 percent. The
30,000 to 49,999 level was underrepresented in the sample when compared to the US Census
numbers (12.68 percent versus 20.29 percent, respectively). All the other income levels
compared favorably with US Census numbers (50,000 to 74,999: 11.21 percent versus 12.86
percent; 75,000 to 99,999: 5.70 percent versus 5.29 percent; and over 100,000: 7.54 percent
versus 6.61 percent, respectively). This distribution of incomes, particularly the
overrepresentation of poorer income levels, was expected – once again – due to the use of
college communities as survey sites.
Figure 24. Question 42: Income
Question 43 asks what the highest level of education was that the respondent had
obtained. There were seven possible responses for this question: less than 12th grade,
diploma/GED, associate’s degree, some college, bachelor’s degree, master’s degree, and
doctoral/professional degree. Once again, due to the effect of surveying college communities,
some categories were underrepresented. For example, the less than 12th grade category was not
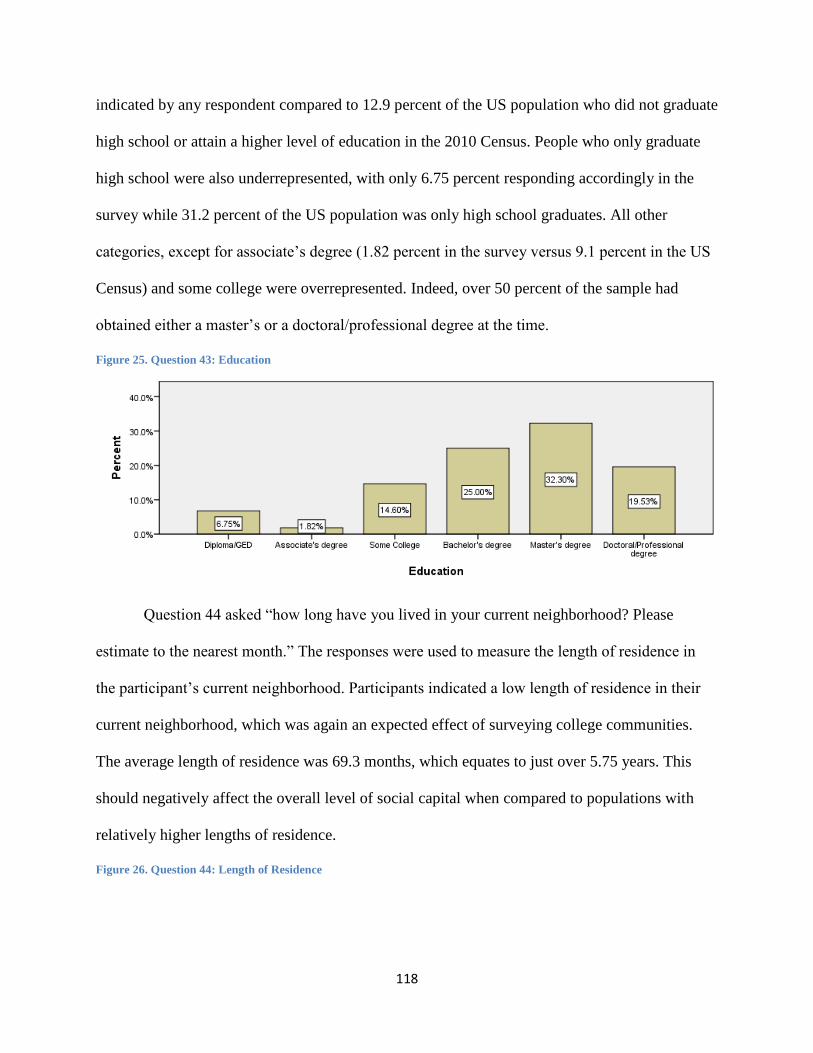
118
indicated by any respondent compared to 12.9 percent of the US population who did not graduate
high school or attain a higher level of education in the 2010 Census. People who only graduate
high school were also underrepresented, with only 6.75 percent responding accordingly in the
survey while 31.2 percent of the US population was only high school graduates. All other
categories, except for associate’s degree (1.82 percent in the survey versus 9.1 percent in the US
Census) and some college were overrepresented. Indeed, over 50 percent of the sample had
obtained either a master’s or a doctoral/professional degree at the time.
Figure 25. Question 43: Education
Question 44 asked “how long have you lived in your current neighborhood? Please
estimate to the nearest month.” The responses were used to measure the length of residence in
the participant’s current neighborhood. Participants indicated a low length of residence in their
current neighborhood, which was again an expected effect of surveying college communities.
The average length of residence was 69.3 months, which equates to just over 5.75 years. This
should negatively affect the overall level of social capital when compared to populations with
relatively higher lengths of residence.
Figure 26. Question 44: Length of Residence

119
The next question, question 45, asked “do you rent or own your residence?” Nearly 61
percent of the respondents indicated that they did not own their residence; rather, they rented
from another entity. Still, nearly 40 percent owned their own residence, but this rate still does not
compare favorably with the 65.4 percent home ownership rate reported by the US Census Bureau
in 2012. Once again, this effect is due to sampling a university-centered population.
Figure 27. Question 45: Residence Ownership
Occupation was the focus of question 46. Participants were asked to indicate what their
current occupation was and the responses were coded into categories. Given the survey sites,
51.39 percent of the respondents indicated that they were students. The next largest category was
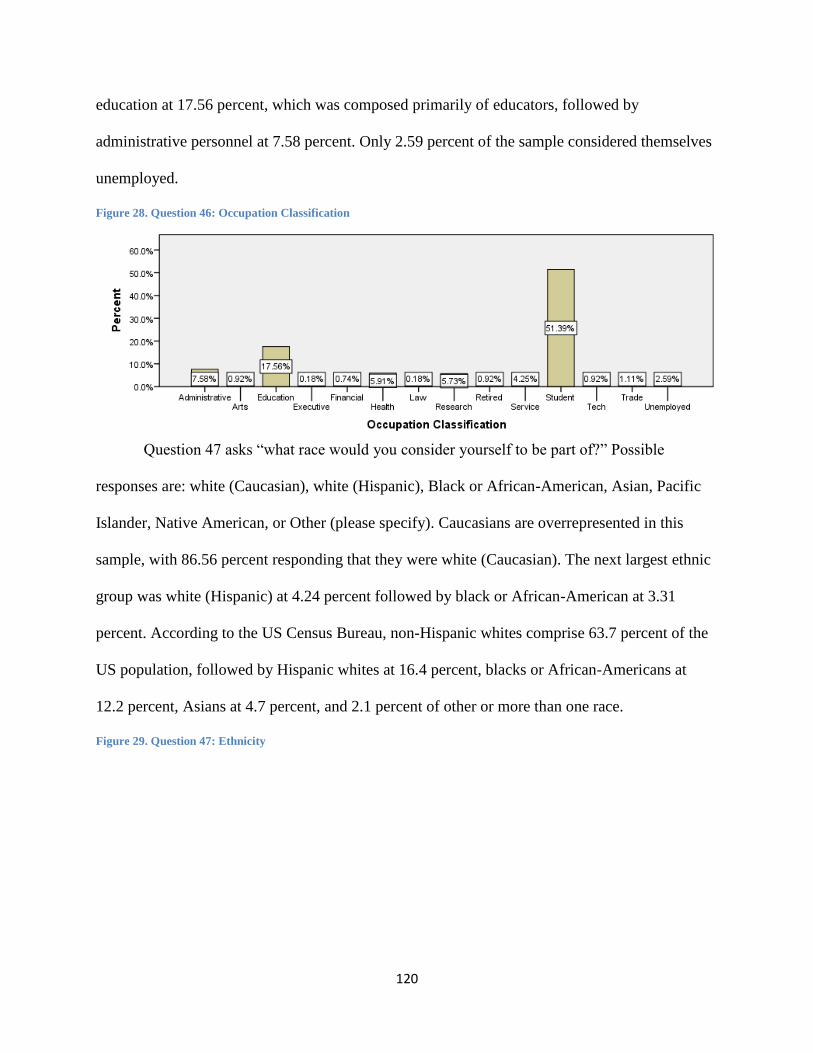
120
education at 17.56 percent, which was composed primarily of educators, followed by
administrative personnel at 7.58 percent. Only 2.59 percent of the sample considered themselves
unemployed.
Figure 28. Question 46: Occupation Classification
Question 47 asks “what race would you consider yourself to be part of?” Possible
responses are: white (Caucasian), white (Hispanic), Black or African-American, Asian, Pacific
Islander, Native American, or Other (please specify). Caucasians are overrepresented in this
sample, with 86.56 percent responding that they were white (Caucasian). The next largest ethnic
group was white (Hispanic) at 4.24 percent followed by black or African-American at 3.31
percent. According to the US Census Bureau, non-Hispanic whites comprise 63.7 percent of the
US population, followed by Hispanic whites at 16.4 percent, blacks or African-Americans at
12.2 percent, Asians at 4.7 percent, and 2.1 percent of other or more than one race.
Figure 29. Question 47: Ethnicity

121
The final question on the survey, question 48, asked “what religion do you most identify
with?” Possible responses included: Christian (Catholic), Christian (Protestant), Christian (non-
denominational), Islam (Sunni), Islam (Shiite), Judaism, Buddhism, Hinduism, Shinto, non-
religious, or other (please specify). The largest individual category of religious identification in
the survey was “non-religious” which was composed of 33.02 percent of the responses. The
second largest individual category was Christian (Catholic) at 21.52 percent follow closely by
Protestants (20.22 percent). Overall, 54.73 percent of the sample was Christian in some manner
of the word. According to the 2010 Census, the largest religious groups were: Protestant (51.3
percent), Catholic (23.9 percent), other Christian (3.3 percent), Jewish (1.7 percent), Buddhist
(0.7 percent), Muslim (0.6 percent), Hindu (0.4 percent), other religions (1.2 percent), and no
religion (16.1 percent). Hence, the non-religious and non-denominational Christian selections
were largely overrepresented in the sample, and Protestants were largely underrepresented.
Figure 30. Question 48: Religion

122
123
Results of the Political Sophistication Factor Analysis
After a factor analysis was run on all 10 original sophistication measures, it was determined that
only 7 would be included in the final scale measure used for political sophistication. Questions 3,
5, and 6 on the political knowledge portion of the survey instrument did not seem to be good
scale measures for the formulation of the political sophistication item. The Kuder-Richardson
Formula 20 (KR20) statisticfor the remaining 7 measures was a good 0.720.
Results of the Values Correlation Analysis
The Self-Direction Value Type
The self-direction value type measures how independent and self-guiding the respondents
were. The respondents indicated their agreement with the statement “it is important to think up
new ideas and be creative; to do things one’s own way.” While the initial statement responses
were given as a Likert scale from -1 to 7, the results were recoded as 1 to 9; hence, a 1 is
complete disagreement and a 9 is complete agreement.
Bivariate correlation analysis between the self-direction value type, political qualities,
and demographics show various results. No bivariate correlations between the political qualities
(political sophistication, political interest, fiscal liberalism, and social liberalism) were found to
be significant. However, all major demographic variables were found to significantly correlate
with self-direction.
Females appeared to have a statistically significant negative correlation with self-
direction. Given the sample size, even moderately weak correlations are often statistically
significant. On average, females scored the self-direction value type as less agreeable (7.39) than

124
males did (7.63). Nevertheless, both still scored the self-direction value relatively highly,
keeping in mind that the scale ranged from 1 through 9.
Income and education also showed a negative correlation with self-direction. The more
highly educated and wealthy a person is, the lower their agreement with self-direction. Perhaps
this correlation may stem from greater socialization into a profession or social clique as income
and education increase. Length of residence, ownership of residence, and age were also
negatively correlated with self-direction. The longer a person has lived in a community where he
or she has owned a home, the less likely that person is to agree with self-direction. This effect
could be due to these particular people realizing that they are a greater stakeholder in the
community and realizing that they must work as a team with that community in order to produce
better outcomes, rather than setting out on their own (self-direction) and distancing themselves
from the community in which they hold a greater stake.
Income showed a fairly stable negative trend as income rises. The maximum average
agreement with self-direction was for those people who made less than $20,000 a year (7.63)
while the minimum average was for those who made anywhere from $30,000 to $49,999 per
year (7.19), which was followed closely by those who made $100,000 or more per year (7.22).
Education also showed a fairly stable negative relationship as education increased. The
maximum average agreement with self-direction was for those who only had a diploma or GED
(8.00) while the minimum was for those who had a master’s degree (7.33).
Length of Residence showed a very negligible negative relationship as length of
residence rose. Ownership of a residence showed a slightly more pronounced negative trend for
those who owned their homes (7.53 for those who rented and 7.37 for those who owned).

125
The maximum self-direction by occupation classification belonged to those in the tech industry
(a little over 8) and the minimum to those who were employed as executives or in the financial
sector (just below 6).
By ethnicity, the minimum level of agreement belonged to those who identified as other
(7.10) and the maximum belonged to those who identified as Pacific Islander (9.00). Since the
Pacific Islander category only represented 1 respondent, Asians would then be the group who
agreed more with self-direction than any other ethnicity (8.18). Among whites, Hispanics agreed
more with self-direction (7.74) than Caucasians (7.44).
Concerning religious differences, Hindus have the highest level of agreement with self-
direction (if both categories of Islam and Shinto are excluded due to small numbers) while
Christian Protestants have the lowest level of self-direction. There also appears to be a slight
negative trend occurring as one ages.
Table 4.15. One-Tail Bivariate Pearson Correlations for Self-Direction Value Type
Political Sophistication -0.059 Political Interest 0.019 Fiscal Liberalism 0.019 Social Liberalism 0.050 Female -0.089** Income -0.136*** Education -0.077** Length of Residence -0.077** Ownership of Residence -0.059* Age -0.134*** * 10% significance ** 5% significance *** 1% significance
The Universalism Value Type
The universalism value type measures how socially and environmentally inclusive the
respondents were. The respondents indicated their agreement with the statement “looking after
126
the environment is important; to care for nature.” While the initial statement responses were
given as a Likert scale from -1 to 7, the results were recoded as 1 to 9; hence, a 1 is complete
disagreement and a 9 is complete agreement.
Bivariate correlation analysis between the universalism value type, political qualities, and
demographics show fairly uniform results. Bivariate correlations between the political qualities
(political sophistication, political interest, fiscal liberalism, and social liberalism) were all found
to be significant and positive. Of the major demographic variables, female, income, education,
and age were found to significantly and positively correlate with universalism (see table 4.16
below).
Political sophistication and political interest were found to correlate positively (0.097 and
0.149 respectively) with universalism. This indicates that political sophistication and interest
increase as agreement with the universalism statement increases. Furthermore, those who agreed
more readily with the universalism statement than others were also found more likely to be both
fiscally and socially liberal (0.236 and 0.232 respectively).
Females appeared to have a positive correlation with universalism. On average, females
scored the universalism value type as more agreeable (7.74) than males did (7.57). Nevertheless,
both still scored the universalism value relatively highly, keeping in mind that the scale ranged
from 1 through 9.
Income and education also showed a positive correlation with universalism. The more
highly educated and wealthy a person is, the higher their agreement with universalism. Age was
also positively correlated with universalism. The more life experience a person has, the more
likely that person is to agree with universalism.

127
Income showed a slightly unstable positive trend as income rises. The maximum average
agreement with universalism was for those people who made $20,000 to $29,999 per year (8.17)
while the minimum average was for those who made anywhere from $75,000 to $99,999 per
year (7.43), which was followed closely by those who made less than $20,000 per year (7.49).
Education showed a fairly stable positive trend as education increased. The maximum
average agreement with universalism was for those who had an associate’s degree (7.90) while
the minimum was for those who had only some college (7.38).
The maximum universalism by occupation classification belonged to those who were
retired (a little over 8) and the minimum to those who were unemployed (about 7).
By ethnicity, the minimum level of agreement belonged to those who identified as black
or African-American (7.06) and the maximum belonged to those who identified as Pacific
Islander (9.00). Since the Pacific Islander category only represented 1 respondent, white
Hispanics would then be the group who agreed more with universalism than any other ethnicity
(8.13). Among whites, Hispanics agreed more with universalism (8.13) than did Caucasians
(7.66).
Concerning religious differences, Hindus had the highest level of agreement with
universalism while non-denominational Christians have the lowest level of universalism. There
also appears to be a positive trend occurring as one ages.
Table 4.16. One-Tail Bivariate Pearson Correlations for Universalism Value Type
Political Sophistication 0.097** Political Interest 0.149*** Fiscal Liberalism 0.236*** Social Liberalism 0.232*** Female 0.061* Income 0.056* Education 0.104*** Length of Residence 0.029

128
Ownership of Residence 0.023 Age 0.138*** * 10% significance ** 5% significance *** 1% significance
The Benevolence Value Type
The benevolence value type measures how generous and how caring for others the
respondents were. The respondents indicated their agreement with the statement “it is important
to help the people nearby; to care for their well-being.” While the initial statement responses
were given as a Likert scale from -1 to 7, the results were recoded as 1 to 9; hence, a 1 is
complete disagreement and a 9 is complete agreement.
Bivariate correlation analysis between the benevolence value type, political qualities, and
demographics show various results. Bivariate correlations between some of the political qualities
(political sophistication, political interest, fiscal liberalism, and social liberalism) were found to
be significant and positive. Of the major demographic variables, only the female variable was
found to significantly and positively correlate with benevolence.
Political sophistication was not found to significantly correlate with benevolence, but
political interest was found to significantly and positively correlate (0.092) with benevolence.
This indicates that political interest increases as agreement with the benevolence statement
increases. Furthermore, those who agreed more readily with the benevolence statement than
others were also found more likely to be fiscally liberal (0.192).
Females appeared to have a positive correlation with benevolence (0.125). On average,
females scored the benevolence value type as more agreeable (7.62) than males did (7.28).
Nevertheless, both still scored the benevolence value relatively highly, keeping in mind that the
scale ranged from 1 through 9.
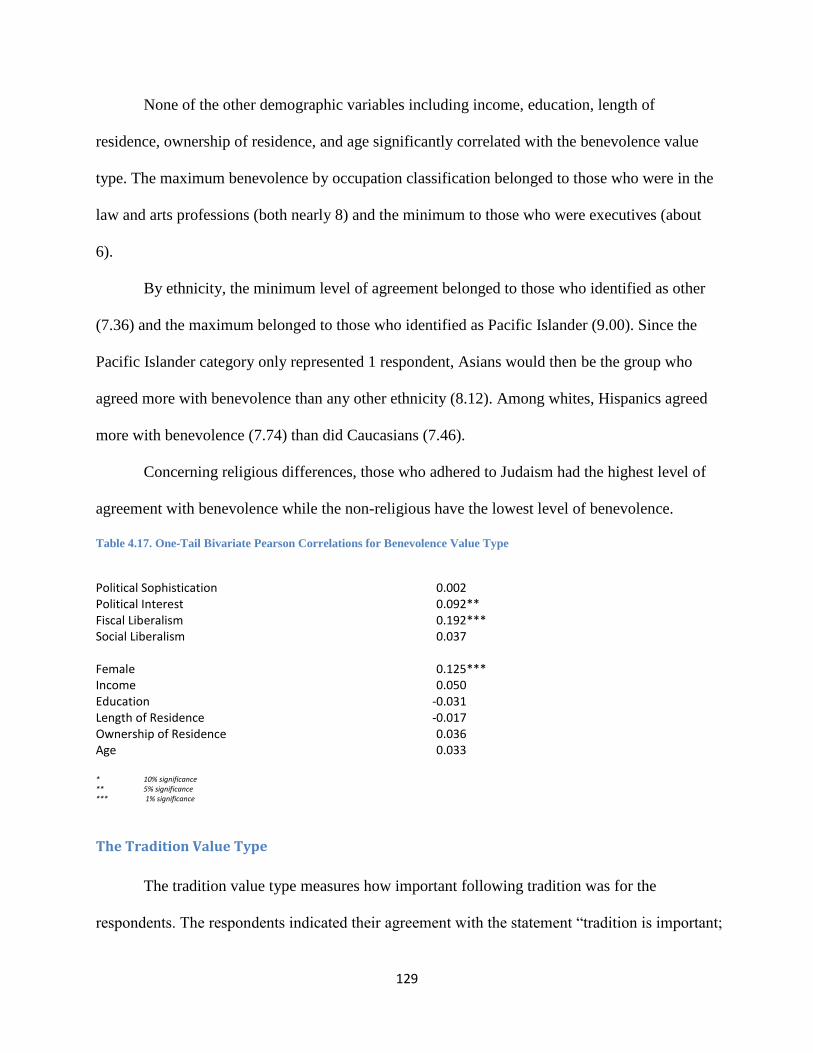
129
None of the other demographic variables including income, education, length of
residence, ownership of residence, and age significantly correlated with the benevolence value
type. The maximum benevolence by occupation classification belonged to those who were in the
law and arts professions (both nearly 8) and the minimum to those who were executives (about
6).
By ethnicity, the minimum level of agreement belonged to those who identified as other
(7.36) and the maximum belonged to those who identified as Pacific Islander (9.00). Since the
Pacific Islander category only represented 1 respondent, Asians would then be the group who
agreed more with benevolence than any other ethnicity (8.12). Among whites, Hispanics agreed
more with benevolence (7.74) than did Caucasians (7.46).
Concerning religious differences, those who adhered to Judaism had the highest level of
agreement with benevolence while the non-religious have the lowest level of benevolence.
Table 4.17. One-Tail Bivariate Pearson Correlations for Benevolence Value Type
Political Sophistication 0.002 Political Interest 0.092** Fiscal Liberalism 0.192*** Social Liberalism 0.037 Female 0.125*** Income 0.050 Education -0.031 Length of Residence -0.017 Ownership of Residence 0.036 Age 0.033 * 10% significance ** 5% significance *** 1% significance
The Tradition Value Type
The tradition value type measures how important following tradition was for the
respondents. The respondents indicated their agreement with the statement “tradition is important;
130
to follow the customs handed down by one’s religion or family.” While the initial statement
responses were given as a Likert scale from -1 to 7, the results were recoded as 1 to 9; hence, a 1
is complete disagreement and a 9 is complete agreement.
Bivariate correlation analysis between the tradition value type, political qualities, and
demographics show various results. Bivariate correlations between all of the political qualities
(political sophistication, political interest, fiscal liberalism, and social liberalism) were found to
be significant and negative. Of the major demographic variables, the education and length of
residence variables were found to significantly and negatively correlate with tradition. The
female variable was found to correlate with an increase in agreement with tradition.
Political sophistication and political interest were found to significantly and negatively
correlate (-0.162 and -0.151 respectively) with tradition. This indicates that both political
sophistication and interest decrease as agreement with the tradition statement increases.
Furthermore, those who agreed more readily with the tradition statement than others were also
found less likely to be both fiscally and socially liberal (-0.230 and -0.317 respectively).
Females appeared to have a positive correlation with tradition (0.066). On average,
females scored the tradition value type as more agreeable (5.59) than males did (5.32). Both
scored the tradition value somewhat highly, keeping in mind that the scale ranged from 1 through
9.
None of the other demographic variables including income, ownership of residence, and
age significantly correlated with the tradition value type.
The maximum tradition by occupation classification belonged to those who were in the
law profession and those who were unemployed (both nearly 7) and the minimum to those who
were retired (about 3.5).

131
By ethnicity, the minimum level of agreement belonged to those who identified as other
(5.38) and the maximum belonged to those who identified as Pacific Islander (9.00). Since the
Pacific Islander category only represented 1 respondent, Asians would then be the group who
agreed more with tradition than any other ethnicity (7.12). Among whites, Hispanics agreed
more with tradition (6.04) than did Caucasians (5.38).
Concerning religious differences, those who adhered to Hinduism had the highest level of
agreement with tradition while the non-religious have the lowest level of tradition agreement.
Table 4.18. One-Tail Bivariate Pearson Correlations for Tradition Value Type
Political Sophistication -0.162*** Political Interest -0.151*** Fiscal Liberalism -0.230*** Social Liberalism -0.317*** Female 0.066* Income -0.014 Education -0.177*** Length of Residence 0.109*** Ownership of Residence 0.033 Age 0.030 * 10% significance ** 5% significance *** 1% significance
The Conformity Value Type
The conformity value type measures how important a sense of belonging and rule-
following was for the respondents. The respondents indicated their agreement with the statement
“it is important to always behave properly; to avoid doing anything people would say is wrong.”
While the initial statement responses were given as a Likert scale from -1 to 7, the results were
recoded as 1 to 9; hence, a 1 is complete disagreement and a 9 is complete agreement.
Bivariate correlation analysis between the conformity value type, political qualities, and
demographics show various results. Bivariate correlations between all of the political qualities
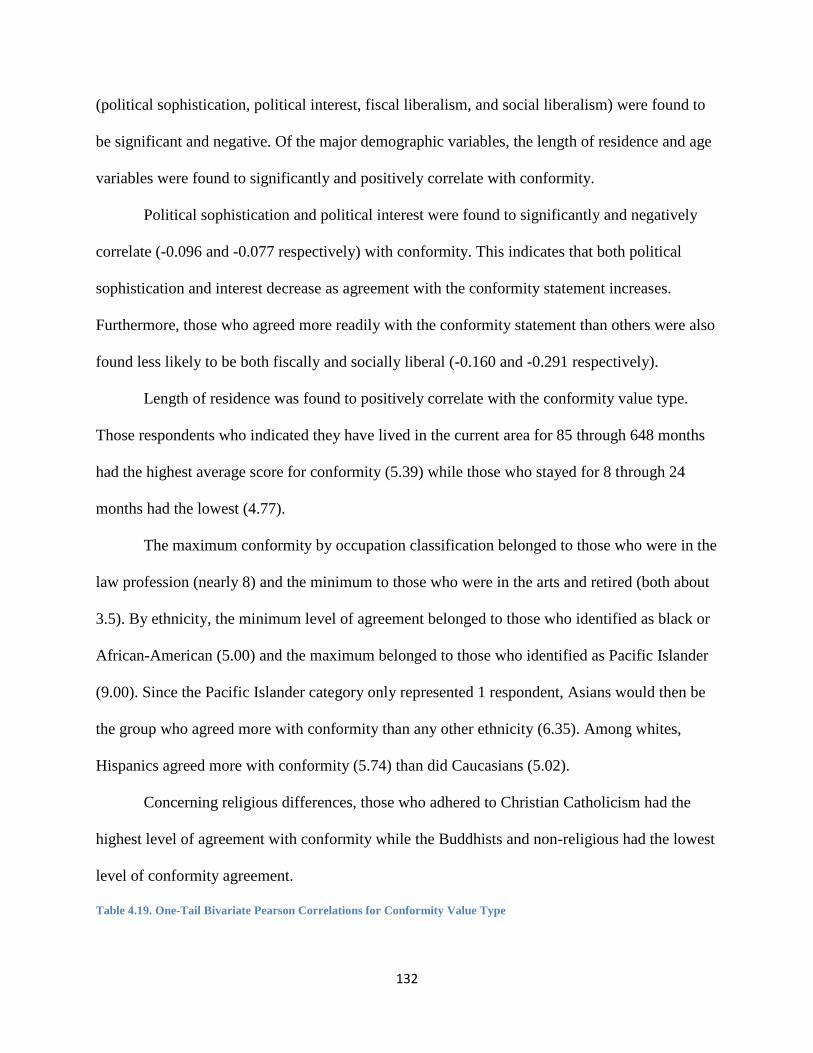
132
(political sophistication, political interest, fiscal liberalism, and social liberalism) were found to
be significant and negative. Of the major demographic variables, the length of residence and age
variables were found to significantly and positively correlate with conformity.
Political sophistication and political interest were found to significantly and negatively
correlate (-0.096 and -0.077 respectively) with conformity. This indicates that both political
sophistication and interest decrease as agreement with the conformity statement increases.
Furthermore, those who agreed more readily with the conformity statement than others were also
found less likely to be both fiscally and socially liberal (-0.160 and -0.291 respectively).
Length of residence was found to positively correlate with the conformity value type.
Those respondents who indicated they have lived in the current area for 85 through 648 months
had the highest average score for conformity (5.39) while those who stayed for 8 through 24
months had the lowest (4.77).
The maximum conformity by occupation classification belonged to those who were in the
law profession (nearly 8) and the minimum to those who were in the arts and retired (both about
3.5). By ethnicity, the minimum level of agreement belonged to those who identified as black or
African-American (5.00) and the maximum belonged to those who identified as Pacific Islander
(9.00). Since the Pacific Islander category only represented 1 respondent, Asians would then be
the group who agreed more with conformity than any other ethnicity (6.35). Among whites,
Hispanics agreed more with conformity (5.74) than did Caucasians (5.02).
Concerning religious differences, those who adhered to Christian Catholicism had the
highest level of agreement with conformity while the Buddhists and non-religious had the lowest
level of conformity agreement.
Table 4.19. One-Tail Bivariate Pearson Correlations for Conformity Value Type
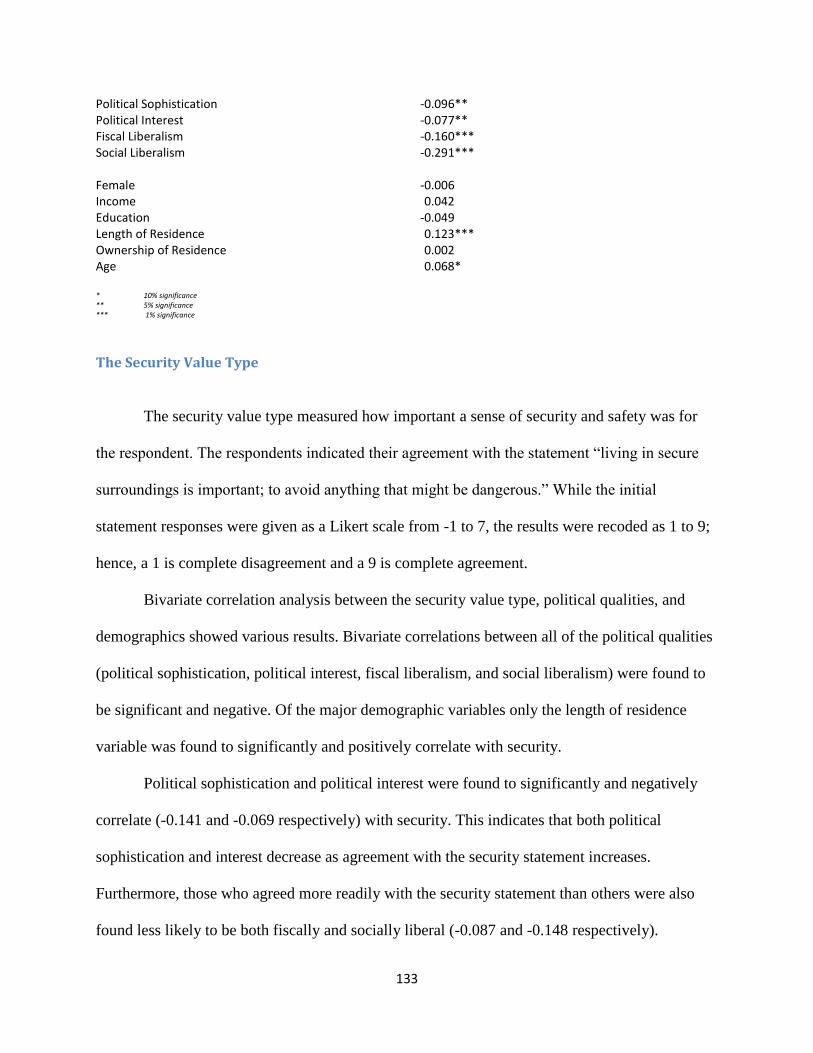
133
Political Sophistication -0.096** Political Interest -0.077** Fiscal Liberalism -0.160*** Social Liberalism -0.291*** Female -0.006 Income 0.042 Education -0.049 Length of Residence 0.123*** Ownership of Residence 0.002 Age 0.068* * 10% significance ** 5% significance *** 1% significance
The Security Value Type
The security value type measured how important a sense of security and safety was for
the respondent. The respondents indicated their agreement with the statement “living in secure
surroundings is important; to avoid anything that might be dangerous.” While the initial
statement responses were given as a Likert scale from -1 to 7, the results were recoded as 1 to 9;
hence, a 1 is complete disagreement and a 9 is complete agreement.
Bivariate correlation analysis between the security value type, political qualities, and
demographics showed various results. Bivariate correlations between all of the political qualities
(political sophistication, political interest, fiscal liberalism, and social liberalism) were found to
be significant and negative. Of the major demographic variables only the length of residence
variable was found to significantly and positively correlate with security.
Political sophistication and political interest were found to significantly and negatively
correlate (-0.141 and -0.069 respectively) with security. This indicates that both political
sophistication and interest decrease as agreement with the security statement increases.
Furthermore, those who agreed more readily with the security statement than others were also
found less likely to be both fiscally and socially liberal (-0.087 and -0.148 respectively).

134
Length of residence was found to positively correlate with the security value type. Those
respondents who indicated they have lived in the current area for 85 through 648 months had the
highest average score for security (6.74) while those who stayed for 8 through 24 months had the
lowest (6.25).
The maximum security by occupation classification belonged to those who were in the
law profession (about 7) and the minimum to those who were in the executive and financial
sectors (both around 5.75).
By ethnicity, the minimum level of agreement belonged to those who identified as other
(5.73) and the maximum belonged to those who identified as Pacific Islander (9.00). Since the
Pacific Islander category only represented 1 respondent, Asians would then be the group who
agreed more with security than any other ethnicity (7.59). Among whites, Hispanics agreed more
with security (6.87) than did Caucasians (6.38).
Concerning religious differences, those who adhered to Christian Catholicism had the
highest level of agreement with security while the Buddhists and non-religious had the lowest
level of security agreement.
Table 4.20. One-Tail Bivariate Pearson Correlations for Security Value Type
Political Sophistication -0.141*** Political Interest -0.069* Fiscal Liberalism -0.087** Social Liberalism -0.148*** Female 0.050 Income 0.011 Education -0.029 Length of Residence 0.091** Ownership of Residence 0.009 Age 0.045 * 10% significance ** 5% significance *** 1% significance

135
The Power Value Type
The power value type measured how important a sense of power and control was for the
respondent. The respondents indicated their agreement with the statement “it is important to be
rich; to have a lot of money and expensive things.” While the initial statement responses were
given as a Likert scale from -1 to 7, the results were recoded as 1 to 9; hence, a 1 is complete
disagreement and a 9 is complete agreement.
Bivariate correlation analysis between the power value type, political qualities, and
demographics showed consistent results. Bivariate correlations between all of the political
qualities (political sophistication, political interest, fiscal liberalism, and social liberalism) were
found to be significant and negative. Of the major demographic variables the female, education,
and age variables were found to significantly and negatively correlate with power.
Political sophistication and political interest were found to significantly and negatively
correlate (-0.144 and -0.086 respectively) with power. This indicates that both political
sophistication and interest decrease as agreement with the power statement increases.
Furthermore, those who agreed more readily with the power statement than others were also
found less likely to be both fiscally and socially liberal (-0.146 and -0.114 respectively).
Females appeared to have a negative correlation with power (-0.111). On average,
females scored the power value type as less agreeable (3.45) than did males (3.87). Both scored
the power value fairly low, keeping in mind that the scale ranged from 1 through 9.
Education was found to negatively correlate with the power value type. Those
respondents who indicated they had at most a diploma or GED had the highest average score for
power (4.53) while those who indicated they had an associate’s degree had the lowest (3.00)
followed by those who indicated they had a master’s degree (3.38). The maximum power by
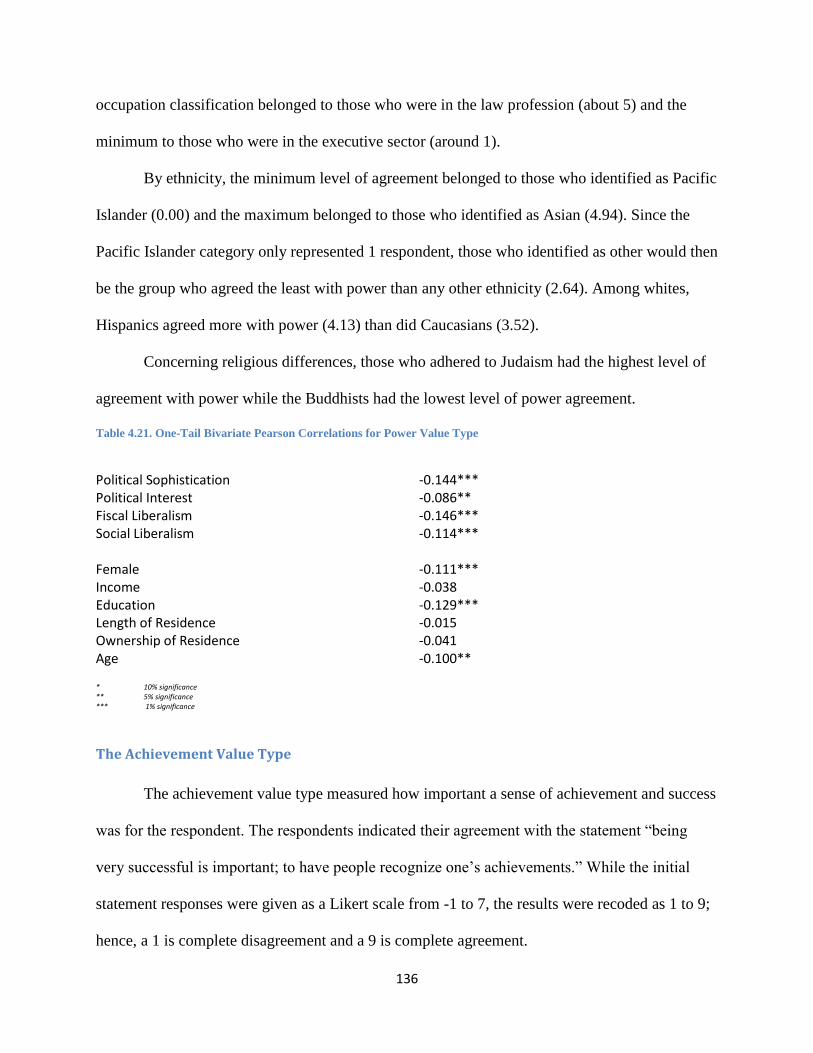
136
occupation classification belonged to those who were in the law profession (about 5) and the
minimum to those who were in the executive sector (around 1).
By ethnicity, the minimum level of agreement belonged to those who identified as Pacific
Islander (0.00) and the maximum belonged to those who identified as Asian (4.94). Since the
Pacific Islander category only represented 1 respondent, those who identified as other would then
be the group who agreed the least with power than any other ethnicity (2.64). Among whites,
Hispanics agreed more with power (4.13) than did Caucasians (3.52).
Concerning religious differences, those who adhered to Judaism had the highest level of
agreement with power while the Buddhists had the lowest level of power agreement.
Table 4.21. One-Tail Bivariate Pearson Correlations for Power Value Type
Political Sophistication -0.144*** Political Interest -0.086** Fiscal Liberalism -0.146*** Social Liberalism -0.114*** Female -0.111*** Income -0.038 Education -0.129*** Length of Residence -0.015 Ownership of Residence -0.041 Age -0.100** * 10% significance ** 5% significance *** 1% significance
The Achievement Value Type
The achievement value type measured how important a sense of achievement and success
was for the respondent. The respondents indicated their agreement with the statement “being
very successful is important; to have people recognize one’s achievements.” While the initial
statement responses were given as a Likert scale from -1 to 7, the results were recoded as 1 to 9;
hence, a 1 is complete disagreement and a 9 is complete agreement.

137
Bivariate correlation analysis between the achievement value type, political qualities, and
demographics showed fairly consistent results. Bivariate correlations between one of the political
qualities (political sophistication) were found to be significant and negative. Of the major
demographic variables the education, ownership of residence, and age variables were found to
significantly and negatively correlate with achievement.
Political sophistication was found to significantly and negatively correlate (-0.107) with
achievement. This indicates that political sophistication decreases as agreement with the
achievement statement increases. Education was found to negatively correlate with the
achievement value type. Those respondents who indicated they had at most a diploma or GED
had the highest average score for achievement (6.86) while those who indicated they had an
associate’s degree had the lowest (4.00) followed by those who indicated they had a master’s
degree (5.38).
The maximum achievement by occupation classification belonged to those who were in
the law profession (about 7) and the minimum to those who were in the retired classification
(around 5). By ethnicity, the minimum level of agreement belonged to those who identified as
Caucasian (5.46) and the maximum belonged to those who identified as Pacific Islander 9.00).
Since the Pacific Islander category only represented 1 respondent, those who identified as Asian
would then be the group who agreed the least with achievement than any other ethnicity (7.29).
Among whites, Hispanics agreed more with achievement (6.39) than did Caucasians (5.46).
Concerning religious differences, those who adhered to Hinduism had the highest level of
agreement with achievement while the Buddhists had the lowest level of achievement agreement.
Table 4.22. One-Tail Bivariate Pearson Correlations for Achievement Value Type
Political Sophistication -0.107** Political Interest 0.050

138
Fiscal Liberalism -0.010 Social Liberalism -0.007 Female -0.038 Income -0.007 Education -0.133*** Length of Residence -0.037 Ownership of Residence -0.110*** Age -0.159*** * 10% significance ** 5% significance *** 1% significance
The Hedonism Value Type
The hedonism value type measured how important spoiling oneself was for the
respondent. The respondents indicated their agreement with the statement “it is important to have
a good time; to “spoil” oneself.”” While the initial statement responses were given as a Likert
scale from -1 to 7, the results were recoded as 1 to 9; hence, a 1 is complete disagreement and a 9
is complete agreement.
Bivariate correlation analysis between the hedonism value type, political qualities, and
demographics showed fairly consistent results. Bivariate correlations between three of the
political qualities (political sophistication, political interest, and social liberalism) were found to
be significant and negative for the first two and significant and positive for the last. All of the
major demographic variables were found to significantly and negatively correlate with hedonism.
Political sophistication and political interest were found to significantly and negatively
correlate (-0.155 and -0.095 respectively) with hedonism. This indicates that political
sophistication decrease as agreement with the hedonism statement increases. Furthermore, those
who agreed more readily with the hedonism statement than others were also found more likely to
be socially liberal (-0.083).
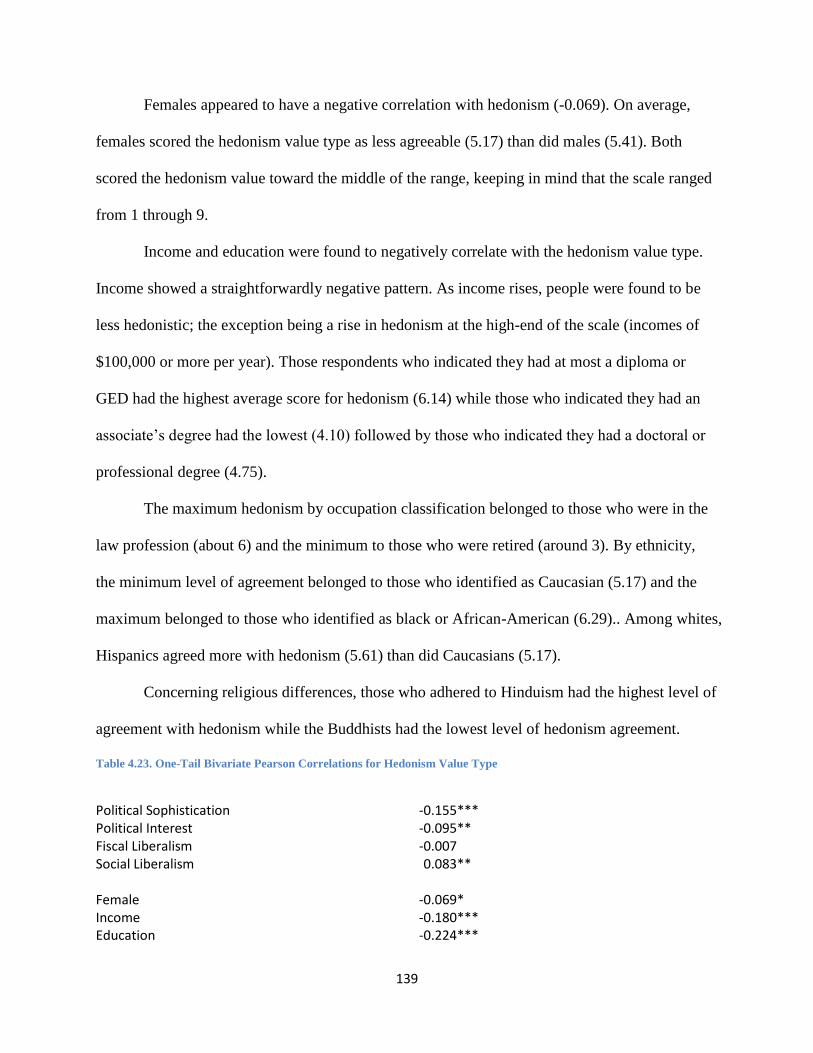
139
Females appeared to have a negative correlation with hedonism (-0.069). On average,
females scored the hedonism value type as less agreeable (5.17) than did males (5.41). Both
scored the hedonism value toward the middle of the range, keeping in mind that the scale ranged
from 1 through 9.
Income and education were found to negatively correlate with the hedonism value type.
Income showed a straightforwardly negative pattern. As income rises, people were found to be
less hedonistic; the exception being a rise in hedonism at the high-end of the scale (incomes of
$100,000 or more per year). Those respondents who indicated they had at most a diploma or
GED had the highest average score for hedonism (6.14) while those who indicated they had an
associate’s degree had the lowest (4.10) followed by those who indicated they had a doctoral or
professional degree (4.75).
The maximum hedonism by occupation classification belonged to those who were in the
law profession (about 6) and the minimum to those who were retired (around 3). By ethnicity,
the minimum level of agreement belonged to those who identified as Caucasian (5.17) and the
maximum belonged to those who identified as black or African-American (6.29).. Among whites,
Hispanics agreed more with hedonism (5.61) than did Caucasians (5.17).
Concerning religious differences, those who adhered to Hinduism had the highest level of
agreement with hedonism while the Buddhists had the lowest level of hedonism agreement.
Table 4.23. One-Tail Bivariate Pearson Correlations for Hedonism Value Type
Political Sophistication -0.155*** Political Interest -0.095** Fiscal Liberalism -0.007 Social Liberalism 0.083** Female -0.069* Income -0.180*** Education -0.224***

140
Length of Residence -0.096** Ownership of Residence -0.202*** Age -0.265*** * 10% significance ** 5% significance *** 1% significance
The Stimulation Value Type
The stimulation value type measured how important a sense of risk and excitement was
for the respondent. The respondents indicated their agreement with the statement “adventure and
taking risks are important; to have an exciting life” While the initial statement responses were
given as a Likert scale from -1 to 7, the results were recoded as 1 to 9; hence, a 1 is complete
disagreement and a 9 is complete agreement.
Bivariate correlation analysis between the stimulation value type, political qualities, and
demographics showed consistent results. Bivariate correlations between one of the political
qualities (political sophistication) were found to be significant and negative. All of the major
demographic variables were found to significantly and negatively correlate with stimulation.
Political sophistication was found to significantly and negatively correlate (-0.130) with
stimulation. This indicates that political sophistication decreases as agreement with the
stimulation statement increases.
Females appeared to have a negative correlation with stimulation (-0.132). On average,
females scored the stimulation value type as less agreeable (5.79) than did males (6.28). Both
scored the stimulation value somewhat highly, keeping in mind that the scale ranged from 1
through 9.
Income and education were found to negatively correlate with the stimulation value type.
Income showed a stable negative trend but rose with the highest income bracket and for those

141
between $50,000 and $74,999 per year. Those respondents who indicated they had at most a
diploma or GED had the highest average score for stimulation (7.15) while those who indicated
they had an associate’s degree had the lowest (5.30) followed by those who indicated they had a
doctoral or professional degree (5.60). The same trend followed for the remaining demographic
variables included in the correlation analysis.
The maximum stimulation by occupation classification belonged to those who were in the
trade profession (about 7) and the minimum to those who were in the financial sector (around 4).
By ethnicity, the minimum level of agreement belonged to those who identified as other
(5.73) and the maximum belonged to those who identified as Asian (6.14). Among whites,
Hispanics agreed more with stimulation (6.22) than did Caucasians (5.93). Concerning religious
differences, those who adhered to Hinduism had the highest level of agreement with stimulation
while the non-religious had the lowest level of stimulation agreement.
Table 4.24. One-Tail Bivariate Pearson Correlations for Stimulation Value Type
Political Sophistication -0.130*** Political Interest -0.023 Fiscal Liberalism -0.030 Social Liberalism 0.044 Female -0.132*** Income -0.166*** Education -0.235*** Length of Residence -0.160*** Ownership of Residence -0.166*** Age -0.278*** * 10% significance ** 5% significance *** 1% significance
Value Type Factor One (Self-Enhancement)
Value type factor one measured how important a sense of self-enhancement was for the
respondent. This value type factor is a composite derived from a factor analysis performed by

142
the researcher to collapse the Schwartz circumplex to the smallest number of variables possible
(which turned out to be three) and is primarily composed of the combined positive effects of the
self-direction, power, achievement, hedonism, and stimulation value types. Each of those value
types had a positive factor loading for value type factor one that was over 0.399.
Table 4.25. The Ten Factor Loadings for Value Type Factors One and Two
Alpha
One 0.649
Two 0.620
Self-Direction 0.399* Universalism Benevolence Tradition 0.750* Conformity 0.826* Security 0.681* Power 0.737* Achievement 0.720* Hedonism 0.747* Stimulation 0.566* * represents factor loadings with absolute values greater than 0.399
Bivariate correlation analysis between value type factor one, political qualities, and
demographics showed fairly consistent results. Bivariate correlations between two of the political
qualities (political sophistication and fiscal liberalism) were found to be significant and negative.
All of the major demographic variables were found to significantly and negatively correlate with
value type factor one.
Political sophistication was found to significantly and negatively correlate (-0.187) with
value type factor one. This indicates that political sophistication decreases as value type factor
one increases. Furthermore, those who agreed more readily with the value type factor one
components than others were also found less likely to be fiscally liberal (-0.063).
Females appeared to have a negative correlation with value type factor one (-0.135). On
average, females were found to have scored value type factor one as less favorable (-0.15) than
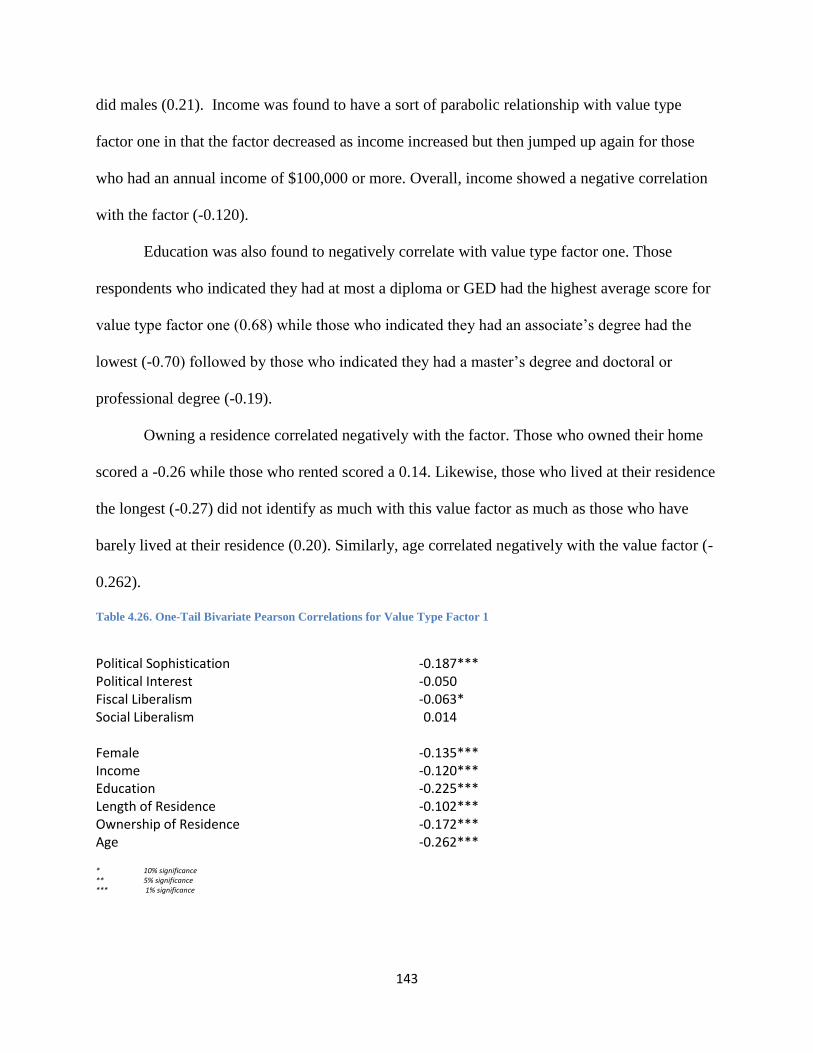
143
did males (0.21). Income was found to have a sort of parabolic relationship with value type
factor one in that the factor decreased as income increased but then jumped up again for those
who had an annual income of $100,000 or more. Overall, income showed a negative correlation
with the factor (-0.120).
Education was also found to negatively correlate with value type factor one. Those
respondents who indicated they had at most a diploma or GED had the highest average score for
value type factor one (0.68) while those who indicated they had an associate’s degree had the
lowest (-0.70) followed by those who indicated they had a master’s degree and doctoral or
professional degree (-0.19).
Owning a residence correlated negatively with the factor. Those who owned their home
scored a -0.26 while those who rented scored a 0.14. Likewise, those who lived at their residence
the longest (-0.27) did not identify as much with this value factor as much as those who have
barely lived at their residence (0.20). Similarly, age correlated negatively with the value factor (-
0.262).
Table 4.26. One-Tail Bivariate Pearson Correlations for Value Type Factor 1
Political Sophistication -0.187*** Political Interest -0.050 Fiscal Liberalism -0.063* Social Liberalism 0.014 Female -0.135*** Income -0.120*** Education -0.225*** Length of Residence -0.102*** Ownership of Residence -0.172*** Age -0.262*** * 10% significance ** 5% significance *** 1% significance
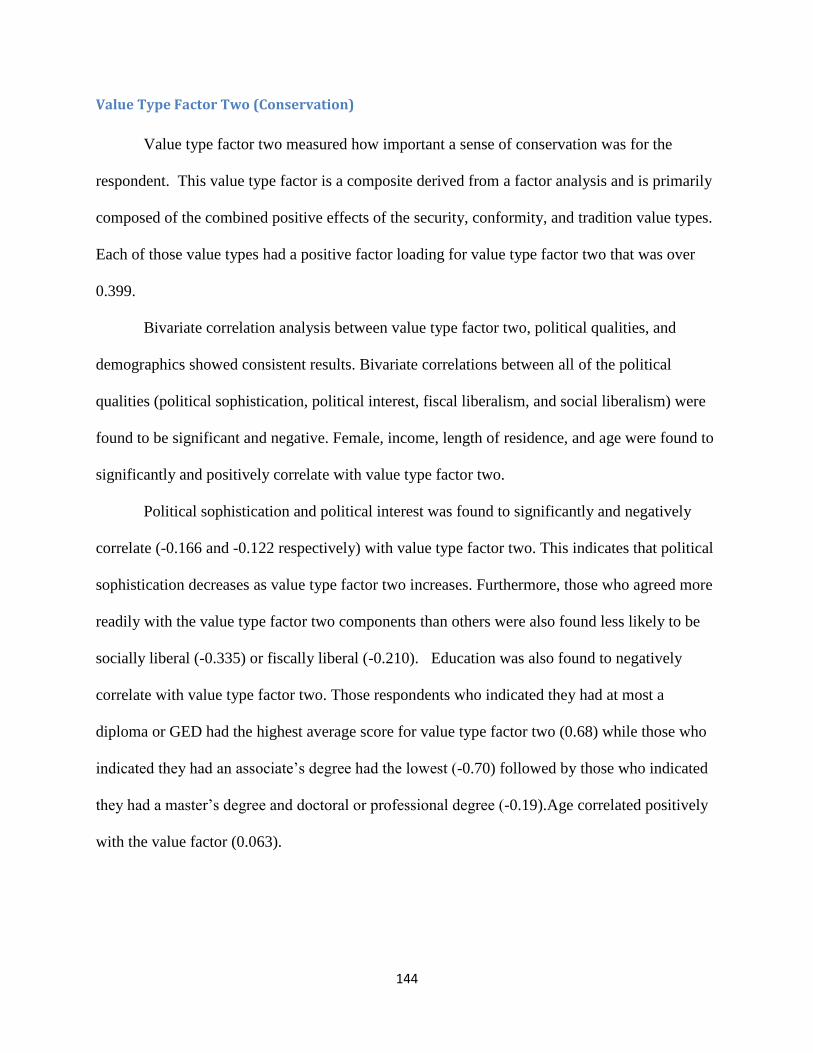
144
Value Type Factor Two (Conservation)
Value type factor two measured how important a sense of conservation was for the
respondent. This value type factor is a composite derived from a factor analysis and is primarily
composed of the combined positive effects of the security, conformity, and tradition value types.
Each of those value types had a positive factor loading for value type factor two that was over
0.399.
Bivariate correlation analysis between value type factor two, political qualities, and
demographics showed consistent results. Bivariate correlations between all of the political
qualities (political sophistication, political interest, fiscal liberalism, and social liberalism) were
found to be significant and negative. Female, income, length of residence, and age were found to
significantly and positively correlate with value type factor two.
Political sophistication and political interest was found to significantly and negatively
correlate (-0.166 and -0.122 respectively) with value type factor two. This indicates that political
sophistication decreases as value type factor two increases. Furthermore, those who agreed more
readily with the value type factor two components than others were also found less likely to be
socially liberal (-0.335) or fiscally liberal (-0.210). Education was also found to negatively
correlate with value type factor two. Those respondents who indicated they had at most a
diploma or GED had the highest average score for value type factor two (0.68) while those who
indicated they had an associate’s degree had the lowest (-0.70) followed by those who indicated
they had a master’s degree and doctoral or professional degree (-0.19).Age correlated positively
with the value factor (0.063).

145
The maximum value type factor two by occupation classification belonged to those who
were in the law profession (about 1.25) and the minimum to those who were in the retired
category (around -0.75).
Table 4.27. One-Tail Bivariate Pearson Correlations for Value Type Factor Two
Political Sophistication -0.166*** Political Interest -0.122*** Fiscal Liberalism -0.210*** Social Liberalism -0.335*** Female 0.042 Income 0.013 Education -0.117*** Length of Residence 0.147*** Ownership of Residence 0.011 Age 0.063* * 10% significance ** 5% significance *** 1% significance
Results of the Social Capital Correlation Analysis
Factor analysis was performed on 57 individual variables collected from the survey
instrument. Overall, the factor analysis derived 8 separate factors from these variables. Each of
these factors seemed to represent a fairly uniform concept and are henceforth described in detail.
SC Factor 1: The Executive Government Trust Factor
The first factor represents trust in executive government entities. The Cronbach’s alpha
statistic for this factor was 0.743, indicating a good scale reliability for the variable.

146
Table 4.28. Top Factor Loadings for Executive Government Trust
Alpha = 0.743 Trust in President
0.546*
Trust in Gov. Agencies 0.526* Trust in UN 0.693* * represents factor loadings with absolute values greater than 0.399
Executive government trust is significantly correlated with many of the values variables.
Universalism, benevolence, hedonism, and stimulation are all positively correlated with the
factor. On the other hand, this factor is also negatively correlated with conformity, security, and
achievement. Of the two values factors, executive government trust is significantly and
negatively related to factor one (self-enhancement).
Concerning the political variables, executive government trust was not conclusively
related to political sophistication. However, this factor was found to be significantly and
positively related to political interest, fiscal liberalism, and social liberalism.
Demographically, this factor was significantly and positively related to the education
variable, but negatively related to the length of residence variable.
Table 4.29. One-Tail Bivariate Pearson Correlations for Executive Government Trust
Universalism
0. 153***
Benevolence 0.089** Tradition -0.019 Conformity -0.076** Security -0.001 Power -0.035 Achievement -0.150*** Stimulation 0.094** Hedonism 0.077** Self-Direction 0.048 Values 1: Self-Enhancement -0.106***

147
Values 2: Conservation -0.026 Political Sophistication 0.012 Political Interest 0.170*** Fiscal Liberalism 0.435*** Social Liberalism 0.410*** Female 0. 028 Income -0.040 Education 0.059* Length of Residence -0.104** Ownership of Residence -0.070* Age -0.110*** * 10% significance ** 5% significance *** 1% significance
SC Factor 2: The Activist Organization Belonging and Trust Factor
The second factor represents belonging to and trusting activist organizations. This factor
loads most heavily onto three similar variables. This factor could also be related to racial and
ethnic diversity or tolerance. The Cronbach’s alpha for this factor was 0.684, indicating an
acceptable level of reliability.
Table 4.30. Top Factor Loadings for Activist Organization Belonging and Trust
Alpha = 0.684 Belong to Environmental Org.
0.594*
Belong to Labor Org. 0.458* Trust in Labor Unions 0.540* Trust in Env. Orgs. 0.763* Trust in Women’s Orgs. 0.778* Trust in Charitable Orgs. 0.615* * represents factor loadings with absolute values greater than 0.399
This factor is significantly correlated with some of the values variables. Universalism,
benevolence, stimulation, and self-direction are all positively correlated with the factor. On the
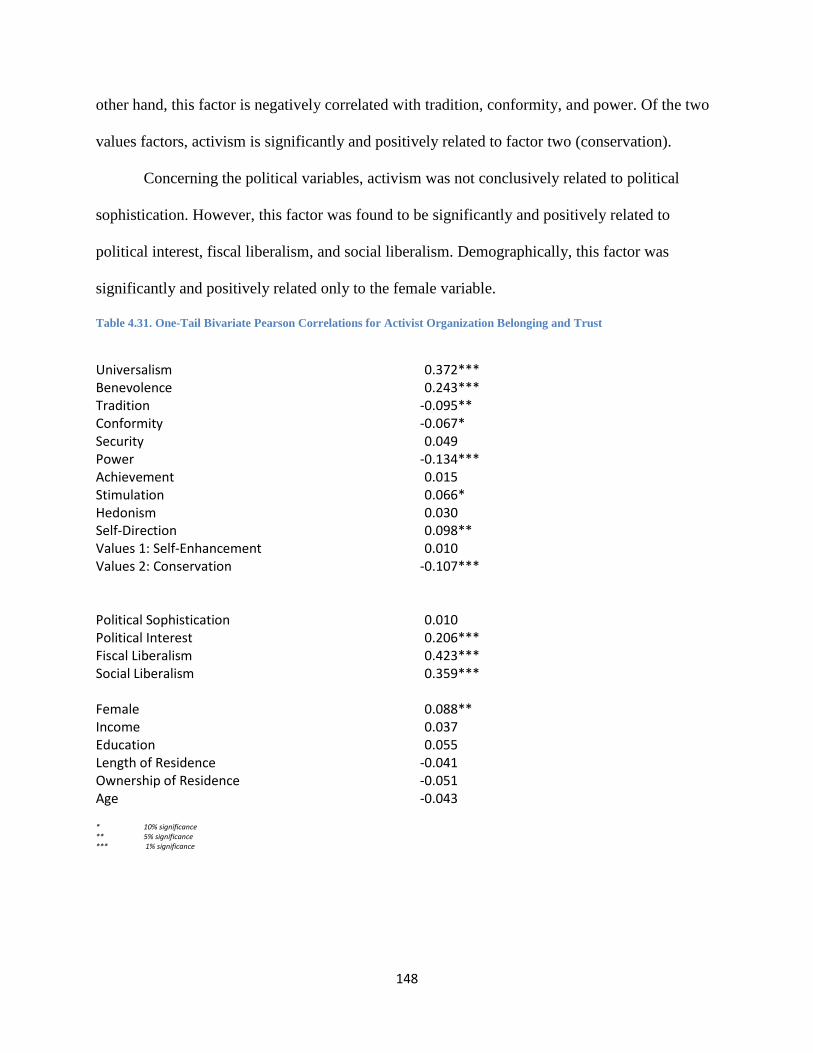
148
other hand, this factor is negatively correlated with tradition, conformity, and power. Of the two
values factors, activism is significantly and positively related to factor two (conservation).
Concerning the political variables, activism was not conclusively related to political
sophistication. However, this factor was found to be significantly and positively related to
political interest, fiscal liberalism, and social liberalism. Demographically, this factor was
significantly and positively related only to the female variable.
Table 4.31. One-Tail Bivariate Pearson Correlations for Activist Organization Belonging and Trust
Universalism
0.372***
Benevolence 0.243*** Tradition -0.095** Conformity -0.067* Security 0.049 Power -0.134*** Achievement 0.015 Stimulation 0.066* Hedonism 0.030 Self-Direction 0.098** Values 1: Self-Enhancement 0.010 Values 2: Conservation -0.107*** Political Sophistication 0.010 Political Interest 0.206*** Fiscal Liberalism 0.423*** Social Liberalism 0.359*** Female 0.088** Income 0.037 Education 0.055 Length of Residence -0.041 Ownership of Residence -0.051 Age -0.043 * 10% significance ** 5% significance *** 1% significance

149
SC Factor 3: The Trust in Media Factor
The third factor represents trust in the media. Cronbach’s alpha for this factor was 0.750,
indicating a good reliability.
Table 4.32. Top Factor Loadings for Trust in Media
Alpha = 0.750
Trust in TV
0.697*
Trust in the Press 0.610* * represents factor loadings with absolute values greater than 0.399
Trust in the media is significantly correlated with some of the values variables. Tradition,
conformity, security, power, achievement, hedonism, and self-direction are all positively
correlated with the factor. On the other hand, this factor is not negatively correlated with any of
the other variables. Of the two values factors, trust in the media is significantly and positively
related to factors one (self-enhancement) and two (conservation).
Concerning the political variables, trust in the federal government and major corporations
was positively related to political interest, fiscal liberalism, and social liberalism.
Demographically, this factor was only significantly and positively related to the female variable.
Table 4.33. One-Tail Bivariate Pearson Correlations for Trust in Media
Universalism
-0.044
Benevolence 0.018 Tradition 0.059* Conformity 0.093** Security 0.091** Power 0.153*** Achievement 0.161*** Stimulation 0.016 Hedonism 0.074** Self-Direction 0.062* Values 1: Self-Enhancement 0.130*** Values 2: Conservation 0.098**

150
Political Sophistication 0.047 Political Interest 0.102** Fiscal Liberalism 0.138*** Social Liberalism 0.121*** Female -0.087** Income 0.047 Education -0.042 Length of Residence 0.020 Ownership of Residence 0.012 Age 0.038 * 10% significance ** 5% significance *** 1% significance
SC Factor 4: The Trust in Representative Government Factor
The fourth factor best represents one’s trust in representative government institutions.
The Cronbach’s alpha for this factor is 0.690, indicating acceptable reliability.
Table 4.34. Top Factor Loadings for Trust in Representative Government
Alpha = 0.690
Trust in Political Parties
0.619* Trust in the Major Companies 0.591* Trust in Congress 0.538* Trust in Major Companies 0.338 Trust in Religious Leaders 0.295 Trust in the President 0.293 Trust in Government Agencies 0.237 Trust in the United Nations 0.224 Racial Heterogeneity -0.190 Participation in Non-Religious Humanitarian Orgs. -0.187 * represents factor loadings with absolute values greater than 0.399
Trust in representative government is significantly correlated with some of the values
variables. Tradition, conformity, security, power, achievement, stimulation, and hedonism are all
positively correlated with the factor. On the other hand, this factor is negatively correlated with
the universalism variable. Of the two values factors, trust in representative government is
151
significantly and positively related to factor one (self-enhancement) and factor two
(conservation).
Concerning the political variables, trust in law enforcement and the military was
negatively related to political sophistication, political interest, fiscal liberalism, and social
liberalism. Demographically, this factor was significantly and positively related to the income,
length of residence, ownership of residence, and age variables.
Table 4.35. One-Tail Bivariate Pearson Correlations for Trust in Representative Government
Universalism
-0.065*
Benevolence 0.049 Tradition 0.256*** Conformity 0.255*** Security 0.118*** Power 0.199*** Achievement 0.251*** Stimulation 0.078** Hedonism 0.110*** Self-Direction 0.051 Values 1: Self-Enhancement 0.205*** Values 2: Conservation 0.272*** Political Sophistication -0.222*** Political Interest -0.014 Fiscal Liberalism -0.026 Social Liberalism -0.070* Female 0.101*** Income -0.126*** Education -0.232*** Length of Residence -0.021 Ownership of Residence -0.099** Age -0.166*** * 10% significance ** 5% significance *** 1% significance

152
SC Factor 5: The Trust in Protection Factor
The fifth factor represents the trust in protective services. The Cronbach’s alpha for this
factor is 0.691, showing an acceptable degree of reliability.
Table 4.36. Top Factor Loadings for Significant Other Networks
Alpha = 0.691 Trust in Police
0.465*
Trust in Armed Forces 0.458* Trust in Courts 0.449* * represents factor loadings with absolute values greater than 0.399
Significant other networks are significantly correlated with most of the values variables.
Universalism and self-direction are the only values that are negatively correlated with the factor.
On the other hand, this factor is positively correlated with the tradition, conformity, security,
power, and achievement variables. Of the two values factors, trust in protective services is
significantly and positively related to factor two (conservation).
Concerning the political variables, trust in protective services was negatively related to
political sophistication, political interest, fiscal liberalism, and social liberalism.
Demographically, this factor was significantly and positively related to the income, length of
residence, ownership of residence, and age variables while negatively related to the education
variable.
Table 4.37. One-Tail Bivariate Pearson Correlations for Trust in Protective Services
Universalism
-0.069*
Benevolence 0.039 Tradition 0.274*** Conformity 0.259*** Security 0.150*** Power 0.082** Achievement 0.122*** Stimulation -0.017 Hedonism -0.011
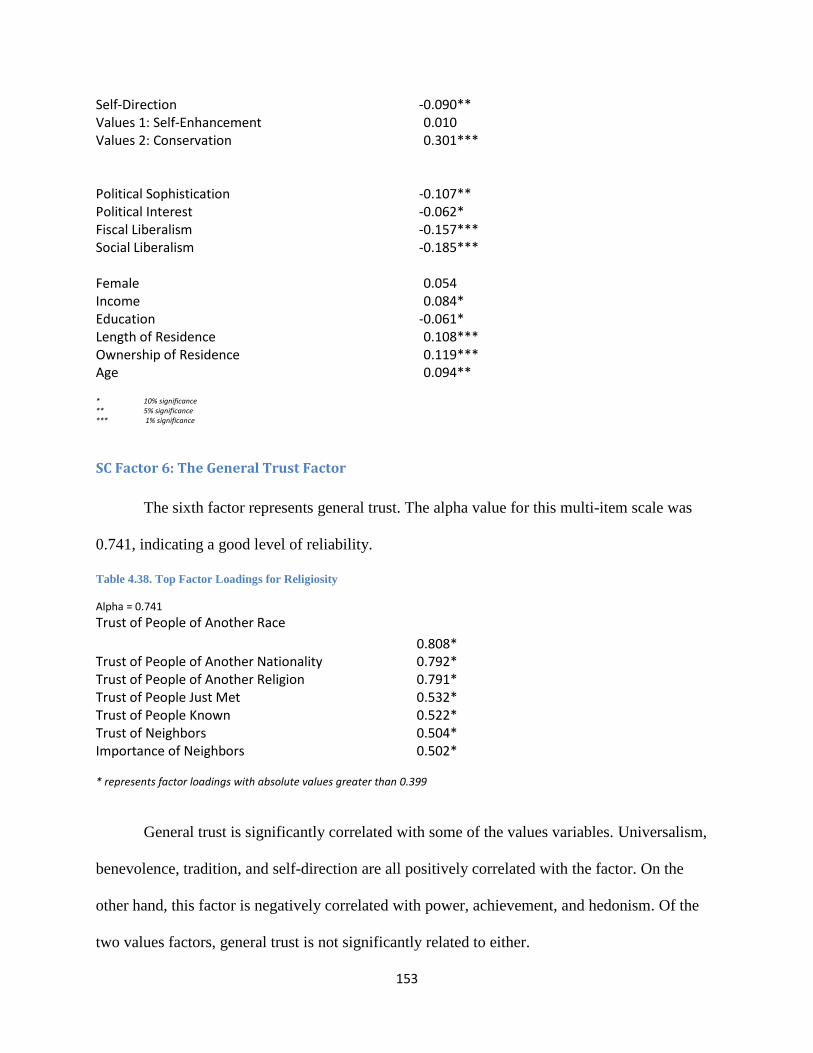
153
Self-Direction -0.090** Values 1: Self-Enhancement 0.010 Values 2: Conservation 0.301*** Political Sophistication -0.107** Political Interest -0.062* Fiscal Liberalism -0.157*** Social Liberalism -0.185*** Female 0.054 Income 0.084* Education -0.061* Length of Residence 0.108*** Ownership of Residence 0.119*** Age 0.094** * 10% significance ** 5% significance *** 1% significance
SC Factor 6: The General Trust Factor
The sixth factor represents general trust. The alpha value for this multi-item scale was
0.741, indicating a good level of reliability.
Table 4.38. Top Factor Loadings for Religiosity
Alpha = 0.741 Trust of People of Another Race
0.808* Trust of People of Another Nationality 0.792* Trust of People of Another Religion 0.791* Trust of People Just Met 0.532* Trust of People Known 0.522* Trust of Neighbors 0.504* Importance of Neighbors 0.502* * represents factor loadings with absolute values greater than 0.399
General trust is significantly correlated with some of the values variables. Universalism,
benevolence, tradition, and self-direction are all positively correlated with the factor. On the
other hand, this factor is negatively correlated with power, achievement, and hedonism. Of the
two values factors, general trust is not significantly related to either.
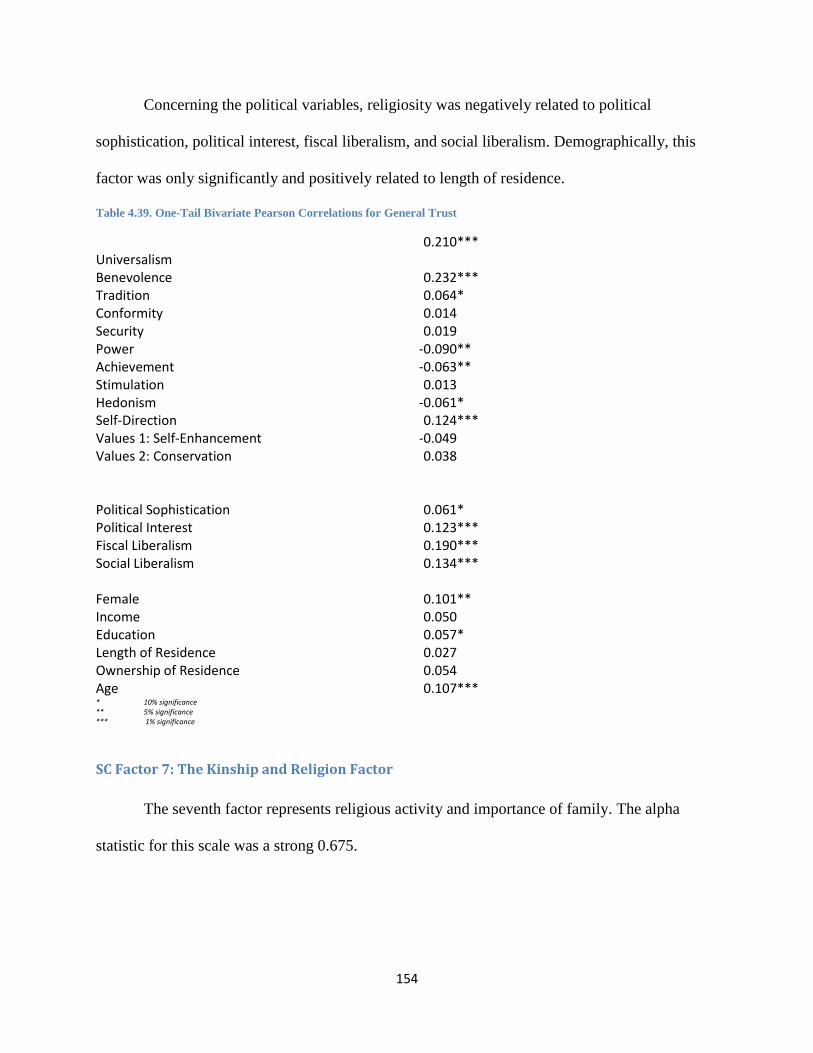
154
Concerning the political variables, religiosity was negatively related to political
sophistication, political interest, fiscal liberalism, and social liberalism. Demographically, this
factor was only significantly and positively related to length of residence.
Table 4.39. One-Tail Bivariate Pearson Correlations for General Trust
Universalism
0.210***
Benevolence 0.232*** Tradition 0.064* Conformity 0.014 Security 0.019 Power -0.090** Achievement -0.063** Stimulation 0.013 Hedonism -0.061* Self-Direction 0.124*** Values 1: Self-Enhancement -0.049 Values 2: Conservation 0.038 Political Sophistication 0.061* Political Interest 0.123*** Fiscal Liberalism 0.190*** Social Liberalism 0.134*** Female 0.101** Income 0.050 Education 0.057* Length of Residence 0.027 Ownership of Residence 0.054 Age 0.107*** * 10% significance ** 5% significance *** 1% significance
SC Factor 7: The Kinship and Religion Factor
The seventh factor represents religious activity and importance of family. The alpha
statistic for this scale was a strong 0.675.
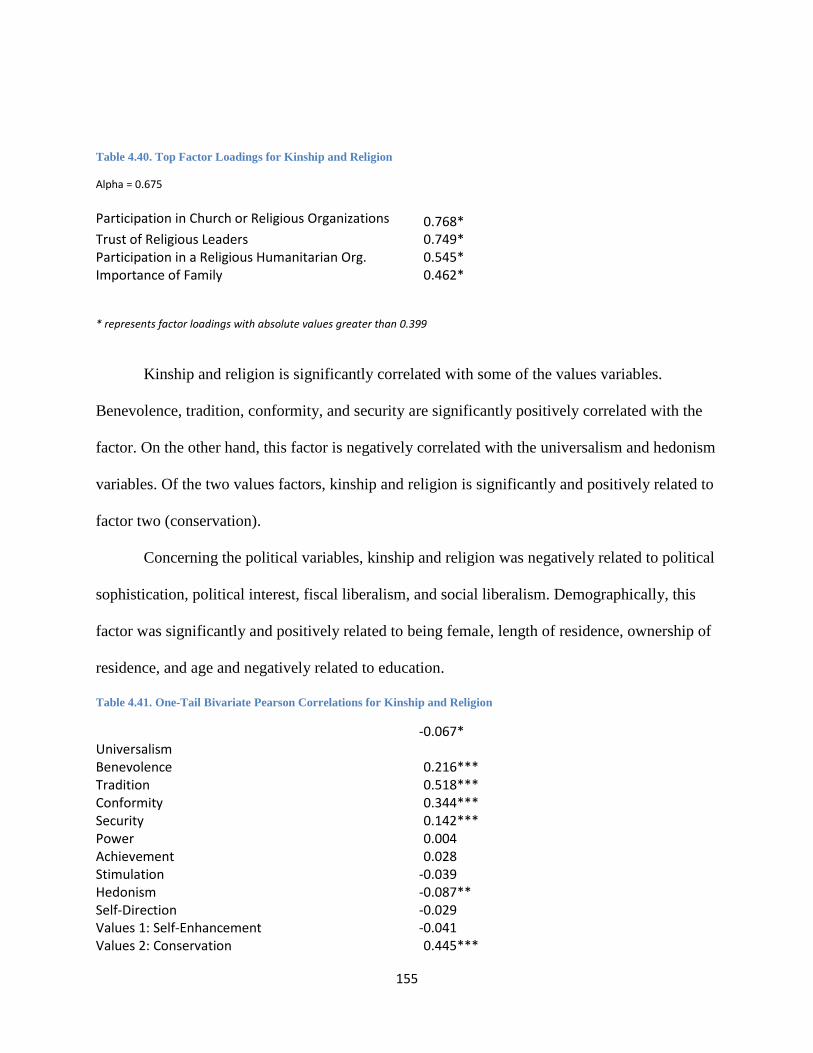
155
Table 4.40. Top Factor Loadings for Kinship and Religion
Alpha = 0.675
Participation in Church or Religious Organizations
0.768* Trust of Religious Leaders 0.749* Participation in a Religious Humanitarian Org. 0.545* Importance of Family 0.462* * represents factor loadings with absolute values greater than 0.399
Kinship and religion is significantly correlated with some of the values variables.
Benevolence, tradition, conformity, and security are significantly positively correlated with the
factor. On the other hand, this factor is negatively correlated with the universalism and hedonism
variables. Of the two values factors, kinship and religion is significantly and positively related to
factor two (conservation).
Concerning the political variables, kinship and religion was negatively related to political
sophistication, political interest, fiscal liberalism, and social liberalism. Demographically, this
factor was significantly and positively related to being female, length of residence, ownership of
residence, and age and negatively related to education.
Table 4.41. One-Tail Bivariate Pearson Correlations for Kinship and Religion
Universalism
-0.067*
Benevolence 0.216*** Tradition 0.518*** Conformity 0.344*** Security 0.142*** Power 0.004 Achievement 0.028 Stimulation -0.039 Hedonism -0.087** Self-Direction -0.029 Values 1: Self-Enhancement -0.041 Values 2: Conservation 0.445***

156
Political Sophistication -0.139*** Political Interest -0.155*** Fiscal Liberalism -0.275*** Social Liberalism -0.469*** Female 0.096** Income 0.021 Education -0.081** Length of Residence 0.159*** Ownership of Residence 0.109*** Age 0.073** * 10% significance ** 5% significance *** 1% significance
SC Factor 8: The Heterogeneity Factor
The eighth factor represents the heterogeneity of an individual’s social network. This
factor is composed of all variables that are part of the measure for heterogeneity. The alpha for
this scale was an acceptable 0.624.
Table 4.42. Top Factor Loadings for Heterogeneity
Alpha = 0.624
Income Heterogeneity 0.668* Personality Heterogeneity 0.596* Heterogeneity in Religions 0.559* Heterogeneity in Occupation 0.521* Heterogeneity in Political Affiliation 0.495* Heterogeneity in Race 0.495* * represents factor loadings with absolute values greater than 0.399
Heterogeneity was significantly correlated with many of the values variables.
Universalism, stimulation, and self-direction were all positively correlated with the factor. On
the other hand, this factor is negatively correlated with the conformity, security, power, and
hedonism variables. Of the two values factors, heterogeneity is not significantly related to either.
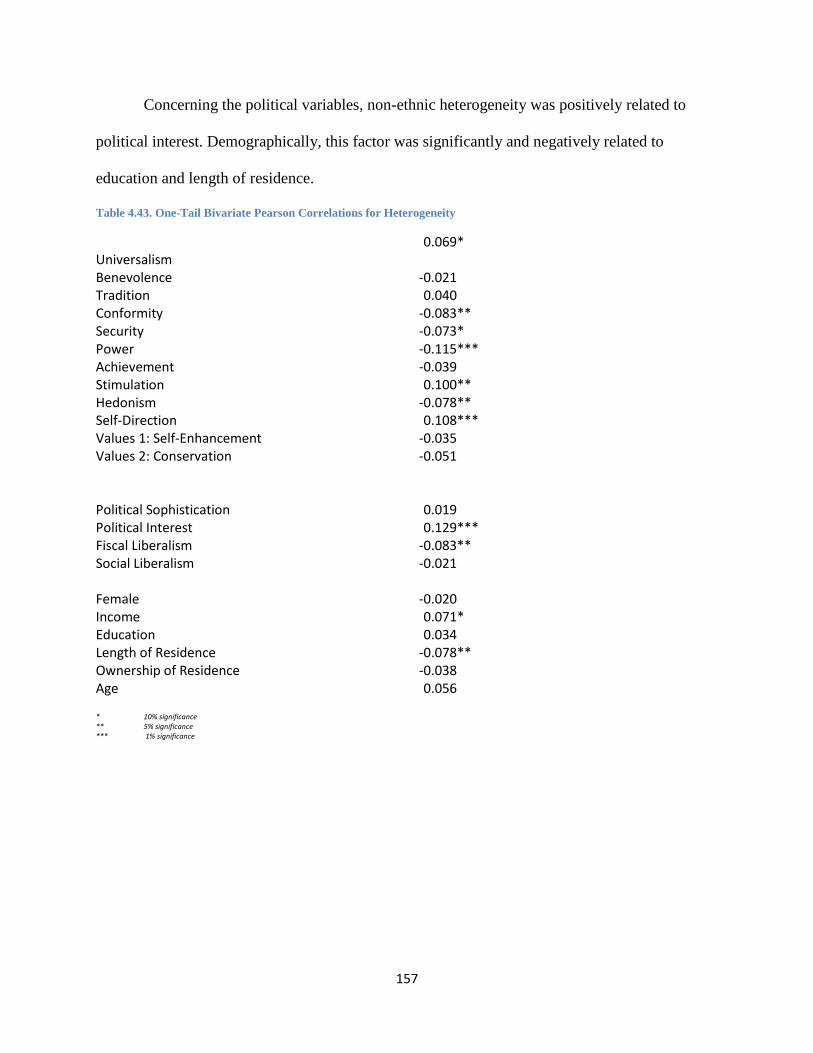
157
Concerning the political variables, non-ethnic heterogeneity was positively related to
political interest. Demographically, this factor was significantly and negatively related to
education and length of residence.
Table 4.43. One-Tail Bivariate Pearson Correlations for Heterogeneity
Universalism
0.069*
Benevolence -0.021 Tradition 0.040 Conformity -0.083** Security -0.073* Power -0.115*** Achievement -0.039 Stimulation 0.100** Hedonism -0.078** Self-Direction 0.108*** Values 1: Self-Enhancement -0.035 Values 2: Conservation -0.051 Political Sophistication 0.019 Political Interest 0.129*** Fiscal Liberalism -0.083** Social Liberalism -0.021 Female -0.020 Income 0.071* Education 0.034 Length of Residence -0.078** Ownership of Residence -0.038 Age 0.056 * 10% significance ** 5% significance *** 1% significance

158
The Spatial Dimension Measure
The spatial dimension measure represents the score for each individual in regards to how
geographically far away their informal networks (friends and family) were. Five of the ten value
types were significantly correlated with the spatial dimension measure. The self-direction,
stimulation, and hedonism values were correlated with an increase in distance from informal
network connections. On the other hand, tradition and security were correlated with
geographically closer network of connections.
Being further away from informal connections was positively correlated with political
interest and fiscal and social liberalism. Education was also positively correlated with distance.
However, being female, length of residence, ownership of residence, and age were negatively
correlated with spatial distance from informal connections.
Table 4.44. One-Tail Bivariate Pearson Correlations for Spatial Dimension Measure
Universalism
0.040
Benevolence 0.028 Tradition -0.098*** Conformity -0.046 Security -0.070** Power -0.011 Achievement 0.034 Stimulation 0.108*** Hedonism 0.075** Self-Direction 0.115*** Values 1: Self-Enhancement 0.120*** Values 2: Conservation -0.121*** Values 3: Self-Transcendence 0.080** Political Sophistication 0.021 Political Interest 0.084** Fiscal Liberalism 0.111*** Social Liberalism 0.109*** Female -0.058* Income -0.042 Education 0.113***

159
Length of Residence -0.298*** Ownership of Residence -0.202*** Age -0.095** * 10% significance ** 5% significance *** 1% significance
The Closure Measure
The closure measure represents the score for each individual in regards to how many of
the individuals in their network knows other individuals in the network. Closure was
significantly correlated with only two of the value types. Stimulation was positively related to
closure while security was negatively related. Closure was also negatively related to the political
sophistication and fiscal and social liberalism variables. Furthermore, three of the six
demographic variables were significantly and negatively related to closure; they were income,
education, and age. This indicates that the older and better education one is, the more open one’s
network becomes (i.e., your friends do not necessarily know all your other friends).
Table 4.45. One-Tail Bivariate Pearson Correlations for Closure
Universalism
-0.030
Benevolence 0.015 Tradition 0.041 Conformity -0.035 Security -0.066* Power 0.001 Achievement -0.050 Stimulation 0.080** Hedonism 0.028 Self-Direction 0.012 Values 1: Self-Enhancement 0.032 Values 2: Conservation -0.032 Values 3: Self-Transcendence 0.023 Political Sophistication -0.095** Political Interest -0.050 Fiscal Liberalism -0.105** Social Liberalism -0.095**

160
Female -0.007 Income -0.099** Education -0.108*** Length of Residence 0.005 Ownership of Residence 0.016 Age -0.101*** * 10% significance ** 5% significance *** 1% significance
The Density Measure
The network density measure represents the score for each individual in regards to how
much their network membership overlaps. Network density is positively and significantly
correlated with four of the ten value types. Power, stimulation, hedonism, and self-direction were
correlated with an increased amount of network density. No other value types were significantly
correlated with network density. None of the political variables were significant in the analysis.
Three of the six demographic variables were significantly correlated with density and all of them
(income, education, and age) were negatively correlated.
Table 4.46. One-Tail Bivariate Pearson Correlations for Density
Universalism
0.048
Benevolence 0.017 Tradition -0.003 Conformity -0.027 Security 0.037 Power 0.060* Achievement 0.018 Stimulation 0.056* Hedonism 0.099*** Self-Direction 0.058* Values 1: Self-Enhancement 0.080** Values 2: Conservation 0.009 Values 3: Self-Transcendence 0.027 Political Sophistication -0.008 Political Interest 0.040 Fiscal Liberalism -0.029 Social Liberalism -0.018

161
Female -0.035 Income -0.059* Education -0.069* Length of Residence 0.016 Ownership of Residence -0.019 Age -0.087** * 10% significance ** 5% significance *** 1% significance
The Horizontality Measure
The horizontality measure represents the overall score for each individual in regards to
how network decisions are made. Five of the ten value types were significantly related to
horizontality. Self-direction, universalism, and benevolence were all positively related to
network horizontality. However, power and achievement correlated with a more hierarchically
structured decision-making process within networks.
Political interest was significantly and positively correlated with horizontality while the
same was true for fiscal liberalism. Only one of the six demographic variables – being female –
was significantly correlated with network horizontality and that variable was negatively related.
Table 4.47. One-Tail Bivariate Pearson Correlations for Horizontality
Universalism
0.148***
Benevolence 0.165*** Tradition 0.017 Conformity -0.003 Security -0.011 Power -0.103*** Achievement -0.097** Stimulation 0.023 Hedonism 0.004 Self-Direction 0.133*** Values 1: Self-Enhancement -0.032 Values 2: Conservation 0.005 Values 3: Self-Transcendence 0.217*** Political Sophistication 0.018
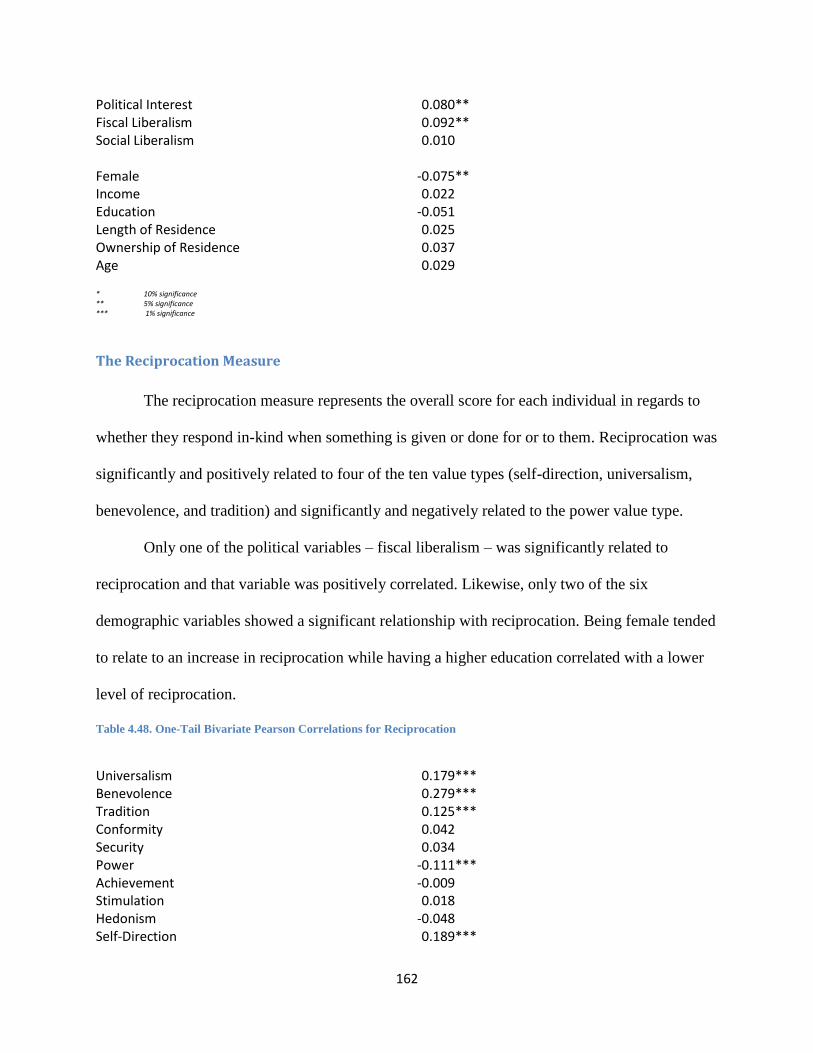
162
Political Interest 0.080** Fiscal Liberalism 0.092** Social Liberalism 0.010 Female -0.075** Income 0.022 Education -0.051 Length of Residence 0.025 Ownership of Residence 0.037 Age 0.029 * 10% significance ** 5% significance *** 1% significance
The Reciprocation Measure
The reciprocation measure represents the overall score for each individual in regards to
whether they respond in-kind when something is given or done for or to them. Reciprocation was
significantly and positively related to four of the ten value types (self-direction, universalism,
benevolence, and tradition) and significantly and negatively related to the power value type.
Only one of the political variables – fiscal liberalism – was significantly related to
reciprocation and that variable was positively correlated. Likewise, only two of the six
demographic variables showed a significant relationship with reciprocation. Being female tended
to relate to an increase in reciprocation while having a higher education correlated with a lower
level of reciprocation.
Table 4.48. One-Tail Bivariate Pearson Correlations for Reciprocation
Universalism
0.179***
Benevolence 0.279*** Tradition 0.125*** Conformity 0.042 Security 0.034 Power -0.111*** Achievement -0.009 Stimulation 0.018 Hedonism -0.048 Self-Direction 0.189***

163
Values 1: Self-Enhancement -0.033 Values 2: Conservation 0.082** Values 3: Self-Transcendence 0.306*** Political Sophistication -0.025 Political Interest 0.039 Fiscal Liberalism 0.079** Social Liberalism -0.033 Female 0.117*** Income -0.019 Education -0.061* Length of Residence -0.008 Ownership of Residence 0.036 Age 0.047 * 10% significance ** 5% significance *** 1% significance
Correlations: Overview and Summary
The table below summarizes the significant relationships with the political sophistication
variable. Nine of the ten value types were significantly correlated with political sophistication,
the only positive correlation being with universalism. Both value factors (self-enhancement and
conservation) were found to be significantly negatively correlated with political sophistication.
Furthermore, many of the social capital variables were found to be statistically significant when
investigating the correlations between them and political sophistication. The social capital
variable with the greatest positive correlation was the general trust factor while the greatest
negative correlation was with the representative government trust factor.
Table 4.49. Significant Relationships w/ Political Sophistication
Universalism 0.097** Tradition -0.162*** Conformity -0.096** Security -0.1141*** Power -0.1441*** Achievement -0.107** Hedonism -0.155*** Stimulation -0.130***

164
Self-Direction -0.074* Self-Enhancement -0.187*** Conservation -0.166*** Representative Government Trust Factor -0.222*** Trust in Protective Services Factor -0.107** General Trust Factor 0.061* Kinship and Religiosity Factor -0.139*** Closure -0.114*** Female -0.196*** Income 0.278*** Education 0.344*** Length of Residence 0.141*** Ownership of Residence 0.191*** Age 0.353*** * 10% significance ** 5% significance *** 1% significance
The table below summarizes the significant relationships with the political interest variable.
Seven of the ten value types were significantly correlated with political interest. Two of the value
types (universalism and benevolence) were positively correlated and the rest were negatively
correlated. One of the two value factors was also significantly correlated with political interest;
the conservation factor was negatively correlated. Once again, many of the social capital factors
were significantly correlated with political interest. The social capital factor with the largest
positive correlation was the activist organizations belonging and trust factor while the largest
negative correlation was with the kinship and religiosity factor.
Table 4.50. Significant Relationships with Political Interest
Universalism 0.149*** Benevolence 0.092** Tradition -0.151*** Conformity -0.077** Security -0.069* Power -0.086** Hedonism -0.095** Conservation -0.122*** Trust in Executive Government 0.170*** Activist Organizations Belonging and Trust 0.206*** Trust in the Press 0.102**

165
Trust in Protective Services -0.062* General Trust Factor 0.123*** Kinship and Religiosity Factor -0.155*** Heterogeneity Factor 0.129*** Horizontality 0.080** Spatial Dimension 0.084** Female -0.061* Income 0.151*** Education 0.196*** Length of Residence 0.069* Ownership of Residence 0.068* Age 0.214*** * 10% significance ** 5% significance *** 1% significance
Overall, both political sophistication and political interest seem to be significantly
correlated with both values and social capital variables. Indeed, with both sophistication and
interest, the positive relationships with values seem to center around the universalism value type
and the negative ones around power, as predicted based upon the Schwartz circumplex.
Furthermore, social capital variables that are seemingly related to participation and information
transfer seem to be positively related to both sophistication and interest. For example, general
trust relates positively while trust in protective services and kinship and religiosity relate
negatively. Indeed, it seems that deference to a higher authority (whether worldly or other-
worldly) has a negative impact on both sophistication and interest.
Regression Results
Social Capital and Political Sophistication with Political Interest
The regression model for social capital on political sophistication included all of the
social capital factors, the major demographic variables that were thought to have an effect on
social capital and political sophistication as shown in the literature, and the political interest
variable. The only dependent variable was the measure for political sophistication.

166
After all the variables mentioned above were included, a regression analysis was run.
Each of the models were trimmed by removing variables and factors that did not contribute to the
explanation of the variance in the dependent variable. The best model gave an adjusted R-
squared of 0.400, but also excluded some variables that did not help much in explaining the
predicted values of the political sophistication variable. The best model is shown in the table
below.
Table 4.51. Regression Results for Social Capital Regressed on Political Sophistication w/ Political Interest as an
Independent Variable
Variable Standardized Coefficients (Constant) -2.391 Representative Government Trust Factor -0.126*** Kinship and Religiosity Factor -0.078* Political Interest 0.425*** Female -0.144*** Education 0.194*** Income -0.097 Age 0.219*** * 10% significance ** 5% significance *** 1% significance
Adjusted R2 = 0.400
Of the seven variables included in the final model, six were statistically significant. The
variable with both the greatest overall and greatest positive effect was the political interest
variable. For every point increase on the 1 to 10 scale of political interest, political sophistication
increased by 0.425 points (note that the political sophistication variable ranged from a minimum
of -3.05 to a maximum measured score of 0.98). There were also two other variables with an
apparent positive effect on political sophistication; education and age.
Each point increase in education (which ranged from 0 to 7) increased political
sophistication by 0.194 points while each point increase in age (ranging from 18 to 81) increased
political sophistication by 0.219 points. All three of these variables – political interest, education,
and age – were significant at the one-percent level or better.

167
There were three statistically significant and negatively associated variables in the model.
The dummy variable for whether a person was female or not accounted for a downward change
in political sophistication by 0.144 points. A one-point increase in the kinship and religiosity
factor (ranging from -2.63 to 2.43) decreased political sophistication by 0.080 points. Finally, a
one-point increase in the representative government trust factor (ranging from -1.73 to 3.86)
accounted for a decrease of 0.126 points in the political sophistication measure.
According to previous research (Verba, Burns, and Schlozman 1997), men have both
greater knowledge of and more interest in politics. Indeed, even political engagement is
generally higher for men than women, especially in Catholic societies. Verba, Burns, and
Schlozman use data from the Citizen Participation Study to tease out the relationships that may
tell us why men and women show such differences in political knowledge, interest, and
engagement. They conclude quite convincingly that even when accounting for differences in
socioeconomic, occupation, and intelligence variables, women still show a statistically
significant difference in political knowledge, interest, and engagement. They argue that this can
be attributed to social norms that have conditioned women to be less interested in politics and
look at it as a man’s realm. Their study even presents evidence in favor of that conclusion,
showing that women who live in a state with a statewide incumbent politician who is female
have more favorable levels of political knowledge, interest, and engagement when compared to
men than those women who reside in states where there are no statewide incumbents who are
women. Thus, this research shows the same effect and presents Verba, Burns, and Scholzman’s
explanation as a reason why the female variable is important for explaining differences in
sophistication and interest regardless of socioeconomic, occupation, or intelligence variables.

168
Social Capital and Political Sophistication without Political Interest
The second regression model for political sophistication also included all social capital
factors and the major demographic variables, but did not include the political interest variable.
This model was included in the analysis in order to see what relationships may exist between
variables without directly accounting for political interest.
Six variables were found to be statistically significant. Three of the six were positively
related and the remaining three were negatively related. The adjusted R-squared was lower than
that of the first model, coming in at 0.236.
Table 4.52. Regression Results for Social Capital Regressed on Political Sophistication w/o Political Interest as an
Independent Variable
Variable Standardized Coefficients (Constant) 0.289*** Executive Government Trust 0.143** Representative Gov. Trust -0.134** Trust in Protective Services -0.082 Kinship and Religiosity -0.088* Female -0.155*** Education 0.212*** Income -0.107 Age 0.332*** * 10% significance ** 5% significance *** 1% significance
Adjusted R2 = 0.236
Executive government trust, education, and age were all statistically significant and
positively related to political sophistication. A one-point increase in the executive government
trust factor increased political sophistication by 0.143 points. A one-point increase in either
education or age increased political sophistication by 0.212 and 0.332 points, respectively.
On the other hand, a one-point increase in trust in representative government trust,
kinship and religiosity, or female variables decreased political sophistication by 0.134, 0.088,
and 0.155 respectively.

169
Social Capital and Political Interest
The third regression model for political sophistication also included all 19 social capital
factors and the major demographic variables, but instead included the political interest variable
as the dependent variable (substituting for the political sophistication variable). This model was
included in the analysis in order to see what relationships may exist between social capital,
demographics, and political interest variables; recall that political interest may be considered part
of political sophistication according to some of the literature.
Seven variables were found to be statistically significant. Five of the fourteen were
positively related and the remaining two were negatively related. The adjusted R-squared
was0.205.
Table 4.53. Regression Results for Social Capital Regressed on Political Interest
Variable Standardized Coefficients (Constant) 2.666*** Activist Organization Belonging and Trust 0.248*** Trust in the Press 0.110** Trust in Protective Services -0.110** Kinship and Religiosity -0.093* Heterogeneity 0.160*** Education 0.156*** Age 0.211*** Density 0.074 * 10% significance ** 5% significance *** 1% significance
Adjusted R2 = 0.205
The strongest positive and significant relationship was that of activist organization
belonging and trust on political interest. One step up on the activist organization belonging and
trust value tended to increase political interest by 0.248 points. The second strongest positive and
significant relationship was for age. A one-year increase in the age variable increased political
interest by 0.211 points.
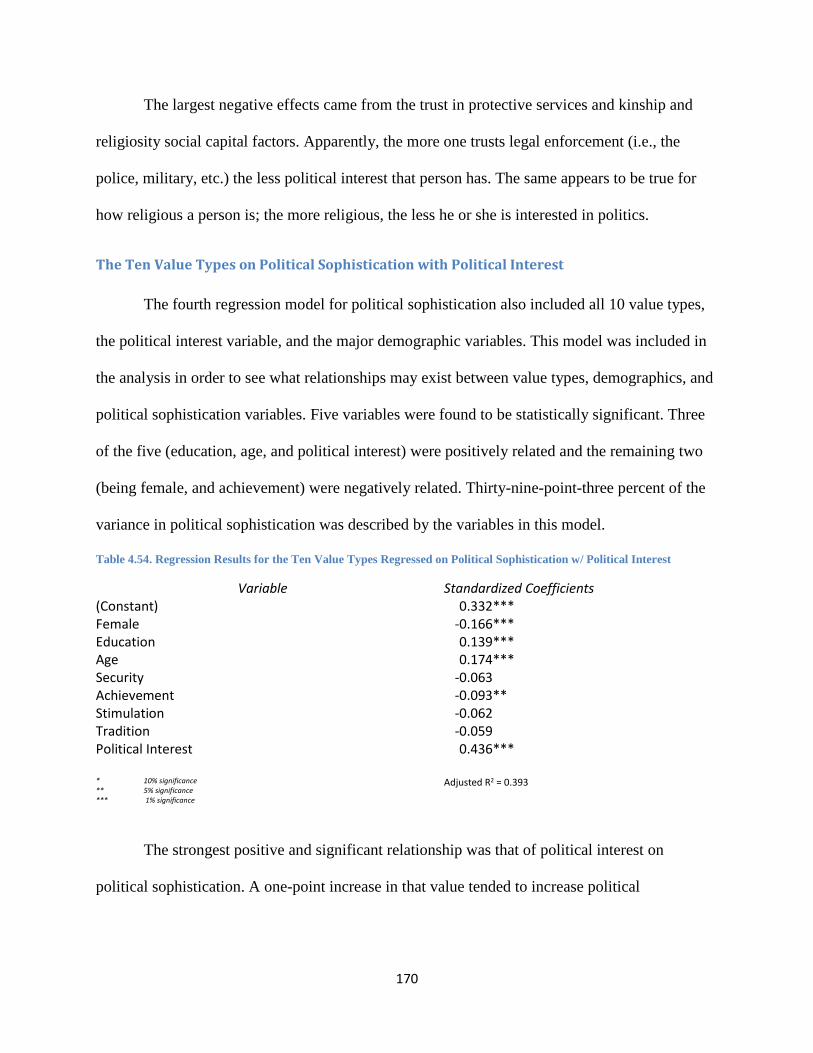
170
The largest negative effects came from the trust in protective services and kinship and
religiosity social capital factors. Apparently, the more one trusts legal enforcement (i.e., the
police, military, etc.) the less political interest that person has. The same appears to be true for
how religious a person is; the more religious, the less he or she is interested in politics.
The Ten Value Types on Political Sophistication with Political Interest
The fourth regression model for political sophistication also included all 10 value types,
the political interest variable, and the major demographic variables. This model was included in
the analysis in order to see what relationships may exist between value types, demographics, and
political sophistication variables. Five variables were found to be statistically significant. Three
of the five (education, age, and political interest) were positively related and the remaining two
(being female, and achievement) were negatively related. Thirty-nine-point-three percent of the
variance in political sophistication was described by the variables in this model.
Table 4.54. Regression Results for the Ten Value Types Regressed on Political Sophistication w/ Political Interest
Variable Standardized Coefficients (Constant) 0.332*** Female -0.166*** Education 0.139*** Age 0.174*** Security -0.063 Achievement -0.093** Stimulation -0.062 Tradition -0.059 Political Interest 0.436*** * 10% significance ** 5% significance *** 1% significance
Adjusted R2 = 0.393
The strongest positive and significant relationship was that of political interest on
political sophistication. A one-point increase in that value tended to increase political

171
sophistication by 0.436 points. The second strongest positive and significant relationship was for
age. A one-point increase in age increased political sophistication by 0.174 points.
The largest negative effects came from being female. Apparently, being female is an
indicator for less political sophistication. Negative effects on political sophistication were also
shown to derive from the achievement value type.
The Ten Values on Political Sophistication without Political Interest
The fifth regression model for political sophistication also included all 10 value types,
and the major demographic variables, but excluded political interest as an explanatory variable.
The same regression method that was used in the other models was also used in this model.
Six variables were found to be statistically significant. Two of the six (education and age)
were positively related and the remaining four (being female, security, achievement, and
stimulation) were negatively related. Twenty-two-point-six percent of the variance in political
sophistication was described by the variables in this model.
Table 4.55. Regression Results for the Ten Value Types Regressed on Political Sophistication w/o Political Interest
Variable Standardized Coefficients (Constant) 0.428*** Female -0.180*** Income -0.083 Education 0.210*** Age 0.298*** Security -0.080* Stimulation -0.081* Universalism 0.065 Tradition -0.135*** * 10% significance ** 5% significance *** 1% significance
Adjusted R2 = 0.226
The strongest positive and significant relationship was that of age on political
sophistication. A one-point increase in that value tended to increase political sophistication by

172
0.298 points. The second strongest positive and significant relationship was for education. A
one-point increase in education increased political sophistication by 0.210 points.
The largest negative effects came from being female. Apparently, once again, being
female is an indicator for less political sophistication. Negative effects on political sophistication
were also once again shown to derive from the security, achievement, and stimulation value
types.
The Two Value Factors on Political Sophistication with Political Interest
The sixth regression model for political sophistication included the two value factors, the
universalism and benevolence measures, the major demographic variables, and political interest
as explanatory variables. The same regression method that was used in the other models was also
used in this model.
Six variables were found to be statistically significant. Three of the six (education, age,
and political interest) were positively related and the remaining three (being female, self-
enhancement, and conservation) were negatively related. About 39.1% of the variance in
political sophistication was described by the variables in this model.
Table 4.56. Regression Results for the Three Value Factors Regressed on Political Sophistication w/ Political Interest
Variable Standardized Coefficients (Constant) 0.218*** Female 0.164*** Education 0.141*** Age 0.174*** Values Factor One (Self-enhancement) -0.105*** Values Factor Two (Conservation) -0.090** Benevolence -0.044 Political Interest 0.430*** * 10% significance ** 5% significance *** 1% significance
Adjusted R2 = 0.391

173
By far, the strongest positive and significant relationship was that of political interest on
political sophistication. A one-point increase in that value tended to increase political
sophistication by 0.430 points. The second strongest positive and significant relationship was for
education. A one-point increase in education increased political sophistication by 0.141 points.
The largest negative effects came from being female. Apparently, once again, being
female is an indicator for less political sophistication, lowering political sophistication by 0.164
points. Negative effects on political sophistication were also shown to derive from the self-
enhancement and conservation factors.
The Two Value Factors on Political Sophistication without Political Interest
The seventh regression model for political sophistication included the two value factors,
the universalism and benevolence variables, and the major demographic variables, but political
interest was not included. Five variables were found to be statistically significant. Two of the
five (education and age) were positively related and the remaining three (being female, self-
enhancement, and conservation) were negatively related. About 22.0% of the variance in
political sophistication was described by the variables in this model.
Table 4.57. Regression Results for the Three Value Factors Regressed on Political Sophistication w/o Political Interest
Variable Standardized Coefficients (Constant) 0.236*** Values Factor One (Self-enhancement) -0.089* Values Factor Two (Conservation) -0.145*** Female -0.168*** Education 0.194*** Age 0.256*** * 10% significance ** 5% significance *** 1% significance
Adjusted R2 = 0.220
For this model, the strongest positive and significant relationship was that of age on
political sophistication. A one-point increase in that value tended to increase political

174
sophistication by 0.256 points. The second strongest positive and significant relationship was for
education. A one-point increase in education increased political sophistication by 0.194 points.
The largest negative effects came from being female. Negative effects on political
sophistication were also shown to derive from the self-enhancement and conservation factors.
Summary of Chapter 4
Chapter 4 presented the information derived from the PVSN survey instrument created
for this study. Descriptive values were presented for each question on the survey, followed by
detailed results for the correlation analysis in order to investigate relationships that may exist for
confirmation of the hypotheses presented in Chapter 1. Finally, regression analyses were
presented that helped define more important variables that may be used in the future to build a
predictive model for political sophistication. The next chapter – Chapter 5 – expands upon the
analysis and discusses the conclusions of the study based upon the hypotheses and data presented.
Chapter 4 has shown that most value and social capital variables do indeed correlate significantly
with political sophistication and interest. Moreover, these effects mesh well with the expected
results derived from the properties of the Schwartz value system and also the information
transfer characteristics of social capital.
175
Chapter 5: Conclusion and Discussion
Introduction
This chapter – chapter 5 – contains five primary sections. First, a summary of the study
will be presented with attention paid to the research questions, a synopsis of the literature review,
and a summary description of the survey instrument. Next, the findings will be presented based
upon each set of hypotheses set forth in prior chapters. Third, conclusions will be presented
based upon the expectations and the findings. Fourth, implications of the study will be discussed
in order to improve upon this current research study and make suggestions for practical use.
Finally, suggestions for future research will be given.
Summary of the Study
Chapter 1 began by introducing the primary motivation and research questions that have
driven this study. Appalachia was used as an example to illustrate why values and social capital
matter to the political process and – in particular – political sophistication. Appalachians and
many other similar groups of people tend to have resource scarcity, which should generally
instill them with a sense of values that emphasizes the lower needs on Maslow’s hierarchy.
These needs should in turn relate to self-enhancement values on the Schwartz circumplex. The
study also hypothesizes that self-enhancement values and their corresponding social capital
characteristics should correlate negatively with political sophistication. This is a problem since
this would mean that impoverished people would be predisposed to lower political sophistication
because of a nearly unchanging adherence to specific, negative (in the context of political
sophistication) values.
The following research questions guided the study toward its current conclusion.

176
1. Are social capital characteristics that facilitate information flow significantly correlated
with particular Schwartz value types?
a. More specifically, are the “other-oriented,” self-transcendence Schwartz value
types associated with social capital characteristics that enhance information flow?
b. Also, are the “self-oriented,” self-enhancement Schwartz value types associated
with social capital characteristics that inhibit information flow?
2. Do social capital characteristics that facilitate information flow significantly correlate
with more political sophistication?
3. Can a preliminary predictive model be built for describing the relationship between social
capital and political sophistication?
Chapter 2 gave the reader an overview of the central literature driving the expectations of
this study. Based upon the literature, it became more apparent that values may act to predispose
individuals toward particular social capital characteristics that either increase or decrease
information flows within and between networks. These information flows were thought to
increase the flow of political information and thus political sophistication. The bounded
rationality perspective indicates that when people process information, there is imperfect
information, limited cognitive processing ability, limited cognitive storage capacity, use of rules
or heuristics to compensate for this limited cognition, lower expected satisfaction when
compared to initial expectations, and that a satisficing solution is generally made; thus, values
may act as heuristics for determining one’s social and political environments. The Schwartz
value system is composed of ten value types (self-direction, universalism, benevolence, tradition,
conformity, security, power, achievement, hedonism, and stimulation) that are arranged in a
circular manner and interact with one another in different ways. For example, the power and

177
universalism value types are considered opposites while the power and achievement value types
are considered to be very similar or complementary. These value types may affect the
predisposition to social capital characteristics such as informal and formal network types,
network closure, network density, network heterogeneity, network horizontality, trust of
familiars, trust of strangers, civic trust, and norms of reciprocity (Stone 2001). In turn, these
social capital characteristics may facilitate the flow of information in order to develop political
knowledge and exercise political cognition.
Chapter 3 continued by explaining how the study intended to measure and operationalize
the phenomena presented in the prior two chapters. A survey – called the PVSN – consisting of
48 substantive questions was developed. Each of four areas – social capital, values, political
knowledge and ideology, and demographics – were available to measure the primary variables
and control variables for the study. The survey was distributed via five universities (West
Virginia University, Marshall University, University of Maryland at College Park, The Ohio
State University, and Pennsylvania State University) and the Internet. In total, 605 people
responded to the survey. Chapter 3 gave a detailed description of each question asked on the
survey and why it was being asked, including what the question intended on measuring.
Chapter 4 detailed the data that was collected from the respondents to the survey. The
chapter began by showing the specific descriptive statistics for each question, then proceeded to
explain the factor analysis used in the study. After that, correlation data was given for each value
type and factor and also for each social capital measure. Finally, regressions were run to show
that there may be some evidence for the building of a good predictive model for political
sophistication. This chapter – Chapter 5 – continues by first discussing the specific findings of
the data by referencing the hypotheses presented in Chapter 1.

178
Findings
This section of Chapter 5 seeks to describe the outcomes of the hypothesis testing for the
relationships between values, social capital, and political sophistication. Recall the hypotheses
from the first chapter:
H1: All social capital characteristics that increase information flow will have a positive
correlation with political sophistication and a positive correlation with self-transcendence values.
h. Informal network importance will correlate positively with (i) political sophistication
and (ii) self-transcendence values
i. Formal network importance will correlate positively with (i) political sophistication
and (ii) self-transcendence values
j. Network capacity will correlate positively with (i) political sophistication and (ii)
self-transcendence values
k. Network heterogeneity will correlate positively with (i) political sophistication and
(ii) self-transcendence values
l. Trust of strangers will correlate positively with (i) political sophistication and (ii)
self-transcendence values
m. Network horizontality will correlate positively with (i) political sophistication and (ii)
self-transcendence values
n. Reciprocity will correlate positively with (i) political sophistication and (ii) self-
transcendence values
H2: All social capital characteristics that decrease information flow will have a negative
correlation with political sophistication and positive correlation with self-enhancement values.

179
c. Network closure will correlate (i) negatively with political sophistication and (ii)
positively with self-enhancement values
d. Network density will correlate (i) negatively with political sophistication and (ii)
positively with self-enhancement values
H1a and H1b: Informal and Formal Networks, Political Sophistication, and Self-
Transcendence
Hypothesis H1a predicted that the strength of activity in informal networks (i.e.,
networks similar to family and friends) would positively correlate with political sophistication.
Likewise, informal networks would correlate with self-transcendence value types. The following
table summarizes the relationships, with the blue areas being the predicted results of the
relationships between the apparent variables and the pink areas being the rejection of part of the
hypothesis.
Table 5.1. Correlations for Informal Networks with Political Sophistication and Self-Transcendence Value Types
Family Friends Sig. Other Neighbors
Political Sophistication - -
Self-Direction + - +
Universalism + + + +
Benevolence + + +
The first hypothesis in this set (H1ai) expected political sophistication to be positively
correlated with informal networks, but was rejected on two of the four counts (for importance of
family and significant other) and inconclusive on the other two (importance of friends and
neighbors). The second part of the hypothesis (H1aii) expected the self-transcendence value
types to be positively correlated with informal networks and was largely accepted. For self-
direction, the relationship was rejected for significant other, inconclusive for family, but
accepted on both friends and neighbors. For universalism, the hypothesis was accepted on all

180
counts. For benevolence, the hypothesis was also accepted for all counts except being
inconclusive for significant other. The study shows that family, friends and neighbors are largely
conclusively and positively linked to self-transcendence value types; however, the importance of
family and a significant other is negatively correlated with political sophistication.
H1b: Formal Networks, Political Sophistication, and Self-Transcendence
Hypothesis H1b predicted that the strength of activity in formal networks (i.e., networks
typically formed by organizations) would positively correlate with political sophistication.
Likewise, formal networks would correlate with self-transcendence value types. The following
table summarizes the relationships, with the blue areas being the predicted results of the
relationships between the apparent variables, and the pink areas being the rejection of part of the
hypothesis.
Table 5.2. Correlations for Formal Networks with Political Sophistication and Self-Transcendence Value Types
Church Non-R. R. Hum Sport Art Labor Pol. Env. Pro. Cons. Activ.
Political Sophistication - + + + + +
Self-Direction - + + - + +
Universalism - + + + + +
Benevolence + + + + + +
Five of the variables for formal networks were conclusively and positively associated
with political sophistication: membership in non-religious humanitarian, political party,
environmental, professional, and consumer organizations. Only membership in church or
religious organizations was conclusively negatively related, so H1bi was largely supported by
the data.
Concerning H1bii – that the formal networks variables were positively related to the self-
transcendence value types – 15 of the 33 possible conclusions were found to be conclusively
positively related to any of the three self-transcendence value types. Only 3 of the possible 33
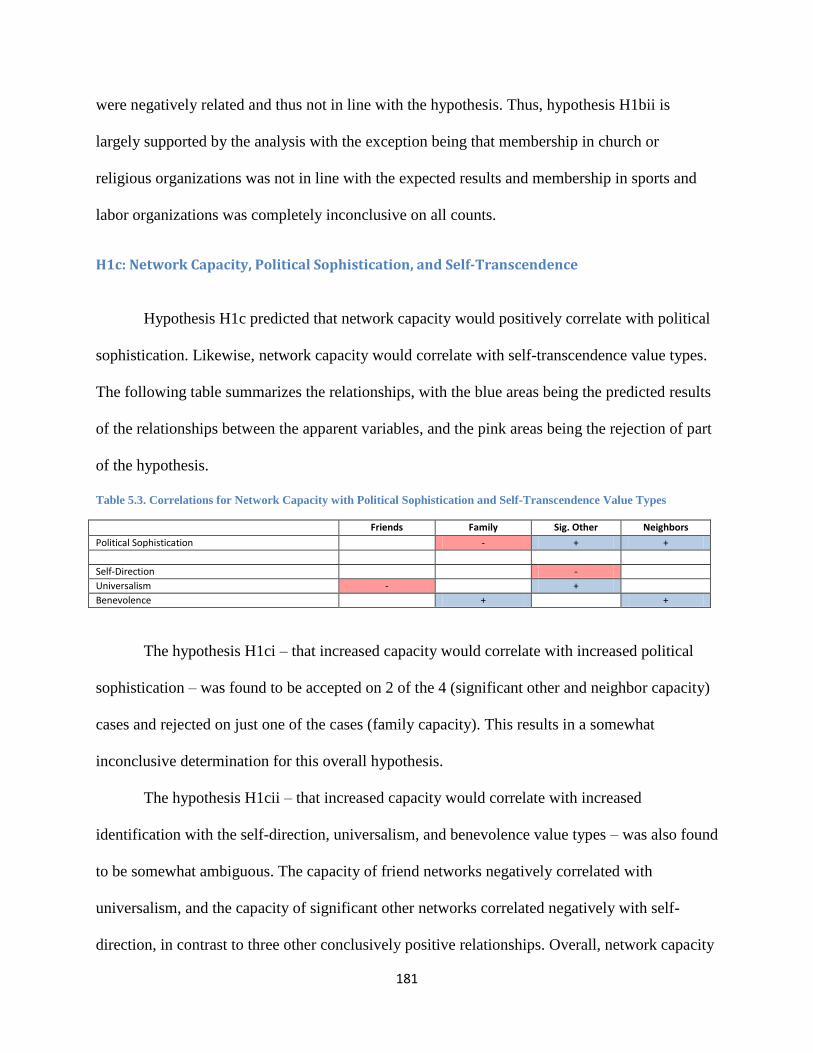
181
were negatively related and thus not in line with the hypothesis. Thus, hypothesis H1bii is
largely supported by the analysis with the exception being that membership in church or
religious organizations was not in line with the expected results and membership in sports and
labor organizations was completely inconclusive on all counts.
H1c: Network Capacity, Political Sophistication, and Self-Transcendence
Hypothesis H1c predicted that network capacity would positively correlate with political
sophistication. Likewise, network capacity would correlate with self-transcendence value types.
The following table summarizes the relationships, with the blue areas being the predicted results
of the relationships between the apparent variables, and the pink areas being the rejection of part
of the hypothesis.
Table 5.3. Correlations for Network Capacity with Political Sophistication and Self-Transcendence Value Types
Friends Family Sig. Other Neighbors
Political Sophistication - + +
Self-Direction -
Universalism - +
Benevolence + +
The hypothesis H1ci – that increased capacity would correlate with increased political
sophistication – was found to be accepted on 2 of the 4 (significant other and neighbor capacity)
cases and rejected on just one of the cases (family capacity). This results in a somewhat
inconclusive determination for this overall hypothesis.
The hypothesis H1cii – that increased capacity would correlate with increased
identification with the self-direction, universalism, and benevolence value types – was also found
to be somewhat ambiguous. The capacity of friend networks negatively correlated with
universalism, and the capacity of significant other networks correlated negatively with self-
direction, in contrast to three other conclusively positive relationships. Overall, network capacity

182
does not seem to be conclusively related to either political sophistication or the self-
transcendence value types.
H1d: Network Heterogeneity, Political Sophistication, and Self-Transcendence
Hypothesis H1d predicted that network heterogeneity would positively correlate with
political sophistication. Likewise, network heterogeneity would correlate with self-transcendence
value types. The following table summarizes the relationships, with the blue areas being the
predicted results of the relationships between the apparent variables, and the pink areas being the
rejection of part of the hypothesis.
Table 5.4. Correlations for Network Heterogeneity with Political Sophistication and Self-Transcendence Value Types
Network Heterogeneity Factor
Political Sophistication
Self-Direction +
Universalism +
Benevolence
The first hypothesis in this set (H1di) expected political sophistication to be positively
correlated with network heterogeneity, but was inconclusive. Although the hypothesis cannot be
supported, it can also not be conclusively rejected. Future studies may still show that the
predicted relationship exists. The second part of this hypothesis (H1dii) expected the self-
transcendence values to be positively correlated with network heterogeneity and was accepted.
The study showed that two of the three self-transcendence values were positively correlated with
network heterogeneity.
H1e: Trust of Strangers, Political Sophistication, and Self-Transcendence
Hypothesis H1e predicted that trust of strangers would positively correlate with political
sophistication. Likewise, trust of strangers would correlate with self-transcendence value types.

183
The following table summarizes the relationships, with the blue areas being the predicted results
of the relationships between the apparent variables, and the pink areas being the rejection of part
of the hypothesis.
Table 5.5. Correlations for Trust of Strangers and General Trust with Political Sophistication and Self-Transcendence
Value Types
Just Met Another Rel. Another Nat. Another Race General Trust
Political Sophistication + + +
Self-Direction + + +
Universalism + + + + +
Benevolence + + + + +
Hypothesis H1ei – that trust of strangers would correlate with an increase in political
sophistication – was generally met. Two of the four stranger variables (trust of people just met
and of another race) were conclusively and positively correlated with political sophistication
while the general trust factor was also positively correlated. The other two stranger trust
variables were inconclusive. Thus, the data provides evidence in support of hypothesis H1ei.
The data also supports the hypothesis H1eii – that trust of strangers is positively
correlated with the self-transcendence value types. Indeed, 13 of the 15 possible relationships
with the trust variables in the table were found to conclusively and positively correlate with each
of the self-transcendence value types. However, self-direction was not conclusively correlated
with either trust of people just met or trust of people of another religion.
H1f: Network Horizontality, Political Sophistication, and Self-Transcendence
Hypothesis H1f predicted that network horizontality would positively correlate with
political sophistication. Likewise, network horizontality would correlate with self-transcendence
value types. The following table summarizes the relationships, with the blue areas being the

184
predicted results of the relationships between the apparent variables, and the pink areas being the
rejection of part of the hypothesis.
Table 5.6. Correlations for Network Horizontality with Political Sophistication and Self-Transcendence Value Types
Network Horizontality
Political Sophistication
Self-Direction +
Universalism +
Benevolence +
The first hypothesis in this set (H1fi) expected political sophistication to be positively
correlated with network horizontality, but was inconclusive. The second part of this hypothesis
(H1fii) expected the self-transcendence values to be positively correlated with network
horizontality and was accepted. The study showed that the self-direction, universalism, and
benevolence value types were positively correlated with network horizontality.
H1g: Reciprocity, Political Sophistication, and Self-Transcendence
Hypothesis H1g predicted that reciprocity would positively correlate with political
sophistication. Similarly, reciprocity would correlate with self-transcendence value types. The
following table summarizes the relationships, with the blue areas being the predicted results of
the relationships between the apparent variables, and the pink areas being the rejection of part of
the hypothesis.
Table 5.7. Correlations for Reciprocity with Political Sophistication and Self-Transcendence Value Types
Network Reciprocity
Political Sophistication
Self-Direction +
Universalism +
Benevolence +
The first hypothesis in this set (H1gi) expected political sophistication to be positively
correlated with reciprocity, but was inconclusive. The second part of this hypothesis (H1gii)

185
expected the self-transcendence values to be positively correlated with reciprocity and was
accepted. The study showed that the self-direction, universalism, and benevolence value types
were positively correlated with network horizontality.
H2a: Network Closure, Political Sophistication, and Self-Enhancement
Hypothesis H2a predicted that network closure would negatively correlate with political
sophistication. On the other hand, it was expected that network closure would correlate
positively with self-enhancement value types. The following table summarizes the relationships,
with the blue areas being the predicted results of the relationships between the apparent variables,
and the pink areas being the rejection of part of the hypothesis.
Table 5.8. Correlations for Network Closure with Political Sophistication and Self-Enhancement Value Types
Network Closure
Political Sophistication -
Self-Enhancement
Stimulation +
Hedonism
Achievement
Power
The first hypothesis in this set (H2ai) expected political sophistication to be negatively
correlated with network closure and was accepted. The second part of this hypothesis (H2aii)
expected the self-enhancement values to be positively correlated with network closure and was
largely inconclusive. However, the study did show that there was a positive correlation between
one of the self-enhancement value types (stimulation) and closure.
H2b: Network Density, Political Sophistication, and Self-Enhancement
Hypothesis H2b predicted that network density would negatively correlate with political
sophistication. On the other hand, it was expected that network density would correlate

186
positively with self-enhancement value types. The following table summarizes the relationships,
with the blue areas being the predicted results of the relationships between the apparent variables,
and the pink areas being the rejection of part of the hypothesis.
Table 5.9. Correlations for Network Density with Political Sophistication and Self-Enhancement Value Types
Network Density
Political Sophistication
Self-Enhancement +
Stimulation +
Hedonism +
Achievement
Power +
The first hypothesis in this set (H2bi) expected political sophistication to be negatively
correlated with network density, but was inconclusive. The second part of this hypothesis (H2bii)
expected the self-enhancement values to be positively correlated with network density and was
accepted. The study showed that not only did network density correlate positively with the self-
enhancement factor, but also with the stimulation, hedonism, and power value types.
Summary of Findings
In summary, this research finds that particular social capital characteristics can both
positively and negatively affect political sophistication. The research found that strong networks
with a significant other, neighborliness, trust of strangers, general trust, and importance of formal
networks all significantly correlate with greater political sophistication. On the other hand, trust
in representative government and major corporations, trust in protective services, strong
religiosity, and high closure all correspond negatively with political sophistication.
Table 5.10. Positive Social Capital Correlations with Political Sophistication
Participation in Non-Religious Humanitarian Org. 0.126*** Participation in a Political Party 0.265*** Participation in an Environmental Org. 0.179*** Participation in a Professional Org. 0.142***

187
Participation in a Consumer Org. 0.078** Significant Other Capacity 0.069* Neighbor Capacity 0.128*** General Trust Factor 0.061* * 10% significance ** 5% significance *** 1% significance
Table 5.11. Negative Social Capital Correlations with Political Sophistication
Importance of Family -0.076** Importance of Significant Other -0.069* Participation in a Church or Religious Org. -0.087** Family Capacity -0.076** Closure -0.114*** Representative Government Trust Factor -0.222*** Trust in Protective Services Factor -0.107*** Kinship and Religiosity Factor -0.139*** * 10% significance ** 5% significance *** 1% significance
Participation in non-religious humanitarian organizations positively related to political
sophistication. So, as participation in non-religious humanitarian organizations increases, so
should political sophistication. This may be explained by increased information transfer within
these particular groups.
Three values positively correlated with participation in non-religious humanitarian
organizations; self-direction, universalism, and benevolence. Only conformity negatively
correlated with participation in non-religious humanitarian organizations.
Table 5.12. Value Correlations with Participation in Non-Religious Humanitarian Organizations
Self-Direction Universalism
0.093** 0.096**
Benevolence 0.124*** Conformity -0.066* * 10% significance ** 5% significance *** 1% significance

188
Participation in a political party also positively correlates with political sophistication.
The only values variable that was conclusively related to participation in a political party was
stimulation and it was negatively related to participation in a political party.
Table 5.13. Value Correlations with Participation in a Political Party
Stimulation -0.117*** * 10% significance ** 5% significance *** 1% significance
Participation in an environmental organization was positively related to political
sophistication. Two of the three transcendence values, self-direction and universalism, were
positively related to participation in an environmental organization while tradition, conformity,
security, power, and hedonism were negatively related. Accordingly, the conservation factor was
also negatively related to participation in environmental organizations; however, stimulation was
positively related.
Table 5.14. Value Correlations with Participation in an Environmental Organization
Self-Direction 0.079** Universalism 0.295*** Tradition -0.098*** Conformity -0.055* Security -0.119*** Power -0.183*** Stimulation 0.081** Hedonism -0.071** Conservation -0.109*** * 10% significance ** 5% significance *** 1% significance
Participation in professional organizations was positively related to political
sophistication. Only one value type was positively related to participation in professional
organizations (universalism). Self-direction, tradition, power, stimulation, and hedonism were all

189
negatively related to this social capital variable. Overall, self-enhancement was negatively
related to participation in professional organizations.
Table 5.15. Value Correlations with Participation in Professional Organizations
Self-Direction -0.063* Universalism 0.075** Tradition -0.056* Power -0.061* Stimulation -0.128*** Hedonism -0.125*** Self-Enhancement -0.102*** * 10% significance ** 5% significance *** 1% significance
Participation in a consumer organization was positively correlated with political
sophistication. Not only were two self-transcendence variables (self-direction and benevolence)
positively correlated with participation in a consumer organization, but so were two other values
(tradition and achievement). Further investigation may be needed for an explanation of this
relationship. Overall, conservation was positively related to participation in a consumer
organization.
Table 5.16. Value Correlations with Participation in a Consumer Organization
Self-Direction 0.067* Benevolence 0.079** Tradition 0.092** Achievement 0.060* Conservation 0.066* * 10% significance ** 5% significance *** 1% significance
Strong significant other capacity was shown to be positively related to political
sophistication. So, as the capacity of that relationship increases, so should political sophistication.
This may be explained by increased and substantively deeper political discourse while in a

190
coupled relationship; however, this is only an assumption and evidence may need to be gathered
for the reasoning behind this correlation.
The only value that positively correlated with significant other capacity was universalism.
Self-direction, power, stimulation, and hedonism all negatively correlated with significant other
capacity. Overall, the self-enhancement value factor negatively correlated with significant other
networks.
Table 5.17. Value Correlations with Significant Other Capacity
Self-Direction -0.081** Universalism 0.064* Power -0.091** Stimulation -0.141*** Hedonism -0.129*** Self-Enhancement -0.141*** * 10% significance ** 5% significance *** 1% significance
Neighbor capacity also positively correlated with political sophistication. The
relationship here may be fairly evident. If neighbors are more tightly knit into a more effective
social network, then this would facilitate the transfer of ideas and information from one neighbor
to the next (Putnam 2000). Neighbor capacity may also indicate how much of a stake a person
believes they have in their community and may be correlated with ownership of residence and
length of residence.
Neighbor capacity was significantly positively correlated only with benevolence. No
other relationships were significant in the analysis.
Table 5.18. Value Correlations with Neighbor Capacity
Benevolence 0.087** * 10% significance ** 5% significance *** 1% significance

191
General trust was shown to be positively related with political sophistication. The general
trust factor was created by combining the scores of all the personal trust (both familiar and
stranger) questions from the survey (excluding organizational trust questions). The positive
relationship was expected. The more one trusts others, the more likely new relationships and
network connections are. This, again, facilitates the transfer of knowledge and information from
one person or network to another.
General trust was significantly and positively correlated with universalism, benevolence,
and self-direction. However, power, achievement, tradition and hedonism negatively correlated
with the general trust factor.
Table 5.19. Value Correlations with General Trust Factor
Self-Direction 0.124*** Universalism 0.210*** Benevolence 0.232*** Tradition 0.064* Power -0.090** Achievement -0.063* Hedonism -0.061* * 10% significance ** 5% significance *** 1% significance
The importance of family was shown to be negatively related to political sophistication.
This variable is an indicator of kinship networks and can be considered part of bonding social
capital. The importance of family was significantly and positively correlated with universalism,
benevolence, tradition, conformity, and security. However, hedonism negatively correlated with
the importance of family. Overall, conservation was positively with the importance of family.
Table 5.20. Value Correlations with Importance of Family
Universalism 0.076** Benevolence 0.133*** Tradition 0.302***
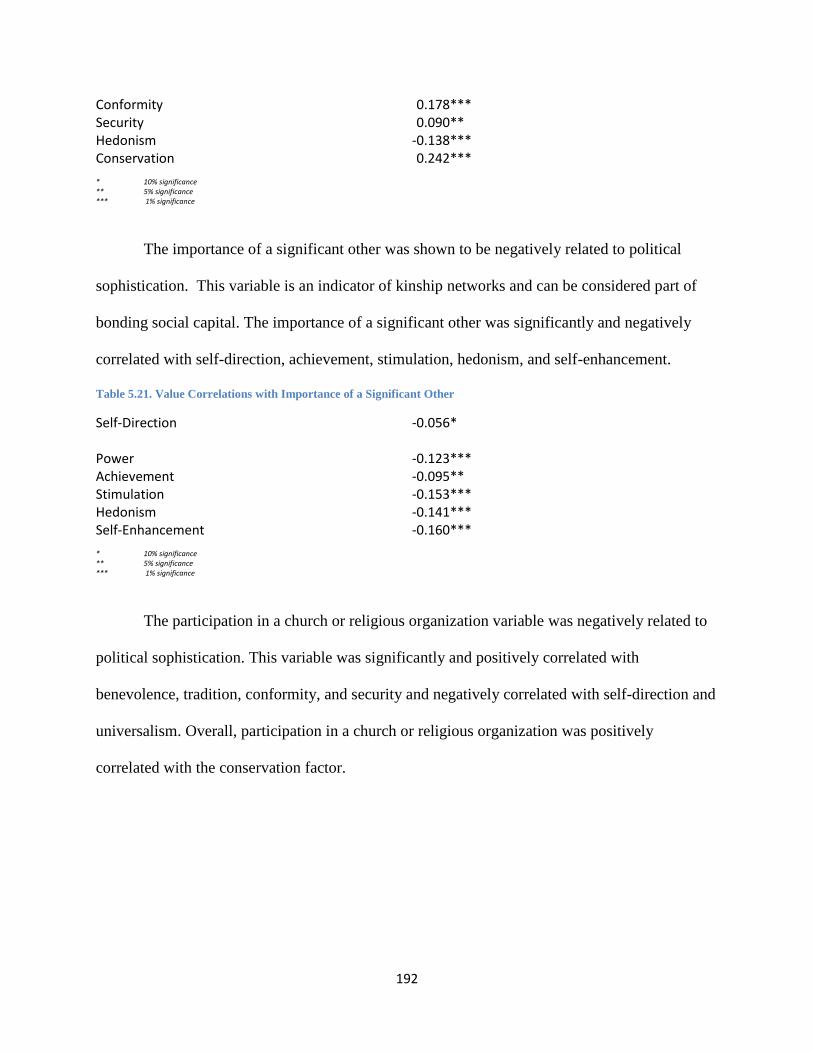
192
Conformity 0.178*** Security 0.090** Hedonism -0.138*** Conservation 0.242*** * 10% significance ** 5% significance *** 1% significance
The importance of a significant other was shown to be negatively related to political
sophistication. This variable is an indicator of kinship networks and can be considered part of
bonding social capital. The importance of a significant other was significantly and negatively
correlated with self-direction, achievement, stimulation, hedonism, and self-enhancement.
Table 5.21. Value Correlations with Importance of a Significant Other
Self-Direction -0.056* Power -0.123*** Achievement -0.095** Stimulation -0.153*** Hedonism -0.141*** Self-Enhancement -0.160*** * 10% significance ** 5% significance *** 1% significance
The participation in a church or religious organization variable was negatively related to
political sophistication. This variable was significantly and positively correlated with
benevolence, tradition, conformity, and security and negatively correlated with self-direction and
universalism. Overall, participation in a church or religious organization was positively
correlated with the conservation factor.

193
Table 5.22. Value Correlations with Participation in a Church or Religious Organization
Self-Direction -0.070** Universalism -0.112*** Benevolence 0.142*** Tradition 0.448*** Conformity 0.302*** Security 0.150*** Conservation 0.402*** * 10% significance ** 5% significance *** 1% significance
The family capacity variable was negatively related to political sophistication. This
variable was also significantly and positively correlated with benevolence, tradition, conformity,
security, power, achievement, and hedonism. Overall, family capacity was positively correlated
with the conservation and self-enhancement factors.
Table 5.23. Value Correlations with Family Capacity
Benevolence 0.063* Tradition 0.175*** Conformity 0.063* Security 0.074** Power 0.071** Achievement 0.068* Hedonism 0.057* Conservation 0.147*** Self-Enhancement 0.073** * 10% significance ** 5% significance *** 1% significance
The closure variable was also negatively related to political sophistication. This factor is
actually a good measure for bonding type social capital in that bonded networks are expected to

194
be nearly entirely closed. This helps to confirm that bonding social capital may decrease
information flow from one person to another since it is likely people in bonded networks are
similar in ideology and less likely to share novel ideas or have disagreements (Putnam 2000).
Stimulation was positively correlated with closure while security was negatively correlated.
Table 5.24. Value Correlations with Closure and Density
Security -0.066* Stimulation 0.080** * 10% significance ** 5% significance *** 1% significance
Trust in representative government and major corporations was negatively related to
political sophistication. Recall that the trust in the representative government and major
corporations factor was composed mostly of trust in congress, political parties, and major
companies. The reason for this factor negatively correlating with political sophistication may be
that if people are more willing to trust the people that they put in charge or defer to on a daily
basis, they are less willing to educate themselves about matters that would normally concern
them; that is, they defer to the people they perceive to be in charge.
Trust in representative government and major corporations was shown to be positively
correlated with tradition, conformity, security, power, achievement, hedonism, and stimulation.
However, this factor was negatively related to universalism. Overall, both conservation and self-
enhancement were positively correlated with trust in representative government and major
corporations.

195
Table 5.25. Value Correlations with Trust in the Representative Government Factor
Universalism -0.065* Tradition 0.256*** Conformity 0.255*** Security 0.118*** Power 0.199*** Achievement 0.251*** Stimulation 0.078** Hedonism 0.110*** Conservation 0.272*** Self-Enhancement 0.205*** * 10% significance ** 5% significance *** 1% significance
Trust in protective services was also negatively related to political sophistication. This
factor consisted of the trust in the police, the courts, and armed forces variables. Again, as with
trust in representative government and major corporations, this correlation may stem from
people’s willingness to defer to entities perceived as being in charge. These people may also be
more inclined to be part of hierarchical networks with a slower flow of information from one
person to the next.
Tradition, conformity, security, power, and achievement were all significantly and
positively correlated with trust in protective services; however, universalism and self-direction
were negatively correlated. Overall, conservation negatively correlated with trust in protective
services.

196
Table 5.26. Value Correlations with Trust in Protective Services Factor
Self-Direction -0.090** Universalism -0.069* Tradition 0.274*** Conformity 0.259*** Security 0.150*** Power 0.082** Achievement 0.122*** Conservation 0.301*** * 10% significance ** 5% significance *** 1% significance
The kinship and religiosity factor was negatively related to political sophistication. Recall
that this was a factor composed primarily of importance of family, activity in church or religious
organizations, activity in religious humanitarian organizations, and trust in religious leaders.
People who ranked high on the religiosity scale may be less concerned with politics than their
counterparts and may also be less likely to engage in connecting with people outside their own
religious group, thereby decreasing the flow of information. People with more religiosity may
also be susceptible to receiving incorrect political information.
Kinship and religiosity was significantly and positively correlated with benevolence,
tradition, conformity, and security and negatively correlated with universalism and hedonism.
Overall, religiosity was positively correlated with the conservation factor.

197
Table 5.27. Value Correlations with Kinship and Religiosity Factor
Universalism -0.067* Benevolence 0.216*** Tradition 0.518*** Conformity 0.344*** Security 0.142*** Hedonism -0.087** Conservation 0.445*** * 10% significance ** 5% significance *** 1% significance
This study shows that some combinations of social network and norm characteristics can
possibly be helpful to the development of political sophistication while others could be harmful.
The positive effects tend to show signs of more bridging social capital than not. For example,
neighborliness and trust of strangers are typically related to bridging social capital. Furthermore,
the negative correlations with political sophistication tend to be what can be termed as bonding
social capital characteristics. These are typically characteristics associated with in-group
similarities and hierarchy such as religiosity, closure and density, and trust in the federal
government and major corporations. The distinction between the varying effects seems to lie in
an explanation based upon the bridging versus bonding social capital argument presented in
much of the literature.
Overall, this study shows a great deal of evidence that the self-transcendence value types
(self-direction, universalism, and benevolence) largely drive increases in political sophistication.
On the other hand, the study shows a great deal of evidence that the self-enhancement

198
(stimulation, hedonism, achievement, and power) and conservation (security, conformity, and
tradition) value types correspond to decreased political sophistication. The study explains this by
showing that self-transcendence values are correlated with social capital characteristics that
positively interact with political sophistication and encourage information flow. Likewise, self-
enhancement and conservation values show the opposing correlation and bring about social
capital characteristics that correlate negatively with political sophistication.
Furthermore, this study shows that developing a regression model for the prediction of
the level of political sophistication is indeed feasible. The best regression model found in this
dissertation explains 40.1% of the variance in political sophistication. This specific regression
model includes demographic and social capital variables as well as the political interest variable.
While this regression does not show much significance regarding social capital variables,
political interest – the most significant variable in the regression – does seem to be driven by
social capital factors. The table below summarizes the regression of social capital characteristics
on political interest, and this is a relationship that will need further investigation in future studies.
Table 5.28. Regression Results for Social Capital Regressed on Political Interest
Variable Standardized Coefficients (Constant) -2.019*** Importance of Family 0.155*** Importance of Neighbors 0.062 Participation in Labor Org. -0.108** Participation in Political Party 0.330*** Spatial 0.101** Density 0.093* Education 0.124** Age 0.160*** Activist Organization Belonging and Trust 0.182*** Trust in Protective Services -0.102** Kinship and Religiosity -0.178*** Heterogeneity 0.120** * 10% significance ** 5% significance *** 1% significance
Adjusted R2 = 0.298

199
This study also helps confirm the Schwartz value system. One should have noticed that
the significant correlations of the value types with social capital and political sophistication and
ideology variables conform to the premises set forth by Schwartz (1992); particularly that similar
value types will have similar effects and that opposing value types will have opposing effects.
This is evident from the data presented herein. For example, in the instance of trust of strangers,
universalism and benevolence (similar value types) both correlate positively while their opposing
value types – power, achievement, and hedonism – correlate negatively. This pattern occurs
throughout the study just as Schwartz surmised.
Implications
This study should enhance the body of knowledge used by political scientists,
sociologists, and psychologists pertaining to values and how they interact with decision-making
and should also advance policy and program creation, implementation, and analysis. This
research shows an association between values and larger political outcomes, and helps add to the
knowledge about how individuals make social and political decisions generally. The study also
helps contribute to a predictive model used to arrive at how much social capital and political
sophistication a person or population would have in the future. Community and political leaders
could also use the information gleaned by this study to tailor their programs and policies to
mitigate the effects of values on social capital and political sophistication.
The evidence shows that there may be truth in the thesis that values may perpetuate
predispositions against the formation of social capital and political sophistication. Recall that
since values are not flexible after adulthood, many people who hold values that may hinder the
formation of social capital and political sophistication may remain “stuck” throughout the
remainder of their lives. This can pose a major problem for the advancement of social capital and

200
political sophistication over generations; especially so if these same people impart the same
values onto their succeeding generations, creating a cycle of low social capital and low political
sophistication.
Another implication arises from the apparent confirmation of the Schwartz value system.
Since the value types behaved as predicted by this study and as formulated by Schwartz (1992),
this can lend credence to its use in other areas of political research such as voter turnout or
candidate perception. Perhaps, in the future, the Schwartz value types can be used as a standard
system for values research in political science. Indeed, according to Schwartz, this system should
be applicable not only in the United States, but in nearly every other nation worldwide.
Future Research
Since trust in the media positively related to political sophistication but was found to
positively correlate with value types that were unexpected, it may be worthwhile for a future
study to investigate why this is so. A study could investigate whether the effects of trust in the
media and the effects of how much people pay attention to the media on political sophistication
are any different (just because someone trusts the media does not necessarily mean that person
pays attention to the media or even that they get their news from the same source).
A future study should also investigate how political interest may factor into building a
more accurate measure for political sophistication. This study showed that, in addition to the
social capital and value variables presented, political interest is a key variable in building a
predictive model for political sophistication. However, political interest may also be considered
part of political sophistication or perhaps a necessary condition for political sophistication to
develop. Furthermore, as mentioned previously in this chapter, social capital variables seem to

201
have more to do with political interest than the political sophistication measure used in this study
in terms of regression and prediction; it would be useful to investigate this in a future study.
Additionally, more work needs to be done to develop a better measure for political
sophistication. While this study makes some progress, more should be done to integrate ideology
and possibly interest into the measure rather than relying exclusively upon political knowledge
of current events and a proxy theta accounting of a latent variable. Measures of social capital
characteristics also need to be refined, particularly to align them with many of the factors
determined in this study from the factor analysis (such as neighborliness and trust in media).
Media use should also be more explicitly determined and measured in the future.
Summary
This study began with a description of the problem that revolved around the example of
the Appalachian culture along with its strengths and weaknesses. This illustrated the problem
that values may indeed affect one’s propensity to develop particular social capital characteristics
that are amenable or detrimental – respectively – toward the development of political
sophistication. Thus, the purpose of this study was to enhance the body of knowledge about
values, social capital, and political sophistication while also giving community leaders a tool to
better understand their own population and culture and how that may evolve into particular social
and political outcomes.
This study found that is a definite pattern with respect to Schwartz value types, social
capital, and political sophistication. Value types such as self-direction, universalism, and
benevolence generally contribute to social capital characteristics that are helpful to the
development of political sophistication. Similarly, the same value types seem to diminish those

202
social capital characteristics that degrade political sophistication; thus, both acting as a catalyst
for social capital development and a line of protection against its degradation.
On the other hand, the study found that Schwartz value types associated with self-
enhancement (stimulation, hedonism, achievement, and power) correlate with both social capital
characteristics that serve to deplete political sophistication and with political sophistication
directly. Likewise, these same value types diminish the social capital characteristics that enhance
the presence of political sophistication. Hence, the self-enhancement value types overall tend to
degrade social capital characteristics that seem necessary for higher political sophistication.
The study also showed that a fairly strong predictive model for political sophistication
can be built using regression as well as showing that the Schwartz value system acts as predicted
with both the social capital and political sophistication phenomena. The explanatory variables
included in the best regression were derived from factor analysis and composite social capital
variables along with demographic variables and political interest. Indeed, preliminary data
derived from this study shows a strong link between political interest and many social capital
characteristics. This link deserves the attention of future studies as well as the possible link
between political interest and Schwartz value types.
Bibliography alejandro. 2012. The Mismeasure of Students: Using Item Response Theory Instead of Traditional
Grading to Assess Student Proficiency. June 7. Accessed December 29, 2012.
http://www.knewton.com/tech/blog/2012/06/understanding-student-performance-with-item-
response-theory/.
Amato, P. 1998. "More than money? Men’s contribution to their children’s lives." In Men in Families:
When do they get involved? What difference does it make?, by A. Booth and A. Creuter. New
Jersey: Lawrence Erlbaum.
n.d. Appalachian Regional Commission (ARC). Accessed October 11, 2012. http://www.arc.gov/.

203
Archives, Compiled by the West Virginia State. 2012. West Virginia's Mine Wars. Accessed December 11,
2012. http://www.wvculture.org/history/minewars.html.
Axelrod, Robert. 1984. The Evolution of Cooperation. New York: Basic Books.
Baum, F., C. Palmer, C. Modra, C. Murray, and R. Bush. 2000. "Families, social capital and health." In
Social Capital and Public Policy in Australia, by I. Winter, 250-275. Melbourne: Australian
Institute of Family Studies.
Bell, Daniel. 1996. "The Protestant Ethic." World Policy Journal 13 (3): 35-39.
Berg, Joyce, John Dickhaut, and Kevin McCabe. 1995. "Trust, Reciprocity, and Social History." Games and
Economic Behavior 10: 122-142.
Blais, André, E. Gidengil, N. Nevitte, and R. Nadeau. 2004. "Where Does Turnout Decline Come From?"
European Journal of Political Research 43: 221-236.
Brad, Gomez T., and J. Mattew Wilson. 2006. "Cognitive Heterogeneity and Economic Voting: A
Comparative Analysis of Four Democratic Electorates." American Journal of Political Science 50
(1): 127-145.
Brenot, Jean, Sylviane Bonnefous, and Claire Marris. 1998. "Testing the Cultural Theory of Risk in
France." Risk Analysis 18 (6): 729-739.
Cacioppo, John T., and Richard E. Petty. 1980. "Persuasiveness of Communications is Affected by
Exposure Frequency and Message Quality: A Theoretical and Empirical Analysis of Persisting
Attitude Change." Current Issues and Research In Advertising 3 (1): 97-122.
Campbell, Angus, Philip Converse, Warren Miller, and Donald Stokes. 1960. The American Voter. Chicago:
The University of Chicago Press.
Campbell, David E. 2004. "Acts of Faith: Churches and Political Engagement." Political Behavior 26 (2):
155-180.
Caprara, Gian V., Shalom H. Schwartz, Cristina Capanna, Michele Vecchione, and Claudio Barbaranelli.
2006. "Personality and Politics: Values, Traits, and Political Choice." Political Psychology 27 (1).
Cassese, Erin, Jeremey Zimmerman, and Lauren Santoro. 2012. "Political Engagement in Appalachia:
Distinctive Regional Subculture or Confluence of Demographic Variables?" APSA 2012 Annual
Meeting Paper. http://ssrn.com/abstract=2108204.
Chaiken, Shelly. 1980. "Heuristic versus systematic information processing and the use of source versus
message cues in persuasion." Journal of Personality and Social Psychology 39 (5): 752-766.
Chaiken, Shelly, and Mark W. Baldwin. 1981. "Affective-cognitive consistency and the effect of salient
behavioral information on the self-perception of attitudes." Journal of Personality and Social
Psychology 41 (1): 1-12.

204
Chisholm, D. 1995. "Problem-solving and institutional design." Journal of Public Administration Resource
Theory 5: 451-491.
Chong, Dennis, Herbert McClosky, and John Zaller. 1983. "Patterns of Support for Democratic and
Capitalist Values." British Journal of Political Science 13 (4): 401-440.
Cochran, M., M. Larner, D. Riley, L. Gunnarsson, and C. R. Henderson. 1990. Extending Families: The
social networks of parents and children. Cambridge, MA: Cambridge University Press.
Coleman, James S. 1990. Foundations of Social Theory. Cambridge, MA: Harvard University.
Coleman, James S. 1988. "Social Capital in the Creation of Human Capital." The American Journal of
Sociology 94: S95-S120.
Converse, P. E. 1964. "The nature of belief systems in mass publics." In Ideology and Discontent, by D. E.
Apter, 206-261. London: Free Press of Glencoe.
Converse, P.E. 1964. "The nature of belief systems in mass publics." In Ideology and disconent, by D.E.
Apter, 206-261. London: Free Press of Glencoe.
Cox, E. 1997. "Building Social Capital." Health Promotion Matters 4: 1-4.
Dasgupta, P. 1988. "Trust as a commodity." In Trust, by D. Gambetta, 49-72. Oxford: Basil Blackford.
Delli Carpini, Michael X., and Scott Keeter. 1996. What Americans Know About Politics and Why It
Matters. New Haven: Yale University Press.
Devine, Donald J. 1972. The Political Culture of the United States: The Influence of Member Values on
Regime Maintenance. Boston: Little, Brown.
Dirks, Kurt T. 1999. "The Effects of Interpersonal Trust on Work Group Performance." Journal of Applied
Psychology 84: 445-455.
Dolan, Kathleen. 2011. "Do Women and Men Know Different Things? Measuring Gender Differences in
Political Knowledge." The Journal of Politics 73 (1): 97-108.
Dow, Jay K. 2009. "Gender Differences in Political Knowledge: Distinguishing Characteristics." Political
Behavior 31 (1): 117-136.
Erisen, Cengiz. 2013. "Measuring Political Sophistication: An IRT Approach." Chicago, IL: MPSA Annual
National Conference.
n.d. European Values Survey. Accessed November 22, 2011. http://www.jdsurvey.net/evs/EVSData.jsp.
Eveland, William P., and Myiah Hutchens Hively. 2009. "Political Discussion Frequency, Network Size,
and ‘‘Heterogeneity’’ of Discussion as Predictors of Political Knowledge and Participation."
Journal of Communication 59: 205-224.
205
Feldman, Stanley. 1988. "Structure and Consistency in Public Opinion: The Role of Core Beliefs and
Values." American Journal of Political Science 32 (2): 416-440.
Feldman, Stanley. 2003. "Values, Ideology, and the Structure of Political Attitudes." In The Handbook of
Political Psychology, by David Sears, Leonie Huddy and Robert Jervis. New York: Stanford
University Press.
Feldman, Stanley, and Leonie Huddy. 2005. "Racial Resentment or White Opposition to Race-Conscious
Programs: Principles or Prejudice?" American Journal of Political Science 49 (1): 161-183.
Finch, J., and J. Mason. 1993. Negotiating Family Responsibilities. London: Tavistock Routledge.
Frazer, Elizabeth, and Ken Macdonald. 2003. "Sex Differences in Political Knowledge in Britain." Political
Studies 51 (1): 67-83.
Furstenberg, F. F., and M. E. Hughes. 1995. "Social capital and successful development among at-risk
youth." Journal of Marriage and the Family 57: 580-592.
Galston, William A. 2001. "Political Knowledge, Political Engagement, and Civic Education." Annual
Review of Political Science 4: 217-234.
Gerber, A., and D. P. Green. 1998. "Rational learning and partisan attitudes." American Journal of
Political Science 42: 794-818.
Gil de Zuniga, Homero, and Sebastian Valenzuela. 2011. "The Mediating Path to a Stronger Citizenship:
Online and Offline Networks, Weake Ties, and Civic Engagement." Communication Research 38:
397-421.
Gomez, Brad T., and J. Matthew Wilson. 2006. "Cognitive Heterogeneity and Economic Voting: A
Comparative Analysis of Four Democratic Electorates." American Journal of Political Science 50
(1): 127-145.
Gomez, Brad T., and J. Matthew Wilson. 2008. "Political Sophistication and Attributions of Blame in the
Wake of Hurricane Katrina." Publius 38 (4): 633-650.
Gomez, Brad T., and J. Matthew Wilson. 2001. "Political sophistication and economic voting in the
American electorate: A theory of heterogeneous attribution." American Journal of Political
Science 45: 899-914.
Good, David. 2000. "Individuals, Interpersonal Relations, and Trust." In Trust: Making and Breaking
Cooperative Relations, by Diego Gambetta. New York: Oxford University Press.
Goren, Paul. 2005. "Party Identification and Core Political Values." American Journal of Political Science
49 (4): 882-897.
Grootaert, C. 1998. Social Capital: The Missing Link? Social Capital Initiative Working Paper No. 3,
Washington, DC: The World Bank.

206
Halman, L. 2001. The European Values Study: A Third Wave Source Book of the 1999/2000 European
Values Study Surveys. Tilburg: Tilburg University Press.
Halpern, J., and R. Stern. 1998. Debating Rationality. Ithaca, NY: Cornell University Press.
Hartz, Louis. 2006. The Liberal Tradition in America. Belmont, CA: Thomas Learning.
Helliwell, J. F., and R. D. Putnam. 2004. "The Social Context of Well-Being." Philosophical Transactions of
the Royal Society of London 359: 1435-1446.
Hendriks Vettehen, P.G., and et al. 2004. "Political knowledge and media use in the Netherlands."
European Sociological Review 20: 415-424.
Hillygus, D. Sunshine. 2005. "The Missing Link: Exploring the Relationship Between Higher Education and
Political Engagement." Political Behavior 27 (1): 25-47.
Hofferth, S., J. Boisjoly, and G. J. Duncan. 1995. Do Families “Invest” in Social Capital? Research Report
no. 95-353, Ann Arbor, Michigan: Population Studies Center at the University of Michigan.
Hogan, D., and D. Owen. 2000. "Social Capital, Active Citizenship ad Political Equality in Australia." In
Social Capital and Public Policy in Australia, by I. Winter, 74-103. Melbourne: Australian Institute
of Family Studies.
Hughes, P., J. Bellamy, and A. Black. 2000. "Building social trust through education." In Social Capital and
Public Policy in Australia, by I. Winter, 225-249. Melbourne: Australian Institute of Family
Studies.
Hughes, P., J. Bellamy, and A. Black. 1998. "Social Capital and Religious Faith." Zadok Paper S97.
Inglehart, R. 1977. "The Silent Revolution in Europe: Intergenerational Change in Post-Industrial
Societies." American Political Science Review 65 (4): 991-1017.
Inglehart, R. 1979. "Value Priorities and Socioeconomic Change." In Political Action, by S.H. Barnes, Max
Kasse and et al. Beverly Hills, CA: Sage Publications.
Iyengar, Shanto, Mark D. Peters, and Donald R. Kinder. 1982. "Experimental Demonstrations of the "Not-
So-Minimal" Consequences of Television News." The American Political Science Review 76 (4):
848-858.
Jennings, Kent M. 1996. "Political Knowledge over Time and across Generations." Public Opinion
Quarterly 60 (2): 228-252.
Jones, Bryan D. 1999. "Bounded Rationality." Annual Political Science Review 2: 297-321.
—. 1994. The Sustaining Hand. Lawrence: University Press of Kansas.
Kahneman, D., and A. Tversky. 1983. "Choices, values, and frames." American Psychology 39: 341-350.
207
Kam, Cindy D. 2005. "Who Toes the Party Line? Cues, Values, and Individual Differences." Political
Behavior 27 (2): 163-182.
Katz, D. 1960. "The Functional Approach to the Study of Attitudes." Public Opinion Quarterly 24: 163-204.
Kinder, Donald, and Tali Mendelberg. 2000. "Individualism Reconsidered." In Racialized Politics, by David
Sears, Jim Sidanius and Larry Bobo. Chicago: University of Chicago Press.
Kingdon, J. 1996. Agendas, Alternatives, and Public Policies. Boston: Little, Brown.
Klingemann, H. 1979. "Measuring ideological conceptualizations." In Political Action, by S. Barnes, Max
Kasse and et al. Beverly Hills, CA: Sage Publications.
Knack, S., and P. Keefer. 1997. "Does social capital have an economic payoff? A cross-country
investigation." The Quarterly Journal of Economics November: 1251-1288.
Knight, Kathleen. 1984. "The dimensionality of partisan and ideological affect: The influence of
positivity." American Politics Quarterly 12: 305-334.
Kramer, R. M., and T. R. Tyler. 1996. Trust in Organizations: Frontiers of theory and research. California:
Sage.Kreuter, M. W., L. A. Young, and N. A. Lezin. 1999. Measuring Social Capital in Small
Communities. Atlanta, GA: Health 2000, Inc. in cooperation with St. Louis School of Public Health.
Krishna, A., and E. Shrader. 1999. Social Capital Assessment Tool. Social Capital Initiative Working Paper
No. 22, Washington, DC: The World Bank.
Kuklinski, J. H., P. J. Quirk, J. Jerit, D. Schweider, and R. F. Rich. 2000. "Misinformation and the Currency
of Democratic Citizenship." The Journal of Politics 62 (3): 790-816.
Latham, M. 2000. "If only men were angels: Social capital and the Third Way." In Social Capital and
Public Policy in Australia, by I. Winter, 192-224. Melbourne: Australian Institute of Family
Studies.
Lewis, Ronald, and Dwight Billings. 2009. Appalachian Culture and Economic Development. Working
Paper, Morgantown, WV: Regional Research Institute.
Lizotte, Mary-Kate, and Andrew H. Sidman. 2009. "Explaining the Gender Gap in Political Knowledge."
Politics and Gender 5 (2): 127-151.
Luskin, Robert C. 1990. "Explaining Political Sophistication." Political Behavior 12 (4): 331-361.
Luskin, Robert C. 1987. "Measuring Political Sophistication." American Journal of Political Science 31 (4):
856-899.
Mangen, D. J., and G. J. Westbrook. 1988. "Measuring intergenerational norms." In Measurement of
Intergenerational Relations, by D. J. Mangen, V. L. Bengston and P. H. Landry. California: Sage.

208
March, J. G. 1994. A Primer on Decision-Making. New York: Free Press.
Maslow, A. 1987. Motivation and Personality. 3rd edition. New York: HarperCollins.
McAllister, Ian. 1998. "Civic Education and Political Knowledge in Australia." Australian Journal of
Political Science 33 (1): 7-23.
McClosky, Herbert. 1964. "Consensus and Ideology in American Politics." American Political Science
Review 87: 688-701.
McClosky, Herbert, and John Zaller. 1984. The American Ethos: Public Attitudes toward Capitalism and
Democracy. Cambridge, MA: Harvard University Press.
McEvoy, Chad Joseph. 2002. "A Consideration of Human Xenophobia and Ethnocentrism from a
Sociobiological Perspective." Human Rights Review 3 (3): 39-49.
Miller, Arthur H., and Warren E. Miller. 1972. "Ideology in the 1972 Election: Myth or reality - a
rejoinder." American Political Science Review 70: 832-849.
Mondak, Jeffery J., and Mary R. Anderson. 2004. "The Knowledge Gap: A Reexamination of Gender-
Based Differences in Political Knowledge." Journal of Politics 66 (2): 492-512.
Narayan, D. 1999. Bonds and Bridges: Social Capital and Poverty. Washington, DC: World Bank.
Neuman, W.R. 1986. The paradox of mass politics. Cambridge, MA: Harvard University Press.
Nyhan, Brendan, and Jason Reifler. 2010. "When Corrections Fail: The Persistence of Political
Misperceptions." Political Behavior 32: 303-330.
Onyx, J., and P. Bullen. 1997. Measuring Social Capital in Five Communities in NSW: An analysis. Centre
for Community Organisations and Management Working Paper Series No. 41, Sydney: University
of Technology.
Onyx, J., and P. Bullen. 2000. "Sources of social capital." In Social Capital and Public Policy in Australia,
by I. Winter, 105-134. Melbourne: Australian Institute of Family Studies.
Paldam, M., and T. G. Svendsen. 1999. Is Social Capital an Effective Smoke Condenser? An essay on a
concept linking the social sciences. Social Capital Initiative Working Paper No. 11, Washington,
DC: The World Bank.
Papadakis, E. 1988. Attitudes to State and Private Welfare, Australia. User's Guide, SSDA Study No. 595.
Partcev, Ivailo. 2004. "A visual guide to item response theory." metheval.uni-jena.de. February 6.
Accessed December 20, 2012. www.metheval.uni-jena.de/irt/VisualIRT.pdf.
Pollitt, K. 1999. TheNation.Com. Accessed October 15, 2012.
http://www.thenation.com/issue/960415/0415poll.htm.

209
Pollock, P. H., S. A. Lilie, and M. E. Vittes. 1993. "Hard Issues, Core Values and Vertical Constraint: The
Case of Nuclear Power." British Journal of Political Science 23: 29-50.
Portney, K. E., and J. M. Berry. 1997. "Mobilizing minority communities: Soical capital and participation
in urban neighborhoods." American Behavioral Scientist 40 (5): 362-644.
Prior, Markus. 2010. "You’ve Either Got It or You Don’t? The Stability of Political Interest over the Life
Cycle." The Journal of Politics 72 (3): 747-766.
Putnam, Robert D. 2000. Bowling Alone: The Collapse and Revival of American Community. New York:
Simon and Schuster.
Putnam, Robert D. 1995. "Bowling along: America's declining social capital." Journal of Democracy 6 (1):
65-78.
Putnam, Robert D. 1998. "Foreword." Housing Policy Debate 9 (1): v-viii.
Putnam, Robert D. 1993. "The prosperous community: social capital and public life." The American
Prospect 12 (4).
Rawls, John. 1999. A Theory of Justice. Cambridge, MA: Harvard University Press.
Rochefort, D., and R. Cobb. 1994. The Politics of Problem Definition. Lawrence: University Press of
Kansas.
Rokeach, M. 1968. Beliefs, Attitudes and Values. San Francisco, CA: Jossey-Bass.
—. 1973. The Nature of Human Values. New York: Free Press.
Rudolph, Thomas J. 2003. "Who's Responsible for the Economy? The Formation and Consequences of
Responsibility Attributions." American Journal of Political Science 47 (4): 698-713.
Sampson, R. J., S. W. Raudenbush, and F. Earls. 1997. "Neighborhoods and violent crime: A multilevel
study of collective efficacy." Science 277: 918-924.
Schwartz, Shalom H. 1994. "Are there Universal Aspects in the Structure and Contents of Human
Values?" Journal of Social Issues 50 (4): 19-45.
Schwartz, Shalom H. 2006. "Basic human values: Theory, measurement, and application." Revue
française de sociologie.
Schwartz, Shalom H. 1992. "Universals in the Content and Structure of Values: Theory and Empirical
Tests in 20 Countries." In Advances in Experimental Social Psychology, by M. Zanna. New York:
Academic Press.
Schwartz, Shalom H., and W. Bilsky. 1987. "Toward a Universal Psychological Structure of Human
Values." Journal of Personality and Social Psychology 53: 550-562.

210
Scott, J. 1991. Social Network Analysis: A Handbook. London: Sage Publications.
Sears, David, P. J. Henry, and Rick Kosterman. 2000. "Egalitarian Values and Contemporary Racial
Politics." In Racialized Politics, by David Sears, Jim Sidanius and Larry Bob. Chicago: Univresity of
Chicago Press.
Simon, H. A. 1995. "Rationality in Political Behavior." Political Psychology 16: 45-61.
—. 1983. Reason in Human Affairs. Stanford, CA: Stanford University Press.
Simon, H. A. 1999. "The potlatch between political science and economics." In Competition and
Cooperation: Conversations with Nobelists about Economics and Political Science, by J. Alt, M.
Levi and E. Ostrom. Cambridge, UK: Cambridge University Press.
—. 1996. The Sciences of the Artificial. Cambridge, MA: MIT Press.
Simon, H.A. 1983. Reason in Human Affairs. Stanford, CA: Stanford University Press.
Skocpol, Theda. 1999. "Associations without members." The American Prospect 45: 1-8.
Slovak, P. 1990. "Choice." In Thinking: An Invitation to Cognitive Science, by D. N. Osherson and E. E.
Smith, 89-116. Cambridge, MA: MIT Press.
Stewart-Weeks, M., and C. Richardson. 1998. Social Capital Storis: How 12 Australian households live
their lives. Sidney: Policy Monograph 42, The Centre for Independent Studies.
Stone, Wendy. 2001. Measuring Social Capital: Towards a theoretically informed measurement
framework for researching social capital in family and community life. Australian Institute of
Family Studies.
Taber, Charles S., and Milton Lodge. 2006. "Motivated Skepticism in the Evaluation of Political Beliefs."
American Journal of Political Science 50 (3): 755-769.
2012. The Appalachian Regional Commission. Accessed December 13, 2013.
http://www.arc.gov/appalachian_region/TheAppalachianRegion.asp.
Travis, Merle. 1955. 16 Tons. Comp. E. Ford.
2012. UK National Survey of Voluntary Activity. October 11. Accessed October 11, 2012.
http://discover.ukdataservice.ac.uk/catalogue/?sn=3931&type=Data%20catalogue.
Uslaner, E. M. 1999. "Trust and Consequences." Paper presented to the Communitarian Summit,
February 1999. Arlington, VA.
Uslaner, E. M. 1999. "Trust but verify: Social capital and moral behavior." Social Science Information 38:
29-56.

211
Uslaner, Eric M., and Mitchell Brown. 2005. "Inequality, Trust, and Civic Engagement." American Politics
Research 33: 868-894.
Verba, Sidney, and Norman H. Nie. 1972. Participation in America: Political Democracy and Social
Equality. Chicago, IL: The University of Chicago Press.
Verba, Sidney, Nancy Burns, and Kay Schlozman. 1997. "Knowing and Caring about Politics: Gender and
Political Engagement." The Journal of Politics 59 (4): 1051-1072.
Wass, Hanna. 2003. "The Effects of Age, Generation and Period on Turnout in Finland 1975 - 2003."
Electoral Studies 26 (3): 648-659.
Wittman, D. 1995. The Myth of Democratic Failure. Chicago: University of Chicago Press.
Woolcock, M. 2000. "Why should we care about social capital?" Canberra Bulletin of Public
Administration 98: 17-19.
n.d. World Values Survey. Accessed November 18, 2011. http://www.worldvaluessurvey.org/.
Wychoff, Mikel. 1980. "Belief system constraint and policy voting: A test of the unidimen- sional
consistency model." Political Behavior 2: 115-146.

212
Appendices

213
Appendix A: The Circular Arrangement of Schwartz Value Types
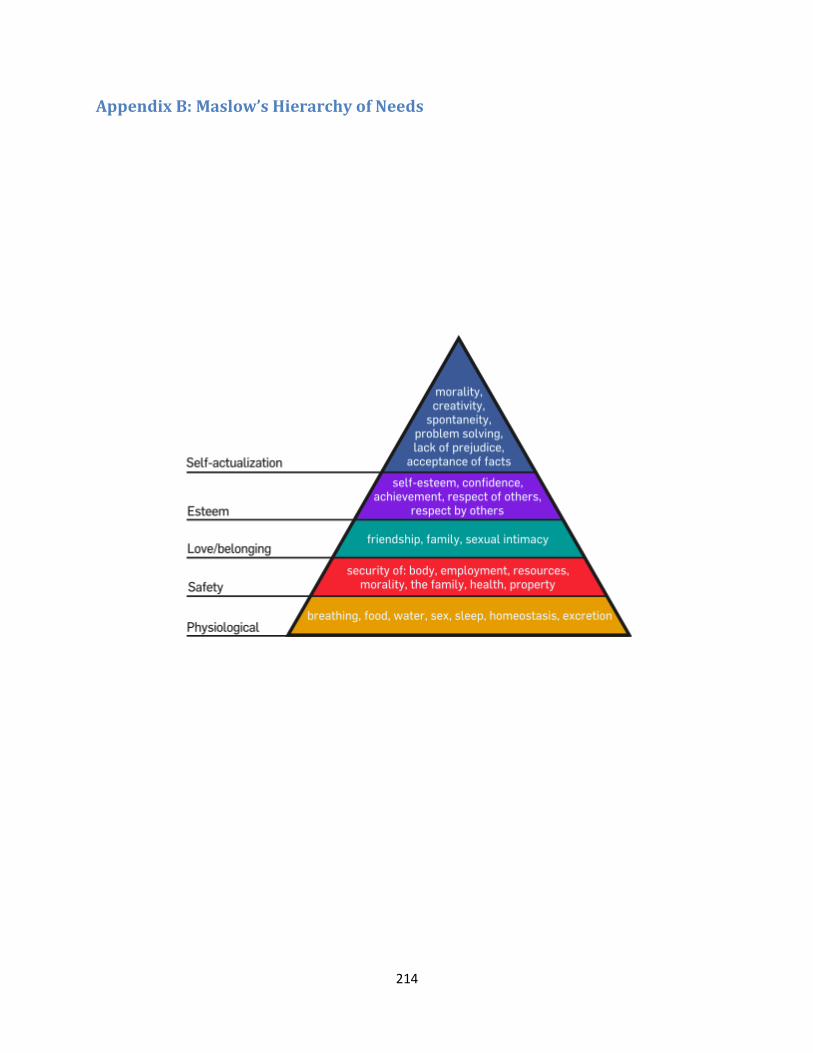
214
Appendix B: Maslow’s Hierarchy of Needs

215
Appendix C: Significant One-Tailed Pearson Correlations between Value Types
Univ. Ben. Trad. Conf. Sec. Pow. Ach. Hed. Stim. Self-D.
Univ. 0.322 -0.253 0.140 0.149
Ben. 0.322 0.152 -0.109 0.170
Trad. 0.448 0.238 0.204
Conf. 0.448 0.367 0.265
Sec. 0.238 0.367 0.241 -0.085
Pow. -0.253 0.213 0.463 0.473
Ach. 0.265 0.463 0.377
Hed. 0.473 0.377 0.305
Stim. -0.085 0.251 0.305 0.330
Self-D. 0.149 0.170 0.330

216
Appendix D: SC Factor: Civic Organizations and Executive Government
Demographic Charts

217

218
Appendix E: SC Factor: Ethnic Trust Demographic Charts
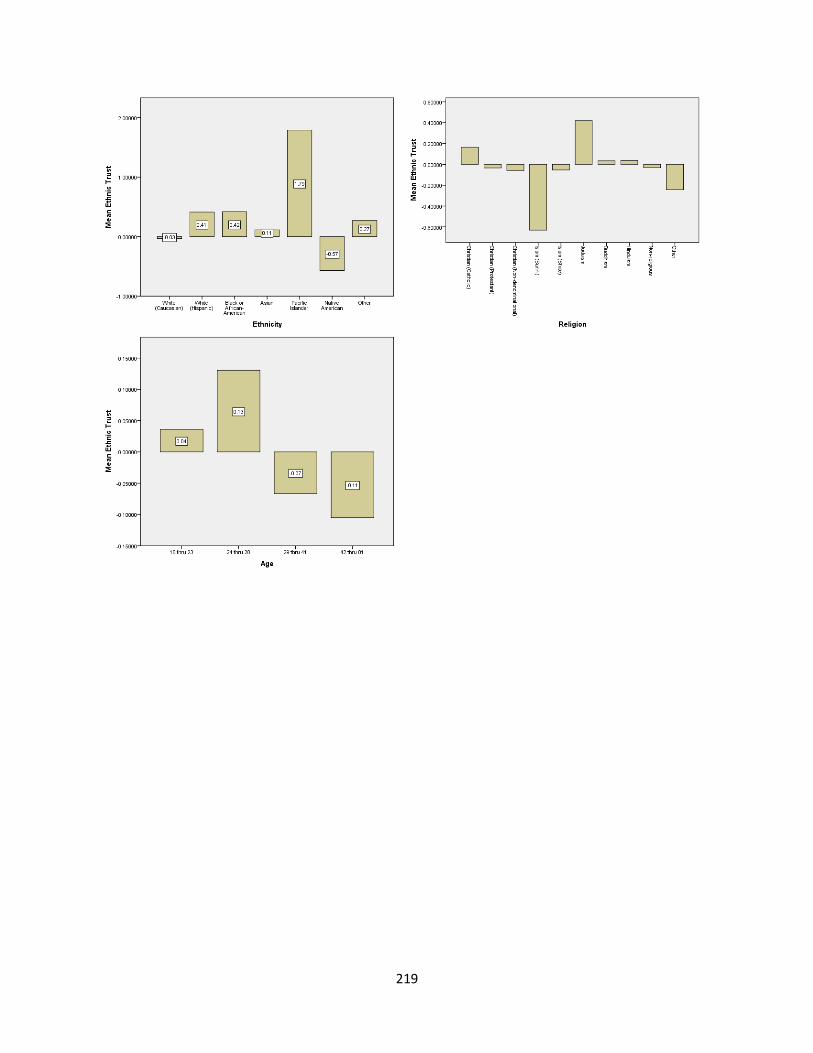
219

220
Appendix F: SC Factor: Trust in Government and Major Corporations
Demographic Charts
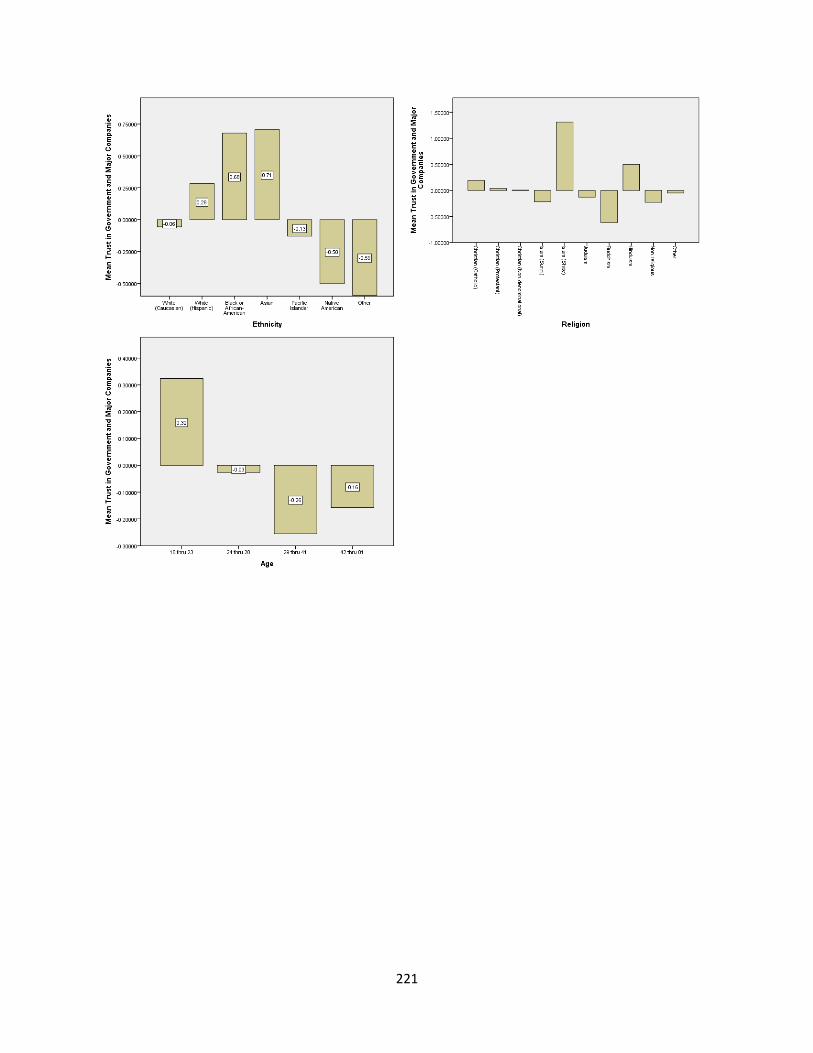
221

222
Appendix G: SC Factor: Trust in Legal Enforcement Demographic Charts

223

224
Appendix H: SC Factor: Significant Other Demographic Charts

225

226
Appendix I: SC Factor: Religiosity Demographic Charts

227

228
Appendix J: SC Factor: Organizational Activism Demographic Charts

229

230
Appendix K: SC Factor: Non-Ethnic Heterogeneity Demographic Charts

231
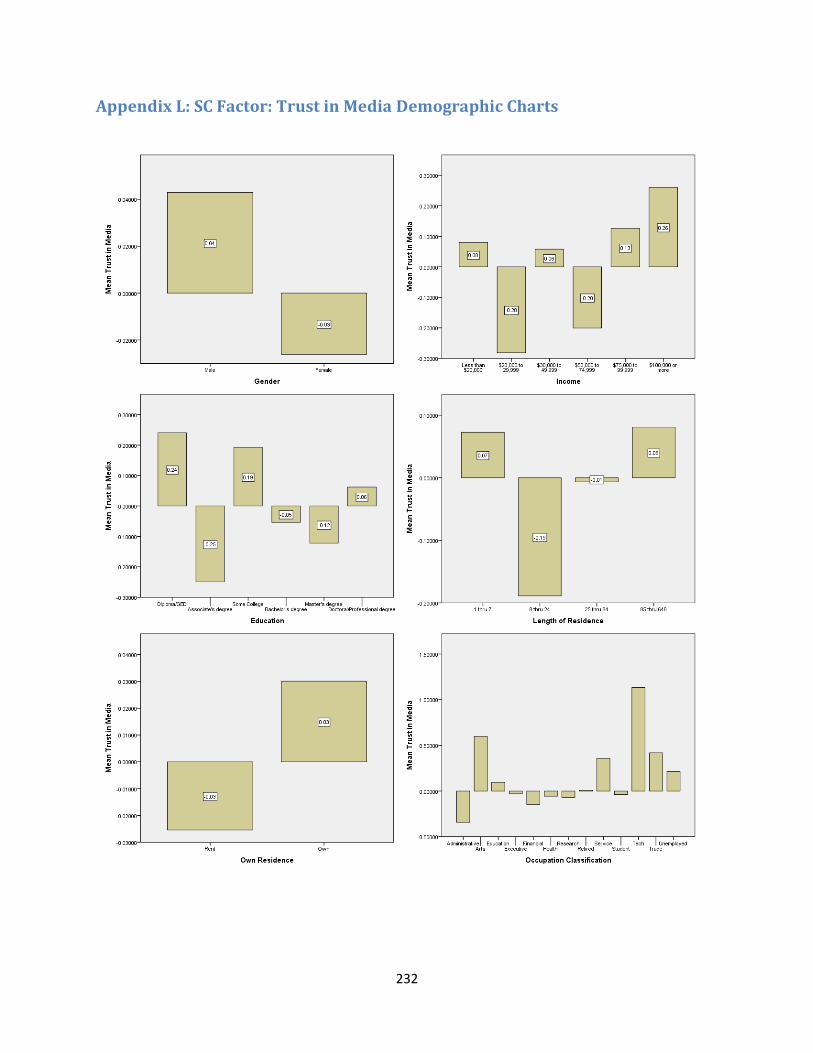
232
Appendix L: SC Factor: Trust in Media Demographic Charts

233

234
Appendix M: SC Factor: Neighborliness Demographic Charts
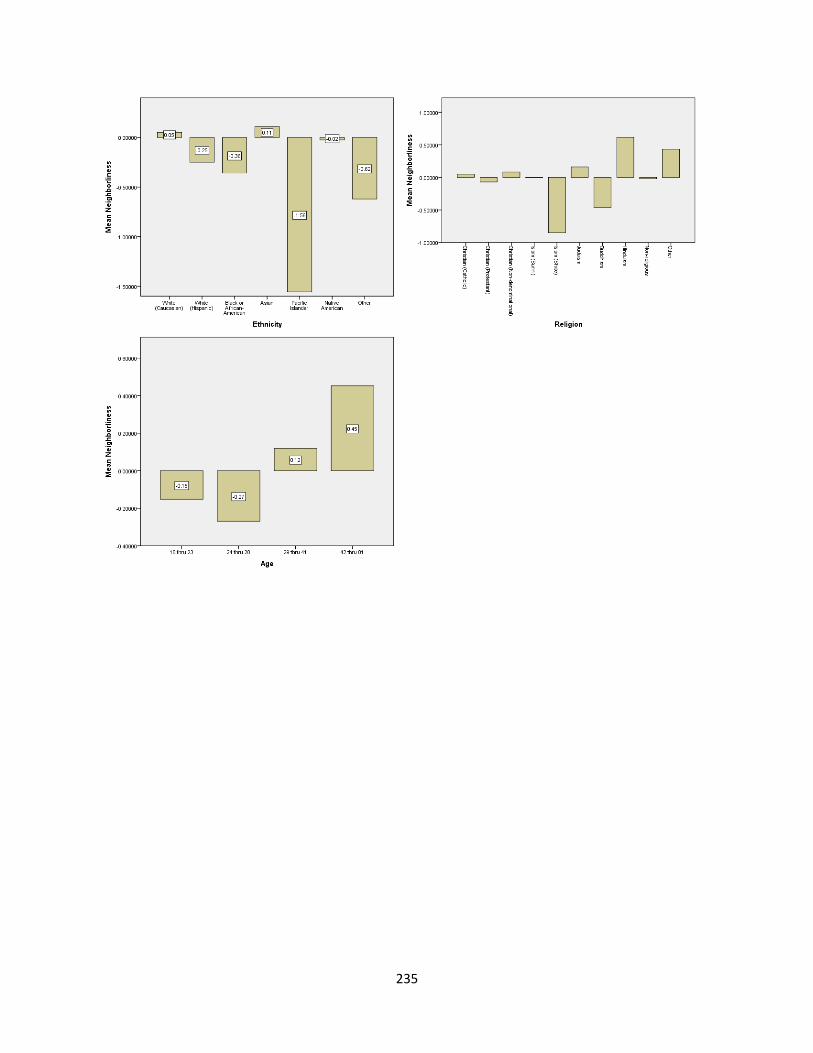
235
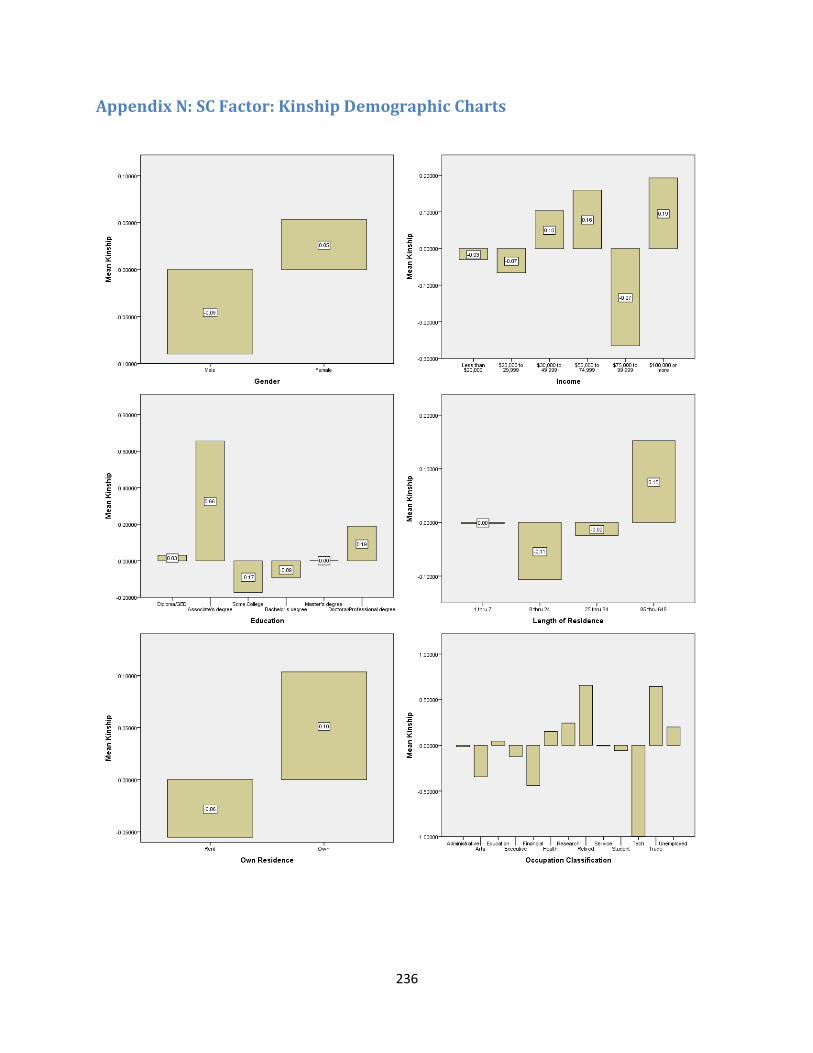
236
Appendix N: SC Factor: Kinship Demographic Charts

237

238
Appendix O: SC Factor: Ethnic Heterogeneity Demographic Charts
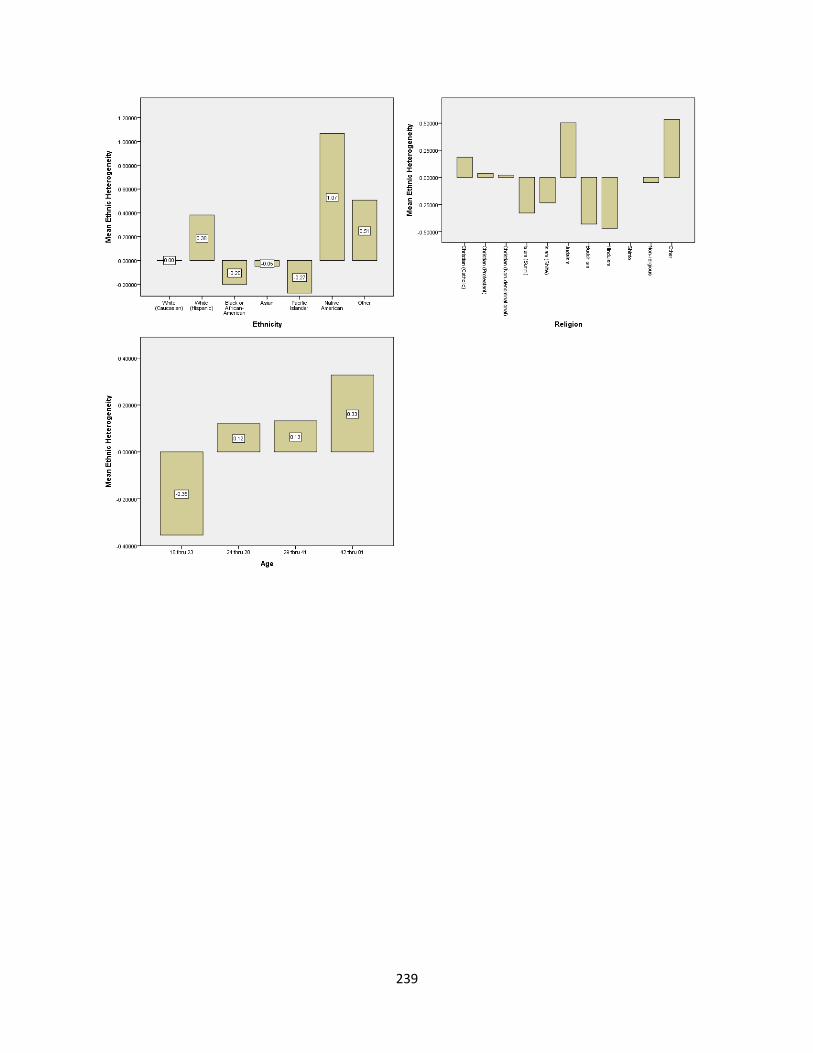
239
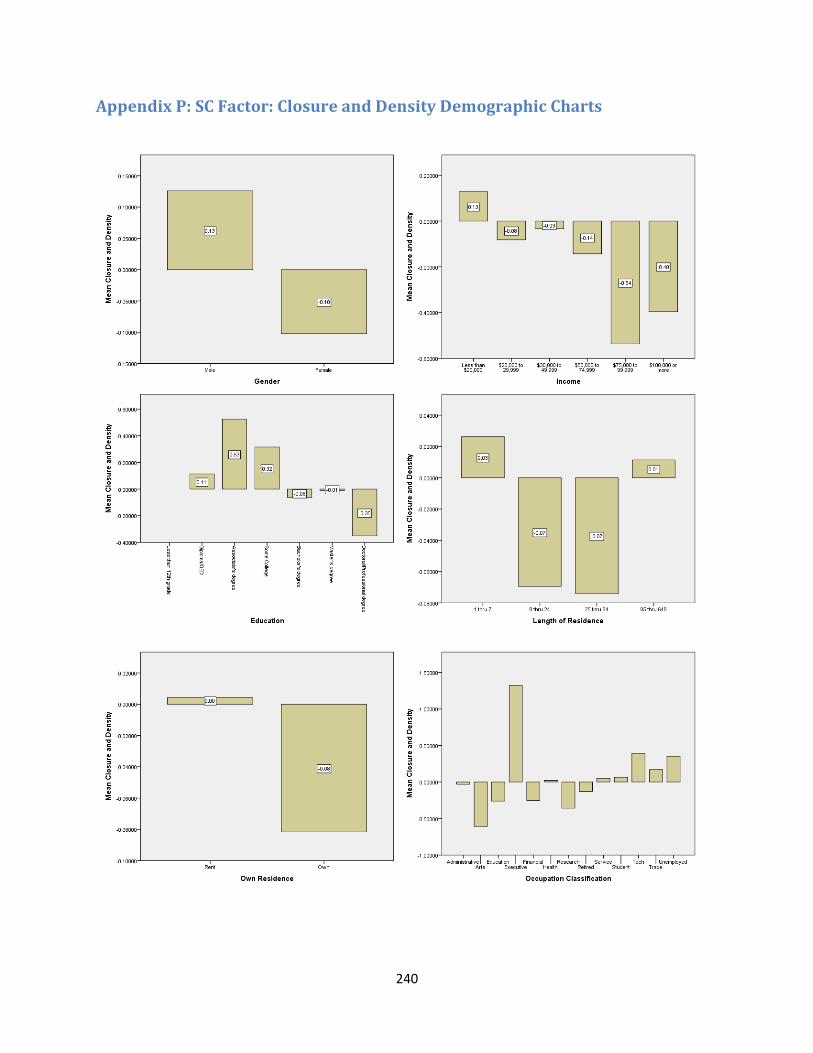
240
Appendix P: SC Factor: Closure and Density Demographic Charts

241

242
Appendix Q: SC Factor: Generic Trust Demographic Charts

243
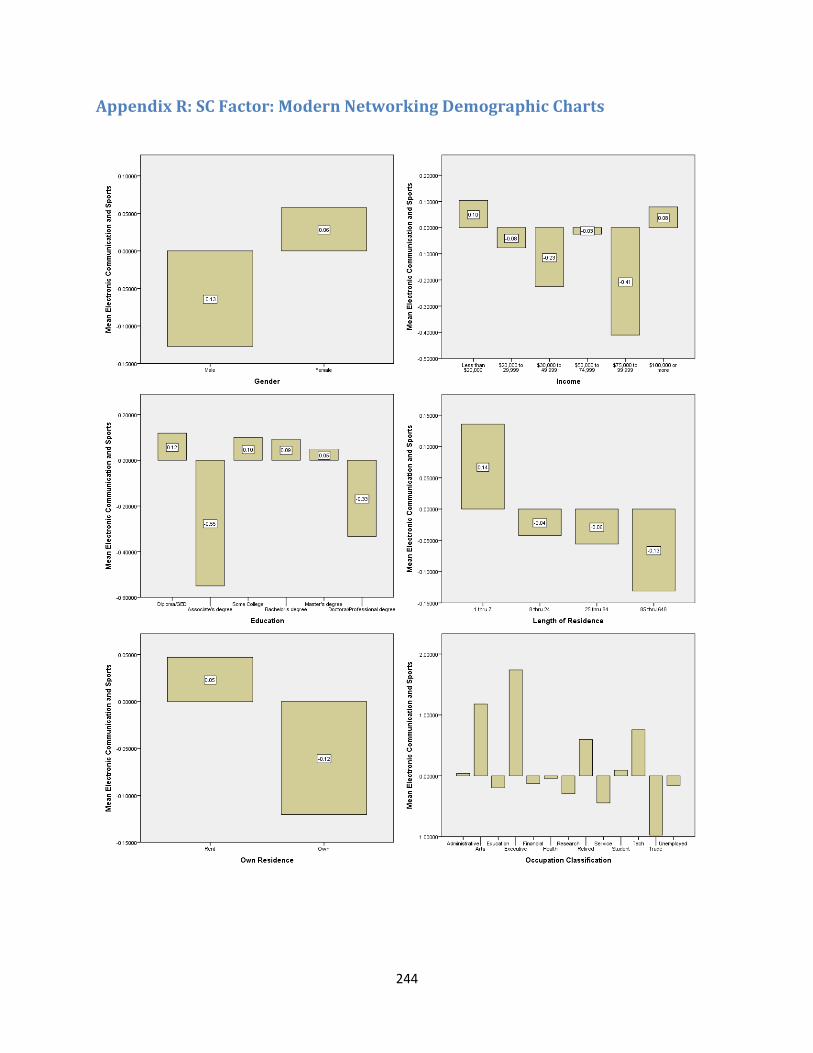
244
Appendix R: SC Factor: Modern Networking Demographic Charts

245

246
Appendix S: SC Factor: Horizontally Reciprocal Friendship Networks
Demographic Charts
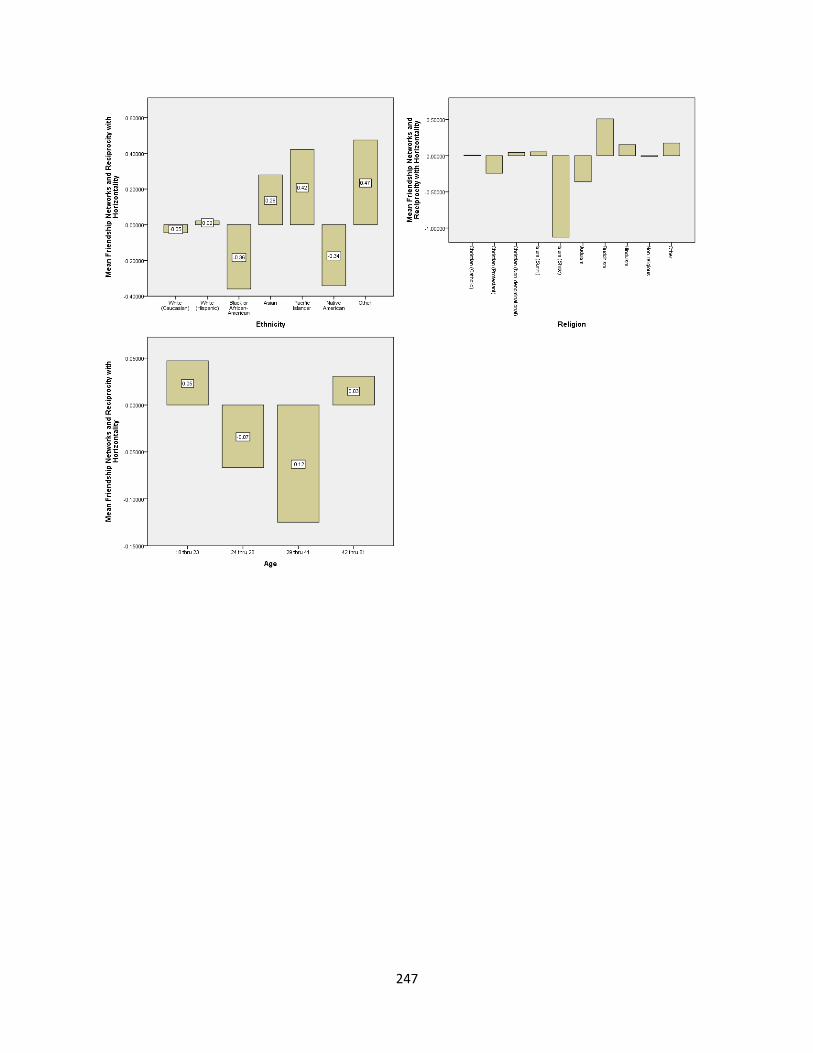
247

248
Appendix T: SC Factor: Spatial Demographic Charts
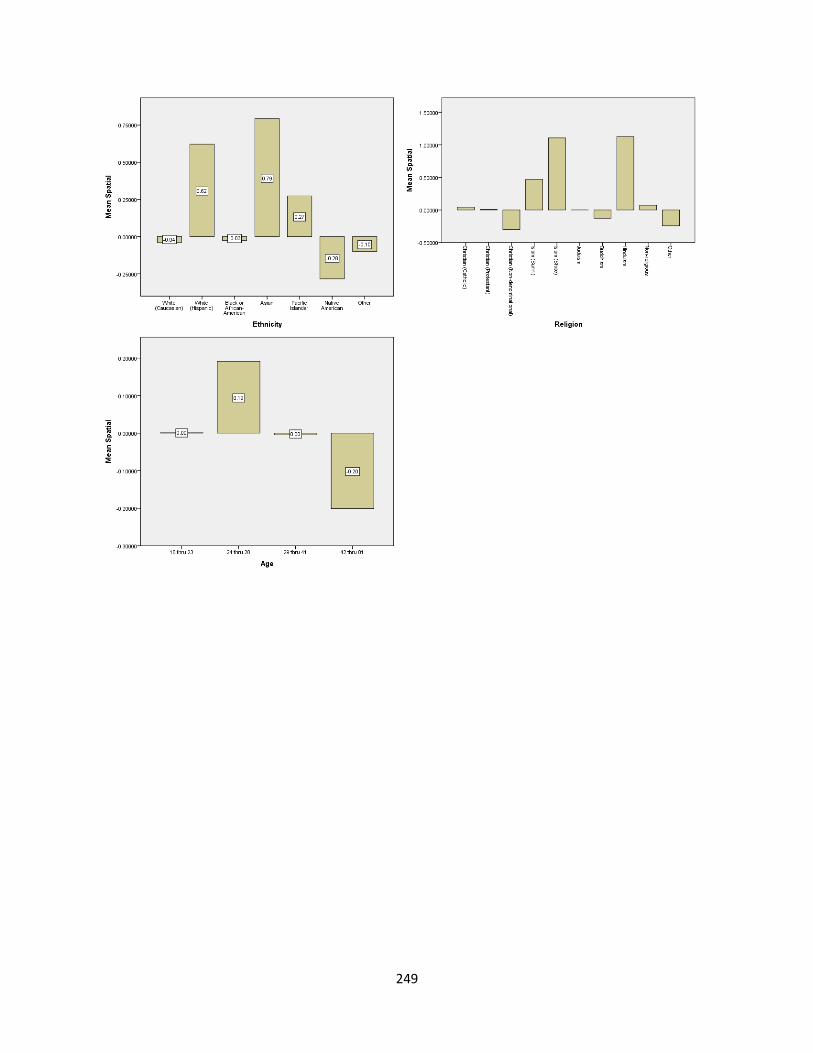
249

250
Appendix U: SC Factor: Organizational Reliance Demographic Charts

251

252
Appendix V: SC Factor: Overall Capacity Demographic Charts

253
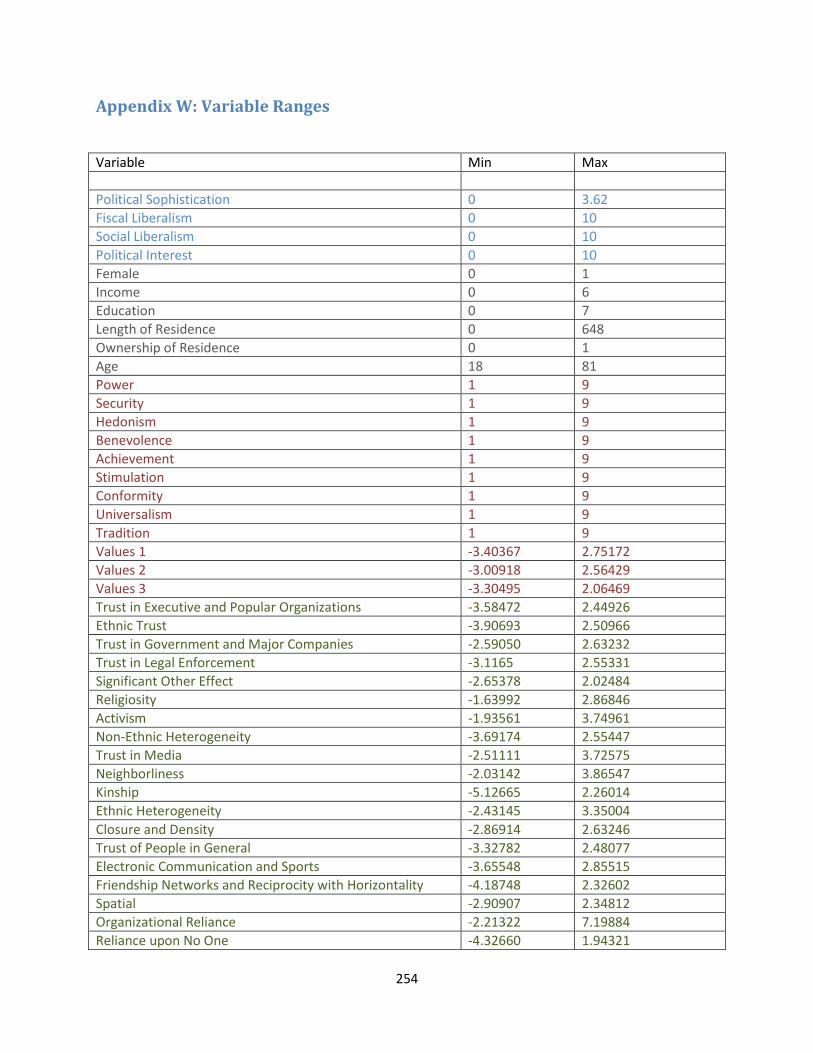
254
Appendix W: Variable Ranges
Variable Min Max
Political Sophistication 0 3.62
Fiscal Liberalism 0 10
Social Liberalism 0 10
Political Interest 0 10
Female 0 1
Income 0 6
Education 0 7
Length of Residence 0 648
Ownership of Residence 0 1
Age 18 81
Power 1 9
Security 1 9
Hedonism 1 9
Benevolence 1 9
Achievement 1 9
Stimulation 1 9
Conformity 1 9
Universalism 1 9
Tradition 1 9
Values 1 -3.40367 2.75172
Values 2 -3.00918 2.56429
Values 3 -3.30495 2.06469
Trust in Executive and Popular Organizations -3.58472 2.44926
Ethnic Trust -3.90693 2.50966
Trust in Government and Major Companies -2.59050 2.63232
Trust in Legal Enforcement -3.1165 2.55331
Significant Other Effect -2.65378 2.02484
Religiosity -1.63992 2.86846
Activism -1.93561 3.74961
Non-Ethnic Heterogeneity -3.69174 2.55447
Trust in Media -2.51111 3.72575
Neighborliness -2.03142 3.86547
Kinship -5.12665 2.26014
Ethnic Heterogeneity -2.43145 3.35004
Closure and Density -2.86914 2.63246
Trust of People in General -3.32782 2.48077
Electronic Communication and Sports -3.65548 2.85515
Friendship Networks and Reciprocity with Horizontality -4.18748 2.32602
Spatial -2.90907 2.34812
Organizational Reliance -2.21322 7.19884
Reliance upon No One -4.32660 1.94321

255
Appendix X: The PVSN Survey Instrument
Your Social Profile
The next few pages are intended for us to get an idea of your preference for particular elements that are part of
how you interact with your community, including your friends and family. Please respond to the following
statements by reading the question and circling only one number to the right of each item. This will indicate your
level of agreement with that particular item. Descriptions of the meaning of each number are provided above
each set of numbers. For example, in question 1 in this Section, circling “2” for Family means you believe family is
“not very important” in your life. Please circle your level of agreement for each statement.
1. For each of the following, indicate how important it is in your life: Not at all important Not very important Rather important Very important
Family 1 2 3 4 Friends 1 2 3 4 Significant Other 1 2 3 4 Neighbors 1 2 3 4
2. The following is a list of voluntary organizations. For each one, please indicate whether you are an active member, an inactive member, or not a member of that type of organization:
Don’t belong Inactive member Active member
Church or religious org. 0 1 2 Non-religious humanitarian or charitable org. 0 1 2 Religious humanitarian or charitable org. 0 1 2 Sport or recreational org. 0 1 2 Art, music, or educational org. 0 1 2 Labor union 0 1 2 Political party 0 1 2 Environmental org. 0 1 2 Professional association 0 1 2 Consumer org. 0 1 2 Any other (write-in):
3. The following is a list of situations and things you may need or need to do, please indicate who you usually rely upon to help you with those particular situations (do not answer if the situation does not apply to you):
A friend A relative Significant Other A neighbor An organization No one
Child care 1 2 3 4 5 6 You are sick 1 2 3 4 5 6 Advice 1 2 3 4 5 6 When you need to borrow something
1 2 3 4 5 6
Money 1 2 3 4 5 6
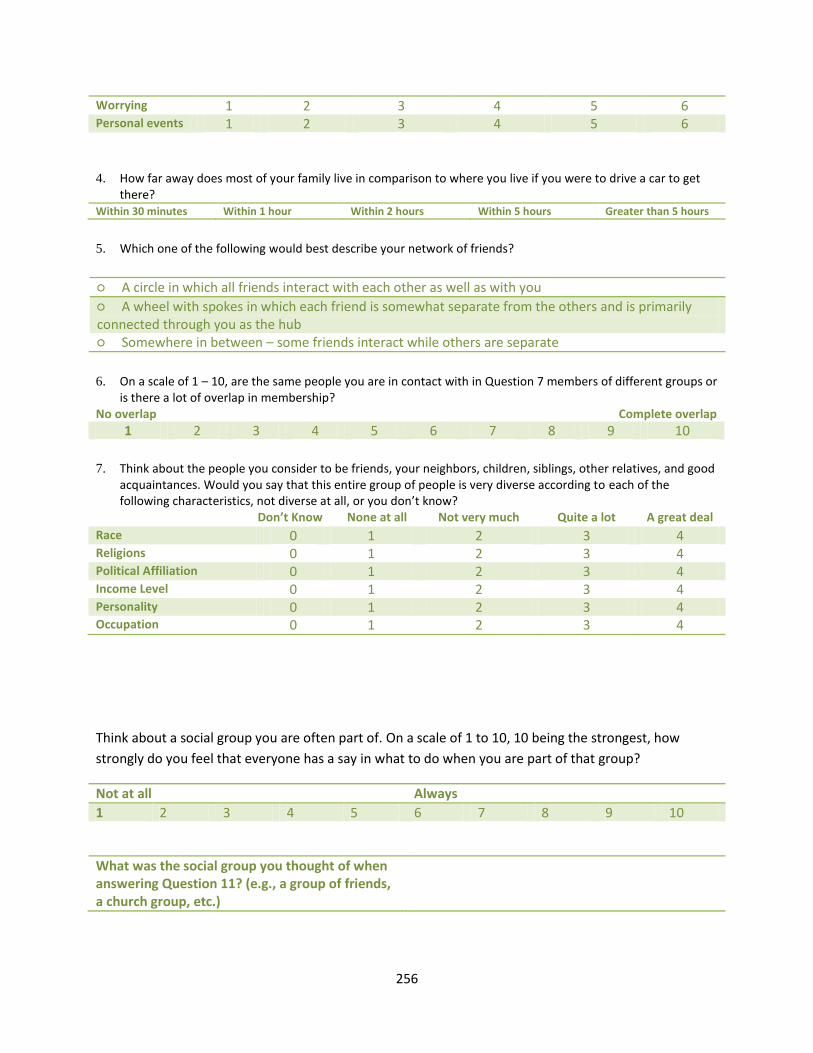
256
Worrying 1 2 3 4 5 6 Personal events 1 2 3 4 5 6
4. How far away does most of your family live in comparison to where you live if you were to drive a car to get there?
Within 30 minutes Within 1 hour Within 2 hours Within 5 hours Greater than 5 hours
5. Which one of the following would best describe your network of friends?
○ A circle in which all friends interact with each other as well as with you
○ A wheel with spokes in which each friend is somewhat separate from the others and is primarily connected through you as the hub ○ Somewhere in between – some friends interact while others are separate
6. On a scale of 1 – 10, are the same people you are in contact with in Question 7 members of different groups or is there a lot of overlap in membership?
No overlap Complete overlap
1 2 3 4 5 6 7 8 9 10
7. Think about the people you consider to be friends, your neighbors, children, siblings, other relatives, and good acquaintances. Would you say that this entire group of people is very diverse according to each of the following characteristics, not diverse at all, or you don’t know?
Don’t Know None at all Not very much Quite a lot A great deal
Race 0 1 2 3 4 Religions 0 1 2 3 4 Political Affiliation 0 1 2 3 4 Income Level 0 1 2 3 4 Personality 0 1 2 3 4 Occupation 0 1 2 3 4
Think about a social group you are often part of. On a scale of 1 to 10, 10 being the strongest, how
strongly do you feel that everyone has a say in what to do when you are part of that group?
Not at all Always
1 2 3 4 5 6 7 8 9 10
What was the social group you thought of when answering Question 11? (e.g., a group of friends, a church group, etc.)

257
I’d like to ask you how much you trust people from various groups:
Not at all Not very much Somewhat Completely Your family 1 2 3 4 Your neighborhood 1 2 3 4 People you know personally 1 2 3 4 People you meet for the first time
1 2 3 4
People of another religion 1 2 3 4 People of another nationality 1 2 3 4 People of another race 1 2 3 4
The following is a list of organizations. For each one, could you tell me how much confidence you have in
them?
None at all Not very much Quite a lot A great deal Religious leaders 1 2 3 4 The armed forces 1 2 3 4 The press 1 2 3 4 Television 1 2 3 4 Labor unions 1 2 3 4 The police 1 2 3 4 The courts 1 2 3 4 The President 1 2 3 4 Political parties 1 2 3 4 Congress 1 2 3 4 Government agencies 1 2 3 4 Major companies 1 2 3 4 Environmental orgs. 1 2 3 4 Women’s orgs. 1 2 3 4 Charitable orgs. 1 2 3 4 The United Nations 1 2 3 4
On a scale of 1 to 10, 10 being the most often, how often do you help people who help you?
Not at all All the time
1 2 3 4 5 6 7 8 9 10
Do you have and use a social networking account (Facebook, Myspace, etc.)?
Yes No
How many hours per week do you spend communicating with people via text, online social networking,
or some other type of electronic communication (do not include telephone use)?
258
Less than 1 hour 1 to 3 hours 3 to 10 hours 10 to 15 hours More than 15 hours
II. Your Values Profile
The next few pages are intended for us to get an idea of your preference for particular elements that are
part of the political belief system. Please respond to each statement by circling only one number to the
right of the sentence. This will indicate your level of agreement with the statement. A “-1” indicates
that you “strongly disagree” with the statement whereas a “7” indicates that you “strongly agree” with
the statement. Please circle your level of agreement for each statement.
It is important to think up new ideas and be creative; to do things one’s own way.
Strongly Disagree Strongly Agree
-1 0 1 2 3 4 5 6 7
It is important to be rich; to have a lot of money and expensive things.
Strongly Disagree Strongly Agree
-1 0 1 2 3 4 5 6 7
Living in secure surroundings is important; to avoid anything that might be dangerous.
Strongly Disagree Strongly Agree -1 0 1 2 3 4 5 6 7
It is important to have a good time; to “spoil” oneself.
Strongly Disagree Strongly Agree
-1 0 1 2 3 4 5 6 7
It is important to help the people nearby; to care for their well-being.
Strongly Disagree Strongly Agree
-1 0 1 2 3 4 5 6 7
Being very successful is important; to have people recognize one’s achievements.
Strongly Disagree Strongly Agree
-1 0 1 2 3 4 5 6 7
Adventure and taking risks are important; to have an exciting life.

259
Strongly Disagree Strongly Agree
-1 0 1 2 3 4 5 6 7
It is important to always behave properly; to avoid doing anything people would say is wrong.
Strongly Disagree Strongly Agree
-1 0 1 2 3 4 5 6 7
Looking after the environment is important; to care for nature.
Strongly Disagree Strongly Agree
-1 0 1 2 3 4 5 6 7
Tradition is important; to follow the customs handed down by one’s religion or family.
Strongly Disagree Strongly Agree
-1 0 1 2 3 4 5 6 7

260
III. Your Political Qualities
This Section is meant to capture your attitudes toward political issues. Please respond to your best
ability.
Bashar al-Assad is the leader of which of these countries?
○ Syria
○ Egypt
○ Saudi Arabia
○ China
○ Don’t know
Who is the current speaker of the U.S. House of Representatives?
○ Mitch McConnell
○ Newt Gingrich
○ John Boehner
○ Nancy Pelosi
○ Don’t know
The Obama administration is proposing revisions to the “No Child Left Behind” Act. That legislation deals with which of these issues?
○ Transportation
○ Education
○ Adoption
○ Nutrition
○ Don’t know
Is the national unemployment rate as reported by the government currently closer to:
○ 5%
○ 9%
○ 15%
○ 21%
○ Don’t know
On which of these activities does the U.S. government currently spend the most money?
○ Education
○ Medicare
○ Interest on the national debt
○ Scientific research
○ Don’t know
According to the U.S. Centers for Disease Control, what percentage of Americans are obese?
○ 5%
○ 10%
○ 25%
○ 50%
○ Don’t know
In the U.S. Congress, Republicans have a majority in:
○ The House of Representatives only
○ The Senate only
○ Both the House and Senate
○ Neither the House nor the Senate
○ Don’t know
Is Hilary Clinton:
○ Secretary of State
○ A senator
○ A governor
○ An ambassador
○ Don’t know

261
What issue was the main focus of recent protests by the Occupy Wall Street group?
○ Same-sex marriage
○ Social and economic inequality
○ Union rights for public employees
○ Agriculture subsidies
○ Don’t know
Which source of energy provides the most electricity in the U.S.?
○ Hydroelectric
○ Nuclear
○ Coal
○ Wind
○ Don’t know
On a scale of 1 to 10, 10 being completely liberal, do you consider yourself fiscally conservative or liberal?
Conservative Liberal
1 2 3 4 5 6 7 8 9 10
On a scale of 1 to 10, 10 being completely liberal, do you consider yourself socially conservative or
liberal?
Conservative Liberal
1 2 3 4 5 6 7 8 9 10
Do you consider yourself to be a Democrat, Republican, or neither?
Democrat Republican Neither
How much do you care about politics?
Not at all A great deal
1 2 3 4 5 6 7 8 9 10

262
IV. Your Demographics
This portion of the survey is used to collect demographic data about you. All data collected by this survey will be
kept confidential. Please circle or otherwise indicate your response to each question.
In what year were you born?
In what zip code do you live?
What is your gender? Male Female
About how much do you earn annually?
Less than $20,000 $20,000 to 29,999 $30,000 to 49,999 $50,000 to 74,999 $75,000 to 99,999 $100,000 or more
What is the highest level of education you have obtained?
Less than 12th grade Diploma/GED Associate’s degree Some College Bachelor’s degree Master’s degree Doctoral/Professional degree
How long have you lived in your current neighborhood? Please estimate to the nearest month.
Do you rent or own your residence? Rent Own
What is your current occupation?
What race would you consider yourself to be part of (circle more than one if needed)?
White (Caucasian) White (Hispanic) Black or African-American
Asian
Pacific Islander Native American Other (please specify):
What religion do you most identify with? Christian (Catholic) Christian (Protestant)
Christian (Non-denominational) Islam (Sunni) Islam (Shiite) Judaism Buddhism Hinduism Shinto Non-religious Other (please specify):