Embed Size (px)
Citation preview
Political information and discussion in different mobilisation settings: the Spanish 2004 General Elections in a Comparative Perspective.
Laura Morales
Department of Political Science University of Murcia, Spain
ECPR Joint Sessions, Nicosia, April 2006 Workshop 23: The Role of Political Discussion in Modern Democracies in a
Comparative Perspective
(1st Draft of work in progress)
Abstract: This paper will explore the interaction between various factors that are relevant for determining electoral behaviour: citizens’ levels of political information and of political discussion, the degree of political homogeneity of their social networks, and the type of campaign mobilisation they are exposed to. The main goal is, thus, to analyse to what extent the characteristics of the social milieu in which citizens make their electoral decisions interact whith the political information and knowledge they possess. Is political information equally relevant for citizens frequently or rarely engaged in political discussions? Is it, maybe, more relevant for those individuals who are set in a politically heterogeneous social context? And how does political information interact with political homogeneity and campaign mobilisation? The analyses come mainly from the Spanish survey of the Comparative National Elections Project (CNEP) conducted a few days after the 2004 General Elections. Nevertheless, comparative data will be provided on previous surveys of other participant countries in the CNEP.
1. Political communication networks, political information and electoral behaviour. It is, to some extent, obvious to argue that individuals are interdependent when they make political choices and when they behave politically (see, for example, Huckfeldt 1986). Yet, too frequently our analyses of electoral (and, for that matter, all political) behaviour disregard or fail to acknowledge this interdependency. Since the 1980s, however, a group of scholars have revived the interest on social networks when it comes to study citizens’ political behaviour (Huckfeldt and Sprague 1987, 1992 & 1993; Huckfeldt, Plutzer and Sprague 1993; REFS). We now know that the immediate social milieu of an individual –her family, neighbourhood, working place, acquaintances, etc- has a non-negligible impact on her political decisions in various ways. On the one hand, social networks and contacts define, to an important extent, the degree and type of information flows to which individuals are exposed. Thus, in this sense, social networks contribute to shape political behaviour to the extent that they provide (or fail to provide) relevant political information (Knoke 1990). On the other hand, the social milieu and the interpersonal networks condition the type of normative reference groups to which the individual referrs when making judgements of what are (and are not) appropriate political behaviours and choices. In this regard, personal networks are relevant socialisation contexts: environments where values, norms, attitudes and behaviours are socially shared. Finally, the immediate social milieu provides a context for political mobilisation. The literature on political participation has shown in numerous instances that mobilisation efforts are generally most successful when it takes place within networks of acquaintances (see, for example, Rosenstone and Hansen 1993, Verba, Schlozman and Brady 1995, OTHER REFS). Hence, we could summarise the effects social networks have on citizens’ political behaviour in three main types: informational, normative, and mobilisational. However, it is clear that, especially in relation to information and mobilisation, individuals also receive substantial input from their broader environment: most notably, media and political parties. Thus, to be able to grasp citizens’ political behaviour more completely
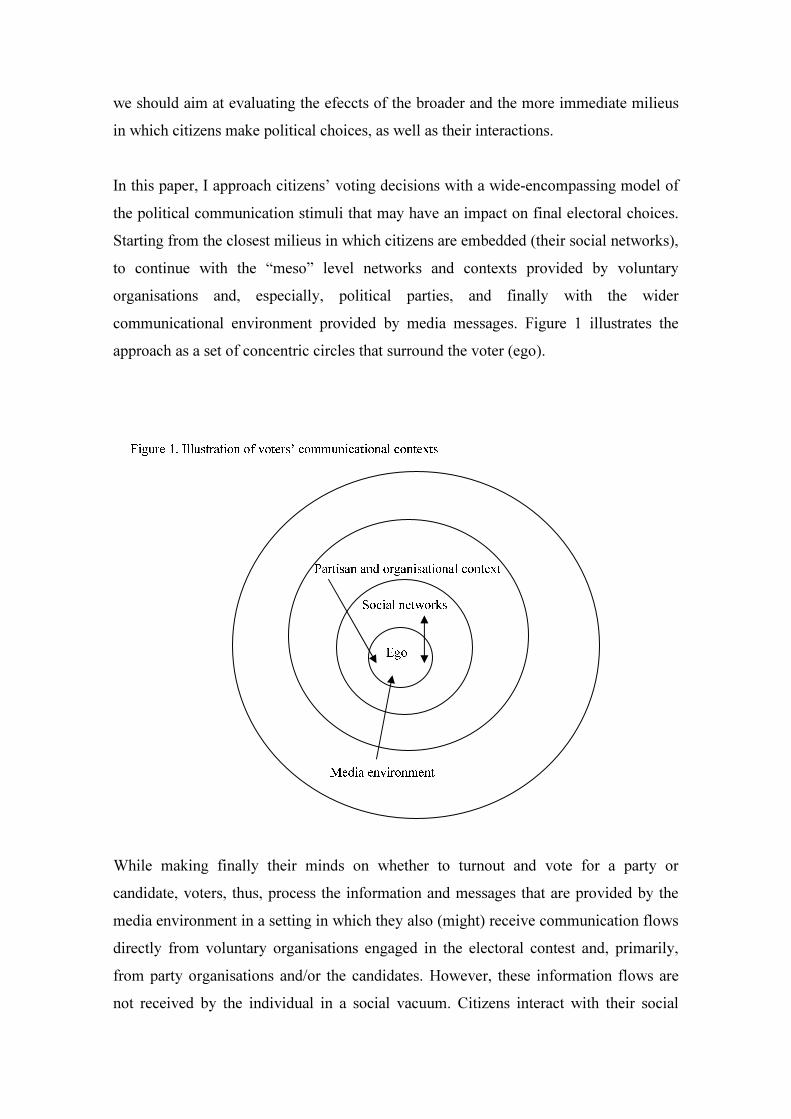
we should aim at evaluating the efeccts of the broader and the more immediate milieus in which citizens make political choices, as well as their interactions. In this paper, I approach citizens’ voting decisions with a wide-encompassing model of the political communication stimuli that may have an impact on final electoral choices. Starting from the closest milieus in which citizens are embedded (their social networks), to continue with the “meso” level networks and contexts provided by voluntary organisations and, especially, political parties, and finally with the wider communicational environment provided by media messages. Figure 1 illustrates the approach as a set of concentric circles that surround the voter (ego).
While making finally their minds on whether to turnout and vote for a party or candidate, voters, thus, process the information and messages that are provided by the media environment in a setting in which they also (might) receive communication flows directly from voluntary organisations engaged in the electoral contest and, primarily, from party organisations and/or the candidates. However, these information flows are not received by the individual in a social vacuum. Citizens interact with their social
Ego Social networks Partisan and organisational context
Media environment
Figure 1. Illustration of voters’ communicational contexts
networks, and they share and contrast some of the information they have processed. To a certain degree, the environment of political communications is a “given” for the individual –she can not choose it- but in many aspects citizens get to choose the type of political “bias” they are exposed to. One might not be able to choose the workmates, the neighbours or relatives, but one is able to choose with which of them to talk about politics, if at all. In addition, one might not be able to escape from parties’ mobilisational contacts, but one is in a position to choose the political bias of the media he is exposed to. Depending on all these choices (or absence of them) the communicational environment of citizens might be more or less politically homogeneous. Also, as Huckfeldt and his colleagues (REFS) show, it is only a matter of probabilities that the wider the networks of interaction, the less likely they will be homogenous. Equally, we would expect that the more sources from which individuals get their political communications inflows, the more heterogeneous the political views and preferences to which they are exposed will be. However, the degree to which this communicational environment is more or less homogeneous might not have the same impact on electoral behaviour if the citizen (ego) is a person well-informed about political matters than if she is inattentive and ignorant of political issues. Thus, although we expect many more individual attributes to be relevant, we would anticipate that the effects of the social and communicational context will be mediated by the level of political information the elector possesses. This paper will addres, then, in a preliminary way two main questions: (1) what are the main characteristics of citizens political communication networks and environment in Spain? Are they primarily homogeneous or is heterogeneity widespread?, and (2) how do all these communication networks, contexts, and environments impact on Spaniards electoral behaviour? Are any effects of these mediated by individuals’ levels of political information and knowledge?
2. The data The dataset used for all analyses shown in this paper come from the Spanish Comparative National Elections Project (CNEP) 2004 postelectoral survey.1 The questionnaire was designed by an international network of researchers, and the fieldwork for the survey was carried out in Spain from 31 March to 28 April 2004 (the elections took place 14 March 2004). The survey is representative of the Spanish adult (18+ years) population and includes valid responses from 2,929 individuals.2 This survey is particularly adapted for the research questions posed in this paper because it has been designed to include items tapping at the three main aspects in which we are interested: political communication networks, exposure to different campaign mobilisation stimuli (both by the media and the political parties), and levels of political information. 3. Political communication networks and contexts in Spain during the 2004 General Elections 3.1. The inner circle: interpersonal communication networks. Before we proceed with the main questions addressed in this paper –which focus specially on the intermediation effects of political information and communication networks and contexts- it is worth offering a basic descriptive overview of the types and extension of communication networks Spanish electors engage in.
1 The survey was financed by a consortium of researchers led by Profs. Richard Gunther, José Ramón Montero and Mariano Torcal, and which included funding from the following institutions: Ohio State University, Universidad Autónoma de Madrid, Universidad Autónoma de Barcelona, Universitat Pompeu Fabra, Universidad de Santiago de Compostela and the Instituto de Estudios Sociales de Andalucía-Consejo Superior de Investigaciones Científicas. 2 The sample design was stratified by region (17 regions) and size of habitat (6 categories). However, quota sampling (the most common type of sample design in Spain) was used for the selection of final respondents within the randomly selected electoral sections, hence it is not strictly a random sample and all statistical analyses should be considered under that circumstance. Under the assumption of simple random sampling, the sample error would be of + 1.8% for a 95.5% confidence level (2 sigmas). Oversampling of 4 regions (Andalucía, Basque Country, Catalonia and Galicia) was done, and hence the data are weighted to account for this design and to adjust it to the population weight of each region within the country as a whole.
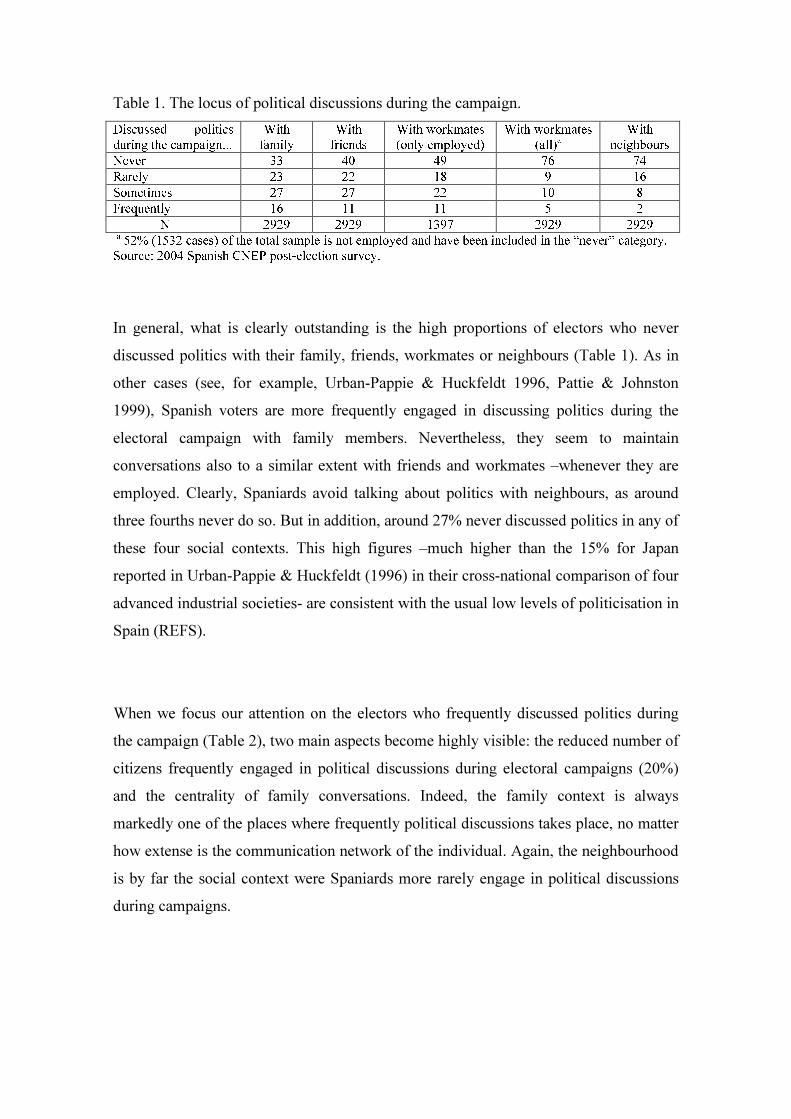
Table 1. The locus of political discussions during the campaign. Discussed politics during the campaign... With family With friends With workmates (only employed) With workmates (all)a With neighbours Never 33 40 49 76 74 Rarely 23 22 18 9 16 Sometimes 27 27 22 10 8 Frequently 16 11 11 5 2 N 2929 2929 1397 2929 2929 a 52% (1532 cases) of the total sample is not employed and have been included in the “never” category. Source: 2004 Spanish CNEP post-election survey. In general, what is clearly outstanding is the high proportions of electors who never discussed politics with their family, friends, workmates or neighbours (Table 1). As in other cases (see, for example, Urban-Pappie & Huckfeldt 1996, Pattie & Johnston 1999), Spanish voters are more frequently engaged in discussing politics during the electoral campaign with family members. Nevertheless, they seem to maintain conversations also to a similar extent with friends and workmates –whenever they are employed. Clearly, Spaniards avoid talking about politics with neighbours, as around three fourths never do so. But in addition, around 27% never discussed politics in any of these four social contexts. This high figures –much higher than the 15% for Japan reported in Urban-Pappie & Huckfeldt (1996) in their cross-national comparison of four advanced industrial societies- are consistent with the usual low levels of politicisation in Spain (REFS). When we focus our attention on the electors who frequently discussed politics during the campaign (Table 2), two main aspects become highly visible: the reduced number of citizens frequently engaged in political discussions during electoral campaigns (20%) and the centrality of family conversations. Indeed, the family context is always markedly one of the places where frequently political discussions takes place, no matter how extense is the communication network of the individual. Again, the neighbourhood is by far the social context were Spaniards more rarely engage in political discussions during campaigns.
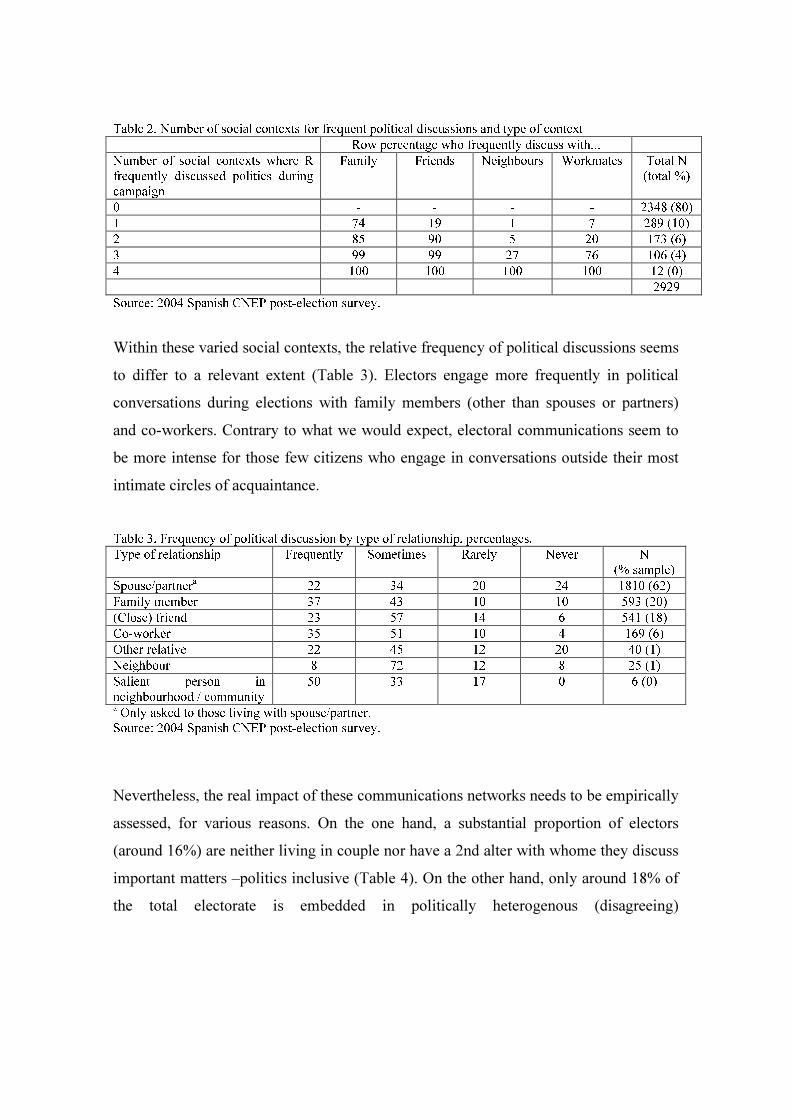
Table 2. Number of social contexts for frequent political discussions and type of context Row percentage who frequently discuss with... Number of social contexts where R frequently discussed politics during campaign Family Friends Neighbours Workmates Total N (total %) 0 - - - - 2348 (80) 1 74 19 1 7 289 (10) 2 85 90 5 20 173 (6) 3 99 99 27 76 106 (4) 4 100 100 100 100 12 (0) 2929 Source: 2004 Spanish CNEP post-election survey. Within these varied social contexts, the relative frequency of political discussions seems to differ to a relevant extent (Table 3). Electors engage more frequently in political conversations during elections with family members (other than spouses or partners) and co-workers. Contrary to what we would expect, electoral communications seem to be more intense for those few citizens who engage in conversations outside their most intimate circles of acquaintance. Table 3. Frequency of political discussion by type of relationship, percentages. Type of relationship Frequently Sometimes Rarely Never N (% sample) Spouse/partnera 22 34 20 24 1810 (62) Family member 37 43 10 10 593 (20) (Close) friend 23 57 14 6 541 (18) Co-worker 35 51 10 4 169 (6) Other relative 22 45 12 20 40 (1) Neighbour 8 72 12 8 25 (1) Salient person in neighbourhood / community 50 33 17 0 6 (0) a Only asked to those living with spouse/partner. Source: 2004 Spanish CNEP post-election survey. Nevertheless, the real impact of these communications networks needs to be empirically assessed, for various reasons. On the one hand, a substantial proportion of electors (around 16%) are neither living in couple nor have a 2nd alter with whome they discuss important matters –politics inclusive (Table 4). On the other hand, only around 18% of the total electorate is embedded in politically heterogenous (disagreeing)
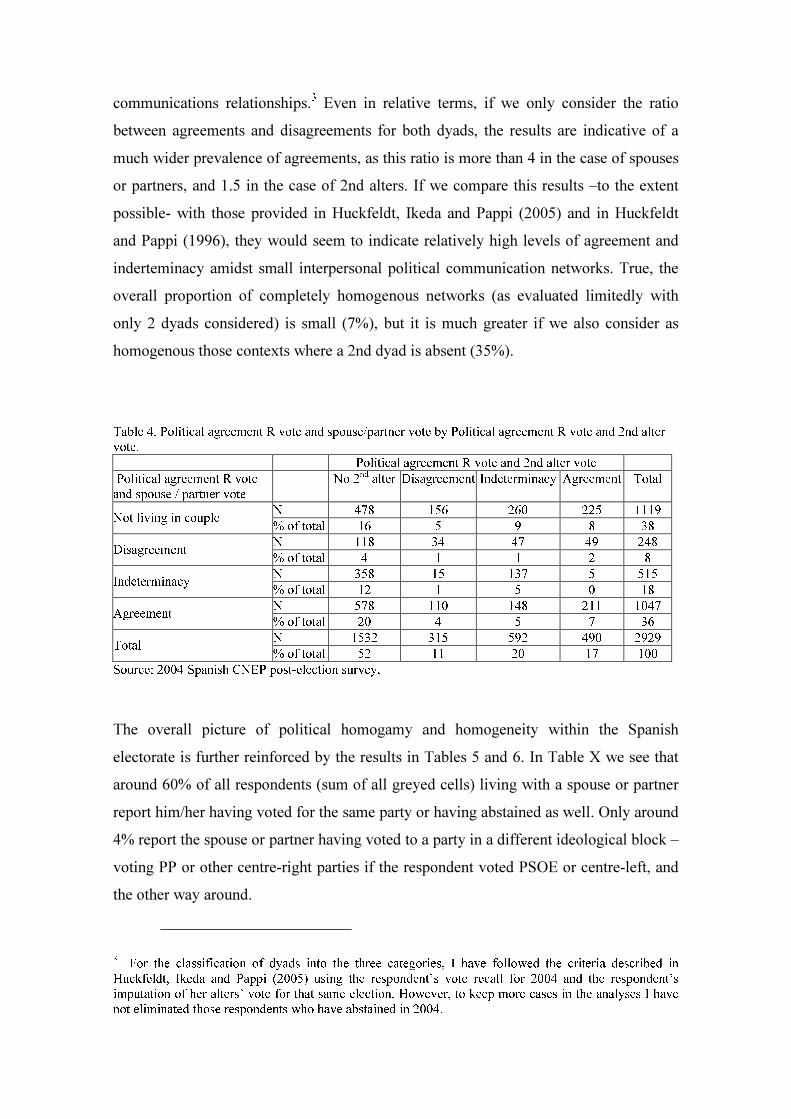
communications relationships.3 Even in relative terms, if we only consider the ratio between agreements and disagreements for both dyads, the results are indicative of a much wider prevalence of agreements, as this ratio is more than 4 in the case of spouses or partners, and 1.5 in the case of 2nd alters. If we compare this results –to the extent possible- with those provided in Huckfeldt, Ikeda and Pappi (2005) and in Huckfeldt and Pappi (1996), they would seem to indicate relatively high levels of agreement and inderteminacy amidst small interpersonal political communication networks. True, the overall proportion of completely homogenous networks (as evaluated limitedly with only 2 dyads considered) is small (7%), but it is much greater if we also consider as homogenous those contexts where a 2nd dyad is absent (35%). Table 4. Political agreement R vote and spouse/partner vote by Political agreement R vote and 2nd alter vote. Political agreement R vote and 2nd alter vote Political agreement R vote and spouse / partner vote No 2nd alter Disagreement Indeterminacy Agreement Total N 478 156 260 225 1119 Not living in couple % of total 16 5 9 8 38 N 118 34 47 49 248 Disagreement % of total 4 1 1 2 8 N 358 15 137 5 515 Indeterminacy % of total 12 1 5 0 18 N 578 110 148 211 1047 Agreement % of total 20 4 5 7 36 N 1532 315 592 490 2929 Total % of total 52 11 20 17 100 Source: 2004 Spanish CNEP post-election survey. The overall picture of political homogamy and homogeneity within the Spanish electorate is further reinforced by the results in Tables 5 and 6. In Table X we see that around 60% of all respondents (sum of all greyed cells) living with a spouse or partner report him/her having voted for the same party or having abstained as well. Only around 4% report the spouse or partner having voted to a party in a different ideological block –voting PP or other centre-right parties if the respondent voted PSOE or centre-left, and the other way around.
3 For the classification of dyads into the three categories, I have followed the criteria described in Huckfeldt, Ikeda and Pappi (2005) using the respondent’s vote recall for 2004 and the respondent’s imputation of her alters’ vote for that same election. However, to keep more cases in the analyses I have not eliminated those respondents who have abstained in 2004.
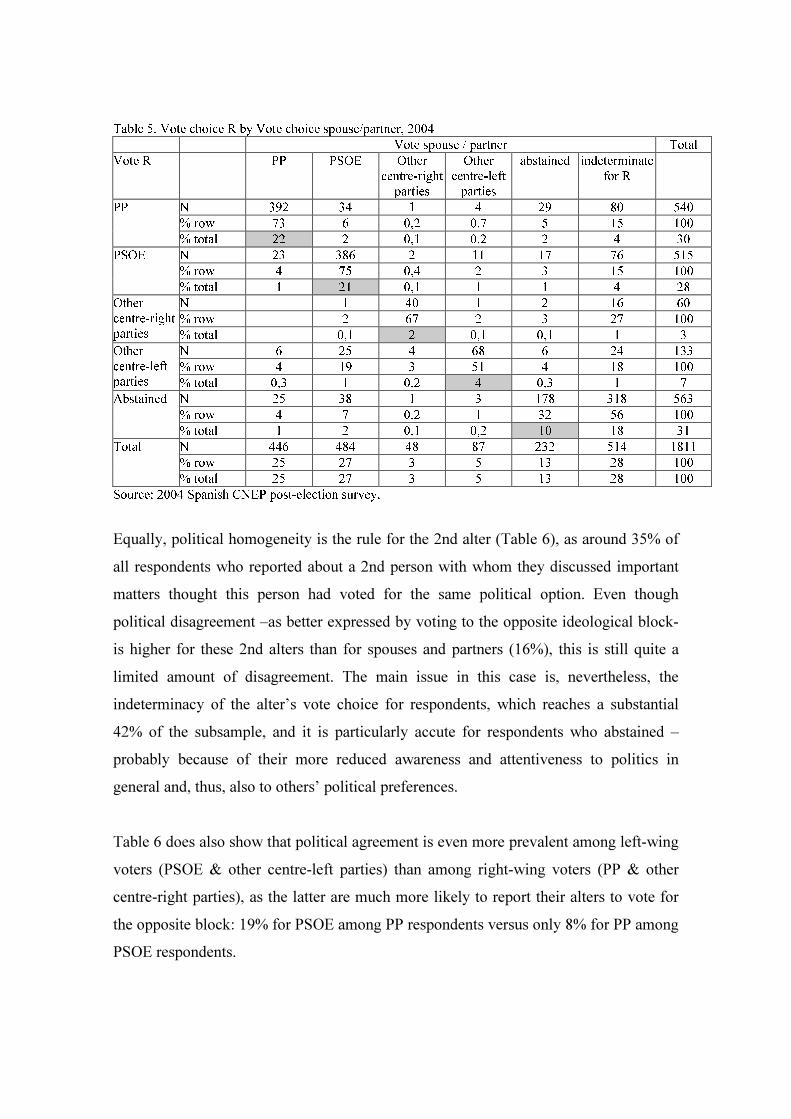
Table 5. Vote choice R by Vote choice spouse/partner, 2004 Vote spouse / partner Total Vote R PP PSOE Other centre-right parties Other centre-left parties abstained indeterminate for R N 392 34 1 4 29 80 540 % row 73 6 0,2 0,7 5 15 100 PP % total 22 2 0,1 0,2 2 4 30 N 23 386 2 11 17 76 515 % row 4 75 0,4 2 3 15 100 PSOE % total 1 21 0,1 1 1 4 28 N 1 40 1 2 16 60 % row 2 67 2 3 27 100 Other centre-right parties % total 0,1 2 0,1 0,1 1 3 N 6 25 4 68 6 24 133 % row 4 19 3 51 4 18 100 Other centre-left parties % total 0,3 1 0,2 4 0,3 1 7 N 25 38 1 3 178 318 563 % row 4 7 0,2 1 32 56 100 Abstained % total 1 2 0,1 0,2 10 18 31 N 446 484 48 87 232 514 1811 % row 25 27 3 5 13 28 100 Total % total 25 27 3 5 13 28 100 Source: 2004 Spanish CNEP post-election survey. Equally, political homogeneity is the rule for the 2nd alter (Table 6), as around 35% of all respondents who reported about a 2nd person with whom they discussed important matters thought this person had voted for the same political option. Even though political disagreement –as better expressed by voting to the opposite ideological block- is higher for these 2nd alters than for spouses and partners (16%), this is still quite a limited amount of disagreement. The main issue in this case is, nevertheless, the indeterminacy of the alter’s vote choice for respondents, which reaches a substantial 42% of the subsample, and it is particularly accute for respondents who abstained –probably because of their more reduced awareness and attentiveness to politics in general and, thus, also to others’ political preferences. Table 6 does also show that political agreement is even more prevalent among left-wing voters (PSOE & other centre-left parties) than among right-wing voters (PP & other centre-right parties), as the latter are much more likely to report their alters to vote for the opposite block: 19% for PSOE among PP respondents versus only 8% for PP among PSOE respondents.
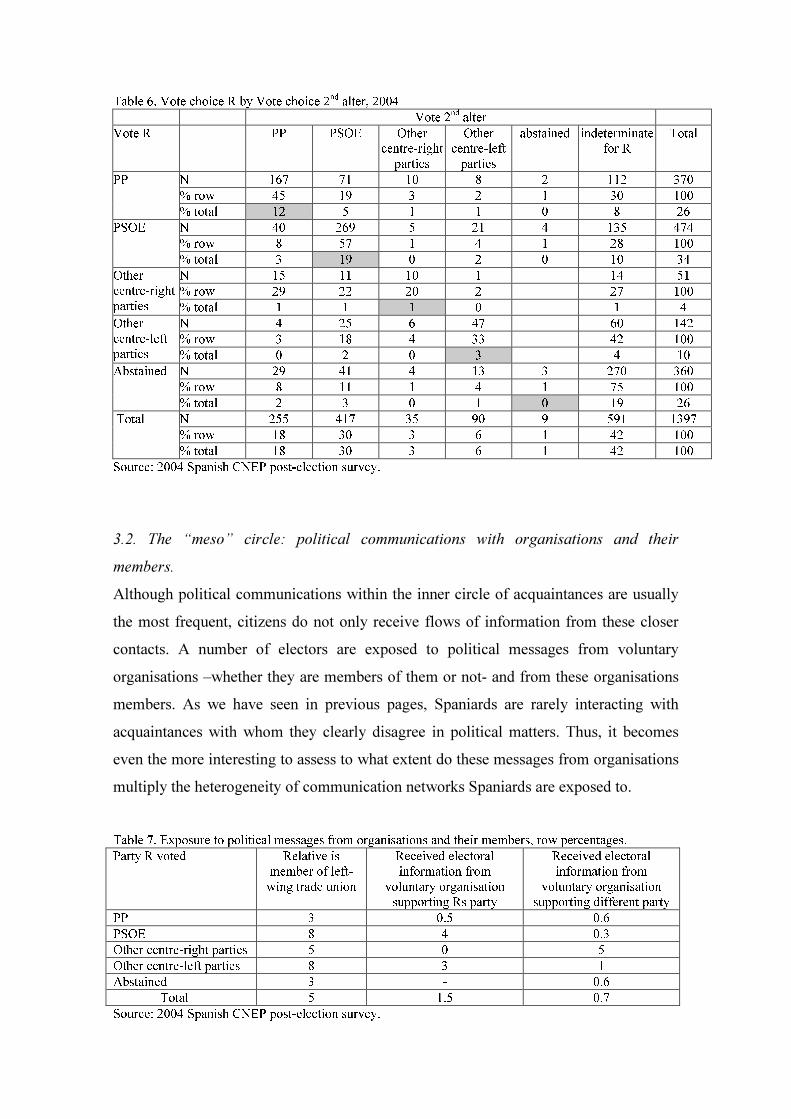
Table 6. Vote choice R by Vote choice 2nd alter, 2004 Vote 2nd alter Vote R PP PSOE Other centre-right parties Other centre-left parties abstained indeterminate for R Total N 167 71 10 8 2 112 370 % row 45 19 3 2 1 30 100 PP % total 12 5 1 1 0 8 26 N 40 269 5 21 4 135 474 % row 8 57 1 4 1 28 100 PSOE % total 3 19 0 2 0 10 34 N 15 11 10 1 14 51 % row 29 22 20 2 27 100 Other centre-right parties % total 1 1 1 0 1 4 N 4 25 6 47 60 142 % row 3 18 4 33 42 100 Other centre-left parties % total 0 2 0 3 4 10 N 29 41 4 13 3 270 360 % row 8 11 1 4 1 75 100 Abstained % total 2 3 0 1 0 19 26 N 255 417 35 90 9 591 1397 % row 18 30 3 6 1 42 100 Total % total 18 30 3 6 1 42 100 Source: 2004 Spanish CNEP post-election survey. 3.2. The “meso” circle: political communications with organisations and their members. Although political communications within the inner circle of acquaintances are usually the most frequent, citizens do not only receive flows of information from these closer contacts. A number of electors are exposed to political messages from voluntary organisations –whether they are members of them or not- and from these organisations members. As we have seen in previous pages, Spaniards are rarely interacting with acquaintances with whom they clearly disagree in political matters. Thus, it becomes even the more interesting to assess to what extent do these messages from organisations multiply the heterogeneity of communication networks Spaniards are exposed to. Table 7. Exposure to political messages from organisations and their members, row percentages. Party R voted Relative is member of left-wing trade union Received electoral information from voluntary organisation supporting Rs party Received electoral information from voluntary organisation supporting different party PP 3 0.5 0.6 PSOE 8 4 0.3 Other centre-right parties 5 0 5 Other centre-left parties 8 3 1 Abstained 3 - 0.6 Total 5 1.5 0.7 Source: 2004 Spanish CNEP post-election survey.

Table 7 clearly shows that, in general terms, Spaniards are scarcely exposed to electoral messages from voluntary organisations and their members, and when they are it is generally more likely that the cues provided will be reinforcing their own political choices. As in previous cases, Socialist and centre-left voters seem to be more exposed to homogeneous political messages than other voters, as they are substantially more likely to have a relative who is a member of a left-wing trade union4 and to receive electoral information from voluntary organisations supporting their political choices. However, as it is obvious, most of the political and electoral messages that citizens receive from organisations come primarily from political parties, given that they are the main contenders of the race. In fact, 40% of all respondents (1,136 cases) have received some sort of message from at least one political party. When these messages have been communicated personally, they have come mainly from friends or from the candidates directly (see Table 8). But, by far, the main means through which electors receive electoral cues and information from parties is through postal sendings of leaflets and ballots –which are subsidised by the state. In addition, the two biggest parties –and, thus, with the greatest resources- seem to have invested a similar amount of effort in mobilising voters. Or, at least, they seem to have been equally successful in reaching voters.
4 Although the questionnaire does allow distinguishing what relationship does this trade union member have to the respondent, I have not included this information because descriptive analyses showed that the type of acquaintance had no impact on electoral behaviour.
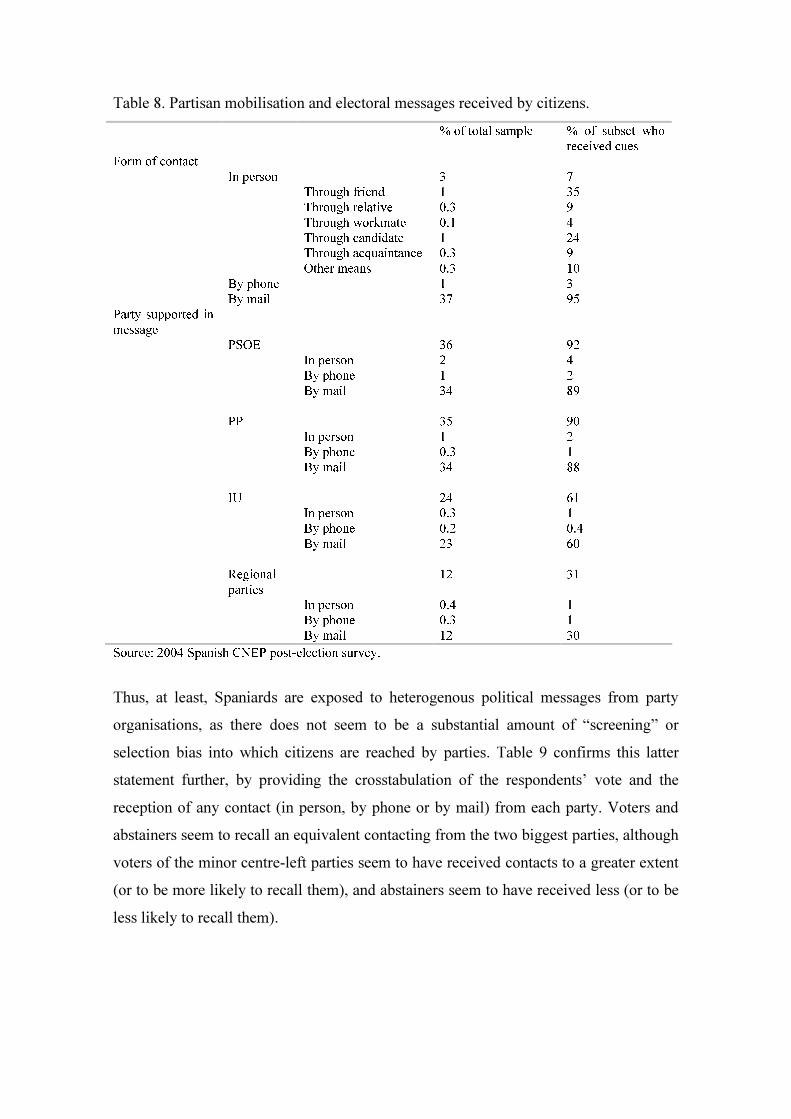
Table 8. Partisan mobilisation and electoral messages received by citizens. % of total sample % of subset who received cues Form of contact In person 3 7 Through friend 1 35 Through relative 0.3 9 Through workmate 0.1 4 Through candidate 1 24 Through acquaintance 0.3 9 Other means 0.3 10 By phone 1 3 By mail 37 95 Party supported in message PSOE 36 92 In person 2 4 By phone 1 2 By mail 34 89 PP 35 90 In person 1 2 By phone 0.3 1 By mail 34 88 IU 24 61 In person 0.3 1 By phone 0.2 0.4 By mail 23 60 Regional parties 12 31 In person 0.4 1 By phone 0.3 1 By mail 12 30 Source: 2004 Spanish CNEP post-election survey. Thus, at least, Spaniards are exposed to heterogenous political messages from party organisations, as there does not seem to be a substantial amount of “screening” or selection bias into which citizens are reached by parties. Table 9 confirms this latter statement further, by providing the crosstabulation of the respondents’ vote and the reception of any contact (in person, by phone or by mail) from each party. Voters and abstainers seem to recall an equivalent contacting from the two biggest parties, although voters of the minor centre-left parties seem to have received contacts to a greater extent (or to be more likely to recall them), and abstainers seem to have received less (or to be less likely to recall them).
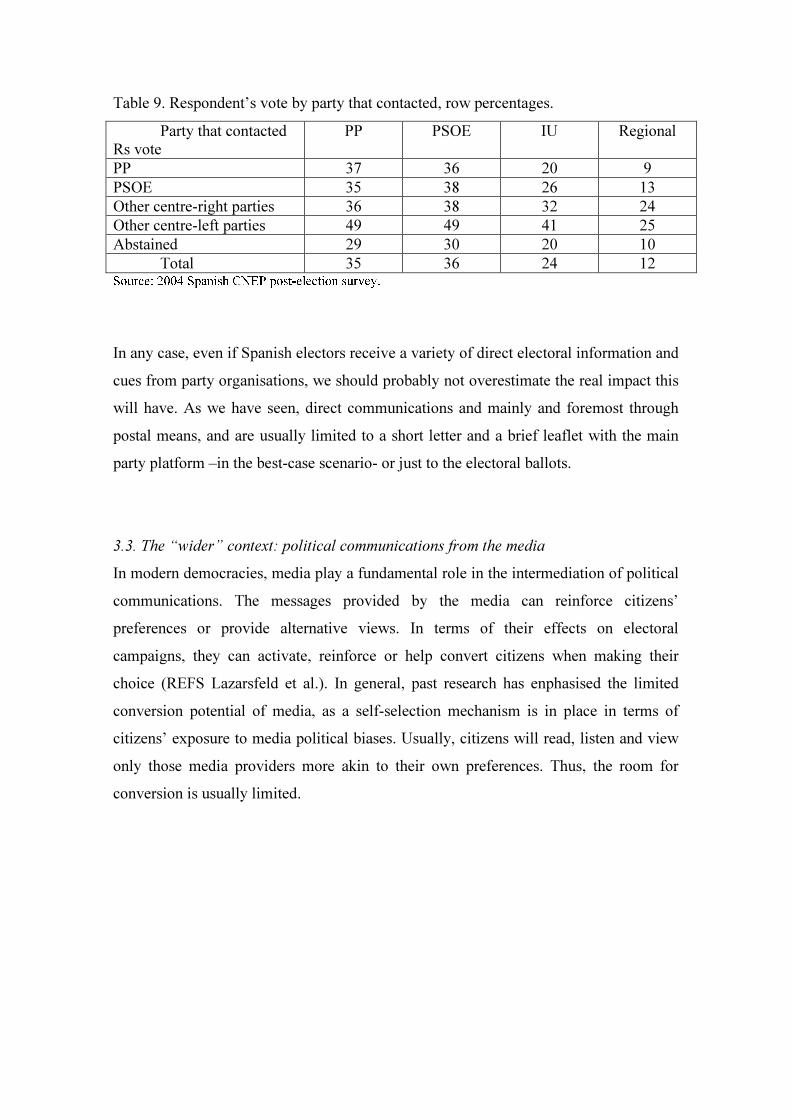
Table 9. Respondent’s vote by party that contacted, row percentages. Party that contacted
Rs vote PP PSOE IU Regional
PP 37 36 20 9 PSOE 35 38 26 13 Other centre-right parties 36 38 32 24 Other centre-left parties 49 49 41 25 Abstained 29 30 20 10
Total 35 36 24 12 Source: 2004 Spanish CNEP post-election survey. In any case, even if Spanish electors receive a variety of direct electoral information and cues from party organisations, we should probably not overestimate the real impact this will have. As we have seen, direct communications and mainly and foremost through postal means, and are usually limited to a short letter and a brief leaflet with the main party platform –in the best-case scenario- or just to the electoral ballots. 3.3. The “wider” context: political communications from the media In modern democracies, media play a fundamental role in the intermediation of political communications. The messages provided by the media can reinforce citizens’ preferences or provide alternative views. In terms of their effects on electoral campaigns, they can activate, reinforce or help convert citizens when making their choice (REFS Lazarsfeld et al.). In general, past research has enphasised the limited conversion potential of media, as a self-selection mechanism is in place in terms of citizens’ exposure to media political biases. Usually, citizens will read, listen and view only those media providers more akin to their own preferences. Thus, the room for conversion is usually limited.
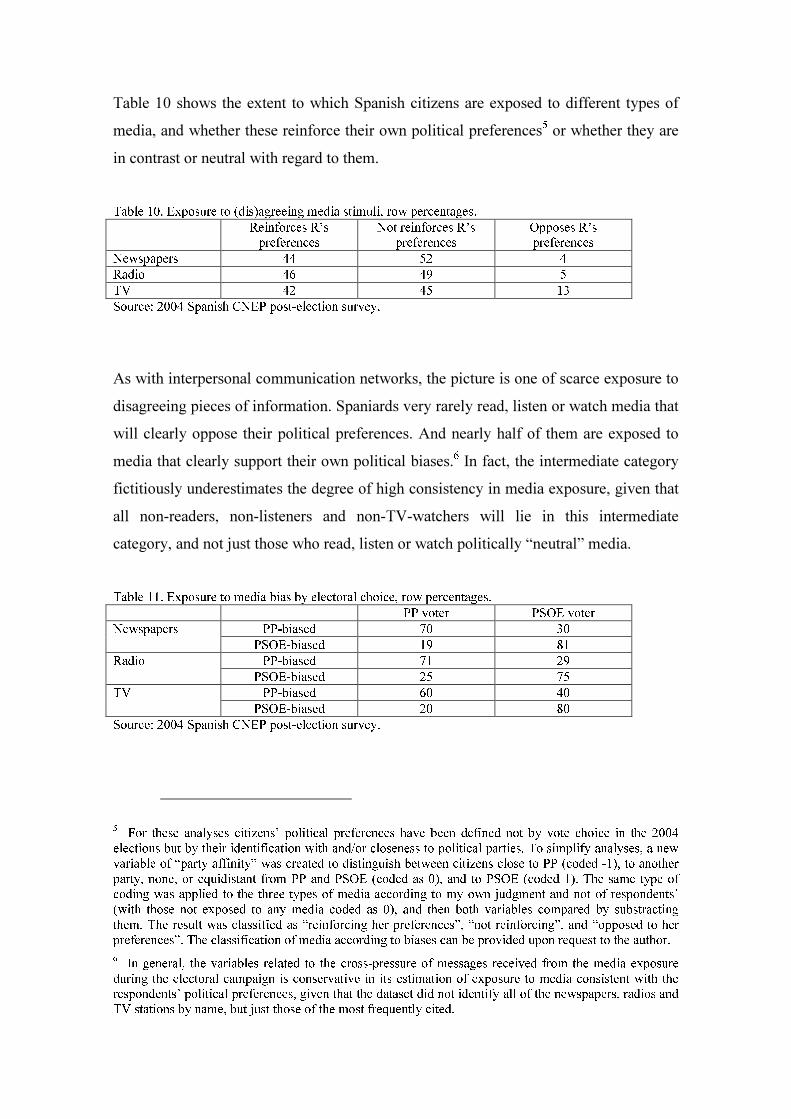
Table 10 shows the extent to which Spanish citizens are exposed to different types of media, and whether these reinforce their own political preferences5 or whether they are in contrast or neutral with regard to them. Table 10. Exposure to (dis)agreeing media stimuli, row percentages. Reinforces R’s preferences Not reinforces R’s preferences Opposes R’s preferences Newspapers 44 52 4 Radio 46 49 5 TV 42 45 13 Source: 2004 Spanish CNEP post-election survey. As with interpersonal communication networks, the picture is one of scarce exposure to disagreeing pieces of information. Spaniards very rarely read, listen or watch media that will clearly oppose their political preferences. And nearly half of them are exposed to media that clearly support their own political biases.6 In fact, the intermediate category fictitiously underestimates the degree of high consistency in media exposure, given that all non-readers, non-listeners and non-TV-watchers will lie in this intermediate category, and not just those who read, listen or watch politically “neutral” media. Table 11. Exposure to media bias by electoral choice, row percentages. PP voter PSOE voter PP-biased 70 30 Newspapers PSOE-biased 19 81 PP-biased 71 29 Radio PSOE-biased 25 75 PP-biased 60 40 TV PSOE-biased 20 80 Source: 2004 Spanish CNEP post-election survey.
5 For these analyses citizens’ political preferences have been defined not by vote choice in the 2004 elections but by their identification with and/or closeness to political parties. To simplify analyses, a new variable of “party affinity” was created to distinguish between citizens close to PP (coded -1), to another party, none, or equidistant from PP and PSOE (coded as 0), and to PSOE (coded 1). The same type of coding was applied to the three types of media according to my own judgment and not of respondents’ (with those not exposed to any media coded as 0), and then both variables compared by substracting them. The result was classified as “reinforcing her preferences”, “not reinforcing”, and “opposed to her preferences”. The classification of media according to biases can be provided upon request to the author. 6 In general, the variables related to the cross-pressure of messages received from the media exposure during the electoral campaign is conservative in its estimation of exposure to media consistent with the respondents’ political preferences, given that the dataset did not identify all of the newspapers, radios and TV stations by name, but just those of the most frequently cited.
In general, citizens exposed to a certain political bias vote consistently with that bias, although this seems to be more the case for Socialist voters to a limited degree. Nevertheless, these results should be interpreted with caution, especially in what regards newspaper and radio exposure, as most citizens are not exposed at all to these media or to neutral ones. And with regard to television, viewers of PSOE-biased media are very limited in proportional terms. In summary, the descriptive results provided in the preceding pages suggest that Spanish electors are, overall, embedded in a political communication environment in which (1) politics is rarely a topic of conversation or attention, and (2), when it is, disagreements and alternative viewpoints are far from common. The limited contrasting political messages citizens receive and perceive are mainly those coming directly from party organisations during the electoral campaign. In such a political and communicational environment, possessing political information might prove a very determinant factor in making electoral choices. If political information is a useful resource for making political decisions, we expect it to have a relevant impact as an intermediating factor of the electoral effects of voters’ communication milieu. 4. The role of political communication networks, political information and electoral mobilisation in predicting electoral participation. Past research in industrial democracies has provided mixed results as to what impact do certain features of political communication networks have on political engagement (REFS). Although the classical studies (Lazarsfeld et al. REF) argued that divergent political messages and cross-pressures would result in demobilization, various pieces by Huckfeldt and his colleagues (REFS) would seem to suggest that this need not be the case, and that citizens embedded in diverse, heterogeneous and disagreeing communication networks and contexts might be even more active and politically engaged than those embedded in homogeneous networks.
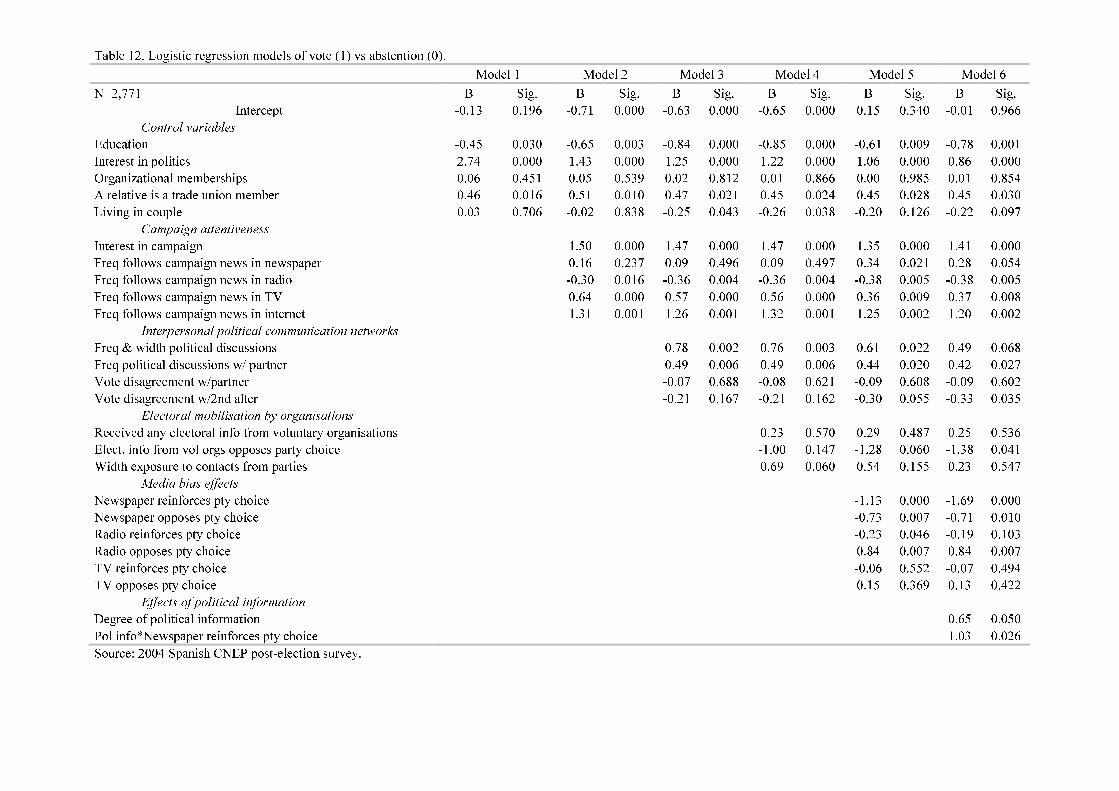
Table 12. Logistic regression models of vote (1) vs abstention (0). Model 1 Model 2 Model 3 Model 4 Model 5 Model 6 N=2,771 B Sig. B Sig. B Sig. B Sig. B Sig. B Sig. Intercept -0.13 0.196 -0.71 0.000 -0.63 0.000 -0.65 0.000 0.15 0.340 -0.01 0.966 Control variables Education -0.45 0.030 -0.65 0.003 -0.84 0.000 -0.85 0.000 -0.61 0.009 -0.78 0.001 Interest in politics 2.74 0.000 1.43 0.000 1.25 0.000 1.22 0.000 1.06 0.000 0.86 0.000 Organizational memberships 0.06 0.451 0.05 0.539 0.02 0.812 0.01 0.866 0.00 0.985 0.01 0.854 A relative is a trade union member 0.46 0.016 0.51 0.010 0.47 0.021 0.45 0.024 0.45 0.028 0.45 0.030 Living in couple 0.03 0.706 -0.02 0.838 -0.25 0.043 -0.26 0.038 -0.20 0.126 -0.22 0.097 Campaign attentiveness Interest in campaign 1.50 0.000 1.47 0.000 1.47 0.000 1.35 0.000 1.41 0.000 Freq follows campaign news in newspaper 0.16 0.237 0.09 0.496 0.09 0.497 0.34 0.021 0.28 0.054 Freq follows campaign news in radio -0.30 0.016 -0.36 0.004 -0.36 0.004 -0.38 0.005 -0.38 0.005 Freq follows campaign news in TV 0.64 0.000 0.57 0.000 0.56 0.000 0.36 0.009 0.37 0.008 Freq follows campaign news in internet 1.31 0.001 1.26 0.001 1.32 0.001 1.25 0.002 1.20 0.002 Interpersonal political communication networks Freq & width political discussions 0.78 0.002 0.76 0.003 0.61 0.022 0.49 0.068 Freq political discussions w/ partner 0.49 0.006 0.49 0.006 0.44 0.020 0.42 0.027 Vote disagreement w/partner -0.07 0.688 -0.08 0.621 -0.09 0.608 -0.09 0.602 Vote disagreement w/2nd alter -0.21 0.167 -0.21 0.162 -0.30 0.055 -0.33 0.035 Electoral mobilisation by organisations Received any electoral info from voluntary organisations 0.23 0.570 0.29 0.487 0.25 0.536 Elect. info from vol orgs opposes party choice -1.00 0.147 -1.28 0.060 -1.38 0.041 Width exposure to contacts from parties 0.69 0.060 0.54 0.155 0.23 0.547 Media bias effects Newspaper reinforces pty choice -1.13 0.000 -1.69 0.000 Newspaper opposes pty choice -0.73 0.007 -0.71 0.010 Radio reinforces pty choice -0.23 0.046 -0.19 0.103 Radio opposes pty choice 0.84 0.007 0.84 0.007 TV reinforces pty choice -0.06 0.552 -0.07 0.494 TV opposes pty choice 0.15 0.369 0.13 0.422 Effects of political information Degree of political information 0.65 0.050 Pol info*Newspaper reinforces pty choice 1.03 0.026 Source: 2004 Spanish CNEP post-election survey.
If we extend these two opposing logics –cross-pressures versus citizens enlightened by heterogenous communication flows- not just to interpersonal communication networks, but also to mobilisational efforts by organisations, and to media effects, we would expect citizens exposed to a greater number of “contrasting” views in their communicational environment to be more likely to vote in the elections (as opposed to abstaining). In this regard, Table 12 provides some very interesting preliminary findings. As usual, some of the common control variables are significant and have a relevant impact on the likelihood of turning out (education and interest in politics). Interestingly enough, a variable usually correlated with voting –organisational memberships- has no significant impact, whereas having a relative that is a trade union member (as a proxy to being embedded in an “engaged” context) does. It is also interesting to note that, contrary to what past research in Spain (REFS) has shown, living in couple would seem to have no significant impact on its own, or a negative effect once we control for the frequency of political discussions with the partner. Most variables related to campaign attentiveness show the expected relation to turnout. However, it is is intriguing to note that the frequency with which an individual has followed the campaign in newspapers has no relevant impact on her likelihood to vote until we control for media biases (models 5 & 6). Equally puzzling is the negative effect that campaign following through the radio has on voting. If we turn our attention to the main variables we are analysing, we see that the coefficients for the variables related to interpersonal communication networks would seem to indicate that exposure to frequent political conversations does enhance turnout, but that disagreement within those networks has either not significant effect (with partners in all models) or a negative impact (with the 2nd alter). Equally, contrasting views to the political preferences of voters expressed by voluntary organisations has a depressing effect on electoral turnout. Interestingly enough, mobilisation efforts by voluntary organisations or by political parties seem to have no marginal impact on citizens propensity to vote. Television biases seem to have no impact whatsoever on turnout.
Finally, these results confirm the relevance of the degree of political information, both in its main effects for predicting turnout, and in its interaction effect with newspaper biases. For citizens with higher levels of information, reading a newspaper that supports one’s political preferences will foster the likelihood of voting, almost neutralising the negative main effect of this media bias. The effects of media biases on the likelihood of turning out to vote are also puzzling. Both newspaper and radio exposure to media that reinforce the respondents’ party choice seem to demobilise voters, and so does readership of newspapers opposing one’s political preferences (baseline category is neutral or no readership). 5. The role of political communication networks, political information and electoral mobilisation in predicting party choice. Political communications networks and the more general political communications environment is not only relevant for citizens to make a decision as to whether or not turn out to vote, but also for making a vote choice. Certainly, we should not expect that the context will have the same effect on both, so our models have to adapt to incorporate the specific political bias of the communicational environment that sorrounds voters. When it comes to predicting vote choice we should expect less of an effect of the frequency of political conversations, no matter with whom, as we are now dealing just with voters who effectively went to the polls. But in this case, we do expect a greater impact of the degree of voting agreement with significant alters, and of political mobilisation from parties and from media biases. In this case, we would also expect political information to mitigate the effects of (dis)agreement with significant others. Table 13 preliminary explores these expectations in an analysis of vote choice for the Socialists, as opposed to voting the centre-right PP.
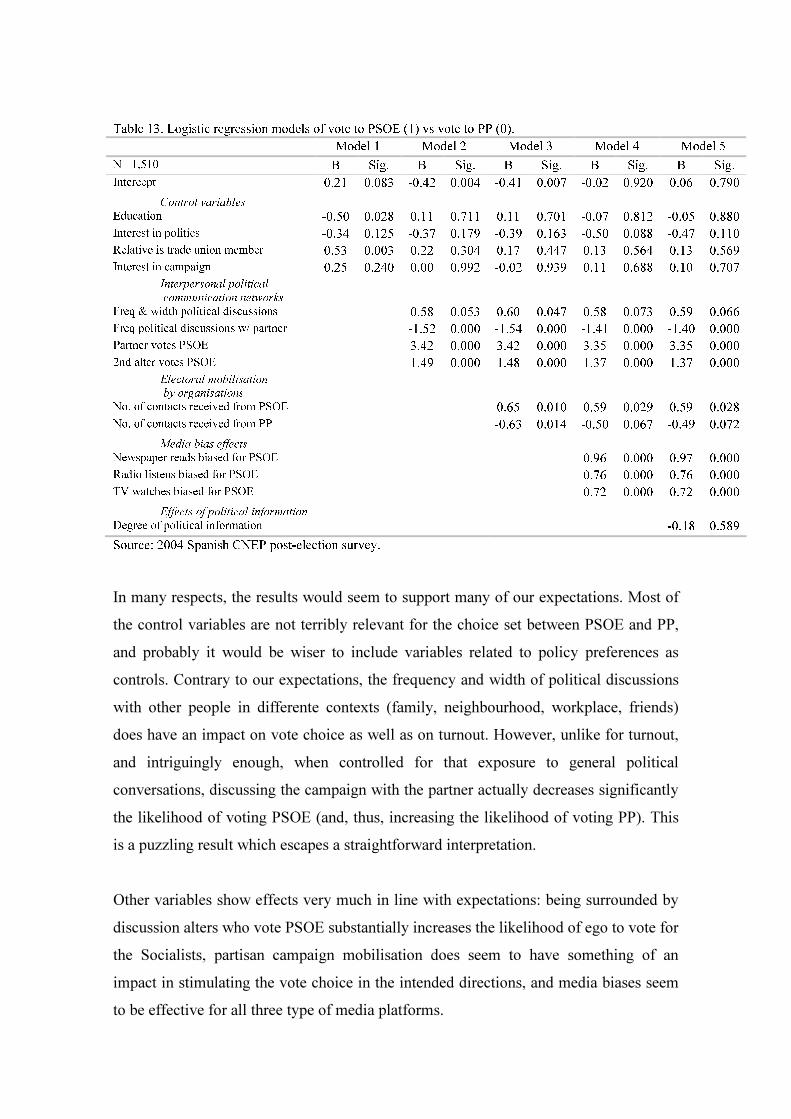
Table 13. Logistic regression models of vote to PSOE (1) vs vote to PP (0). Model 1 Model 2 Model 3 Model 4 Model 5 N= 1,510 B Sig. B Sig. B Sig. B Sig. B Sig. Intercept 0.21 0.083 -0.42 0.004 -0.41 0.007 -0.02 0.920 0.06 0.790 Control variables Education -0.50 0.028 0.11 0.711 0.11 0.701 -0.07 0.812 -0.05 0.880 Interest in politics -0.34 0.125 -0.37 0.179 -0.39 0.163 -0.50 0.088 -0.47 0.110 Relative is trade union member 0.53 0.003 0.22 0.304 0.17 0.447 0.13 0.564 0.13 0.569 Interest in campaign 0.25 0.240 0.00 0.992 -0.02 0.939 0.11 0.688 0.10 0.707 Interpersonal political communication networks Freq & width political discussions 0.58 0.053 0.60 0.047 0.58 0.073 0.59 0.066 Freq political discussions w/ partner -1.52 0.000 -1.54 0.000 -1.41 0.000 -1.40 0.000 Partner votes PSOE 3.42 0.000 3.42 0.000 3.35 0.000 3.35 0.000 2nd alter votes PSOE 1.49 0.000 1.48 0.000 1.37 0.000 1.37 0.000 Electoral mobilisation by organisations No. of contacts received from PSOE 0.65 0.010 0.59 0.029 0.59 0.028 No. of contacts received from PP -0.63 0.014 -0.50 0.067 -0.49 0.072 Media bias effects Newspaper reads biased for PSOE 0.96 0.000 0.97 0.000 Radio listens biased for PSOE 0.76 0.000 0.76 0.000 TV watches biased for PSOE 0.72 0.000 0.72 0.000 Effects of political information Degree of political information -0.18 0.589 Source: 2004 Spanish CNEP post-election survey. In many respects, the results would seem to support many of our expectations. Most of the control variables are not terribly relevant for the choice set between PSOE and PP, and probably it would be wiser to include variables related to policy preferences as controls. Contrary to our expectations, the frequency and width of political discussions with other people in differente contexts (family, neighbourhood, workplace, friends) does have an impact on vote choice as well as on turnout. However, unlike for turnout, and intriguingly enough, when controlled for that exposure to general political conversations, discussing the campaign with the partner actually decreases significantly the likelihood of voting PSOE (and, thus, increasing the likelihood of voting PP). This is a puzzling result which escapes a straightforward interpretation. Other variables show effects very much in line with expectations: being surrounded by discussion alters who vote PSOE substantially increases the likelihood of ego to vote for the Socialists, partisan campaign mobilisation does seem to have something of an impact in stimulating the vote choice in the intended directions, and media biases seem to be effective for all three type of media platforms.
Political information does, however, have no significant impact on vote choice, and nore does it any sensible interaction between political information and variables related to the heterogeneity of the communication context of respondents. Thus, the biases of the social and political environment in which voters are embedded contribute substantially to define their vote choice, but this effect is not dependent on the levels of political information they possess. 6. Brief summary In this preliminary analysis of the role of communication networks and political information in the electoral behaviour of Spanish citizens we have been able to detect some provisional findings. (1) The extension of the interpersonal communication networks of Spaniards is comparatively limited, when considering other advanced industrial democracies analysed elsewhere. Spanish electors rarely engage in political discussions at all, and when they do, these are reduced to a small circle of family and friends. (2) In general terms, the political communicational environment that sorrounds Spanish citizens is quite homogeneous. They are exposed to opposing political views –from acquaintances, organisations and political parties, or the media- to a very limited extent. (3) The frequency of political communication with others is relevant both to predict voting turnout and vote choice, whereas the degree of (dis)agreement of the closest alters is more generally relevant for vote choice. (4) The electoral mobilisation of party organisations seems to have a greater impact in determining vote choice than in assuring turnout. (5) Media biases are related both to turnout and vote choice, but their effect is more clear and systematic for the latter.

(6) Finally, political information seems to be relevant for determining turnout and irrelevant for vote choice. In the former case, being more politically informed not only contributes to increasing the likelihood of electoral participation, but it also mediates with the effects of media biases on turnout.