Embed Size (px)
Citation preview

INTERNATIONAL JOURNAL OF BUSINESS, 8(3), 2003 ISSN:1083-4346
Political Events and the Stock Market: Evidence from Israel
Tzachi Zach Washington University, Olin School of Business, St. Louis, MO 63130
ABSRACT
The past decade has seen increasing activity regarding the peace process between Israel and its Arab neighbors. In this paper I study the return patterns of the Tel Aviv Stock Exchange index and of Israeli firms’ stocks traded in the United-States following announcements of news related to the peace process. I find that returns on the Tel Aviv Stock Exchange following political events are more extreme than returns on days that do not follow political events. This pattern is also apparent in returns of dually listed stocks (those traded both in the US and in Israel). The pattern is not present in Israeli stocks that are traded only in the US. JEL: G15, F31 Keywords: Political event; Stock market; Israel; Middle East; News
Copyright2003 by SMC Premier Holdings, Inc. All rights of reproduction in any form reserved.
244 Zach
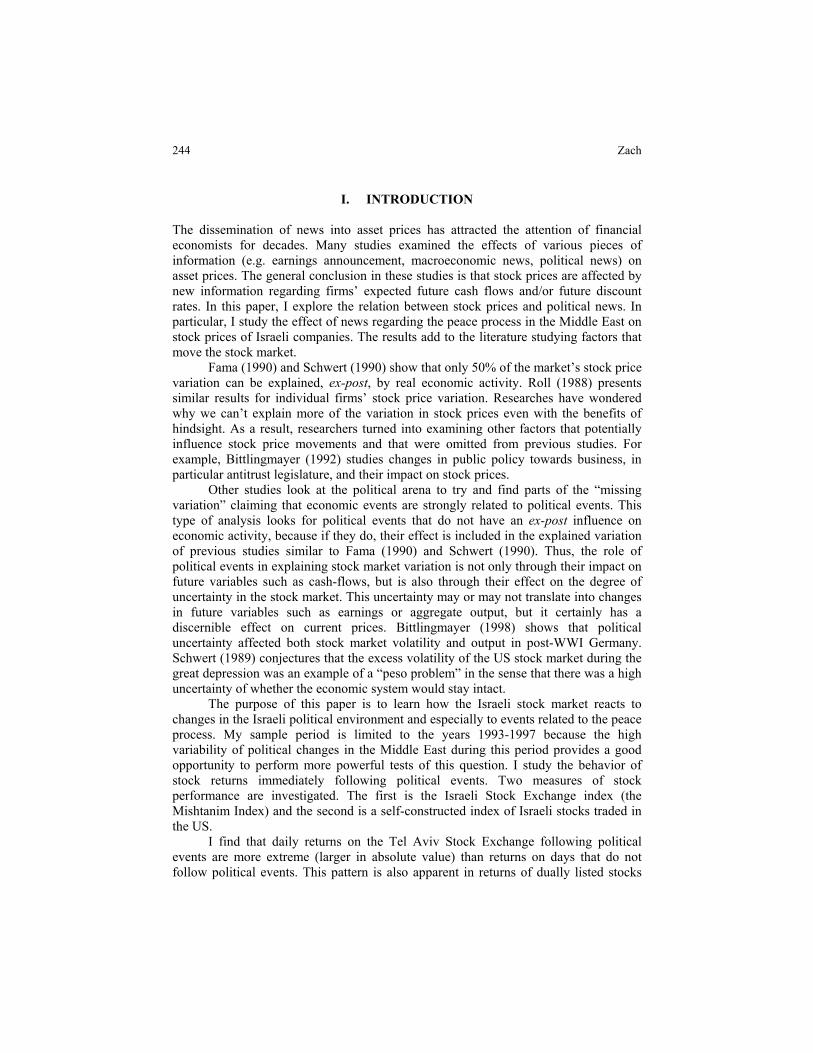
I. INTRODUCTION The dissemination of news into asset prices has attracted the attention of financial economists for decades. Many studies examined the effects of various pieces of information (e.g. earnings announcement, macroeconomic news, political news) on asset prices. The general conclusion in these studies is that stock prices are affected by new information regarding firms’ expected future cash flows and/or future discount rates. In this paper, I explore the relation between stock prices and political news. In particular, I study the effect of news regarding the peace process in the Middle East on stock prices of Israeli companies. The results add to the literature studying factors that move the stock market.
Fama (1990) and Schwert (1990) show that only 50% of the market’s stock price variation can be explained, ex-post, by real economic activity. Roll (1988) presents similar results for individual firms’ stock price variation. Researches have wondered why we can’t explain more of the variation in stock prices even with the benefits of hindsight. As a result, researchers turned into examining other factors that potentially influence stock price movements and that were omitted from previous studies. For example, Bittlingmayer (1992) studies changes in public policy towards business, in particular antitrust legislature, and their impact on stock prices.
Other studies look at the political arena to try and find parts of the “missing variation” claiming that economic events are strongly related to political events. This type of analysis looks for political events that do not have an ex-post influence on economic activity, because if they do, their effect is included in the explained variation of previous studies similar to Fama (1990) and Schwert (1990). Thus, the role of political events in explaining stock market variation is not only through their impact on future variables such as cash-flows, but is also through their effect on the degree of uncertainty in the stock market. This uncertainty may or may not translate into changes in future variables such as earnings or aggregate output, but it certainly has a discernible effect on current prices. Bittlingmayer (1998) shows that political uncertainty affected both stock market volatility and output in post-WWI Germany. Schwert (1989) conjectures that the excess volatility of the US stock market during the great depression was an example of a “peso problem” in the sense that there was a high uncertainty of whether the economic system would stay intact.
The purpose of this paper is to learn how the Israeli stock market reacts to changes in the Israeli political environment and especially to events related to the peace process. My sample period is limited to the years 1993-1997 because the high variability of political changes in the Middle East during this period provides a good opportunity to perform more powerful tests of this question. I study the behavior of stock returns immediately following political events. Two measures of stock performance are investigated. The first is the Israeli Stock Exchange index (the Mishtanim Index) and the second is a self-constructed index of Israeli stocks traded in the US.
I find that daily returns on the Tel Aviv Stock Exchange following political events are more extreme (larger in absolute value) than returns on days that do not follow political events. This pattern is also apparent in returns of dually listed stocks

INTERNATIONAL JOURNAL OF BUSINESS, 8(3), 2003 245
(those traded both in the US and in Israel). However, this pattern is not present in the group of Israeli firms that are traded only in US markets. Cross-sectional differences in locations of sales and assets do not account for the different reactions to political events across the two groups.
The rest of this paper is organized as follows: In section 2 I provide a summary of past literature that studied the relation between the stock market and the political arena. Section 3 provides some background on the political environment in the Middle East during the sample period. I describe the data in section 4, and perform the statistical tests in section 5. In section 6 I carry out a cross-sectional analysis and in section 7 I look more closely at specific news-intensive periods. I conclude in section 8.
II. PREVIOUS LITERATURE In general, there is little direct evidence on the link between political events and market movements because of the difficulty in identifying and quantifying political changes. The little literature that does exist can be divided into two groups: (i) Short-window event studies, (ii) Long- horizon studies. In this study, I take the first approach and perform short-window tests. A. Short-window event studies Niederhoffer (1971) studies the short-window reaction of the stock market to world events. In his study, Niederhoffer relates world events to subsequent movements in the S&P 500. World events are chosen from the New York Times based on the magnitude of their headlines. Niederhoffer finds that world events exert a discernible influence on the movement of the S&P 500. More specifically, returns following world events tend to be larger in absolute value than returns on other days.
Cutler, Poterba and Summers (1989), perform a similar analysis. They study market reactions following 49 carefully selected events.1 They find that the average absolute value of daily returns on the 49 selected dates is 1.46% and its standard deviation is 2.08%. In contrast, the average absolute value of returns on non-event days during the 1941-1987 period was 0.56% with a standard deviation of 0.83%. Cutler et al. (1989) argue that these numbers cannot explain the “missing variation” in stock prices. However, these numbers do show that returns on event days are more volatile than returns on non-event days.
Cutler et al. (1989) also conduct a different analysis. They examine the fifty largest percentage changes in the S&P500 since 1946. They check whether the New York Times mentioned the reasons for the unusual movements. In general, Cutler et al. (1989) argue that the significant market movements are not associated with the release of big political news.
Kim and Mei (1994) examine the movements in the Hong Kong stock market and their relation to political events. Using an event-study approach they show that political developments have a significant impact on stock prices. They also show that adding a political variable to the regressions specified in Fama (1990) increases these

246 Zach
models’ explanatory power. Finally, Kim and Mei (1994) model more formally the variation in volatility as a function of political events.
Klibanoff, Lamont and Wizman (1998) examine a sample of closed-end country mutual funds to test, among other things, whether “major news events” lead certain traders to temporarily react more quickly to changes in fundamentals. They find that the absolute value and standard deviation of both funds’ returns and changes in net asset values are sharply higher in weeks that contain major news items than in other weeks. In addition, they show that the elasticity of the funds’ prices with respect to their NAV is higher in event weeks than in other weeks. This evidence is consistent with the hypothesis that investors underreact to changes in NAV that take place every week, but change their behavior when they observe dramatic news. In weeks containing news events, investors respond much more to changes in fundamentals. B. Long-horizon studies Diamonte, Liew, and Stevents (1996) and Erb, Harvey, and Viskanta (1996) study the long-term link between political risk and stock market returns. Diamonte et al. (1996) show that changes in political risk have a larger impact on returns in emerging markets than in developed markets. Erb et. al (1996) show that country-risk measures (consisting of both political and economical risk measures) are correlated with future equity returns. Both of these are long-window studies that look at some measure of political risk and its relation to the stock market over a long period of time.
III. HISTORICAL AND POLITICAL BACKGROUND In 1991, immediately following the Gulf War, the US gathered, for the first time, delegates from Israel and its Arab neighbors around one table in the Madrid Conference. This marked the starting point of the peace process in the Middle East. Two notable treaties were signed since then. In September 1993, Israeli Prime Minister Yitzhak Rabin and PLO chairman Yassir Arafat signed the Oslo Accords on the White House lawn. In October 1994, Israel and Jordan signed a peace treaty.
Two opposite views regarding the link between the peace process and its economic impact have divided the Israeli political system. The first is represented with the following quote by Benny Gaon, at the time CEO of Koor Industries, Israel’s largest conglomerate:
“In my view, the economic benefits of the peace process are irrefutable… The peace process also enabled a redistribution of resources from defense to infrastructure, transportation, telecommunications and education. The felicitous impact on our national well-being over the longer term is therefore inestimably greater”.2
The second view is represented by the following quote: “An objective observer would be hard put to see a positive correlation between the peace process and the state of Israel’s economy. At best the peace process is irrelevant”.3

INTERNATIONAL JOURNAL OF BUSINESS, 8(3), 2003 247
As the quotes illustrate, the political debate about what is commonly referred to as “the fruits of peace” or “the dividend of peace” has been at the center of Israeli public attention. A few notable changes in the Israeli economy and foreign relations have taken place since the outset of the peace process. First, Israel markedly improved its diplomatic relations with the rest of the world. Israel today maintains diplomatic relations with 162 countries, an increase of 70 since 1991. For example, China and India are two important countries that established diplomatic relations with Israel in 1992. Another example is the signing of the fundamental agreement with the Vatican in December 1993. Most important are the improving relations with Israel's Arab neighbors. As a result of this improvement in diplomatic relations, new potential markets have opened for Israeli companies.
Second, in 1994 countries of the Persian Gulf lifted the secondary and tertiary economic boycott against Israel. As a result, many foreign companies and investors started doing business in Israel. For instance, Fershtman and Gandell (1998) discuss the entry of all major Japanese and Korean car manufacturers into the Israeli market. A salient example of increasing activity of foreign investors is the 1994 authorization given by the Tokyo Stock Exchange to Japanese firms to invest in the Israeli stock market. Third, internally, the change in the political arena helped Israel reallocate resources in its budget to investment in education and infrastructure.
Finally, Israeli companies are more welcomed in foreign capital markets. Since 1992 a growing number of Israeli firms have raised funds in the US capital market. Today, more than 100 Israeli and Israeli-related companies are traded in NASDAQ, AMEX and NYSE.5 In addition, many Israeli firms raised capital in European stock market such as the London Stock Exchange and the Euro.NM.
In the appendix I provide an example of a paragraph that is common in Israeli firms’ prospectuses. The paragraph gives a brief historical background and illustrates the strong relation between Israeli economic and political conditions.
IV. THE DATA A. Political Events In order to proceed with a short-window event study I must identify political events that have implication on the peace process in the Middle East. I search the Dow Jones News Retrieval Service (DJNRS) for days in which “something happened” in the Middle East. The search process has to overcome a few obstacles that affect the power of the statistical analysis that follows. First, my search has to identify important events that are pivotal to the peace process. Second, the search must not identify old news but rather it has to pick events as close as possible to their time of occurrence.
I search the DJNRS for articles in the Wall Street Journal, the New York Times, the Washington Post and the Los Angeles Times during 1993 – 1997.6 My sample period is not longer because of the relatively high costs of data collection. I limit myself to this particular period because of the high variability of political events taking place in it, which provides a more powerful setting to examine the issues studied in the paper. Using a few news resources increases the probability that the search will yield both

248 Zach
important and timely events. For example, the search will not pick up commentary articles summarizing events that occurred in the preceding month because the probability that such an article will appear in a few newspapers on the same day is quite low. In contrast, if an article appears in a few sources, it is likely that it reports about an important event.
The search results in 199 hits in the Los Angeles Times, 181 hits in the Washington Post, 155 hits in the New York Times and 30 hits in the Wall Street Journal. I form two samples of calendar event days, depending on the sources in which the hits appeared. Sample 1 consists of days that contain articles, on the same topic, in at least two out of the three top sources.7 Sample 2 consists of days that contain articles, on the same topic, in at least three out of the four sources. Its purpose is to refine sample 1 by picking more important events.
Table 1 Distribution of calendar event days
I search the DJNRS for articles concerning the peace process in the Middle East in the Wall Street Journal, the New York Times, the Washington Post and the Los Angeles Times during 1993 – 1997. Specifically, I run the following search (“Israel” and “peace” and [“Palestinian” or “Syria”]) in the article’s headline or first paragraph. The table lists the results of the search by weekday and by month.
By weekday By month Sunday 30 12.4% January 15 6.2% Monday 31 12.9% February 20 8.3% Tuesday 40 16.6% March 23 9.5% Wednesday 26 10.8% April 18 7.5% Thursday 39 16.2% May 18 7.5% Friday 44 18.2% June 11 4.6% Saturday 31 12.9% July 15 6.2% August 23 9.5% September 39 16.2% October 31 12.9% November 10 4.1% December 18 7.5%
241 100% 241 100%
Figure 1 plots the frequency of calendar event days by month. The top-news month is September 1993, when the Oslo Accords between Israel and the Palestinians were signed. Table 1 shows the distribution of calendar event days by days of the week and by months. As one might expect, there seems to be no apparent pattern in these distributions.

INTERNATIONAL JOURNAL OF BUSINESS, 8(3), 2003 249
Figure 1 The distribution of calendar event days by month
Table 2 is an example of the type of events that my search yielded for the period 5 0
Calendar Event Days by month
10
15
20
25
30
Dec-92
Mar-93Jun-93
Sep-93
Dec-93
Mar-94Jun-94
Sep-94
Dec-94
Mar-95Jun-95
Sep-95
Dec-95
Mar-96Jun-96
Sep-96
Dec-96
Mar-97Jun-97
Sep-97
Dec-97
Table 2 is an example of the type of events that my search yielded for the period
January 1994 to June 1994. B. Stock returns When analyzing the relation between returns and political events, I translate each calendar event day into its relevant trading event day, depending on the index I study. I do not control for concurrent economic events.
I look at daily returns of two indices. The first is the Tel Aviv Stock Exchange Daily 100 index (TAD100, formerly known as the Mishtanim Index) obtained from DataStream.8 The second is a self-constructed equally-weighted index (ISRIX) from daily returns of Israeli stocks traded in the United States.9
For each market, I convert the calendar event days, in samples 1 and 2, into trading event days. In doing so, I take into account two factors. First, where applicable, I add the day before the calendar event day because I use newspapers as my only sources of information and thus cannot be sure of the exact timing of an event. The addition of days to my sample introduces noise that decreases the statistical power of the analysis. Nevertheless, any significant results I obtain are underestimated in the “right direction” and the inference is not altered.

250 Zach
Table 2 Event days during the period January 1994 – June 1994
Date Event Headline
1/11/94 Israel-PLO Talks Resume; Agreement Is Expected to Take Several Weeks. 1/15/94 Persecution ended, Syria’s Jews stage an exodus. 1/18/94 Israel welcomes Assad stand, carefully. 2/10/94 Israel-PLO deal solves key issues in self-rule plan. 2/11/94 Peace Pact at Least a Month Away, Rabin Warns; Text of latest Israel-PLO agreement
shows both sides gave ground on key issues. Arafat flies to Jordan to meet with King. 2/26/94 Massacre in the Mideast; Killings Harden Opponents of Peace; Reaction: Protests
against talks with Israel erupt throughout Arab world. PLO demands a disarming of Israeli settlers.
2/28/94 3 Arab nations are said to break off Israel talks. 3/2/94 Israel Frees 570 Prisoners, Seeks to Draw PLO to Talks. 3/4/94 Backlash Against Arafat Sweeps Occupied West Bank, Gaza; Palestinian anger is
directed as much at the PLO chairman as at Israel and the settler who killed 48 Muslims.
3/16/94 Rabin Rejects PLO Terms for New Talks; Addressing U.S. Jewish leaders, premier rules out removal of settlers from territories. He meets with Clinton today.
4/22/94 Rabin Says Golan Sites Expendable; Israel Studies Options For Talks With Syria. 4/30/94 Christopher, Rabin Renew Efforts for Peace With Syria. 5/2/94 Israel-Syria Talks in `New Phase,' Christopher Says; He presents Damascus with
Jerusalem's peace proposals. The initial response is negative. 5/3/94 Christopher Conveys Syria's Reply to Israeli Proposal; Official says Jerusalem is
encouraged by response to peace initiative-but not ready for talks. 5/17/94 Christopher Shuttles Assad's Peace Suggestions to Israel; Syria appears increasingly
serious about an accord on the Golan Heights, U.S. officials say. 5/19/94 Israel, Syria Closing Gap, Officials Say Aides call Christopher upbeat about peace
prospects after four days of shuttling between capitals. But neither side is ready for face-to-face talks.
5/24/94 Israel Seeks Arafat Vow to Back Pact; Government threatens to withhold further implementation of Autonomy accord. PLO leader had suggested deal was not permanent.
6/22/94 Jordan's King Hopes for Open Talks With Israel Hussein says he will press ahead with peace negotiations without relying on Syria's lead.
Second, if the calendar event day falls on a weekend or on a holiday, I add the first trading day immediately following it.10 In sum, a trading event day can be one of three days: A calendar event day, a day that precedes a calendar event day, or the first trading day that follows a calendar event day. Hereinafter, I will refer to a trading event day as simply an “event day”. Figure 2 describes the conversion of calendar event days into trading event days. The ovals represent calendar event days and the squares represent trading event days.

INTERNATIONAL JOURNAL OF BUSINESS, 8(3), 2003 251
Sample 1 229 Days
Sample 288 Days
TAD100 Sample A 297 Days
ISRIXSample C306 Days
TAD100Sample B124 Days
ISRIX Sample D 121 Days
Figure 2 Conversion of calendar event days into trading event days
Figure 3
/9
350
550
750
950
1150
1350
1550
1750
1950
1/434/4/93
7/4/93
10/4/931/4/944/4/94
7/4/94
10/4/941/4/954/4/95
7/4/95
10/4/951/4/96
4/4/96
7/4/96
10/4/961/4/97
4/4/977/4/97
10/4/97
Date
S&P 500
Israeli Stocks (ISRIX)
Mishtanim (TAD 100)

252 Zach
In Table 3, I present some summary statistics of the distribution of returns in the sample period. I include data on the S&P500 for comparison. Figure 3 plots the performance of the Israeli stock index (TAD100) against the ISRIX index and the S&P500.
Table 3 Distribution of daily returns and the absolute values of daily returns - Summary statistics
Panel A refers the distributions of daily returns and Panel B refers to the distribution of the absolute value of daily returns. In each panel, TAD refers to returns of the Tel Aviv 100 index, ISRIX refers to the returns of Israeli stocks traded in the US, and S&P 500 refers to returns on the S&P 500 index. Samples A and C correspond to trading events days derived from calendar events days in sample 1. Samples B and D correspond to trading event days derived from calendar event days in sample 2. (See Section IV for details).
Mean Median σ Kurt.* Skew. Number Panel A: Daily returns
TAD100 Full Sample (1993-1997)
0.05% 0.12% 1.63% 3.67 -0.06 1219
Sample A 0.10% 0.17% 1.76% 4.09 0.15 297 Sample B 0.29% 0.35% 1.77% 4.40 -0.05 124
ISRIX
Full Sample (1993-1997)
0.10% 0.17% 1.29% 5.37 -0.42 1264
Sample C 0.13% 0.20% 1.19% 3.84 -0.04 306 Sample D 0.14% 0.20% 1.22% 3.62 -0.24 121
S&P 500
Full Sample (1993-1997)
0.07% 0.06% 0.75% 8.51 -0.49 1264
Panel B: Absolute value of daily returns TAD100
Full Sample (1993-1997)
1.19% 0.89% 1.12% 12.11 2.36 1219
Sample A 1.33% 0.98% 1.15% 5.92 1.52 297 Sample B 1.37% 0.98% 1.15% 6.74 1.69 124
ISRIX
Full Sample (1993-1997)
0.98% 0.78% 0.84% 10.15 1.91 1264
Sample C 0.90% 0.69% 0.78% 4.79 1.38 306 Sample D 0.94% 0.77% 0.78% 4.42 1.25 121
S&P 500
Full Sample (1993-1997)
0.53% 0.39% 0.53% 22.33 3.13 1264
* The hypothesis that the distributions of daily returns in both markets are normal is rejected at the 1-% level.

INTERNATIONAL JOURNAL OF BUSINESS, 8(3), 2003 253
Panel A of Table 3 suggests that returns on event days are slightly higher than returns in the full sample (except for sample B where they are considerably higher). This suggests that, on average, the market viewed news about the peace process in this period as positive. Event-day returns on the TAD100 seem to be more volatile than returns in the full sample, whereas event-day returns on ISRIX seem to be less volatile than returns in the full sample. More formal tests are performed in the next section.
V. STATISTICAL ANALYSIS
As a first step, I rank the daily returns of both indices (each index separately) in ascending order and divide them into ten equal deciles, such that the lowest returns are in the first decile and the highest returns are in the tenth decile. Table 4 shows the distribution of returns, in each sample of trading event days, according to deciles.
It is apparent from Table 4 that TAD100 event day returns tend to be extreme. In sample A, about 27% of the event days are concentrated in the first or tenth decile, which is statistically different from the expected value of 20% at the 1% level. In sample B we see that there is a high concentration of event days in the tenth decile. The ISRIX returns do not exhibit any apparent abnormal behavior. The conclusion I draw from Table 4 is that there is a tendency for returns following political events in the Israeli market to be more extreme than in other days. In sample B it seems that extreme positive returns are more prevalent than extreme negative returns.
Table 4 Frequency of event-day returns
For each variable, I rank the full sample returns in ascending order and divide them into ten equal deciles. The first decile includes the lowest returns and the tenth decile includes the highest returns. The table reports the frequency of event days, for the four different samples, across deciles.
TAD100 ISRIX Decile Sample A Sample B Sample C Sample D
Obs 297 124 306 121 1 12.79%c 8.06% 10.13% 8.26% 2 8.75% 8.06% 7.19% 10.74% 3 9.43% 12.90% 9.15% 9.92% 4 9.43% 8.06% 12.42% 9.92% 5 8.43% 8.06% 9.80% 10.74% 6 9.43% 5.65% 12.42% 9.09% 7 8.75% 11.29% 12.09% 12.40% 8 9.43% 8.88% 10.78% 9.92% 9 8.75% 9.69% 7.20% 9.09% 10 14.81%a 19.35%a 8.82% 9.92% 100% 100% 100% 100%
a,b,c Denote statistical significance at the 1%,5%,10% levels, respectively.

254 Zach
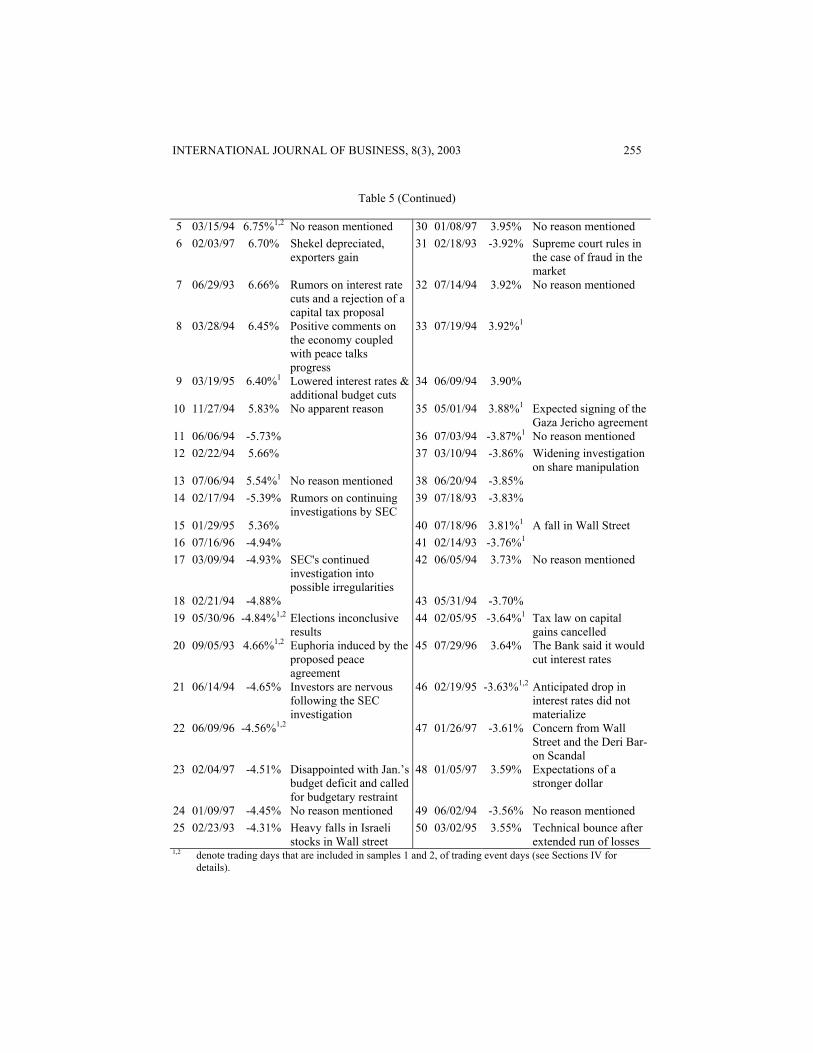
Table 5 looks at the fifty largest movements in the TAD100 during 1993-1997. In addition, the table lists the reasons for the big changes as they were reported in the daily market column of the Jerusalem Post.11 Seventeen (34%) of the fifty largest movements occurred in days that are classified as trading event days in sample 1 and seven (14%) occurred in days that are in sample 2. These frequencies are higher than the frequency of trading event days in the population (24% and 10% in samples 1 and 2, respectively). However, out of the 35 days for which I found a Jerusalem Post article, only in five days are political events mentioned explicitly to be the reason for the market’s extreme reaction.
A. Statistical tests – Location I now turn to a more formal examination of the question: Do returns following political events differ from returns in other days? Since the distribution of returns is non-normal, I choose to perform a few non-parametric tests. The first dimension I examine is whether the location (median) of the return distribution in event days is different from that in non-event days. If event days are equally likely to produce positive returns as they are negative returns there is no reason to believe that there is a difference between the medians. I run a Wilcoxon rank-sum test for each sample. The null hypothesis is that the median return in the sample is identical to the median return out of the sample (the full sample returns excluding the event-day returns). The Z-statistic and its corresponding p-values are presented in panel A of Table 6. The results are consistent with panel A of Table 3. Except for Sample B, we cannot reject the hypothesis that the mean return following event days is identical to that in other days. In Sample B, we can reject that hypothesis with a significance level of 6%. This is consistent with Table 4, where we saw far more extreme positive returns than extreme negative returns.
Table 5 The 50 largest daily changes in the TAD100 (Mishtanim), 1993-1997
This table lists the 50 largest movements in the TAD100 (Mishtanim) index during 1993 – 1997. The explanation column describes the reason for the big movement as mentioned in the Jerusalem Post stock market column. Some boxes are empty because I could not find the article in the Dow Jones News Retrieval Service.
Date Explanation Date Explanation 1 08/21/94 -9.93% 26 02/11/93 -4.17%1 Frenkel's remarks
about market uncertainty - Bubble
2 10/28/97 -8.42% 27 02/13/94 -4.05%1 SEC investigation causes market's mood to be low
3 10/30/97 8.00% Following Wall street rebound
28 09/26/96 -4.04%1,2 No reason mentioned
4 01/31/95 7.72% Rabin talks against the capital gains tax
29 12/11/94 3.98%1,2
INTERNATIONAL JOURNAL OF BUSINESS, 8(3), 2003 255
Table 5 (Continued)
5 03/15/94 6.75%1,2 No reason mentioned 30 01/08/97 3.95% No reason mentioned 6 02/03/97 6.70% Shekel depreciated,
exporters gain 31 02/18/93 -3.92% Supreme court rules in
the case of fraud in the market
7 06/29/93 6.66% Rumors on interest rate cuts and a rejection of a capital tax proposal
32 07/14/94 3.92% No reason mentioned
8 03/28/94 6.45% Positive comments on the economy coupled with peace talks progress
33 07/19/94 3.92%1
9 03/19/95 6.40%1 Lowered interest rates & additional budget cuts
34 06/09/94 3.90%
10 11/27/94 5.83% No apparent reason 35 05/01/94 3.88%1 Expected signing of the Gaza Jericho agreement
11 06/06/94 -5.73% 36 07/03/94 -3.87%1 No reason mentioned 12 02/22/94 5.66% 37 03/10/94 -3.86% Widening investigation
on share manipulation 13 07/06/94 5.54%1 No reason mentioned 38 06/20/94 -3.85% 14 02/17/94 -5.39% Rumors on continuing
investigations by SEC 39 07/18/93 -3.83%
15 01/29/95 5.36% 40 07/18/96 3.81%1 A fall in Wall Street 16 07/16/96 -4.94% 41 02/14/93 -3.76%1 17 03/09/94 -4.93% SEC's continued
investigation into possible irregularities
42 06/05/94 3.73% No reason mentioned
18 02/21/94 -4.88% 43 05/31/94 -3.70% 19 05/30/96 -4.84%1,2 Elections inconclusive
results 44 02/05/95 -3.64%1 Tax law on capital
gains cancelled 20 09/05/93 4.66%1,2 Euphoria induced by the
proposed peace agreement
45 07/29/96 3.64% The Bank said it would cut interest rates
21 06/14/94 -4.65% Investors are nervous following the SEC investigation
46 02/19/95 -3.63%1,2 Anticipated drop in interest rates did not materialize
22 06/09/96 -4.56%1,2 47 01/26/97 -3.61% Concern from Wall Street and the Deri Bar-on Scandal
23 02/04/97 -4.51% Disappointed with Jan.’s budget deficit and called for budgetary restraint
48 01/05/97 3.59% Expectations of a stronger dollar
24 01/09/97 -4.45% No reason mentioned 49 06/02/94 -3.56% No reason mentioned 25 02/23/93 -4.31% Heavy falls in Israeli
stocks in Wall street 50 03/02/95 3.55% Technical bounce after
extended run of losses 1,2 denote trading days that are included in samples 1 and 2, of trading event days (see Sections IV for
details).

256 Zach
Table 6
Panel A presents the results of Wilcoxon rank-sum tests and Siegel Tukey tests on daily returns. The null hypothesis, for each sample, is that that the median return (dispersion of returns) in the sample is identical to the median return (dispersion of returns) out of the sample (the full sample returns excluding the event-day returns). Panel B presents the results of Wilcoxon rank-sum tests on the absolute value of daily returns. The null hypothesis, for each sample, is that that the median absolute value of returns in the sample is identical to the median absolute value of returns out of the sample (the full sample returns excluding the event-day returns). Panel C presents the results of Wilcoxon rank-sum tests on the absolute values of daily returns of the ADR index. The null hypothesis, for each sample, is that that the mean absolute value of return in the sample is identical to the mean absolute value of return out of the sample (the full sample returns excluding the event-day returns).
Panel A Wilcoxon Siegel-Tukey Num.
Obs. Z-Stat. p-value ST
statistic p-value
TAD100 Sample A 297 0.528 0.5968 7.23 0.0073 Sample B 124 1.922 0.0545 5.46 0.0196
ISRIX
Sample C 306 0.181 0.8559 4.17 0.0413 Sample D 121 0.218 0.8275 0.13 0.7219
Panel B
TAD100 Sample A 297 2.700 0.0069 Sample B 124 2.240 0.0246
ISRIX
Sample C 306 -2.051 0.0403 Sample D 121 -0.478 0.6326
Panel C
ADR
Sample C 306 1.98 0.0477 Sample D 121 1.88 0.0606

INTERNATIONAL JOURNAL OF BUSINESS, 8(3), 2003 257
B. Statistical tests – Spread The more interesting question, however, is whether there is a tendency for more extreme returns to follow political events. Under the assumption that the locations of the distributions in and out of sample are not different, I run the Siegel-Tukey test. The null hypothesis is that the spreads (dispersion) of the returns in and out of sample are equal. Results are presented in the right-most columns of panel A of Table 6.
The results in all of the samples, except sample D, suggest that there is a difference in spread. I cannot assess, however, whether returns on event days are more or less extreme than in other days.
In order to learn about the direction of the difference in spread, I now look at the distribution of the absolute values of the returns. If the mean of the absolute value of the returns on event days is higher (lower) than the mean on other days, then I can conclude that event-day returns are more (less) extreme than returns in other days. Summary statistics of the distribution of absolute values are presented in panel B of Table 3. Results of a Wilcoxon rank-sum test for differences in location between the distributions are presented in panel B of Table 6.
The evidence suggests that, indeed, the dispersion of event-day returns is different from that of returns on other days. Also, from panel B of Table 3, we learn that the event-day returns on TAD100 are more extreme than returns on other days. However, panel B of Table 6 and the sign of the Z-stat of sample C suggest that event-day returns on ISRIX are less extreme than returns on other days. C. Regression Analysis An alternative way to check whether the returns following event days are more extreme than returns in other days is presented in Huberman and Schwert (1985). I rank the returns in ascending order and I assign to each observation a rank. The lowest return in the five-year period is assigned with a rank of one and the highest return is assigned with a rank of N (the number of observation in the sample). I then normalize the ranks according to the following formula x= (rank-1)/(N-1). This results in a series that is bounded between zero and one. Next, I let y=2*abs(x-0.5). The y-series is also bounded between zero and one. Finally, I run the following regression:
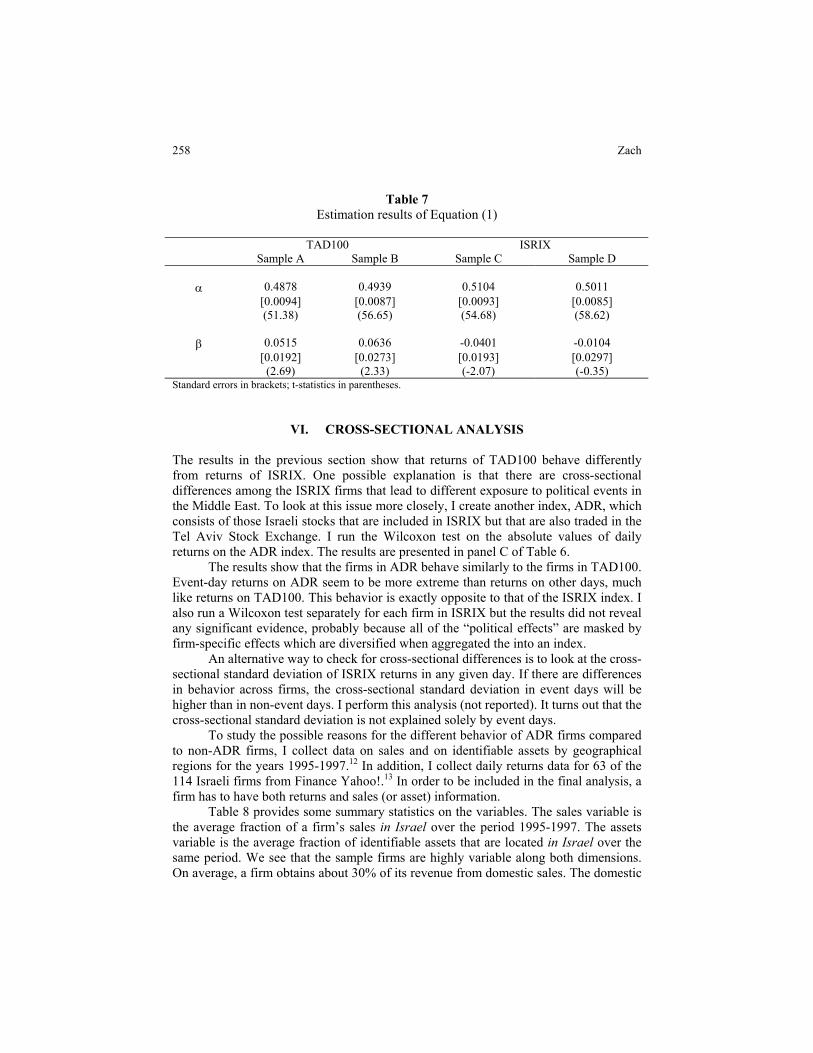
titt Dy ε+β+α= (1) where Di=1 for trading event days. I run four regressions, one for each sample of trading event days. If returns on event days are more extreme then returns in other days, then the coefficient of the indicator variables should be positive. This means that the rank of these returns is either very high or very low. The results of the regression are presented in Table 7. The results confirm those of the previous section. For TAD100 returns, the coefficient is positive and significant i.e. returns on event days are more extreme than returns in other days. For ISRIX the coefficients are negative, and in sample C the coefficient is significant. This, again, shows that ISRIX event-day returns are less extreme than returns on other days.
258 Zach
Table 7 Estimation results of Equation (1)
TAD100 ISRIX Sample A Sample B Sample C Sample D α 0.4878 0.4939 0.5104 0.5011 [0.0094] [0.0087] [0.0093] [0.0085] (51.38) (56.65) (54.68) (58.62) β 0.0515 0.0636 -0.0401 -0.0104 [0.0192] [0.0273] [0.0193] [0.0297] (2.69) (2.33) (-2.07) (-0.35)
Standard errors in brackets; t-statistics in parentheses.
VI. CROSS-SECTIONAL ANALYSIS The results in the previous section show that returns of TAD100 behave differently from returns of ISRIX. One possible explanation is that there are cross-sectional differences among the ISRIX firms that lead to different exposure to political events in the Middle East. To look at this issue more closely, I create another index, ADR, which consists of those Israeli stocks that are included in ISRIX but that are also traded in the Tel Aviv Stock Exchange. I run the Wilcoxon test on the absolute values of daily returns on the ADR index. The results are presented in panel C of Table 6.
The results show that the firms in ADR behave similarly to the firms in TAD100. Event-day returns on ADR seem to be more extreme than returns on other days, much like returns on TAD100. This behavior is exactly opposite to that of the ISRIX index. I also run a Wilcoxon test separately for each firm in ISRIX but the results did not reveal any significant evidence, probably because all of the “political effects” are masked by firm-specific effects which are diversified when aggregated the into an index.
An alternative way to check for cross-sectional differences is to look at the cross-sectional standard deviation of ISRIX returns in any given day. If there are differences in behavior across firms, the cross-sectional standard deviation in event days will be higher than in non-event days. I perform this analysis (not reported). It turns out that the cross-sectional standard deviation is not explained solely by event days.
To study the possible reasons for the different behavior of ADR firms compared to non-ADR firms, I collect data on sales and on identifiable assets by geographical regions for the years 1995-1997.12 In addition, I collect daily returns data for 63 of the 114 Israeli firms from Finance Yahoo!.13 In order to be included in the final analysis, a firm has to have both returns and sales (or asset) information.
Table 8 provides some summary statistics on the variables. The sales variable is the average fraction of a firm’s sales in Israel over the period 1995-1997. The assets variable is the average fraction of identifiable assets that are located in Israel over the same period. We see that the sample firms are highly variable along both dimensions. On average, a firm obtains about 30% of its revenue from domestic sales. The domestic

INTERNATIONAL JOURNAL OF BUSINESS, 8(3), 2003 259
assets comprise about 60% of total assets. Next, I construct an equal-weighted daily index (1993-1997) for the firms in each portfolio and check whether there are differences in behavior across these indices in response to political events. I assume that the assignment of firms to portfolios based on the three-year averages is identical to what it was in 1993-1994.
Table 8
Panel A presents summary statistics for sales, the fraction of firm’s sales in Israel, and for identifiable assets, the fraction of a firm’s assets located in Israel. High, medium, low are portfolios of firms ranked on each of these variables. Panel B presents the results of Wilcoxon rank-sum tests of the absolute value of daily returns. The indices are constructed for portfolios of firms ranked based either sales in Israel or identifiable assets located in Israel between the years 1995-1997. The null hypothesis, for each sample, is that that the median return in the sample is identical to the median return out of the sample (the full sample returns excluding the event-day returns).
N Mean Median σ Min Max Panel A
Sales All firms 69 0.2972 0.2115 0.2812 0 1
High 23 0.6324 0.5904 0.2031 0.3585 1 Med 23 0.2275 0.2115 0.0798 0.0857 0.3484 Low 23 0.0318 0.0307 0.0242 0 0.0816
Identifiable assets
All firms 32 0.5486 0.6121 0.3147 0 1
High 11 0.8732 0.8747 0.0660 0.7763 1 Med 11 0.5774 0.6057 0.1309 0.3402 0.7591 Low 10 0.1599 0.1089 0.1396 0 0.3389
Panel B
Sales Identifiable Assets N (p-value) (p-value)
Hi Sample C 306 0.1693 0.3040 Sample D 121 0.4413 0.7347
Med Sample C 306 0.6224 0.8719 Sample D 121 0.1772 0.8214
Low Sample C 306 0.7634 0.9179 Sample D 121 0.8477 0.8766

260 Zach
Panel B of Table 8 reports the p-values of Wilcoxon tests of differences between the event day returns and non-events day returns for each index. We see that there is no evidence of differences in behavior of any index. One possible explanation for the results is that these indices are not powerful enough to diversify away firm-specific events. The number of firms in each index starts out very low (about 4 in 1993) and then increases over time. Therefore, I perform the analysis year-by-year but get the same results (again, possibly because the number of event days in a particular year is much lower). Another explanation is that sales and identifiable assets are not factors determining a firm’s “exposure” to political events. It is possible that the different behavior of ADR firms is merely because they are listed on a different exchange.
VII. NEWS-INTENSIVE PERIODS
Political events have a tendency to cluster together. There are periods in which many events happen at the same time. In this section I examine, more closely, the behavior of returns in specific news-intensive periods. I look at stretches of days that include a large percentage of calendar event days. Tables 9 and 10 list the news-intensive periods and various statistics for the TAD100 and ISRIX, respectively. For identification purposes, only the major event in each period is listed. The tables are sorted in descending order of the mean absolute value of returns. The adjusted standard deviation is calculated with respect to the full sample mean and not with respect to the mean of each individual subsample.
A study of Table 9 and Table 10 provides some insight. As an illustration, I discuss the market returns during and after the signing of the Oslo Accords, the longest of all news-intensive periods. First, the mean absolute value of daily returns on the TAD100 during this period is 1.61%, almost twice larger than that of the full sample. In addition, we can see that the standard deviation is also higher than that of the full sample. However, since the mean of return of this period is different from that of the full period, looking at the adjusted standard deviation is more informative. Here, too, we see that the returns after the signing of the Oslo Accords were more volatile than the returns in the full sample (1.95% compared to 1.63%). The mean return and its relation to the full sample mean return can be interpreted as the market’s assessment of the overall news during the period. The mean return during the Oslo Accord period was 0.60% compared to a mean return of 0.05% in the full sample. This suggests that, overall the market viewed the Oslo Accords as good news.
An analysis of the return behavior during the Jericho implementation shows how the adjusted standard deviation is helpful. During this period the standard deviation of returns was 1.54% compared to 1.63% in the full sample. However, we can see that the mean return in that period was very low (-2.03%). In this case, the adjusted standard deviation of 2.51% correctly coveys the picture that returns in this period were very extreme. A second issue is the high negative return in this period. It turns out that in this period the interest rate in Israel was raised by a considerable amount. The inability to control for major economic events might lead us to wrong conclusions about the market’s overall assessment of the event.

INTERNATIONAL JOURNAL OF BUSINESS, 8(3), 2003 261
Table 9
News-intensive periods and daily returns on the TAD100
The major Event Start End Days Mean Abs.
Value
St.dev Adj. St.dev*
Mean
Jericho implementation of the Oslo Accords
5/13/94 5/24/94 6 2.38% 1.54% 2.51% -2.03%
Israeli elections 5/29/96 6/10/96 8 1.98% 2.74% 2.61% -0.44% Hebron Massacre 2/25/94 3/4/94 6 1.95% 2.12% 2.13% -0.85% Signing of the Oslo Accords 8/30/93 10/4/93 22 1.61% 1.91% 1.95% 0.60% Riots in the west bank. Washington summit convenes
9/25/96 10/7/96 9 1.43% 1.83% 1.83% -0.55%
Israel and Jordan Sign Peace treaty 10/10/94 10/31/94 16 1.16% 1.45% 1.43% 0.33% Progress in the Israeli-Syrian Negotiations
4/29/94 5/9/94 7 1.14% 1.79% 1.66% -0.03%
Yitzhak Rabin's assassination 11/5/95 11/13/95 7 1.03% 1.51% 1.46% -0.36% Suicide bombings in Jerusalem 7/30/97 8/15/97 11 0.91% 1.11% 1.07% -0.12% Riots in the west bank following the Har Homa crisis
3/18/97 4/3/97 13 0.90% 1.12% 1.10% 0.25%
Statistics for the full sample 1993 -1997
0.89% 1.63% 0.05%
Netanyahu and Arafat meet for the first time
8/29/96 9/10/96 9 0.81% 0.65% 0.84% 0.62%
Progress in the Israeli-Syrian Negotiations
12/7/93 12/23/93 13 0.79% 0.89% 0.89% 0.28%
Suicide bombings in Jerusalem 9/4/97 9/15/97 8 0.77% 0.99% 0.93% -0.07% Anti-terror conference in Egypt 3/4/96 3/15/96 8 0.76% 0.93% 0.91% -0.23% Oslo accord is further implemented 12/11/95 12/28/95 14 0.76% 0.84% 0.86% 0.33% Arafat and Rabin Sign Oslo B accords
9/25/95 10/9/95 5 0.73% 0.56% 0.80% -0.58%
PLO votes to amend the Palestinian convention
4/24/96 5/2/96 6 0.65% 0.59% 0.81% 0.65%
* The adjusted standard deviations are calculated with respect to the mean of the full sample and not with respect to the mean of each individual subsample.

262 Zach
Table 10
News-intensive periods and daily returns on the ISRIX
The major Event Start End Days Mean Abs.
Value
St.dev Adj. St.dev*
Mean
Oslo accord is further implemented 12/11/95 12/28/95 13 1.36% 1.86% 1.79% 0.15% Signing of the Oslo Accords 8/30/93 10/4/93 25 1.23% 1.48% 1.49% 0.42% Anti-terror conference in Egypt 3/4/96 3/15/96 10 1.12% 1.47% 1.49% -0.44% PLO votes to amend the Palestinian convention
4/24/96 5/2/96 7 1.12% 1.36% 1.34% 0.55%
Riots in the west bank. Washington summit convenes
9/25/96 10/7/96 9 1.06% 1.32% 1.28% -0.18%
Israeli elections 5/29/96 6/10/96 9 1.06% 1.24% 1.17% 0.04% Jericho implementation of the Oslo Accords
5/13/94 5/24/94 8 1.06% 1.67% 1.57% -0.02%
Yitzhak Rabin's assassination 11/5/95 11/13/95 6 1.04% 1.31% 1.27% -0.32% Statistics for the full sample 1993 -1997
0.98% 1.29% 0.10%
Suicide bombings in Jerusalem 7/30/97 8/15/97 13 0.95% 1.12% 1.09% -0.03% Arafat and Rabin Sign Oslo B accords
9/25/95 10/9/95 11 0.90% 1.05% 1.19% -0.54%
Progress in the Israeli-Syrian Negotiations
4/29/94 5/9/94 7 0.79% 0.99% 0.96% -0.17%
Suicide bombings in Jerusalem 9/4/97 9/15/97 8 0.78% 0.91% 0.86% 0.26% Riots in the west bank following the Har Homa crisis
3/18/97 4/3/97 12 0.72% 0.93% 0.97% -0.30%
Netanyahu and Arafat meet for the first time
8/29/96 9/10/96 8 0.66% 0.87% 0.82% 0.17%
Progress in the Israeli-Syrian Negotiations
12/7/93 12/23/93 13 0.58% 0.69% 0.68% -0.04%
Israel and Jordan Sign Peace treaty 10/10/94 10/31/94 16 0.57% 0.83% 0.81% 0.17% Hebron Massacre 2/25/94 3/4/94 6 0.29% 0.37% 0.34% 0.10% * The adjusted standard deviations are calculated with respect to the mean of the full sample and not with
respect to the mean of each individual subsample.
INTERNATIONAL JOURNAL OF BUSINESS, 8(3), 2003 263
VIII. SUMMARY This study demonstrates the effects of political events on stock returns using a sample period (1993-1997) and a country (Israel), which provide a setting of high variability in political news. The evidence in the paper demonstrates that the returns on the Israeli stock market’s main index following political events are more extreme (volatile) than the returns on the same index in other days. Under the assumption of market efficiency, the evidence refutes the claim presented earlier suggesting that the peace process is irrelevant to the Israeli economy. In addition, this evidence shows that political news contributes to the variability of stock returns.
The paper also shows that returns on stocks that are cross-listed (both in Israel and in the US) exhibit a similar behavior. Other stocks that are traded on American exchanges, and that are considered Israeli stocks, behave differently. This interesting finding is consistent with a market that distinguishes between the stocks according to their “political exposure”. A further investigation of the source of these differences in behavior reveals that they are not explained by cross-sectional variation in location of assets or in location of sales.
ACKNOWLEDGEMENT I thank Katharina Bibus-Lewellen, Scott Keating, S.P. Kothari, Gans Narayanamoorthy, Bill Schwert, Ross Watts and an anonymous referee for helpful comments. All errors are my own.
NOTES 1. The authors acknowledge that their sample selection procedure is biased towards
finding a positive effect of political events on stock prices. 2. “Duty to Privatize the Peace”, Gaon Benny, Jerusalem Post June 20, 1997 3. "Israel's Economy and the Peace Process", Jack Menes, Jerusalem Post, June 29,
1997. 4. For more on the Arab boycott see Fershtman and Gandal (1998) and the references
mentioned there. 5. Israel is the second most represented foreign country in NASDAQ, Canada being
first. 6. Specifically, I run the following search (“Israel” and “peace” and [“Palestinian” or
“Syria”]) in the article’s headline or first paragraph. 7. Top sources are Los Angeles Times, Washington Post and New York times. 8. I discovered that the original series obtained from DataStream was contaminated
with errors. I corrected them by crosschecking the daily index against newspaper articles. The main reason for the errors was the fact that weekend and holidays in Israel and the US do not fall on the same days. For example, DataStream reports a return of zero for the Israeli market on Fridays although there is no trade.
9. Although there are over 100 Israeli firms traded in US markets, most of them are not included in the CRSP tapes because CRSP does not cover foreign stocks that
264 Zach
are traded in the US and are not ADRs. Therefore, my CRSP-based index includes only Israeli ADRs or Israeli companies that are also registered in the US and are covered by CRSP. The number of firms that are included in the index ranges from 16 in 1/1/93 to 24 in 12/31/97.
10. The conversion is quite different for the TAD and ISRIX. First, unlike in the US, the market in Israel is closed on Fridays as well as on Saturdays while it is open on Sundays. Second, in Jewish holidays the Israeli stock exchange is closed while the American market is open, and vice-versa.
11. Empty explanations represent days for which either no articles were found in the DJNRS or that the articles that were found did not state a specific explanation.
12. Since most firms are not covered by Compustat, I collected the data manually from the firm’s financial statements. I was able to obtain sales data on 68 firms and asset data on 28 firms.
13. As mentioned earlier, most firms in my sample are not covered by CRSP.
REFERENCES
Bittlingmayer G., 1992, “Stock returns, real activity and the trust question”, Journal of Finance, 47(5), 1701-30.
Bittlingmayer G., 1998, “Output, stock volatility, and political uncertainty in a natural experiment: Germany, 1880-1940”, Journal of Finance, 53 (6), 2243-57.
Cutler M. D., Poterba J. M., and Summers L. H., 1989, “What moves stock prices?”, Journal of Portfolio Management, 15(3), 4-12.
Diamonte R., Liew. J., Stevens, R., 1996, “Political risk in emerging and developed markets”, Financial Analysts Journal, 52 (3), 71-76.
Erb C., Harvey. C, Viskanta T., 1996, “Political risk, economic risk and financial risk”, Financial Analysts Journal, Nov-Dec 1996.
Fama E., 1990, “Stock returns, expected returns and real activity”, Journal of Finance, 44 (4), 1089-1107.
Fershtman C., Gandal N., 1998, “The effect of the Arab boycott on Israel: the automobile market”, RAND Journal of Economics, 29 (1), 193-214.
Guttman, J., Shachmurove, Y., 1990, Dynamic optimization of political popularity in an empirical macroeconomic model, Public Choice, 66, 51-66.
Huberman G., Schwert G. W., 1985, “Information aggregation, inflation, and the pricing of indexed bonds”, Journal of Political Economy, 93, 92-114.
Kim H., Mei J., 1994, “Political risk and the stock market: the case of Hong Kong”, Working paper S-94-30, New York University, Salomon Center.
Klibanoff P., Lamont O., Wizman, T., 1998, “Investor reaction to salient news in closed-end country funds”, Journal of Finance, 53 (2), 673-99.
Niederhoffer V., 1971, “The analysis of world events and stock prices”, Journal of Business, 44(2), 193-219.
Roll R., 1988, “R2”, Journal of finance, 43(3), 41-66. Schwert G. W., 1989, “Why does stock volatility change over time?”, Journal of
Finance, 44 (5), 1115-53.

INTERNATIONAL JOURNAL OF BUSINESS, 8(3), 2003 265
Schwert G. W., 1990, “Stock returns and real activity: A century of evidence”, Journal of Finance, 45 (4), 1237-57.
APPENDIX*
A. Political environment Since the establishment of the state of Israel in 1948, a state of hostility has existed, varying in degree and intensity, between Israel and Arab countries. In addition, Israel and companies doing business with Israel has been the subject of an economic boycott by the Arab countries since Israel's establishment. Furthermore, following the Six-Day War in 1967, Israel commenced administering the territories of the West Bank and Gaza Strip and, since December 1987, increased civil unrest has existed in these territories. Although, as described below, Israel has entered into various agreements with Arab countries and the Palestinian Liberation Organization (“PLO”) and various declarations have been signed in connection with efforts to resolve some of the aforementioned problems, no prediction can be made as to whether full resolution of these problems will be achieved or as to the nature of any such a resolution. To date, these problems have not had a material adverse impact on the financial condition or operations of the company, although there can be no assurance that continuation of these problems will not have such an impact in the future.
In 1979, a peace agreement between Israel and Egypt was signed under which the political relations were established; however, economic relations have been very limited.
In September 1993, a breakthrough occurred in Israeli-Palestinian relations. The joint Israeli-Palestinian declaration of principles was signed by Israel and the PLO in Washington D.C. outlining the interim Palestinian self-government agreements. Prior to the signing of that declaration, PLO Chairman Arafat sent a letter to Israeli Prime Minister Rabin in which the PLO recognized Israel's right to exist in peace and security, renounced terrorism and violence, and affirmed that the clauses of the PLO covenant denying Israel's right to exist are no longer valid. In reply, Israel recognized the PLO as the representative of the Palestinian people in the peace negotiations.
In 1994, Israel the PLO signed an agreement in Cairo in which the principles of the September 1993 declarations were implemented. In accordance with this agreement, Israel has transferred the civil administration of the Gaza strip and Jericho to the Palestinian self-rule authority and the Israeli army has withdrawn from these areas.
In July 1994, the Israeli Prime Minister and the king of Jordan met publicly for the first time, in Washington, and signed a joint declaration as a first step towards a peace treaty between Israel and Jordan. The declaration provides for the cessation of belligerency between the states, the mutual opening of aerospace to civil aviation, the opening of border crossings (the first of which was opened on August 8th, 1994) and the commencement of joint projects with respect to electricity and water resources. In October 1994, Israel and Jordan signed a peace treaty, which provides, among other things, for the commencement of full diplomatic relations between the two countries, including the exchange of ambassadors and consuls. In addition, such treaty expresses

266 Zach
the mutual desire of the party for Economic cooperation and calls for both parties to lift economic barriers in discrimination against the other and to act jointly towards the removal of any economic boycotts by third parties. B. Army service All male adult permanent residents of Israel under the age of 54 are, unless exempt, obligated to perform up to 44 days of military reserve duty annually. Additionally, all such residents are subject to being called to active duty at any time under emergency circumstances. Some of the employees of the company currently are obligated to perform annual reserve duty. While the company has operated effectively under these and similar requirements in the past, no assessment can be made of the full impact of such requirements on the company in the future, particularly if emergency circumstances occur. * The appendix is taken from the prospectus of Tower Semiconductor, an Israeli company that went public in NASDAQ in 1995. Many Israeli companies include similar paragraphs in their prospectuses under the heading “Conditions in Israel”. For a study of political popularity in Israel, see Guttman and Shachmurove (1990).