Embed Size (px)
Citation preview
1
Political Connections, Controlling Shareholders and
Post-IPO Performance of China’s Listed Companies
Lihui Tian and Wei Cheung
Institute of Finance and Development, Nankai University, Tianjin 300071, China
Abstract
We examine how political connections influence long term performance of the Chinese firms
listed in the stock market. Developing Fan et al. (2007), our paper and investigates the effects of
political connections on corporate performance under different types of controlling shareholders.
We find that political connections actually bring about better performance of family-controlled
firms in the long term, although the effects of political connections on corporate performance are
insignificant in government-controlled firms. Furthermore, political connections in
family-controlled firms are associated with better access to bank loans, tax rebates and
government subsidies. We argue that political connections are not only the substitute for investor
protections, but also even be a channel for government patronage under poor institutional
environment.
JEL Classification: G12; G23; G28
Keywords: Political Connections; Long Term Post-IPO Performance; Investor Protection;
Government Patronage
1. Introduction
The Chinese society is featured with Guanxi and the economy is centered with its strong
government (Gold, Guthrie and Wank, 2002). Indeed, political connections are not unusual in the
Correspondence Address: Professor Lihui Tian, Institute of Finance and Development, Nankai University,
Tianjin 300071, China. Email: [email protected]; Phone: +86 22 23503316. This paper is supported by
Natural Science Foundation of China (NSFC) (No.71272179), Ministry of Education Social Science Project (No.
12YJA790124) and the NCET Program (No. NCET-12-0288).
2
Chinese firms, including those listed in the stock market. The government shareholder tends to
appoint its former officials to the firms under its control. For example, Yun Gongmin, the board
president of Huadian Power International Co. Ltd, was the former vice governor of Inner Mogolia
province from 1997 to 2001 and the former vice general secretary of the communist party in
Shanxi province from 2003 to 2006. In contrast, the family-controlled firms also tend to connect
to the government. Political connections are set up with gaining the membership of the congresses
or with recruiting the retired government officials to be the board. For example, Nan Cunhui, the
president of CHINT Electrics Co., Ltd, became a member of the National Congress in 2008. Do
political connections benefit or damage corporate value in China? Do political connections play
different roles in the firms with different controlling shareholders? If so, then why? Investigating
the long-term performance of the firms listed in the Chinese stock market, this paper attempts to
shed lights on understanding the relationship between political connections and corporate value
under different types of controlling shareholders.
It has been a focal point in the literature to study the impacts of political connections on
corporate value. Fisman (2001), Johnson and Mitten (2003), and Faccio (2006) find that political
connection can increase the value of the firm. Bai et al. (2006), Li et al. (2006), and Chen et al.
(2011) argue that political connections can be considered as an alternative mechanism for investor
protections. Khwaja and Mian (2005) and Leuz and Oberholzer (2005) point out that firms with
political connections can obtain preferential financing. Faccio (2006) and Adhikari et al. (2006)
show that a good relationship with government can bring tax relief to the firm. Faccio et al. (2006)
find that political connections are associated with government supports.
However, Shleifer and Vishny (1998) and Faccio et al. (2006) argue that political connection
may damage firm value. In the seminal study of Fan, Wong and Zhang (2007), it is found that
these Chinese firms with politically connected CEOs significantly underperform those without
politically connected CEOs, in terms of three-year post-IPO stock returns. The destruction of
value by political connections is also evidenced by poorer growth of three-year post-IPO earnings
and sales as well as returns on sales. The above findings of Fan et al. (2007) are based on the
empirical analyses of the 790 Chinese firms listed during the period from 1993 to 2001.
【Insert Figure 1-Figure 3 about here】
In this paper, we examine the three-year post-IPO performance of the firms listed on the
3
Shanghai or Shenzhen Stock Exchanges during the period from 2001 to 2008, as there are many
family-controlled firms to get listed in the Chinese stock market during this period and we need to
use the three-year share data. Therefore, our sample is composed both of government-controlled
and of family-controlled firms, different from Fan et al. (2007). Furthermore, our data covers not
only CEOs, but also board members. Following Faccio (2006), we further build up the database of
political connections, including not only the former government officials as in Fan et al. (2007),
but also the members of the congresses and the government consulting body etc as in Li et al.
(2006) and Li et al. (2008). With this comprehensive dataset of the Chinese public listed firms, we
find that political connections of family-controlled firms significantly bring about better long term
performance after listing, but there is no significant relationship between political connections and
long term stock returns in government-controlled firms. These findings support the hypothesis of
investor protection for family-controlled firms, but not the hypothesis of social burdens for
government-controlled firms. We argue that government ownership can replace the influence of
political connections on corporate behaviors, and thus political connections of senior executives
may not significantly increase the burdens of the government-controlled firms. Examining the
hypothesis of government patronage, we further find that political connections are associated with
easier access to bank loans, longer term loans, higher tax rebates, and more government subsidies
in family-controlled firms.
This paper makes the following contributions to the literature. First, our paper develops Fan et
al. (2007) with recent data and family-controlled firms. We argue that the decision-making power
of the general manager in China’s listed firms is quite different from that of CEO in
Anglo-American companies. On the basis of China’s “Company Law”, the president or the
chairman of the board is the de facto top leader of the firm with usually holding the post both of
the company’s legal representative and of the general secretary of communist party committee in
the firm. The board president tends to have greater administrative power than the general manager
in many cases. A more comprehensive study is thus demanded after Fan et al. (2007). Furthermore,
in the light of positive effect of political connection of family-controlled firms on corporate value
(Chen et al., 2011; Li et al., 2008), we take property right into account in our analysis of the
relationship between political connections and corporate performance. Based on the above aspects,
our paper sheds some new lights on the effects of political connection on long term performance
4
with fresh evidences. Second, we discuss the complexity of social burdens on values of the
government-controlled firms to enrich the literature of Lin et al. (1998) and Lin and Tan (1999).
Our paper proposes the substitute effect of government ownership for political connections, which
not only enrich the literature of political connections, but also brings together the literature of
government ownership and that of political connections. Third, we develop the hypotheses of
investor protection and government patronage with concrete empirical evidences, which support
Allen et al. (2005), Bai et al. (2006), Li et al. (2006), and Chen et al. (2011). We argue that the
Chinese market is twisted by the helping hand from the government, but the preferential treatment
of the government is not only for the government-controlled firms, but also for some
family-controlled firms if they are well politically connected.
The rest of this paper is organized as follows. Section 2 reviews the literature and develops the
research hypotheses. Section 3 defines the sample, variables, and empirical models employed.
Section 4 examines the relationship between political connections and post-IPO long term
performance with different controlling shareholders. Section 5 further examines how political
connections can help to improve the stock returns in family-controlled firms. Section 6 presents
our robustness tests. Section 7 concludes.
2. Hypotheses of political connections
There has been a growing stream of literature on the determinants, valuation, and consequences of
political connection in both developed and emerging economies(e.g. Roberts, 1990; Fisman, 2001;
Shleifer and Vishny, 1994; Faccio, 2006; Faccio et al., 2006; Boubakri et al., 2008; Chaney et al.,
2011; Duchin and Sosyur, 2012; Kim et al., 2012), but the effects of political connections on firm
value remain undecided. Faccio (2006) finds that share prices significantly rise up in a company
when its owner gains a political post or sets up formal political connections. However, Faccio et al.
(2006) and Boubakri et al. (2008) argue that politically connected firms financially perform worse
than their non-connected peers.
In the study of political connections in China (e.g. Li et al., 2006; Fan et al., 2007; Li et al.,
2008; Fan et al., 2008; Sun et al., 2011), Li et al. (2008) find that the memberships of communist
party for the senior executives have a positive effect on the performance of private firms. Chen et
5
al. (2011) find that political connections have a positive effect on the performance of private firms.
Studying the firms listed in the Shanghai or Shenzhen Stock Exchanges from 1993 to 2001, Fan et
al. (2007), however, show that the accounting and stock performance of firms run by politically
connected CEOs are worse than their unconnected counterparts in the newly privatized firms.
Indeed, Ritter (1991) suggests that post-IPO long term performance is a good indicator of
corporate performance, but there are sufficient studies of political connections on post IPO
performance in the Chinese firms yet.
In this paper, we propose three testable hypotheses of social burdens, investor protection and
government patronage to examine the effects of political connections in the Chinese firms.
2.2.1. Effect of social burdens
Some public listed firms were the former state-owned enterprises (SOEs) and the government
remains as the controlling shareholder. The government has the utility function to pursue the goal
of social welfare maximization instead of corporate value and therefore the firms under its control
are pushed to share the burdens of the society. Lin et al. (1998) argue that, if a firm is controlled
by the government shareholder, it has to bear the policy burdens, such as employment, social
pension, and social stability. Li and Liang (1998) find that some firms with the government as
their controlling shareholder retain redundant employees and invest in non-profitable social
projects, which result in financial losses of the firms. Shleifer and Vishny (1994) argue that the
government actually works through politicians and bureaucrats, who tend to pursue their personal
goals. Chen et al. (2005) and Li and Zhou (2005) show that the promotion of the Chinese
provincial-level officials’ is significantly related to local economic performance. It means that the
firms politically connected to or owned by the government may have to contribute to the local
infrastructure constructions and other social work in order to improve the local economic
performance, which serves for the interests of the local officials. Chang and Wong (2004) further
find that the control over the management team by the communist party committee in a listed firm
is detrimental to its profitability. Hung et al. (2012) argue that even going for listing is under the
political considerations. Political connections may help the career development of the managers,
but it consequently requires the firms to bear more social burdens at the cost of firm value. We

6
therefore have the following hypothesis of social burdens.
Hypothesis 1: political connections of government-controlled firms are negatively associated
with post-IPO long term performance.
2.2.2. Effect of investor protection
Besides the social burdens, political connection may help family-controlled firms to stay away
from the grabbing hand of the government and may assist family-controlled firms to compete
against government-controlled firms as a fair play. That is, when the enforcement of rule of law is
weak, political connections can be a substitute of investor protection. Indeed, La Porta et al. (1997
and 2002) argue that the countries with poorer investor protections have smaller and narrower
capital markets and the firms in countries with better protection of minority shareholders are
valued higher. Rule of man tends to result in poor investor protection. The Chinese economy is so
far featured with weak legal system, poor enforcement of law and high entry barriers. Allen et al.
(2005) argue that the firms with family ownership face predatory behaviors of local governments
in China, like arbitrary charges of service fees and apportion of social works. The
family-controlled firms therefore go in quest of informal mechanisms of investor protection, like
political connections. Xin and Pearce (1996) find that, compared with other firms, the private
firms more extensively use gift-giving to build up political connections. Li et al. (2006) and Chen
et al. (2011) further show that private firms are more likely to establish political connections in
regions where the market-oriented institutions are weaker, which is defined as heavier government
intervention, more informal taxes and weaker legal enforcement. Li et al. (2008) find that if the
firm owners have the membership of communist party, it helps to increase corporate profitability
in the areas with poor investor protection. Bai et al. (2006) argue that political participation is an
informal substitute for the formal protection of private property. That is, if a firm is owned or
controlled by the shareholder who is politically connected, the government tends to reduce its
political intervention and the magnitude of wealth grabbing is reduced. In addition, political
connection can also help to bring fair competitions into being between government-controlled
firms and family-controlled firms. Otherwise, the family-controlled firms are subject to high entry
barriers and tend to be more difficult in obtaining the license. Hu and Shi (2009) and Deng et al.
7
(2012) argue that political connections facilitate private firms to implement the strategy of
diversification, especially entering into the industries heavily regulated by the government, since
new entries to other industries often require the tedious administrative approval by the government.
We therefore have the following hypothesis of investor protection.
Hypothesis 2: political connections of family-controlled firms have a positive impact on
post-IPO long term performance.
2.2.3. Effect of government patronage
Besides investor protection, we suggest that political connection can help private enterprises to
gain financial resources, such as bank loan, tax rebates, and government subsidies in an economy
with weak legal enforcement. Khwaja and Mian (2005) and Leuz and Oberholzer (2005) find that
politically connected firms have easier accesses to bank loans. Li et al. (2008) show that the
membership of Communist Party helps private entrepreneurs to obtain loans from banks or other
state institutions. Fan et al. (2008) also suggest that the firms connected to corrupt bureaucrats
enjoy advantages in access to bank loans, particularly to the long term loans, but this debt
advantage is lost if the connected bureaucrats are charged for corruption and get arrested. Political
connections may also help to reduce tax burdens. Faccio (2006) find that politically connected
firms have higher asset-liability ratio and lower taxes than non-connected ones. Adhikari et al.
(2006) suggest that tax-rate of politically-connected firms is lower in Malaysia. Wu et al. (2012)
also find that private firms with politically connected managers enjoy tax benefits. Political
connections may further help firms to obtain government subsidies. Faccio et al. (2006) suggest
that during the financial distresses, the politically connected firms can get more financial aides
from the government than non-connected firms. The firms with political connections tend to be
bailed out by the government. However, Johnson and Mitten (2003) find that if the government
lost the capabilities in providing preferential treatments during the economic crises, the
politically-connected firms suffer more than their counterparts. Chan et al. (2012) argue that there
are no financing constraints in the politically-connected firms with the supports from the
government. We therefore have the following hypothesis of government patronage.
Hypothesis 3: political connections help family-controlled firms to obtain preferential
8
treatments from the government.
3. Sample, variables, and models
3.1. Sample
We study the share price data and financial data from January 2004 to December 2011 for the
firms in China’s stock market. That is, our sample includes the firms listed onto Shanghai or
Shenzhen Stock Exchanges during the period from January 2001 to December 2008. Choosing
this sample period is based on the fact that the data of political connections in the IPO
prospectuses before 2001 is not well standardized. With the recent data, our sample can trace back
the listing dates to the end of 2008 to study the three-year performance. Our sample only retains
the firms whose ultimate controlling owners are local governments, the central government,
individuals, or families.2 As a result, our final sample consists of 561 companies.
Our database includes the financial data, market data, the data of ultimate controlling owners
and the data of political connections of all board members. Annual financial data and monthly
market microstructure data are taken from CSMAR database and WIND database, respectively.
Ultimate controlling owner data, government subsidy data and political connection data of senior
executives are manually collected. Required by the Chinese regulations body CSRC, there are
sections of the “directors, supervisions and senior management personnel”, “the controlling
shareholder of the company, the ultimate owner, other promoters, and the shareholders holding
more than 5% shares” in the IPO prospectus released after 2001. Different from USA, there are
many studies to show that the Chinese independent non-executive directors do not play a
significant role in corporate governance (Clarke, 2006; Chen et al., 2011) and the independent
directors are therefore excluded in the reported tables, but we include these independent directors
in our robustness examination.
【Insert Table 1 about here】
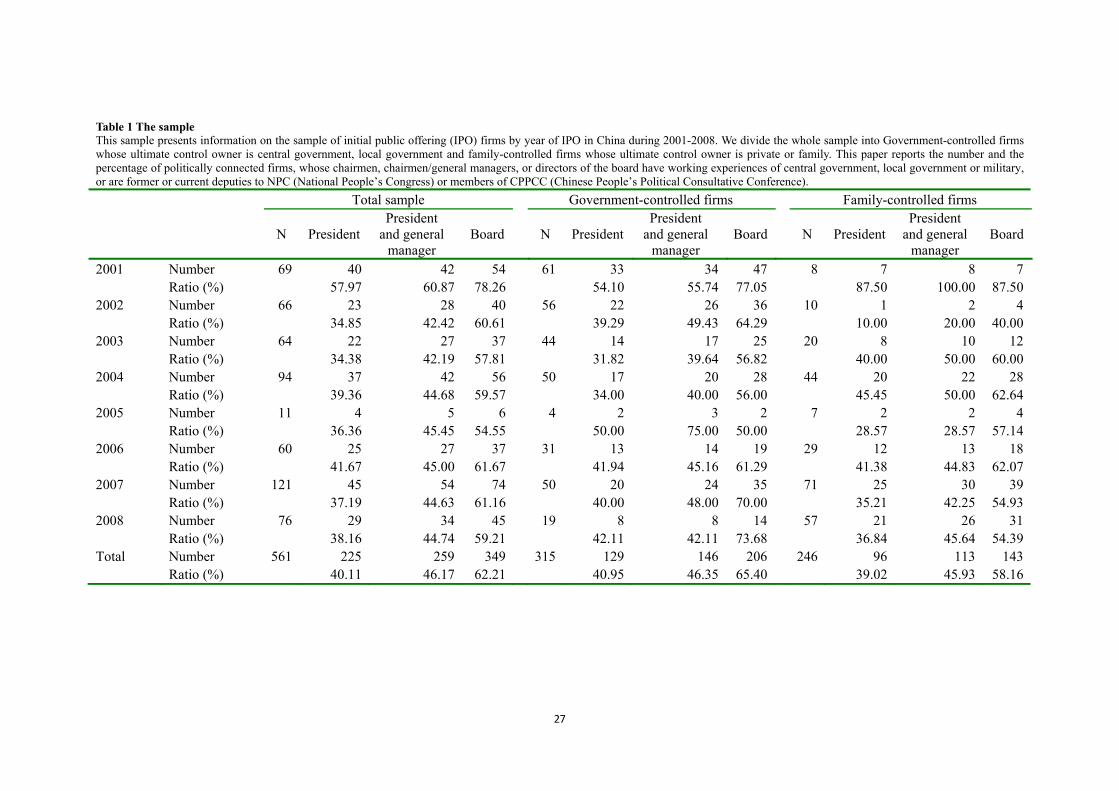
Table 1 reports the distribution of political connections in different years for the president, both
2 For the purpose of comparison with Fan et al. (2007), these firms in the financial industry are involved to perform empirical analyses. However, the results of this paper hold when these firms are taken out from our sample.
9
the president and the general manager, and the directors of board, respectively3. With identifying
the ultimate controlling owners, our sample is divided into government-controlled firms and
family-controlled firms. As in the last row of table 1, there are 40.1% firms with the
politically-connected board president in the total sample. If these board chairmen served in the
central government, local governments or military or they are former or current members of NPC
(National People’s Congress) or of CPPCC (Chinese People’s Political Consultative Conference),
we take them as being politically connected. If taking the general managers into account, there are
46.2% firms to be politically connected. If taking the non-independent directors into account, there
are 62.2% firms having political connections. As in the subsample of government-controlled firms,
there are more board chairmen, general managers and non-independent directors to be politically
connected, with the ratios of 41.0%, 46.4% and 65.4%, respectively. The proportions of connected
chairmen, managers and directors in family-controlled firms are slightly lower than
government-controlled firms, with the ratios of 39.0%, 45.9% and 58.2%, respectively.
Table 1 reports that political connections are not usual in both government-controlled and
family-controlled firms. These political connections are established in different ways. Senior
executives or board members of government-controlled firms are often directly or indirectly
appointed by the government. Compared with government-controlled firms, political connections
of family-controlled firm come either from the manipulated elections into the local or national
people congress (NPC) or the government consulting body (CPPCC) or from appointing the
former government officials into the firm.
3.2. Variables
【Insert Table 2 about here】
3.2.1 Dependent variables
Following Fan et al. (2007) and Chen et al. (2011), we measure share performance with the
abnormal market-adjusted returns (CAR) and buy-and-hold returns (BHAR) of 12-month,
3 The number of IPO firms in 2005 and 2008 is rare because, during the split share structure reform in 2005-2006 and the financial crisis in 2008, the CSRC implemented the rigid regulations of IPO to maintain stock market steady.
10
24-month and 36-month after being listed into the stock markets. The CAR and BHAR are
adjusted by the equally weighted indices of Shanghai and Shenzhen Stock Exchanges in all our
analysis. If the adjustment changes to the value weighted indices, all our results remain almost the
same. Table 2 presents the definitions of variables.
Our paper also examines corporate performance with accounting indicators, measured with
earnings growth, sales growth, and the change in return on asset (ROA). However, Aharony et al.
(2000) and Fan et al. (2007) argue that there are financial packaging and earning managements in
China. To reduce the effect of accounting manipulations, we therefore adjust the above three
accounting measures with the corresponding industry median value. Under the industrial
classification follows the Guidelines of the Listed Company Industry Classification issued by the
China Securities Regulatory Commission in 2001, our sampled companies are classified into 21
industrial sectors.
Following Khwaja and Mian (2005), Fan et al. (2008), Faccio et al. (2006), and Adhikari et al.
(2006), we further examine the data of post-IPO three-year loan sizes, loan maturity, effective tax
rates, and government subsidies. The real tax burden is approximated by effect tax rates. As a
proxy of real tax burden of the firm, the variables of real effective tax rates capture tax preference,
tax base preference, and tax mount preference. Porcanol (1986), Stickney and McGee (1982), and
Shevlin (1987) suggest different methods to calculate the real effective tax rate and we
correspondingly work out the variables of TAX1, TAX2 and TAX3 in table 2. In addition, because
value-added taxes included in government subsidy are drawn up by central government, local
government cannot enjoy a big discretion space. Thus, we have value-added taxes removed from
government subsidy adjusted by firm income and total assets, respectively.
3.2.2. Political connection
In the literature, political connections are often approximated by the political backgrounds of
senior executives or/and board members. Chen et al. (2011) take the ratio of the number of
politically connected directors to the total number of all the directors in the board as political
connection. However, the numbers of political connections do not matter much, but it does matter
whether the firm has the connection and how effective the connection. Fan et al. (2007) define the
11
political connections as whether the firm chief executive officer (CEO) has the political
background. However, there are not CEOs in China’s standard corporate management, but the
general managers. Well, the board president of the government-controlled firms tends to be the
Secretary of the Communist Party in the government-controlled firms and the decision power
normally stays with the party. In the family-controlled firms, the boss takes to the role of the board
president instead of the general manager and the boss tends to make the decision with its large
sizes of shares. Actually, the board president tends to get involved in the day-to-day operations
and management of the firm, as the representative of the legal person. Therefore, it is in need to
examine whether the political backgrounds of board chairmen influence corporate performance.
Besides it, our paper also examines the impact of political connections with the data of the general
managers and the directors of board in the robustness tests.
3.2.3. Other variables
The choice of control variables follows Fan et al. (2007) to use the following variables, including
Leverage (financial leverage), Stateshare (the percentage of state share), Lnasset (the natural log
of total assets), Market_Book (the market-to-book ratio) and Regulated (industry dummy
variable).
3.3. Models
The relationship between political connections and post-IPO long term performance is examined
by the following model.
0 1 2 3 4
5 6
/
_ , (1)
CARi Finances POL Leverage Stateshare Lnasset
Market Book Regulated
where CARi (i=12, 24, 36) represents the 12, 24, and 36-month cumulative abnormal equally
weighted adjusted returns4, respectively. Finances refer to financial indicators, including earnings
growth (Return), sales growth (SALE), the change of ROA, the total loan Total_Loan, the loan
maturity Loan_Term, the real effective tax-rate TAX1-TAX3, and government subsidy
4 The conclusion of this paper holds when CARs are scaled by value weighted market return of Shanghai and Shenzhen stock exchanges.
12
Subsidy1-Subsidy4. POL is the abbreviation of political connections.
In Section 5, we examine how different controlling shareholders influence the relationship
between political connection and post-IPO long term performance by the following model.
0 1 2 3 4
5 6 7 8
36 *
_ , (2)
CAR POL Private POL Private Leverage
Stateshare Lnasset Market Book Regulated
where the property right dummy variable Private takes 1 if the ultimate control owner is an
individual or family, and 0 otherwise. Shleifer (1998) argues that “private ownership should
generally be preferred to public ownership when the incentives to innovate and to contain costs
must be strong.” Using various net-income-based measures, Dewenter and Malatesta (2001) show
that government-owned firms are significantly less profitable than privately owned firms.
Jefferson and Su (2006) provide the evidence that the transformation of state-owned enterprises
into shareholding companies contributes to overall increases in both productivity and innovation
activities. Thus, we shall expect that the property dummy variable Private is positively correlated
with the firm value.
POL*Private represents interaction term between the dummy of political connection and the
dummy of property right. This interaction term help to examine whether political connections are
beneficial to protect private property right. If political connections brings about investor
protections, we shall expect the regression coefficient of POL*Private to be positive.
Furthermore, we adopt the following model to examine whether political connection can
substitute for poor institutional environment.
0 1 2 3 4
5 6 7 8
36 *
_ , (3)
CAR POL Institution POL Institution Leverage
Stateshare Lnasset Market Book Regulated
where Institution represents institutional dummy variables, including the marketization index
Index_Mar, the government intervention index Index_Gov and the legal environment index
Index_Law. Following the literature of Chen et al.(2011) and Fan et al. (2013), the marketization
level Index_Mar is calculated with total marketization score, the government intervention level
Index_Gov is calculated with the relation score between the government and firms, and the legal
institution level Index_Law is calculated with the score of intermediary organizations and legal
institutions developed by Fan et al. (2010). POL*Institution represents the interaction term
13
between the dummy of political connection dummy and the institution dummy, which helps to
examine the effects of political connection on post-IPO performance in poor institutional regions.
If political connections can improve the value of family-controlled firms under the poor
institutional settings, the sign of the variable of POL*Institution shall be expected to be positive.
4. Political Connection and Long Term Performance
In this section, we show the charts of share returns, report the descriptive statistics, and then
perform econometric analysis to examine the relationship between political connections and
post-IPO long term performance.
4.1. Data description
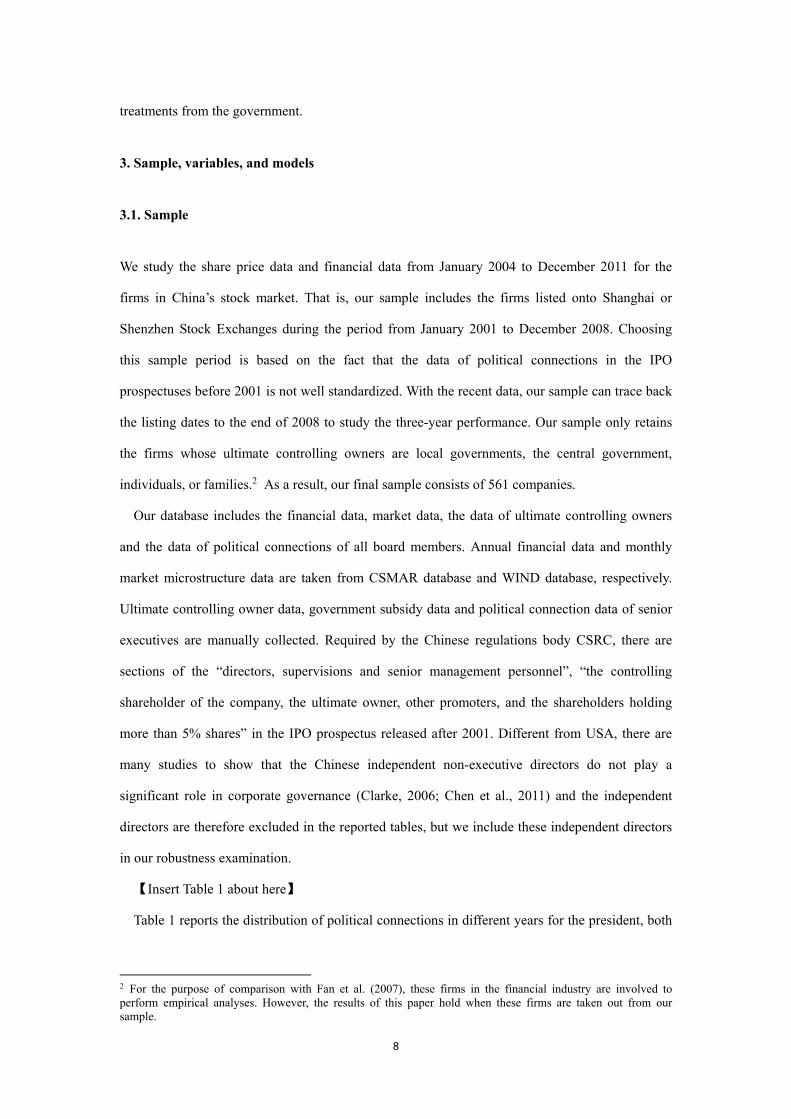
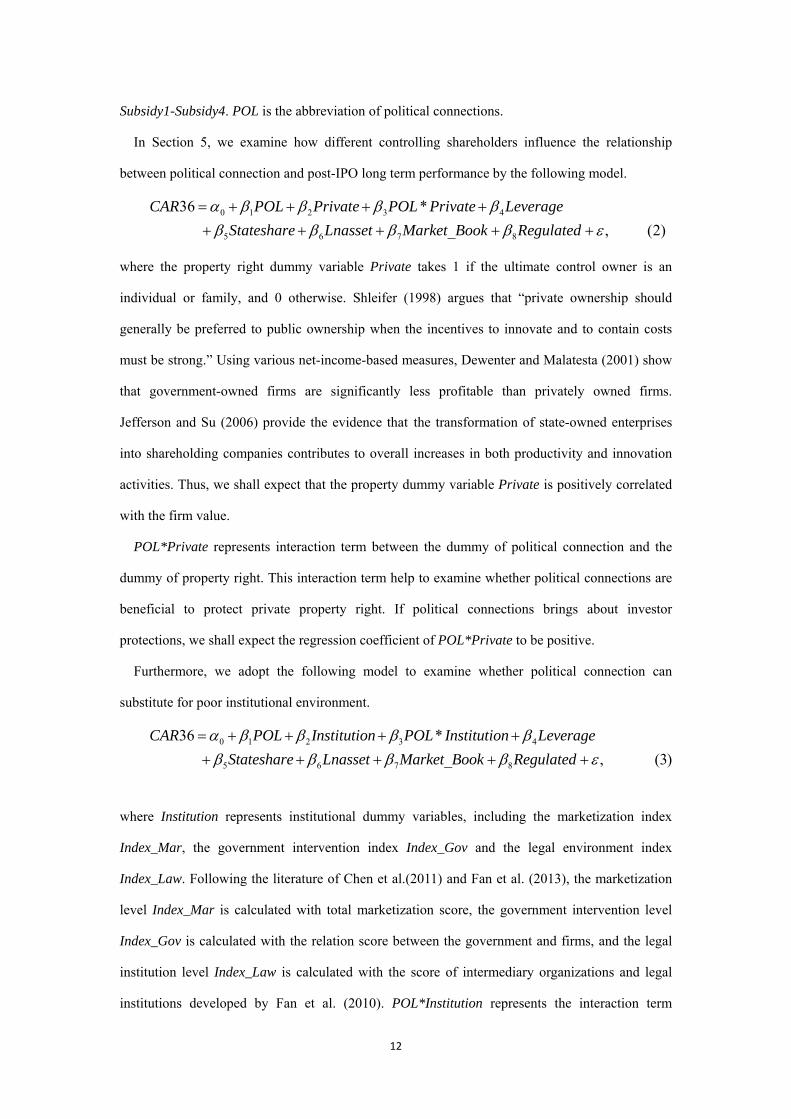
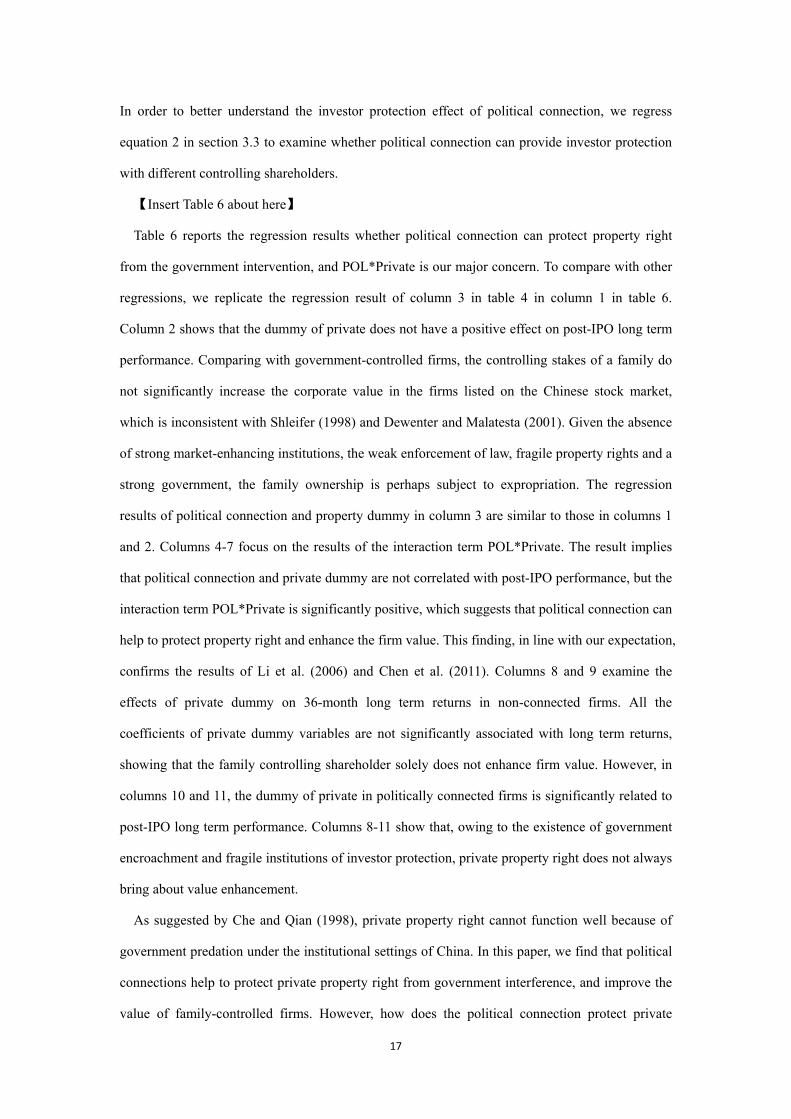
【Insert Figure 1, Figure 2 and Figure 3 about here】
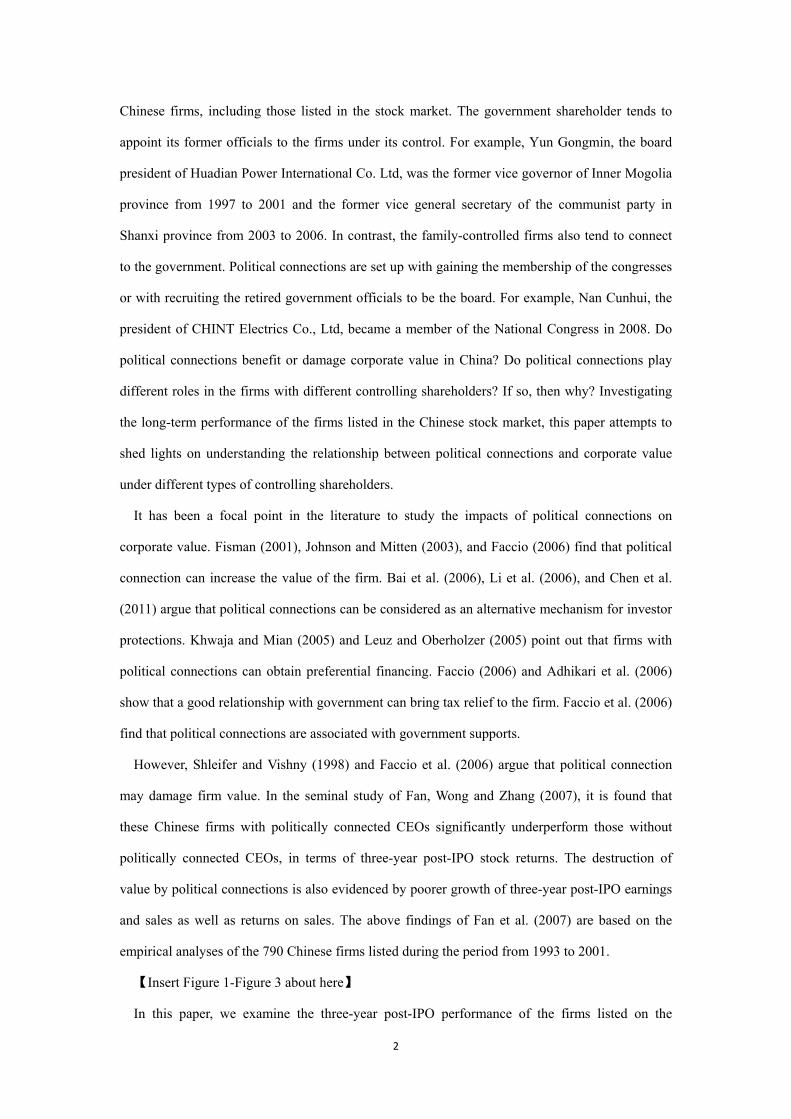
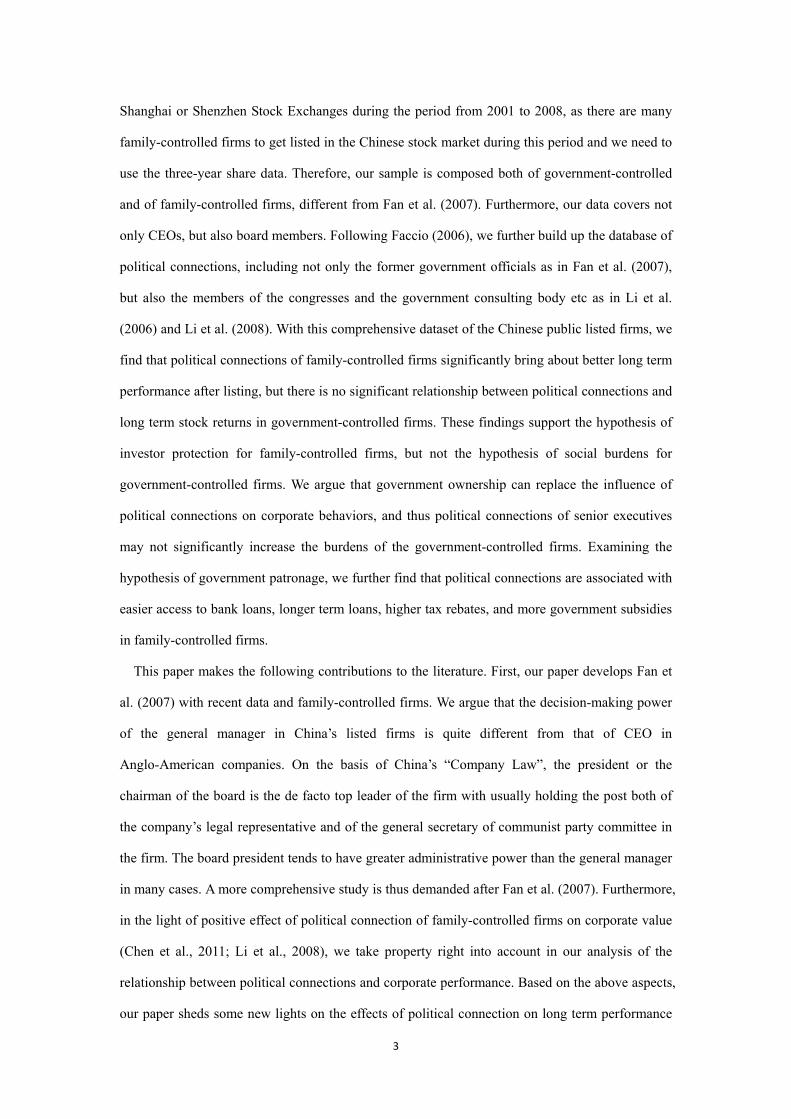
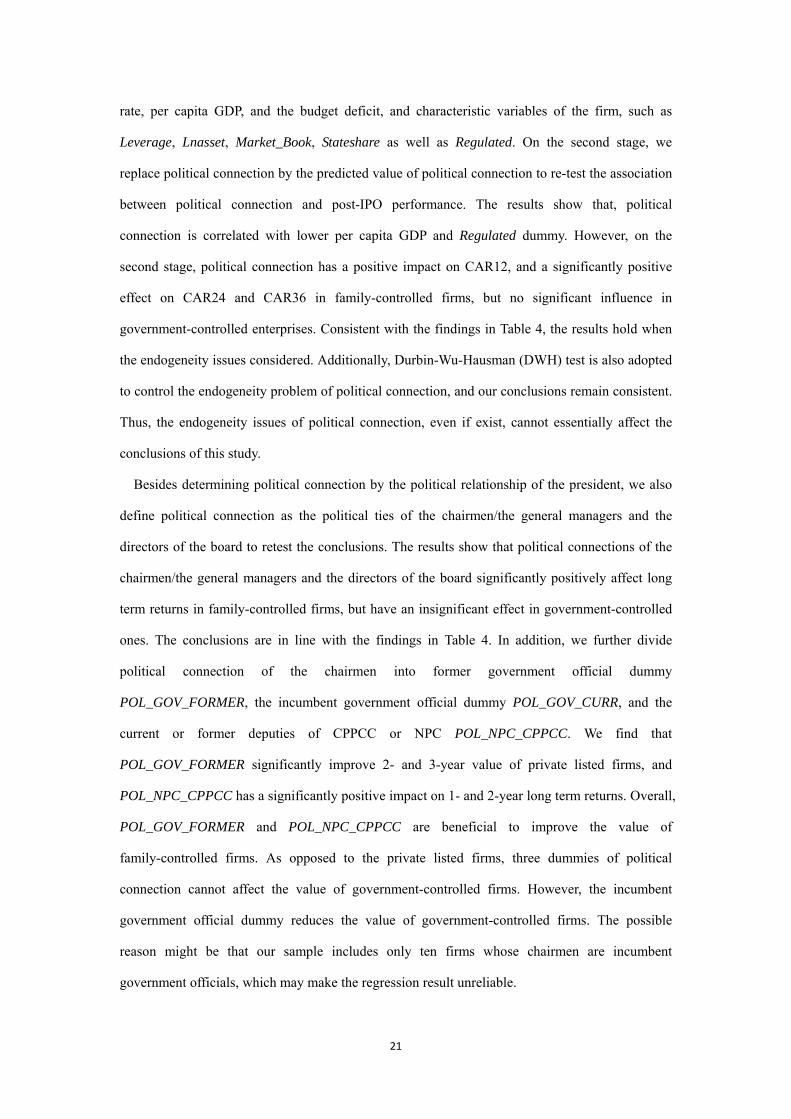
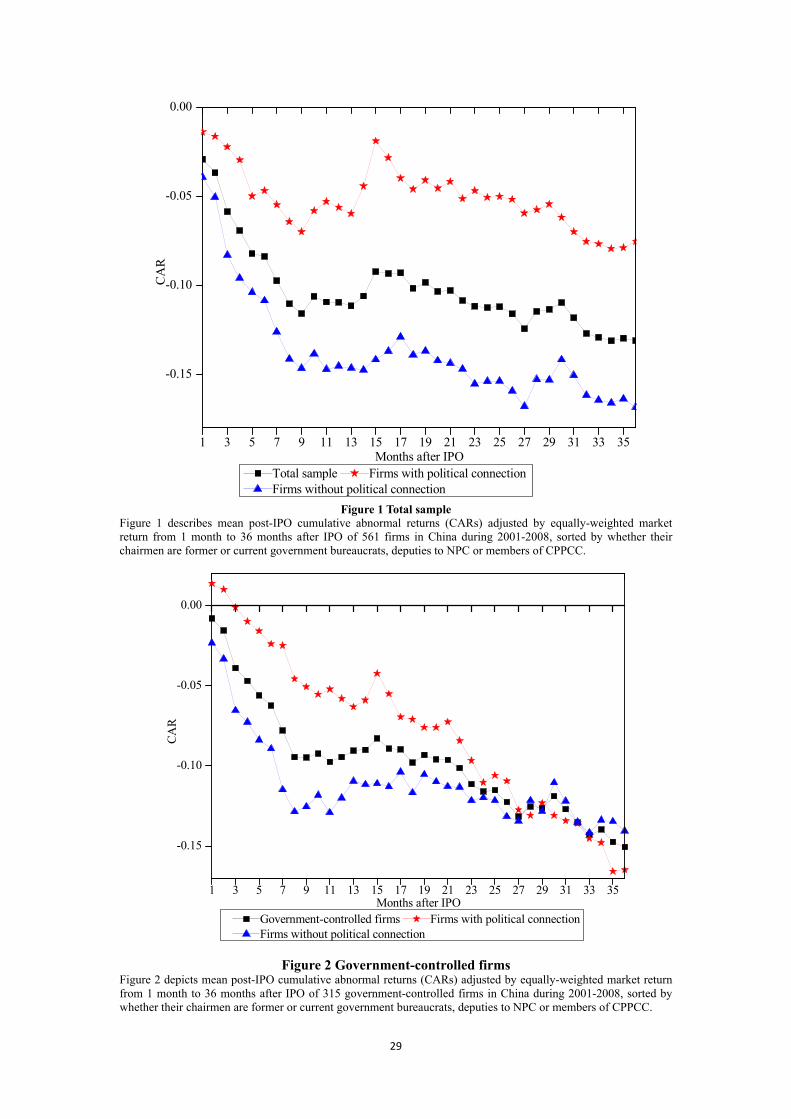
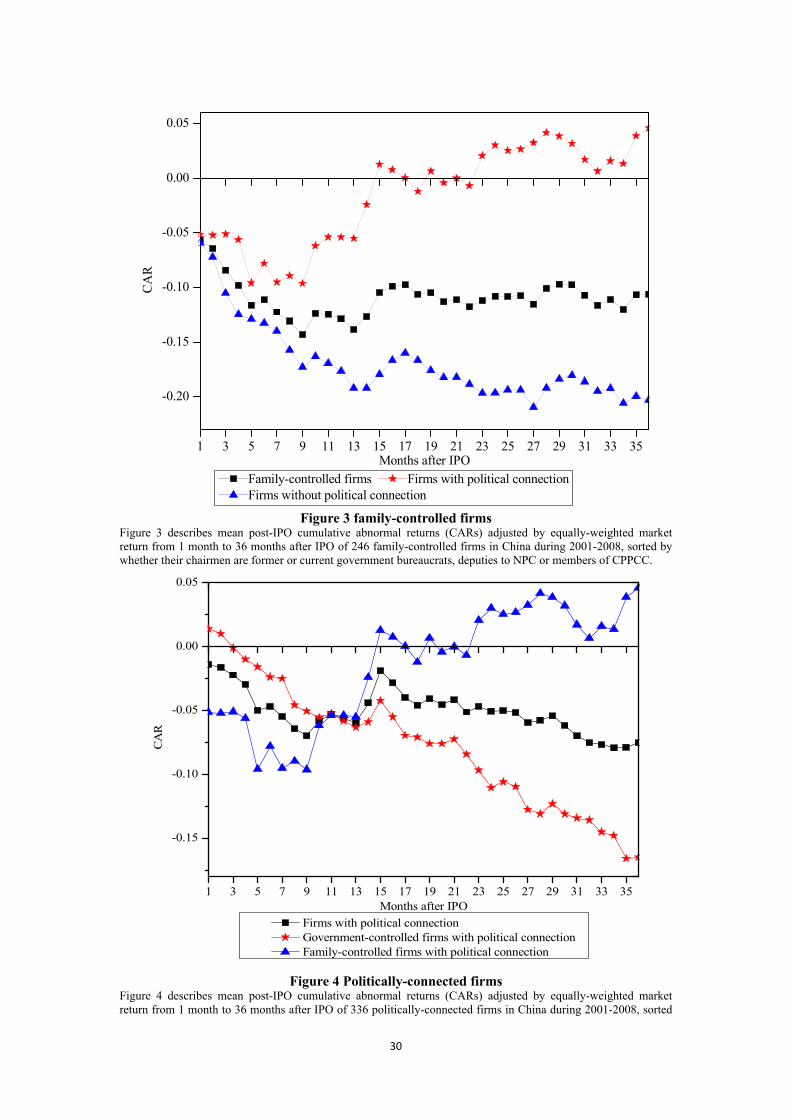
The above three figures are drawn on the post-IPO cumulative abnormal returns (CARs)
adjusted by equally-weighted market return from 1 month to 36 months for all the sampled firms,
for the firms with political connections and for the firms without political connections. Figure 1
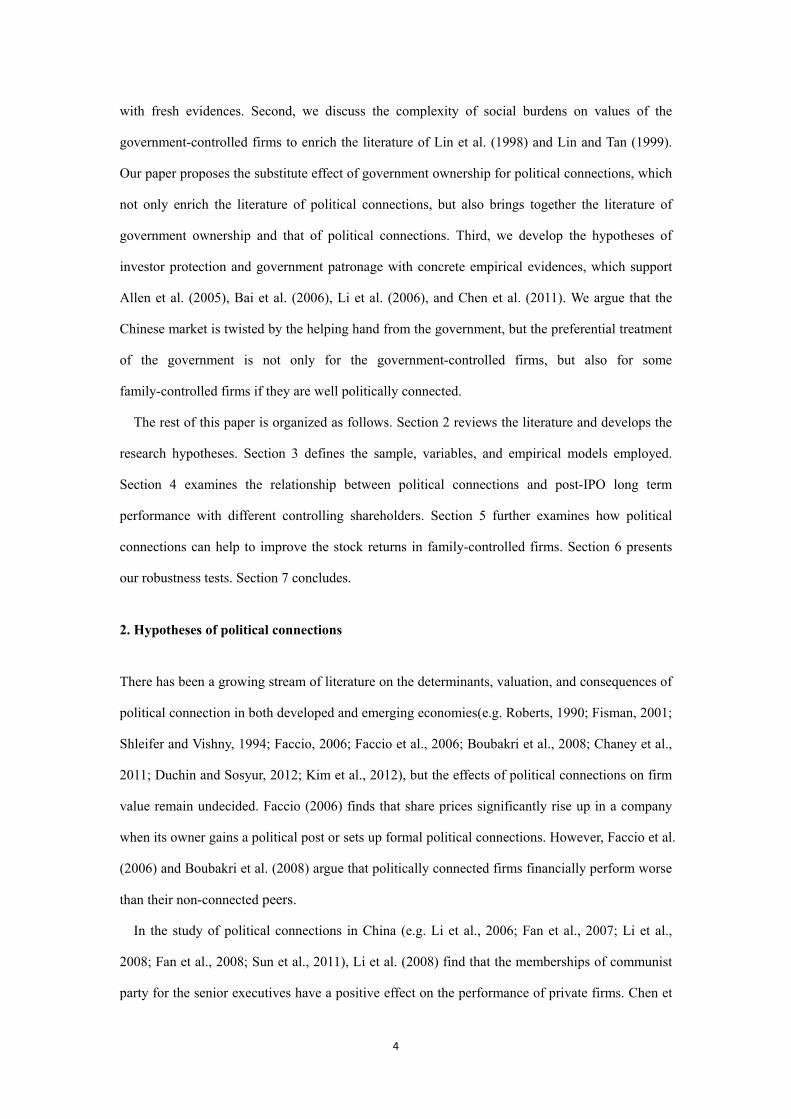
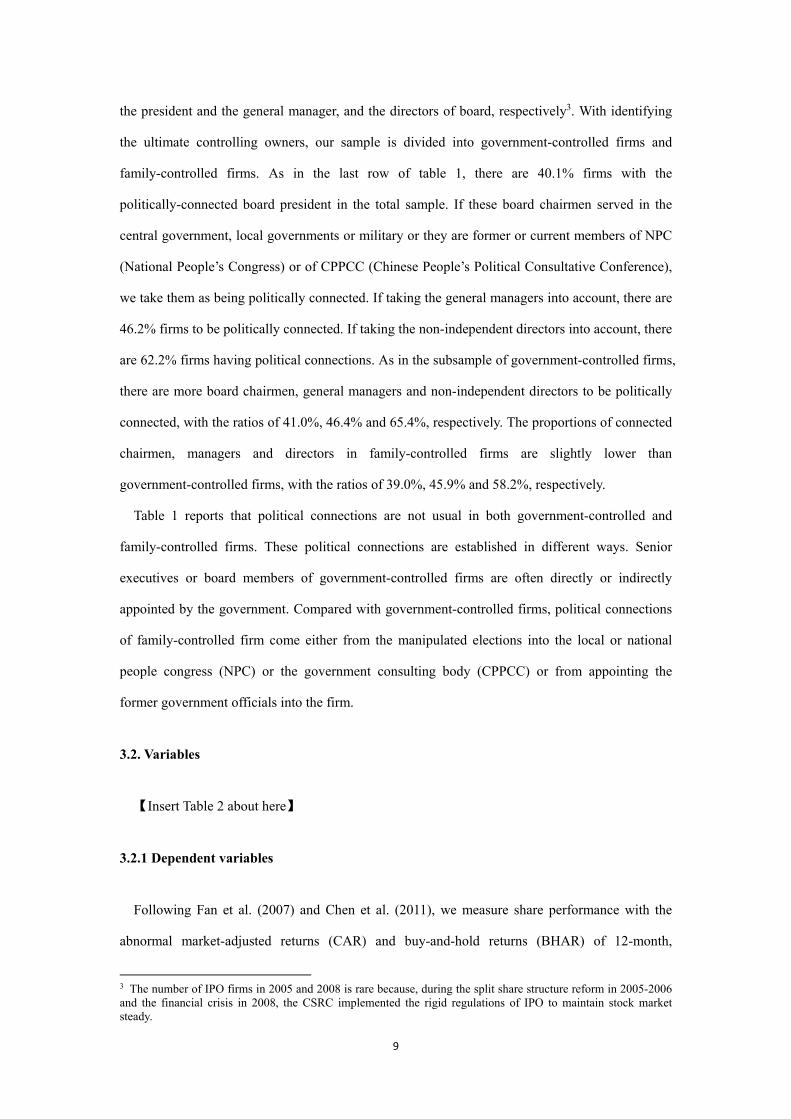
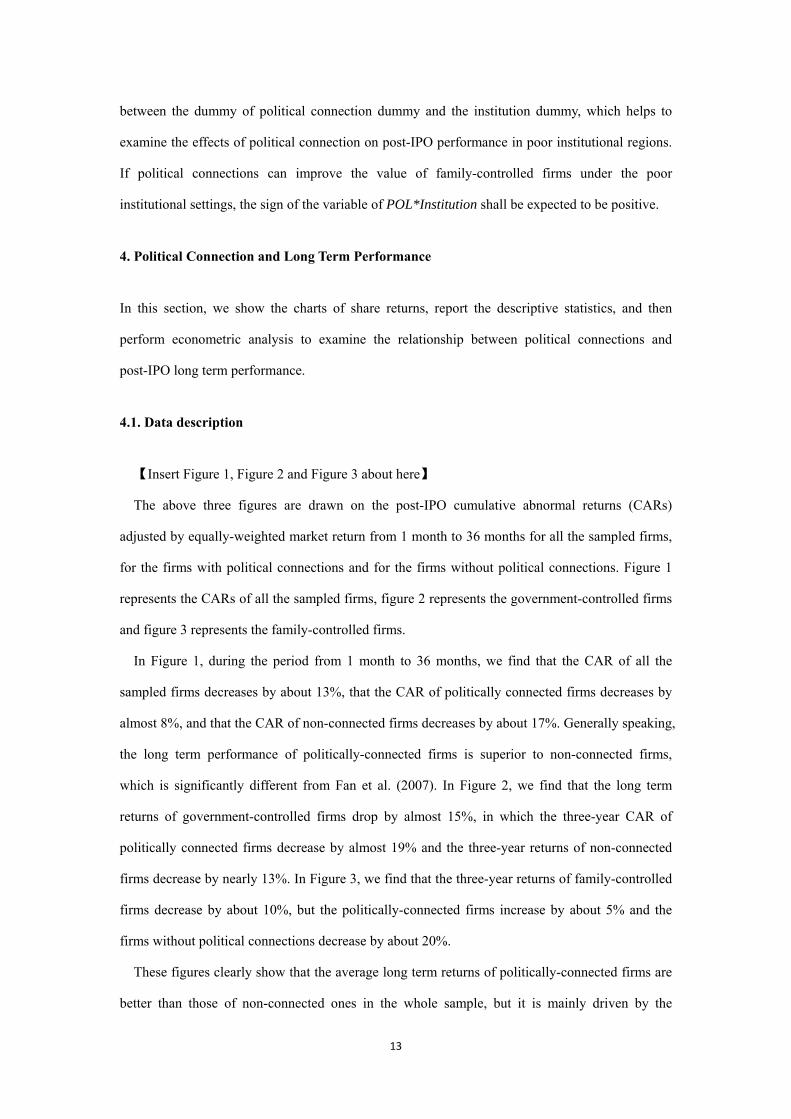
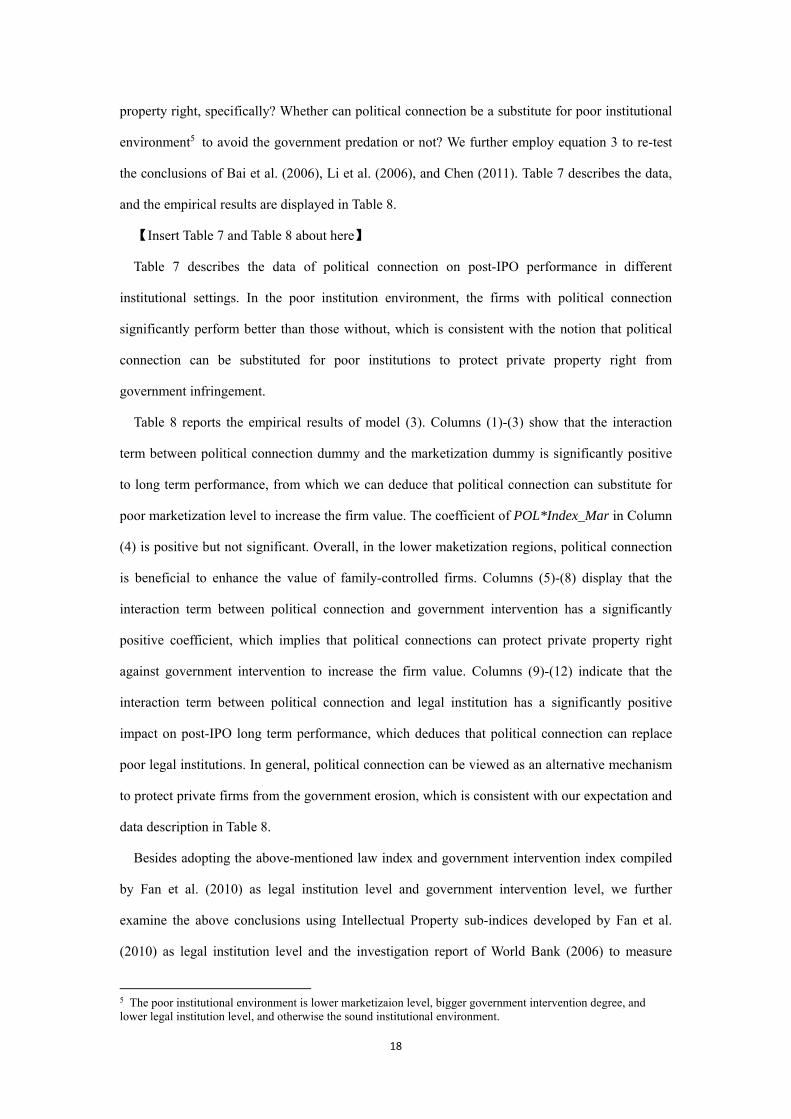
represents the CARs of all the sampled firms, figure 2 represents the government-controlled firms
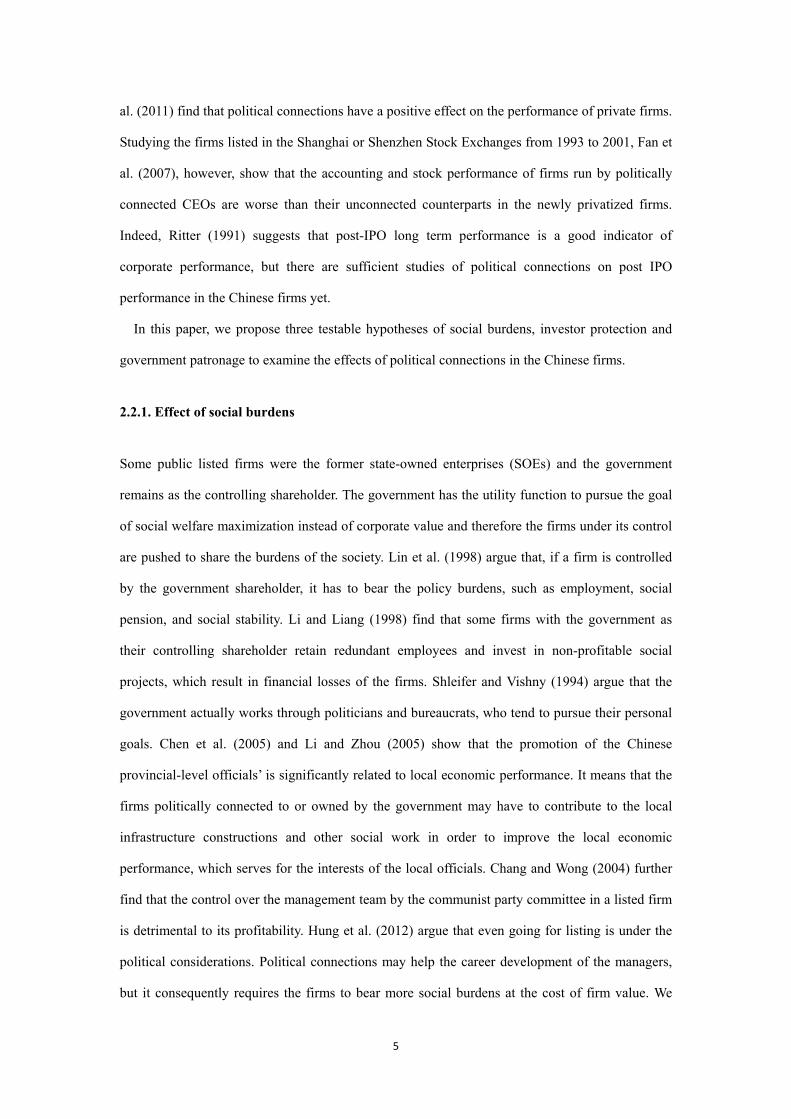
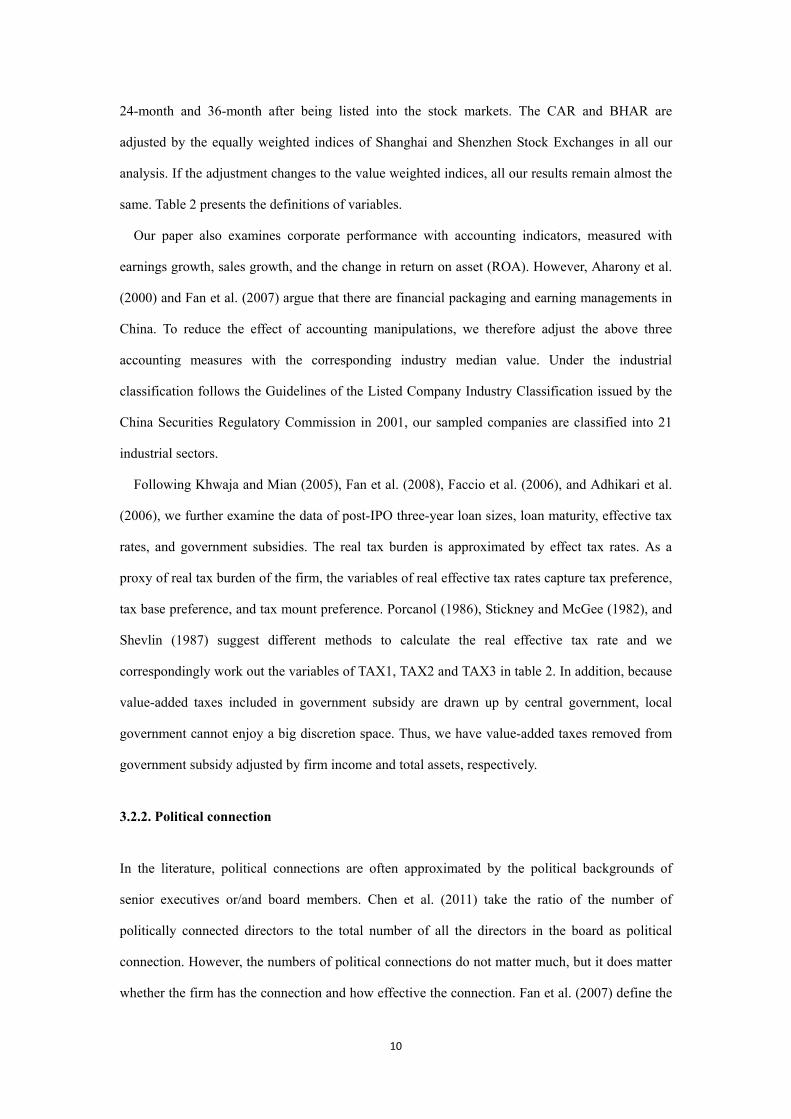
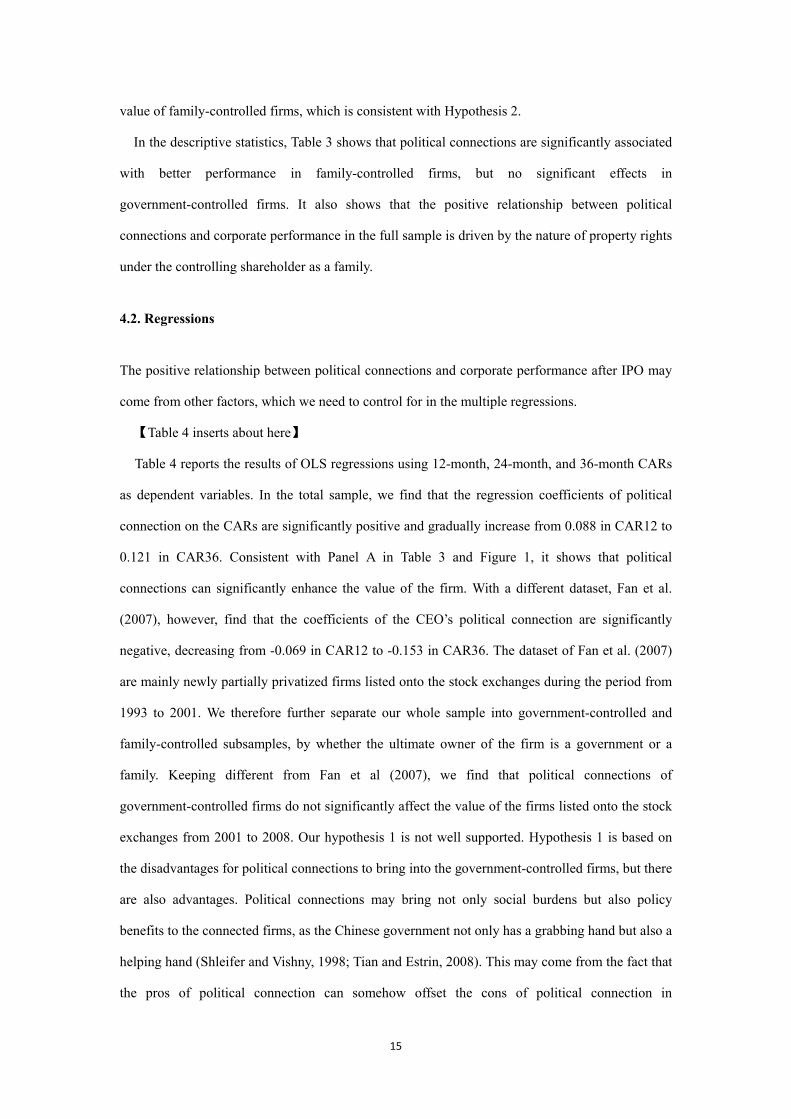
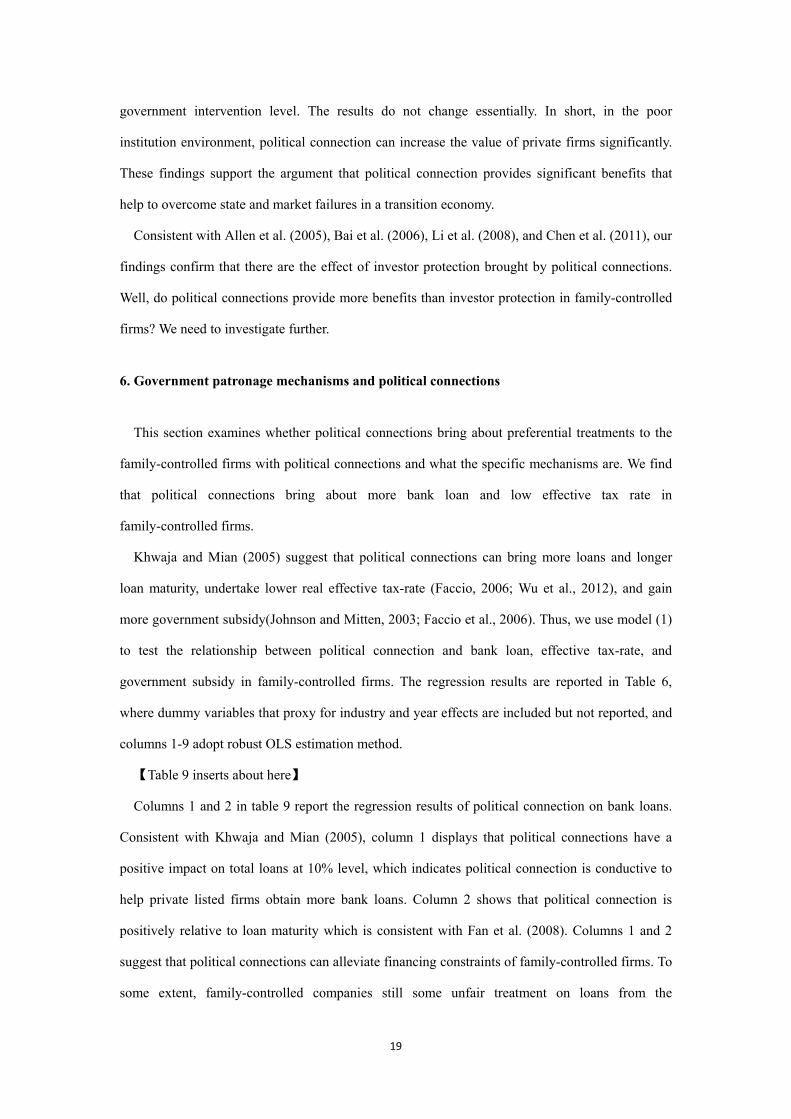
and figure 3 represents the family-controlled firms.
In Figure 1, during the period from 1 month to 36 months, we find that the CAR of all the
sampled firms decreases by about 13%, that the CAR of politically connected firms decreases by
almost 8%, and that the CAR of non-connected firms decreases by about 17%. Generally speaking,
the long term performance of politically-connected firms is superior to non-connected firms,
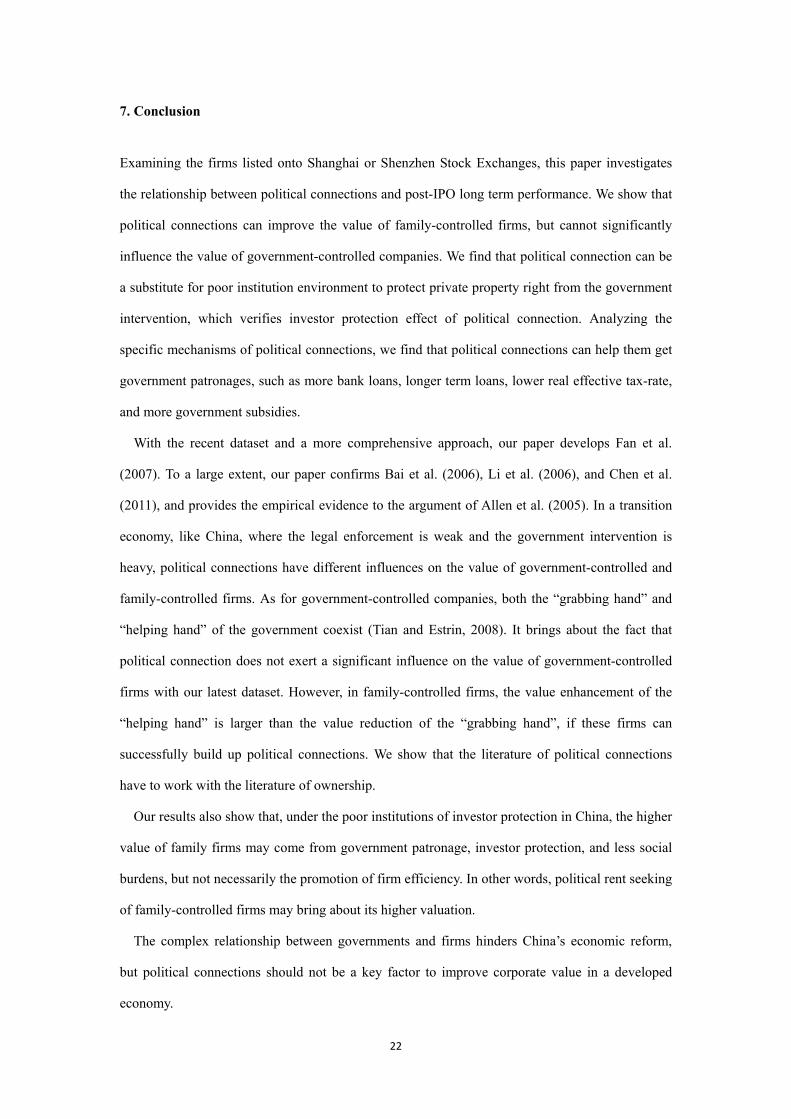
which is significantly different from Fan et al. (2007). In Figure 2, we find that the long term
returns of government-controlled firms drop by almost 15%, in which the three-year CAR of
politically connected firms decrease by almost 19% and the three-year returns of non-connected
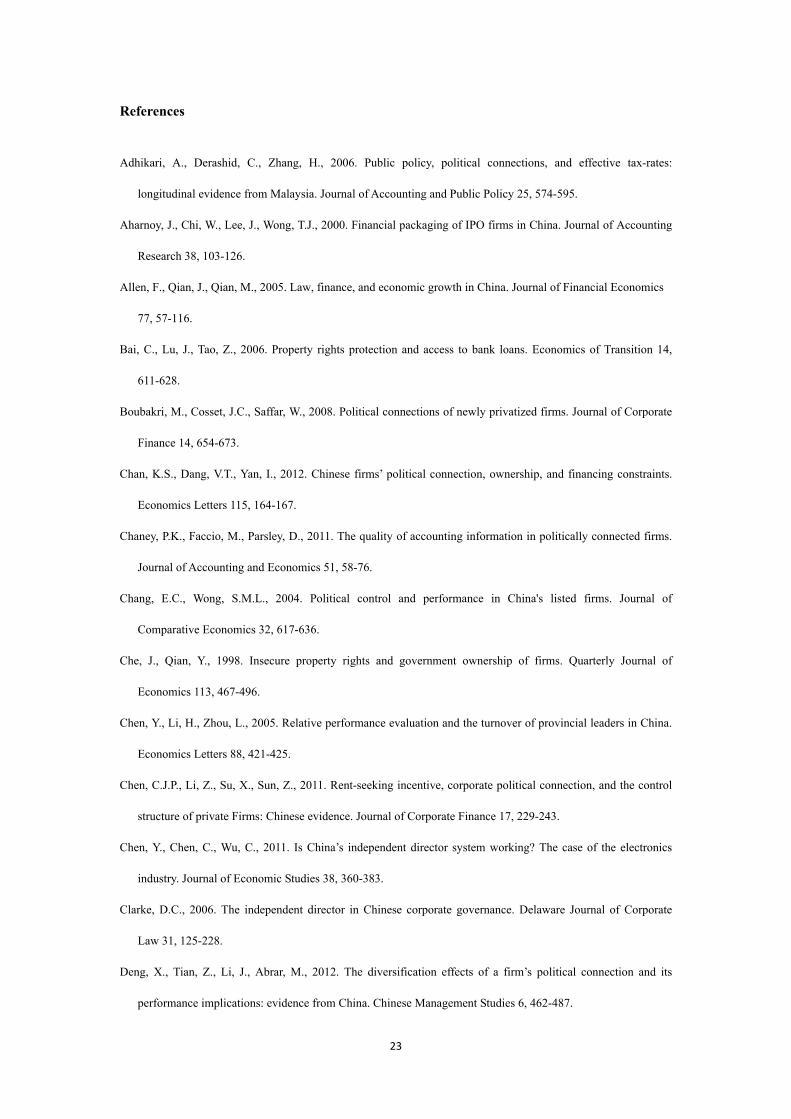
firms decrease by nearly 13%. In Figure 3, we find that the three-year returns of family-controlled
firms decrease by about 10%, but the politically-connected firms increase by about 5% and the
firms without political connections decrease by about 20%.
These figures clearly show that the average long term returns of politically-connected firms are
better than those of non-connected ones in the whole sample, but it is mainly driven by the

14
family-controlled firms and the influence of political connections in government-controlled firms
is not very clear. Corporate performance is influenced not only by political connections, but also
by the nature of property rights owned by controlling shareholders. Next, we analyze our data with
descriptive statistics and econometric regressions.
【Insert Table 3 about here】
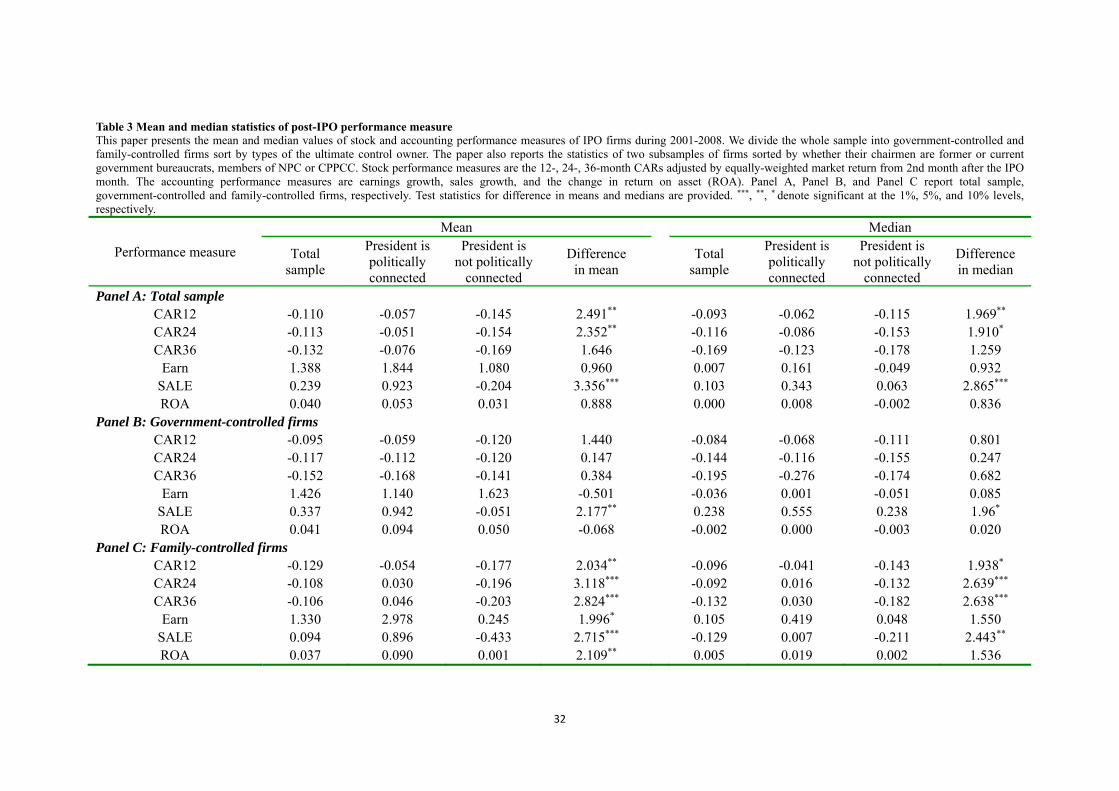
Table 3 reports the 12-month, 24-month and 36-month CARs of listed firms after IPO. In Panel
A, the CAR reduces from -0.11 in one year to -0.13 in three years. Comparing the means of
performance measures, we find that the CARs of politically connected firms are all higher than
those of non-connected ones and CAR12 and CAR24 are significant at 5% level, which is
different from Fan et al. (2007). Our findings are confirmed with the accounting performance
measures and earnings growth, sales growth and the change of ROA of politically connected firms
are all higher than those of non-connected ones, although the difference of sales growth is
significant with student-t test. In the medians and the Wilcoxon signed-ranks test for the median
difference, the results are consistent to the above discussions of means.
Panel B presents the stock- and accounting-based performance of the government-controlled
firms. In line with Figure 2, the means of CAR decreases from -0.095 to -0.152 over time. One-
and two-year CARs of politically connected firms are higher than those of non-connected firms,
although this difference is not significant with student-t test. However, the mean of three-year
CAR of connected firms is -0.168, even lower than that of non-connected ones. As far as
accounting measures to be concerned, sales growth and the change of ROA of politically
connected firms are higher than those of non-connected ones, but the earnings growth of
politically connected companies is lower than that of non-connected ones. Confirmed with the
median tests, there is not a pattern for the difference between connected firms and non-connected
ones in the subsample of government-controlled firms.
Panel C examines the subsample of family-controlled companies. The mean CAR gradually
increases from -0.129 to -0.106. In the student-t tests for the mean difference, the one, two and
three-year CARs of politically connected firms are significantly higher than those of
non-connected ones. The means of earnings growth, sales growth and the change of ROA of the
president’s politically-connected firms are also significantly higher than non-connected ones at
10%, 1%, and 5% levels, respectively. It is suggested that political connection can enhance the
15
value of family-controlled firms, which is consistent with Hypothesis 2.
In the descriptive statistics, Table 3 shows that political connections are significantly associated
with better performance in family-controlled firms, but no significant effects in
government-controlled firms. It also shows that the positive relationship between political
connections and corporate performance in the full sample is driven by the nature of property rights
under the controlling shareholder as a family.
4.2. Regressions
The positive relationship between political connections and corporate performance after IPO may
come from other factors, which we need to control for in the multiple regressions.
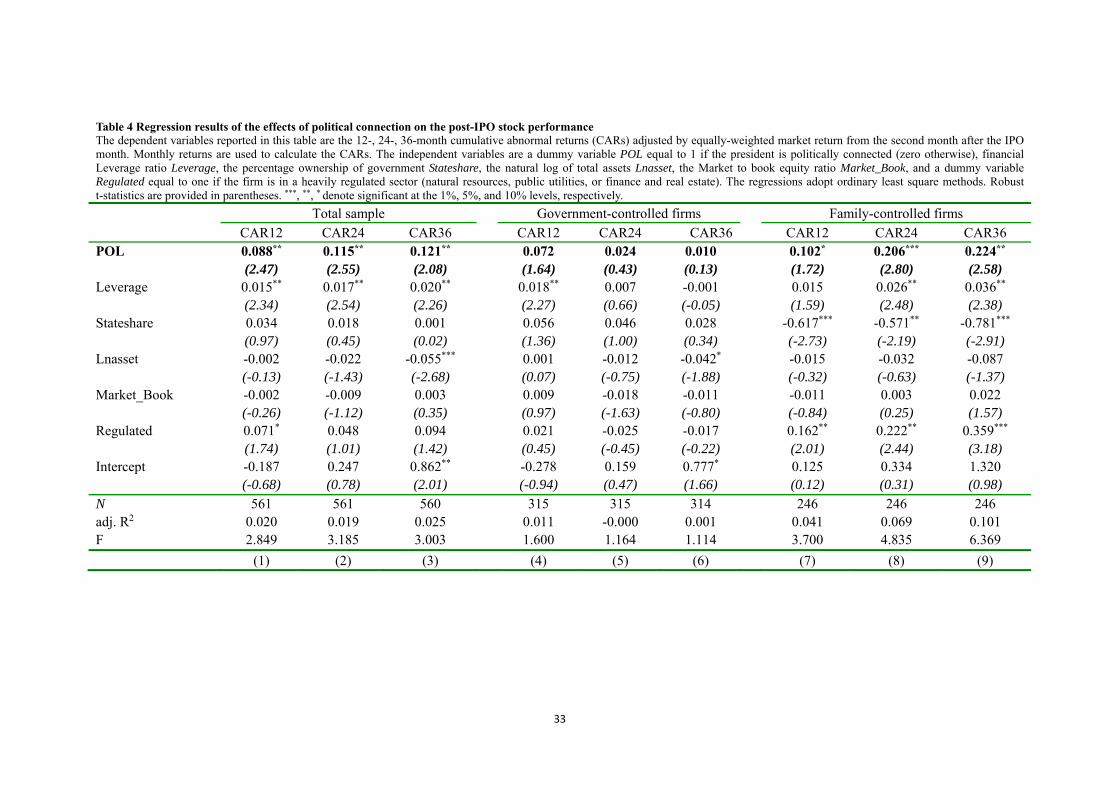
【Table 4 inserts about here】
Table 4 reports the results of OLS regressions using 12-month, 24-month, and 36-month CARs
as dependent variables. In the total sample, we find that the regression coefficients of political
connection on the CARs are significantly positive and gradually increase from 0.088 in CAR12 to
0.121 in CAR36. Consistent with Panel A in Table 3 and Figure 1, it shows that political
connections can significantly enhance the value of the firm. With a different dataset, Fan et al.
(2007), however, find that the coefficients of the CEO’s political connection are significantly
negative, decreasing from -0.069 in CAR12 to -0.153 in CAR36. The dataset of Fan et al. (2007)
are mainly newly partially privatized firms listed onto the stock exchanges during the period from
1993 to 2001. We therefore further separate our whole sample into government-controlled and
family-controlled subsamples, by whether the ultimate owner of the firm is a government or a
family. Keeping different from Fan et al (2007), we find that political connections of
government-controlled firms do not significantly affect the value of the firms listed onto the stock
exchanges from 2001 to 2008. Our hypothesis 1 is not well supported. Hypothesis 1 is based on
the disadvantages for political connections to bring into the government-controlled firms, but there
are also advantages. Political connections may bring not only social burdens but also policy
benefits to the connected firms, as the Chinese government not only has a grabbing hand but also a
helping hand (Shleifer and Vishny, 1998; Tian and Estrin, 2008). This may come from the fact that
the pros of political connection can somehow offset the cons of political connection in
16
government-controlled firms, which makes the coefficients of political connections insignificant.
We also find that the coefficients of political dummy variables gradually decrease from 0.072 to
0.01, which suggests that political connections play a smaller role when the
government-controlled firms are more market oriented with a longer period after listing into the
stock market. In the family-controlled firms, political connections have significantly positive
effects on corporate value, CAR12 significant at 1% levels, CAR24 10% and CAR36 1%. The
coefficients of political connection gradually increase from 0.102 to 0.224, which suggests that
positive effects of political connection become larger with longer periods on the stock market and
consequently getting more established. Hypothesis 2 is well supported. Consistent with the
literature (e.g., Fisman, 2001; Faccio, 2006; Chen et al, 2011), political connections can improve
corporate value with investor protection. The regression result of industry dummy variable
Regulated is consistent with Fan et al. (2007), which suggests that the entrance into regulatory
industries is beneficial to increase the value of family-controlled firms.
【Insert Table 5 about here】
We report the empirical results of political connection of accounting performance measures in
table 5. In the whole sample, political connections significantly improve the growth of sales by
0.915, but there are not significant effects of political connections on any accounting measures
used in government-controlled firms and the hypothesis of social burdens is not supported, either.
However, political connections of family-controlled firms significantly positively influence all the
accounting indicators, including earnings growth, sales growth, and the change of returns on asset,
which suggests that political connections increase the value of private listed firms. This result is
consistent with CAR regressions in table 4 and supports Hypothesis 2.
Table 4 and table 5 show that political connections significantly enhance the value of
family-controlled firms, but cannot significantly influence the value of government-controlled
firms. Given the complexity of government behaviors, our findings do not support the hypothesis
of social burdens, different from Fan et al. (2007), but somehow support the hypothesis of investor
protection. How do political connections work as investor protection specifically?
5. Investor protection and political connections
17
In order to better understand the investor protection effect of political connection, we regress
equation 2 in section 3.3 to examine whether political connection can provide investor protection
with different controlling shareholders.
【Insert Table 6 about here】
Table 6 reports the regression results whether political connection can protect property right
from the government intervention, and POL*Private is our major concern. To compare with other
regressions, we replicate the regression result of column 3 in table 4 in column 1 in table 6.
Column 2 shows that the dummy of private does not have a positive effect on post-IPO long term
performance. Comparing with government-controlled firms, the controlling stakes of a family do
not significantly increase the corporate value in the firms listed on the Chinese stock market,
which is inconsistent with Shleifer (1998) and Dewenter and Malatesta (2001). Given the absence
of strong market-enhancing institutions, the weak enforcement of law, fragile property rights and a
strong government, the family ownership is perhaps subject to expropriation. The regression
results of political connection and property dummy in column 3 are similar to those in columns 1
and 2. Columns 4-7 focus on the results of the interaction term POL*Private. The result implies
that political connection and private dummy are not correlated with post-IPO performance, but the
interaction term POL*Private is significantly positive, which suggests that political connection can
help to protect property right and enhance the firm value. This finding, in line with our expectation,
confirms the results of Li et al. (2006) and Chen et al. (2011). Columns 8 and 9 examine the
effects of private dummy on 36-month long term returns in non-connected firms. All the
coefficients of private dummy variables are not significantly associated with long term returns,
showing that the family controlling shareholder solely does not enhance firm value. However, in
columns 10 and 11, the dummy of private in politically connected firms is significantly related to
post-IPO long term performance. Columns 8-11 show that, owing to the existence of government
encroachment and fragile institutions of investor protection, private property right does not always
bring about value enhancement.
As suggested by Che and Qian (1998), private property right cannot function well because of
government predation under the institutional settings of China. In this paper, we find that political
connections help to protect private property right from government interference, and improve the
value of family-controlled firms. However, how does the political connection protect private
18
property right, specifically? Whether can political connection be a substitute for poor institutional
environment5 to avoid the government predation or not? We further employ equation 3 to re-test
the conclusions of Bai et al. (2006), Li et al. (2006), and Chen (2011). Table 7 describes the data,
and the empirical results are displayed in Table 8.
【Insert Table 7 and Table 8 about here】
Table 7 describes the data of political connection on post-IPO performance in different
institutional settings. In the poor institution environment, the firms with political connection
significantly perform better than those without, which is consistent with the notion that political
connection can be substituted for poor institutions to protect private property right from
government infringement.
Table 8 reports the empirical results of model (3). Columns (1)-(3) show that the interaction
term between political connection dummy and the marketization dummy is significantly positive
to long term performance, from which we can deduce that political connection can substitute for
poor marketization level to increase the firm value. The coefficient of POL*Index_Mar in Column
(4) is positive but not significant. Overall, in the lower maketization regions, political connection
is beneficial to enhance the value of family-controlled firms. Columns (5)-(8) display that the
interaction term between political connection and government intervention has a significantly
positive coefficient, which implies that political connections can protect private property right
against government intervention to increase the firm value. Columns (9)-(12) indicate that the
interaction term between political connection and legal institution has a significantly positive
impact on post-IPO long term performance, which deduces that political connection can replace
poor legal institutions. In general, political connection can be viewed as an alternative mechanism
to protect private firms from the government erosion, which is consistent with our expectation and
data description in Table 8.
Besides adopting the above-mentioned law index and government intervention index compiled
by Fan et al. (2010) as legal institution level and government intervention level, we further
examine the above conclusions using Intellectual Property sub-indices developed by Fan et al.
(2010) as legal institution level and the investigation report of World Bank (2006) to measure
5 The poor institutional environment is lower marketizaion level, bigger government intervention degree, and lower legal institution level, and otherwise the sound institutional environment.
19
government intervention level. The results do not change essentially. In short, in the poor
institution environment, political connection can increase the value of private firms significantly.
These findings support the argument that political connection provides significant benefits that
help to overcome state and market failures in a transition economy.
Consistent with Allen et al. (2005), Bai et al. (2006), Li et al. (2008), and Chen et al. (2011), our
findings confirm that there are the effect of investor protection brought by political connections.
Well, do political connections provide more benefits than investor protection in family-controlled
firms? We need to investigate further.
6. Government patronage mechanisms and political connections
This section examines whether political connections bring about preferential treatments to the
family-controlled firms with political connections and what the specific mechanisms are. We find
that political connections bring about more bank loan and low effective tax rate in
family-controlled firms.
Khwaja and Mian (2005) suggest that political connections can bring more loans and longer
loan maturity, undertake lower real effective tax-rate (Faccio, 2006; Wu et al., 2012), and gain
more government subsidy(Johnson and Mitten, 2003; Faccio et al., 2006). Thus, we use model (1)
to test the relationship between political connection and bank loan, effective tax-rate, and
government subsidy in family-controlled firms. The regression results are reported in Table 6,
where dummy variables that proxy for industry and year effects are included but not reported, and
columns 1-9 adopt robust OLS estimation method.
【Table 9 inserts about here】
Columns 1 and 2 in table 9 report the regression results of political connection on bank loans.
Consistent with Khwaja and Mian (2005), column 1 displays that political connections have a
positive impact on total loans at 10% level, which indicates political connection is conductive to
help private listed firms obtain more bank loans. Column 2 shows that political connection is
positively relative to loan maturity which is consistent with Fan et al. (2008). Columns 1 and 2
suggest that political connections can alleviate financing constraints of family-controlled firms. To
some extent, family-controlled companies still some unfair treatment on loans from the
20
government-controlled banks in China. Political ties between the government and the
family-controlled firms may help the firm to obtain bank loans to ease the financing constraints.
Columns 3-5 report the regression results of political connection on real effective tax-rate. It can
be seen that political connection has a significantly negative impact on tax-rate, which implies that
political connection reduces the real effective tax-rate of private firms. This result is consistent
with Faccio (2006), Adhikari et al. (2006), and Wu et al. (2012).
Columns 6-9 report the regression results of political connection on government subsidies. As
can be seen from Columns 6-9 in table 9, political connections have a significant and positive
effect on government subsidies. The results are consistent with Faccio et al. (2006) and Johnson
and Mitten (2003), which indicate that political connections can help the private firms obtain more
government subsidies.
Overall, political connection helps family-controlled firms get more bank loans, longer loan
maturity, lower effective tax-rate, and more government subsidies, which verifies government
patronage effect of political connection.
7. Robustness Tests
The above analysis finds that political connection can significantly improve the value of private
firms, but do not significantly influence the value of government-controlled firms. To show the
robustness of our findings, we re-examine the effect of the political connection on post-IPO
performance with buy-and-hold abnormal return (BHAR) instead of CAR. The results display that
political connection has significantly positive effects on BHAR24 and BHAR36. Overall, political
connection increases the value of private firms. Meantime, we replace the accounting-based
measures by ROA1-ROA3, ROE1-ROE3 and Sale1-Sale3 to re-test model (1). The results remain
unchanged.
We are concerned about potential endogeneity issues in the relationship between political
connection and long term performance. Political connection may be effected by the unemployment
rate, per capita GDP and budget deficit (Fan et al., 2007). Following Fan et al. (2007), we adopt
a two-stage least square (2SLS) method to control the endogeneity of political connection. On the
first stage, we regress political connection dummy on external factors, such as the unemployment
21
rate, per capita GDP, and the budget deficit, and characteristic variables of the firm, such as
Leverage, Lnasset, Market_Book, Stateshare as well as Regulated. On the second stage, we
replace political connection by the predicted value of political connection to re-test the association
between political connection and post-IPO performance. The results show that, political
connection is correlated with lower per capita GDP and Regulated dummy. However, on the
second stage, political connection has a positive impact on CAR12, and a significantly positive
effect on CAR24 and CAR36 in family-controlled firms, but no significant influence in
government-controlled enterprises. Consistent with the findings in Table 4, the results hold when
the endogeneity issues considered. Additionally, Durbin-Wu-Hausman (DWH) test is also adopted
to control the endogeneity problem of political connection, and our conclusions remain consistent.
Thus, the endogeneity issues of political connection, even if exist, cannot essentially affect the
conclusions of this study.
Besides determining political connection by the political relationship of the president, we also
define political connection as the political ties of the chairmen/the general managers and the
directors of the board to retest the conclusions. The results show that political connections of the
chairmen/the general managers and the directors of the board significantly positively affect long
term returns in family-controlled firms, but have an insignificant effect in government-controlled
ones. The conclusions are in line with the findings in Table 4. In addition, we further divide
political connection of the chairmen into former government official dummy
POL_GOV_FORMER, the incumbent government official dummy POL_GOV_CURR, and the
current or former deputies of CPPCC or NPC POL_NPC_CPPCC. We find that
POL_GOV_FORMER significantly improve 2- and 3-year value of private listed firms, and
POL_NPC_CPPCC has a significantly positive impact on 1- and 2-year long term returns. Overall,
POL_GOV_FORMER and POL_NPC_CPPCC are beneficial to improve the value of
family-controlled firms. As opposed to the private listed firms, three dummies of political
connection cannot affect the value of government-controlled firms. However, the incumbent
government official dummy reduces the value of government-controlled firms. The possible
reason might be that our sample includes only ten firms whose chairmen are incumbent
government officials, which may make the regression result unreliable.
22
7. Conclusion
Examining the firms listed onto Shanghai or Shenzhen Stock Exchanges, this paper investigates
the relationship between political connections and post-IPO long term performance. We show that
political connections can improve the value of family-controlled firms, but cannot significantly
influence the value of government-controlled companies. We find that political connection can be
a substitute for poor institution environment to protect private property right from the government
intervention, which verifies investor protection effect of political connection. Analyzing the
specific mechanisms of political connections, we find that political connections can help them get
government patronages, such as more bank loans, longer term loans, lower real effective tax-rate,
and more government subsidies.
With the recent dataset and a more comprehensive approach, our paper develops Fan et al.
(2007). To a large extent, our paper confirms Bai et al. (2006), Li et al. (2006), and Chen et al.
(2011), and provides the empirical evidence to the argument of Allen et al. (2005). In a transition
economy, like China, where the legal enforcement is weak and the government intervention is
heavy, political connections have different influences on the value of government-controlled and
family-controlled firms. As for government-controlled companies, both the “grabbing hand” and
“helping hand” of the government coexist (Tian and Estrin, 2008). It brings about the fact that
political connection does not exert a significant influence on the value of government-controlled
firms with our latest dataset. However, in family-controlled firms, the value enhancement of the
“helping hand” is larger than the value reduction of the “grabbing hand”, if these firms can
successfully build up political connections. We show that the literature of political connections
have to work with the literature of ownership.
Our results also show that, under the poor institutions of investor protection in China, the higher
value of family firms may come from government patronage, investor protection, and less social
burdens, but not necessarily the promotion of firm efficiency. In other words, political rent seeking
of family-controlled firms may bring about its higher valuation.
The complex relationship between governments and firms hinders China’s economic reform,
but political connections should not be a key factor to improve corporate value in a developed
economy.
23
References
Adhikari, A., Derashid, C., Zhang, H., 2006. Public policy, political connections, and effective tax-rates:
longitudinal evidence from Malaysia. Journal of Accounting and Public Policy 25, 574-595.
Aharnoy, J., Chi, W., Lee, J., Wong, T.J., 2000. Financial packaging of IPO firms in China. Journal of Accounting
Research 38, 103-126.
Allen, F., Qian, J., Qian, M., 2005. Law, finance, and economic growth in China. Journal of Financial Economics
77, 57-116.
Bai, C., Lu, J., Tao, Z., 2006. Property rights protection and access to bank loans. Economics of Transition 14,
611-628.
Boubakri, M., Cosset, J.C., Saffar, W., 2008. Political connections of newly privatized firms. Journal of Corporate
Finance 14, 654-673.
Chan, K.S., Dang, V.T., Yan, I., 2012. Chinese firms’ political connection, ownership, and financing constraints.
Economics Letters 115, 164-167.
Chaney, P.K., Faccio, M., Parsley, D., 2011. The quality of accounting information in politically connected firms.
Journal of Accounting and Economics 51, 58-76.
Chang, E.C., Wong, S.M.L., 2004. Political control and performance in China's listed firms. Journal of
Comparative Economics 32, 617-636.
Che, J., Qian, Y., 1998. Insecure property rights and government ownership of firms. Quarterly Journal of
Economics 113, 467-496.
Chen, Y., Li, H., Zhou, L., 2005. Relative performance evaluation and the turnover of provincial leaders in China.
Economics Letters 88, 421-425.
Chen, C.J.P., Li, Z., Su, X., Sun, Z., 2011. Rent-seeking incentive, corporate political connection, and the control
structure of private Firms: Chinese evidence. Journal of Corporate Finance 17, 229-243.
Chen, Y., Chen, C., Wu, C., 2011. Is China’s independent director system working? The case of the electronics
industry. Journal of Economic Studies 38, 360-383.
Clarke, D.C., 2006. The independent director in Chinese corporate governance. Delaware Journal of Corporate
Law 31, 125-228.
Deng, X., Tian, Z., Li, J., Abrar, M., 2012. The diversification effects of a firm’s political connection and its
performance implications: evidence from China. Chinese Management Studies 6, 462-487.
24
Dewenter, K.L., Malatesta, P.H., 2001. State-owned and privately owned firms: an empirical analysis of
profitability, leverage, and labor intensity. American Economic Review 91, 320-334.
Duchin, R., Sosyur, D., 2012. The politics of government investment. Journal of Financial Economics 106, 24-48.
Faccio, M., 2006. Politically connected firms. American Economic Review 96, 369-386.
Faccio, M., Masulis, R.W., Mcconnell, J., 2006. Politically connections and corporate bailouts. Journal of Finance
61, 2597-2635.
Fan, J.P.H., Wong, T.J., Zhang, T., 2007. Politically connected CEOs, corporate governance and post-IPO
performance of China’s newly partially privatized firms. Journal of Financial Economics 84, 330-357.
Fan, J.P.H., Rui, M.O., Zhao, M., 2008. Public governance and corporate finance: evidence from corruption cases.
Journal of Comparative Economics 36, 343-364.
Fan, G., Wang, X.L., Zhu, H.P., 2010. NERI index of marketization of China’s provinces 2010 report. Beijing:
Economic Science Press.
Fan, J.P.H., Wong, T.J., Zhang, T., 2013. Institutions and organizational structure: the Case of state-owned
corporate pyramids. Journal of Law Economics & Organization, forthcoming.
Fisman, R., 2001. Estimating the value of political connections. American Economic Review 91, 1095-1102.
Gold, T., Guthrie D., Wank, D., 2002. Social connections in China: institutions, culture and the changing nature of
Guanxi. Cambridge: Cambridge University Press.
Hu, X., Shi, J., 2009. The relationship between political resources and diversification of private enterprises: An
empirical study of the top 500 private enterprises in China. Frontiers of Business Research in China 3,
207-223.
Hung, M., Wong, T.J., Zhang, T., 2012. Political considerations in the decision of Chinese SOEs to list in Hong
Kong. Journal of Accounting Economics 53, 435-449.
Jefferson, G.H., Su, J., 2006. Privatization and restructuring in China: Evidence from shareholding ownership,
1995-2001. Journal of Comparative Economics 34, 146-166.
Johnson, S., Mitton, T., 2003. Cronyism and capital controls: evidence from Malaysia. Journal of Financial
Economics 67, 351-382.
Khwaja, A., Mian, A., 2005. Do lenders favor politically-connected firms? Rent provision in an emerging financial
market. Quarterly Journal of Economics 120, 1371-1411.
Kim, C., Christos, P., Chui, P.J., 2012. Political geography and stock returns: the value and risk implications of
proximity to political power. Journal of Financial Economics 106, 196-228.
25
La Porta, R., Lopez-de-silanes, F., Shleifer, A., Vishny, R., 1997. Legal determinants of external finance. Journal of
Finance 52, 1131-1150.
La Porta, R., Lopez-de-silanes, F., Shleifer, A., Vishny, R., 2002. Investor protection and corporate valuation.
Journal of Finance 58, 1147-1170.
Leuz, C., Oberholzer, G.F., 2005. Political relationships, global financing, and corporate transparency: evidence
from Indonesia. Journal of Financial Economics 81, 411-439.
Li, D.D., Liang, M., 1998. Causes of the soft budget constraint: evidence on three explanations. Journal of
Comparative Economics 26, 104-116.
Li, H., Zhou, L., 2005. Political turnover and economic performance: the incentive role of personnel control in
China. Journal of Public Economics 89, 1743-1762.
Li, H., Meng, L., Zhang, J., 2006. Why do entrepreneurs enter politics? Evidence from China. Economic Inquiry
44, 559-578.
Li, H., Meng, L., Wang, Q., Zhou, L., 2008. Political connections, financing and firm performance: evidence from
Chinese private firms. Journal of Development Economics 87, 283-299.
Lin, J.Y., Cai, F., Li, Z., 1998. Competition, policy burdens and state owned enterprise reform. American
Economic Review 88, 422-427.
Lin, J.Y., Tan, G., 1999. Policy burdens, accountability, and the soft budget. American Economic Review 89,
426-431.
Porcano, T.M., 1986. Corporate tax rates: progressive, proportional, or regressive. The Journal of the American
Taxation Association 7, 17-31.
Ritter, J.R, 1991. The long run performance of initial public offerings. Journal of Finance 46, 3-28.
Roberts, B.E., 1990. A dead senator tells no lies: seniority and the distribution of federal benefits. American
Journal of Political Science 34, 31-58.
Shevlin, T., 1987. Taxes and off-balance-sheet financing: research and development limited partnerships.
Accounting Review 62, 480-509.
Shleifer, A., Vishny, R., 1994. Politicians and Firms. Quarterly Journal of Economics 109, 995-1025.
Shleifer, A., Vishny, R., 1998. The grabbing hand: government pathologies and their curves. Harvard University
Press, Cambridge, MA.
Shleifer, A., 1998. State versus private ownership. Journal of Economic Perspectives 12, 133-150.
Stickney, C. P., McGee, V.E., 1982. Effective corporate tax rates: the effect of size, capital intensity, leverage and
26
other factors. Journal of Accounting and Public Policy 1, 125-152.
Sun, P., Xu, H., Zhou, J., 2011. The value of local political capital in transition China. Economics Letters 110,
189-192.
Tian, L., Estrin, S., 2008. Retained state shareholding in Chinese PLCs: does government ownership always reduce
corporate value? Journal of Comparative Economics 36, 74-89.
Wu, W., Wu, C., Zhou, C., Wu, J., 2012. Political connections, tax benefits and firm performance: evidence from
China. Journal of Accounting and Public Policy 31, 277-300.
Xin, K.R., Pearce, J., 1996. Guanxi: connection as substitute for formal institutional support. Academy of
Management Journal 39, 1641-1658.
27
Table 1 The sample This sample presents information on the sample of initial public offering (IPO) firms by year of IPO in China during 2001-2008. We divide the whole sample into Government-controlled firms whose ultimate control owner is central government, local government and family-controlled firms whose ultimate control owner is private or family. This paper reports the number and the percentage of politically connected firms, whose chairmen, chairmen/general managers, or directors of the board have working experiences of central government, local government or military, or are former or current deputies to NPC (National People’s Congress) or members of CPPCC (Chinese People’s Political Consultative Conference).
Total sample Government-controlled firms Family-controlled firms
N PresidentPresident
and general manager
Board N President President
and general manager
Board N PresidentPresident
and general manager
Board
2001 Number 69 40 42 54 61 33 34 47 8 7 8 7 Ratio (%) 57.97 60.87 78.26 54.10 55.74 77.05 87.50 100.00 87.50 2002 Number 66 23 28 40 56 22 26 36 10 1 2 4 Ratio (%) 34.85 42.42 60.61 39.29 49.43 64.29 10.00 20.00 40.00 2003 Number 64 22 27 37 44 14 17 25 20 8 10 12 Ratio (%) 34.38 42.19 57.81 31.82 39.64 56.82 40.00 50.00 60.00 2004 Number 94 37 42 56 50 17 20 28 44 20 22 28 Ratio (%) 39.36 44.68 59.57 34.00 40.00 56.00 45.45 50.00 62.64 2005 Number 11 4 5 6 4 2 3 2 7 2 2 4 Ratio (%) 36.36 45.45 54.55 50.00 75.00 50.00 28.57 28.57 57.14 2006 Number 60 25 27 37 31 13 14 19 29 12 13 18 Ratio (%) 41.67 45.00 61.67 41.94 45.16 61.29 41.38 44.83 62.07 2007 Number 121 45 54 74 50 20 24 35 71 25 30 39 Ratio (%) 37.19 44.63 61.16 40.00 48.00 70.00 35.21 42.25 54.93 2008 Number 76 29 34 45 19 8 8 14 57 21 26 31 Ratio (%) 38.16 44.74 59.21 42.11 42.11 73.68 36.84 45.64 54.39 Total Number 561 225 259 349 315 129 146 206 246 96 113 143 Ratio (%) 40.11 46.17 62.21 40.95 46.35 65.40 39.02 45.93 58.16
28
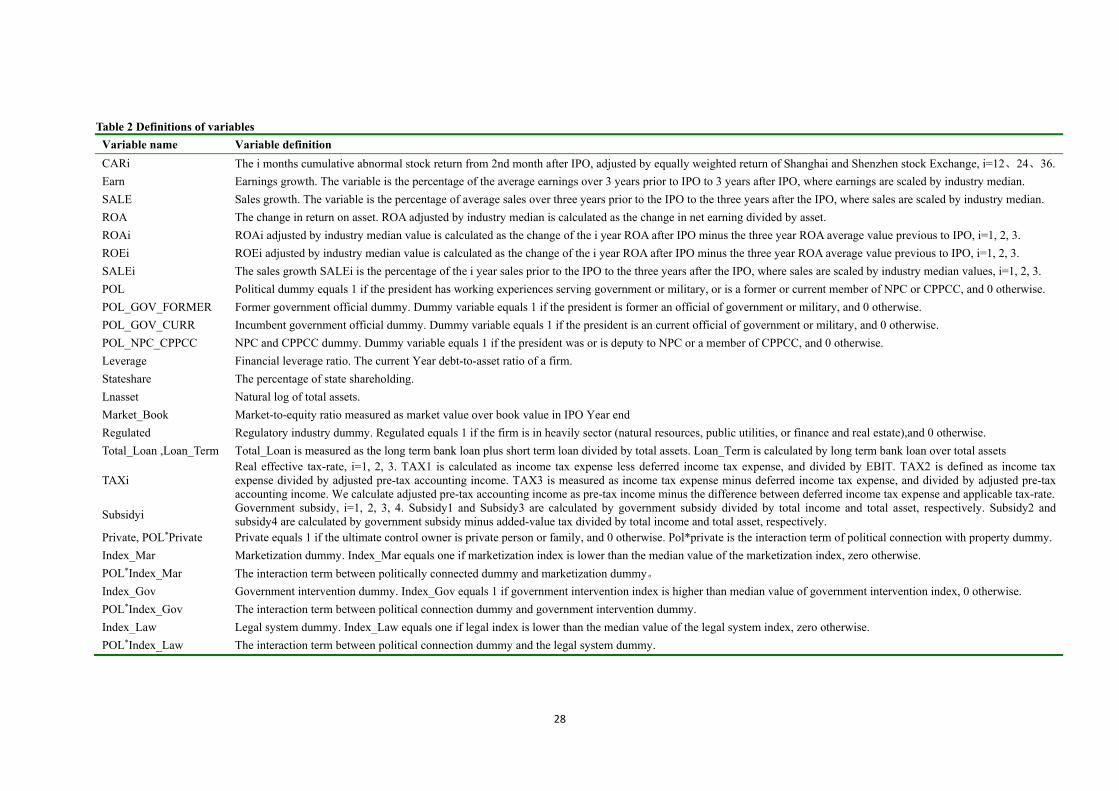
Table 2 Definitions of variables
Variable name Variable definition
CARi The i months cumulative abnormal stock return from 2nd month after IPO, adjusted by equally weighted return of Shanghai and Shenzhen stock Exchange, i=12、24、36.
Earn Earnings growth. The variable is the percentage of the average earnings over 3 years prior to IPO to 3 years after IPO, where earnings are scaled by industry median.
SALE Sales growth. The variable is the percentage of average sales over three years prior to the IPO to the three years after the IPO, where sales are scaled by industry median.
ROA The change in return on asset. ROA adjusted by industry median is calculated as the change in net earning divided by asset.
ROAi ROAi adjusted by industry median value is calculated as the change of the i year ROA after IPO minus the three year ROA average value previous to IPO, i=1, 2, 3.
ROEi ROEi adjusted by industry median value is calculated as the change of the i year ROA after IPO minus the three year ROA average value previous to IPO, i=1, 2, 3.
SALEi The sales growth SALEi is the percentage of the i year sales prior to the IPO to the three years after the IPO, where sales are scaled by industry median values, i=1, 2, 3.
POL Political dummy equals 1 if the president has working experiences serving government or military, or is a former or current member of NPC or CPPCC, and 0 otherwise.
POL_GOV_FORMER Former government official dummy. Dummy variable equals 1 if the president is former an official of government or military, and 0 otherwise.
POL_GOV_CURR Incumbent government official dummy. Dummy variable equals 1 if the president is an current official of government or military, and 0 otherwise.
POL_NPC_CPPCC NPC and CPPCC dummy. Dummy variable equals 1 if the president was or is deputy to NPC or a member of CPPCC, and 0 otherwise.
Leverage Financial leverage ratio. The current Year debt-to-asset ratio of a firm.
Stateshare The percentage of state shareholding.
Lnasset Natural log of total assets.
Market_Book Market-to-equity ratio measured as market value over book value in IPO Year end
Regulated Regulatory industry dummy. Regulated equals 1 if the firm is in heavily sector (natural resources, public utilities, or finance and real estate),and 0 otherwise.
Total_Loan ,Loan_Term Total_Loan is measured as the long term bank loan plus short term loan divided by total assets. Loan_Term is calculated by long term bank loan over total assets
TAXi Real effective tax-rate, i=1, 2, 3. TAX1 is calculated as income tax expense less deferred income tax expense, and divided by EBIT. TAX2 is defined as income tax expense divided by adjusted pre-tax accounting income. TAX3 is measured as income tax expense minus deferred income tax expense, and divided by adjusted pre-tax accounting income. We calculate adjusted pre-tax accounting income as pre-tax income minus the difference between deferred income tax expense and applicable tax-rate.
Subsidyi Government subsidy, i=1, 2, 3, 4. Subsidy1 and Subsidy3 are calculated by government subsidy divided by total income and total asset, respectively. Subsidy2 and subsidy4 are calculated by government subsidy minus added-value tax divided by total income and total asset, respectively.
Private, POL*Private Private equals 1 if the ultimate control owner is private person or family, and 0 otherwise. Pol*private is the interaction term of political connection with property dummy.
Index_Mar Marketization dummy. Index_Mar equals one if marketization index is lower than the median value of the marketization index, zero otherwise.
POL*Index_Mar The interaction term between politically connected dummy and marketization dummy。
Index_Gov Government intervention dummy. Index_Gov equals 1 if government intervention index is higher than median value of government intervention index, 0 otherwise.
POL*Index_Gov The interaction term between political connection dummy and government intervention dummy.
Index_Law Legal system dummy. Index_Law equals one if legal index is lower than the median value of the legal system index, zero otherwise.
POL*Index_Law The interaction term between political connection dummy and the legal system dummy.
29
1 3 5 7 9 11 13 15 17 19 21 23 25 27 29 31 33 35
-0.15
-0.10
-0.05
0.00
CA
R
Months after IPOTotal sample Firms with political connection Firms without political connection
Figure 1 Total sample
Figure 1 describes mean post-IPO cumulative abnormal returns (CARs) adjusted by equally-weighted market return from 1 month to 36 months after IPO of 561 firms in China during 2001-2008, sorted by whether their chairmen are former or current government bureaucrats, deputies to NPC or members of CPPCC.
1 3 5 7 9 11 13 15 17 19 21 23 25 27 29 31 33 35
-0.15
-0.10
-0.05
0.00
CA
R
Months after IPOGovernment-controlled firms Firms with political connection Firms without political connection
Figure 2 Government-controlled firms
Figure 2 depicts mean post-IPO cumulative abnormal returns (CARs) adjusted by equally-weighted market return from 1 month to 36 months after IPO of 315 government-controlled firms in China during 2001-2008, sorted by whether their chairmen are former or current government bureaucrats, deputies to NPC or members of CPPCC.
30
1 3 5 7 9 11 13 15 17 19 21 23 25 27 29 31 33 35
-0.20
-0.15
-0.10
-0.05
0.00
0.05
CA
R
Months after IPO
Family-controlled firms Firms with political connection Firms without political connection
Figure 3 family-controlled firms
Figure 3 describes mean post-IPO cumulative abnormal returns (CARs) adjusted by equally-weighted market return from 1 month to 36 months after IPO of 246 family-controlled firms in China during 2001-2008, sorted by whether their chairmen are former or current government bureaucrats, deputies to NPC or members of CPPCC.
1 3 5 7 9 11 13 15 17 19 21 23 25 27 29 31 33 35
-0.15
-0.10
-0.05
0.00
0.05
CA
R
Months after IPO
Firms with political connection Government-controlled firms with political connection Family-controlled firms with political connection
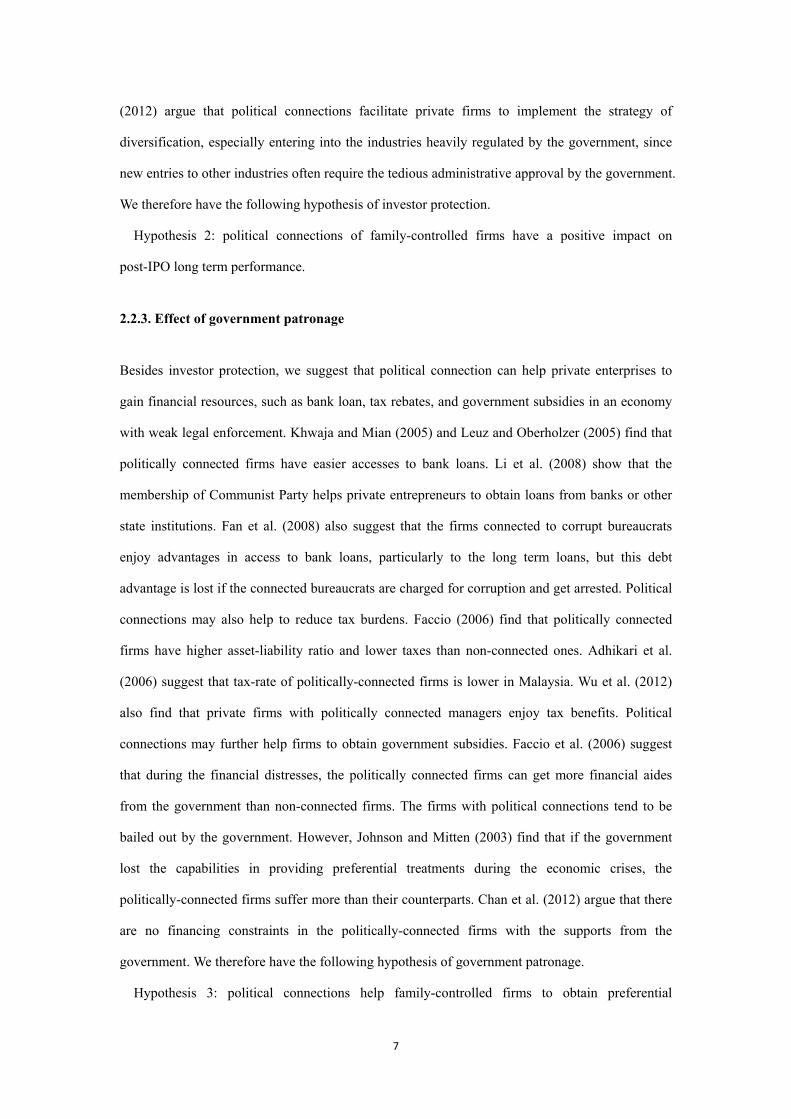
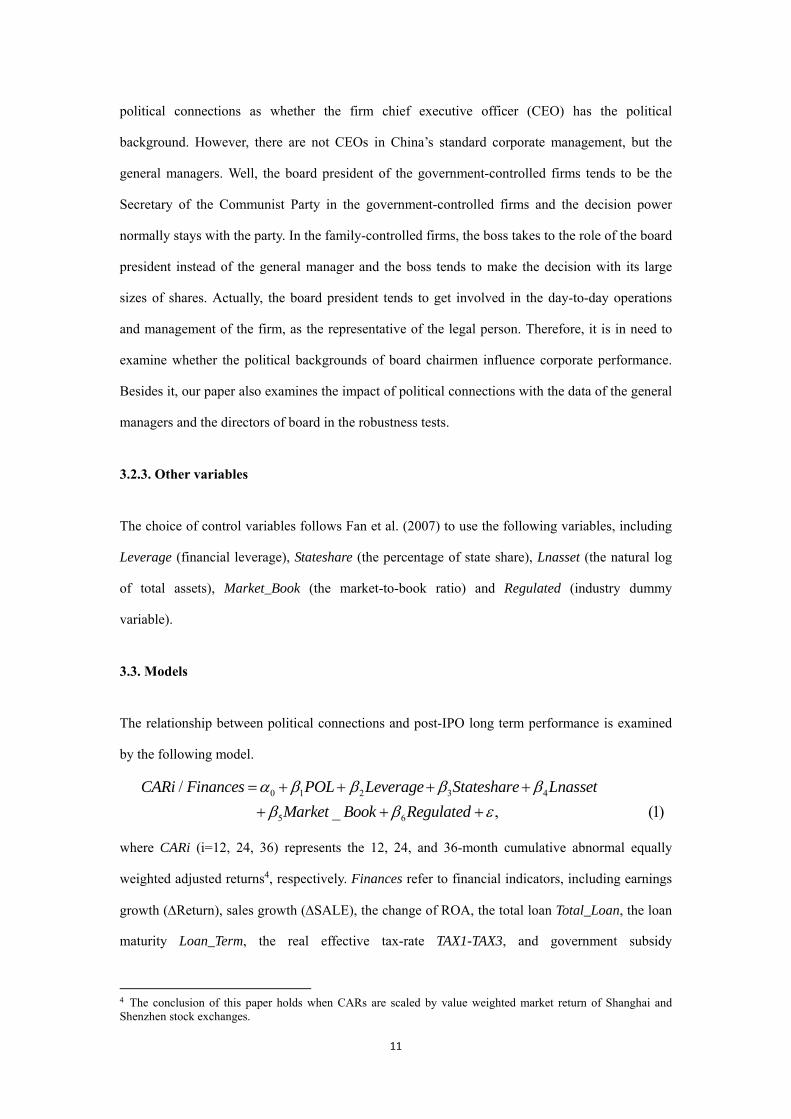
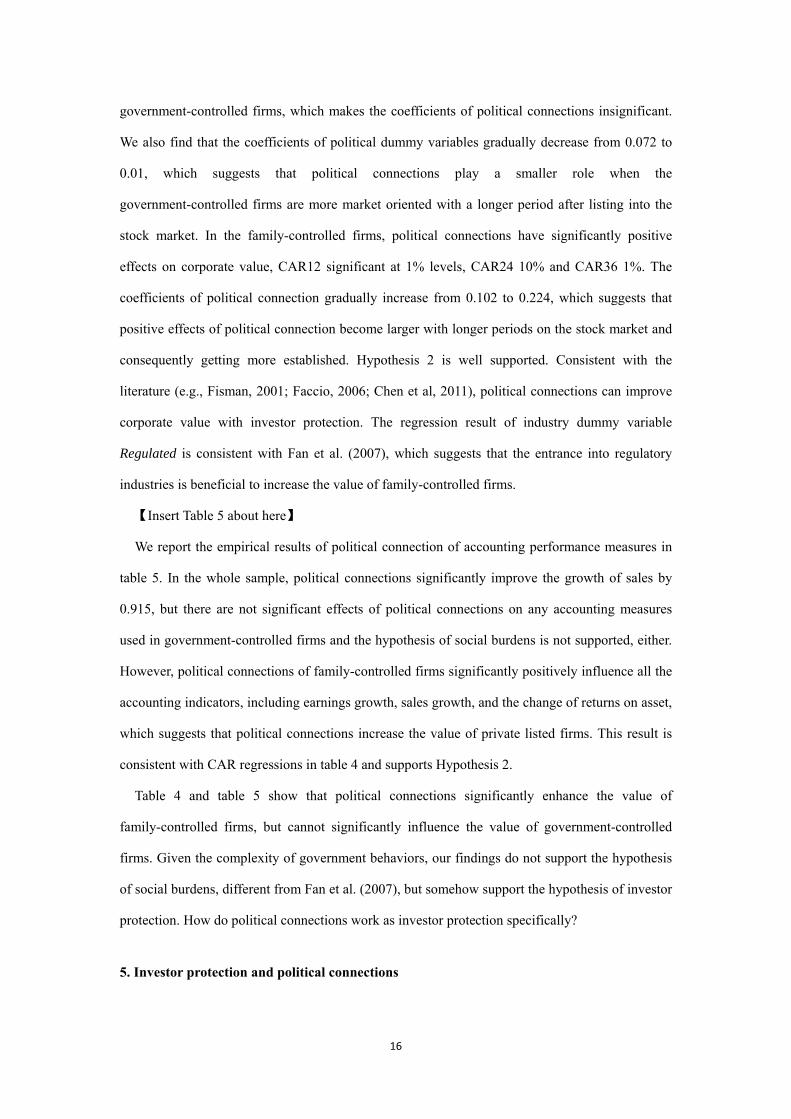
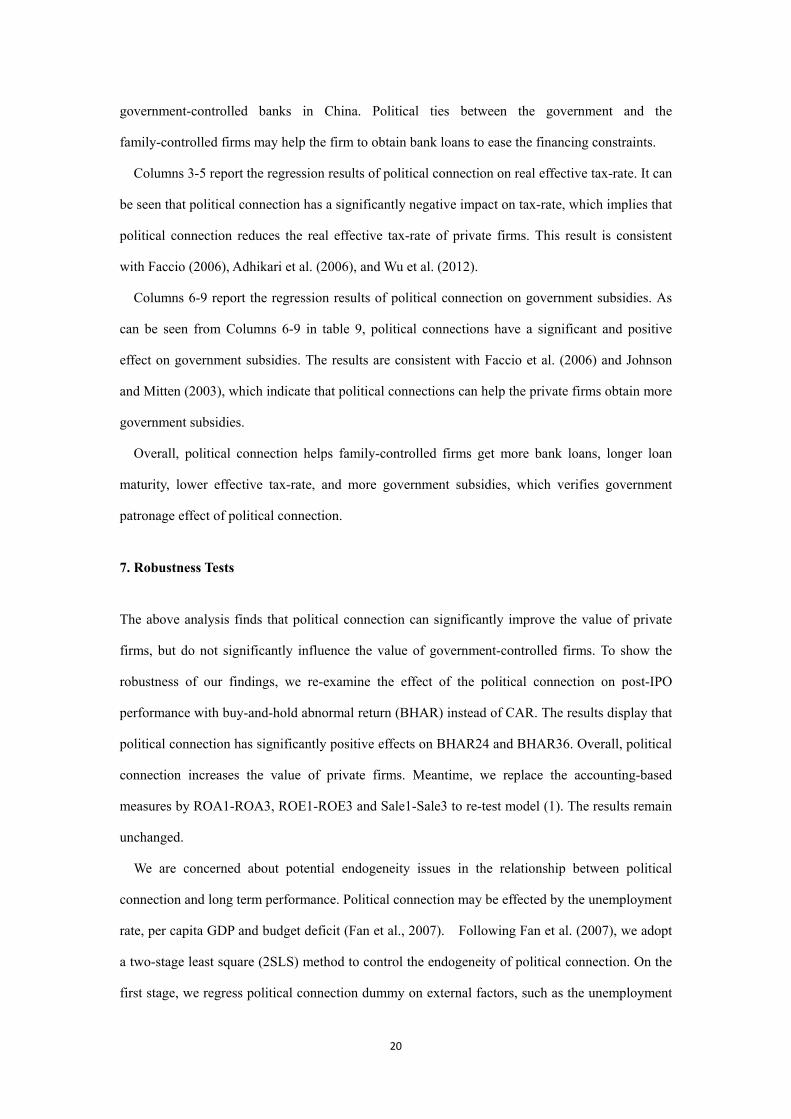
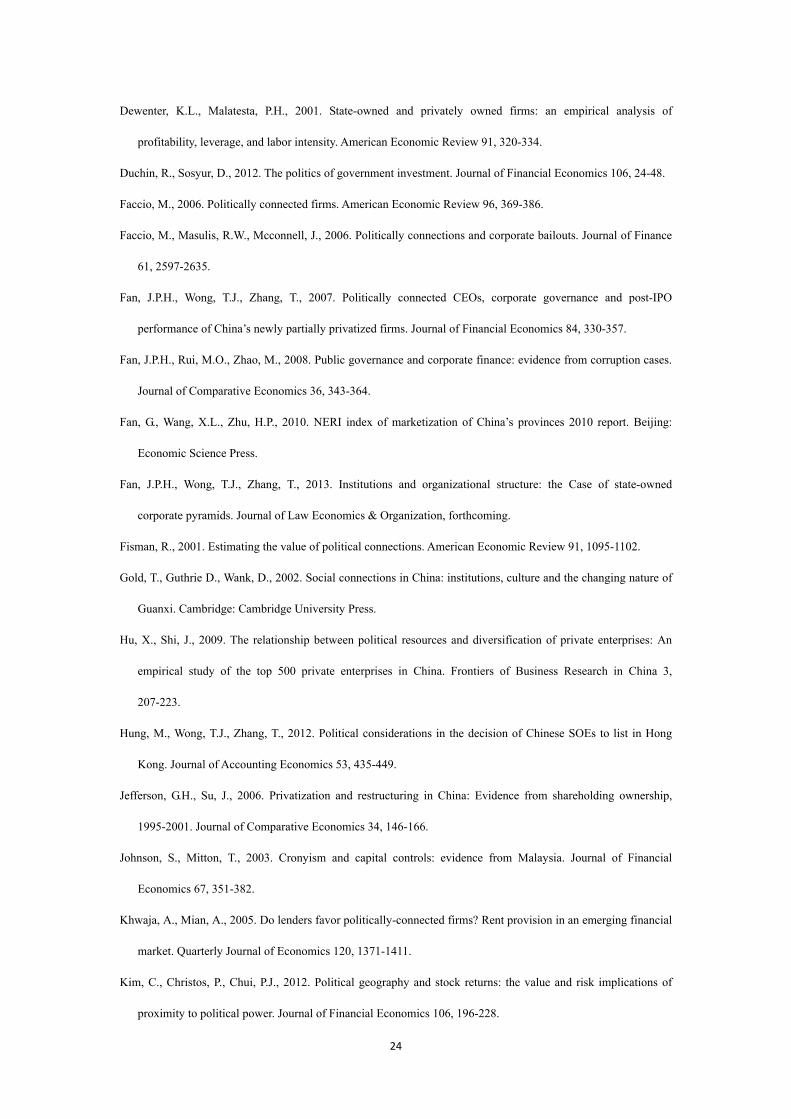
Figure 4 Politically-connected firms
Figure 4 describes mean post-IPO cumulative abnormal returns (CARs) adjusted by equally-weighted market return from 1 month to 36 months after IPO of 336 politically-connected firms in China during 2001-2008, sorted
31
by types of property right.
1 3 5 7 9 11 13 15 17 19 21 23 25 27 29 31 33 35
-0.20
-0.15
-0.10
-0.05
0.00C
AR
Months after IPO Firms without political connection Government-controlled firms without political connection Family-controlled firms without political connection
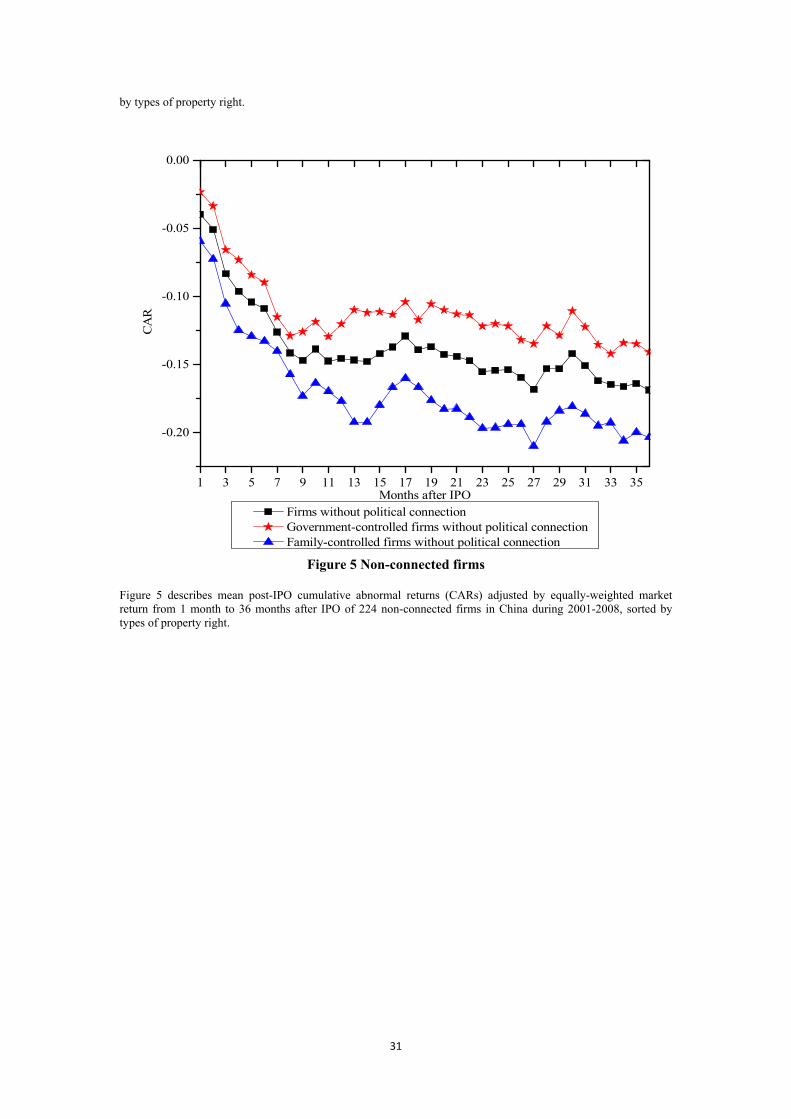
Figure 5 Non-connected firms
Figure 5 describes mean post-IPO cumulative abnormal returns (CARs) adjusted by equally-weighted market return from 1 month to 36 months after IPO of 224 non-connected firms in China during 2001-2008, sorted by types of property right.
32
Table 3 Mean and median statistics of post-IPO performance measure This paper presents the mean and median values of stock and accounting performance measures of IPO firms during 2001-2008. We divide the whole sample into government-controlled and family-controlled firms sort by types of the ultimate control owner. The paper also reports the statistics of two subsamples of firms sorted by whether their chairmen are former or current government bureaucrats, members of NPC or CPPCC. Stock performance measures are the 12-, 24-, 36-month CARs adjusted by equally-weighted market return from 2nd month after the IPO month. The accounting performance measures are earnings growth, sales growth, and the change in return on asset (ROA). Panel A, Panel B, and Panel C report total sample, government-controlled and family-controlled firms, respectively. Test statistics for difference in means and medians are provided. ***, **, * denote significant at the 1%, 5%, and 10% levels, respectively.
Performance measure
Mean Median
Total sample
President is politically connected
President is not politically
connected
Difference in mean
Total sample
President is politically connected
President is not politically
connected
Difference in median
Panel A: Total sample CAR12 -0.110 -0.057 -0.145 2.491** -0.093 -0.062 -0.115 1.969** CAR24 -0.113 -0.051 -0.154 2.352** -0.116 -0.086 -0.153 1.910* CAR36 -0.132 -0.076 -0.169 1.646 -0.169 -0.123 -0.178 1.259
Earn 1.388 1.844 1.080 0.960 0.007 0.161 -0.049 0.932 SALE 0.239 0.923 -0.204 3.356*** 0.103 0.343 0.063 2.865*** ROA 0.040 0.053 0.031 0.888 0.000 0.008 -0.002 0.836
Panel B: Government-controlled firms CAR12 -0.095 -0.059 -0.120 1.440 -0.084 -0.068 -0.111 0.801 CAR24 -0.117 -0.112 -0.120 0.147 -0.144 -0.116 -0.155 0.247 CAR36 -0.152 -0.168 -0.141 0.384 -0.195 -0.276 -0.174 0.682
Earn 1.426 1.140 1.623 -0.501 -0.036 0.001 -0.051 0.085 SALE 0.337 0.942 -0.051 2.177** 0.238 0.555 0.238 1.96* ROA 0.041 0.094 0.050 -0.068 -0.002 0.000 -0.003 0.020
Panel C: Family-controlled firms CAR12 -0.129 -0.054 -0.177 2.034** -0.096 -0.041 -0.143 1.938* CAR24 -0.108 0.030 -0.196 3.118*** -0.092 0.016 -0.132 2.639*** CAR36 -0.106 0.046 -0.203 2.824*** -0.132 0.030 -0.182 2.638***
Earn 1.330 2.978 0.245 1.996* 0.105 0.419 0.048 1.550 SALE 0.094 0.896 -0.433 2.715*** -0.129 0.007 -0.211 2.443** ROA 0.037 0.090 0.001 2.109** 0.005 0.019 0.002 1.536
33
Table 4 Regression results of the effects of political connection on the post-IPO stock performance The dependent variables reported in this table are the 12-, 24-, 36-month cumulative abnormal returns (CARs) adjusted by equally-weighted market return from the second month after the IPO month. Monthly returns are used to calculate the CARs. The independent variables are a dummy variable POL equal to 1 if the president is politically connected (zero otherwise), financial Leverage ratio Leverage, the percentage ownership of government Stateshare, the natural log of total assets Lnasset, the Market to book equity ratio Market_Book, and a dummy variable Regulated equal to one if the firm is in a heavily regulated sector (natural resources, public utilities, or finance and real estate). The regressions adopt ordinary least square methods. Robust t-statistics are provided in parentheses. ***, **, * denote significant at the 1%, 5%, and 10% levels, respectively.
Total sample Government-controlled firms Family-controlled firms CAR12 CAR24 CAR36 CAR12 CAR24 CAR36 CAR12 CAR24 CAR36 POL 0.088** 0.115** 0.121** 0.072 0.024 0.010 0.102* 0.206*** 0.224** (2.47) (2.55) (2.08) (1.64) (0.43) (0.13) (1.72) (2.80) (2.58) Leverage 0.015** 0.017** 0.020** 0.018** 0.007 -0.001 0.015 0.026** 0.036** (2.34) (2.54) (2.26) (2.27) (0.66) (-0.05) (1.59) (2.48) (2.38) Stateshare 0.034 0.018 0.001 0.056 0.046 0.028 -0.617*** -0.571** -0.781*** (0.97) (0.45) (0.02) (1.36) (1.00) (0.34) (-2.73) (-2.19) (-2.91) Lnasset -0.002 -0.022 -0.055*** 0.001 -0.012 -0.042* -0.015 -0.032 -0.087 (-0.13) (-1.43) (-2.68) (0.07) (-0.75) (-1.88) (-0.32) (-0.63) (-1.37) Market_Book -0.002 -0.009 0.003 0.009 -0.018 -0.011 -0.011 0.003 0.022 (-0.26) (-1.12) (0.35) (0.97) (-1.63) (-0.80) (-0.84) (0.25) (1.57) Regulated 0.071* 0.048 0.094 0.021 -0.025 -0.017 0.162** 0.222** 0.359*** (1.74) (1.01) (1.42) (0.45) (-0.45) (-0.22) (2.01) (2.44) (3.18) Intercept -0.187 0.247 0.862** -0.278 0.159 0.777* 0.125 0.334 1.320 (-0.68) (0.78) (2.01) (-0.94) (0.47) (1.66) (0.12) (0.31) (0.98) N 561 561 560 315 315 314 246 246 246 adj. R2 0.020 0.019 0.025 0.011 -0.000 0.001 0.041 0.069 0.101 F 2.849 3.185 3.003 1.600 1.164 1.114 3.700 4.835 6.369
(1) (2) (3) (4) (5) (6) (7) (8) (9)
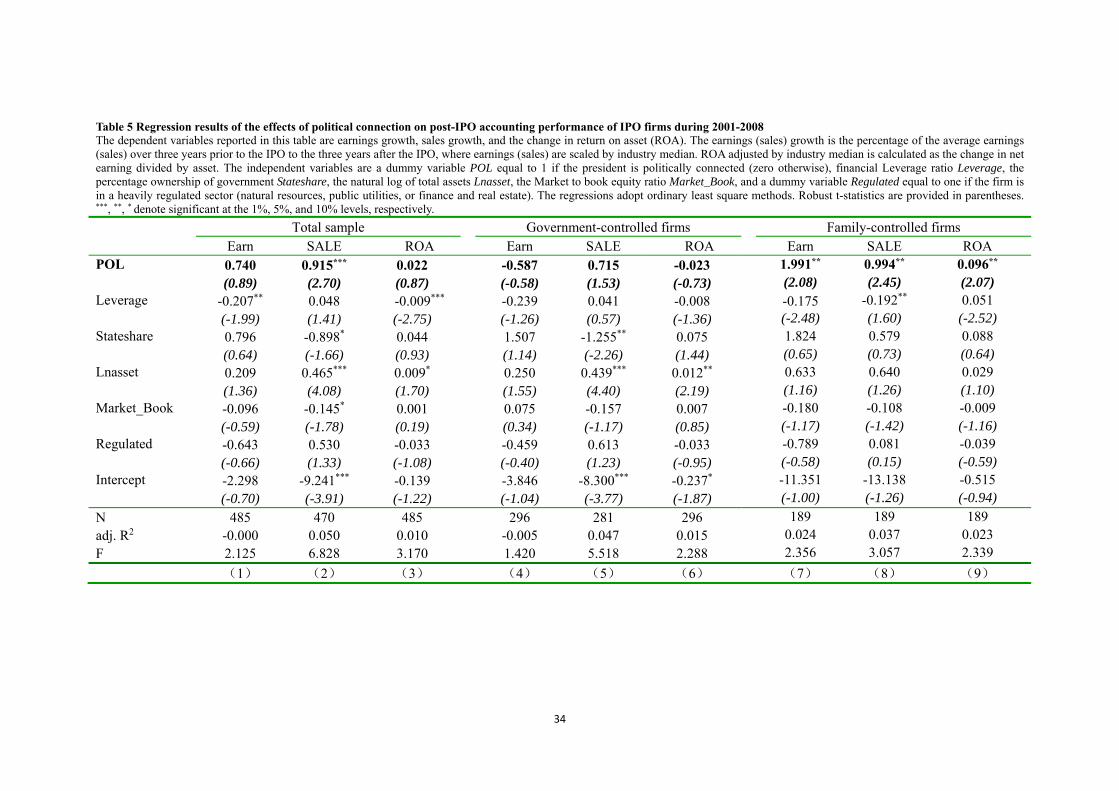
34
Table 5 Regression results of the effects of political connection on post-IPO accounting performance of IPO firms during 2001-2008 The dependent variables reported in this table are earnings growth, sales growth, and the change in return on asset (ROA). The earnings (sales) growth is the percentage of the average earnings (sales) over three years prior to the IPO to the three years after the IPO, where earnings (sales) are scaled by industry median. ROA adjusted by industry median is calculated as the change in net earning divided by asset. The independent variables are a dummy variable POL equal to 1 if the president is politically connected (zero otherwise), financial Leverage ratio Leverage, the percentage ownership of government Stateshare, the natural log of total assets Lnasset, the Market to book equity ratio Market_Book, and a dummy variable Regulated equal to one if the firm is in a heavily regulated sector (natural resources, public utilities, or finance and real estate). The regressions adopt ordinary least square methods. Robust t-statistics are provided in parentheses. ***, **, * denote significant at the 1%, 5%, and 10% levels, respectively.
Total sample Government-controlled firms Family-controlled firms Earn SALE ROA Earn SALE ROA Earn SALE ROA POL 0.740 0.915*** 0.022 -0.587 0.715 -0.023 1.991** 0.994** 0.096** (0.89) (2.70) (0.87) (-0.58) (1.53) (-0.73) (2.08) (2.45) (2.07) Leverage -0.207** 0.048 -0.009*** -0.239 0.041 -0.008 -0.175 -0.192** 0.051 (-1.99) (1.41) (-2.75) (-1.26) (0.57) (-1.36) (-2.48) (1.60) (-2.52) Stateshare 0.796 -0.898* 0.044 1.507 -1.255** 0.075 1.824 0.579 0.088 (0.64) (-1.66) (0.93) (1.14) (-2.26) (1.44) (0.65) (0.73) (0.64) Lnasset 0.209 0.465*** 0.009* 0.250 0.439*** 0.012** 0.633 0.640 0.029 (1.36) (4.08) (1.70) (1.55) (4.40) (2.19) (1.16) (1.26) (1.10) Market_Book -0.096 -0.145* 0.001 0.075 -0.157 0.007 -0.180 -0.108 -0.009 (-0.59) (-1.78) (0.19) (0.34) (-1.17) (0.85) (-1.17) (-1.42) (-1.16) Regulated -0.643 0.530 -0.033 -0.459 0.613 -0.033 -0.789 0.081 -0.039 (-0.66) (1.33) (-1.08) (-0.40) (1.23) (-0.95) (-0.58) (0.15) (-0.59) Intercept -2.298 -9.241*** -0.139 -3.846 -8.300*** -0.237* -11.351 -13.138 -0.515 (-0.70) (-3.91) (-1.22) (-1.04) (-3.77) (-1.87) (-1.00) (-1.26) (-0.94)
N 485 470 485 296 281 296 189 189 189 adj. R2 -0.000 0.050 0.010 -0.005 0.047 0.015 0.024 0.037 0.023 F 2.125 6.828 3.170 1.420 5.518 2.288 2.356 3.057 2.339
(1) (2) (3) (4) (5) (6) (7) (8) (9)
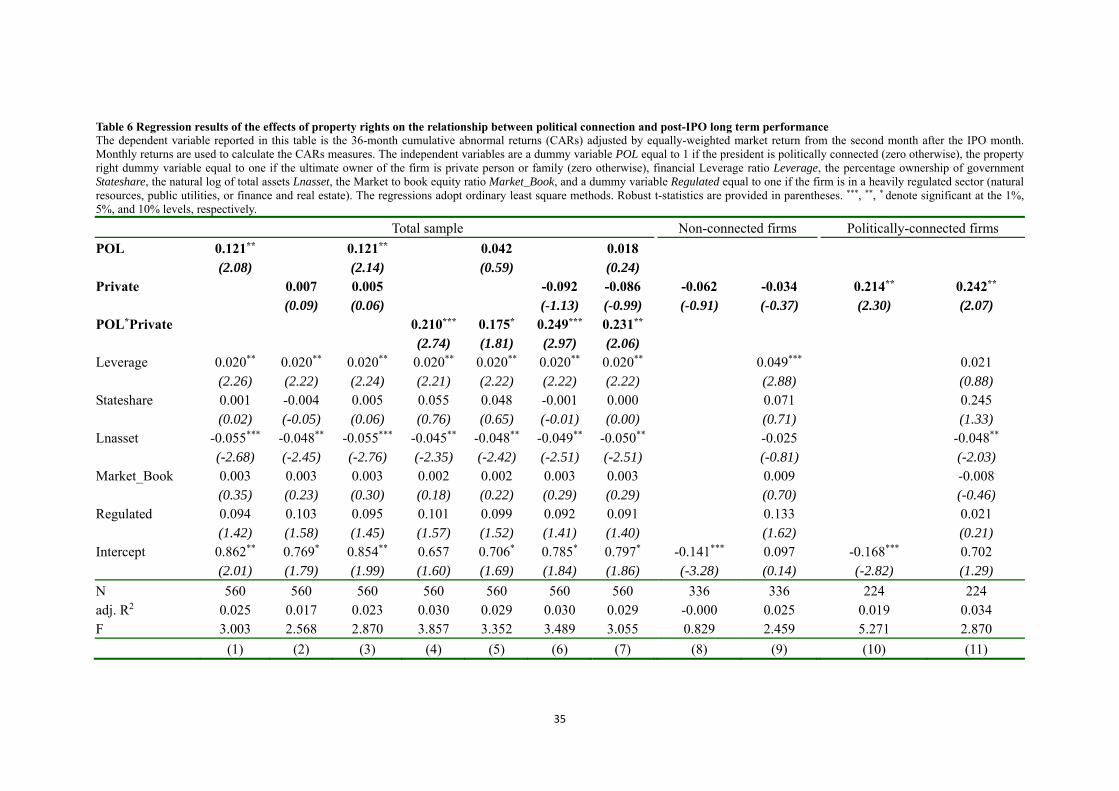
35
Table 6 Regression results of the effects of property rights on the relationship between political connection and post-IPO long term performance The dependent variable reported in this table is the 36-month cumulative abnormal returns (CARs) adjusted by equally-weighted market return from the second month after the IPO month. Monthly returns are used to calculate the CARs measures. The independent variables are a dummy variable POL equal to 1 if the president is politically connected (zero otherwise), the property right dummy variable equal to one if the ultimate owner of the firm is private person or family (zero otherwise), financial Leverage ratio Leverage, the percentage ownership of government Stateshare, the natural log of total assets Lnasset, the Market to book equity ratio Market_Book, and a dummy variable Regulated equal to one if the firm is in a heavily regulated sector (natural resources, public utilities, or finance and real estate). The regressions adopt ordinary least square methods. Robust t-statistics are provided in parentheses. ***, **, * denote significant at the 1%, 5%, and 10% levels, respectively.
Total sample Non-connected firms Politically-connected firms
POL 0.121** 0.121** 0.042 0.018 (2.08) (2.14) (0.59) (0.24) Private 0.007 0.005 -0.092 -0.086 -0.062 -0.034 0.214** 0.242** (0.09) (0.06) (-1.13) (-0.99) (-0.91) (-0.37) (2.30) (2.07) POL*Private 0.210*** 0.175* 0.249*** 0.231** (2.74) (1.81) (2.97) (2.06) Leverage 0.020** 0.020** 0.020** 0.020** 0.020** 0.020** 0.020** 0.049*** 0.021 (2.26) (2.22) (2.24) (2.21) (2.22) (2.22) (2.22) (2.88) (0.88) Stateshare 0.001 -0.004 0.005 0.055 0.048 -0.001 0.000 0.071 0.245 (0.02) (-0.05) (0.06) (0.76) (0.65) (-0.01) (0.00) (0.71) (1.33) Lnasset -0.055*** -0.048** -0.055*** -0.045** -0.048** -0.049** -0.050** -0.025 -0.048** (-2.68) (-2.45) (-2.76) (-2.35) (-2.42) (-2.51) (-2.51) (-0.81) (-2.03) Market_Book 0.003 0.003 0.003 0.002 0.002 0.003 0.003 0.009 -0.008 (0.35) (0.23) (0.30) (0.18) (0.22) (0.29) (0.29) (0.70) (-0.46) Regulated 0.094 0.103 0.095 0.101 0.099 0.092 0.091 0.133 0.021 (1.42) (1.58) (1.45) (1.57) (1.52) (1.41) (1.40) (1.62) (0.21) Intercept 0.862** 0.769* 0.854** 0.657 0.706* 0.785* 0.797* -0.141*** 0.097 -0.168*** 0.702 (2.01) (1.79) (1.99) (1.60) (1.69) (1.84) (1.86) (-3.28) (0.14) (-2.82) (1.29)
N 560 560 560 560 560 560 560 336 336 224 224 adj. R2 0.025 0.017 0.023 0.030 0.029 0.030 0.029 -0.000 0.025 0.019 0.034 F 3.003 2.568 2.870 3.857 3.352 3.489 3.055 0.829 2.459 5.271 2.870
(1) (2) (3) (4) (5) (6) (7) (8) (9) (10) (11)
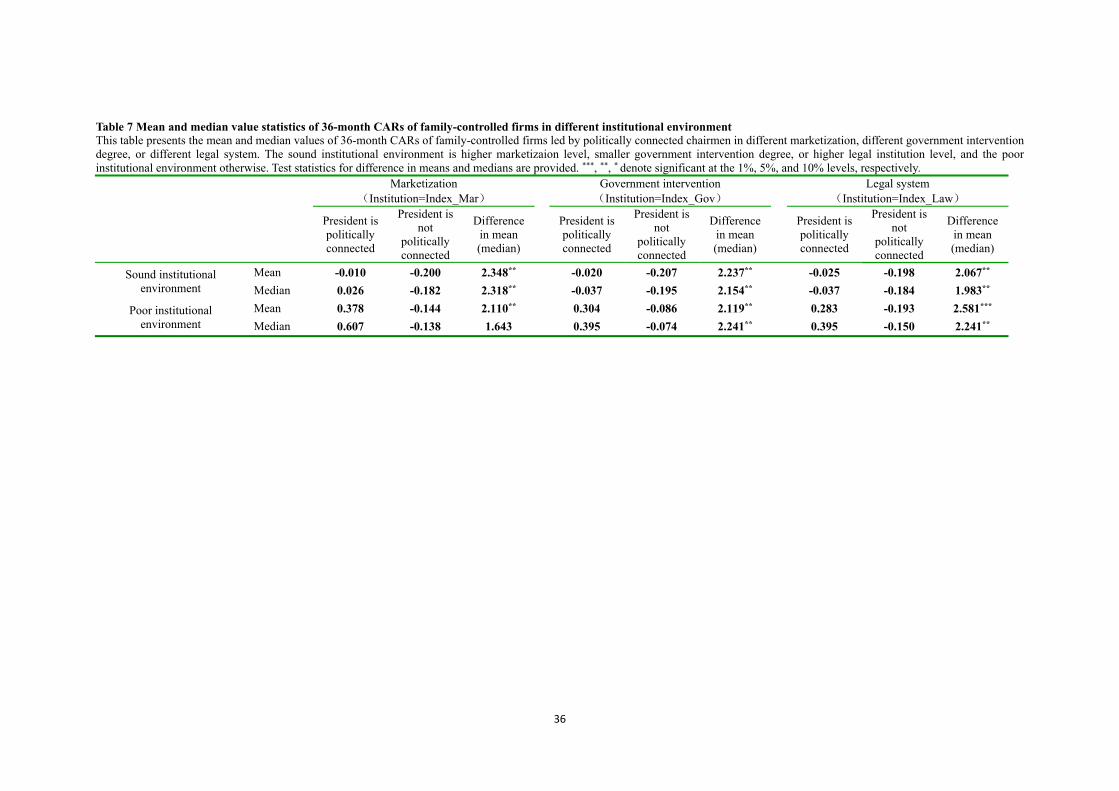
36
Table 7 Mean and median value statistics of 36-month CARs of family-controlled firms in different institutional environment This table presents the mean and median values of 36-month CARs of family-controlled firms led by politically connected chairmen in different marketization, different government intervention degree, or different legal system. The sound institutional environment is higher marketizaion level, smaller government intervention degree, or higher legal institution level, and the poor institutional environment otherwise. Test statistics for difference in means and medians are provided. ***, **, * denote significant at the 1%, 5%, and 10% levels, respectively.
Marketization
(Institution=Index_Mar) Government intervention
(Institution=Index_Gov) Legal system
(Institution=Index_Law)
President is politically connected
President is not
politically connected
Difference in mean (median)
President is politically connected
President is not
politically connected
Difference in mean (median)
President is politically connected
President is not
politically connected
Difference in mean (median)
Sound institutional environment
Mean -0.010 -0.200 2.348** -0.020 -0.207 2.237** -0.025 -0.198 2.067**
Median 0.026 -0.182 2.318** -0.037 -0.195 2.154** -0.037 -0.184 1.983**
Poor institutional environment
Mean 0.378 -0.144 2.110** 0.304 -0.086 2.119** 0.283 -0.193 2.581***
Median 0.607 -0.138 1.643 0.395 -0.074 2.241** 0.395 -0.150 2.241**
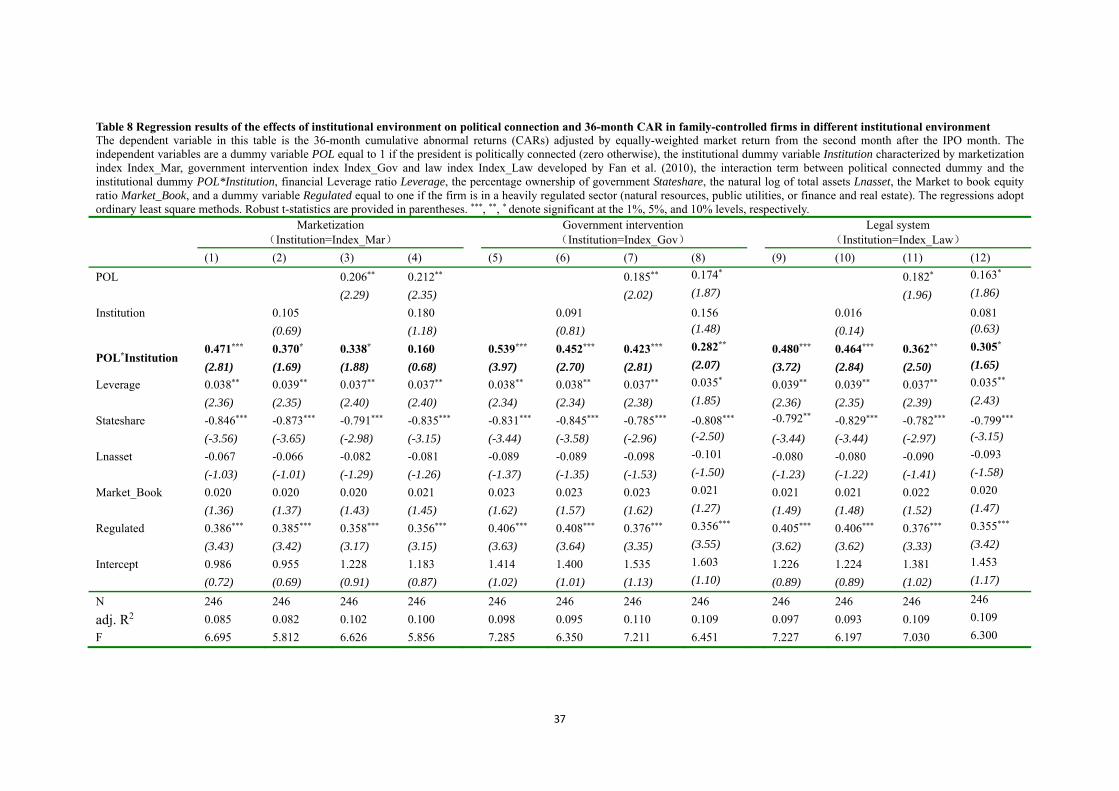
37
Table 8 Regression results of the effects of institutional environment on political connection and 36-month CAR in family-controlled firms in different institutional environment The dependent variable in this table is the 36-month cumulative abnormal returns (CARs) adjusted by equally-weighted market return from the second month after the IPO month. The independent variables are a dummy variable POL equal to 1 if the president is politically connected (zero otherwise), the institutional dummy variable Institution characterized by marketization index Index_Mar, government intervention index Index_Gov and law index Index_Law developed by Fan et al. (2010), the interaction term between political connected dummy and the institutional dummy POL*Institution, financial Leverage ratio Leverage, the percentage ownership of government Stateshare, the natural log of total assets Lnasset, the Market to book equity ratio Market_Book, and a dummy variable Regulated equal to one if the firm is in a heavily regulated sector (natural resources, public utilities, or finance and real estate). The regressions adopt ordinary least square methods. Robust t-statistics are provided in parentheses. ***, **, * denote significant at the 1%, 5%, and 10% levels, respectively.
Marketization
(Institution=Index_Mar) Government intervention
(Institution=Index_Gov) Legal system
(Institution=Index_Law)
(1) (2) (3) (4) (5) (6) (7) (8) (9) (10) (11) (12)
POL 0.206** 0.212** 0.185** 0.174* 0.182* 0.163*
(2.29) (2.35) (2.02) (1.87) (1.96) (1.86)
Institution 0.105 0.180 0.091 0.156 0.016 0.081
(0.69) (1.18) (0.81) (1.48) (0.14) (0.63)
POL*Institution 0.471*** 0.370* 0.338* 0.160 0.539*** 0.452*** 0.423*** 0.282** 0.480*** 0.464*** 0.362** 0.305*
(2.81) (1.69) (1.88) (0.68) (3.97) (2.70) (2.81) (2.07) (3.72) (2.84) (2.50) (1.65)
Leverage 0.038** 0.039** 0.037** 0.037** 0.038** 0.038** 0.037** 0.035* 0.039** 0.039** 0.037** 0.035**
(2.36) (2.35) (2.40) (2.40) (2.34) (2.34) (2.38) (1.85) (2.36) (2.35) (2.39) (2.43)
Stateshare -0.846*** -0.873*** -0.791*** -0.835*** -0.831*** -0.845*** -0.785*** -0.808*** -0.792** -0.829*** -0.782*** -0.799***
(-3.56) (-3.65) (-2.98) (-3.15) (-3.44) (-3.58) (-2.96) (-2.50) (-3.44) (-3.44) (-2.97) (-3.15)
Lnasset -0.067 -0.066 -0.082 -0.081 -0.089 -0.089 -0.098 -0.101 -0.080 -0.080 -0.090 -0.093
(-1.03) (-1.01) (-1.29) (-1.26) (-1.37) (-1.35) (-1.53) (-1.50) (-1.23) (-1.22) (-1.41) (-1.58)
Market_Book 0.020 0.020 0.020 0.021 0.023 0.023 0.023 0.021 0.021 0.021 0.022 0.020
(1.36) (1.37) (1.43) (1.45) (1.62) (1.57) (1.62) (1.27) (1.49) (1.48) (1.52) (1.47)
Regulated 0.386*** 0.385*** 0.358*** 0.356*** 0.406*** 0.408*** 0.376*** 0.356*** 0.405*** 0.406*** 0.376*** 0.355***
(3.43) (3.42) (3.17) (3.15) (3.63) (3.64) (3.35) (3.55) (3.62) (3.62) (3.33) (3.42)
Intercept 0.986 0.955 1.228 1.183 1.414 1.400 1.535 1.603 1.226 1.224 1.381 1.453
(0.72) (0.69) (0.91) (0.87) (1.02) (1.01) (1.13) (1.10) (0.89) (0.89) (1.02) (1.17)
N 246 246 246 246 246 246 246 246 246 246 246 246
adj. R2 0.085 0.082 0.102 0.100 0.098 0.095 0.110 0.109 0.097 0.093 0.109 0.109
F 6.695 5.812 6.626 5.856 7.285 6.350 7.211 6.451 7.227 6.197 7.030 6.300
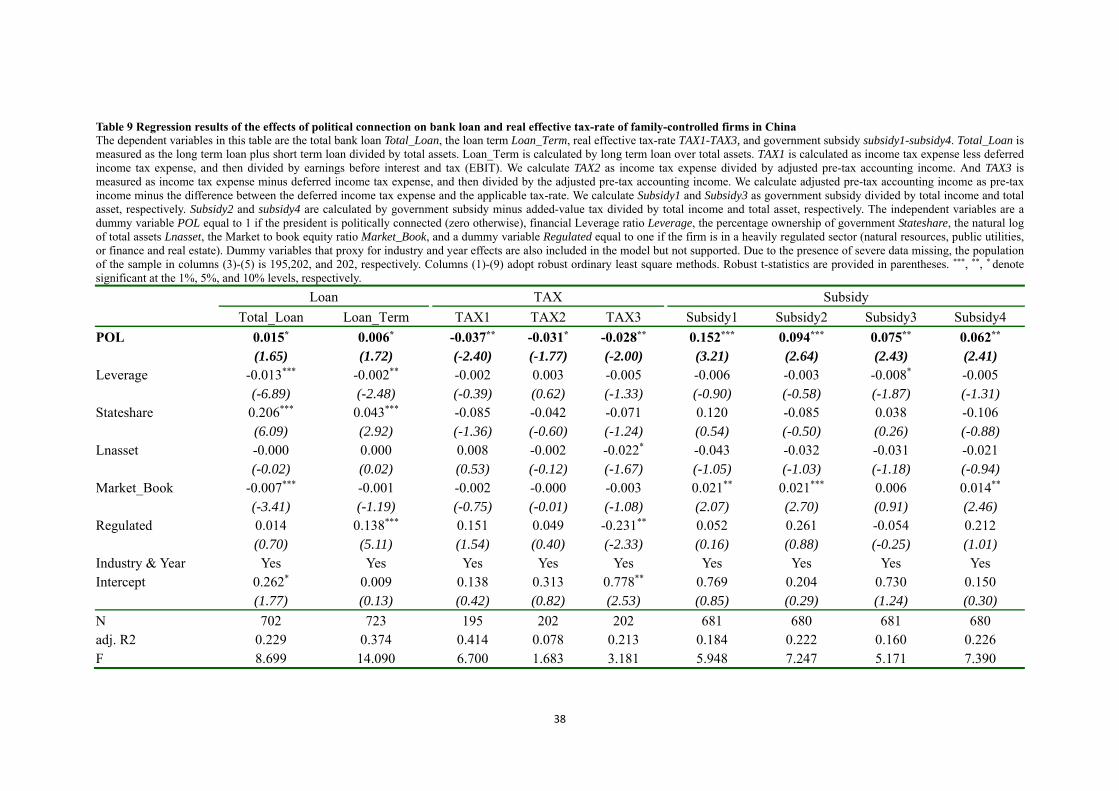
38
Table 9 Regression results of the effects of political connection on bank loan and real effective tax-rate of family-controlled firms in China The dependent variables in this table are the total bank loan Total_Loan, the loan term Loan_Term, real effective tax-rate TAX1-TAX3, and government subsidy subsidy1-subsidy4. Total_Loan is measured as the long term loan plus short term loan divided by total assets. Loan_Term is calculated by long term loan over total assets. TAX1 is calculated as income tax expense less deferred income tax expense, and then divided by earnings before interest and tax (EBIT). We calculate TAX2 as income tax expense divided by adjusted pre-tax accounting income. And TAX3 is measured as income tax expense minus deferred income tax expense, and then divided by the adjusted pre-tax accounting income. We calculate adjusted pre-tax accounting income as pre-tax income minus the difference between the deferred income tax expense and the applicable tax-rate. We calculate Subsidy1 and Subsidy3 as government subsidy divided by total income and total asset, respectively. Subsidy2 and subsidy4 are calculated by government subsidy minus added-value tax divided by total income and total asset, respectively. The independent variables are a dummy variable POL equal to 1 if the president is politically connected (zero otherwise), financial Leverage ratio Leverage, the percentage ownership of government Stateshare, the natural log of total assets Lnasset, the Market to book equity ratio Market_Book, and a dummy variable Regulated equal to one if the firm is in a heavily regulated sector (natural resources, public utilities, or finance and real estate). Dummy variables that proxy for industry and year effects are also included in the model but not supported. Due to the presence of severe data missing, the population of the sample in columns (3)-(5) is 195,202, and 202, respectively. Columns (1)-(9) adopt robust ordinary least square methods. Robust t-statistics are provided in parentheses. ***, **, * denote significant at the 1%, 5%, and 10% levels, respectively.
Loan TAX Subsidy
Total_Loan Loan_Term TAX1 TAX2 TAX3 Subsidy1 Subsidy2 Subsidy3 Subsidy4
POL 0.015* 0.006* -0.037** -0.031* -0.028** 0.152*** 0.094*** 0.075** 0.062** (1.65) (1.72) (-2.40) (-1.77) (-2.00) (3.21) (2.64) (2.43) (2.41) Leverage -0.013*** -0.002** -0.002 0.003 -0.005 -0.006 -0.003 -0.008* -0.005 (-6.89) (-2.48) (-0.39) (0.62) (-1.33) (-0.90) (-0.58) (-1.87) (-1.31) Stateshare 0.206*** 0.043*** -0.085 -0.042 -0.071 0.120 -0.085 0.038 -0.106 (6.09) (2.92) (-1.36) (-0.60) (-1.24) (0.54) (-0.50) (0.26) (-0.88) Lnasset -0.000 0.000 0.008 -0.002 -0.022* -0.043 -0.032 -0.031 -0.021 (-0.02) (0.02) (0.53) (-0.12) (-1.67) (-1.05) (-1.03) (-1.18) (-0.94) Market_Book -0.007*** -0.001 -0.002 -0.000 -0.003 0.021** 0.021*** 0.006 0.014** (-3.41) (-1.19) (-0.75) (-0.01) (-1.08) (2.07) (2.70) (0.91) (2.46) Regulated 0.014 0.138*** 0.151 0.049 -0.231** 0.052 0.261 -0.054 0.212 (0.70) (5.11) (1.54) (0.40) (-2.33) (0.16) (0.88) (-0.25) (1.01) Industry & Year Yes Yes Yes Yes Yes Yes Yes Yes Yes Intercept 0.262* 0.009 0.138 0.313 0.778** 0.769 0.204 0.730 0.150 (1.77) (0.13) (0.42) (0.82) (2.53) (0.85) (0.29) (1.24) (0.30)
N 702 723 195 202 202 681 680 681 680 adj. R2 0.229 0.374 0.414 0.078 0.213 0.184 0.222 0.160 0.226 F 8.699 14.090 6.700 1.683 3.181 5.948 7.247 5.171 7.390
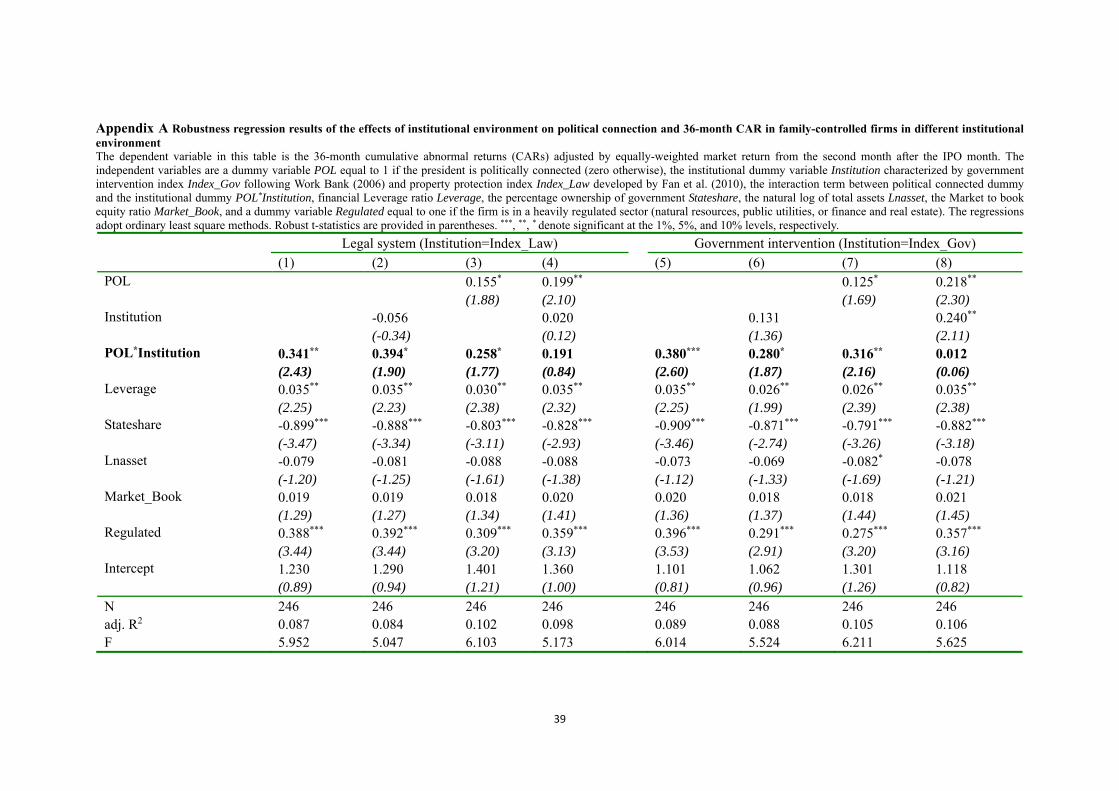
39
Appendix A Robustness regression results of the effects of institutional environment on political connection and 36-month CAR in family-controlled firms in different institutional environment The dependent variable in this table is the 36-month cumulative abnormal returns (CARs) adjusted by equally-weighted market return from the second month after the IPO month. The independent variables are a dummy variable POL equal to 1 if the president is politically connected (zero otherwise), the institutional dummy variable Institution characterized by government intervention index Index_Gov following Work Bank (2006) and property protection index Index_Law developed by Fan et al. (2010), the interaction term between political connected dummy and the institutional dummy POL*Institution, financial Leverage ratio Leverage, the percentage ownership of government Stateshare, the natural log of total assets Lnasset, the Market to book equity ratio Market_Book, and a dummy variable Regulated equal to one if the firm is in a heavily regulated sector (natural resources, public utilities, or finance and real estate). The regressions adopt ordinary least square methods. Robust t-statistics are provided in parentheses. ***, **, * denote significant at the 1%, 5%, and 10% levels, respectively.
Legal system (Institution=Index_Law) Government intervention (Institution=Index_Gov) (1) (2) (3) (4) (5) (6) (7) (8) POL 0.155* 0.199** 0.125* 0.218** (1.88) (2.10) (1.69) (2.30) Institution -0.056 0.020 0.131 0.240** (-0.34) (0.12) (1.36) (2.11) POL*Institution 0.341** 0.394* 0.258* 0.191 0.380*** 0.280* 0.316** 0.012 (2.43) (1.90) (1.77) (0.84) (2.60) (1.87) (2.16) (0.06) Leverage 0.035** 0.035** 0.030** 0.035** 0.035** 0.026** 0.026** 0.035** (2.25) (2.23) (2.38) (2.32) (2.25) (1.99) (2.39) (2.38) Stateshare -0.899*** -0.888*** -0.803*** -0.828*** -0.909*** -0.871*** -0.791*** -0.882*** (-3.47) (-3.34) (-3.11) (-2.93) (-3.46) (-2.74) (-3.26) (-3.18) Lnasset -0.079 -0.081 -0.088 -0.088 -0.073 -0.069 -0.082* -0.078 (-1.20) (-1.25) (-1.61) (-1.38) (-1.12) (-1.33) (-1.69) (-1.21) Market_Book 0.019 0.019 0.018 0.020 0.020 0.018 0.018 0.021 (1.29) (1.27) (1.34) (1.41) (1.36) (1.37) (1.44) (1.45) Regulated 0.388*** 0.392*** 0.309*** 0.359*** 0.396*** 0.291*** 0.275*** 0.357*** (3.44) (3.44) (3.20) (3.13) (3.53) (2.91) (3.20) (3.16) Intercept 1.230 1.290 1.401 1.360 1.101 1.062 1.301 1.118 (0.89) (0.94) (1.21) (1.00) (0.81) (0.96) (1.26) (0.82) N 246 246 246 246 246 246 246 246 adj. R2 0.087 0.084 0.102 0.098 0.089 0.088 0.105 0.106 F 5.952 5.047 6.103 5.173 6.014 5.524 6.211 5.625
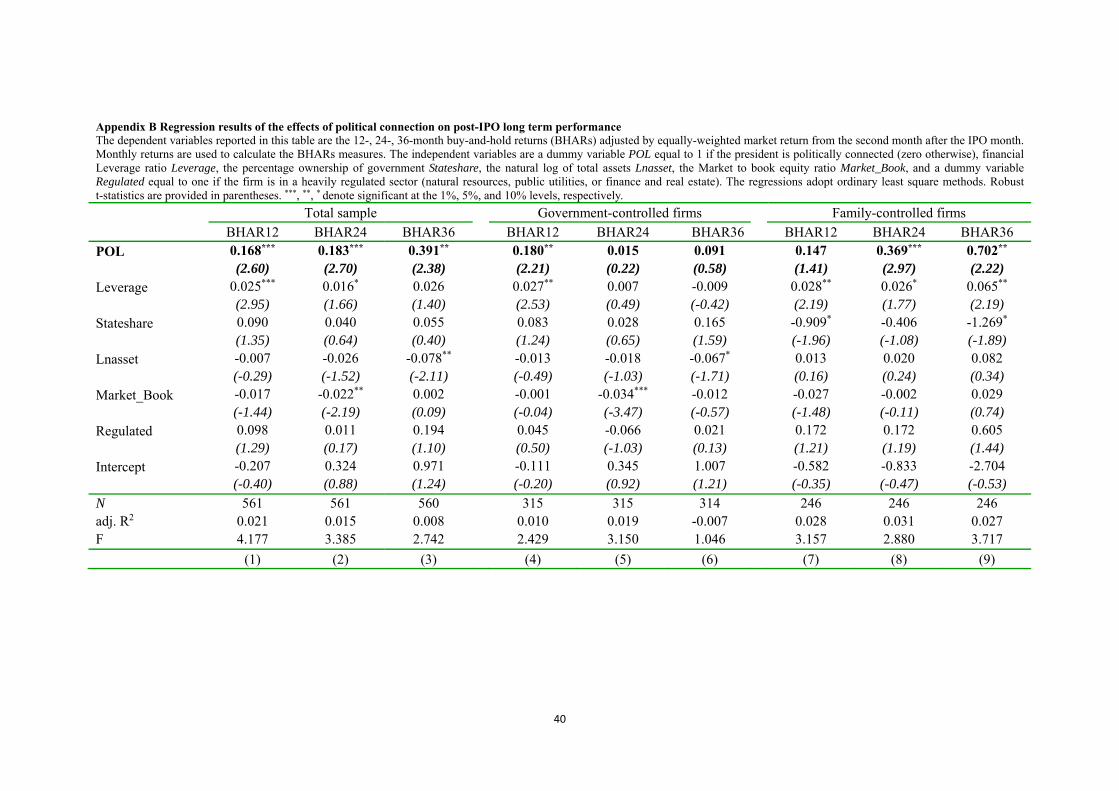
40
Appendix B Regression results of the effects of political connection on post-IPO long term performance The dependent variables reported in this table are the 12-, 24-, 36-month buy-and-hold returns (BHARs) adjusted by equally-weighted market return from the second month after the IPO month. Monthly returns are used to calculate the BHARs measures. The independent variables are a dummy variable POL equal to 1 if the president is politically connected (zero otherwise), financial Leverage ratio Leverage, the percentage ownership of government Stateshare, the natural log of total assets Lnasset, the Market to book equity ratio Market_Book, and a dummy variable Regulated equal to one if the firm is in a heavily regulated sector (natural resources, public utilities, or finance and real estate). The regressions adopt ordinary least square methods. Robust t-statistics are provided in parentheses. ***, **, * denote significant at the 1%, 5%, and 10% levels, respectively.
Total sample Government-controlled firms Family-controlled firms BHAR12 BHAR24 BHAR36 BHAR12 BHAR24 BHAR36 BHAR12 BHAR24 BHAR36 POL 0.168*** 0.183*** 0.391** 0.180** 0.015 0.091 0.147 0.369*** 0.702** (2.60) (2.70) (2.38) (2.21) (0.22) (0.58) (1.41) (2.97) (2.22) Leverage 0.025*** 0.016* 0.026 0.027** 0.007 -0.009 0.028** 0.026* 0.065** (2.95) (1.66) (1.40) (2.53) (0.49) (-0.42) (2.19) (1.77) (2.19) Stateshare 0.090 0.040 0.055 0.083 0.028 0.165 -0.909* -0.406 -1.269* (1.35) (0.64) (0.40) (1.24) (0.65) (1.59) (-1.96) (-1.08) (-1.89) Lnasset -0.007 -0.026 -0.078** -0.013 -0.018 -0.067* 0.013 0.020 0.082 (-0.29) (-1.52) (-2.11) (-0.49) (-1.03) (-1.71) (0.16) (0.24) (0.34) Market_Book -0.017 -0.022** 0.002 -0.001 -0.034*** -0.012 -0.027 -0.002 0.029 (-1.44) (-2.19) (0.09) (-0.04) (-3.47) (-0.57) (-1.48) (-0.11) (0.74) Regulated 0.098 0.011 0.194 0.045 -0.066 0.021 0.172 0.172 0.605 (1.29) (0.17) (1.10) (0.50) (-1.03) (0.13) (1.21) (1.19) (1.44) Intercept -0.207 0.324 0.971 -0.111 0.345 1.007 -0.582 -0.833 -2.704 (-0.40) (0.88) (1.24) (-0.20) (0.92) (1.21) (-0.35) (-0.47) (-0.53) N 561 561 560 315 315 314 246 246 246 adj. R2 0.021 0.015 0.008 0.010 0.019 -0.007 0.028 0.031 0.027 F 4.177 3.385 2.742 2.429 3.150 1.046 3.157 2.880 3.717
(1) (2) (3) (4) (5) (6) (7) (8) (9)
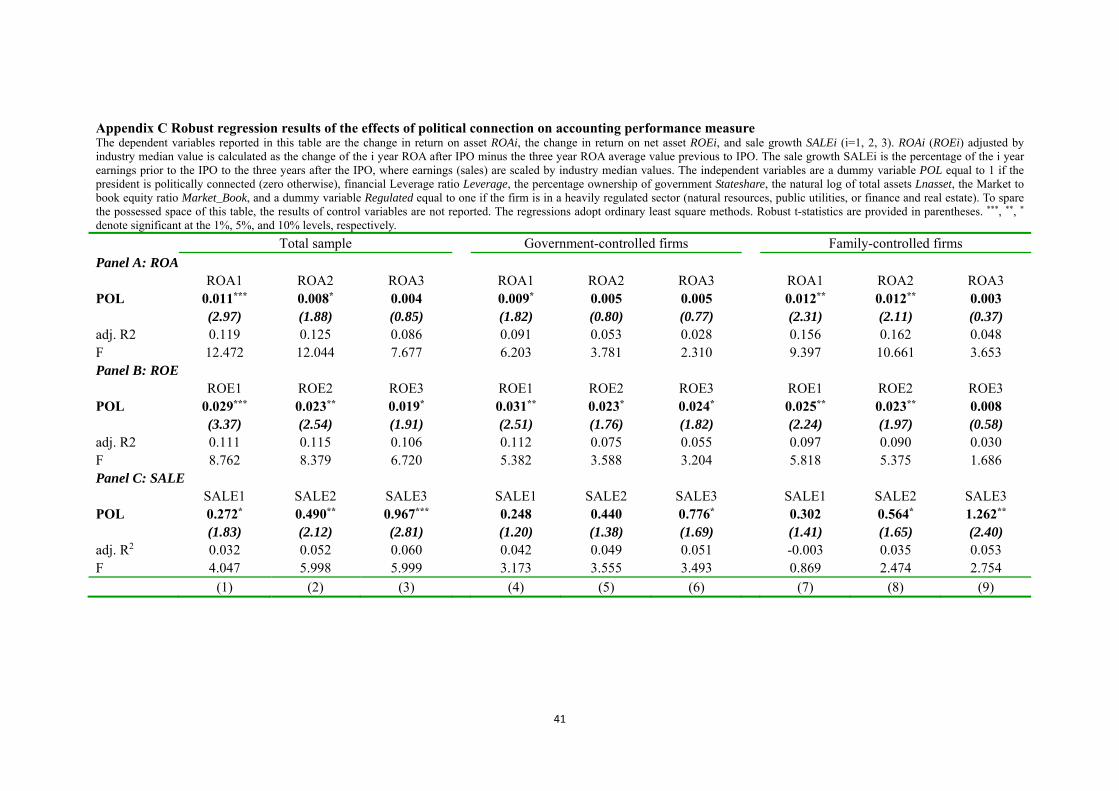
41
Appendix C Robust regression results of the effects of political connection on accounting performance measure The dependent variables reported in this table are the change in return on asset ROAi, the change in return on net asset ROEi, and sale growth SALEi (i=1, 2, 3). ROAi (ROEi) adjusted by industry median value is calculated as the change of the i year ROA after IPO minus the three year ROA average value previous to IPO. The sale growth SALEi is the percentage of the i year earnings prior to the IPO to the three years after the IPO, where earnings (sales) are scaled by industry median values. The independent variables are a dummy variable POL equal to 1 if the president is politically connected (zero otherwise), financial Leverage ratio Leverage, the percentage ownership of government Stateshare, the natural log of total assets Lnasset, the Market to book equity ratio Market_Book, and a dummy variable Regulated equal to one if the firm is in a heavily regulated sector (natural resources, public utilities, or finance and real estate). To spare the possessed space of this table, the results of control variables are not reported. The regressions adopt ordinary least square methods. Robust t-statistics are provided in parentheses. ***, **, *
denote significant at the 1%, 5%, and 10% levels, respectively.
Total sample Government-controlled firms Family-controlled firms
Panel A: ROA ROA1 ROA2 ROA3 ROA1 ROA2 ROA3 ROA1 ROA2 ROA3 POL 0.011*** 0.008* 0.004 0.009* 0.005 0.005 0.012** 0.012** 0.003 (2.97) (1.88) (0.85) (1.82) (0.80) (0.77) (2.31) (2.11) (0.37) adj. R2 0.119 0.125 0.086 0.091 0.053 0.028 0.156 0.162 0.048 F 12.472 12.044 7.677 6.203 3.781 2.310 9.397 10.661 3.653 Panel B: ROE ROE1 ROE2 ROE3 ROE1 ROE2 ROE3 ROE1 ROE2 ROE3 POL 0.029*** 0.023** 0.019* 0.031** 0.023* 0.024* 0.025** 0.023** 0.008 (3.37) (2.54) (1.91) (2.51) (1.76) (1.82) (2.24) (1.97) (0.58) adj. R2 0.111 0.115 0.106 0.112 0.075 0.055 0.097 0.090 0.030 F 8.762 8.379 6.720 5.382 3.588 3.204 5.818 5.375 1.686 Panel C: SALE SALE1 SALE2 SALE3 SALE1 SALE2 SALE3 SALE1 SALE2 SALE3 POL 0.272* 0.490** 0.967*** 0.248 0.440 0.776* 0.302 0.564* 1.262** (1.83) (2.12) (2.81) (1.20) (1.38) (1.69) (1.41) (1.65) (2.40) adj. R2 0.032 0.052 0.060 0.042 0.049 0.051 -0.003 0.035 0.053 F 4.047 5.998 5.999 3.173 3.555 3.493 0.869 2.474 2.754 (1) (2) (3) (4) (5) (6) (7) (8) (9)
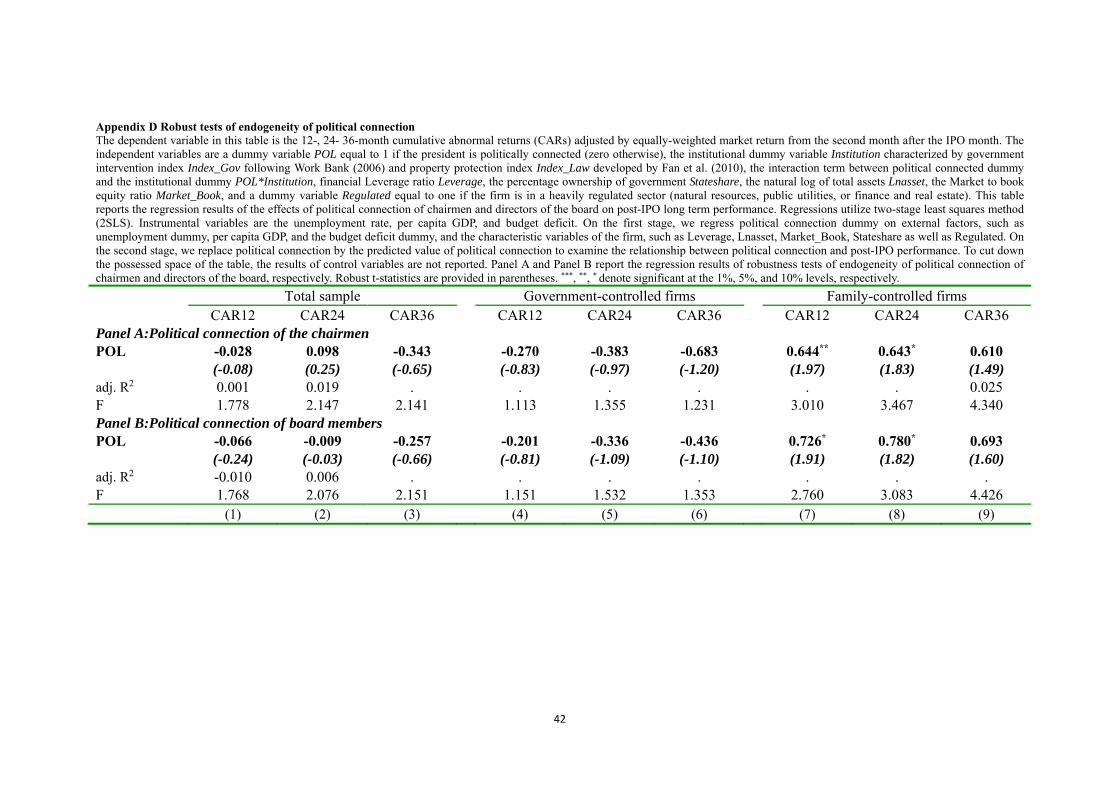
42
Appendix D Robust tests of endogeneity of political connection The dependent variable in this table is the 12-, 24- 36-month cumulative abnormal returns (CARs) adjusted by equally-weighted market return from the second month after the IPO month. The independent variables are a dummy variable POL equal to 1 if the president is politically connected (zero otherwise), the institutional dummy variable Institution characterized by government intervention index Index_Gov following Work Bank (2006) and property protection index Index_Law developed by Fan et al. (2010), the interaction term between political connected dummy and the institutional dummy POL*Institution, financial Leverage ratio Leverage, the percentage ownership of government Stateshare, the natural log of total assets Lnasset, the Market to book equity ratio Market_Book, and a dummy variable Regulated equal to one if the firm is in a heavily regulated sector (natural resources, public utilities, or finance and real estate). This table reports the regression results of the effects of political connection of chairmen and directors of the board on post-IPO long term performance. Regressions utilize two-stage least squares method (2SLS). Instrumental variables are the unemployment rate, per capita GDP, and budget deficit. On the first stage, we regress political connection dummy on external factors, such as unemployment dummy, per capita GDP, and the budget deficit dummy, and the characteristic variables of the firm, such as Leverage, Lnasset, Market_Book, Stateshare as well as Regulated. On the second stage, we replace political connection by the predicted value of political connection to examine the relationship between political connection and post-IPO performance. To cut down the possessed space of the table, the results of control variables are not reported. Panel A and Panel B report the regression results of robustness tests of endogeneity of political connection of chairmen and directors of the board, respectively. Robust t-statistics are provided in parentheses. ***, **, * denote significant at the 1%, 5%, and 10% levels, respectively.
Total sample Government-controlled firms Family-controlled firms CAR12 CAR24 CAR36 CAR12 CAR24 CAR36 CAR12 CAR24 CAR36 Panel A:Political connection of the chairmen POL -0.028 0.098 -0.343 -0.270 -0.383 -0.683 0.644** 0.643* 0.610 (-0.08) (0.25) (-0.65) (-0.83) (-0.97) (-1.20) (1.97) (1.83) (1.49) adj. R2 0.001 0.019 . . . . . . 0.025 F 1.778 2.147 2.141 1.113 1.355 1.231 3.010 3.467 4.340 Panel B:Political connection of board members POL -0.066 -0.009 -0.257 -0.201 -0.336 -0.436 0.726* 0.780* 0.693 (-0.24) (-0.03) (-0.66) (-0.81) (-1.09) (-1.10) (1.91) (1.82) (1.60) adj. R2 -0.010 0.006 . . . . . . . F 1.768 2.076 2.151 1.151 1.532 1.353 2.760 3.083 4.426 (1) (2) (3) (4) (5) (6) (7) (8) (9)
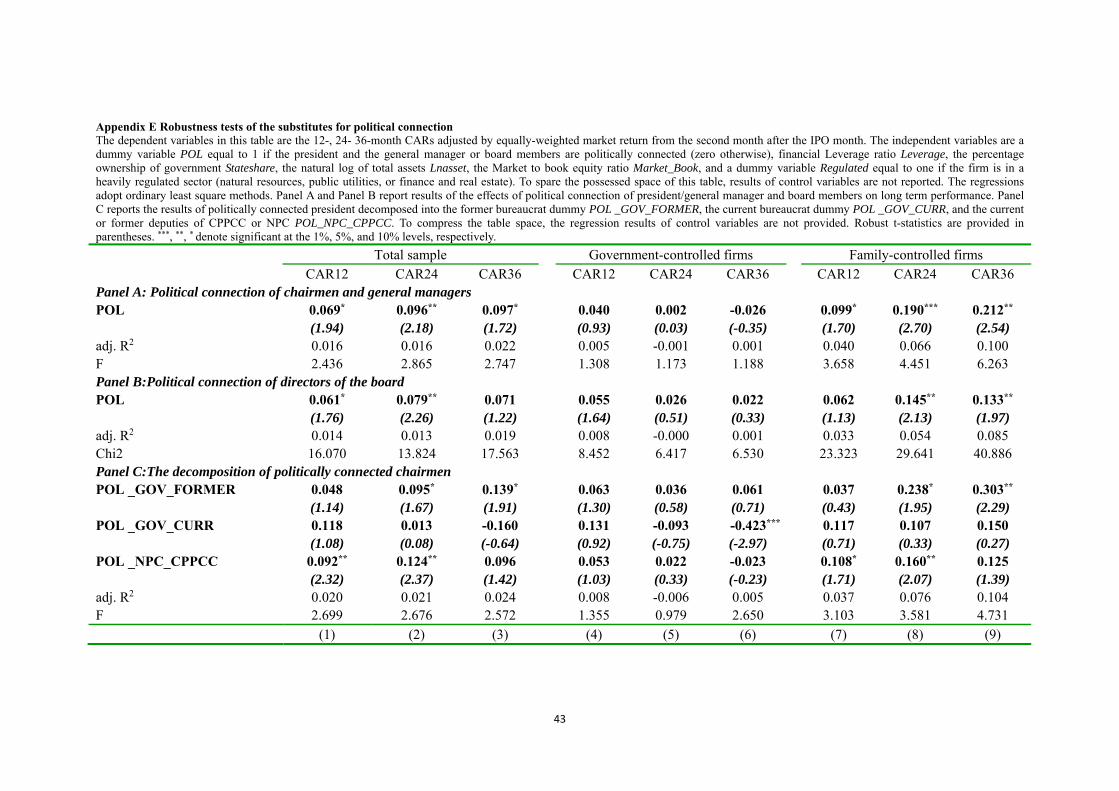
43
Appendix E Robustness tests of the substitutes for political connection The dependent variables in this table are the 12-, 24- 36-month CARs adjusted by equally-weighted market return from the second month after the IPO month. The independent variables are a dummy variable POL equal to 1 if the president and the general manager or board members are politically connected (zero otherwise), financial Leverage ratio Leverage, the percentage ownership of government Stateshare, the natural log of total assets Lnasset, the Market to book equity ratio Market_Book, and a dummy variable Regulated equal to one if the firm is in a heavily regulated sector (natural resources, public utilities, or finance and real estate). To spare the possessed space of this table, results of control variables are not reported. The regressions adopt ordinary least square methods. Panel A and Panel B report results of the effects of political connection of president/general manager and board members on long term performance. Panel C reports the results of politically connected president decomposed into the former bureaucrat dummy POL _GOV_FORMER, the current bureaucrat dummy POL _GOV_CURR, and the current or former deputies of CPPCC or NPC POL_NPC_CPPCC. To compress the table space, the regression results of control variables are not provided. Robust t-statistics are provided in parentheses. ***, **, * denote significant at the 1%, 5%, and 10% levels, respectively.
Total sample Government-controlled firms Family-controlled firms CAR12 CAR24 CAR36 CAR12 CAR24 CAR36 CAR12 CAR24 CAR36 Panel A: Political connection of chairmen and general managers POL 0.069* 0.096** 0.097* 0.040 0.002 -0.026 0.099* 0.190*** 0.212** (1.94) (2.18) (1.72) (0.93) (0.03) (-0.35) (1.70) (2.70) (2.54) adj. R2 0.016 0.016 0.022 0.005 -0.001 0.001 0.040 0.066 0.100 F 2.436 2.865 2.747 1.308 1.173 1.188 3.658 4.451 6.263 Panel B:Political connection of directors of the board POL 0.061* 0.079** 0.071 0.055 0.026 0.022 0.062 0.145** 0.133** (1.76) (2.26) (1.22) (1.64) (0.51) (0.33) (1.13) (2.13) (1.97) adj. R2 0.014 0.013 0.019 0.008 -0.000 0.001 0.033 0.054 0.085 Chi2 16.070 13.824 17.563 8.452 6.417 6.530 23.323 29.641 40.886 Panel C:The decomposition of politically connected chairmen POL _GOV_FORMER 0.048 0.095* 0.139* 0.063 0.036 0.061 0.037 0.238* 0.303** (1.14) (1.67) (1.91) (1.30) (0.58) (0.71) (0.43) (1.95) (2.29) POL _GOV_CURR 0.118 0.013 -0.160 0.131 -0.093 -0.423*** 0.117 0.107 0.150 (1.08) (0.08) (-0.64) (0.92) (-0.75) (-2.97) (0.71) (0.33) (0.27) POL _NPC_CPPCC 0.092** 0.124** 0.096 0.053 0.022 -0.023 0.108* 0.160** 0.125 (2.32) (2.37) (1.42) (1.03) (0.33) (-0.23) (1.71) (2.07) (1.39) adj. R2 0.020 0.021 0.024 0.008 -0.006 0.005 0.037 0.076 0.104 F 2.699 2.676 2.572 1.355 0.979 2.650 3.103 3.581 4.731 (1) (2) (3) (4) (5) (6) (7) (8) (9)