Embed Size (px)
Citation preview
POLITECNICO DI TORINO
Master of Science in Engineering and Management
An econometric analysis of the innovation financing in
the manufacturing industry in Colombia 2017-2018
Supervisor: Candidate:
Elisa Ughetto Leidy Rodriguez

ACKNOWLEDGMENTS
This thesis is dedicated to: First, I would like to thank God, for allowing me to study in a wonderful country like Italy and giving me the opportunity to learn so much throughout my master's degree. Thanks to my parents, brother and grandmother, who with their love and effort have allowed me to reach another goal, thank you for showing me the importance of education, for instilling in me the desire to improve myself day after day, and for teaching me not to be afraid of adversities because God is always with me.
To my boyfriend and friends for their unconditional support, throughout this process, for listening to me when I have needed it, and for helping me to recognize that with effort and perseverance, I am able to achieve everything I set out to do.
And finally, but not least, my thanks to Politecnico di Torino, to my professors, who with their valuable knowledge allowed me to grow as a professional. Thank you for your wonderful work and dedication in this process. In particular, to Professor Elisa Ughetto, my sincere thanks for being the main collaborator of this work, who with her knowledge, time, patience and supervision, allowed the development and improvement of this thesis.
ABSTRACT The present paper presents a general view of statistical data coming from the investments in innovation made by Colombian companies and the way they are financed. After literature review, the Survey of Development and Technological Innovation of the Manufacturing Industry (EDIT IX) prepared by the National Administrative Department of Statistics – DANE was used to extract the companies’ information and to analyze it through statistical graphics. Then, an econometric analysis was carried out by using statistical software R with the purpose of defining how the investment from own resources was associated with other variables. The main findings were: i) Own resources were the main source to finance innovation with a relative importance of 81.41% ii) The most of investments in innovation were represented by Machinery and equipment with 54.12% and iii) A regression model can explain the way the firms finance their investments. Finally, some recommendations were: i) to include other variables of interest in databases related to the age of the firms and their stage of lifecycle, ii) to consider macroeconomic aspects in future research and iii) to promote proper public policies that encourage the innovation in Colombia.
INTRODUCTION Over time, innovation has been considered as a critical factor of the firm and economic development of countries, also is in charge of establishing new paradigms and technological development (De Faria et. al, 2019). However, although there is evidence of its contribution to improving firms competitiveness and productivity, it is also important to highlight the existence of restrictions associated with obtaining the necessary funds to carry out this type of investment projects. For that reason, according to Wellalage, N. H., & Fernandez, V. (2019), there is a broader consensus that the funding types play a significant role in innovation.
There are few academic publications that relate the innovation activities carried out by Colombian firms and their respective financing (Arbeláez and Parra, 2011). However, Becerra (2001) stresses that innovation activities in Colombia present financing restrictions due to their great risk and the lack of physical assets that serve as collateral. These restrictions make it difficult to obtain financial resources, which happens more frequently in smaller firms.
When analyzing the evolution of investments in science, technology and innovation in Colombia, a slow dynamism is evident, a situation contrary to international trends and the needs of the country. Gómez, H. J., & Mitchell, D. (2014). However, in recent years, Colombia has discovered the importance of science, technology and innovation activities for progress and has allocated resources for this purpose, establishing institutions that improve access to finance for small and medium-sized enterprises, for example: SENA, COLCIENCIAS and BANCOLDEX. (Departamento Administrativo Nacional de Estadística, 2017-2018).
On the other hand, Salazar, J. C. (2003) states according to Bolsa de Valores de Colombia (2002) that in recent years, the progressive growing of pension and severance funds, of trust funds, securities funds, insurance companies and foreign capital funds (although with minimal participation) have driven the progress of the capital market in Colombia. However, the Capital Market Studies Mission characterized the Colombian capital market as small, not very liquid and highly concentrated (Ministerio de Hacienda, et al, 1996), a conclusion that was also obtained by the Consejo Privado de Competitividad (2007).
Likewise, Colombia promotes fiscal measures to encourage investment in Science, Technology and Innovation, particularly, tax incentives that are considered as resources that the state stops collecting by granting certain exemptions to research and technological development activities. In
the same way, Colombia has worked to promote the production of high-quality national statistical information related to innovation, through the processes of collection and analysis of the results of the Survey of Technological Development and Innovation in the manufacturing sector. (EDIT by DANE). The first measurement exercise of this type was carried out by the National Planning Department in 1996. In 2005, it was developed by the National Administrative Department of Statistics (DANE). In 2010, methodological improvements were introduced. In 2012, based on the observations of international experts and based on the guidelines of the Frascati Manual, some questions were added to increase the consistency of the information. To this improved collection instrument, the International Standard Industrial Classification - ISIC was added and this has been used to date. (DANE,2017)
However, the efforts made, and the amounts invested in STI activities by both the public and private sectors in Colombia have been insufficient. As evidenced by Barona-Zuluaga, B., & Rivera-Godoy, J. A. (2017) from CONPES (2016), investment in R&D in the country in 2015 amounted to 0.23% of GDP, a percentage that is well below countries such as Brazil, Argentina, and Mexico.
To evaluate financing, Salazar, J. C. (2003) from Pineda, L., (2002) affirms that it is necessary to consider the National Innovation System (SNI), which is the institutional framework in Colombia that encompasses the set of cooperation relationships of both public (ministries, decentralized entities and public banks) and private (Technological Development Centers, Regional Productivity Centers and business incubators) in the development and transfer of new technologies. Although innovative companies have resorted to internal sources and bank credit to carry out their operations, these companies consider that such sources have been insufficient to allow them to achieve a feasible development.
Among previous studies of the relationship between innovation and funding sources, the research by Sierra et al. (2009) and Arbeláez and Parra (2011), conclude that in Colombia larger companies are more innovative than smaller ones; argue that investment in R&D is negatively affected by foreign ownership of the company, that public financing is highly relevant for investment in innovation and that public instruments are effective promoters of total innovation; additionally, Zuluaga, B. B., et al. (2015) from Sierra et al (2009) indicates that the main reasons why smaller companies do not innovate is that they consider that “innovation is not profitable or unnecessary;
also, although with less importance, they affirm not to do so due to lack of financial resources, which is supported by Otálora et al. (2009), who conclude that “entrepreneurs on average have
little interest or aversion to knowing sources of financing”. Finally, Zuluaga, B. B., et al. (2015) highlight the prevalence of own resources and those provided by private banks, which coincides with the results of Sierra et al. (2009) and Barona et al. (2014); in the same way, they evaluate public financing mechanisms and find that, among these, the most used is Bancoldex. In addition, Cohen and Levin (1989) reveal that in the case of large companies, a clear preference for internal financing over external financing is evident, to the extent that these companies have a greater capacity to generate resources to finance their innovations. For their part, Zuluaga, B. B., et al. (2015) from the research of Langebaek and Vásquez (2007), which analyze the determinants of innovation in the Colombian manufacturing industry, found that this activity shows a strong relationship with the size of the company and the presence of foreign capital in the property.
In this order of ideas, the purpose of this document is to contribute to the knowledge that currently exists on the innovation activities carried out by private companies in Colombia, and the way in which this investment is financed. Given the importance of innovation for countries transformation, this thesis develops an econometric analysis using as source of information the Survey of Innovation and Technological Development in the Colombian manufacturing industry (EDIT IX), prepared by the National Administrative Department of Statistics (DANE), with data from technological development and innovation activities carried out by manufacturing companies for the years 2017 and 2018.
Theis thesis consists of five chapters: the first one presents the literature review about fundamentals of innovation financing emphasizing the Colombian case and theory about the statistical tools that will be used; the second one exhibits the methodology for collecting and interpreting the data, the third one stresses the main results and contrast them with theorical developments, the fourth one is based on conclusions and the last one indicates some recommendations.
CONTENTS
1. THEORETICAL FRAMEWORK ................................................................................................................................ 1 1.1. Innovation financing ......................................................................................................................................... 1 1.2.Innovation classification ..................................................................................................................................... 4 1.3.Econometric analysis .......................................................................................................................................... 5
2. METHODOLOGY ....................................................................................................................................................... 9 2.1. Companies’ characteristics................................................................................................................................. 9 2.2. Econometric analysis........................................................................................................................................ 55
3. RESULTS ................................................................................................................................................................... 65 3.1. Interpretation of the model obtained ................................................................................................................ 65 3.2. Predictions ....................................................................................................................................................... 68
4. CONCLUSIONS ........................................................................................................................................................ 70 5. RECOMMENDATIONS ............................................................................................................................................ 71 REFERENCES ................................................................................................................................................................... 73 APPENDIX ........................................................................................................................................................................ 77
A1.EDIT Questionnaire ......................................................................................................................................... 77
8
1. THEORETICAL FRAMEWORK 1.1. Innovation financing
This document is framed within economic theory, the which has identified innovation as one of the determining factors of economic development according to Barona-Zuluaga, B., et al. (2015) from Schumpeter (2008). The innovation is closely linked to continuous improvement and choosing its best source of financing is an important issue that has not an accurate and/or a single solution. There are several concepts of innovation that will be detailed below:
✓ Porter (1990) conceives business innovation as “a new way of doing things that are
marketed”. It means that there are ideas, knowledge, technologies, and products in continuous transformation. Then, the purpose is to discover and invent other waysof reaching new knowledge, perfecting technologies, and transforming or creating new highly competitive products.
✓ The Oslo Manual (OECD, 2005) defines innovation as the introduction of a new, or
significantly improved, product, service, process, organizational method. It also differentiates between product, process, marketing, and organizational innovations:
• Product innovation consists of the creation of new products or services, or the improvement of the characteristics, benefits, and quality of existing ones.
• Process innovation involves the introduction of new production methods or
the modification of existing ones, and its main objective is cost reduction.
• Marketing innovation is the application of a new marketing method that involves significant changes in the design or packaging of a product, its positioning, its promotion, or its pricing.
• Organizational innovation is the introduction of a new organizational method
in the practices, the organization of the workplace or the external relations of the company.
✓ Fayomi et al., (2019) define innovation as "the ability to continuously transform new
knowledge and ideas into new products, processes and systems”, and, according to Popa et al., (2010) state that “innovation has become an essential source of competitive advantage due to technological development and intense global product and service competition”.
9
It is worth noting that any type of innovation involves high risks, since it is not possible to know the results (financial, technical and market-related) before making the investment. This is how the aversion to risk of the actors involved in the process could become an obstacle on innovation activities. In an ideal world, companies would sell products or services and use the proceeds to finance new products and services. However, risk aversion means that companies do not use the profits to finance innovation, preferring to give dividends to shareholders or save profits for possible eventualities. This is how external funders come into play to finance innovation.
On the other hand, innovation is a process driven by competition in the market, since companies are incentivized to outperform each other. For this reason, companies are forced to strengthen and invest on their innovation activities if they want to be successful in the economy where they are operating. In this way, it is also important to highlight the role of appropriability regimes, which allow the proponents of innovations to save their economic value without having to share it with other actors; and in turn, they serve as an incentive for the creation of new knowledge.
Innovation contributes to economic development, since it generates higher levels of productivity, favors the generation of employment and the satisfaction of social and environmental needs. For this reason, companies see innovation as a driver of competitive advantage. In this sense, organizations must carry out innovation activities, in order to generate new products and processes and acquire greater flexibility in the face of change.
However, countries do not have the same capacity to finance innovation, particularly for Science, Technology, and Innovation (STI) activities. Sierra (2019) states that even though Colombia is positioned as the fourth largest economy in Latin America, it spends only 0.25% of GDP on STI, 30% of which comes from the government, the other 70% comes from private financing. This situation is caused because Colombian companies adopt the preference for financing innovation in hierarchical order: first, resorting to their own resources, then banks and finally, public operations, since they only resort to external sources of financing when profits are exhausted, which means that companies assume all the risk of innovation, for this reason innovation and therefore economic growth are hindered. This is how in Colombia there seems to be a conflict around innovation, as companies do not invest enough in innovation, but when they do, they prefer to use internal financing and in cases of low liquidity, companies look for expensive bank loans instead of cheaper government support.
Sierra (2019) states that two theories prevail within the financing of innovation:
✓ The trade-off theory also known as static theory, suggests that companies adapt to an optimal level of indebtedness, which is determined by a trade-off between the costs and the benefits of indebtedness, that is, the level of indebtedness depends on an optimal balance between the tax advantages of the debt and the disadvantages derived from the increased possibility of bankruptcy. When the optimal combination of debt
10
and equity is reached, companies maximize their value and have no incentive to increase their debt, since an additional monetary unit in debt implies a net marginal loss of that value. Therefore, this theory defends the existence of an optimal capital structure in the company, considering that such structure defines the value of the firm.
✓ Pecking Order Theory (POT): affirms that there is no optimal capital structure but rather, when companies make new investments, they first resort to financing with internal funds because the costs and risks are low and there is no information asymmetry, then they resort to debt (which is cheaper than equity because agency costs raise the risk of equity funding) and as a last option to issue shares since companies are aware of the asymmetry of information in the capital market. In this regard, Zambrano and Acuña (2011. p.95) state: "The Pecking Order today has great acceptance since there are many organizations in our environment that do not seek the optimal combination between debt and capital but rather try at all times to finance their new projects with their own resources.”
At present this theory achieves great importance within organizations because most companies are not in search of an optimal combination but rather are trying to finance their new investments with their own resources due to their aversion to information asymmetry in the capital market.
Morales, E. A. M. (2019) according to Hall & Lerner (2009) states that the market failures are larger for innovative and high technology companies since innovation involves a higher risk and its duration is longer than traditional capital investments. Then, it entails a higher profit rate required by external investors, which drives the use of internal funding. This idea is supported by Manigart & Struyf (1997) who concluded that Belgium high technology firms, follow POT parameters. This is the same case for Italian high technology companies, which according to a study of Bartolini (2013), their main source of financing for innovation is own resources.
The use of the POT theory in Colombia is given two different points of view: Morales, E. A. M. (2019) state that in a developing country like Colombia, innovative firms will tend to fund their innovation activities according to POT Theory, and, if internal funding is not enough, firms will have to look for external sources of financing, being debt preferred to equity, since Colombia is characterized by a small, illiquid and difficult to access equity market. But, on the other hand, Sierra (2019) stresses that Colombian companies do not follow a standard practice of the POT theory for the financing of innovation, since according to Manigart & Struyf (1997) and Giudici & Paleari (2000), this transaction not only depends on the risks and costs but also depends on the nature of the project, on the characteristics of the company and the funders. It is supported by García, D., et al. (2013) who evidence in their research that the existence of a positive relationship between the size of the company and the performance of innovative activities has been identified.
11
On the other hand, Barona, B., et al. (2017) affirm that modern financial economic theory indicates that the characteristics of investment in innovation are a key element to understand the way in which innovation activities should be financed. This is how a very precise estimate of the future cash flows that the activities to be financed will generate is required to decide which investment activities to finance. They also conclude from Arbeláez and Parra (2011) research that large and medium-sized companies innovate more intensively than small firms, find that investment in R&D is negatively affected by foreign ownership of the company, and lastly, they affirm that public financing is highly relevant for investment in innovation. and that public instruments are effective promoters of total innovation.
Based on an analysis of the innovation activities of SMEs in 47 developing economies, Barona, B., et al. (2017) according to Ayyagari et al., (2011) conclude that bank financing (domestic and foreign private banking) was positively associated with the improvement of existing products lines, the opening of a new plant and the signing of joint ventures with foreign partners.
Other important aspect highlighted by Zuluaga et al. (2015) from Arrow (1962) is that companies tend to make less investment in innovation than is considered optimal for achieving high levels of economic growth development. One reason worth noting according to Zuluaga et al. (2015) is that a very high percentage of investment in innovation is represented in remuneration of highly qualified personnel, such as scientists and engineers. Although conceptually these payments constitute an investment for the company, due to their intangible nature it is an investment very different from the investment in physical assets such as inventory in merchandise or plant and equipment.
1.2. Innovation classification
In order to obtain a better understanding of the procedures carried out in this document, it is important to provide the companies classification according to the progress made in terms of innovation results, which is defined by EDIT IX (DANE, 2017-2018):
✓ Innovative in the strict sense: companies that obtained at least one service, either new or significantly improved in the international market.
✓ Innovative in a broad sense: companies that obtained at least one service
either new or significantly improved in the national market or a new or improved service for the company, or that implemented a new or significantly
12
improved production process improved for the main production line or for complementary production lines or a new organizational or marketing form.
✓ Potentially innovative: companies that have not obtained any innovation, but
that they reported having an innovation project in process or having abandoned, either to obtain a new or significantly improved product in the international market, in the national market, or for the company; or to obtain a production process for the main production line or for complementary lines, or a new organizational or marketing technique.
✓ Non-innovative: companies that did not obtain innovations, nor did they
report having in process, or having abandoned, any project to obtain innovations.
1.3. Econometric analysis
Given the importance of the econometric techniques in providing instruments to the economist for him to carry out economic studies considering statistical data and considering the elements that compose it, it is necessary to define what econometry is.
Econometrics is a branch of economics that uses statistical methods to study and quantify economic phenomena through real data, thus providing clues about the relevance of scientific theories developed by economists (Ventosa, 2012). This means that econometry is a science that allows the estimation of economic relationships. Therefore, this scientific discipline can, based on certain data, test hypotheses and finally forecast the behavior of both economic and individual variables.
Now, according to (López, et al. 1986) an econometric analysis has the main objective of explaining one variable in terms of others and it follows the subsequent steps:
✓ Statement of the theory ✓ Specification of the econometric model ✓ Estimation of the parameters of the chosen model ✓ Statistical verification or inference ✓ Predictions or forecasts
From this, it is necessary to define what a regression model is.
A tool that will allow us to analyze the relationship between the type of resources that companies invest in innovation and other variables is a Multiple Regression Model. To understand how this works, it is important to define what is a Simple Regression Model.
13
Simple Regression Model is a statistical technique that allows us to predict the relationship between two variables: the predictor variable (x) and the response or results variable (y).
This model has the following expression:
𝑦 = 𝛼 + 𝛽X + 𝜀 (1)
Where 𝛼 is the ordinate at the origin (the value that Y takes when X is equal to 0), 𝛽 is the slope of the line (and indicates how Y changes when X increases by one unit) and 𝜀 a variable that includes a large set of factors, each of which influences the response only to a small extent, which we will call error. X and Y are random variables, so an exact linear relationship cannot be established between them.
✓ In this way, Rodrigo, J. A., (2016) states that a Multiple Regression Model is an extension of simple regression model and allows generating a model in which the value of the dependent variable or response (Y) is determined from a set of independent variables called predictors.
General form of a multiple model is shown as follows:
𝑦 = 𝛽0 + 𝛽1X1 + 𝛽2X2 + 𝛽𝑖X𝑖 + 𝜀 (2)
The terms 𝛽0, 𝛽1, 𝛽2, 𝛽𝑖 are called regression coefficients and Rodrigo, J. A., (2016) defines them as follows: 𝛽0: is the ordinate at the origin, the value of the dependent variable Y when all predictors are zero.
βi: is the average effect of the increase in one unit of the predictor variable 𝑥𝑖 on the dependent variable y, keeping the rest of the variables constant.
ε: is the residual or error, the difference between the observed value and that estimated by the model.
Predictor variables selection
When selecting predictors, Rodrigo, J. A., (2016) defines the method for this purpose:
✓ Stepwise method: uses mathematical criteria to decide which predictors contribute significantly to the model and in what order they are introduced. Within this method, two strategies are differentiated:
• Forward direction: The initial model does not contain any predictors, only
the parameter 𝛽0. From this, singles variables are incorporated generating different models and the variables that are most statistically significant are selected. This process finishes until all variables that contribute to the model has been incorporated.
14
• Backward direction: The model starts with all the available variables included as predictors. Each variable that does not contribute to the model is eliminated one by one.
The step-by-step method requires some mathematical criteria to determine if the model improves or worsens with each incorporation or extraction. There are several parameters used, among which the AIC, BIC and adjusted 𝑅2 stand out, each of them with advantages and disadvantages. They are defined below:
✓ 𝑹𝟐 (coefficient of determination) is defined by Rousson and Goşoniu (2007) as a quantifier of the goodness of fit of the model. It allows to quantify how good the model is to predict the value of the observations. In multiple models, the more predictors included in the model, the greater the value of 𝑅2, since, no matter how little, each predictor will explain a part of the variability observed in Y.
✓ Adjusted 𝑹𝟐 introduces a penalty to the value of 𝑅2 for each predictor that is entered into the model. The value of the penalty depends on the number of predictors used and the size of the sample, that is, the number of degrees of freedom. The larger the sample size, the more predictors can be incorporated into the model. Adjusted 𝑅2
makes it possible to find the best model, the one that manages to better explain the variability of Y with the least number of predictors. (Rodrigo, J. A., 2016).
✓ The Akaike Information Criterion (AIC) is a mathematical method that allows to
evaluate how well a model fits the data from which it was generated. AIC is used to make a comparison between different models and determine which one best fits the data. (Ingdal, M., Johnsen, R., & Harrington, D. A., 2019).
✓ The Bayesian information criterion (BIC) or Schwarz criterion is a method that focuses on the sum of the squares of the residuals to find the number of lagged periods p that minimize this model. In other words, we want to find the minimum number of lagged periods that we include in the autoregression to help us with the prediction of the dependent variable. In this way, we will have control over the number of lagged periods p that we are including in the regression. When we exceed this optimal level, the Schwarz model will stop decreasing and therefore we will have reached the minimum. That is, we will have reached the number of lagged periods p that minimize the Schwarz model. (Neath, A. A., & Cavanaugh, J. E., 2012)
On the other hand, it is common to find cases in which the selection of predictors is based on the p-value associated with each one. Brereton (2019) defines the p-value as the probability, under the assumption of no effect or no difference (the null hypothesis), of obtaining a result equal to or more extreme than what was actually observed. Then, the idea is to remove the variables with a higher p-value than an established significance level.
15
The level of significance of a test is a statistical concept associated with the verification of a statistical hypothesis. In short, it is defined as the probability of making the decision to reject the null hypothesis (𝐻0) when it is true (a decision known as Type I Error).
Osborne and Waters (2002) raises four assumptions that allow validating the model:
✓ Normal distribution of the residuals: The residuals must be normally distributed with zero mean. To verify this, histograms, normal quantiles or normalityhypothesis tests are used.
Different tests are used to check if the data of the dependent variable follow a normal distribution:
• Shapiro-Wilk normality Test: • Jarque Bera Test • Anderson-Darling normality Test
Also, there are graphical tools that allow to observe the behavior of the data and to conclude the presence of normality:
• Boxplot • Histogram • Q-Q (quantile-quantile) plot
✓ Constant variance of the residuals (homoscedasticity): The variance of the
residuals must be constant throughout the range of observations. To check this, the residuals are represented. If the variance is constant, they are distributed randomly, maintaining the same dispersion and without any specific pattern. An important tool to conclude homocedasticity is the Breusch-Pagan test and some of the most important graphical techniques to observe the behavior of data and to determine constant variance are:
• Fitted values vs. Residuals • Response variable vs. Residuals
✓ No autocorrelation (Independence): The values of each observation are
independent of the others, this is especially important to check when working with temporal measurements. It is recommended to represent the residuals ordered according to the recording time of the observations, if there is a certain pattern there are indications of autocorrelation. In this case, the Durbin-Watson hypothesis test and Partial Autocorrelation Function (PACF) plot can be used to determine data Independence.
16
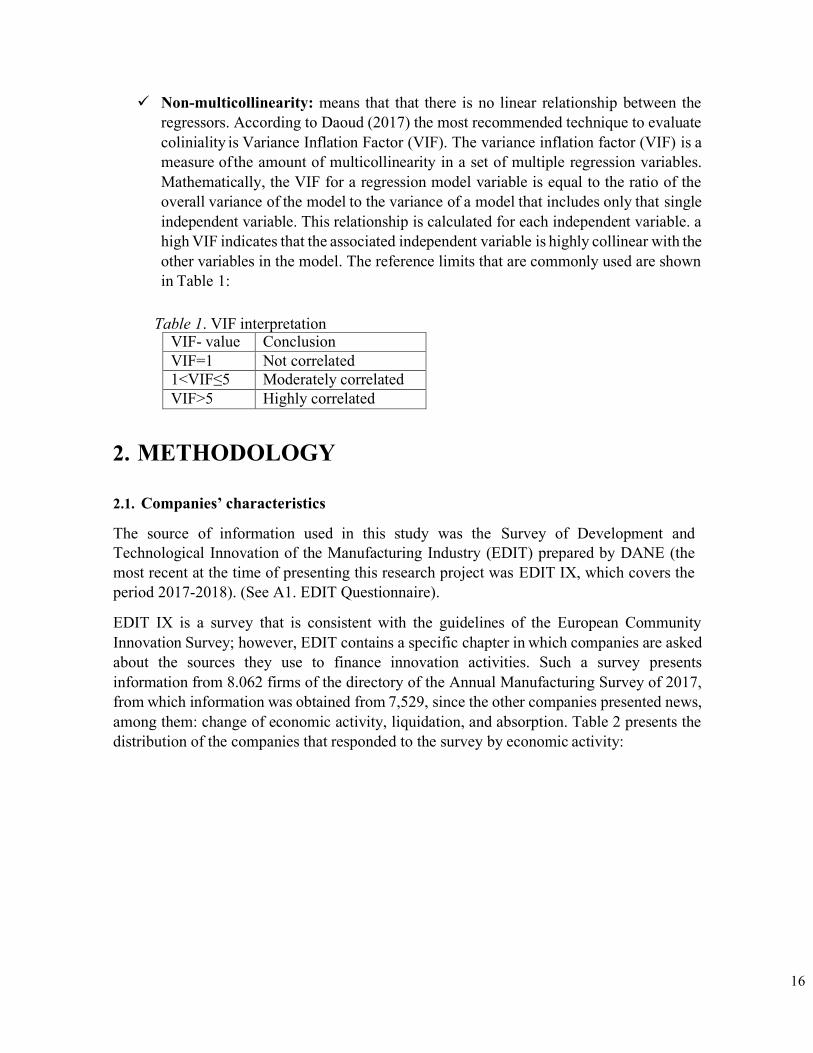
✓ Non-multicollinearity: means that that there is no linear relationship between the regressors. According to Daoud (2017) the most recommended technique to evaluate coliniality is Variance Inflation Factor (VIF). The variance inflation factor (VIF) is a measure of the amount of multicollinearity in a set of multiple regression variables. Mathematically, the VIF for a regression model variable is equal to the ratio of the overall variance of the model to the variance of a model that includes only that single independent variable. This relationship is calculated for each independent variable. a high VIF indicates that the associated independent variable is highly collinear with the other variables in the model. The reference limits that are commonly used are shown in Table 1:
Table 1. VIF interpretation
VIF- value Conclusion VIF=1 Not correlated 1<VIF≤5 Moderately correlated VIF>5 Highly correlated
2. METHODOLOGY
2.1. Companies’ characteristics
The source of information used in this study was the Survey of Development and Technological Innovation of the Manufacturing Industry (EDIT) prepared by DANE (the most recent at the time of presenting this research project was EDIT IX, which covers the period 2017-2018). (See A1. EDIT Questionnaire).
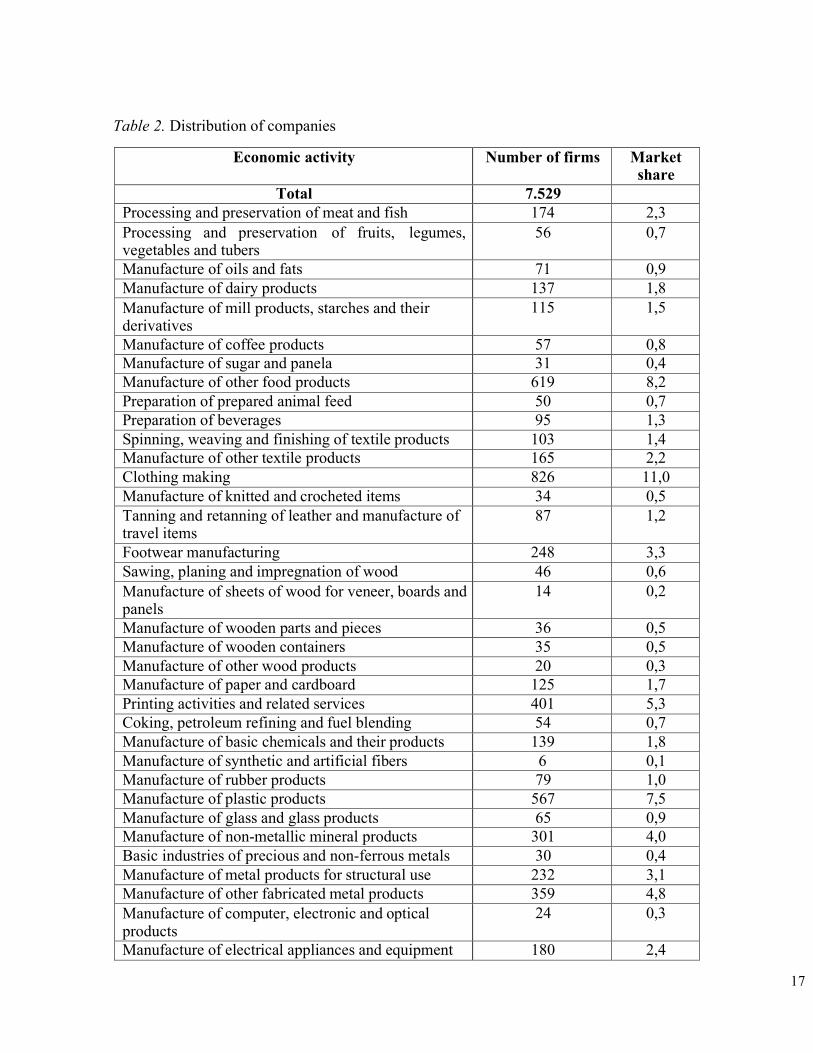
EDIT IX is a survey that is consistent with the guidelines of the European Community Innovation Survey; however, EDIT contains a specific chapter in which companies are asked about the sources they use to finance innovation activities. Such a survey presents information from 8.062 firms of the directory of the Annual Manufacturing Survey of 2017, from which information was obtained from 7,529, since the other companies presented news, among them: change of economic activity, liquidation, and absorption. Table 2 presents the distribution of the companies that responded to the survey by economic activity:
17
Table 2. Distribution of companies
Economic activity Number of firms Market
share Total 7.529
Processing and preservation of meat and fish 174 2,3 Processing and preservation of fruits, legumes, vegetables and tubers
56 0,7
Manufacture of oils and fats 71 0,9 Manufacture of dairy products 137 1,8 Manufacture of mill products, starches and their derivatives
115 1,5
Manufacture of coffee products 57 0,8 Manufacture of sugar and panela 31 0,4 Manufacture of other food products 619 8,2 Preparation of prepared animal feed 50 0,7 Preparation of beverages 95 1,3 Spinning, weaving and finishing of textile products 103 1,4 Manufacture of other textile products 165 2,2 Clothing making 826 11,0 Manufacture of knitted and crocheted items 34 0,5 Tanning and retanning of leather and manufacture of travel items
87 1,2
Footwear manufacturing 248 3,3 Sawing, planing and impregnation of wood 46 0,6 Manufacture of sheets of wood for veneer, boards and panels
14 0,2
Manufacture of wooden parts and pieces 36 0,5 Manufacture of wooden containers 35 0,5 Manufacture of other wood products 20 0,3 Manufacture of paper and cardboard 125 1,7 Printing activities and related services 401 5,3 Coking, petroleum refining and fuel blending 54 0,7 Manufacture of basic chemicals and their products 139 1,8 Manufacture of synthetic and artificial fibers 6 0,1 Manufacture of rubber products 79 1,0 Manufacture of plastic products 567 7,5 Manufacture of glass and glass products 65 0,9 Manufacture of non-metallic mineral products 301 4,0 Basic industries of precious and non-ferrous metals 30 0,4 Manufacture of metal products for structural use 232 3,1 Manufacture of other fabricated metal products 359 4,8 Manufacture of computer, electronic and optical products
24 0,3
Manufacture of electrical appliances and equipment 180 2,4
18
Manufacture of machinery and equipment for general use
199 2,6
Manufacture of machinery and equipment for special use
222 2,9
Manufacture of motor vehicles and their engines 12 0,2 Manufacture of bodies for motor vehicles 63 0,8 Manufacture of parts, pieces (auto parts) and accessories for vehicles
96 1,3
Manufacture of other types of transport equipment 33 0,4 Furniture manufacturing 344 4,6 Manufacture of mattresses and bed bases 39 0,5 Manufacture of jewelery, costume jewelery and related articles
20 0,3
Manufacture of articles and equipment for the practice of sport
12 0,2
Manufacture of games, toys and puzzles 24 0,3 Manufacture of medical and dental instruments, devices and materials
66 0,9
Other manufacturing industries 111 1,5 Maintenance and repair of metal products, machinery and equipment
32 0,4
Manufacture of pesticides and other chemicals for agricultural use
29 0,4
Manufacture of paints, varnishes and similar coatings 76 1,0 Manufacture of soaps and detergents, perfumes and toilet preparations
171 2,3
Manufacture of other chemicals 98 1,3 Manufacture of pharmaceuticals, medicinal chemicals 187 2,5 Basic Iron and Steel Industries - Metal Casting 114 1,5
Source: DANE, Technological Development and Innovation Survey – EDIT
For the period 2017-2018, the following classifications were analyzed:
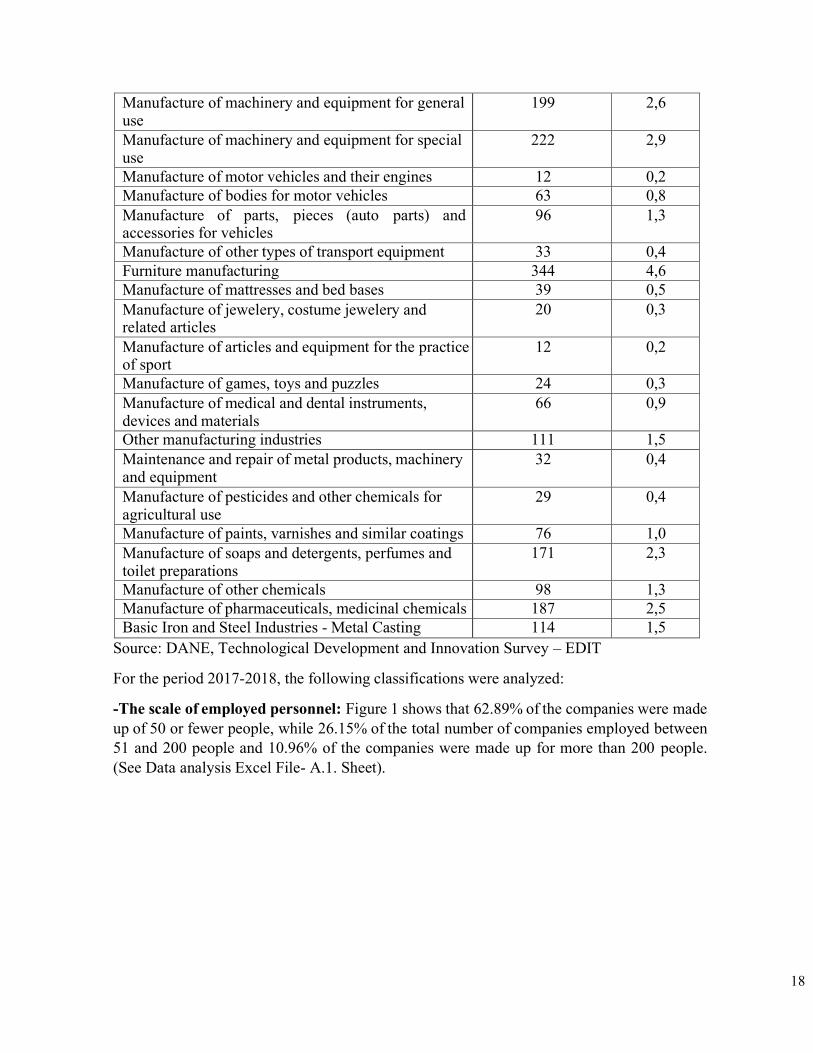
-The scale of employed personnel: Figure 1 shows that 62.89% of the companies were made up of 50 or fewer people, while 26.15% of the total number of companies employed between 51 and 200 people and 10.96% of the companies were made up for more than 200 people. (See Data analysis Excel File- A.1. Sheet).
19
6,000
4,000
2,000
50 or less 51 to 200 More than 200
Staff number
Figure 1. Distribution of manufacturing companies by scale of employed personnel
Source: DANE, Technological Development and Innovation Survey – EDIT - Own creation
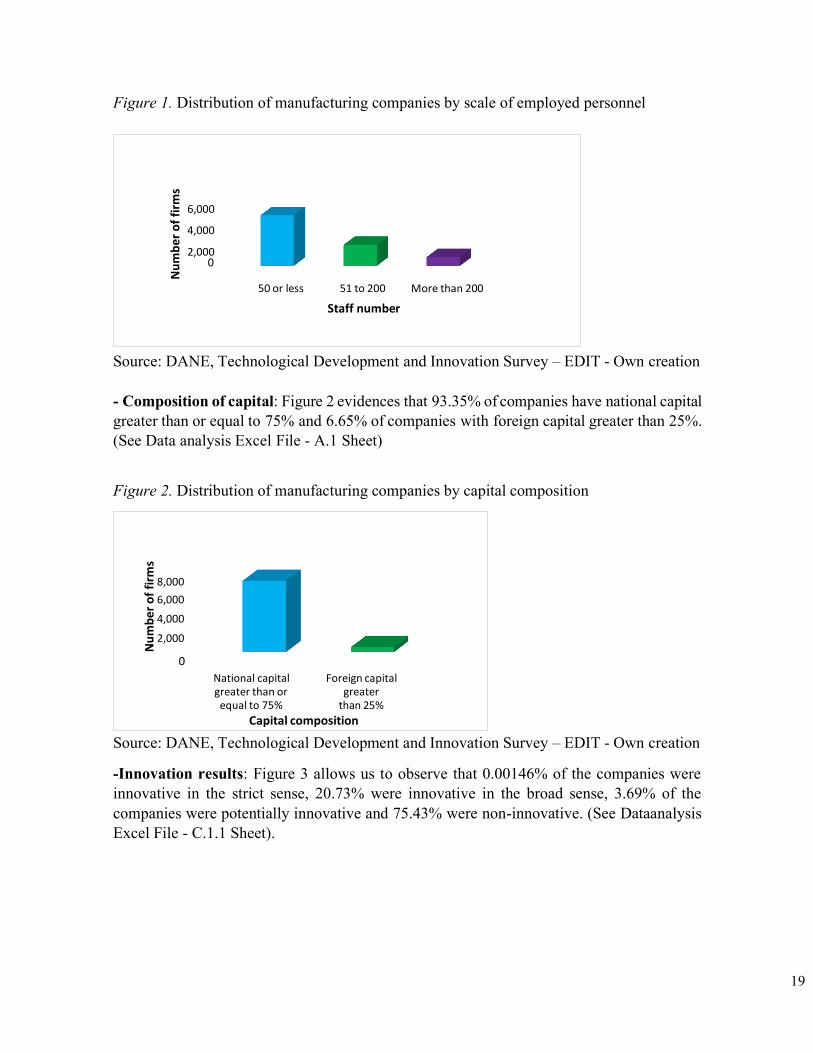
- Composition of capital: Figure 2 evidences that 93.35% of companies have national capital greater than or equal to 75% and 6.65% of companies with foreign capital greater than 25%. (See Data analysis Excel File - A.1 Sheet)
Figure 2. Distribution of manufacturing companies by capital composition
Source: DANE, Technological Development and Innovation Survey – EDIT - Own creation
-Innovation results: Figure 3 allows us to observe that 0.00146% of the companies were innovative in the strict sense, 20.73% were innovative in the broad sense, 3.69% of the companies were potentially innovative and 75.43% were non-innovative. (See Dataanalysis Excel File - C.1.1 Sheet).
8,000
6,000
4,000
2,000
National capital greater than or equal to 75%
Foreign capital greater
than 25%
Capital composition
Nu
mb
er o
f fi
rms
Nu
mb
er o
f fi
rms
20
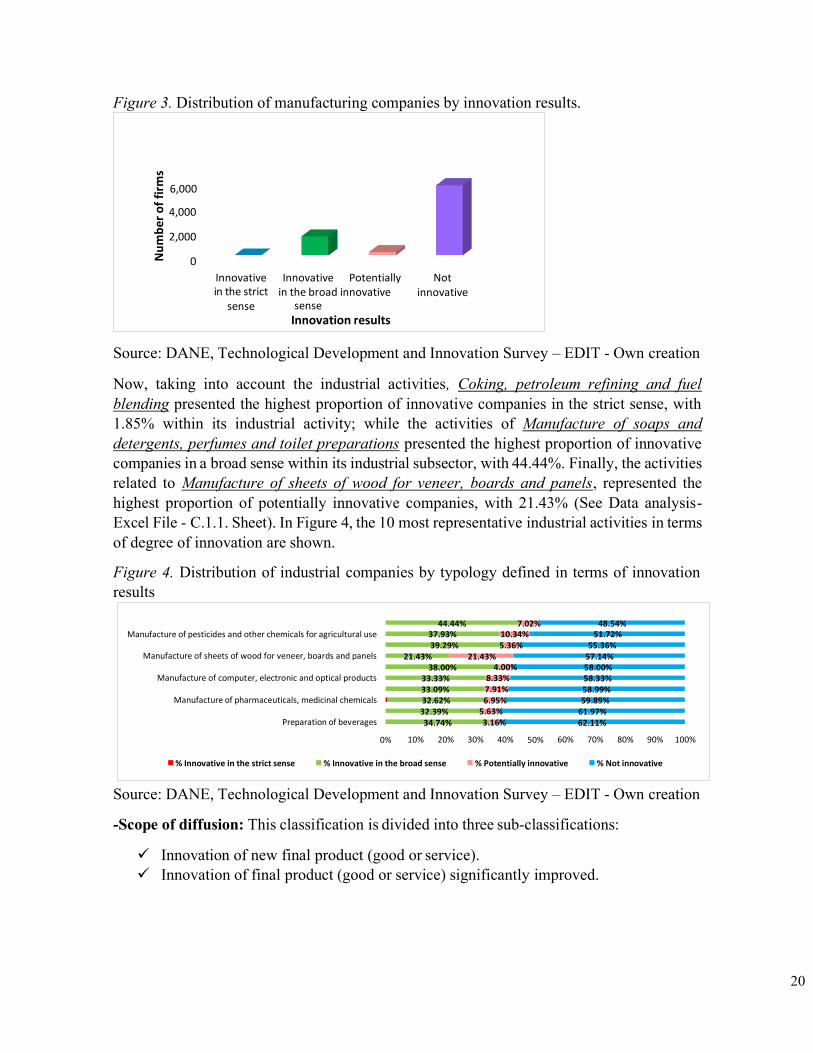
Figure 3. Distribution of manufacturing companies by innovation results.
Source: DANE, Technological Development and Innovation Survey – EDIT - Own creation
Now, taking into account the industrial activities, Coking, petroleum refining and fuel blending presented the highest proportion of innovative companies in the strict sense, with 1.85% within its industrial activity; while the activities of Manufacture of soaps and detergents, perfumes and toilet preparations presented the highest proportion of innovative companies in a broad sense within its industrial subsector, with 44.44%. Finally, the activities related to Manufacture of sheets of wood for veneer, boards and panels, represented the highest proportion of potentially innovative companies, with 21.43% (See Data analysis- Excel File - C.1.1. Sheet). In Figure 4, the 10 most representative industrial activities in terms of degree of innovation are shown.
Figure 4. Distribution of industrial companies by typology defined in terms of innovation results
Source: DANE, Technological Development and Innovation Survey – EDIT - Own creation
-Scope of diffusion: This classification is divided into three sub-classifications:
✓ Innovation of new final product (good or service). ✓ Innovation of final product (good or service) significantly improved.
Manufacture of pesticides and other chemicals for agricultural use
Manufacture of sheets of wood for veneer, boards and panels
Manufacture of computer, electronic and optical products
Manufacture of pharmaceuticals, medicinal chemicals
Preparation of beverages
0%
44.44% 37.93% 39.29%
21.43% 38.00%
33.33% 33.09% 32.62% 32.39% 34.74%
10% 20%
7.02% 10.34% 5.36%
21.43% 4.00%
8.33% 7.91% 6.95%
5.63% 3.16%
30% 40% 50%
48.54% 51.72%
55.36% 57.14% 58.00% 58.33% 58.99% 59.89%
61.97% 62.11%
60% 70% 80% 90% 100%
% Innovative in the strict sense % Innovative in the broad sense % Potentially innovative % Not innovative
6,000
4,000
2,000
Innovative in the strict
sense
Innovative Potentially Not in the broad innovative
sense Innovation results
innovative
Nu
mb
er o
f fi
rms
21
✓ Innovation of business methods and / or techniques.
For the reference period, 430 companies made innovations in new products, 578 in significantly improved goods, and 1,298 in business methods and techniques.
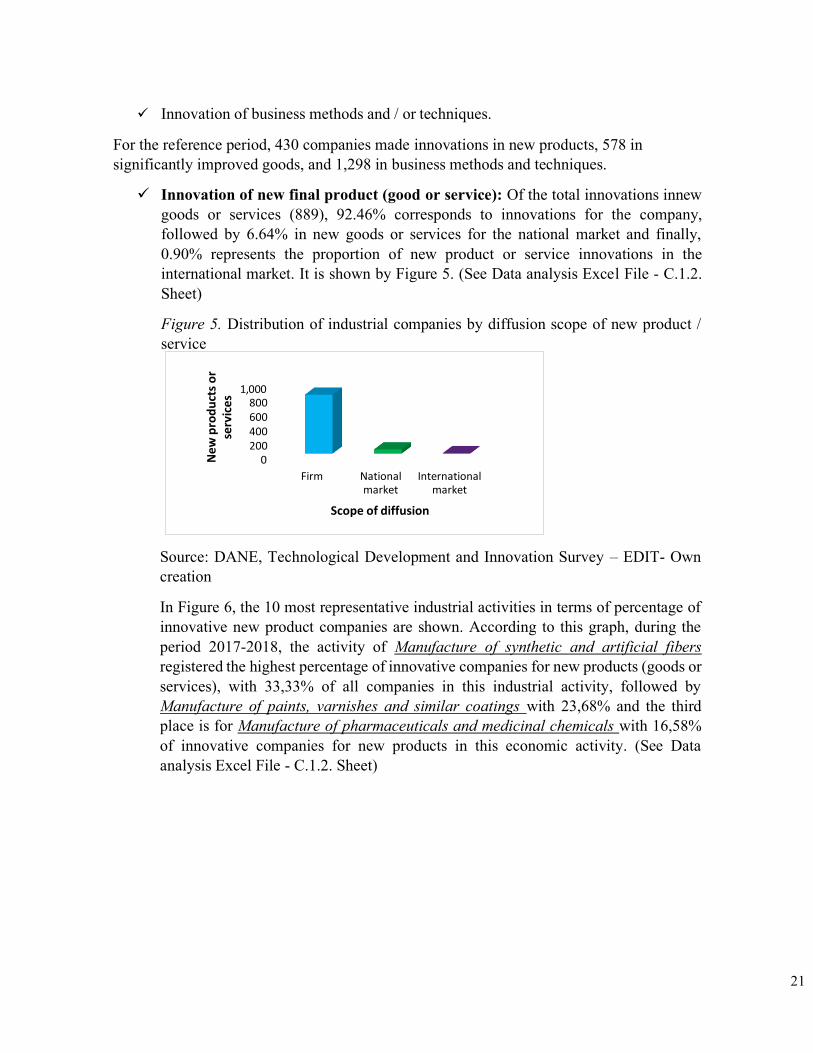
✓ Innovation of new final product (good or service): Of the total innovations innew goods or services (889), 92.46% corresponds to innovations for the company, followed by 6.64% in new goods or services for the national market and finally, 0.90% represents the proportion of new product or service innovations in the international market. It is shown by Figure 5. (See Data analysis Excel File - C.1.2. Sheet)
Figure 5. Distribution of industrial companies by diffusion scope of new product / service
Source: DANE, Technological Development and Innovation Survey – EDIT- Own creation
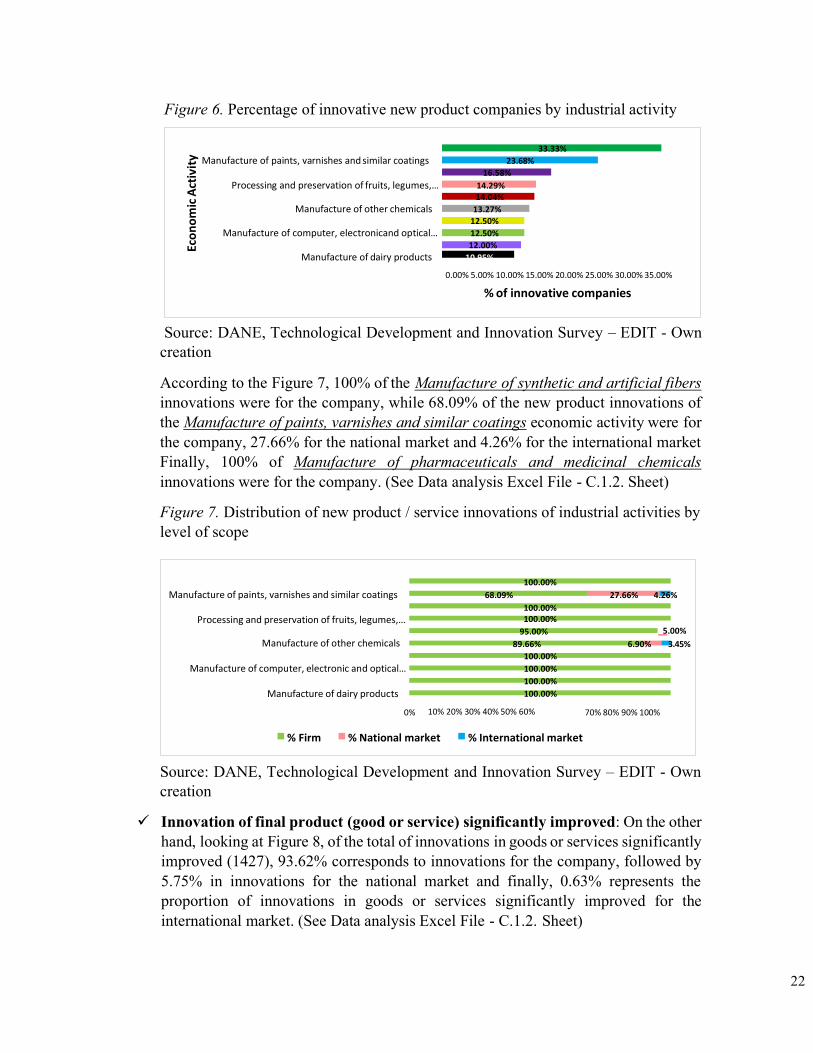
In Figure 6, the 10 most representative industrial activities in terms of percentage of innovative new product companies are shown. According to this graph, during the period 2017-2018, the activity of Manufacture of synthetic and artificial fibers registered the highest percentage of innovative companies for new products (goods or services), with 33,33% of all companies in this industrial activity, followed by Manufacture of paints, varnishes and similar coatings with 23,68% and the third place is for Manufacture of pharmaceuticals and medicinal chemicals with 16,58% of innovative companies for new products in this economic activity. (See Data analysis Excel File - C.1.2. Sheet)
1,000 800 600 400 200
Firm National International market market
Scope of diffusion
Ne
w p
rod
uct
s o
r se
rvic
es
22
Figure 6. Percentage of innovative new product companies by industrial activity
Source: DANE, Technological Development and Innovation Survey – EDIT - Own creation
According to the Figure 7, 100% of the Manufacture of synthetic and artificial fibers innovations were for the company, while 68.09% of the new product innovations of the Manufacture of paints, varnishes and similar coatings economic activity were for the company, 27.66% for the national market and 4.26% for the international market Finally, 100% of Manufacture of pharmaceuticals and medicinal chemicals innovations were for the company. (See Data analysis Excel File - C.1.2. Sheet)
Figure 7. Distribution of new product / service innovations of industrial activities by level of scope
Source: DANE, Technological Development and Innovation Survey – EDIT - Own creation
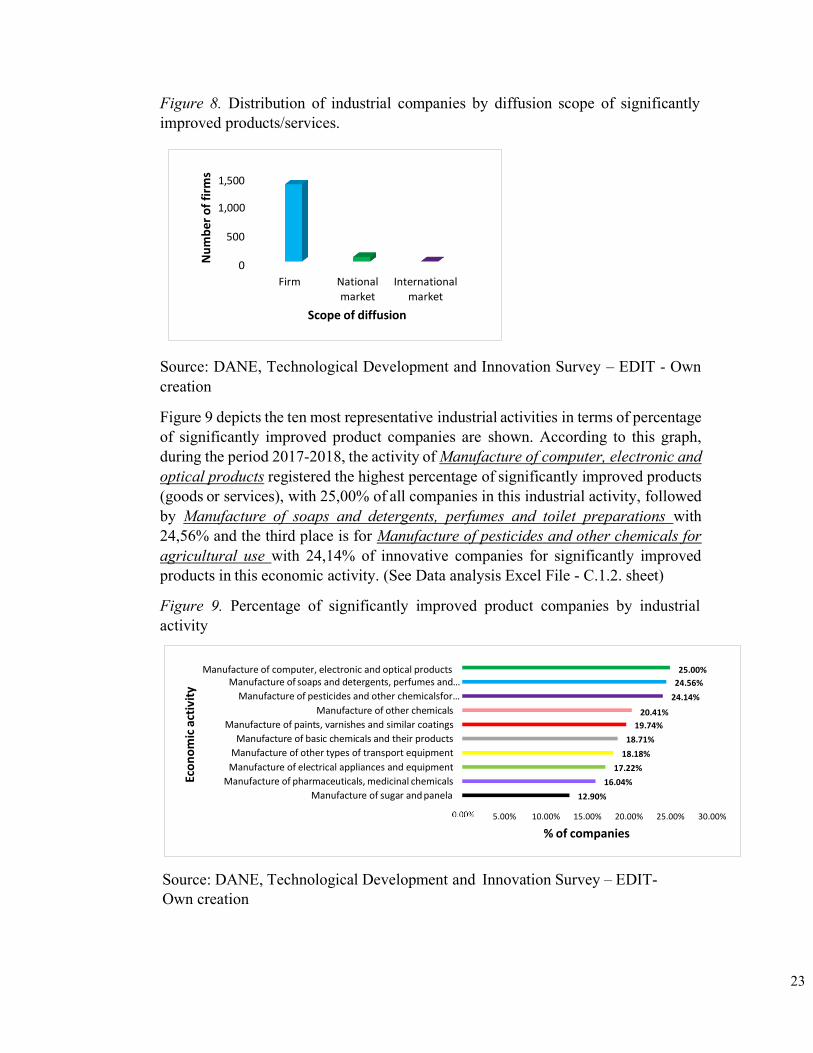
✓ Innovation of final product (good or service) significantly improved: On the other hand, looking at Figure 8, of the total of innovations in goods or services significantly improved (1427), 93.62% corresponds to innovations for the company, followed by 5.75% in innovations for the national market and finally, 0.63% represents the proportion of innovations in goods or services significantly improved for the international market. (See Data analysis Excel File - C.1.2. Sheet)
Eco
no
mic
Act
ivit
y
33.33%
Manufacture of paints, varnishes and similar coatings 23.68%
16.58%
Processing and preservation of fruits, legumes,… 14.29% 14.04%
Manufacture of other chemicals 13.27%
12.50%
Manufacture of computer, electronicand optical… 12.50%
12.00%
Manufacture of dairy products 10.95%
0.00% 5.00% 10.00% 15.00% 20.00% 25.00% 30.00% 35.00%
% of innovative companies
100.00%
Manufacture of paints, varnishes and similar coatings 68.09% 27.66% 4.26%
Processing and preservation of fruits, legumes,…
Manufacture of other chemicals
Manufacture of computer, electronic and optical…
Manufacture of dairy products
0%
100.00% 100.00%
95.00%
89.66%
100.00%
100.00%
100.00%
100.00%
10% 20% 30% 40% 50% 60%
5.00%
6.90% 3.45%
70% 80% 90% 100%
% Firm % National market % International market
23
Figure 8. Distribution of industrial companies by diffusion scope of significantly improved products/services.
Source: DANE, Technological Development and Innovation Survey – EDIT - Own creation
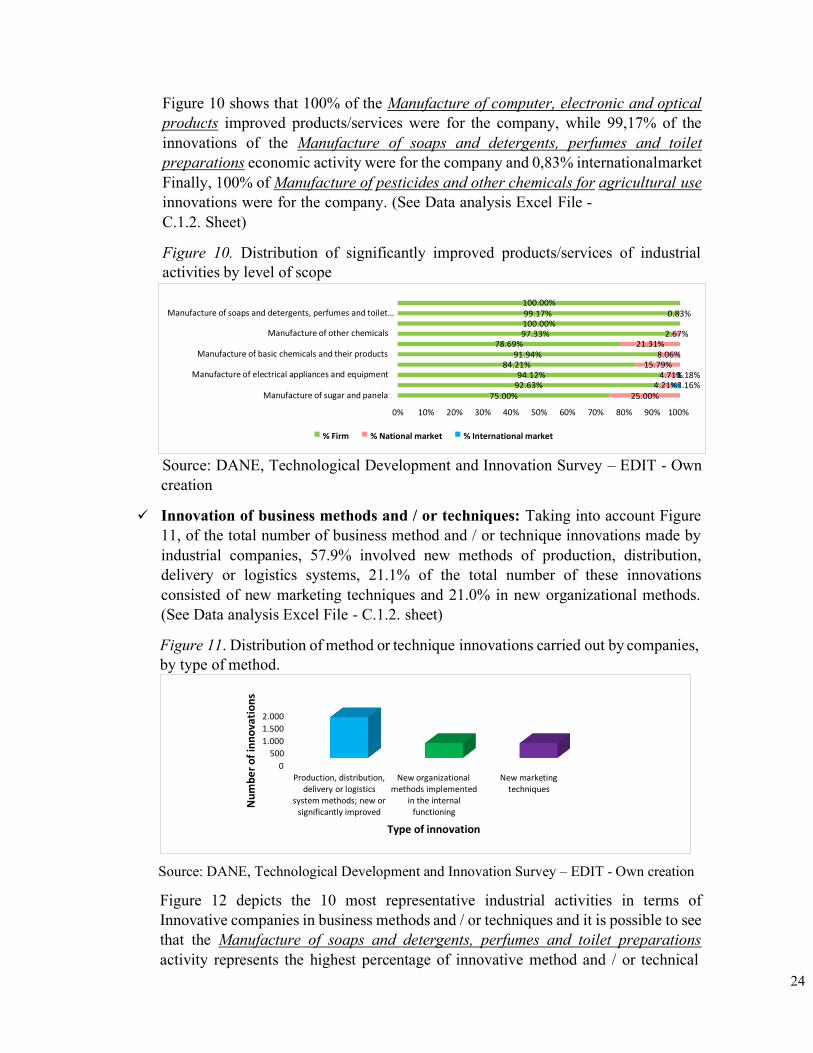
Figure 9 depicts the ten most representative industrial activities in terms of percentage of significantly improved product companies are shown. According to this graph, during the period 2017-2018, the activity of Manufacture of computer, electronic and optical products registered the highest percentage of significantly improved products (goods or services), with 25,00% of all companies in this industrial activity, followed by Manufacture of soaps and detergents, perfumes and toilet preparations with 24,56% and the third place is for Manufacture of pesticides and other chemicals for agricultural use with 24,14% of innovative companies for significantly improved products in this economic activity. (See Data analysis Excel File - C.1.2. sheet)
Figure 9. Percentage of significantly improved product companies by industrial activity
Source: DANE, Technological Development and Innovation Survey – EDIT- Own creation
Manufacture of computer, electronic and optical products Manufacture of soaps and detergents, perfumes and…
Manufacture of pesticides and other chemicalsfor…
Manufacture of other chemicals
Manufacture of paints, varnishes and similar coatings
Manufacture of basic chemicals and their products
Manufacture of other types of transport equipment
Manufacture of electrical appliances and equipment
Manufacture of pharmaceuticals, medicinal chemicals
Manufacture of sugar and panela
25.00%
24.56%
24.14%
20.41%
19.74%
18.71%
18.18%
17.22%
16.04%
12.90%
5.00% 10.00% 15.00% 20.00% 25.00% 30.00%
% of companies
1,500
1,000
500
Firm National International market market
Scope of diffusion
Eco
no
mic
act
ivit
y N
um
ber
of
firm
s
24
Figure 10 shows that 100% of the Manufacture of computer, electronic and optical products improved products/services were for the company, while 99,17% of the innovations of the Manufacture of soaps and detergents, perfumes and toilet preparations economic activity were for the company and 0,83% international market Finally, 100% of Manufacture of pesticides and other chemicals for agricultural use innovations were for the company. (See Data analysis Excel File - C.1.2. Sheet)
Figure 10. Distribution of significantly improved products/services of industrial activities by level of scope
Source: DANE, Technological Development and Innovation Survey – EDIT - Own creation
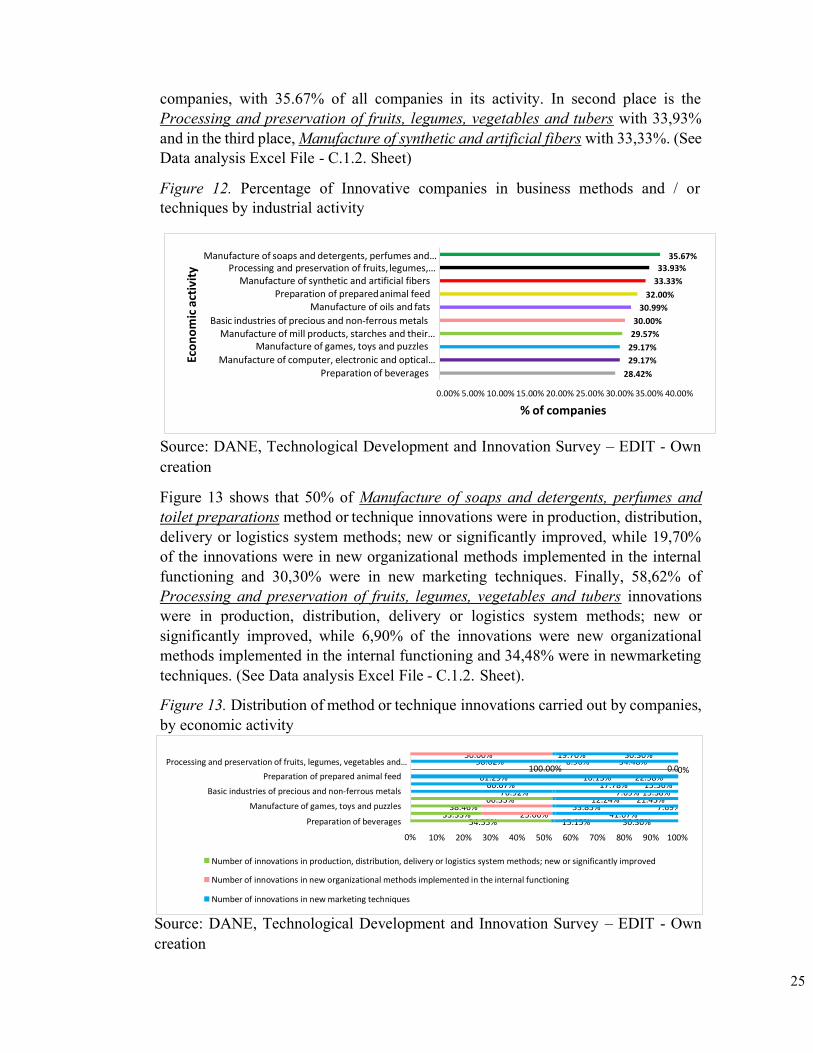
✓ Innovation of business methods and / or techniques: Taking into account Figure 11, of the total number of business method and / or technique innovations made by industrial companies, 57.9% involved new methods of production, distribution, delivery or logistics systems, 21.1% of the total number of these innovations consisted of new marketing techniques and 21.0% in new organizational methods. (See Data analysis Excel File - C.1.2. sheet)
Figure 11. Distribution of method or technique innovations carried out by companies, by type of method.
Source: DANE, Technological Development and Innovation Survey – EDIT - Own creation
Figure 12 depicts the 10 most representative industrial activities in terms of Innovative companies in business methods and / or techniques and it is possible to see that the Manufacture of soaps and detergents, perfumes and toilet preparations activity represents the highest percentage of innovative method and / or technical
100.00%
Manufacture of soaps and detergents, perfumes and toilet… 99.17% 0.83% 100.00%
Manufacture of other chemicals 97.33% 2.67% 78.69% 21.31%
Manufacture of basic chemicals and their products 91.94% 8.06% 84.21% 15.79%
Manufacture of electrical appliances and equipment 94.12% 4.71%1.18% 92.63% 4.21%3.16%
Manufacture of sugar and panela 75.00% 25.00%
0% 10% 20% 30% 40% 50% 60% 70% 80% 90% 100%
% Firm % National market % International market
2.000
1.500
1.000
500
0
Production, distribution, New organizational New marketing delivery or logistics methods implemented techniques
system methods; new or in the internal significantly improved functioning
Type of innovation
Nu
mb
er
of
inn
ova
tio
ns
25
Processing and preservation of fruits, legumes, vegetables and…
Preparation of prepared animal feed
Basic industries of precious and non-ferrous metals
Manufacture of games, toys and puzzles
Preparation of beverages
0%
0%
54.55% 15.15% 30.30%
10% 20% 30% 40% 50% 60% 70% 80% 90% 100%
Number of innovations in production, distribution, delivery or logistics system methods; new or significantly improved
Number of innovations in new organizational methods implemented in the internal functioning
Number of innovations in new marketing techniques
companies, with 35.67% of all companies in its activity. In second place is the Processing and preservation of fruits, legumes, vegetables and tubers with 33,93% and in the third place, Manufacture of synthetic and artificial fibers with 33,33%. (See Data analysis Excel File - C.1.2. Sheet)
Figure 12. Percentage of Innovative companies in business methods and / or techniques by industrial activity
Source: DANE, Technological Development and Innovation Survey – EDIT - Own creation
Figure 13 shows that 50% of Manufacture of soaps and detergents, perfumes and toilet preparations method or technique innovations were in production, distribution, delivery or logistics system methods; new or significantly improved, while 19,70% of the innovations were in new organizational methods implemented in the internal functioning and 30,30% were in new marketing techniques. Finally, 58,62% of Processing and preservation of fruits, legumes, vegetables and tubers innovations were in production, distribution, delivery or logistics system methods; new or significantly improved, while 6,90% of the innovations were new organizational methods implemented in the internal functioning and 34,48% were in newmarketing techniques. (See Data analysis Excel File - C.1.2. Sheet).
Figure 13. Distribution of method or technique innovations carried out by companies, by economic activity
50.00% 19.70% 30.30%
58.62% 6.90% 34.48% 100.00% 0.0
61.29% 16.13% 22.58% 66.67% 17.78% 15.56%
76.92% 7.69% 15.38% 66.33% 12.24% 21.43%
38.46% 53.85% 7.69% 33.33% 25.00% 41.67%
Source: DANE, Technological Development and Innovation Survey – EDIT - Own creation
Manufacture of soaps and detergents, perfumes and… Processing and preservation of fruits, legumes,…
Manufacture of synthetic and artificial fibers Preparation of prepared animal feed
Manufacture of oils and fats
Basic industries of precious and non-ferrous metals Manufacture of mill products, starches and their…
Manufacture of games, toys and puzzles
Manufacture of computer, electronic and optical… Preparation of beverages
35.67%
33.93%
33.33%
32.00%
30.99%
30.00%
29.57%
29.17%
29.17%
28.42%
0.00% 5.00% 10.00% 15.00% 20.00% 25.00% 30.00% 35.00% 40.00%
% of companies
Eco
no
mic
act
ivit
y
26
-Type of innovation impact:
EDIT classifies the types of impact according to where they are generated:
✓ Product ✓ Market ✓ Process ✓ Other impacts
1572 innovative companies are taken (an innovative company is understood as one that during the reference period obtained new or significantly improved goods or services, either for the international or national market or for the same company; or introduced new or significantly improved methods of service delivery, or a new organizational or marketing form).
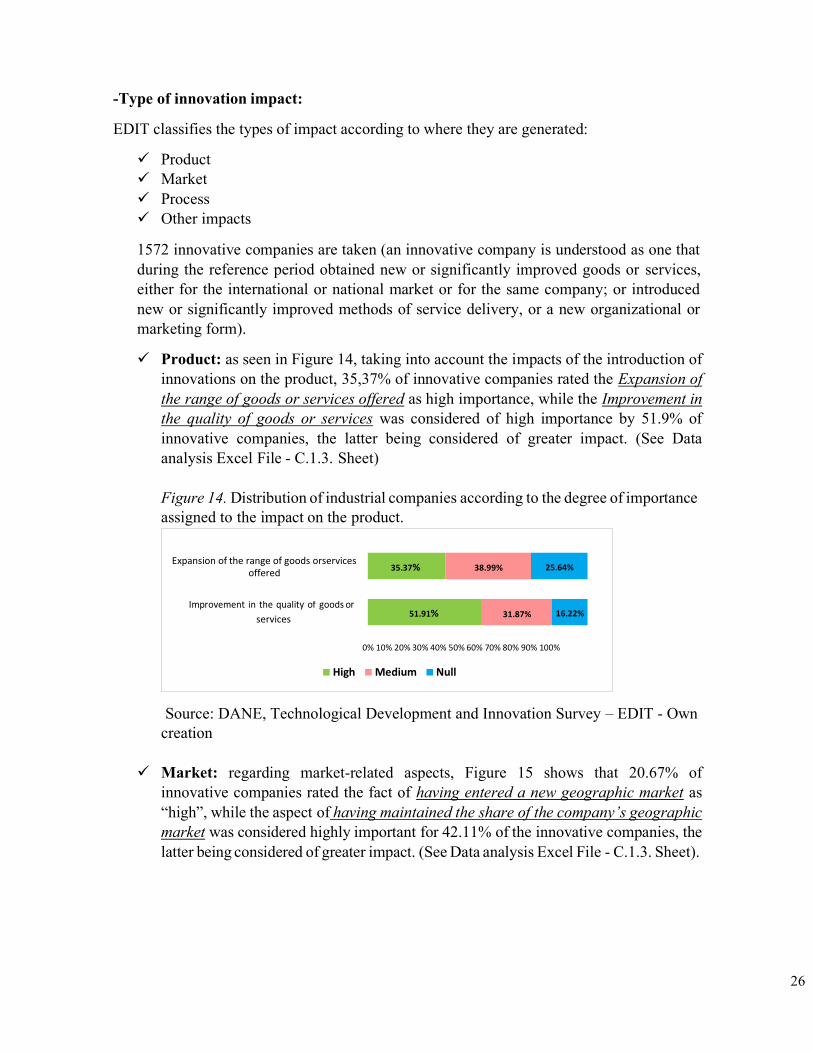
✓ Product: as seen in Figure 14, taking into account the impacts of the introduction of innovations on the product, 35,37% of innovative companies rated the Expansion of the range of goods or services offered as high importance, while the Improvement in the quality of goods or services was considered of high importance by 51.9% of innovative companies, the latter being considered of greater impact. (See Data analysis Excel File - C.1.3. Sheet)
Figure 14. Distribution of industrial companies according to the degree of importance assigned to the impact on the product.
Source: DANE, Technological Development and Innovation Survey – EDIT - Own creation
✓ Market: regarding market-related aspects, Figure 15 shows that 20.67% of
innovative companies rated the fact of having entered a new geographic market as “high”, while the aspect of having maintained the share of the company’s geographic market was considered highly important for 42.11% of the innovative companies, the latter being considered of greater impact. (See Data analysis Excel File - C.1.3. Sheet).
Expansion of the range of goods orservices offered
38.99% 25.64%
services 31.87% 16.22%
0% 10% 20% 30% 40% 50% 60% 70% 80% 90% 100%
High Medium Null
51.91%
35.37%
27
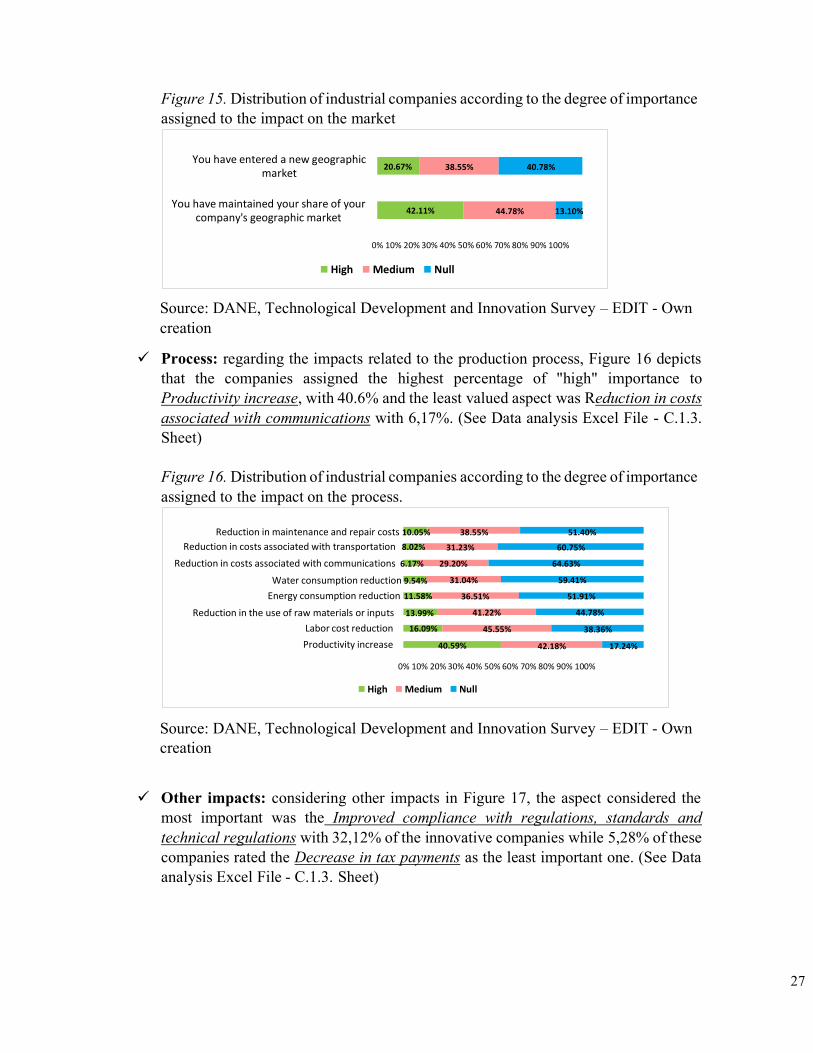
Figure 15. Distribution of industrial companies according to the degree of importance assigned to the impact on the market
Source: DANE, Technological Development and Innovation Survey – EDIT - Own creation
✓ Process: regarding the impacts related to the production process, Figure 16 depicts that the companies assigned the highest percentage of "high" importance to Productivity increase, with 40.6% and the least valued aspect was Reduction in costs associated with communications with 6,17%. (See Data analysis Excel File - C.1.3. Sheet)
Figure 16. Distribution of industrial companies according to the degree of importance assigned to the impact on the process.
Source: DANE, Technological Development and Innovation Survey – EDIT - Own creation
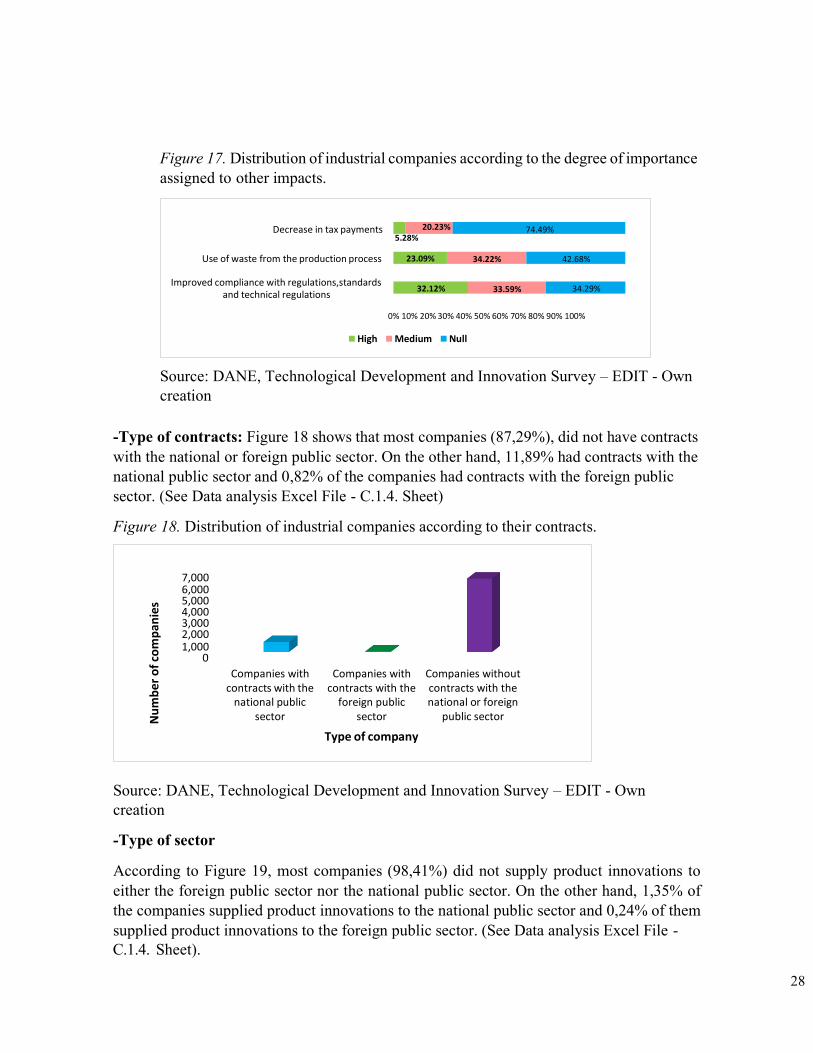
✓ Other impacts: considering other impacts in Figure 17, the aspect considered the most important was the Improved compliance with regulations, standards and technical regulations with 32,12% of the innovative companies while 5,28% of these companies rated the Decrease in tax payments as the least important one. (See Data analysis Excel File - C.1.3. Sheet)
You have entered a new geographic market
38.55% 40.78%
You have maintained your share of your company's geographic market
44.78% 13.10%
0% 10% 20% 30% 40% 50% 60% 70% 80% 90% 100%
High Medium Null
42.11%
20.67%
Reduction in maintenance and repair costs 10.05%
Reduction in costs associated with transportation 8.02%
Reduction in costs associated with communications 6.17%
Water consumption reduction 9.54%
Energy consumption reduction 11.58%
Reduction in the use of raw materials or inputs 13.99%
Labor cost reduction 16.09%
Productivity increase
38.55%
31.23%
29.20%
31.04%
36.51%
41.22%
45.55%
40.59%
51.40%
60.75%
64.63%
59.41%
51.91%
44.78%
38.36%
42.18% 17.24%
0% 10% 20% 30% 40% 50% 60% 70% 80% 90% 100%
High Medium Null
28
Figure 17. Distribution of industrial companies according to the degree of importance assigned to other impacts.
Source: DANE, Technological Development and Innovation Survey – EDIT - Own creation
-Type of contracts: Figure 18 shows that most companies (87,29%), did not have contracts with the national or foreign public sector. On the other hand, 11,89% had contracts with the national public sector and 0,82% of the companies had contracts with the foreign public sector. (See Data analysis Excel File - C.1.4. Sheet)
Figure 18. Distribution of industrial companies according to their contracts.
7,000 6,000 5,000 4,000 3,000 2,000 1,000
Companies with contracts with the
national public sector
Companies with contracts with the
foreign public sector
Type of company
Companies without contracts with the national or foreign
public sector
Source: DANE, Technological Development and Innovation Survey – EDIT - Own creation
-Type of sector
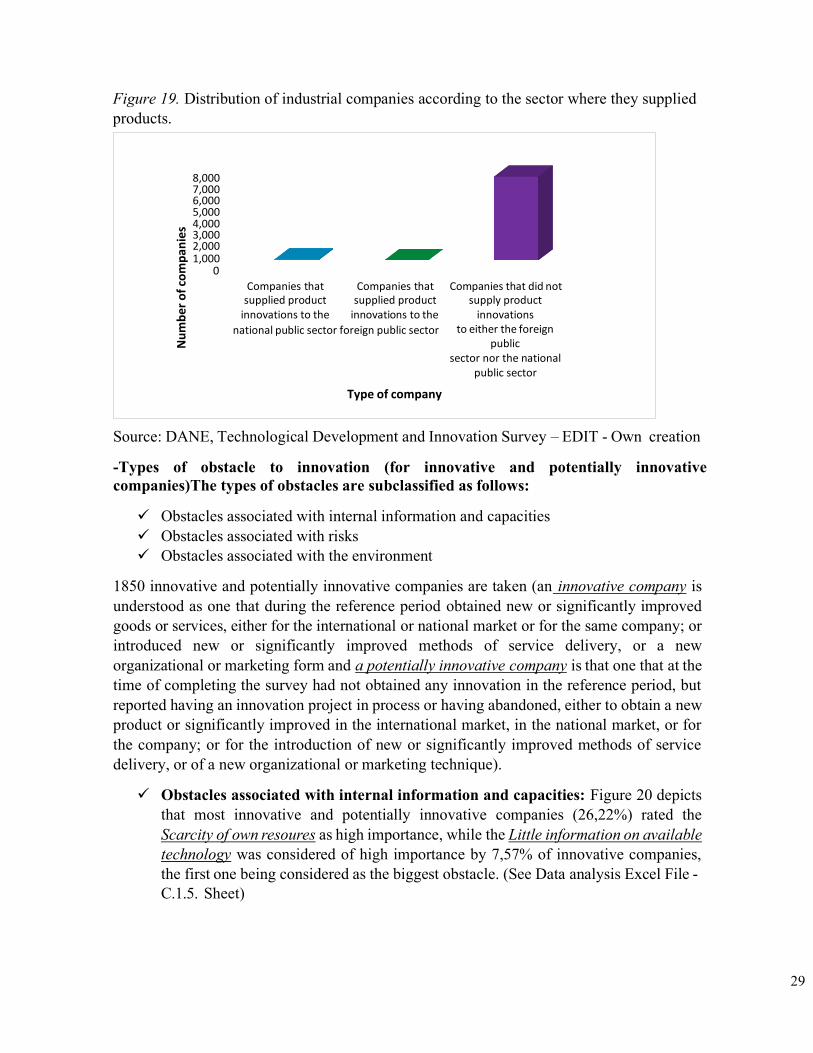
According to Figure 19, most companies (98,41%) did not supply product innovations to either the foreign public sector nor the national public sector. On the other hand, 1,35% of the companies supplied product innovations to the national public sector and 0,24% of them supplied product innovations to the foreign public sector. (See Data analysis Excel File - C.1.4. Sheet).
Nu
mb
er o
f co
mp
anie
s
Decrease in tax payments 20.23% 74.49% 5.28%
Use of waste from the production process 34.22% 42.68%
Improved compliance with regulations,standards and technical regulations
33.59% 34.29%
0% 10% 20% 30% 40% 50% 60% 70% 80% 90% 100%
High Medium Null
32.12%
23.09%
29
Figure 19. Distribution of industrial companies according to the sector where they supplied products.
Source: DANE, Technological Development and Innovation Survey – EDIT - Own creation
-Types of obstacle to innovation (for innovative and potentially innovative companies)The types of obstacles are subclassified as follows:
✓ Obstacles associated with internal information and capacities ✓ Obstacles associated with risks ✓ Obstacles associated with the environment
1850 innovative and potentially innovative companies are taken (an innovative company is understood as one that during the reference period obtained new or significantly improved goods or services, either for the international or national market or for the same company; or introduced new or significantly improved methods of service delivery, or a new organizational or marketing form and a potentially innovative company is that one that at the time of completing the survey had not obtained any innovation in the reference period, but reported having an innovation project in process or having abandoned, either to obtain a new product or significantly improved in the international market, in the national market, or for the company; or for the introduction of new or significantly improved methods of service delivery, or of a new organizational or marketing technique).
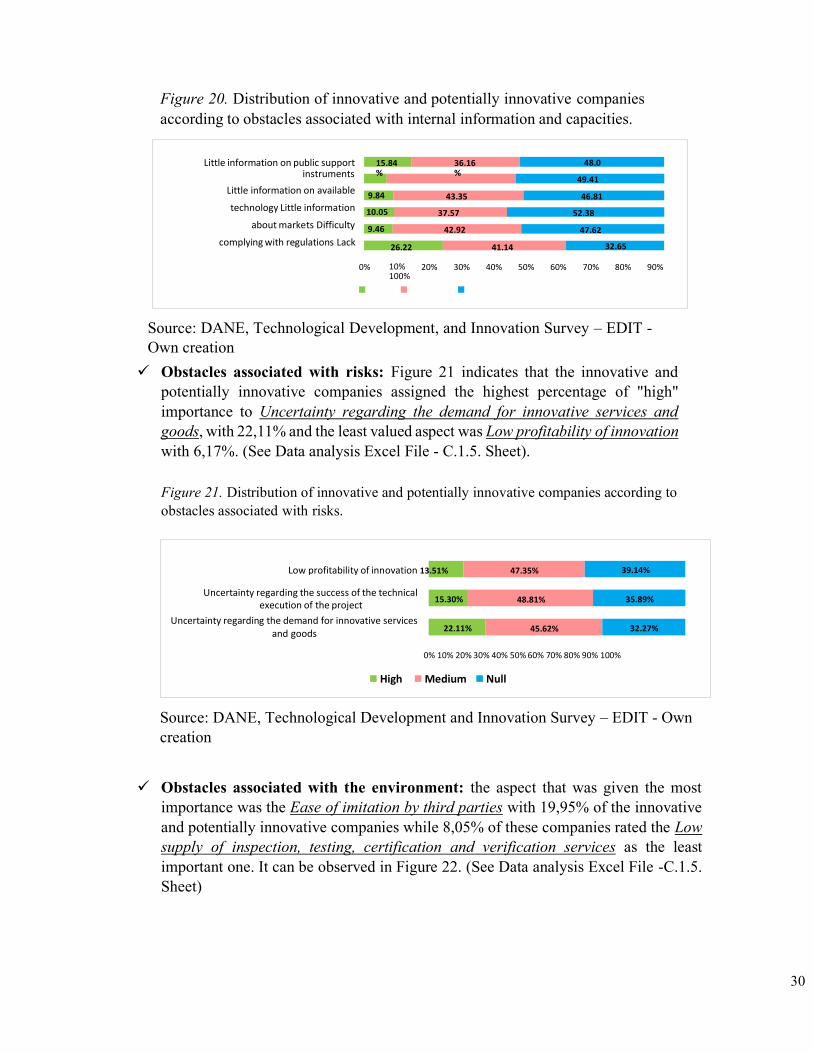
✓ Obstacles associated with internal information and capacities: Figure 20 depicts that most innovative and potentially innovative companies (26,22%) rated the Scarcity of own resoures as high importance, while the Little information on available technology was considered of high importance by 7,57% of innovative companies, the first one being considered as the biggest obstacle. (See Data analysis Excel File - C.1.5. Sheet)
8,000 7,000 6,000 5,000 4,000 3,000 2,000 1,000
Companies that Companies that supplied product supplied product
innovations to the innovations to the
national public sector foreign public sector
Companies that did not supply product
innovations to either the foreign
public sector nor the national
public sector
Type of company
Nu
mb
er o
f co
mp
anie
s
30
Figure 20. Distribution of innovative and potentially innovative companies according to obstacles associated with internal information and capacities.
Source: DANE, Technological Development, and Innovation Survey – EDIT - Own creation ✓ Obstacles associated with risks: Figure 21 indicates that the innovative and
potentially innovative companies assigned the highest percentage of "high" importance to Uncertainty regarding the demand for innovative services and goods, with 22,11% and the least valued aspect was Low profitability of innovation with 6,17%. (See Data analysis Excel File - C.1.5. Sheet).
Figure 21. Distribution of innovative and potentially innovative companies according to obstacles associated with risks.
Source: DANE, Technological Development and Innovation Survey – EDIT - Own creation
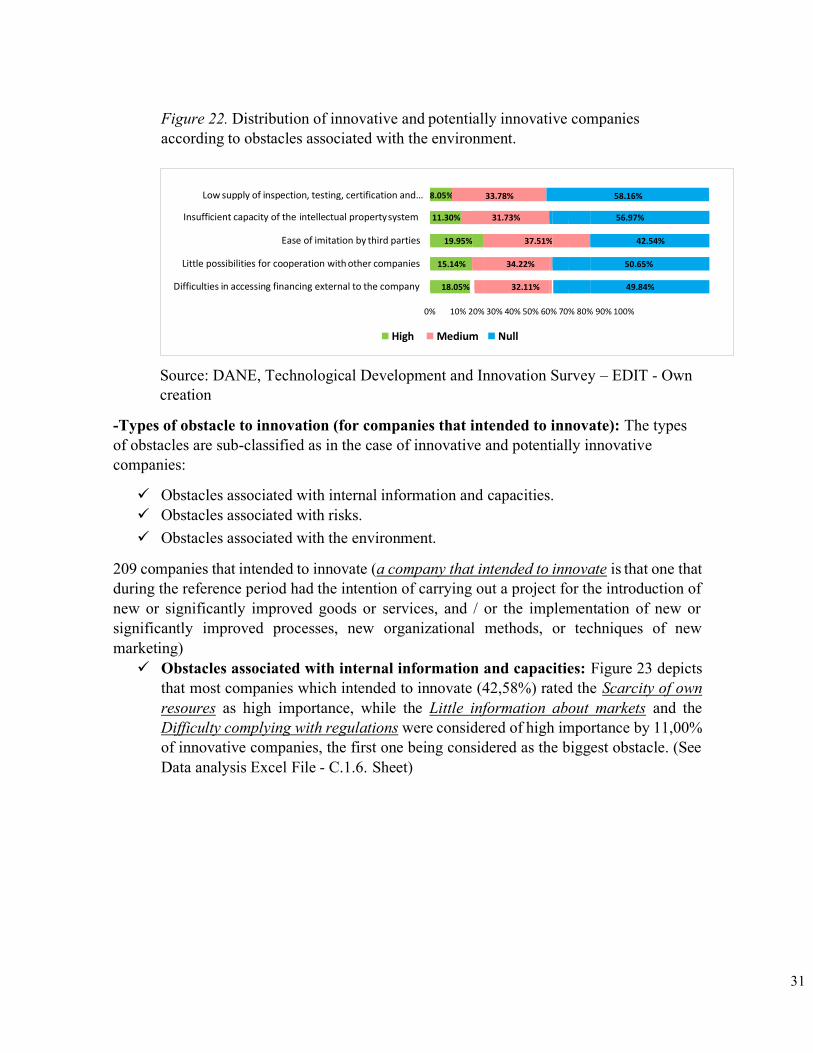
✓ Obstacles associated with the environment: the aspect that was given the most importance was the Ease of imitation by third parties with 19,95% of the innovative and potentially innovative companies while 8,05% of these companies rated the Low supply of inspection, testing, certification and verification services as the least important one. It can be observed in Figure 22. (See Data analysis Excel File -C.1.5. Sheet)
Little information on public support instruments
Little information on available
technology Little information
about markets Difficulty
complying with regulations Lack
15.84 %
36.16 %
43.35
37.57
42.92
48.0
49.41
46.81
52.38
47.62
26.22 41.14 32.65
0% 10% 100%
20% 30% 40% 50% 60% 70% 80% 90%
9.46
10.05
9.84
Low profitability of innovation 13.51% 47.35% 39.14%
Uncertainty regarding the success of the technical execution of the project
Uncertainty regarding the demand for innovative services and goods
48.81% 35.89%
45.62% 32.27%
0% 10% 20% 30% 40% 50% 60% 70% 80% 90% 100%
High Medium Null
22.11%
15.30%
31
Low supply of inspection, testing, certification and… 33.78% 58.16%
0% 10% 20% 30% 40% 50% 60% 70% 80% 90% 100%
High Medium Null
8.05%
Figure 22. Distribution of innovative and potentially innovative companies according to obstacles associated with the environment.
Insufficient capacity of the intellectual property system 11.30% 31.73% 56.97%
Ease of imitation by third parties 19.95% 37.51% 42.54%
Little possibilities for cooperation with other companies 15.14% 34.22% 50.65%
Difficulties in accessing financing external to the company 18.05% 32.11% 49.84%
Source: DANE, Technological Development and Innovation Survey – EDIT - Own creation
-Types of obstacle to innovation (for companies that intended to innovate): The types of obstacles are sub-classified as in the case of innovative and potentially innovative companies:
✓ Obstacles associated with internal information and capacities. ✓ Obstacles associated with risks. ✓ Obstacles associated with the environment.
209 companies that intended to innovate (a company that intended to innovate is that one that during the reference period had the intention of carrying out a project for the introduction of new or significantly improved goods or services, and / or the implementation of new or significantly improved processes, new organizational methods, or techniques of new marketing) ✓ Obstacles associated with internal information and capacities: Figure 23 depicts
that most companies which intended to innovate (42,58%) rated the Scarcity of own resoures as high importance, while the Little information about markets and the Difficulty complying with regulations were considered of high importance by 11,00% of innovative companies, the first one being considered as the biggest obstacle. (See Data analysis Excel File - C.1.6. Sheet)
32
Little information on public support instruments
Little information on available technology
Little information about markets
Difficulty complying with regulations
Lack of qualified personnel
Scarcity of own resources
0% 10% 20% 30% 40% 50% 60% 70% 80% 90% 100%
High Medium Null
Figure 23. Distribution of companies that intended to innovate according to obstacles associated with internal information and capacities.
18.66% 37.32% 44.02%
11.96% 40.67% 47.37%
11.00% 48.33% 40.67%
11.00% 39.71% 49.28%
14.35% 44.50% 41.15%
42.58% 42.58% 14.83%
Source: DANE, Technological Development, and Innovation Survey – EDIT - Own creation
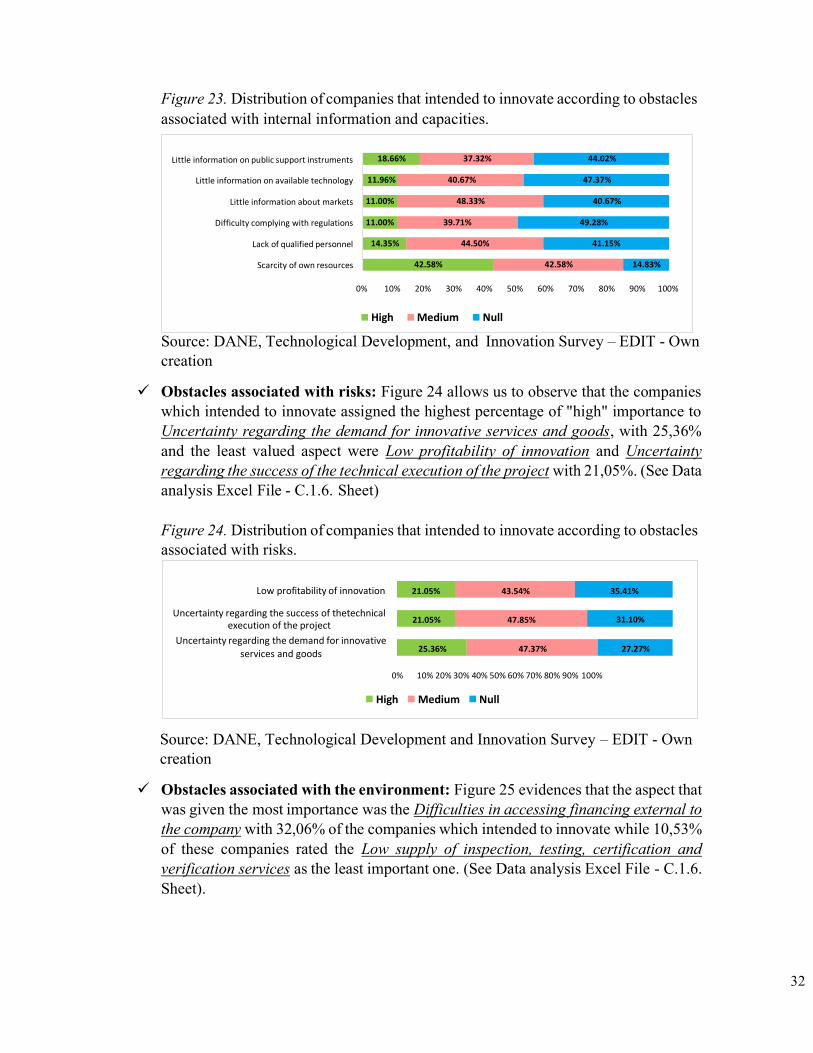
✓ Obstacles associated with risks: Figure 24 allows us to observe that the companies which intended to innovate assigned the highest percentage of "high" importance to Uncertainty regarding the demand for innovative services and goods, with 25,36% and the least valued aspect were Low profitability of innovation and Uncertainty regarding the success of the technical execution of the project with 21,05%. (See Data analysis Excel File - C.1.6. Sheet)
Figure 24. Distribution of companies that intended to innovate according to obstacles associated with risks.
Source: DANE, Technological Development and Innovation Survey – EDIT - Own creation
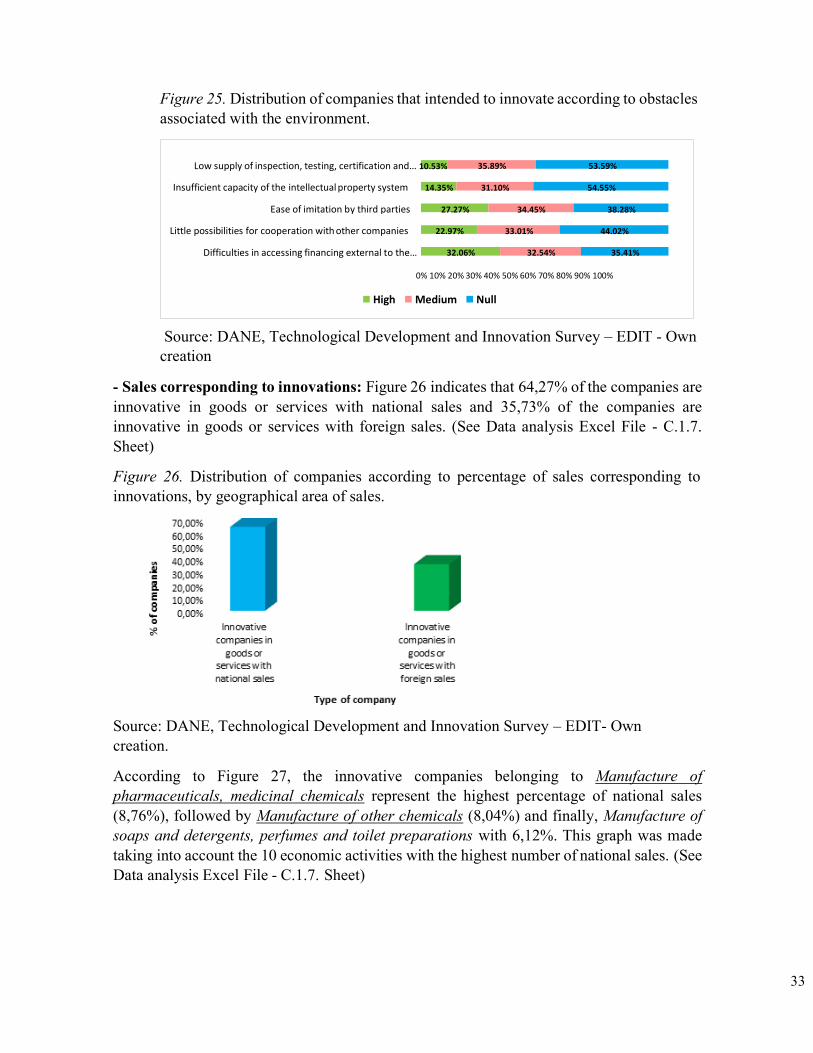
✓ Obstacles associated with the environment: Figure 25 evidences that the aspect that was given the most importance was the Difficulties in accessing financing external to the company with 32,06% of the companies which intended to innovate while 10,53% of these companies rated the Low supply of inspection, testing, certification and verification services as the least important one. (See Data analysis Excel File - C.1.6. Sheet).
Low profitability of innovation 21.05% 43.54% 35.41%
Uncertainty regarding the success of thetechnical execution of the project
Uncertainty regarding the demand for innovative services and goods
21.05% 47.85% 31.10%
25.36% 47.37% 27.27%
0% 10% 20% 30% 40% 50% 60% 70% 80% 90% 100%
High Medium Null
33
Figure 25. Distribution of companies that intended to innovate according to obstacles associated with the environment.
Source: DANE, Technological Development and Innovation Survey – EDIT - Own creation
- Sales corresponding to innovations: Figure 26 indicates that 64,27% of the companies are innovative in goods or services with national sales and 35,73% of the companies are innovative in goods or services with foreign sales. (See Data analysis Excel File - C.1.7. Sheet)
Figure 26. Distribution of companies according to percentage of sales corresponding to innovations, by geographical area of sales.
Source: DANE, Technological Development and Innovation Survey – EDIT- Own creation.
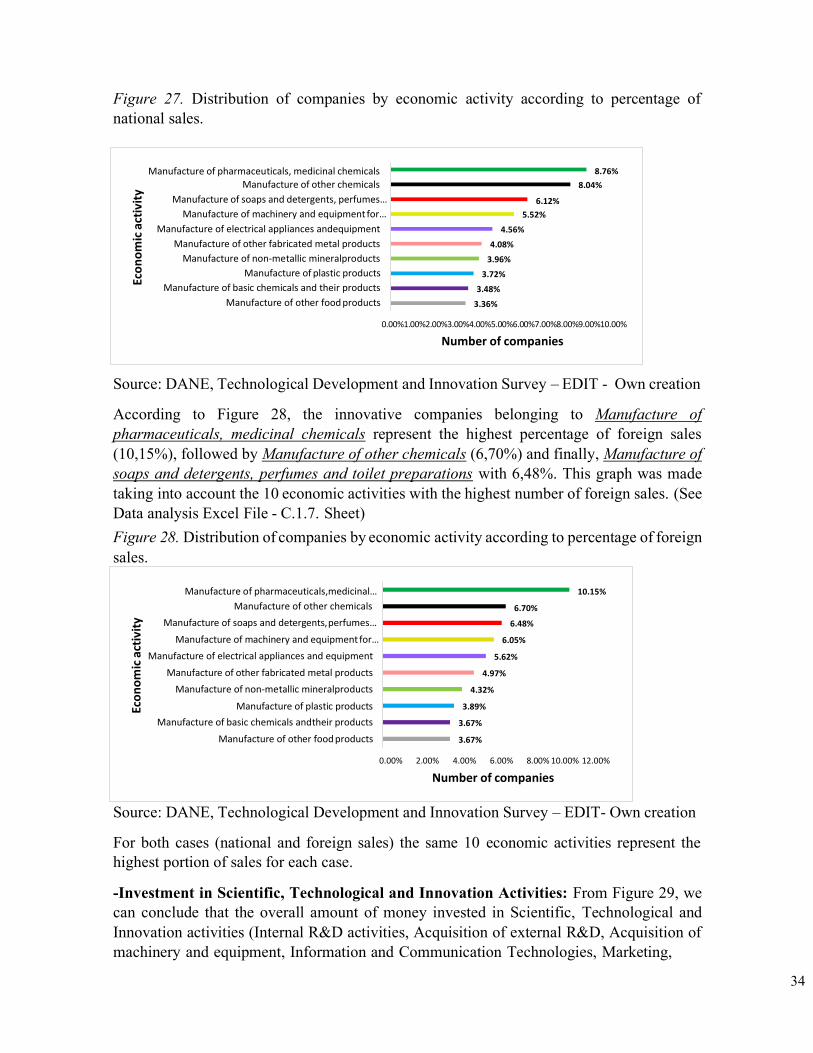
According to Figure 27, the innovative companies belonging to Manufacture of pharmaceuticals, medicinal chemicals represent the highest percentage of national sales (8,76%), followed by Manufacture of other chemicals (8,04%) and finally, Manufacture of soaps and detergents, perfumes and toilet preparations with 6,12%. This graph was made taking into account the 10 economic activities with the highest number of national sales. (See Data analysis Excel File - C.1.7. Sheet)
Low supply of inspection, testing, certification and… 10.53% 35.89% 53.59%
Insufficient capacity of the intellectual property system 14.35% 31.10% 54.55%
Ease of imitation by third parties 27.27% 34.45% 38.28%
Little possibilities for cooperation with other companies 22.97% 33.01% 44.02%
Difficulties in accessing financing external to the… 32.06% 32.54% 35.41%
0% 10% 20% 30% 40% 50% 60% 70% 80% 90% 100%
High Medium Null
34
Figure 27. Distribution of companies by economic activity according to percentage of national sales.
Source: DANE, Technological Development and Innovation Survey – EDIT - Own creation
According to Figure 28, the innovative companies belonging to Manufacture of pharmaceuticals, medicinal chemicals represent the highest percentage of foreign sales (10,15%), followed by Manufacture of other chemicals (6,70%) and finally, Manufacture of soaps and detergents, perfumes and toilet preparations with 6,48%. This graph was made taking into account the 10 economic activities with the highest number of foreign sales. (See Data analysis Excel File - C.1.7. Sheet) Figure 28. Distribution of companies by economic activity according to percentage of foreign sales.
Source: DANE, Technological Development and Innovation Survey – EDIT- Own creation
For both cases (national and foreign sales) the same 10 economic activities represent the highest portion of sales for each case.
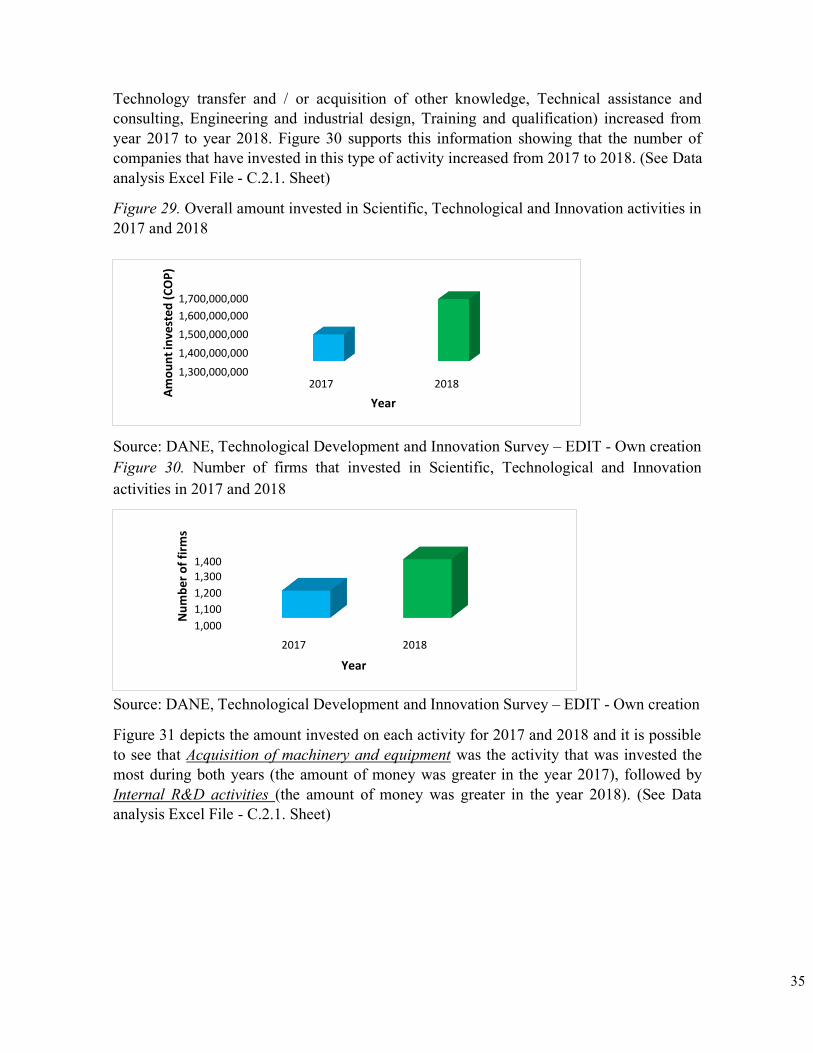
-Investment in Scientific, Technological and Innovation Activities: From Figure 29, we can conclude that the overall amount of money invested in Scientific, Technological and Innovation activities (Internal R&D activities, Acquisition of external R&D, Acquisition of machinery and equipment, Information and Communication Technologies, Marketing,
Manufacture of pharmaceuticals, medicinal chemicals Manufacture of other chemicals
Manufacture of soaps and detergents, perfumes…
Manufacture of machinery and equipment for…
Manufacture of electrical appliances andequipment
Manufacture of other fabricated metal products
Manufacture of non-metallic mineralproducts
Manufacture of plastic products
Manufacture of basic chemicals and their products
Manufacture of other food products
8.76%
8.04%
6.12%
5.52%
4.56%
4.08%
3.96%
3.72%
3.48%
3.36%
0.00%1.00%2.00%3.00%4.00%5.00%6.00%7.00%8.00%9.00%10.00%
Number of companies
Manufacture of pharmaceuticals,medicinal…
Manufacture of other chemicals
Manufacture of soaps and detergents, perfumes…
Manufacture of machinery and equipment for…
Manufacture of electrical appliances and equipment
Manufacture of other fabricated metal products
Manufacture of non-metallic mineralproducts
Manufacture of plastic products
Manufacture of basic chemicals andtheir products
Manufacture of other food products
10.15%
6.70%
6.48%
6.05%
5.62%
4.97%
4.32%
3.89%
3.67%
3.67%
0.00% 2.00% 4.00% 6.00% 8.00% 10.00% 12.00%
Number of companies
Eco
no
mic
act
ivit
y Ec
on
om
ic a
ctiv
ity
35
Technology transfer and / or acquisition of other knowledge, Technical assistance and consulting, Engineering and industrial design, Training and qualification) increased from year 2017 to year 2018. Figure 30 supports this information showing that the number of companies that have invested in this type of activity increased from 2017 to 2018. (See Data analysis Excel File - C.2.1. Sheet)
Figure 29. Overall amount invested in Scientific, Technological and Innovation activities in 2017 and 2018
Source: DANE, Technological Development and Innovation Survey – EDIT - Own creation Figure 30. Number of firms that invested in Scientific, Technological and Innovation activities in 2017 and 2018
Source: DANE, Technological Development and Innovation Survey – EDIT - Own creation
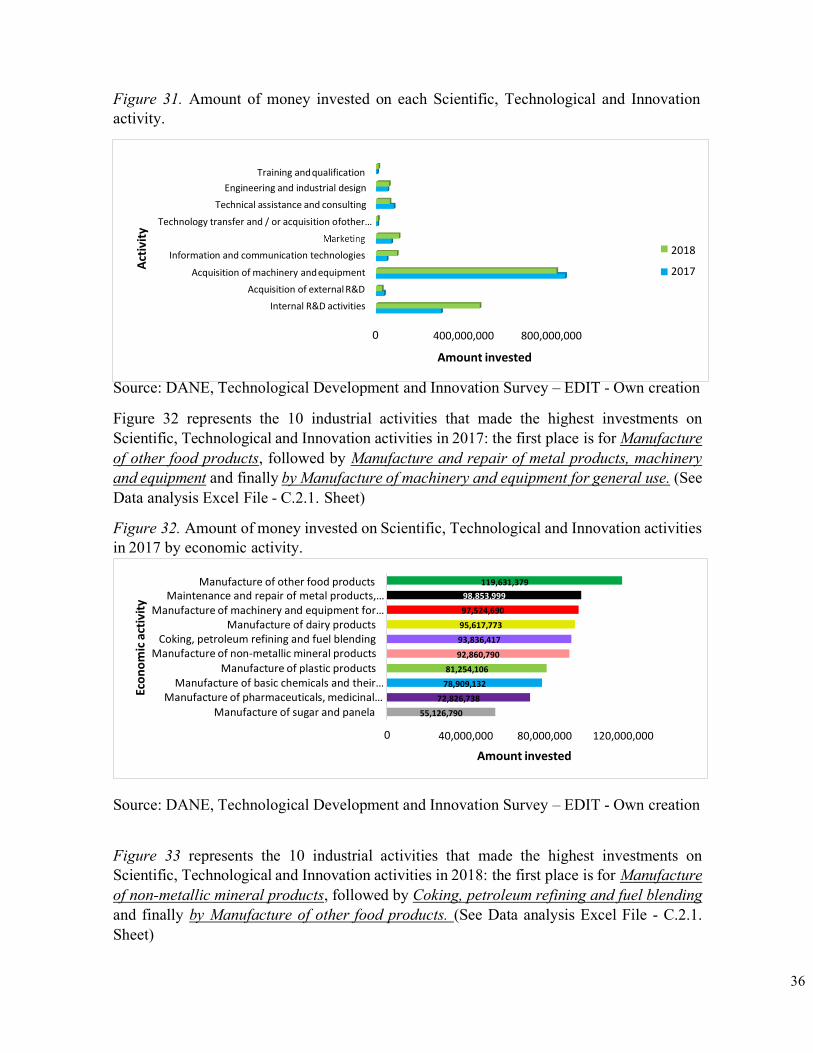
Figure 31 depicts the amount invested on each activity for 2017 and 2018 and it is possible to see that Acquisition of machinery and equipment was the activity that was invested the most during both years (the amount of money was greater in the year 2017), followed by Internal R&D activities (the amount of money was greater in the year 2018). (See Data analysis Excel File - C.2.1. Sheet)
1,700,000,000
1,600,000,000
1,500,000,000
1,400,000,000
1,300,000,000 2017 2018
Year
1,400 1,300
1,200
1,100
1,000
2017 2018
Year
Am
ou
nt
inve
sted
(C
OP
) N
um
ber
of
firm
s
36
Training and qualification
Engineering and industrial design
Technical assistance and consulting
Technology transfer and / or acquisition ofother…
Information and communication technologies
Acquisition of machinery and equipment
Acquisition of external R&D
Internal R&D activities
2018
2017
400,000,000 800,000,000
Amount invested
Figure 31. Amount of money invested on each Scientific, Technological and Innovation activity.
Source: DANE, Technological Development and Innovation Survey – EDIT - Own creation
Figure 32 represents the 10 industrial activities that made the highest investments on Scientific, Technological and Innovation activities in 2017: the first place is for Manufacture of other food products, followed by Manufacture and repair of metal products, machinery and equipment and finally by Manufacture of machinery and equipment for general use. (See Data analysis Excel File - C.2.1. Sheet)
Figure 32. Amount of money invested on Scientific, Technological and Innovation activities in 2017 by economic activity.
Source: DANE, Technological Development and Innovation Survey – EDIT - Own creation
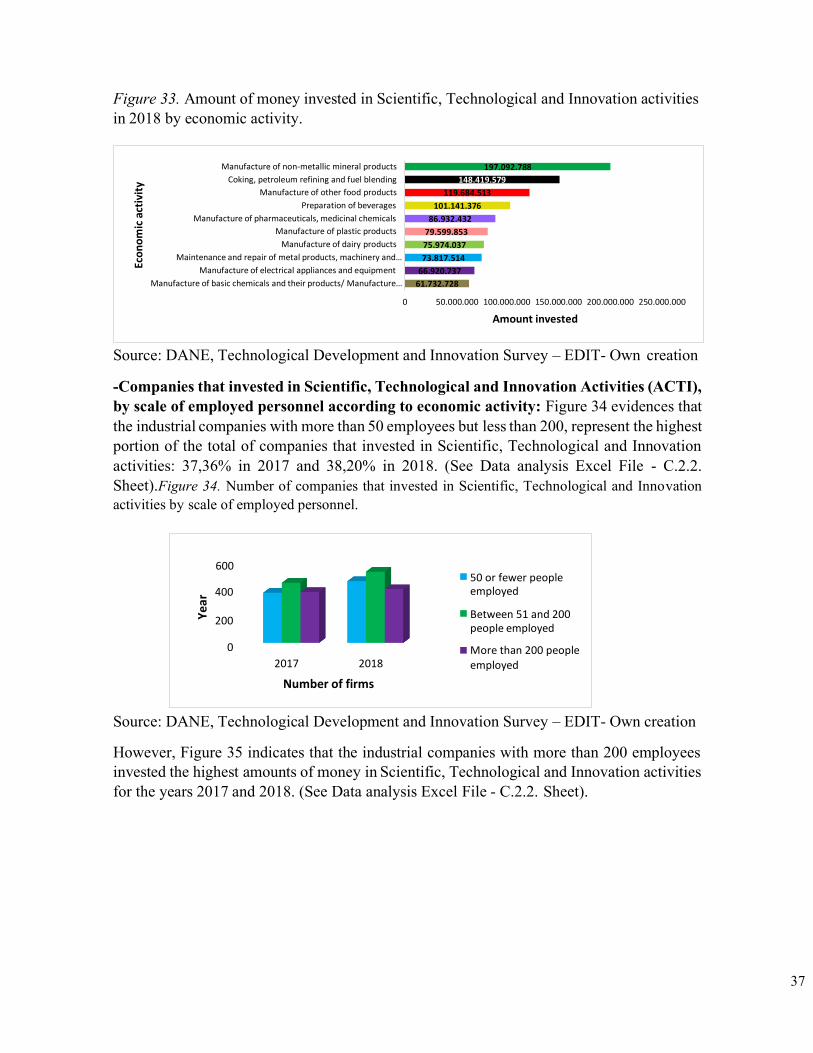
Figure 33 represents the 10 industrial activities that made the highest investments on Scientific, Technological and Innovation activities in 2018: the first place is for Manufacture of non-metallic mineral products, followed by Coking, petroleum refining and fuel blending and finally by Manufacture of other food products. (See Data analysis Excel File - C.2.1. Sheet)
Manufacture of other food products Maintenance and repair of metal products,…
Manufacture of machinery and equipment for… Manufacture of dairy products
Coking, petroleum refining and fuel blending Manufacture of non-metallic mineral products
Manufacture of plastic products Manufacture of basic chemicals and their…
Manufacture of pharmaceuticals, medicinal… Manufacture of sugar and panela
119,631,379
98,853,999
97,524,690
95,617,773
93,836,417
92,860,790
81,254,106
78,909,132
72,826,738
55,126,790
40,000,000 80,000,000 120,000,000
Amount invested
Eco
no
mic
act
ivit
y A
ctiv
ity
37
Figure 33. Amount of money invested in Scientific, Technological and Innovation activities in 2018 by economic activity.
Manufacture of non-metallic mineral products
Coking, petroleum refining and fuel blending
Manufacture of other food products
Preparation of beverages
Manufacture of pharmaceuticals, medicinal chemicals
Manufacture of plastic products
Manufacture of dairy products
Maintenance and repair of metal products, machinery and…
Manufacture of electrical appliances and equipment
Manufacture of basic chemicals and their products/ Manufacture…
197.092.788
148.419.579
119.684.513
101.141.376
86.932.432
79.599.853
75.974.037
73.817.514
66.920.737
61.732.728
0 50.000.000 100.000.000 150.000.000 200.000.000 250.000.000
Amount invested
Source: DANE, Technological Development and Innovation Survey – EDIT- Own creation
-Companies that invested in Scientific, Technological and Innovation Activities (ACTI), by scale of employed personnel according to economic activity: Figure 34 evidences that the industrial companies with more than 50 employees but less than 200, represent the highest portion of the total of companies that invested in Scientific, Technological and Innovation activities: 37,36% in 2017 and 38,20% in 2018. (See Data analysis Excel File - C.2.2. Sheet).Figure 34. Number of companies that invested in Scientific, Technological and Innovation activities by scale of employed personnel.
Source: DANE, Technological Development and Innovation Survey – EDIT- Own creation
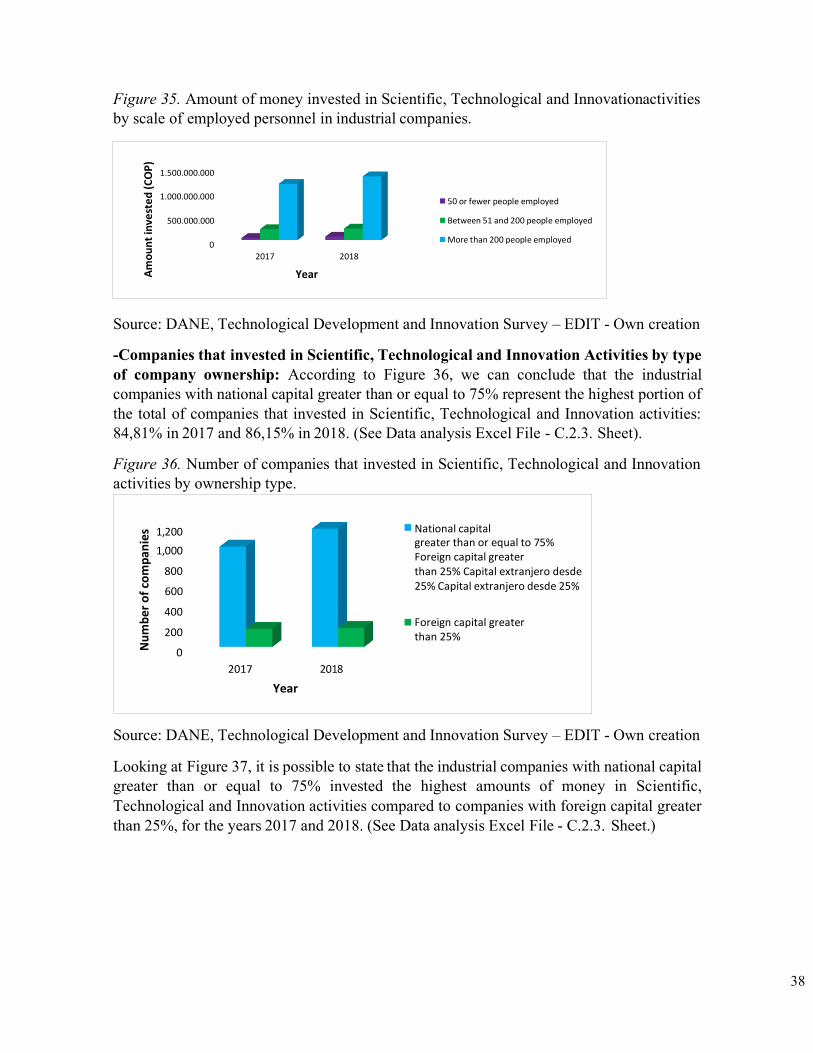
However, Figure 35 indicates that the industrial companies with more than 200 employees invested the highest amounts of money in Scientific, Technological and Innovation activities for the years 2017 and 2018. (See Data analysis Excel File - C.2.2. Sheet).
600
400 50 or fewer people employed
200
2017 2018
Between 51 and 200 people employed
More than 200 people employed
Number of firms
Eco
no
mic
act
ivit
y
Yea
r
38
Figure 35. Amount of money invested in Scientific, Technological and Innovationactivities by scale of employed personnel in industrial companies.
Source: DANE, Technological Development and Innovation Survey – EDIT - Own creation
-Companies that invested in Scientific, Technological and Innovation Activities by type of company ownership: According to Figure 36, we can conclude that the industrial companies with national capital greater than or equal to 75% represent the highest portion of the total of companies that invested in Scientific, Technological and Innovation activities: 84,81% in 2017 and 86,15% in 2018. (See Data analysis Excel File - C.2.3. Sheet).
Figure 36. Number of companies that invested in Scientific, Technological and Innovation activities by ownership type.
Source: DANE, Technological Development and Innovation Survey – EDIT - Own creation
Looking at Figure 37, it is possible to state that the industrial companies with national capital greater than or equal to 75% invested the highest amounts of money in Scientific, Technological and Innovation activities compared to companies with foreign capital greater than 25%, for the years 2017 and 2018. (See Data analysis Excel File - C.2.3. Sheet.)
1,200
1,000
800
600
400
200
National capital greater than or equal to 75% Foreign capital greater than 25% Capital extranjero desde 25% Capital extranjero desde 25%
Foreign capital greater than 25%
2017 2018
Year
1.500.000.000
1.000.000.000
50 or fewer people employed
500.000.000 Between 51 and 200 people employed
0 More than 200 people employed
2017 2018
Year
Nu
mb
er o
f co
mp
anie
s A
mo
un
t in
vest
ed
(C
OP
)
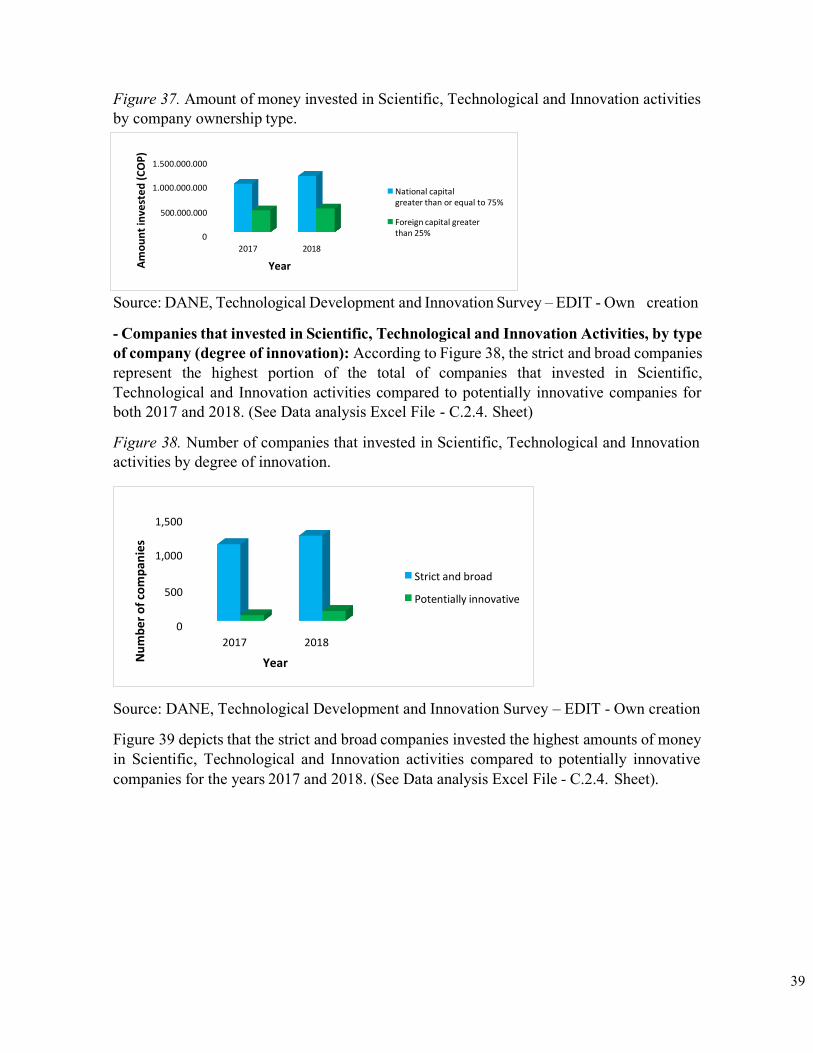
39
Figure 37. Amount of money invested in Scientific, Technological and Innovation activities by company ownership type.
Source: DANE, Technological Development and Innovation Survey – EDIT - Own creation
- Companies that invested in Scientific, Technological and Innovation Activities, by type of company (degree of innovation): According to Figure 38, the strict and broad companies represent the highest portion of the total of companies that invested in Scientific, Technological and Innovation activities compared to potentially innovative companies for both 2017 and 2018. (See Data analysis Excel File - C.2.4. Sheet)
Figure 38. Number of companies that invested in Scientific, Technological and Innovation activities by degree of innovation.
Source: DANE, Technological Development and Innovation Survey – EDIT - Own creation
Figure 39 depicts that the strict and broad companies invested the highest amounts of money in Scientific, Technological and Innovation activities compared to potentially innovative companies for the years 2017 and 2018. (See Data analysis Excel File - C.2.4. Sheet).
1,500
1,000
Strict and broad
500 Potentially innovative
2017 2018
Year
1.500.000.000
1.000.000.000 National capital
greater than or equal to 75% 500.000.000
0
Foreign capital greater than 25%
2017 2018
Year
Nu
mb
er o
f co
mp
anie
s A
mo
un
t in
vest
ed
(C
OP
)
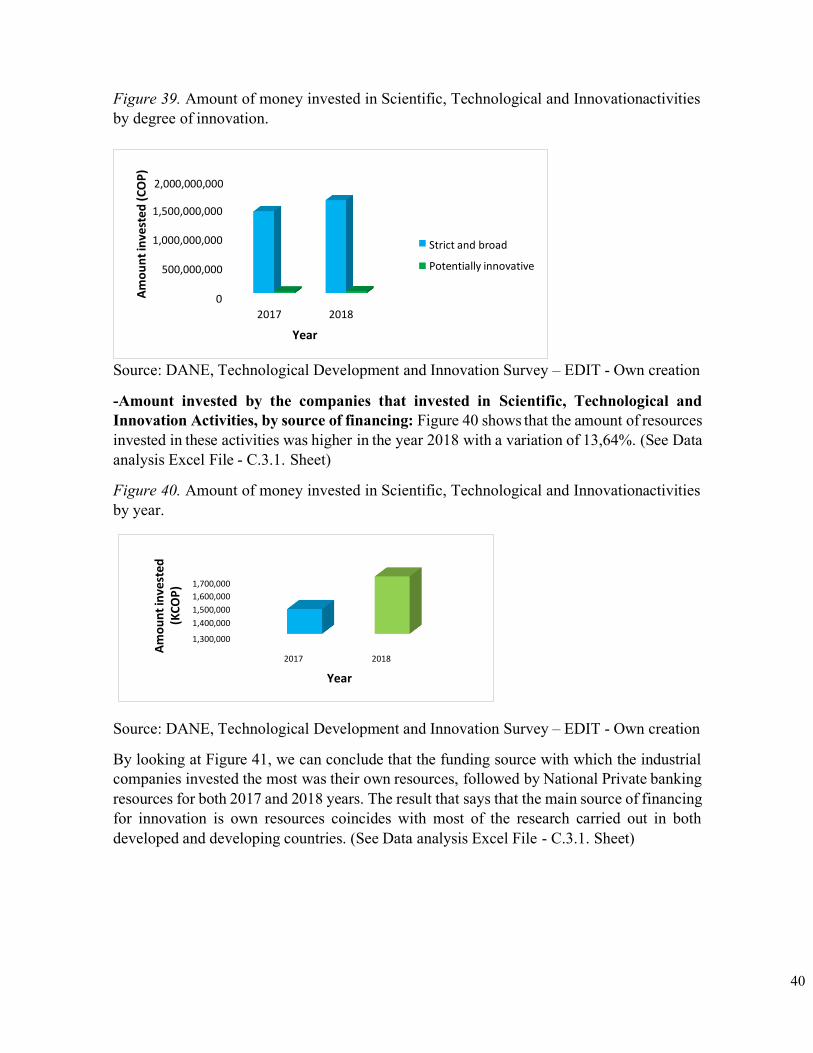
40
Figure 39. Amount of money invested in Scientific, Technological and Innovationactivities by degree of innovation.
Source: DANE, Technological Development and Innovation Survey – EDIT - Own creation
-Amount invested by the companies that invested in Scientific, Technological and Innovation Activities, by source of financing: Figure 40 shows that the amount of resources invested in these activities was higher in the year 2018 with a variation of 13,64%. (See Data analysis Excel File - C.3.1. Sheet)
Figure 40. Amount of money invested in Scientific, Technological and Innovationactivities by year.
Source: DANE, Technological Development and Innovation Survey – EDIT - Own creation
By looking at Figure 41, we can conclude that the funding source with which the industrial companies invested the most was their own resources, followed by National Private banking resources for both 2017 and 2018 years. The result that says that the main source of financing for innovation is own resources coincides with most of the research carried out in both developed and developing countries. (See Data analysis Excel File - C.3.1. Sheet)
2,000,000,000
1,500,000,000
1,000,000,000
500,000,000
Strict and broad
Potentially innovative
2017 2018
Year
1,700,000
1,600,000
1,500,000
1,400,000
1,300,000
2017 2018
Year
Am
ou
nt
inve
sted
(C
OP
)
Am
ou
nt
inve
sted
(K
CO
P)
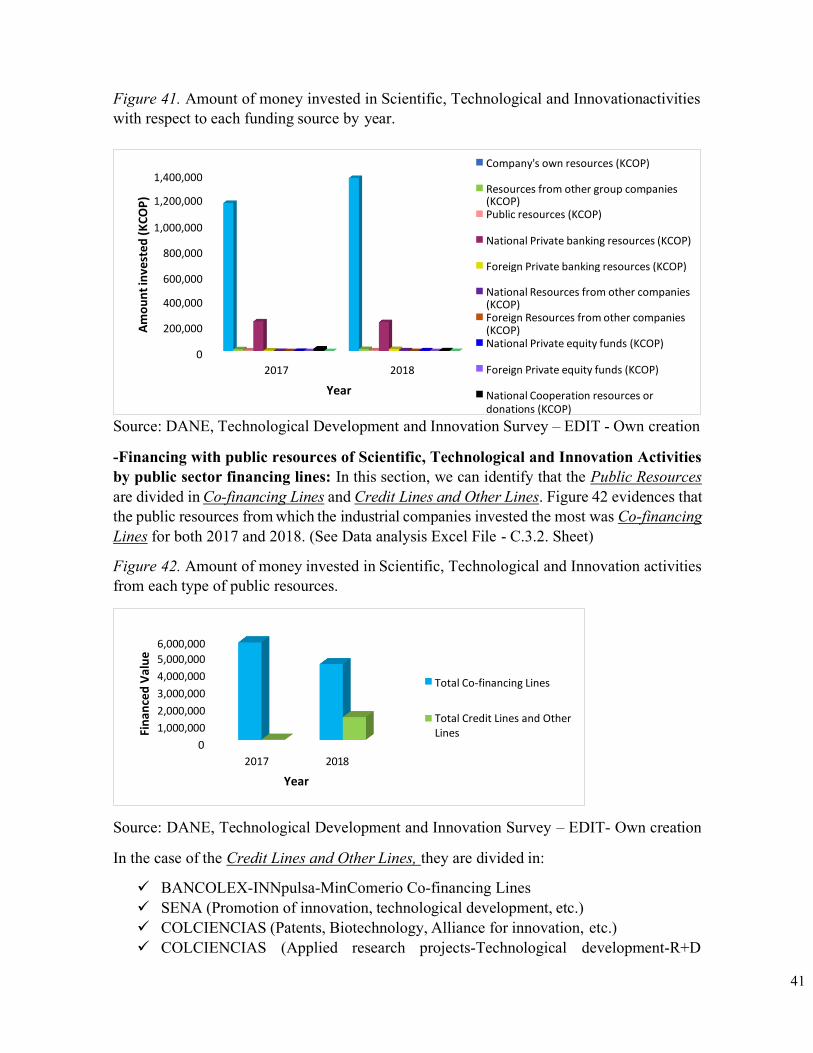
41
Figure 41. Amount of money invested in Scientific, Technological and Innovationactivities with respect to each funding source by year.
Source: DANE, Technological Development and Innovation Survey – EDIT - Own creation
-Financing with public resources of Scientific, Technological and Innovation Activities by public sector financing lines: In this section, we can identify that the Public Resources are divided in Co-financing Lines and Credit Lines and Other Lines. Figure 42 evidences that the public resources from which the industrial companies invested the most was Co-financing Lines for both 2017 and 2018. (See Data analysis Excel File - C.3.2. Sheet)
Figure 42. Amount of money invested in Scientific, Technological and Innovation activities from each type of public resources.
Source: DANE, Technological Development and Innovation Survey – EDIT- Own creation
In the case of the Credit Lines and Other Lines, they are divided in:
✓ BANCOLEX-INNpulsa-MinComerio Co-financing Lines ✓ SENA (Promotion of innovation, technological development, etc.) ✓ COLCIENCIAS (Patents, Biotechnology, Alliance for innovation, etc.) ✓ COLCIENCIAS (Applied research projects-Technological development-R+D
Company's own resources (KCOP) 1,400,000
1,200,000 Resources from other group companies (KCOP) Public resources (KCOP)
1,000,000 National Private banking resources (KCOP)
800,000 Foreign Private banking resources (KCOP)
600,000
400,000
200,000
National Resources from other companies (KCOP) Foreign Resources from other companies (KCOP) National Private equity funds (KCOP)
2017 2018 Foreign Private equity funds (KCOP)
Year National Cooperation resources or donations (KCOP)
6,000,000
5,000,000
4,000,000
3,000,000
2,000,000
1,000,000
Total Co-financing Lines
Total Credit Lines and Other Lines
2017 2018
Year
Am
ou
nt
inve
sted
(K
CO
P)
Fin
ance
d V
alu
e
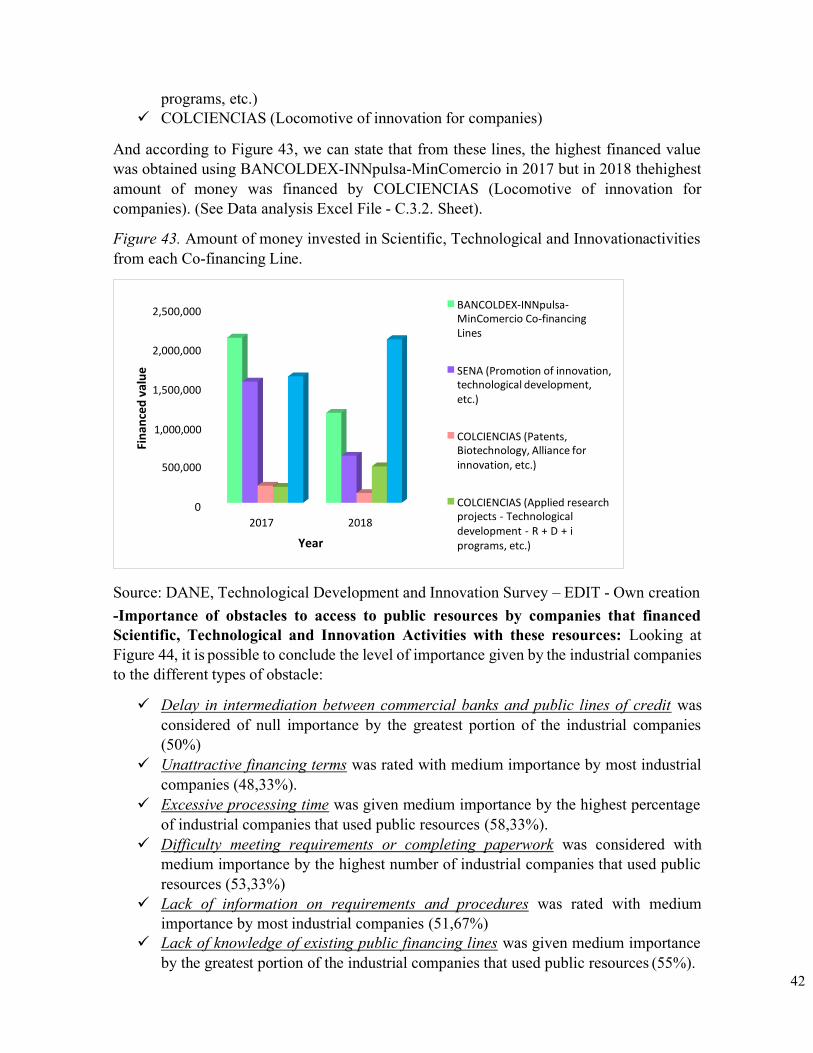
42
programs, etc.) ✓ COLCIENCIAS (Locomotive of innovation for companies)
And according to Figure 43, we can state that from these lines, the highest financed value was obtained using BANCOLDEX-INNpulsa-MinComercio in 2017 but in 2018 thehighest amount of money was financed by COLCIENCIAS (Locomotive of innovation for companies). (See Data analysis Excel File - C.3.2. Sheet).
Figure 43. Amount of money invested in Scientific, Technological and Innovationactivities from each Co-financing Line.
Source: DANE, Technological Development and Innovation Survey – EDIT - Own creation -Importance of obstacles to access to public resources by companies that financed Scientific, Technological and Innovation Activities with these resources: Looking at Figure 44, it is possible to conclude the level of importance given by the industrial companies to the different types of obstacle:
✓ Delay in intermediation between commercial banks and public lines of credit was considered of null importance by the greatest portion of the industrial companies (50%)
✓ Unattractive financing terms was rated with medium importance by most industrial companies (48,33%).
✓ Excessive processing time was given medium importance by the highest percentage of industrial companies that used public resources (58,33%).
✓ Difficulty meeting requirements or completing paperwork was considered with medium importance by the highest number of industrial companies that used public resources (53,33%)
✓ Lack of information on requirements and procedures was rated with medium importance by most industrial companies (51,67%)
✓ Lack of knowledge of existing public financing lines was given medium importance by the greatest portion of the industrial companies that used public resources (55%).
2,500,000 BANCOLDEX-INNpulsa- MinComercio Co-financing Lines
2,000,000
1,500,000
SENA (Promotion of innovation, technological development, etc.)
1,000,000
500,000
COLCIENCIAS (Patents, Biotechnology, Alliance for innovation, etc.)
2017 2018
Year
COLCIENCIAS (Applied research projects - Technological development - R + D + i programs, etc.)
Fin
ance
d v
alu
e
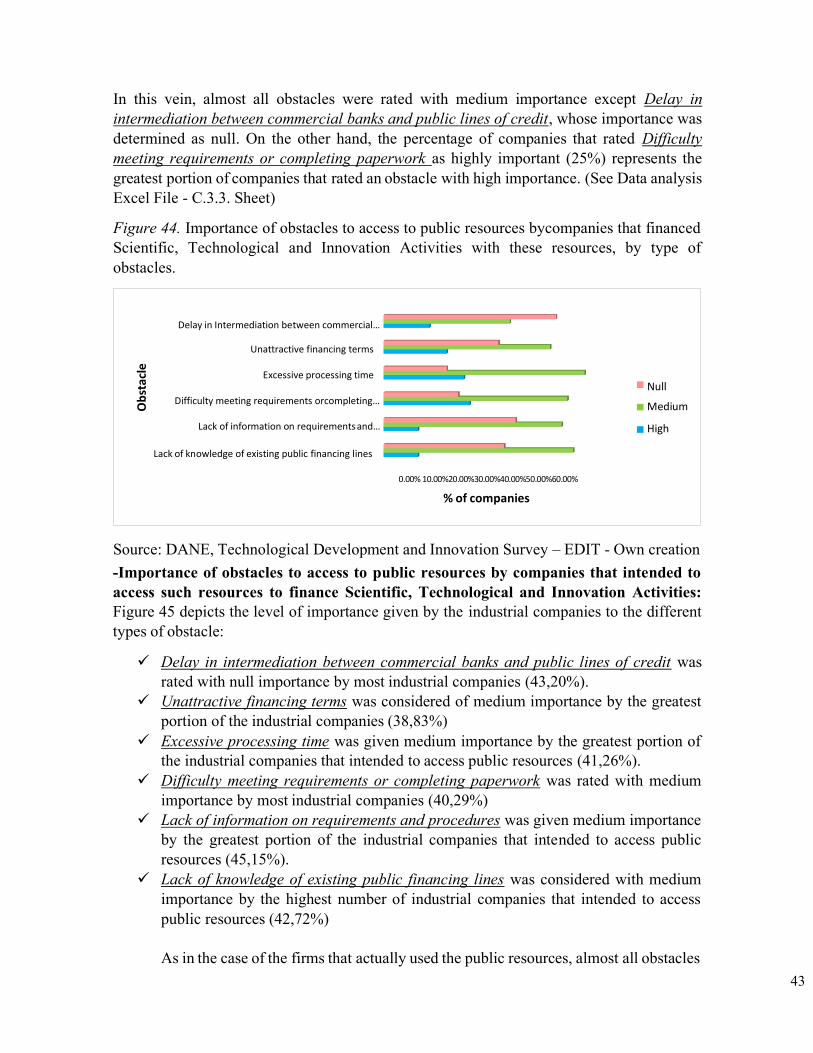
43
In this vein, almost all obstacles were rated with medium importance except Delay in intermediation between commercial banks and public lines of credit, whose importance was determined as null. On the other hand, the percentage of companies that rated Difficulty meeting requirements or completing paperwork as highly important (25%) represents the greatest portion of companies that rated an obstacle with high importance. (See Data analysis Excel File - C.3.3. Sheet)
Figure 44. Importance of obstacles to access to public resources bycompanies that financed Scientific, Technological and Innovation Activities with these resources, by type of obstacles.
Source: DANE, Technological Development and Innovation Survey – EDIT - Own creation -Importance of obstacles to access to public resources by companies that intended to access such resources to finance Scientific, Technological and Innovation Activities: Figure 45 depicts the level of importance given by the industrial companies to the different types of obstacle:
✓ Delay in intermediation between commercial banks and public lines of credit was rated with null importance by most industrial companies (43,20%).
✓ Unattractive financing terms was considered of medium importance by the greatest portion of the industrial companies (38,83%)
✓ Excessive processing time was given medium importance by the greatest portion of the industrial companies that intended to access public resources (41,26%).
✓ Difficulty meeting requirements or completing paperwork was rated with medium importance by most industrial companies (40,29%)
✓ Lack of information on requirements and procedures was given medium importance by the greatest portion of the industrial companies that intended to access public resources (45,15%).
✓ Lack of knowledge of existing public financing lines was considered with medium importance by the highest number of industrial companies that intended to access public resources (42,72%)
As in the case of the firms that actually used the public resources, almost all obstacles
Delay in Intermediation between commercial…
Unattractive financing terms
Excessive processing time
Difficulty meeting requirements orcompleting…
Lack of information on requirements and…
Null
Medium
High
Lack of knowledge of existing public financing lines
0.00% 10.00%20.00%30.00%40.00%50.00%60.00%
% of companies
Ob
stac
le
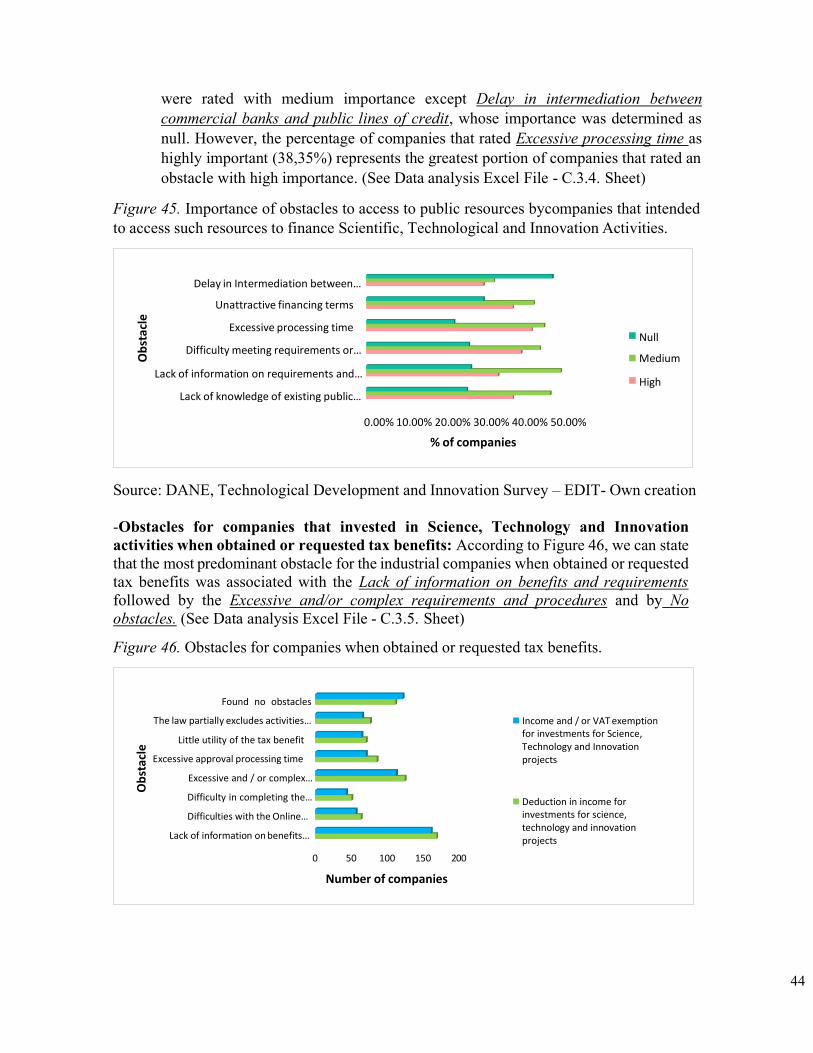
44
were rated with medium importance except Delay in intermediation between commercial banks and public lines of credit, whose importance was determined as null. However, the percentage of companies that rated Excessive processing time as highly important (38,35%) represents the greatest portion of companies that rated an obstacle with high importance. (See Data analysis Excel File - C.3.4. Sheet)
Figure 45. Importance of obstacles to access to public resources bycompanies that intended to access such resources to finance Scientific, Technological and Innovation Activities.
Source: DANE, Technological Development and Innovation Survey – EDIT- Own creation
-Obstacles for companies that invested in Science, Technology and Innovation activities when obtained or requested tax benefits: According to Figure 46, we can state that the most predominant obstacle for the industrial companies when obtained or requested tax benefits was associated with the Lack of information on benefits and requirements followed by the Excessive and/or complex requirements and procedures and by No obstacles. (See Data analysis Excel File - C.3.5. Sheet)
Figure 46. Obstacles for companies when obtained or requested tax benefits.
Found no obstacles
The law partially excludes activities…
Little utility of the tax benefit
Excessive approval processing time
Excessive and / or complex…
Difficulty in completing the…
Difficulties with the Online…
Lack of information on benefits…
0 50 100 150 200
Number of companies
Income and / or VAT exemption for investments for Science, Technology and Innovation projects
Deduction in income for investments for science, technology and innovation projects
Delay in Intermediation between…
Unattractive financing terms
Excessive processing time
Difficulty meeting requirements or… Null
Medium
Lack of information on requirements and… High
Lack of knowledge of existing public…
0.00% 10.00% 20.00% 30.00% 40.00% 50.00%
% of companies
Ob
stac
le
Ob
stac
le
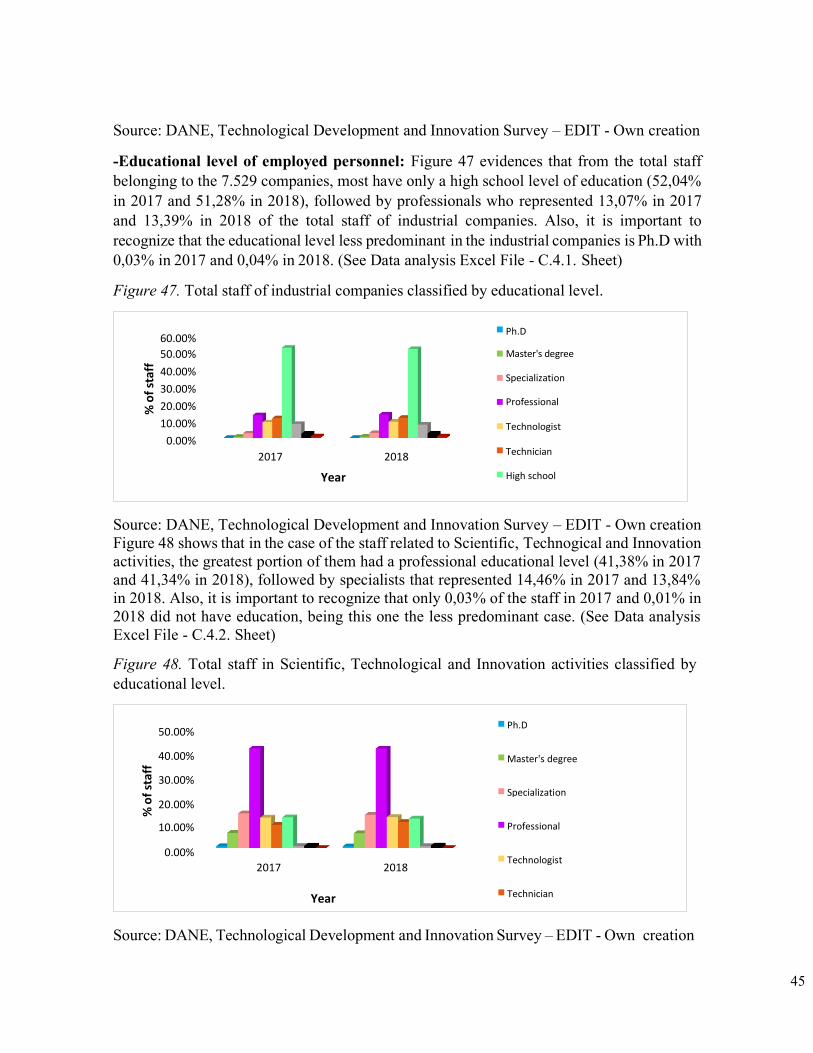
45
Source: DANE, Technological Development and Innovation Survey – EDIT - Own creation
-Educational level of employed personnel: Figure 47 evidences that from the total staff belonging to the 7.529 companies, most have only a high school level of education (52,04% in 2017 and 51,28% in 2018), followed by professionals who represented 13,07% in 2017 and 13,39% in 2018 of the total staff of industrial companies. Also, it is important to recognize that the educational level less predominant in the industrial companies is Ph.D with 0,03% in 2017 and 0,04% in 2018. (See Data analysis Excel File - C.4.1. Sheet)
Figure 47. Total staff of industrial companies classified by educational level.
Source: DANE, Technological Development and Innovation Survey – EDIT - Own creation Figure 48 shows that in the case of the staff related to Scientific, Technogical and Innovation activities, the greatest portion of them had a professional educational level (41,38% in 2017 and 41,34% in 2018), followed by specialists that represented 14,46% in 2017 and 13,84% in 2018. Also, it is important to recognize that only 0,03% of the staff in 2017 and 0,01% in 2018 did not have education, being this one the less predominant case. (See Data analysis Excel File - C.4.2. Sheet)
Figure 48. Total staff in Scientific, Technological and Innovation activities classified by educational level.
Source: DANE, Technological Development and Innovation Survey – EDIT - Own creation
60.00%
50.00%
40.00%
30.00%
20.00%
10.00%
0.00%
Ph.D
Master's degree
Specialization
Professional
Technologist
2017 2018 Technician
Year High school
50.00% Ph.D
40.00% Master's degree
30.00% Specialization
20.00%
10.00% Professional
0.00%
2017 2018 Technologist
Year Technician
% o
f st
aff
% o
f st
aff
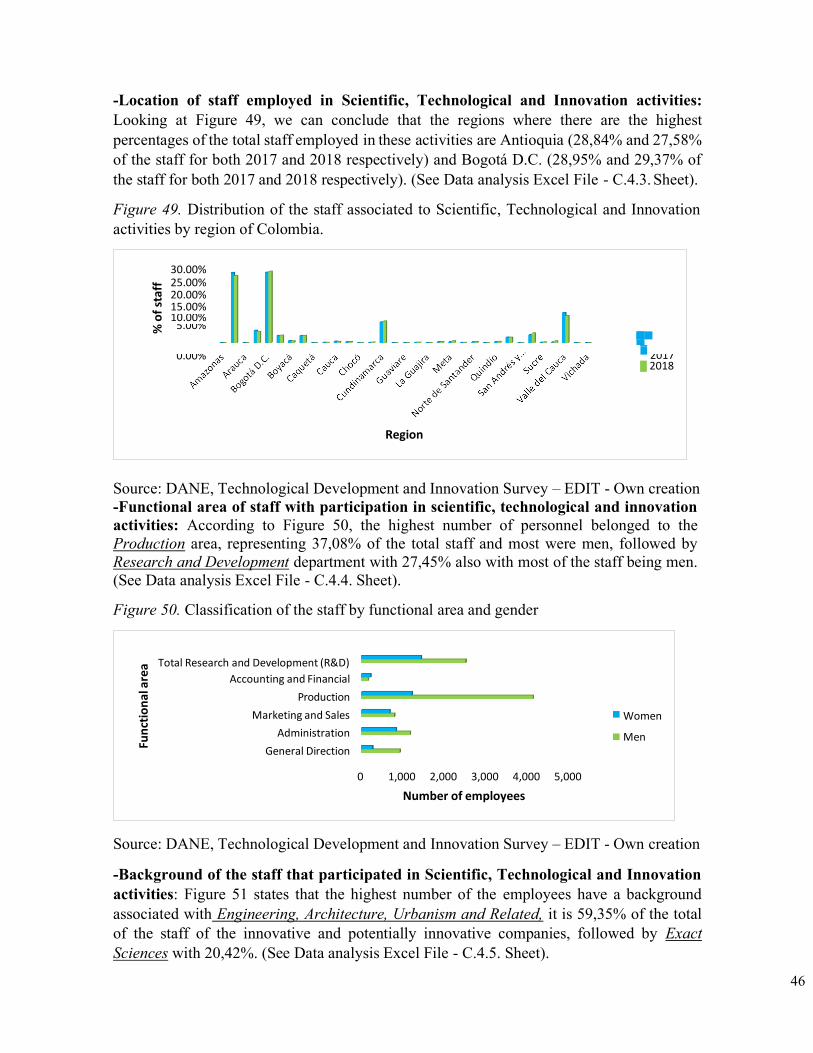
46
Region
% o
f st
aff
-Location of staff employed in Scientific, Technological and Innovation activities: Looking at Figure 49, we can conclude that the regions where there are the highest percentages of the total staff employed in these activities are Antioquia (28,84% and 27,58% of the staff for both 2017 and 2018 respectively) and Bogotá D.C. (28,95% and 29,37% of the staff for both 2017 and 2018 respectively). (See Data analysis Excel File - C.4.3. Sheet).
Figure 49. Distribution of the staff associated to Scientific, Technological and Innovation activities by region of Colombia.
30.00%
25.00%
20.00%
15.00% 10.00%
5.00%
0.00%
2017 2018
Source: DANE, Technological Development and Innovation Survey – EDIT - Own creation -Functional area of staff with participation in scientific, technological and innovation activities: According to Figure 50, the highest number of personnel belonged to the Production area, representing 37,08% of the total staff and most were men, followed by Research and Development department with 27,45% also with most of the staff being men. (See Data analysis Excel File - C.4.4. Sheet).
Figure 50. Classification of the staff by functional area and gender
Source: DANE, Technological Development and Innovation Survey – EDIT - Own creation
-Background of the staff that participated in Scientific, Technological and Innovation activities: Figure 51 states that the highest number of the employees have a background associated with Engineering, Architecture, Urbanism and Related, it is 59,35% of the total of the staff of the innovative and potentially innovative companies, followed by Exact Sciences with 20,42%. (See Data analysis Excel File - C.4.5. Sheet).
Total Research and Development (R&D)
Accounting and Financial
Production
Marketing and Sales
Administration
General Direction
Women
Men
0 1,000 2,000 3,000 4,000 5,000
Number of employees
Fun
ctio
nal
are
a
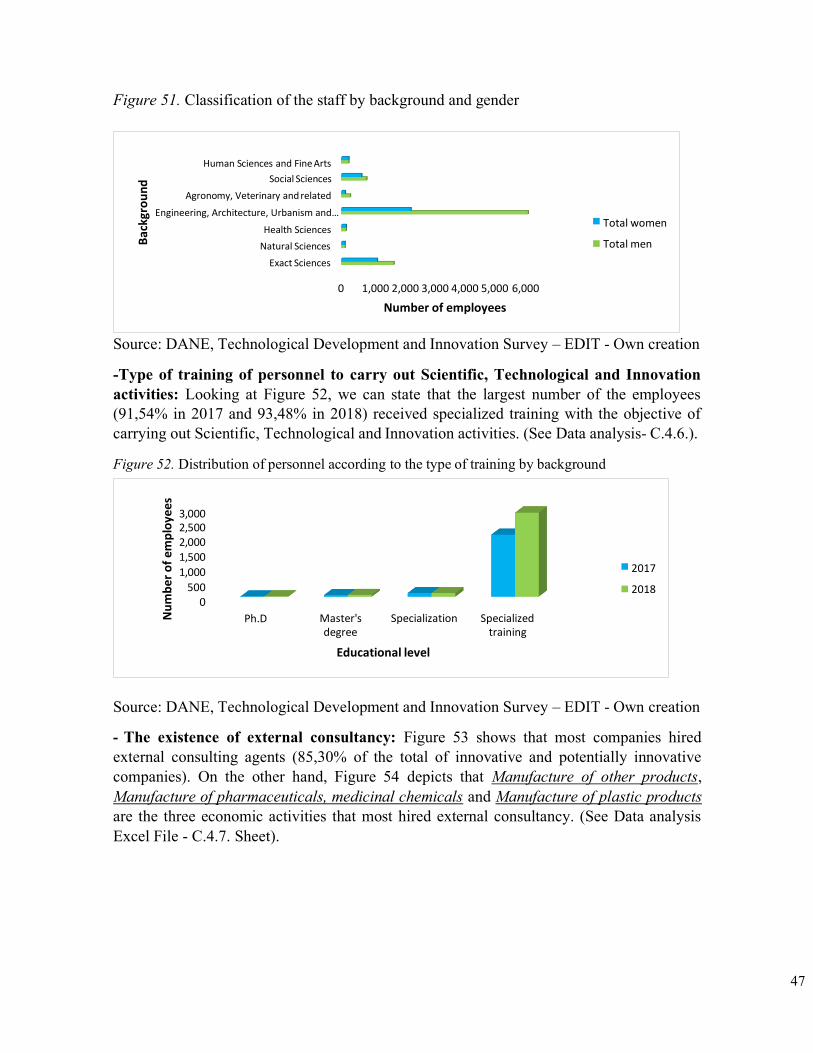
47
Figure 51. Classification of the staff by background and gender
Source: DANE, Technological Development and Innovation Survey – EDIT - Own creation
-Type of training of personnel to carry out Scientific, Technological and Innovation activities: Looking at Figure 52, we can state that the largest number of the employees (91,54% in 2017 and 93,48% in 2018) received specialized training with the objective of carrying out Scientific, Technological and Innovation activities. (See Data analysis- C.4.6.).
Figure 52. Distribution of personnel according to the type of training by background
Source: DANE, Technological Development and Innovation Survey – EDIT - Own creation
- The existence of external consultancy: Figure 53 shows that most companies hired external consulting agents (85,30% of the total of innovative and potentially innovative companies). On the other hand, Figure 54 depicts that Manufacture of other products, Manufacture of pharmaceuticals, medicinal chemicals and Manufacture of plastic products are the three economic activities that most hired external consultancy. (See Data analysis Excel File - C.4.7. Sheet).
Human Sciences and Fine Arts
Social Sciences
Agronomy, Veterinary and related
Engineering, Architecture, Urbanism and…
Health Sciences
Natural Sciences
Exact Sciences
Total women
Total men
0 1,000 2,000 3,000 4,000 5,000 6,000
Number of employees
3,000 2,500 2,000 1,500
1,000
500
2017
2018
Ph.D Master's degree
Specialization Specialized training
Educational level
Bac
kgro
un
d
Nu
mb
er o
f em
plo
yees
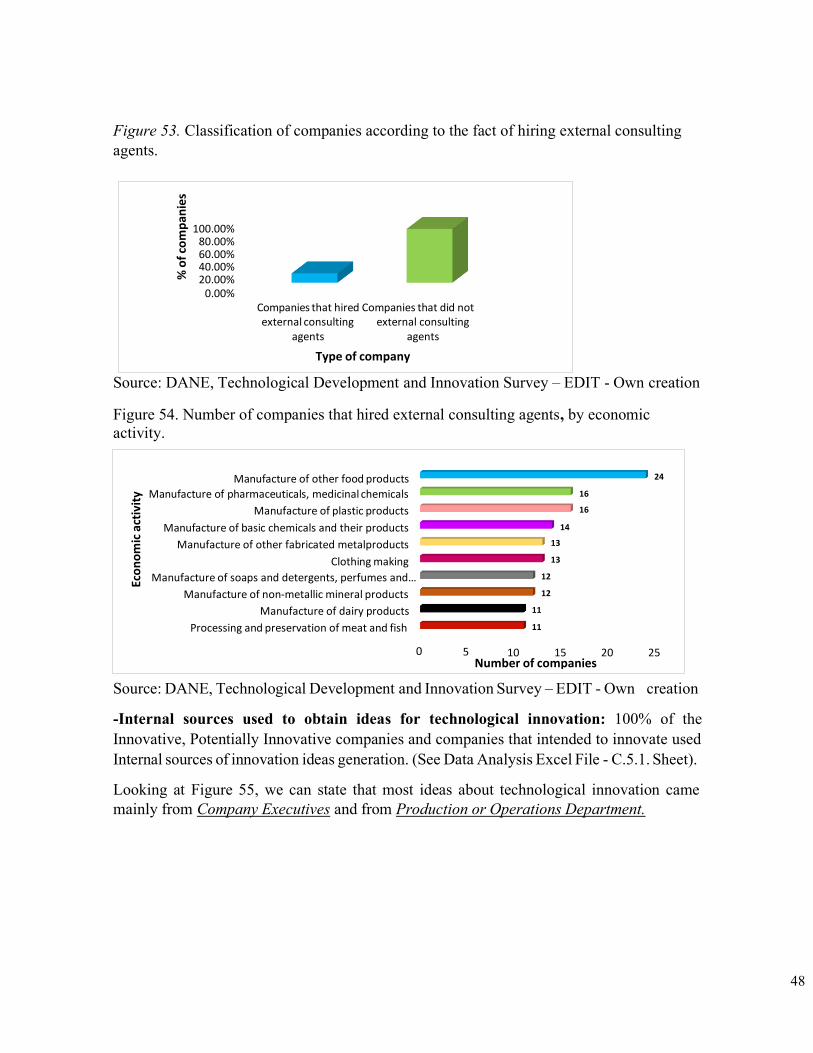
48
Figure 53. Classification of companies according to the fact of hiring external consulting agents.
Source: DANE, Technological Development and Innovation Survey – EDIT - Own creation
Figure 54. Number of companies that hired external consulting agents, by economic activity.
Source: DANE, Technological Development and Innovation Survey – EDIT - Own creation
-Internal sources used to obtain ideas for technological innovation: 100% of the Innovative, Potentially Innovative companies and companies that intended to innovate used Internal sources of innovation ideas generation. (See Data Analysis Excel File - C.5.1. Sheet).
Looking at Figure 55, we can state that most ideas about technological innovation came mainly from Company Executives and from Production or Operations Department.
100.00% 80.00% 60.00% 40.00% 20.00%
0.00% Companies that hired Companies that did not external consulting external consulting
agents agents
Type of company
Manufacture of other food products
Manufacture of pharmaceuticals, medicinal chemicals
Manufacture of plastic products
Manufacture of basic chemicals and their products
Manufacture of other fabricated metalproducts
Clothing making
Manufacture of soaps and detergents, perfumes and…
Manufacture of non-metallic mineral products
Manufacture of dairy products
Processing and preservation of meat and fish
24
16
16
14
13
13
12
12
11
11
10 15 20 25 Number of companies
Eco
no
mic
act
ivit
y
% o
f co
mp
anie
s
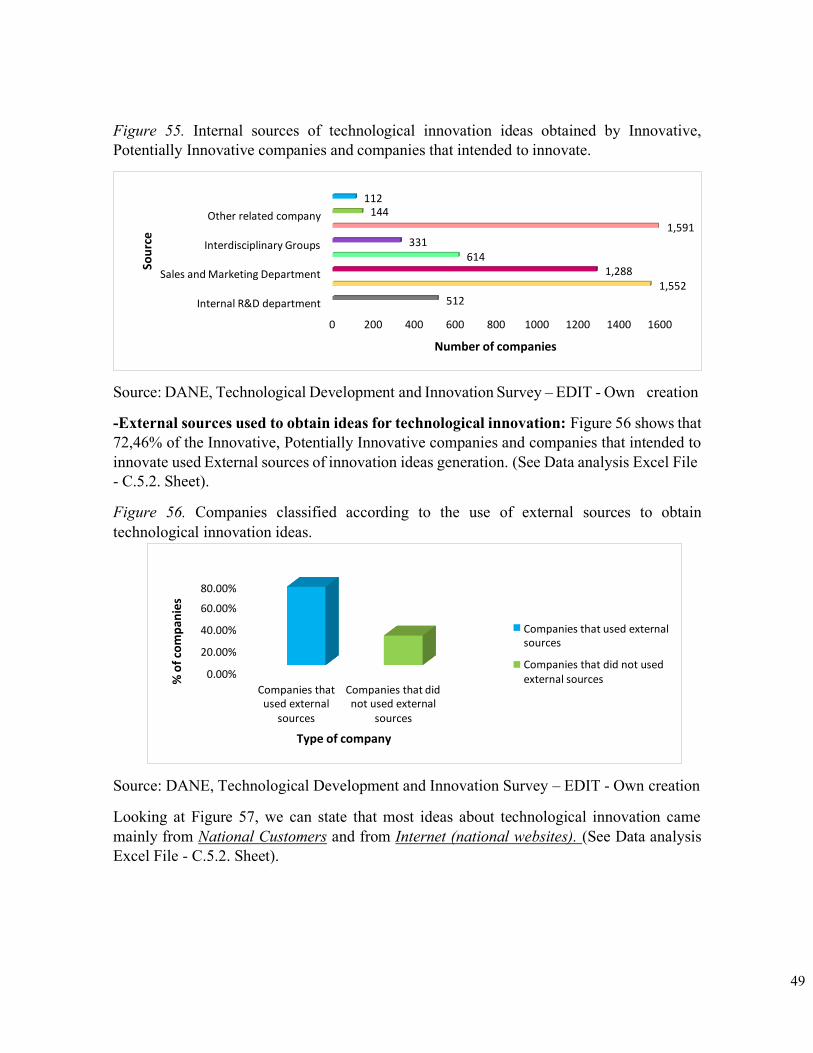
49
Figure 55. Internal sources of technological innovation ideas obtained by Innovative, Potentially Innovative companies and companies that intended to innovate.
Source: DANE, Technological Development and Innovation Survey – EDIT - Own creation
-External sources used to obtain ideas for technological innovation: Figure 56 shows that 72,46% of the Innovative, Potentially Innovative companies and companies that intended to innovate used External sources of innovation ideas generation. (See Data analysis Excel File - C.5.2. Sheet).
Figure 56. Companies classified according to the use of external sources to obtain technological innovation ideas.
Source: DANE, Technological Development and Innovation Survey – EDIT - Own creation
Looking at Figure 57, we can state that most ideas about technological innovation came mainly from National Customers and from Internet (national websites). (See Data analysis Excel File - C.5.2. Sheet).
Other related company
112 144
1,591
Interdisciplinary Groups 331 614
Sales and Marketing Department 1,288 1,552
Internal R&D department 512
0 200 400 600 800 1000 1200 1400 1600
Number of companies
80.00%
60.00%
40.00%
20.00%
0.00%
Companies that used external sources
Companies that did not used external sources
Companies that Companies that did used external not used external
sources sources
Type of company
Sou
rce
% o
f co
mp
anie
s
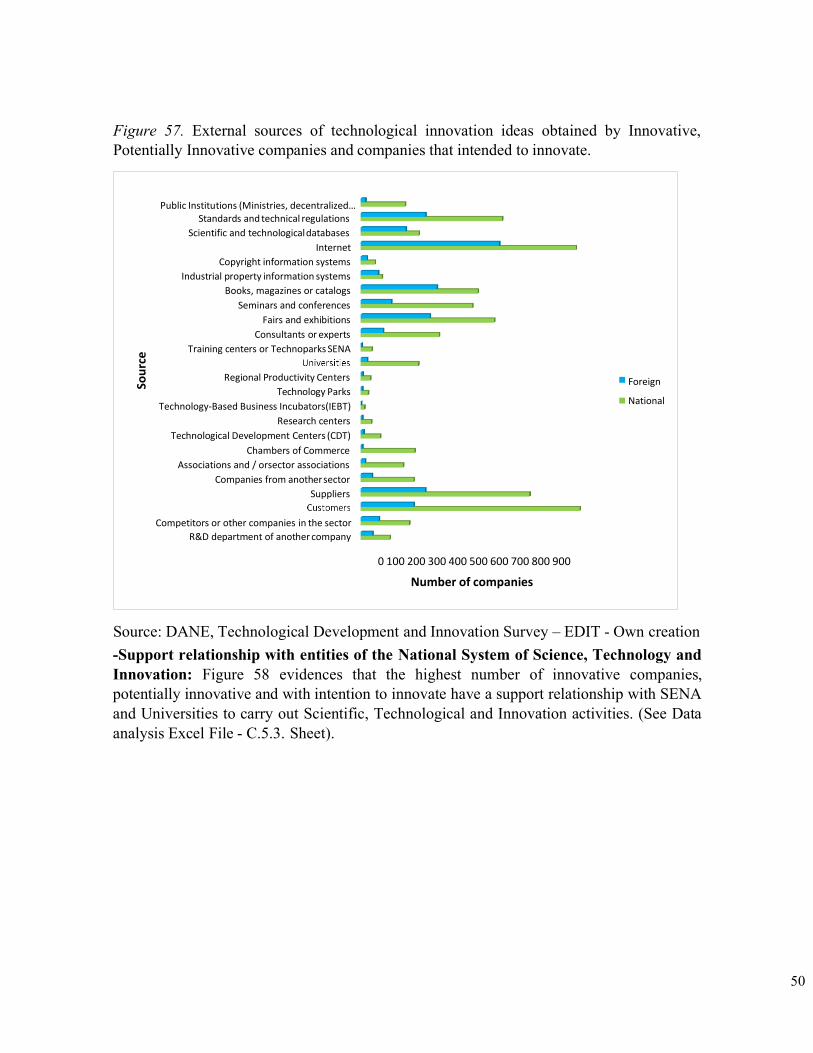
50
Figure 57. External sources of technological innovation ideas obtained by Innovative, Potentially Innovative companies and companies that intended to innovate.
Source: DANE, Technological Development and Innovation Survey – EDIT - Own creation -Support relationship with entities of the National System of Science, Technology and Innovation: Figure 58 evidences that the highest number of innovative companies, potentially innovative and with intention to innovate have a support relationship with SENA and Universities to carry out Scientific, Technological and Innovation activities. (See Data analysis Excel File - C.5.3. Sheet).
Public Institutions (Ministries, decentralized… Standards and technical regulations
Scientific and technological databases
Internet
Copyright information systems
Industrial property information systems
Books, magazines or catalogs
Seminars and conferences
Fairs and exhibitions
Consultants or experts
Training centers or Technoparks SENA
Regional Productivity Centers
Technology Parks
Technology-Based Business Incubators(IEBT)
Research centers
Technological Development Centers (CDT)
Chambers of Commerce
Associations and / orsector associations
Companies from another sector
Suppliers
Foreign
National
Competitors or other companies in the sector
R&D department of another company
0 100 200 300 400 500 600 700 800 900
Number of companies
Sou
rce
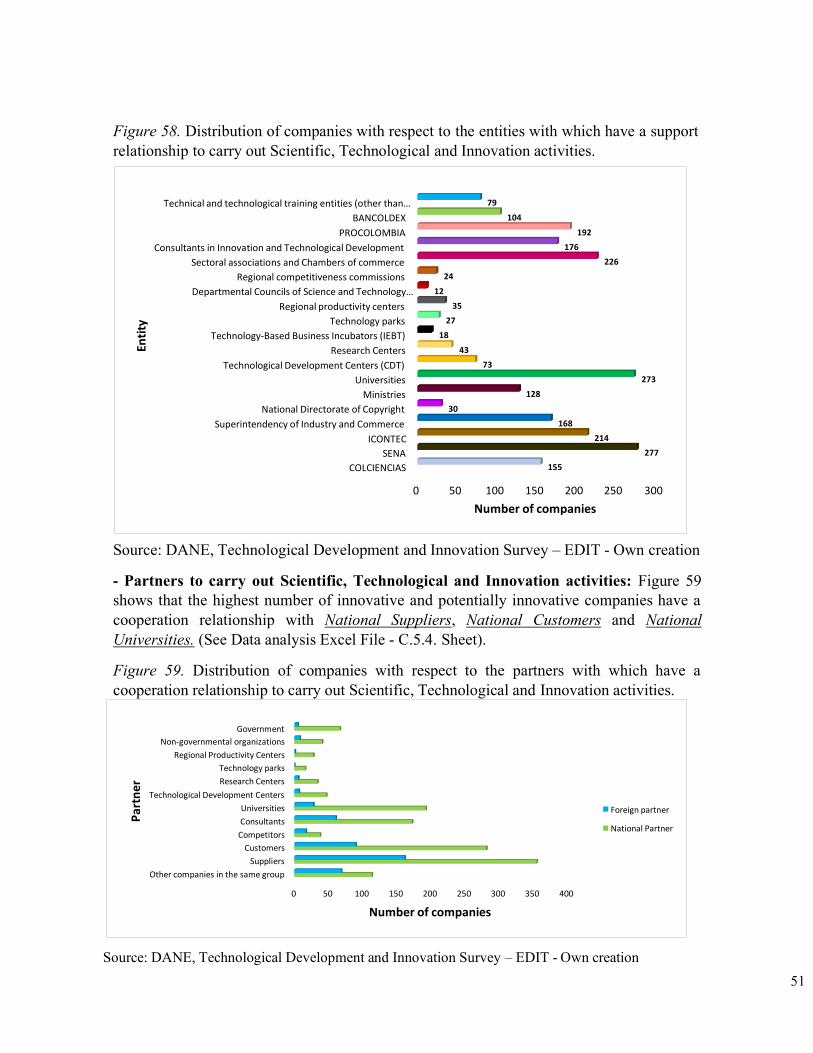
51
Number of companies
Figure 58. Distribution of companies with respect to the entities with which have a support relationship to carry out Scientific, Technological and Innovation activities.
Technical and technological training entities (other than…
BANCOLDEX
PROCOLOMBIA
79
104
192
Consultants in Innovation and Technological Development 176
Sectoral associations and Chambers of commerce 226
Regional competitiveness commissions 24
Departmental Councils of Science and Technology… 12
Regional productivity centers 35
Technology parks 27
Technology-Based Business Incubators (IEBT) 18
Research Centers 43
Technological Development Centers (CDT) 73
Universities 273
Ministries 128
National Directorate of Copyright 30
Superintendency of Industry and Commerce 168
ICONTEC 214
SENA 277
COLCIENCIAS 155
0 50 100 150 200 250 300
Source: DANE, Technological Development and Innovation Survey – EDIT - Own creation
- Partners to carry out Scientific, Technological and Innovation activities: Figure 59 shows that the highest number of innovative and potentially innovative companies have a cooperation relationship with National Suppliers, National Customers and National Universities. (See Data analysis Excel File - C.5.4. Sheet).
Figure 59. Distribution of companies with respect to the partners with which have a cooperation relationship to carry out Scientific, Technological and Innovation activities.
Source: DANE, Technological Development and Innovation Survey – EDIT - Own creation
Government
Non-governmental organizations
Regional Productivity Centers
Technology parks
Research Centers
Technological Development Centers
Universities
Consultants
Competitors
Customers
Suppliers
Other companies in the same group
Foreign partner
National Partner
0 50 100 150 200 250 300 350 400
Number of companies
Par
tner
En
tity
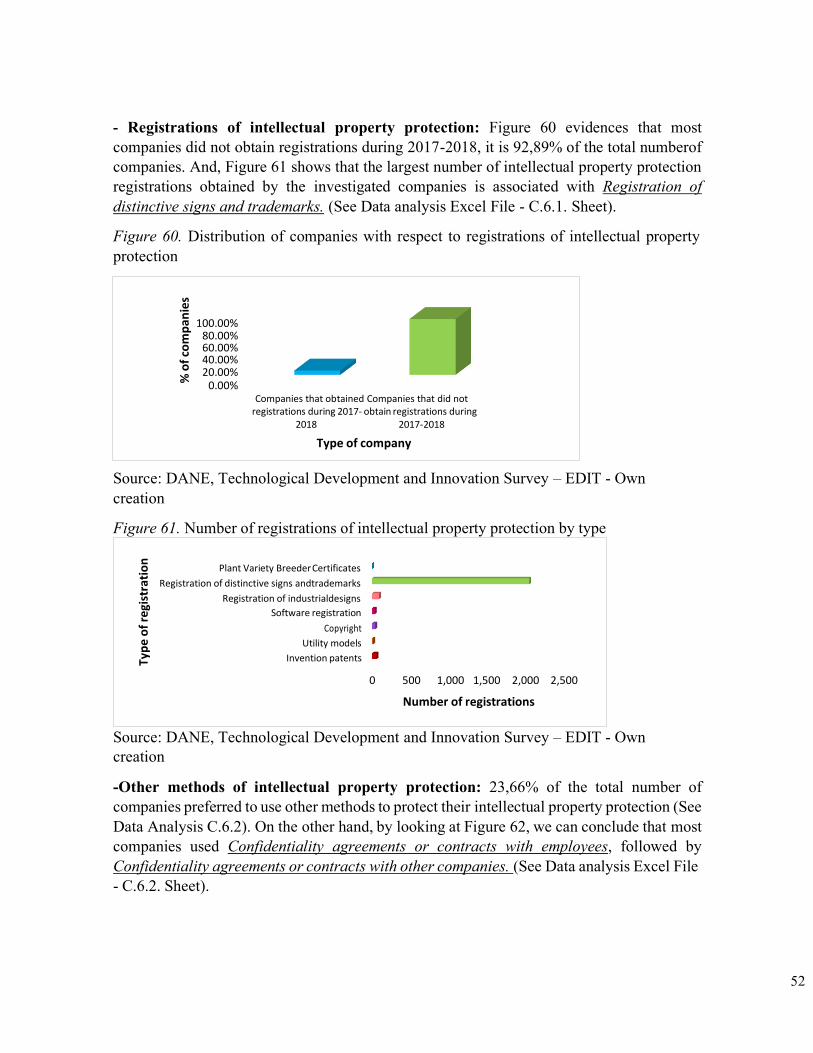
52
- Registrations of intellectual property protection: Figure 60 evidences that most companies did not obtain registrations during 2017-2018, it is 92,89% of the total numberof companies. And, Figure 61 shows that the largest number of intellectual property protection registrations obtained by the investigated companies is associated with Registration of distinctive signs and trademarks. (See Data analysis Excel File - C.6.1. Sheet).
Figure 60. Distribution of companies with respect to registrations of intellectual property protection
Source: DANE, Technological Development and Innovation Survey – EDIT - Own creation
Figure 61. Number of registrations of intellectual property protection by type
Plant Variety Breeder Certificates
Registration of distinctive signs andtrademarks
Registration of industrialdesigns
Software registration
Copyright
Utility models
Invention patents
0 500 1,000 1,500 2,000 2,500
Number of registrations
Source: DANE, Technological Development and Innovation Survey – EDIT - Own creation
-Other methods of intellectual property protection: 23,66% of the total number of companies preferred to use other methods to protect their intellectual property protection (See Data Analysis C.6.2). On the other hand, by looking at Figure 62, we can conclude that most companies used Confidentiality agreements or contracts with employees, followed by Confidentiality agreements or contracts with other companies. (See Data analysis Excel File - C.6.2. Sheet).
100.00% 80.00% 60.00% 40.00% 20.00%
0.00% Companies that obtained Companies that did not
registrations during 2017- obtain registrations during 2018 2017-2018
Type of company
Typ
e o
f re
gist
rati
on
% o
f co
mp
anie
s
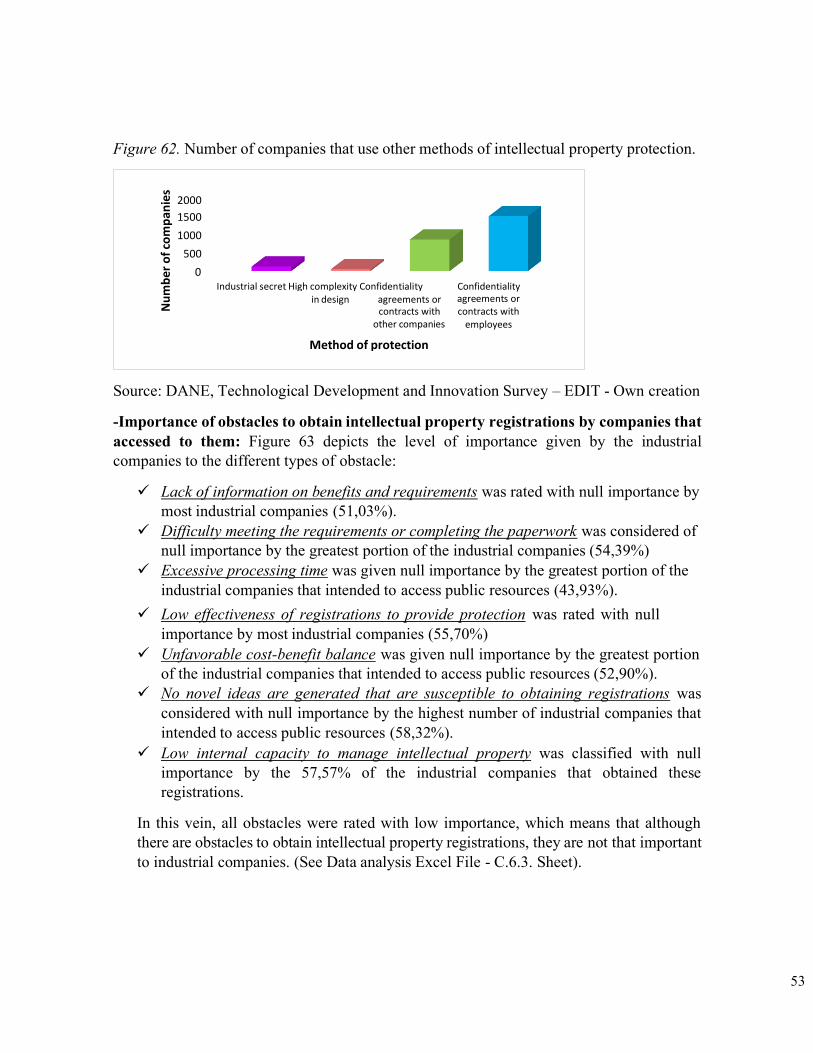
53
Figure 62. Number of companies that use other methods of intellectual property protection.
Source: DANE, Technological Development and Innovation Survey – EDIT - Own creation
-Importance of obstacles to obtain intellectual property registrations by companies that accessed to them: Figure 63 depicts the level of importance given by the industrial companies to the different types of obstacle:
✓ Lack of information on benefits and requirements was rated with null importance by most industrial companies (51,03%).
✓ Difficulty meeting the requirements or completing the paperwork was considered of null importance by the greatest portion of the industrial companies (54,39%)
✓ Excessive processing time was given null importance by the greatest portion of the industrial companies that intended to access public resources (43,93%).
✓ Low effectiveness of registrations to provide protection was rated with null importance by most industrial companies (55,70%)
✓ Unfavorable cost-benefit balance was given null importance by the greatest portion of the industrial companies that intended to access public resources (52,90%).
✓ No novel ideas are generated that are susceptible to obtaining registrations was considered with null importance by the highest number of industrial companies that intended to access public resources (58,32%).
✓ Low internal capacity to manage intellectual property was classified with null importance by the 57,57% of the industrial companies that obtained these registrations.
In this vein, all obstacles were rated with low importance, which means that although there are obstacles to obtain intellectual property registrations, they are not that important to industrial companies. (See Data analysis Excel File - C.6.3. Sheet).
2000
1500
1000
500
Industrial secret High complexity Confidentiality in design agreements or
contracts with other companies
Confidentiality agreements or contracts with
employees
Method of protection
Nu
mb
er o
f co
mp
anie
s
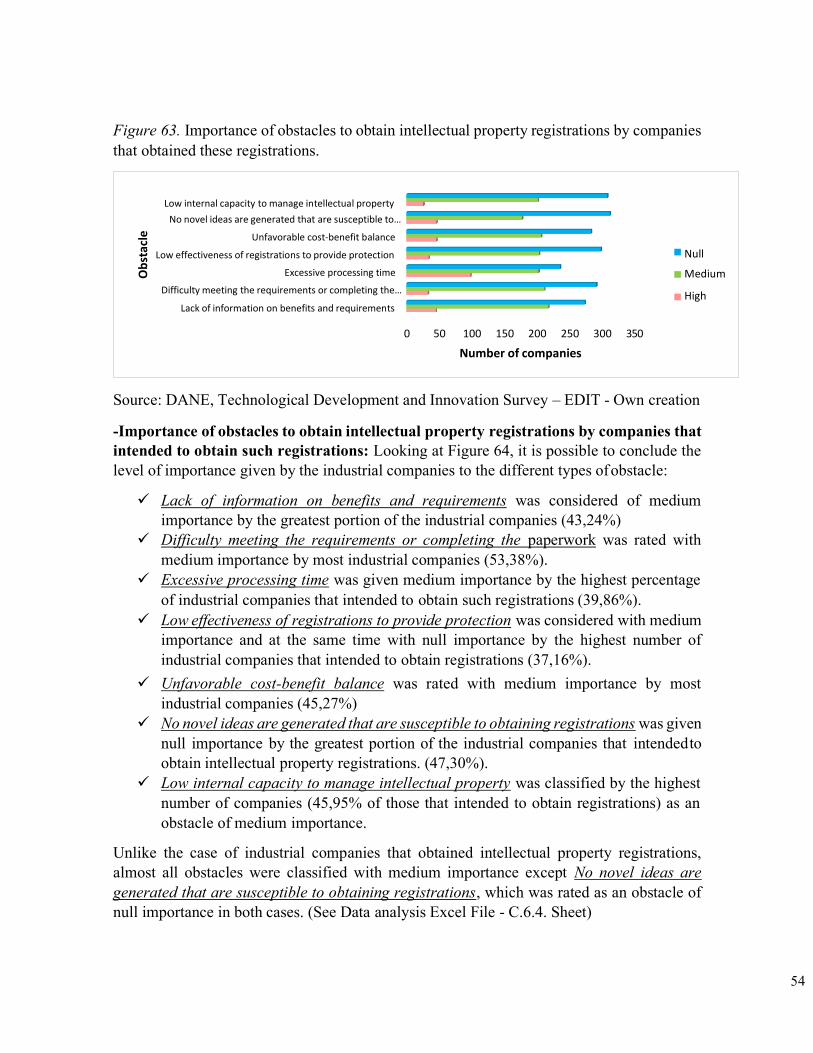
54
Figure 63. Importance of obstacles to obtain intellectual property registrations by companies that obtained these registrations.
Source: DANE, Technological Development and Innovation Survey – EDIT - Own creation
-Importance of obstacles to obtain intellectual property registrations by companies that intended to obtain such registrations: Looking at Figure 64, it is possible to conclude the level of importance given by the industrial companies to the different types of obstacle:
✓ Lack of information on benefits and requirements was considered of medium importance by the greatest portion of the industrial companies (43,24%)
✓ Difficulty meeting the requirements or completing the paperwork was rated with medium importance by most industrial companies (53,38%).
✓ Excessive processing time was given medium importance by the highest percentage of industrial companies that intended to obtain such registrations (39,86%).
✓ Low effectiveness of registrations to provide protection was considered with medium importance and at the same time with null importance by the highest number of industrial companies that intended to obtain registrations (37,16%).
✓ Unfavorable cost-benefit balance was rated with medium importance by most industrial companies (45,27%)
✓ No novel ideas are generated that are susceptible to obtaining registrations was given null importance by the greatest portion of the industrial companies that intended to obtain intellectual property registrations. (47,30%).
✓ Low internal capacity to manage intellectual property was classified by the highest number of companies (45,95% of those that intended to obtain registrations) as an obstacle of medium importance.
Unlike the case of industrial companies that obtained intellectual property registrations, almost all obstacles were classified with medium importance except No novel ideas are generated that are susceptible to obtaining registrations, which was rated as an obstacle of null importance in both cases. (See Data analysis Excel File - C.6.4. Sheet)
Low internal capacity to manage intellectual property
No novel ideas are generated that are susceptible to…
Unfavorable cost-benefit balance
Low effectiveness of registrations to provide protection
Excessive processing time
Difficulty meeting the requirements or completing the…
Lack of information on benefits and requirements
Null
Medium
High
0 50 100 150 200 250 300 350
Number of companies
Ob
stac
le
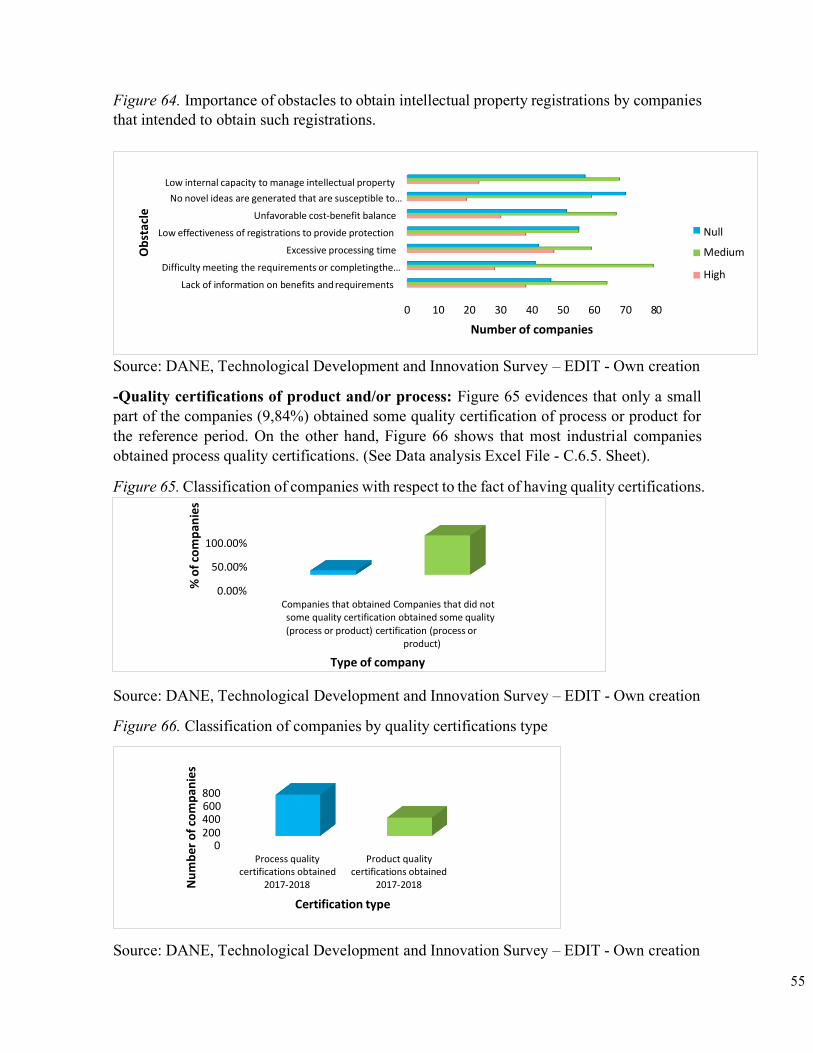
55
800 600 400 200
Process quality Product quality certifications obtained certifications obtained
2017-2018 2017-2018
Certification type
Figure 64. Importance of obstacles to obtain intellectual property registrations by companies that intended to obtain such registrations.
Source: DANE, Technological Development and Innovation Survey – EDIT - Own creation
-Quality certifications of product and/or process: Figure 65 evidences that only a small part of the companies (9,84%) obtained some quality certification of process or product for the reference period. On the other hand, Figure 66 shows that most industrial companies obtained process quality certifications. (See Data analysis Excel File - C.6.5. Sheet).
Figure 65. Classification of companies with respect to the fact of having quality certifications.
Source: DANE, Technological Development and Innovation Survey – EDIT - Own creation
Figure 66. Classification of companies by quality certifications type
Source: DANE, Technological Development and Innovation Survey – EDIT - Own creation
Low internal capacity to manage intellectual property
No novel ideas are generated that are susceptible to…
Unfavorable cost-benefit balance
Low effectiveness of registrations to provide protection
Excessive processing time
Difficulty meeting the requirements or completingthe…
Lack of information on benefits and requirements
Null
Medium
High
0 10 20 30 40 50 60 70 80
Number of companies
100.00%
50.00%
0.00% Companies that obtained Companies that did not some quality certification obtained some quality (process or product) certification (process or
product)
Type of company
Ob
stac
le
Nu
mb
er o
f co
mp
anie
s %
of
com
pan
ies
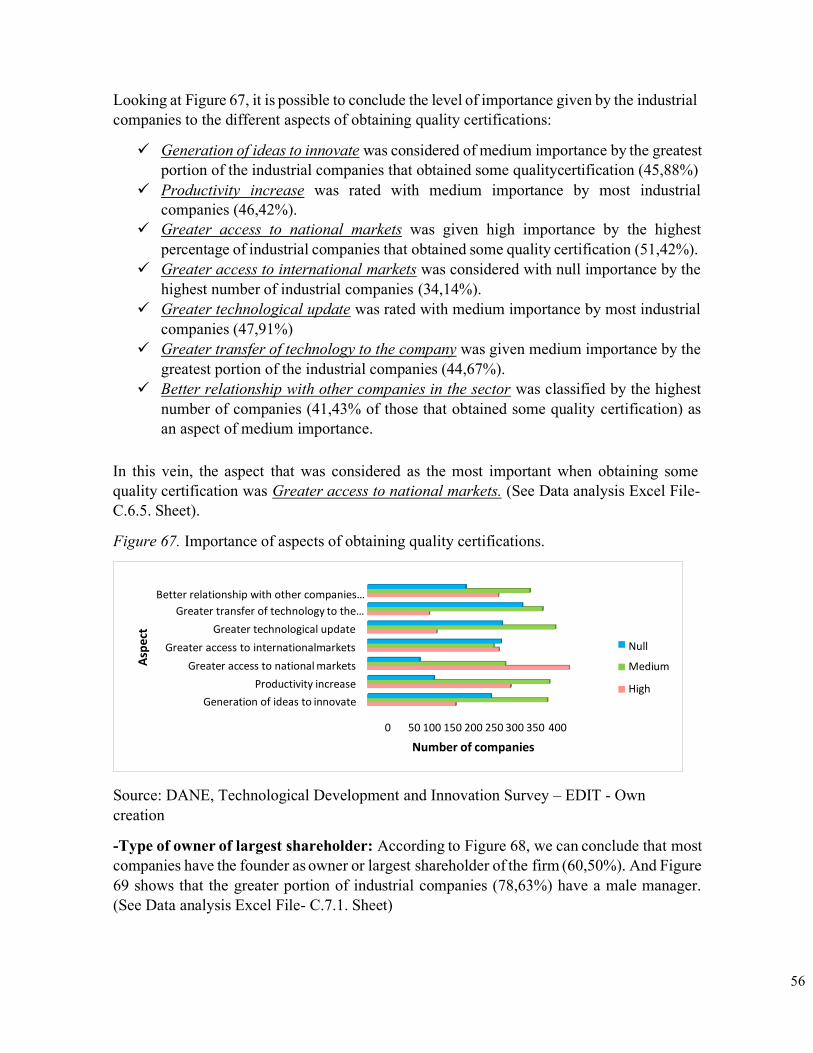
56
Looking at Figure 67, it is possible to conclude the level of importance given by the industrial companies to the different aspects of obtaining quality certifications:
✓ Generation of ideas to innovate was considered of medium importance by the greatest portion of the industrial companies that obtained some qualitycertification (45,88%)
✓ Productivity increase was rated with medium importance by most industrial companies (46,42%).
✓ Greater access to national markets was given high importance by the highest percentage of industrial companies that obtained some quality certification (51,42%).
✓ Greater access to international markets was considered with null importance by the highest number of industrial companies (34,14%).
✓ Greater technological update was rated with medium importance by most industrial companies (47,91%)
✓ Greater transfer of technology to the company was given medium importance by the greatest portion of the industrial companies (44,67%).
✓ Better relationship with other companies in the sector was classified by the highest number of companies (41,43% of those that obtained some quality certification) as an aspect of medium importance.
In this vein, the aspect that was considered as the most important when obtaining some quality certification was Greater access to national markets. (See Data analysis Excel File- C.6.5. Sheet).
Figure 67. Importance of aspects of obtaining quality certifications.
Source: DANE, Technological Development and Innovation Survey – EDIT - Own creation
-Type of owner of largest shareholder: According to Figure 68, we can conclude that most companies have the founder as owner or largest shareholder of the firm (60,50%). And Figure 69 shows that the greater portion of industrial companies (78,63%) have a male manager. (See Data analysis Excel File- C.7.1. Sheet)
Better relationship with other companies…
Greater transfer of technology to the…
Greater technological update
Greater access to internationalmarkets
Greater access to national markets
Productivity increase
Generation of ideas to innovate
Null
Medium
High
0 50 100 150 200 250 300 350 400
Number of companies
Asp
ect
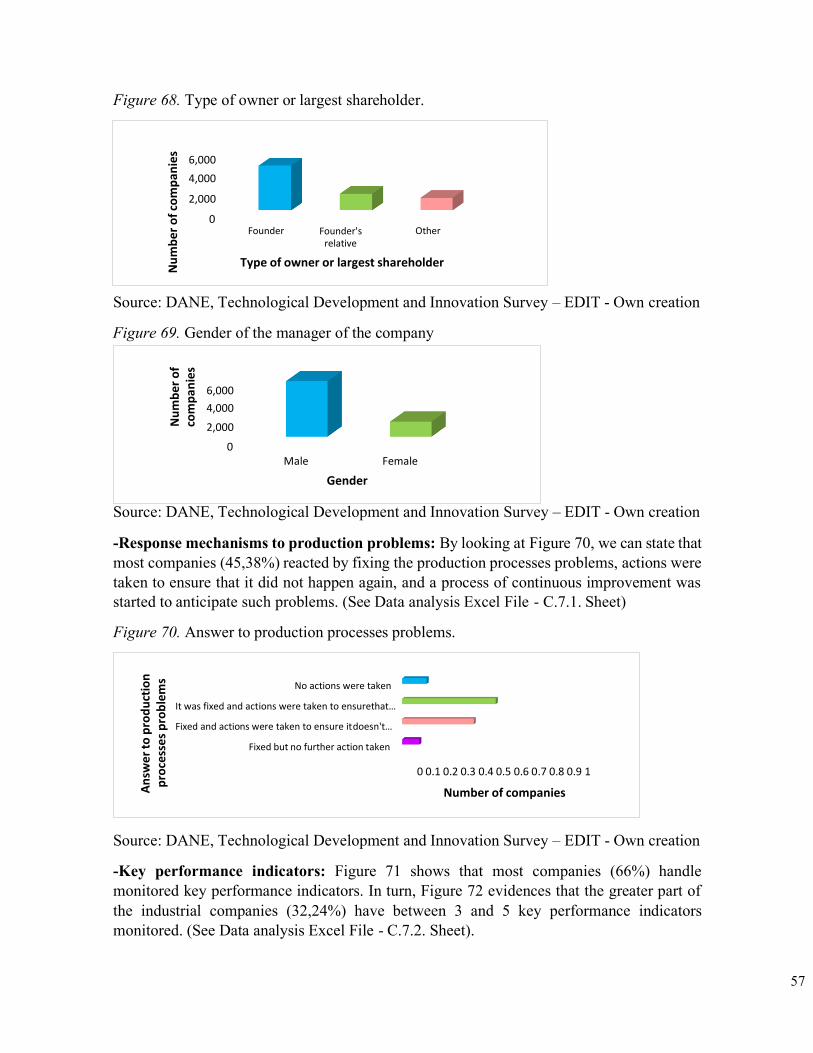
57
Figure 68. Type of owner or largest shareholder.
Source: DANE, Technological Development and Innovation Survey – EDIT - Own creation
Figure 69. Gender of the manager of the company
Source: DANE, Technological Development and Innovation Survey – EDIT - Own creation
-Response mechanisms to production problems: By looking at Figure 70, we can state that most companies (45,38%) reacted by fixing the production processes problems, actions were taken to ensure that it did not happen again, and a process of continuous improvement was started to anticipate such problems. (See Data analysis Excel File - C.7.1. Sheet)
Figure 70. Answer to production processes problems.
Source: DANE, Technological Development and Innovation Survey – EDIT - Own creation
-Key performance indicators: Figure 71 shows that most companies (66%) handle monitored key performance indicators. In turn, Figure 72 evidences that the greater part of the industrial companies (32,24%) have between 3 and 5 key performance indicators monitored. (See Data analysis Excel File - C.7.2. Sheet).
6,000
4,000
2,000
Founder Founder's relative
Other
Type of owner or largest shareholder
6,000
4,000
2,000
Male Female
Gender
No actions were taken
It was fixed and actions were taken to ensurethat…
Fixed and actions were taken to ensure it doesn't…
Fixed but no further action taken
0 0.1 0.2 0.3 0.4 0.5 0.6 0.7 0.8 0.9 1
Number of companies An
swer
to
pro
du
ctio
n
pro
cess
es
pro
ble
ms
Nu
mb
er o
f co
mp
anie
s N
um
ber
of
com
pan
ies
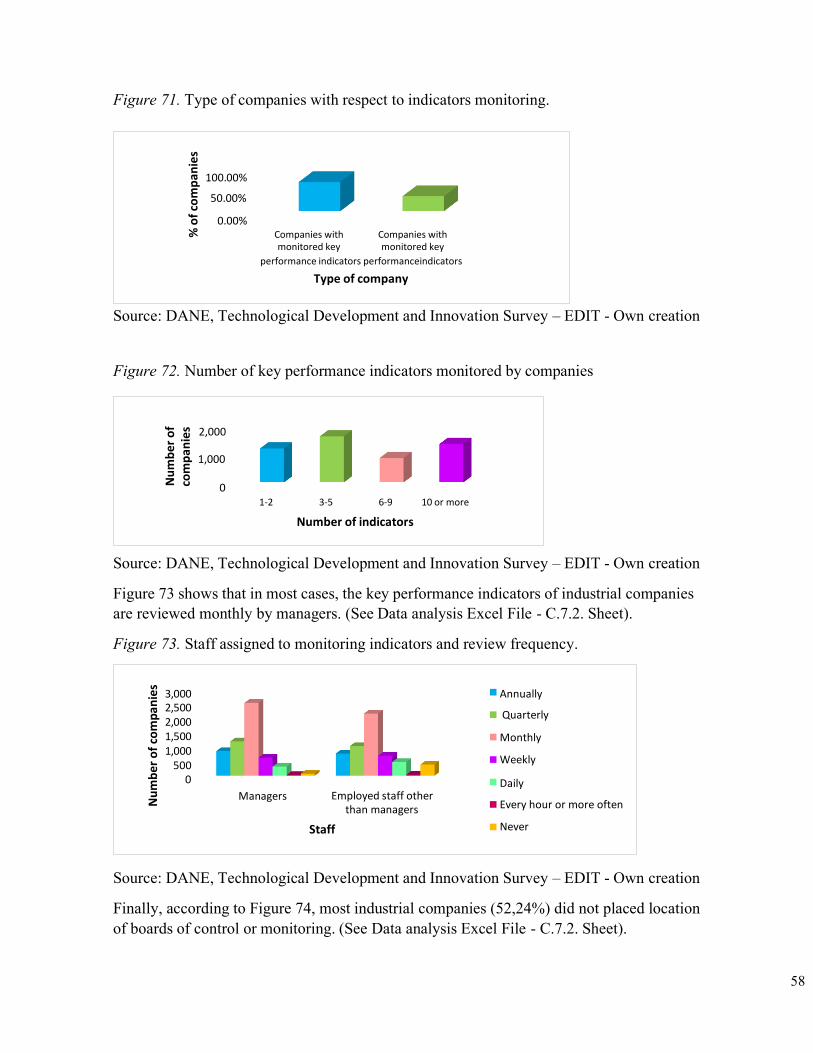
58
Figure 71. Type of companies with respect to indicators monitoring.
Source: DANE, Technological Development and Innovation Survey – EDIT - Own creation
Figure 72. Number of key performance indicators monitored by companies
Source: DANE, Technological Development and Innovation Survey – EDIT - Own creation
Figure 73 shows that in most cases, the key performance indicators of industrial companies are reviewed monthly by managers. (See Data analysis Excel File - C.7.2. Sheet).
Figure 73. Staff assigned to monitoring indicators and review frequency.
Source: DANE, Technological Development and Innovation Survey – EDIT - Own creation
Finally, according to Figure 74, most industrial companies (52,24%) did not placed location of boards of control or monitoring. (See Data analysis Excel File - C.7.2. Sheet).
100.00%
50.00%
0.00% Companies with monitored key
Companies with monitored key
performance indicators performanceindicators
Type of company
2,000
1,000
1-2 3-5 6-9 10 or more
Number of indicators
3,000 2,500 2,000 1,500 1,000
500
Annually
Quarterly
Monthly
Weekly
Managers Employed staff other than managers
Staff
Daily
Every hour or more often
Never
Nu
mb
er o
f co
mp
anie
s
Nu
mb
er o
f co
mp
anie
s %
of
com
pan
ies
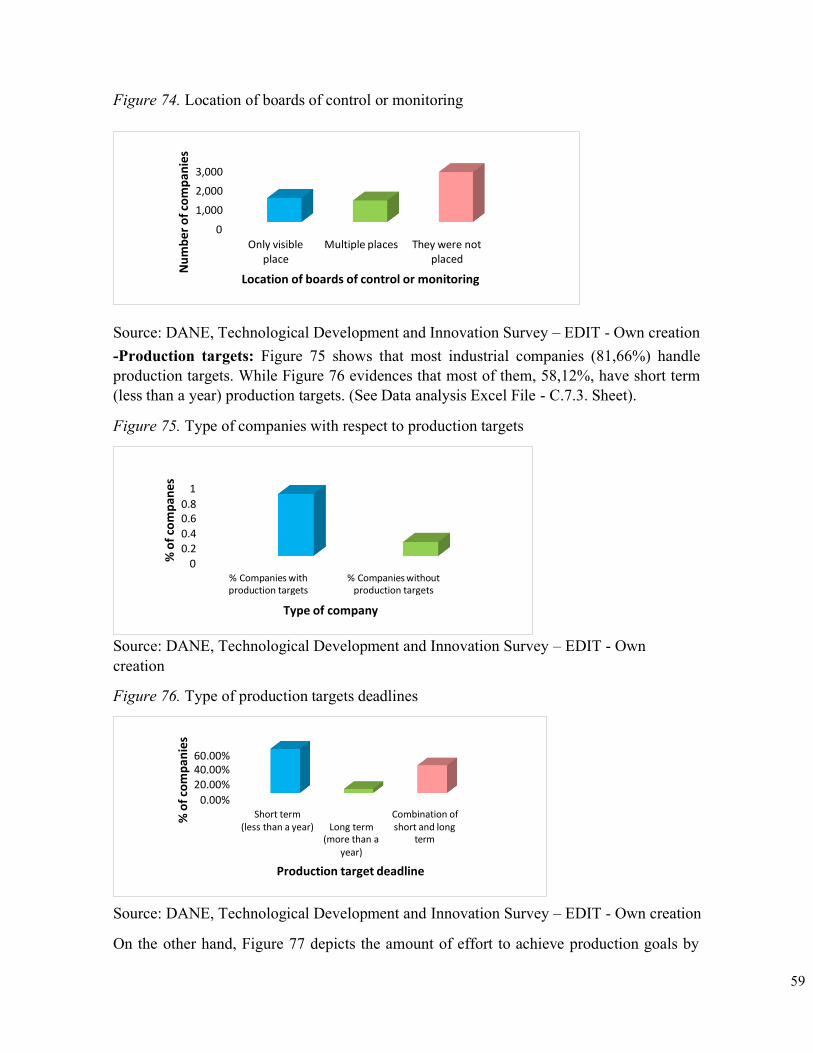
59
3,000
2,000
1,000
Only visible Multiple places They were not
place placed
Location of boards of control or monitoring
Figure 74. Location of boards of control or monitoring
Source: DANE, Technological Development and Innovation Survey – EDIT - Own creation -Production targets: Figure 75 shows that most industrial companies (81,66%) handle production targets. While Figure 76 evidences that most of them, 58,12%, have short term (less than a year) production targets. (See Data analysis Excel File - C.7.3. Sheet).
Figure 75. Type of companies with respect to production targets
Source: DANE, Technological Development and Innovation Survey – EDIT - Own creation
Figure 76. Type of production targets deadlines
Source: DANE, Technological Development and Innovation Survey – EDIT - Own creation
On the other hand, Figure 77 depicts the amount of effort to achieve production goals by
60.00% 40.00% 20.00%
0.00% Short term Combination of
(less than a year) Long term short and long (more than a term
year)
Production target deadline
0.8 0.6
0.4 0.2
% Companies with production targets
% Companies without production targets
Type of company
% o
f co
mp
anes
%
of
com
pan
ies
Nu
mb
er o
f co
mp
anie
s
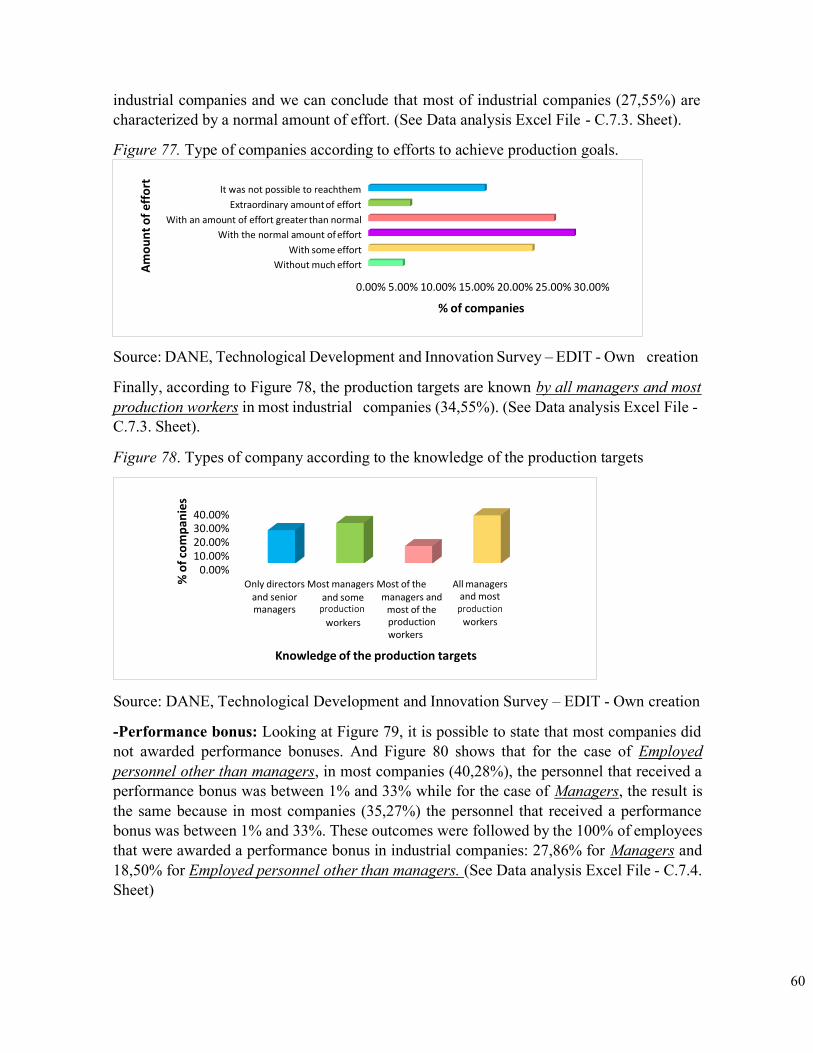
60
industrial companies and we can conclude that most of industrial companies (27,55%) are characterized by a normal amount of effort. (See Data analysis Excel File - C.7.3. Sheet).
Figure 77. Type of companies according to efforts to achieve production goals.
Source: DANE, Technological Development and Innovation Survey – EDIT - Own creation
Finally, according to Figure 78, the production targets are known by all managers and most production workers in most industrial companies (34,55%). (See Data analysis Excel File - C.7.3. Sheet).
Figure 78. Types of company according to the knowledge of the production targets
Source: DANE, Technological Development and Innovation Survey – EDIT - Own creation
-Performance bonus: Looking at Figure 79, it is possible to state that most companies did not awarded performance bonuses. And Figure 80 shows that for the case of Employed personnel other than managers, in most companies (40,28%), the personnel that received a performance bonus was between 1% and 33% while for the case of Managers, the result is the same because in most companies (35,27%) the personnel that received a performance bonus was between 1% and 33%. These outcomes were followed by the 100% of employees that were awarded a performance bonus in industrial companies: 27,86% for Managers and 18,50% for Employed personnel other than managers. (See Data analysis Excel File - C.7.4. Sheet)
It was not possible to reachthem
Extraordinary amount of effort
With an amount of effort greater than normal
With the normal amount of effort
With some effort
Without much effort
0.00% 5.00% 10.00% 15.00% 20.00% 25.00% 30.00%
% of companies
40.00% 30.00% 20.00% 10.00%
0.00% Only directors Most managers Most of the
and senior managers
and some All managers
and most
workers
managers and most of the production workers workers
Knowledge of the production targets
Am
ou
nt
of
effo
rt
% o
f co
mp
anie
s
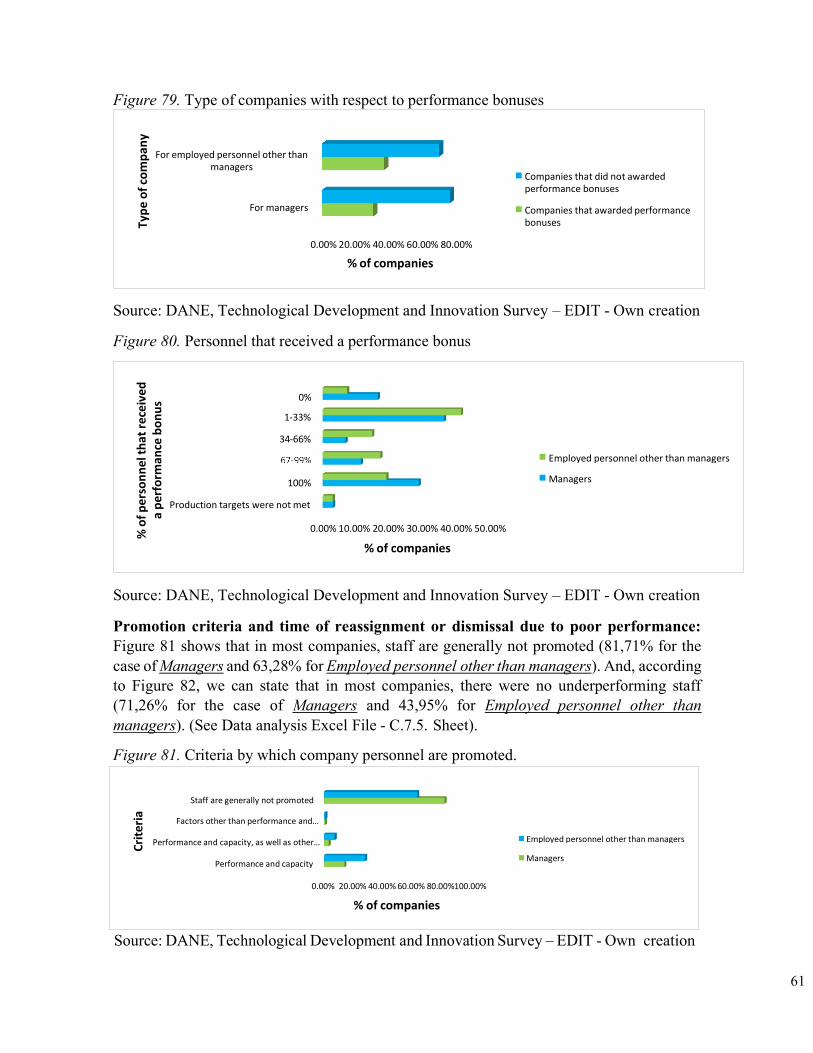
61
Figure 79. Type of companies with respect to performance bonuses
Source: DANE, Technological Development and Innovation Survey – EDIT - Own creation
Figure 80. Personnel that received a performance bonus
Source: DANE, Technological Development and Innovation Survey – EDIT - Own creation
Promotion criteria and time of reassignment or dismissal due to poor performance: Figure 81 shows that in most companies, staff are generally not promoted (81,71% for the case of Managers and 63,28% for Employed personnel other than managers). And, according to Figure 82, we can state that in most companies, there were no underperforming staff (71,26% for the case of Managers and 43,95% for Employed personnel other than managers). (See Data analysis Excel File - C.7.5. Sheet).
Figure 81. Criteria by which company personnel are promoted.
Source: DANE, Technological Development and Innovation Survey – EDIT - Own creation
For employed personnel other than managers
Companies that did not awarded performance bonuses
For managers Companies that awarded performance bonuses
0.00% 20.00% 40.00% 60.00% 80.00%
% of companies
0%
1-33%
34-66%
Employed personnel other than managers
100% Managers
Production targets were not met
0.00% 10.00% 20.00% 30.00% 40.00% 50.00%
% of companies
Staff are generally not promoted
Factors other than performance and…
Performance and capacity, as well as other… Employed personnel other than managers
Performance and capacity Managers
0.00% 20.00% 40.00% 60.00% 80.00%100.00%
% of companies
Cri
teri
a
% o
f p
erso
nn
el t
hat
rec
eiv
ed
a p
erfo
rman
ce b
on
us
Typ
e o
f co
mp
any
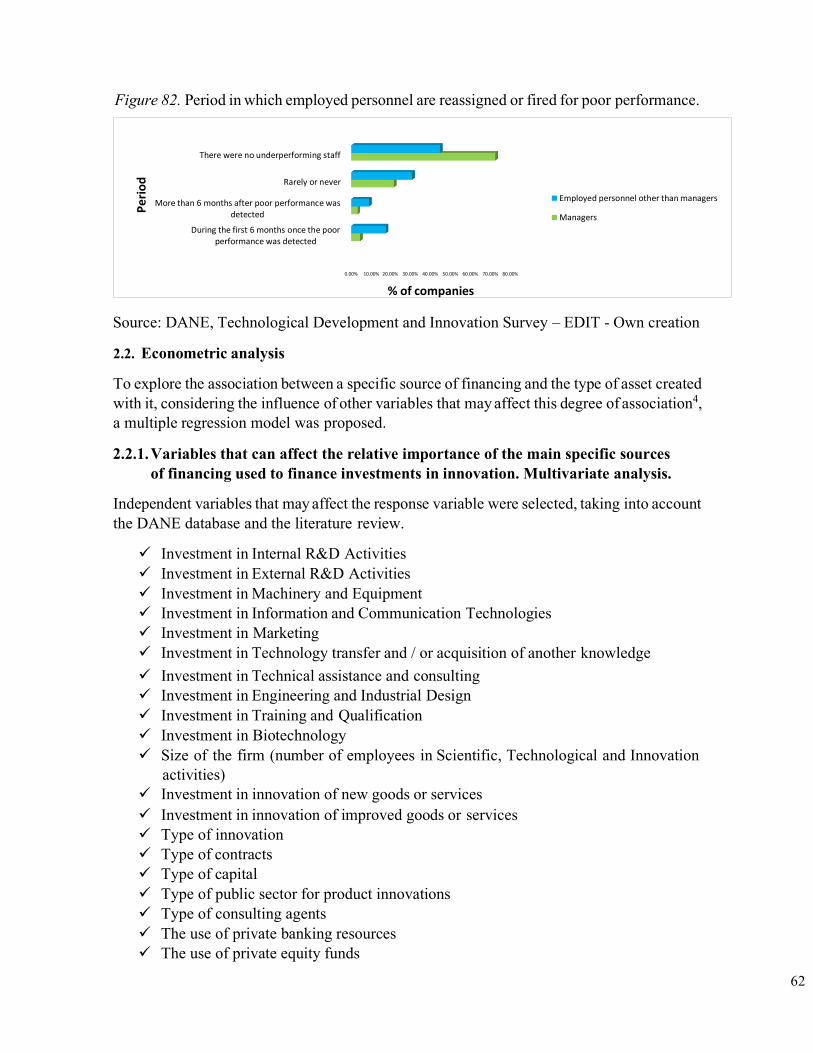
62
Figure 82. Period in which employed personnel are reassigned or fired for poor performance.
There were no underperforming staff
Rarely or never
More than 6 months after poor performance was detected
During the first 6 months once the poor performance was detected
Employed personnel other than managers
Managers
0.00% 10.00% 20.00% 30.00% 40.00% 50.00% 60.00% 70.00% 80.00%
% of companies
Source: DANE, Technological Development and Innovation Survey – EDIT - Own creation
2.2. Econometric analysis
To explore the association between a specific source of financing and the type of asset created with it, considering the influence of other variables that may affect this degree of association4, a multiple regression model was proposed.
2.2.1. Variables that can affect the relative importance of the main specific sources of financing used to finance investments in innovation. Multivariate analysis.
Independent variables that may affect the response variable were selected, taking into account the DANE database and the literature review.
✓ Investment in Internal R&D Activities ✓ Investment in External R&D Activities ✓ Investment in Machinery and Equipment ✓ Investment in Information and Communication Technologies ✓ Investment in Marketing ✓ Investment in Technology transfer and / or acquisition of another knowledge ✓ Investment in Technical assistance and consulting ✓ Investment in Engineering and Industrial Design ✓ Investment in Training and Qualification ✓ Investment in Biotechnology ✓ Size of the firm (number of employees in Scientific, Technological and Innovation
activities) ✓ Investment in innovation of new goods or services ✓ Investment in innovation of improved goods or services ✓ Type of innovation ✓ Type of contracts ✓ Type of capital ✓ Type of public sector for product innovations ✓ Type of consulting agents ✓ The use of private banking resources ✓ The use of private equity funds
Per
iod
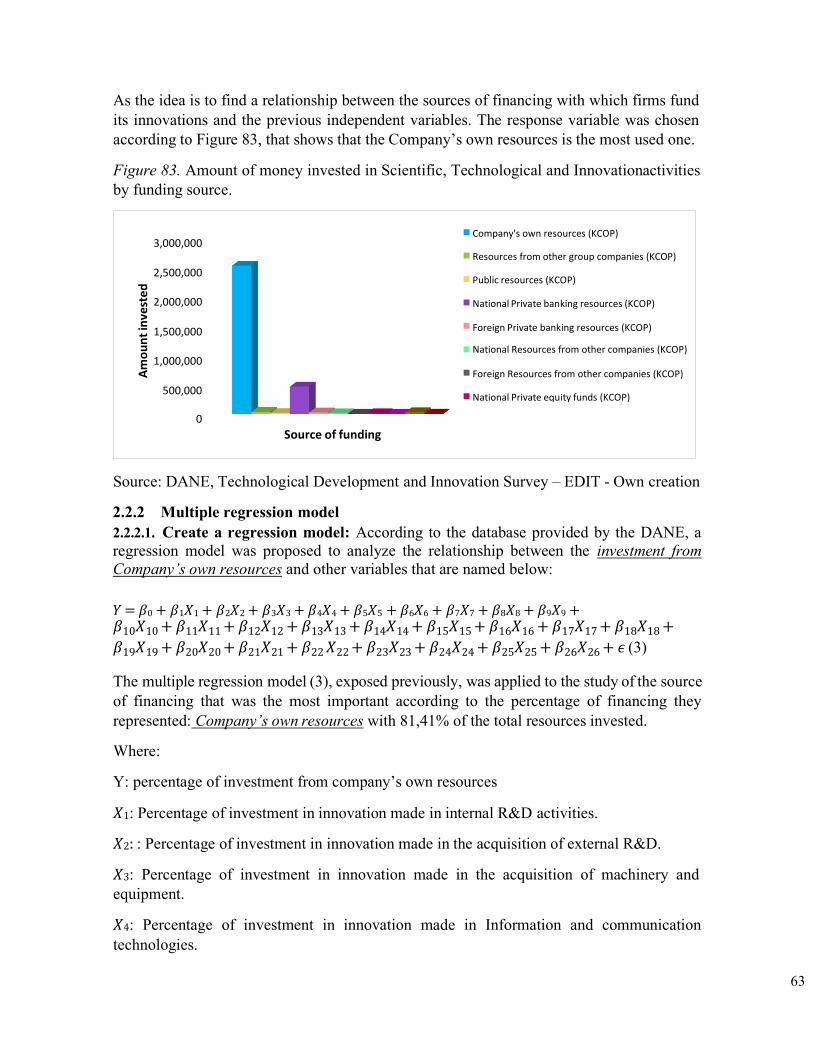
63
As the idea is to find a relationship between the sources of financing with which firms fund its innovations and the previous independent variables. The response variable was chosen according to Figure 83, that shows that the Company’s own resources is the most used one.
Figure 83. Amount of money invested in Scientific, Technological and Innovationactivities by funding source.
Source: DANE, Technological Development and Innovation Survey – EDIT - Own creation
2.2.2 Multiple regression model 2.2.2.1. Create a regression model: According to the database provided by the DANE, a regression model was proposed to analyze the relationship between the investment from Company’s own resources and other variables that are named below:
𝑌 = 𝛽0 + 𝛽1𝑋1 + 𝛽2𝑋2 + 𝛽3𝑋3 + 𝛽4𝑋4 + 𝛽5𝑋5 + 𝛽6𝑋6 + 𝛽7𝑋7 + 𝛽8𝑋8 + 𝛽9𝑋9 + 𝛽10𝑋10 + 𝛽11𝑋11 + 𝛽12𝑋12 + 𝛽13𝑋13 + 𝛽14𝑋14 + 𝛽15𝑋15 + 𝛽16𝑋16 + 𝛽17𝑋17 + 𝛽18𝑋18 + 𝛽19𝑋19 + 𝛽20𝑋20 + 𝛽21𝑋21 + 𝛽22 𝑋22 + 𝛽23𝑋23 + 𝛽24𝑋24 + 𝛽25𝑋25 + 𝛽26𝑋26 + 𝜖 (3)
The multiple regression model (3), exposed previously, was applied to the study of the source of financing that was the most important according to the percentage of financing they represented: Company’s own resources with 81,41% of the total resources invested.
Where:
Y: percentage of investment from company’s own resources
𝑋1: Percentage of investment in innovation made in internal R&D activities.
𝑋2: : Percentage of investment in innovation made in the acquisition of external R&D.
𝑋3: Percentage of investment in innovation made in the acquisition of machinery and equipment.
𝑋4: Percentage of investment in innovation made in Information and communication technologies.
Company's own resources (KCOP) 3,000,000
Resources from other group companies (KCOP)
2,500,000 Public resources (KCOP)
2,000,000 National Private banking resources (KCOP)
1,500,000 Foreign Private banking resources (KCOP)
National Resources from other companies (KCOP) 1,000,000
Foreign Resources from other companies (KCOP)
500,000 National Private equity funds (KCOP)
Source of funding
Am
ou
nt
inve
sted
64
𝑋5 : Percentage of investment in innovation made in marketing.
𝑋6: Percentage of investment in innovation made in Technology transfer and / or acquisition of another knowledge.
𝑋7: Percentage of investment in innovation made in Technical assistance and consulting.
𝑋8: Percentage of investment in innovation made in Engineering and industrial design.
𝑋9: Percentage of investment in innovation made in Training and qualification.
𝑋10: Percentage of investment in innovation made in Biotechnology.
𝑋11: Size of the company. (The number of employees as an indicator of size).
𝑋12 ∶ Percentage of the investment in Innovation in new goods or services.
𝑋13: Percentage of the investment in Innovation in significantly improved goods or services.
𝑋14, 𝑋15: Dummy variables for type of innovation.
𝑋14 : ∶was assigned 1 if the company classifies the innovation as broad and 0 in any other case.
𝑋15: was assigned 1 if the company classifies the innovation as strict, and 0 in any other case.
𝑋16: Dummy variable for type of contract
𝑋16: was assigned 1 if the company had contracts with the foreign public sector, and 0 in any other case. 𝑋17: Dummy variable for type of equity ownership
𝑋17: was assigned 1 if it is reported that the company has foreign investment within its social capital, and 0 in any other case.
𝑋18, 𝑋19: Dummy variable according to supplied product innovations.
𝑋18: was assigned 1 if the company supplied product innovations to the national public sector, and 0 in any other case.
𝑋19: was assigned 1 if the company supplied product innovations to the foreign public sector, and 0 in any other case.
𝑋20: Dummy variable according to hiring of external consulting agents.
𝑋20: was assigned 1 if it is reported that the company hired external consulting agents.
𝑋21: Percentage of the investment from resources of other group companies
𝑋22: Percentage of the investment from public resources
𝑋23: Percentage of the investment from Private Banking
𝑋24: Percentage of the investment from other companies’ resources
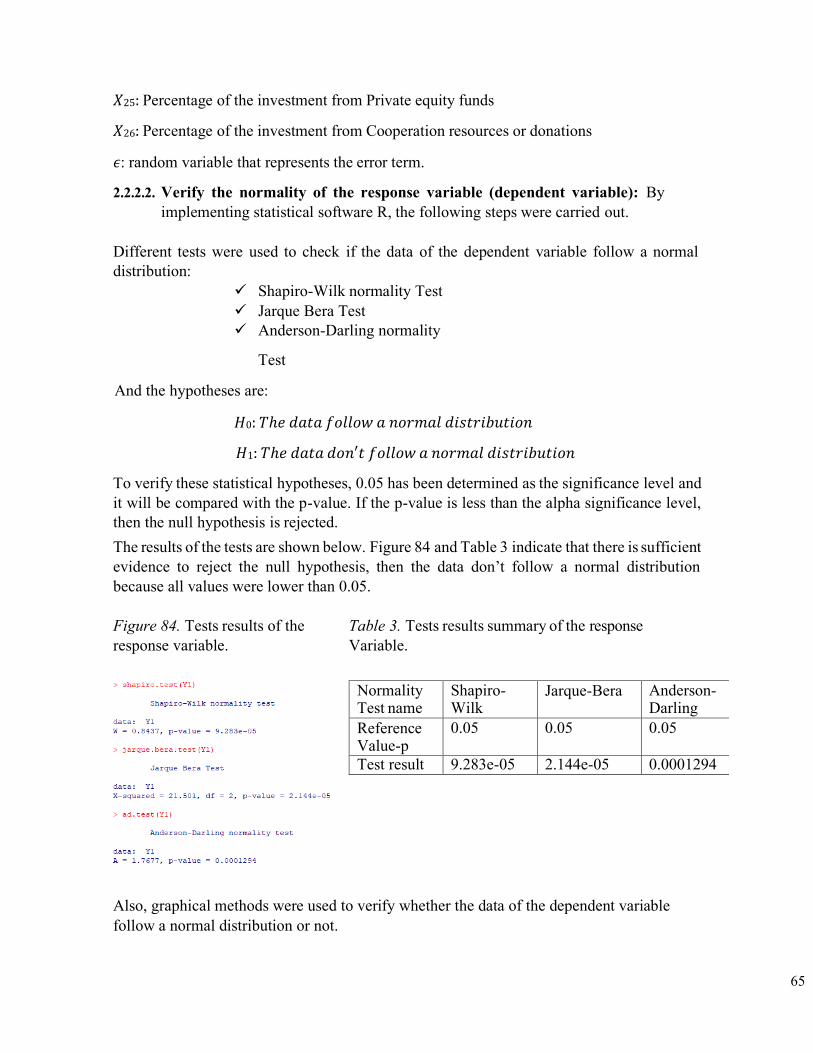
65
𝑋25: Percentage of the investment from Private equity funds
𝑋26: Percentage of the investment from Cooperation resources or donations
𝜖: random variable that represents the error term.
2.2.2.2. Verify the normality of the response variable (dependent variable): By implementing statistical software R, the following steps were carried out.
Different tests were used to check if the data of the dependent variable follow a normal distribution:
✓ Shapiro-Wilk normality Test ✓ Jarque Bera Test ✓ Anderson-Darling normality
Test
And the hypotheses are:
𝐻0: 𝑇ℎ𝑒 𝑑𝑎𝑡𝑎 𝑓𝑜𝑙𝑙𝑜𝑤 𝑎 𝑛𝑜𝑟𝑚𝑎𝑙 𝑑𝑖𝑠𝑡𝑟𝑖𝑏𝑢𝑡𝑖𝑜𝑛
𝐻1: 𝑇ℎ𝑒 𝑑𝑎𝑡𝑎 𝑑𝑜𝑛′𝑡 𝑓𝑜𝑙𝑙𝑜𝑤 𝑎 𝑛𝑜𝑟𝑚𝑎𝑙 𝑑𝑖𝑠𝑡𝑟𝑖𝑏𝑢𝑡𝑖𝑜𝑛
To verify these statistical hypotheses, 0.05 has been determined as the significance level and it will be compared with the p-value. If the p-value is less than the alpha significance level, then the null hypothesis is rejected. The results of the tests are shown below. Figure 84 and Table 3 indicate that there is sufficient evidence to reject the null hypothesis, then the data don’t follow a normal distribution because all values were lower than 0.05. Figure 84. Tests results of the Table 3. Tests results summary of the response response variable. Variable.
Also, graphical methods were used to verify whether the data of the dependent variable follow a normal distribution or not.
Normality Test name
Shapiro- Wilk
Jarque-Bera Anderson- Darling
Reference Value-p
0.05 0.05 0.05
Test result 9.283e-05 2.144e-05 0.0001294
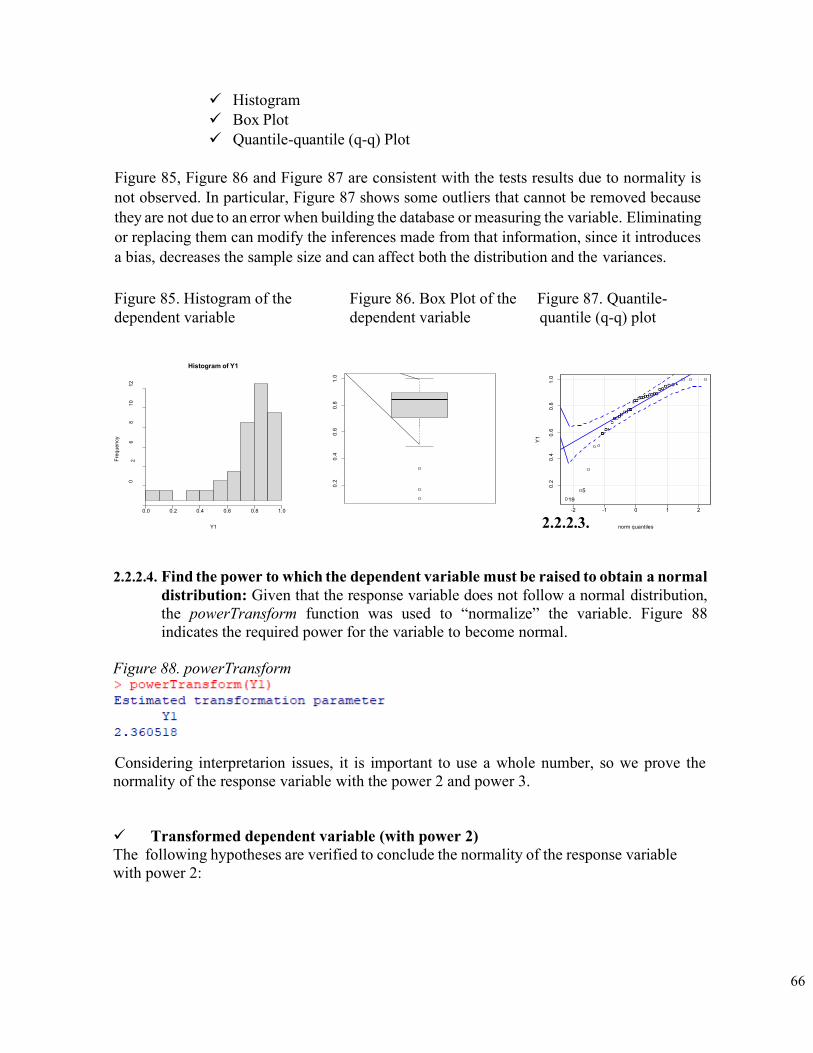
66
✓ Histogram ✓ Box Plot ✓ Quantile-quantile (q-q) Plot
Figure 85, Figure 86 and Figure 87 are consistent with the tests results due to normality is not observed. In particular, Figure 87 shows some outliers that cannot be removed because they are not due to an error when building the database or measuring the variable. Eliminating or replacing them can modify the inferences made from that information, since it introduces a bias, decreases the sample size and can affect both the distribution and the variances.
Figure 85. Histogram of the Figure 86. Box Plot of the Figure 87. Quantile- dependent variable dependent variable quantile (q-q) plot
Histogram of Y1
0.0 0.2 0.4 0.6 0.8 1.0 -2 -1 0 1 2
Y1 2.2.2.3. norm quantiles
2.2.2.4. Find the power to which the dependent variable must be raised to obtain a normal distribution: Given that the response variable does not follow a normal distribution, the powerTransform function was used to “normalize” the variable. Figure 88 indicates the required power for the variable to become normal.
Figure 88. powerTransform
Considering interpretarion issues, it is important to use a whole number, so we prove the normality of the response variable with the power 2 and power 3.
✓ Transformed dependent variable (with power 2) The following hypotheses are verified to conclude the normality of the response variable with power 2:
Freq
uenc
y
0 6
8 10
12
2
0.2
0.4
0.6
0.8
1.0
Y1
0.2
0.4
0.6
0.8
1.0
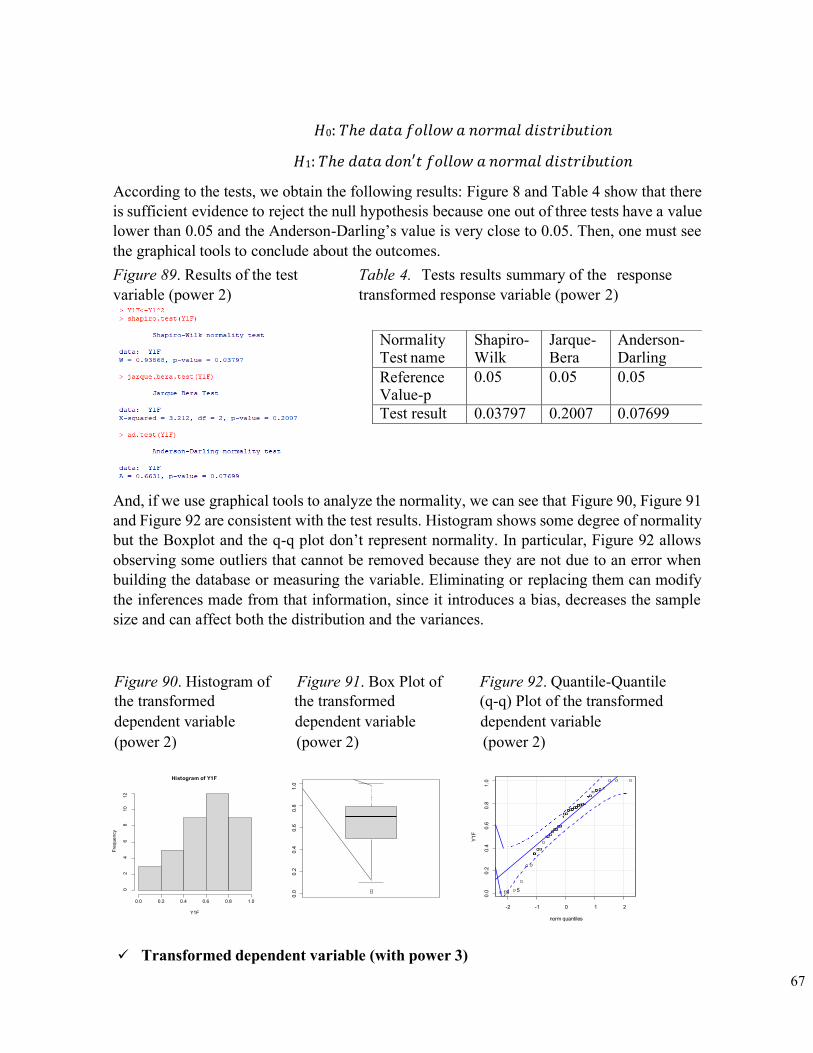
67
Freq
uenc
y
0 2
4 6
8 10
12
0.0
0.2
0.4
0.6
0.8
1.0
Y1F
0.0
0.2
0.4
0.6
0.8
1.0
𝐻0: 𝑇ℎ𝑒 𝑑𝑎𝑡𝑎 𝑓𝑜𝑙𝑙𝑜𝑤 𝑎 𝑛𝑜𝑟𝑚𝑎𝑙 𝑑𝑖𝑠𝑡𝑟𝑖𝑏𝑢𝑡𝑖𝑜𝑛
𝐻1: 𝑇ℎ𝑒 𝑑𝑎𝑡𝑎 𝑑𝑜𝑛′𝑡 𝑓𝑜𝑙𝑙𝑜𝑤 𝑎 𝑛𝑜𝑟𝑚𝑎𝑙 𝑑𝑖𝑠𝑡𝑟𝑖𝑏𝑢𝑡𝑖𝑜𝑛
According to the tests, we obtain the following results: Figure 8 and Table 4 show that there is sufficient evidence to reject the null hypothesis because one out of three tests have a value lower than 0.05 and the Anderson-Darling’s value is very close to 0.05. Then, one must see the graphical tools to conclude about the outcomes. Figure 89. Results of the test Table 4. Tests results summary of the response variable (power 2) transformed response variable (power 2)
And, if we use graphical tools to analyze the normality, we can see that Figure 90, Figure 91 and Figure 92 are consistent with the test results. Histogram shows some degree of normality but the Boxplot and the q-q plot don’t represent normality. In particular, Figure 92 allows observing some outliers that cannot be removed because they are not due to an error when building the database or measuring the variable. Eliminating or replacing them can modify the inferences made from that information, since it introduces a bias, decreases the sample size and can affect both the distribution and the variances.
Figure 90. Histogram of Figure 91. Box Plot of Figure 92. Quantile-Quantile the transformed the transformed (q-q) Plot of the transformed dependent variable dependent variable dependent variable (power 2)
Histogram of Y1F
0.0 0.2 0.4 0.6 0.8 1.0
Y1F
(power 2) (power 2)
19 5
-2 -1 0 1 2
norm quantiles
✓ Transformed dependent variable (with power 3)
Normality Test name
Shapiro- Wilk
Jarque- Bera
Anderson- Darling
Reference Value-p
0.05 0.05 0.05
Test result 0.03797 0.2007 0.07699
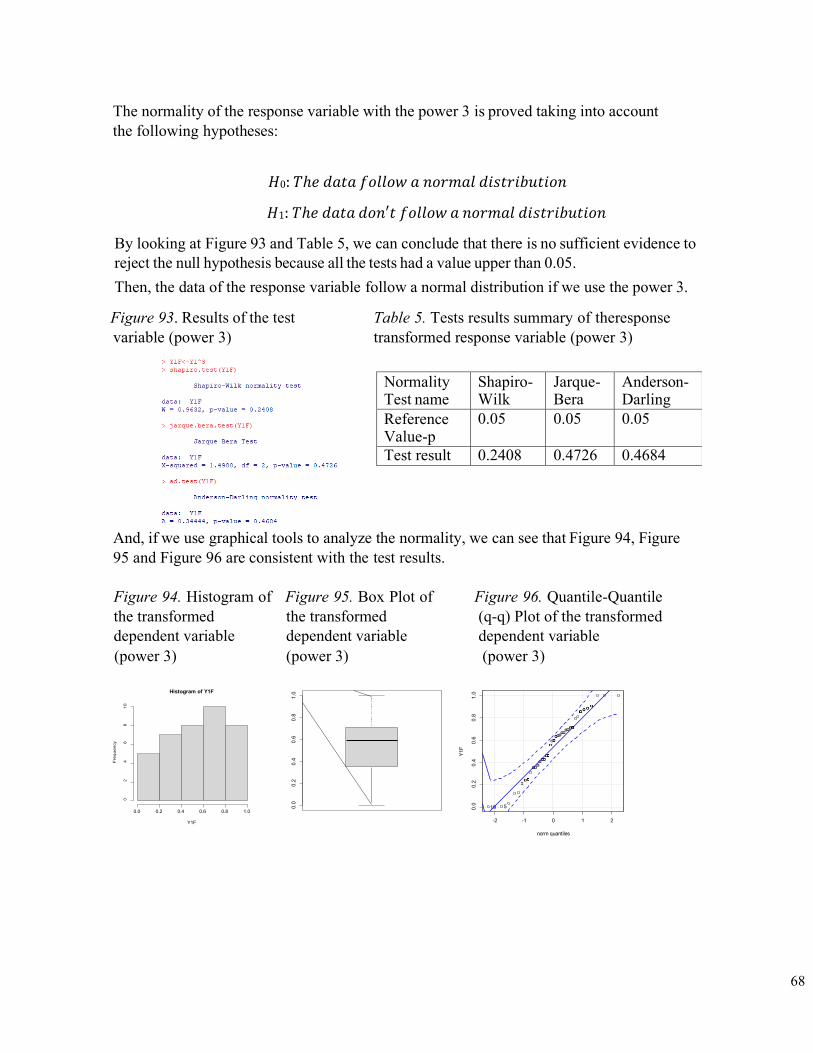
68
The normality of the response variable with the power 3 is proved taking into account the following hypotheses:
𝐻0: 𝑇ℎ𝑒 𝑑𝑎𝑡𝑎 𝑓𝑜𝑙𝑙𝑜𝑤 𝑎 𝑛𝑜𝑟𝑚𝑎𝑙 𝑑𝑖𝑠𝑡𝑟𝑖𝑏𝑢𝑡𝑖𝑜𝑛
𝐻1: 𝑇ℎ𝑒 𝑑𝑎𝑡𝑎 𝑑𝑜𝑛′𝑡 𝑓𝑜𝑙𝑙𝑜𝑤 𝑎 𝑛𝑜𝑟𝑚𝑎𝑙 𝑑𝑖𝑠𝑡𝑟𝑖𝑏𝑢𝑡𝑖𝑜𝑛
By looking at Figure 93 and Table 5, we can conclude that there is no sufficient evidence to reject the null hypothesis because all the tests had a value upper than 0.05. Then, the data of the response variable follow a normal distribution if we use the power 3.
Figure 93. Results of the test Table 5. Tests results summary of theresponse variable (power 3) transformed response variable (power 3)
And, if we use graphical tools to analyze the normality, we can see that Figure 94, Figure 95 and Figure 96 are consistent with the test results.
Figure 94. Histogram of Figure 95. Box Plot of Figure 96. Quantile-Quantile the transformed the transformed (q-q) Plot of the transformed dependent variable dependent variable dependent variable (power 3) (power 3) (power 3)
Histogram of Y1F
0.0 0.2 0.4 0.6 0.8 1.0
Y1F
-2 -1 0 1 2
norm quantiles
19 5
Freq
uenc
y
0 2
4 6
8 10
0.0
0.2
0.4
0.6
0.8
1.0
Y1F
0.0
0.2
0.4
0.6
0.8
1.0
Normality Test name
Shapiro- Wilk
Jarque- Bera
Anderson- Darling
Reference Value-p
0.05 0.05 0.05
Test result 0.2408 0.4726 0.4684
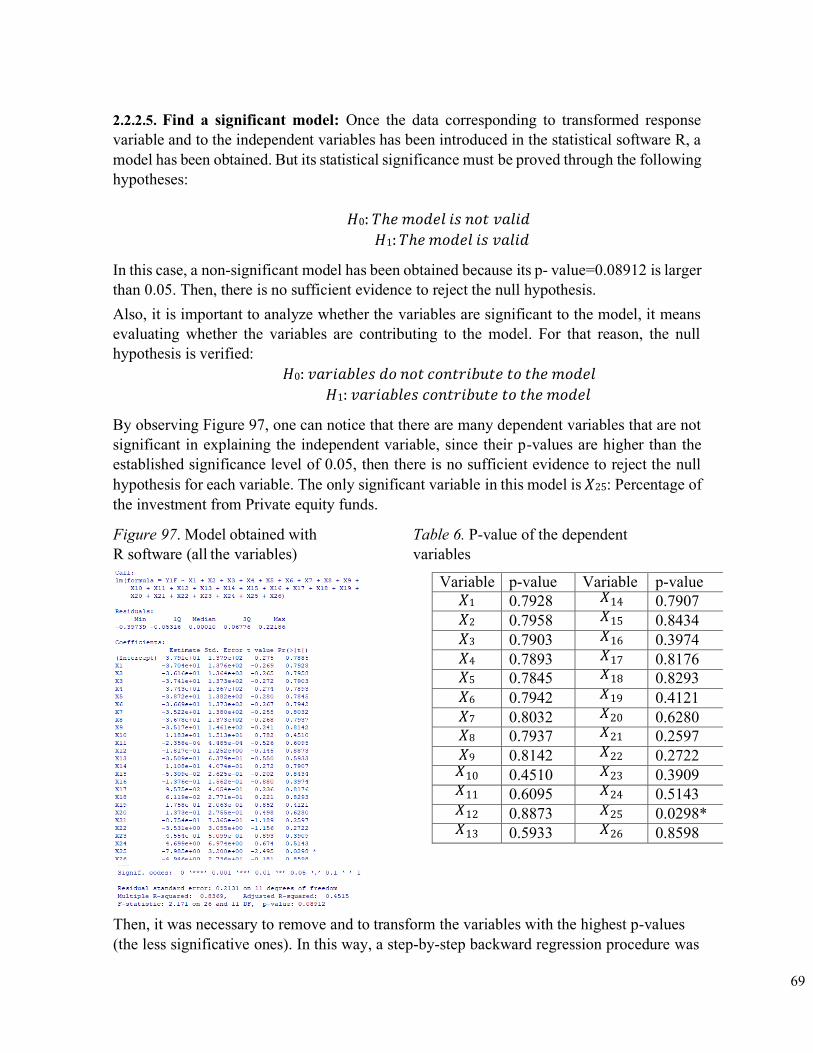
69
2.2.2.5. Find a significant model: Once the data corresponding to transformed response variable and to the independent variables has been introduced in the statistical software R, a model has been obtained. But its statistical significance must be proved through the following hypotheses:
𝐻0: 𝑇ℎ𝑒 𝑚𝑜𝑑𝑒𝑙 𝑖𝑠 𝑛𝑜𝑡 𝑣𝑎𝑙𝑖𝑑
𝐻1: 𝑇ℎ𝑒 𝑚𝑜𝑑𝑒𝑙 𝑖𝑠 𝑣𝑎𝑙𝑖𝑑
In this case, a non-significant model has been obtained because its p- value=0.08912 is larger than 0.05. Then, there is no sufficient evidence to reject the null hypothesis. Also, it is important to analyze whether the variables are significant to the model, it means evaluating whether the variables are contributing to the model. For that reason, the null hypothesis is verified:
𝐻0: 𝑣𝑎𝑟𝑖𝑎𝑏𝑙𝑒𝑠 𝑑𝑜 𝑛𝑜𝑡 𝑐𝑜𝑛𝑡𝑟𝑖𝑏𝑢𝑡𝑒 𝑡𝑜 𝑡ℎ𝑒 𝑚𝑜𝑑𝑒𝑙 𝐻1: 𝑣𝑎𝑟𝑖𝑎𝑏𝑙𝑒𝑠 𝑐𝑜𝑛𝑡𝑟𝑖𝑏𝑢𝑡𝑒 𝑡𝑜 𝑡ℎ𝑒 𝑚𝑜𝑑𝑒𝑙
By observing Figure 97, one can notice that there are many dependent variables that are not significant in explaining the independent variable, since their p-values are higher than the established significance level of 0.05, then there is no sufficient evidence to reject the null hypothesis for each variable. The only significant variable in this model is 𝑋25: Percentage of the investment from Private equity funds.
Figure 97. Model obtained with Table 6. P-value of the dependent R software (all the variables) variables
Then, it was necessary to remove and to transform the variables with the highest p-values (the less significative ones). In this way, a step-by-step backward regression procedure was
Variable p-value Variable p-value 𝑋1 0.7928 𝑋14 0.7907 𝑋2 0.7958 𝑋15 0.8434 𝑋3 0.7903 𝑋16 0.3974 𝑋4 0.7893 𝑋17 0.8176 𝑋5 0.7845 𝑋18 0.8293 𝑋6 0.7942 𝑋19 0.4121 𝑋7 0.8032 𝑋20 0.6280 𝑋8 0.7937 𝑋21 0.2597 𝑋9 0.8142 𝑋22 0.2722 𝑋10 0.4510 𝑋23 0.3909 𝑋11 0.6095 𝑋24 0.5143 𝑋12 0.8873 𝑋25 0.0298* 𝑋13 0.5933 𝑋26 0.8598
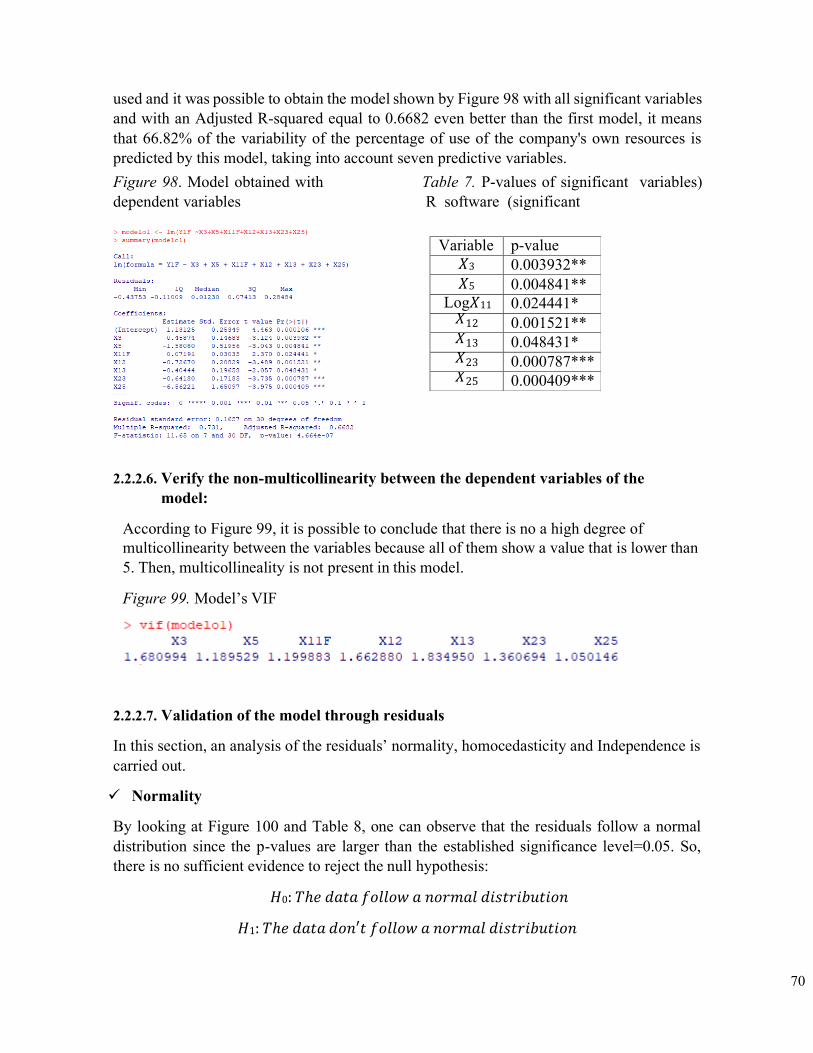
70
used and it was possible to obtain the model shown by Figure 98 with all significant variables and with an Adjusted R-squared equal to 0.6682 even better than the first model, it means that 66.82% of the variability of the percentage of use of the company's own resources is predicted by this model, taking into account seven predictive variables. Figure 98. Model obtained with Table 7. P-values of significant variables) dependent variables R software (significant
2.2.2.6. Verify the non-multicollinearity between the dependent variables of the model:
According to Figure 99, it is possible to conclude that there is no a high degree of multicollinearity between the variables because all of them show a value that is lower than 5. Then, multicollineality is not present in this model.
Figure 99. Model’s VIF
2.2.2.7. Validation of the model through residuals
In this section, an analysis of the residuals’ normality, homocedasticity and Independence is carried out.
✓ Normality
By looking at Figure 100 and Table 8, one can observe that the residuals follow a normal distribution since the p-values are larger than the established significance level=0.05. So, there is no sufficient evidence to reject the null hypothesis:
𝐻0: 𝑇ℎ𝑒 𝑑𝑎𝑡𝑎 𝑓𝑜𝑙𝑙𝑜𝑤 𝑎 𝑛𝑜𝑟𝑚𝑎𝑙 𝑑𝑖𝑠𝑡𝑟𝑖𝑏𝑢𝑡𝑖𝑜𝑛
𝐻1: 𝑇ℎ𝑒 𝑑𝑎𝑡𝑎 𝑑𝑜𝑛′𝑡 𝑓𝑜𝑙𝑙𝑜𝑤 𝑎 𝑛𝑜𝑟𝑚𝑎𝑙 𝑑𝑖𝑠𝑡𝑟𝑖𝑏𝑢𝑡𝑖𝑜𝑛
Variable p-value 𝑋3 0.003932** 𝑋5 0.004841**
Log𝑋11 0.024441* 𝑋12 0.001521** 𝑋13 0.048431* 𝑋23 0.000787*** 𝑋25 0.000409***
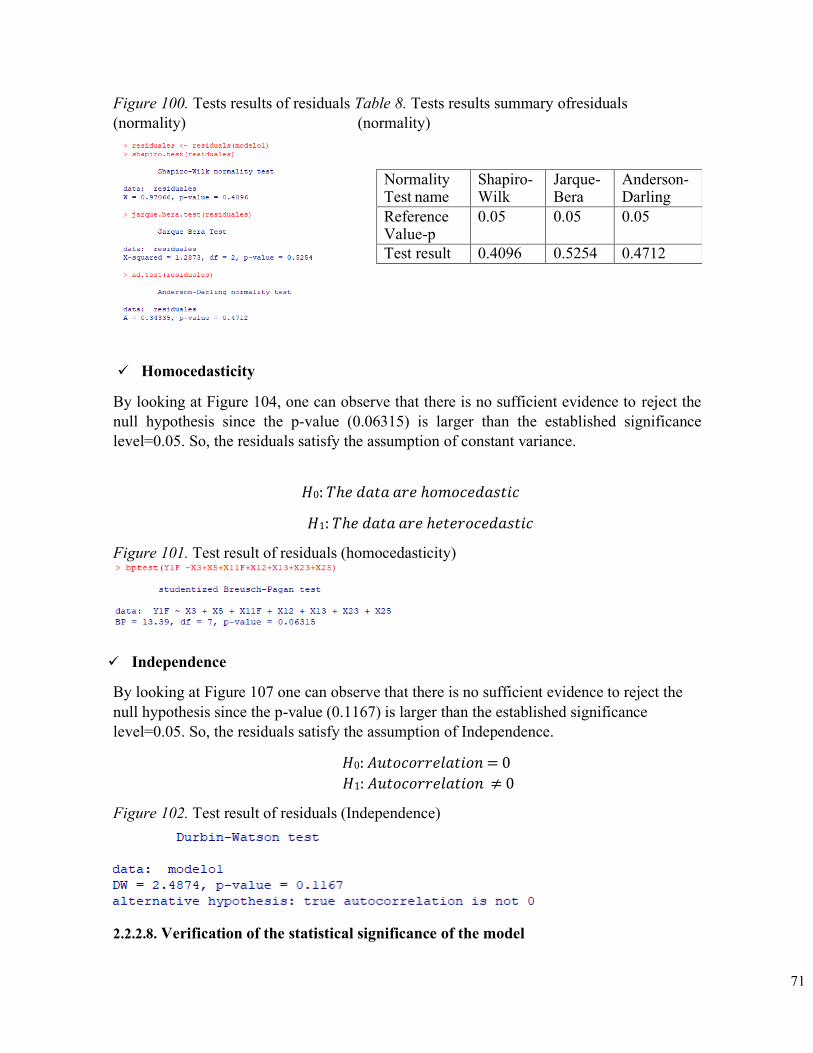
71
Figure 100. Tests results of residuals Table 8. Tests results summary ofresiduals (normality) (normality)
✓ Homocedasticity
By looking at Figure 104, one can observe that there is no sufficient evidence to reject the null hypothesis since the p-value (0.06315) is larger than the established significance level=0.05. So, the residuals satisfy the assumption of constant variance.
𝐻0: 𝑇ℎ𝑒 𝑑𝑎𝑡𝑎 𝑎𝑟𝑒 ℎ𝑜𝑚𝑜𝑐𝑒𝑑𝑎𝑠𝑡𝑖𝑐
𝐻1: 𝑇ℎ𝑒 𝑑𝑎𝑡𝑎 𝑎𝑟𝑒 ℎ𝑒𝑡𝑒𝑟𝑜𝑐𝑒𝑑𝑎𝑠𝑡𝑖𝑐
Figure 101. Test result of residuals (homocedasticity)
✓ Independence
By looking at Figure 107 one can observe that there is no sufficient evidence to reject the null hypothesis since the p-value (0.1167) is larger than the established significance level=0.05. So, the residuals satisfy the assumption of Independence.
𝐻0: 𝐴𝑢𝑡𝑜𝑐𝑜𝑟𝑟𝑒𝑙𝑎𝑡𝑖𝑜𝑛 = 0 𝐻1: 𝐴𝑢𝑡𝑜𝑐𝑜𝑟𝑟𝑒𝑙𝑎𝑡𝑖𝑜𝑛 ≠ 0
Figure 102. Test result of residuals (Independence)
2.2.2.8. Verification of the statistical significance of the model
Normality Test name
Shapiro- Wilk
Jarque- Bera
Anderson- Darling
Reference Value-p
0.05 0.05 0.05
Test result 0.4096 0.5254 0.4712
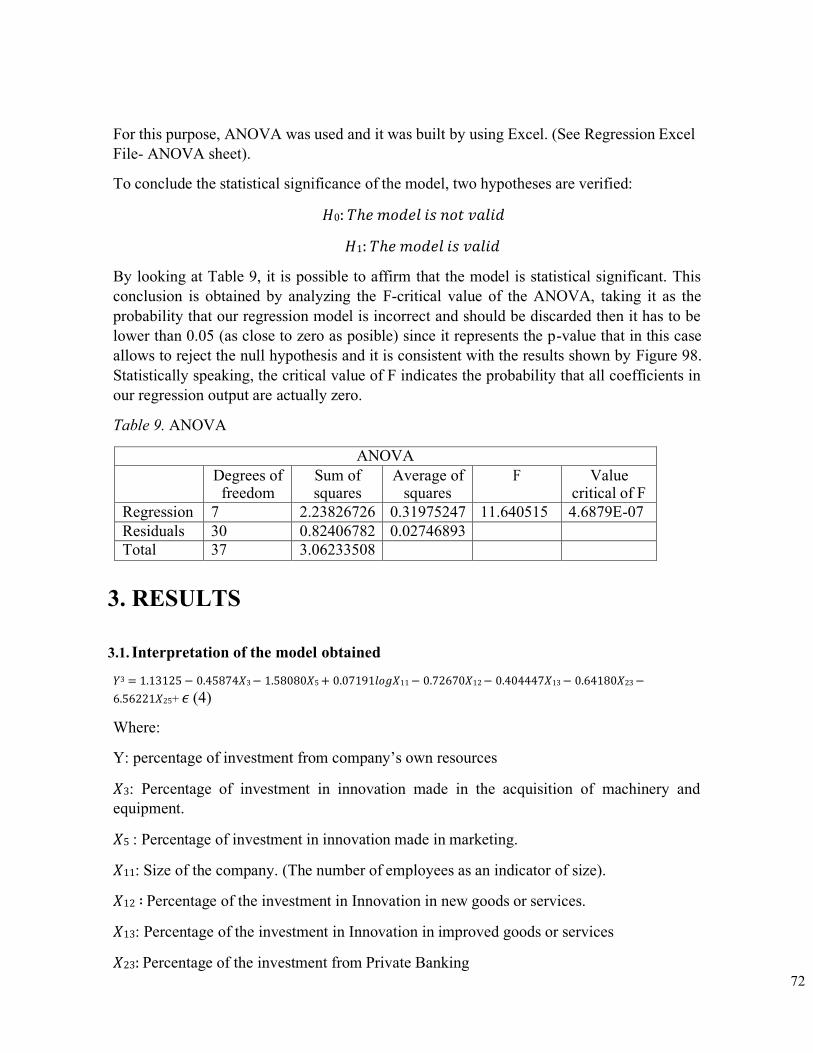
72
For this purpose, ANOVA was used and it was built by using Excel. (See Regression Excel File- ANOVA sheet).
To conclude the statistical significance of the model, two hypotheses are verified:
𝐻0: 𝑇ℎ𝑒 𝑚𝑜𝑑𝑒𝑙 𝑖𝑠 𝑛𝑜𝑡 𝑣𝑎𝑙𝑖𝑑
𝐻1: 𝑇ℎ𝑒 𝑚𝑜𝑑𝑒𝑙 𝑖𝑠 𝑣𝑎𝑙𝑖𝑑
By looking at Table 9, it is possible to affirm that the model is statistical significant. This conclusion is obtained by analyzing the F-critical value of the ANOVA, taking it as the probability that our regression model is incorrect and should be discarded then it has to be lower than 0.05 (as close to zero as posible) since it represents the p-value that in this case allows to reject the null hypothesis and it is consistent with the results shown by Figure 98. Statistically speaking, the critical value of F indicates the probability that all coefficients in our regression output are actually zero.
Table 9. ANOVA
ANOVA Degrees of
freedom Sum of squares
Average of squares
F Value critical of F
Regression 7 2.23826726 0.31975247 11.640515 4.6879E-07 Residuals 30 0.82406782 0.02746893 Total 37 3.06233508
3. RESULTS
3.1. Interpretation of the model obtained
𝑌3 = 1.13125 − 0.45874𝑋3 − 1.58080𝑋5 + 0.07191𝑙𝑜𝑔𝑋11 − 0.72670𝑋12 − 0.404447𝑋13 − 0.64180𝑋23 −
6.56221𝑋25+ 𝜖 (4)
Where:
Y: percentage of investment from company’s own resources
𝑋3: Percentage of investment in innovation made in the acquisition of machinery and equipment.
𝑋5 : Percentage of investment in innovation made in marketing.
𝑋11: Size of the company. (The number of employees as an indicator of size).
𝑋12 ∶ Percentage of the investment in Innovation in new goods or services.
𝑋13: Percentage of the investment in Innovation in improved goods or services
𝑋23: Percentage of the investment from Private Banking
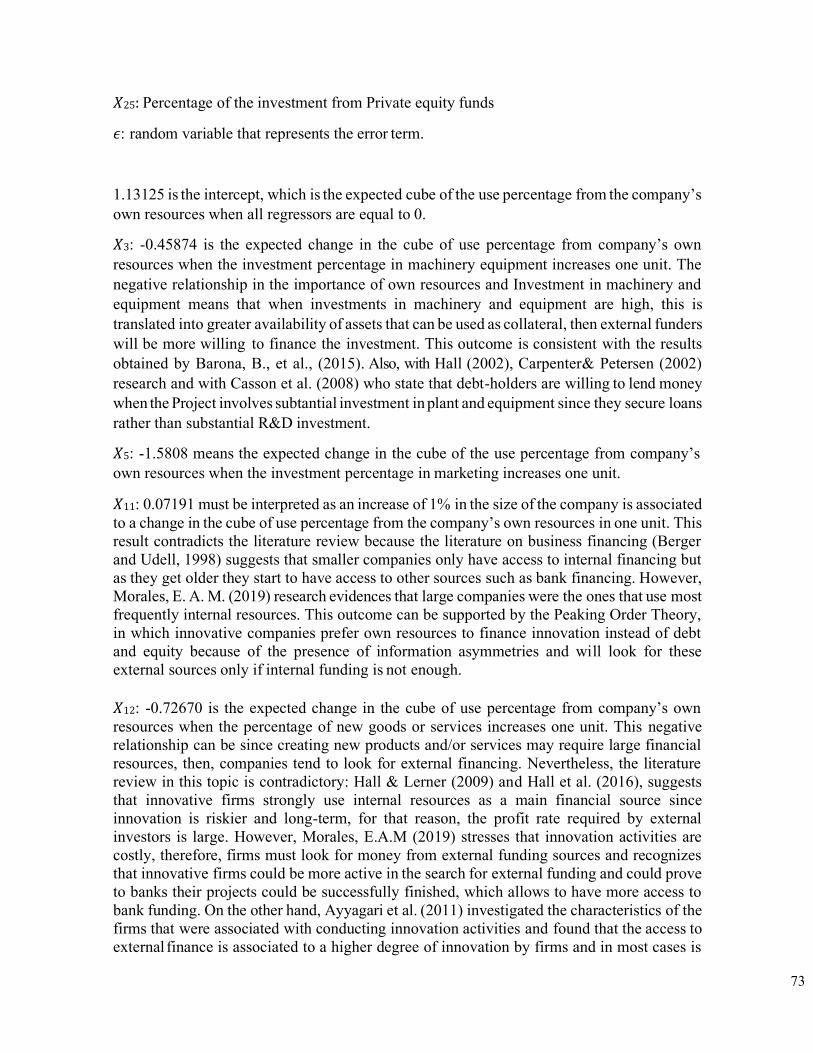
73
𝑋25: Percentage of the investment from Private equity funds
𝜖: random variable that represents the error term.
1.13125 is the intercept, which is the expected cube of the use percentage from the company’s own resources when all regressors are equal to 0.
𝑋3: -0.45874 is the expected change in the cube of use percentage from company’s own resources when the investment percentage in machinery equipment increases one unit. The negative relationship in the importance of own resources and Investment in machinery and equipment means that when investments in machinery and equipment are high, this is translated into greater availability of assets that can be used as collateral, then external funders will be more willing to finance the investment. This outcome is consistent with the results obtained by Barona, B., et al., (2015). Also, with Hall (2002), Carpenter & Petersen (2002) research and with Casson et al. (2008) who state that debt-holders are willing to lend money when the Project involves subtantial investment in plant and equipment since they secure loans rather than substantial R&D investment.
𝑋5: -1.5808 means the expected change in the cube of the use percentage from company’s own resources when the investment percentage in marketing increases one unit.
𝑋11: 0.07191 must be interpreted as an increase of 1% in the size of the company is associated to a change in the cube of use percentage from the company’s own resources in one unit. This result contradicts the literature review because the literature on business financing (Berger and Udell, 1998) suggests that smaller companies only have access to internal financing but as they get older they start to have access to other sources such as bank financing. However, Morales, E. A. M. (2019) research evidences that large companies were the ones that use most frequently internal resources. This outcome can be supported by the Peaking Order Theory, in which innovative companies prefer own resources to finance innovation instead of debt and equity because of the presence of information asymmetries and will look for these external sources only if internal funding is not enough.
𝑋12: -0.72670 is the expected change in the cube of use percentage from company’s own resources when the percentage of new goods or services increases one unit. This negative relationship can be since creating new products and/or services may require large financial resources, then, companies tend to look for external financing. Nevertheless, the literature review in this topic is contradictory: Hall & Lerner (2009) and Hall et al. (2016), suggests that innovative firms strongly use internal resources as a main financial source since innovation is riskier and long-term, for that reason, the profit rate required by external investors is large. However, Morales, E.A.M (2019) stresses that innovation activities are costly, therefore, firms must look for money from external funding sources and recognizes that innovative firms could be more active in the search for external funding and could prove to banks their projects could be successfully finished, which allows to have more access to bank funding. On the other hand, Ayyagari et al. (2011) investigated the characteristics of the firms that were associated with conducting innovation activities and found that the access to external finance is associated to a higher degree of innovation by firms and in most cases is
74
bank funding although liquid equity markets may provide the resources for radical product innovations, but firms use first debt since it involves giving up less control rights than equity and when they have no choice, opt for equity. Finally, statistical analyzes in Zuluaga et al. (2015) show that innovative firms seem to make more intensive use of the source bank loans than non-innovative firms.
𝑋13: -0.404447 is the expected change in the cube of use percentage from company’s own resources when the percentage of improved goods or services increases one unit. This negative relationship can be since improving products and/or services may require large financial resources, then, companies tend to look for external financing. This outcome is consistent with Casson et al. (2008) research, which associated the continuous improvements with bank’s lending. Also, it can be supported by Morales, E.A.M (2019) and Zuluaga et al. (2015) as in the case of new goods or services. And, finally this negative relationship is another evidence of Ayyagari et al. (2011) research, in which the conclusion was that bank financing (domestic and foreign private banking) was positively associated with the improvement of existing products lines, the opening of a new plant and the signing of joint ventures with foreign partners.
𝑋23: -0.64180 is the expected change in the cube of use percentage from company’s own resources when the percentage of investment from private banking resources increases one unit. As expected, the use of own resources and the investment from private banking resources exhibit a negative relationship. Mathematically, the negative relationship may be due to the fact that the variables are expressed in terms of percentages: if the company acquires debt, the financing coming from its own resources decreases. This is consistent with Barona et. Al (2015) research, which found that the relationship between the own resources variable and bank financing turns out to be negative, since companies, in some stages of their life, as their available internal resources increase, could decide to reduce the debt in their financial structure to finance their innovations, considering that equity resources are more suitable as a source of financing than those from bank debt, which are characterized by high interest rates, so the decision is to de-leverage once internal resources have been accumulated in sufficient amounts.
Also, Morales E.A.M (2019) stresses “firms do not use an exclusive funding source, but a combination of them, so a specific company can use internal funding, banks, and government funding at the same time, and all the possible combinations of those sources but the amounts of one decrease those of the other source. In the same sense, a firm’s decision to use one of the funding sources can be affected by the likelihood they have access to another funding source.”
𝑋25: -6.56221 is the expected change in the cube of use percentage from company’s own resources when the percentage of investment from private equity funds increases one unit.
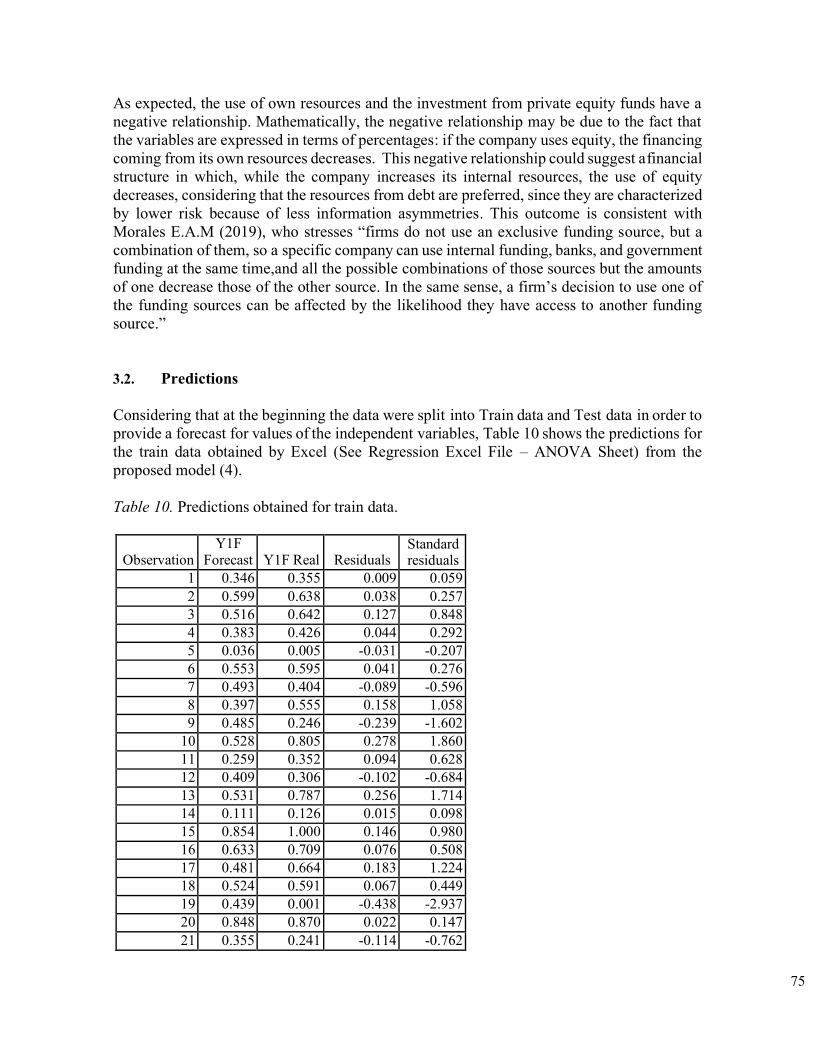
75
As expected, the use of own resources and the investment from private equity funds have a negative relationship. Mathematically, the negative relationship may be due to the fact that the variables are expressed in terms of percentages: if the company uses equity, the financing coming from its own resources decreases. This negative relationship could suggest a financial structure in which, while the company increases its internal resources, the use of equity decreases, considering that the resources from debt are preferred, since they are characterized by lower risk because of less information asymmetries. This outcome is consistent with Morales E.A.M (2019), who stresses “firms do not use an exclusive funding source, but a combination of them, so a specific company can use internal funding, banks, and government funding at the same time, and all the possible combinations of those sources but the amounts of one decrease those of the other source. In the same sense, a firm’s decision to use one of
the funding sources can be affected by the likelihood they have access to another funding source.”
3.2. Predictions
Considering that at the beginning the data were split into Train data and Test data in order to provide a forecast for values of the independent variables, Table 10 shows the predictions for the train data obtained by Excel (See Regression Excel File – ANOVA Sheet) from the proposed model (4).
Table 10. Predictions obtained for train data.
Observation
Y1F Forecast
Y1F Real
Residuals
Standard residuals
1 0.346 0.355 0.009 0.059 2 0.599 0.638 0.038 0.257 3 0.516 0.642 0.127 0.848 4 0.383 0.426 0.044 0.292 5 0.036 0.005 -0.031 -0.207 6 0.553 0.595 0.041 0.276 7 0.493 0.404 -0.089 -0.596 8 0.397 0.555 0.158 1.058 9 0.485 0.246 -0.239 -1.602
10 0.528 0.805 0.278 1.860 11 0.259 0.352 0.094 0.628 12 0.409 0.306 -0.102 -0.684 13 0.531 0.787 0.256 1.714 14 0.111 0.126 0.015 0.098 15 0.854 1.000 0.146 0.980 16 0.633 0.709 0.076 0.508 17 0.481 0.664 0.183 1.224 18 0.524 0.591 0.067 0.449 19 0.439 0.001 -0.438 -2.937 20 0.848 0.870 0.022 0.147 21 0.355 0.241 -0.114 -0.762
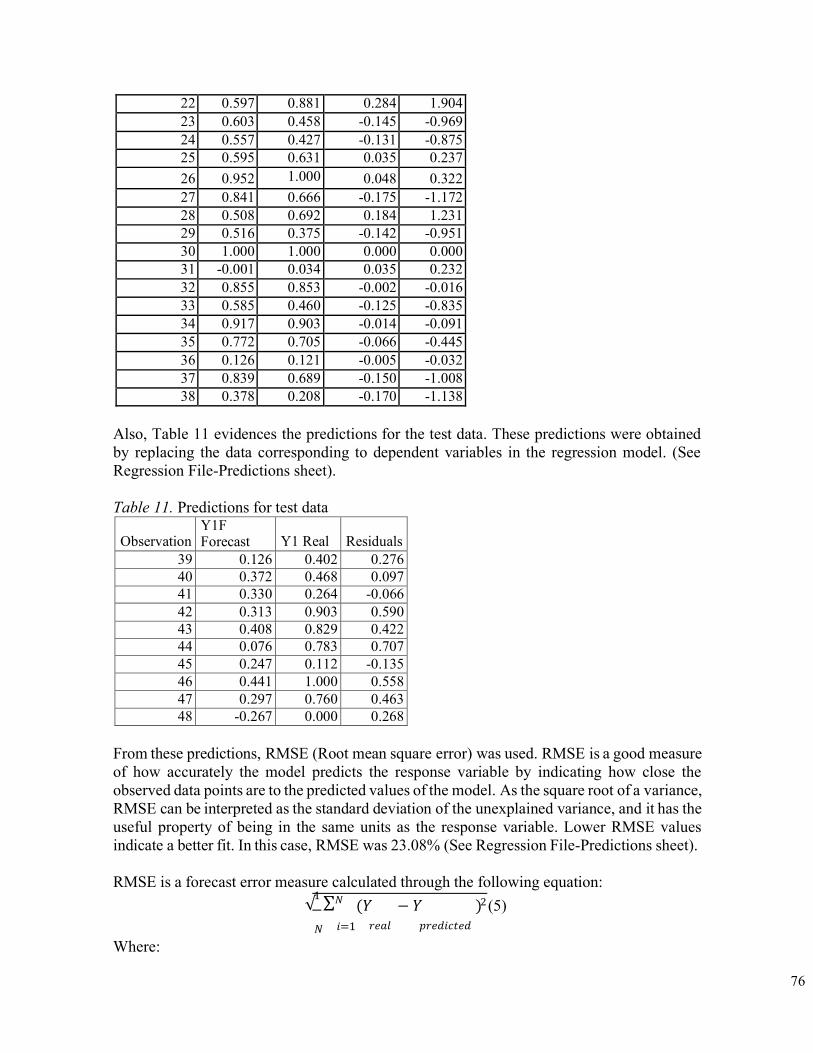
76
1 ∑𝑁 2
22 0.597 0.881 0.284 1.904 23 0.603 0.458 -0.145 -0.969 24 0.557 0.427 -0.131 -0.875 25 0.595 0.631 0.035 0.237 26 0.952 1.000 0.048 0.322 27 0.841 0.666 -0.175 -1.172 28 0.508 0.692 0.184 1.231 29 0.516 0.375 -0.142 -0.951 30 1.000 1.000 0.000 0.000 31 -0.001 0.034 0.035 0.232 32 0.855 0.853 -0.002 -0.016 33 0.585 0.460 -0.125 -0.835 34 0.917 0.903 -0.014 -0.091 35 0.772 0.705 -0.066 -0.445 36 0.126 0.121 -0.005 -0.032 37 0.839 0.689 -0.150 -1.008 38 0.378 0.208 -0.170 -1.138
Also, Table 11 evidences the predictions for the test data. These predictions were obtained by replacing the data corresponding to dependent variables in the regression model. (See Regression File-Predictions sheet).
Table 11. Predictions for test data Observation
Y1F Forecast
Y1 Real
Residuals
39 0.126 0.402 0.276 40 0.372 0.468 0.097 41 0.330 0.264 -0.066 42 0.313 0.903 0.590 43 0.408 0.829 0.422 44 0.076 0.783 0.707 45 0.247 0.112 -0.135 46 0.441 1.000 0.558 47 0.297 0.760 0.463 48 -0.267 0.000 0.268
From these predictions, RMSE (Root mean square error) was used. RMSE is a good measure of how accurately the model predicts the response variable by indicating how close the observed data points are to the predicted values of the model. As the square root of a variance, RMSE can be interpreted as the standard deviation of the unexplained variance, and it has the useful property of being in the same units as the response variable. Lower RMSE values indicate a better fit. In this case, RMSE was 23.08% (See Regression File-Predictions sheet).
RMSE is a forecast error measure calculated through the following equation:
√ (𝑌 − 𝑌 ) (5) 𝑁 𝑖=1 𝑟𝑒𝑎𝑙 𝑝𝑟𝑒𝑑𝑖𝑐𝑡𝑒𝑑
Where:
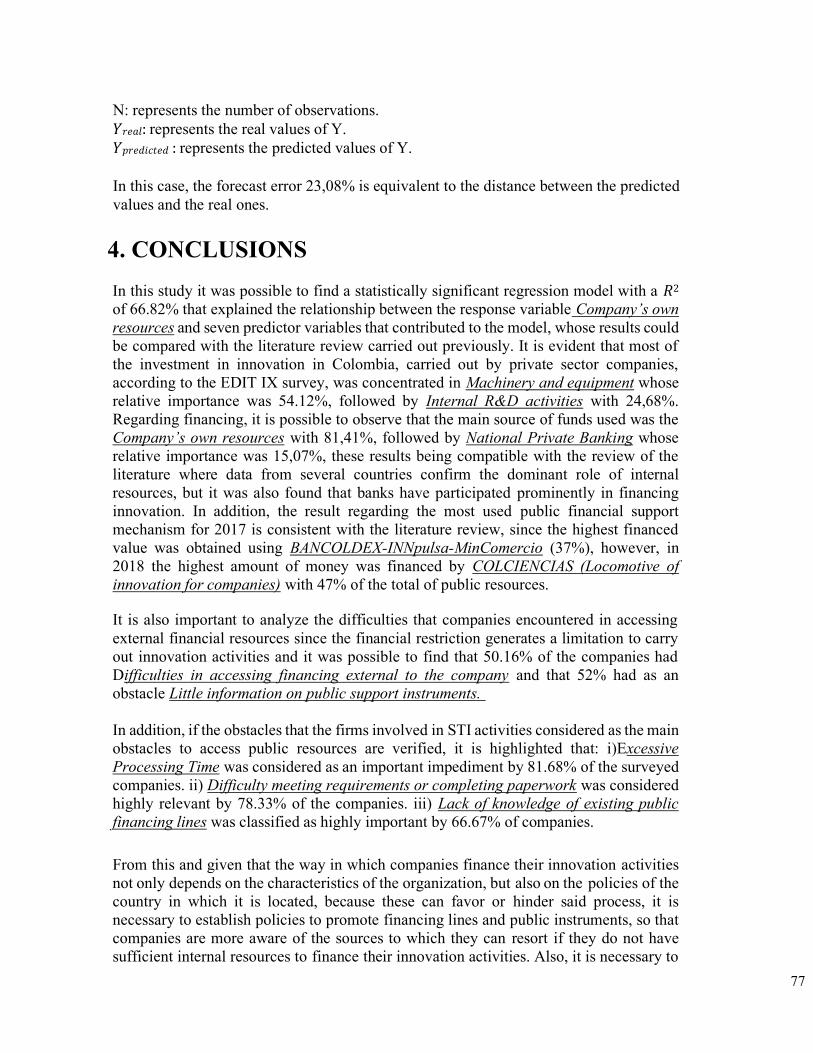
77
N: represents the number of observations. 𝑌𝑟𝑒𝑎𝑙: represents the real values of Y. 𝑌𝑝𝑟𝑒𝑑𝑖𝑐𝑡𝑒𝑑 : represents the predicted values of Y.
In this case, the forecast error 23,08% is equivalent to the distance between the predicted values and the real ones.
4. CONCLUSIONS In this study it was possible to find a statistically significant regression model with a 𝑅2
of 66.82% that explained the relationship between the response variable Company’s own resources and seven predictor variables that contributed to the model, whose results could be compared with the literature review carried out previously. It is evident that most of the investment in innovation in Colombia, carried out by private sector companies, according to the EDIT IX survey, was concentrated in Machinery and equipment whose relative importance was 54.12%, followed by Internal R&D activities with 24,68%. Regarding financing, it is possible to observe that the main source of funds used was the Company’s own resources with 81,41%, followed by National Private Banking whose relative importance was 15,07%, these results being compatible with the review of the literature where data from several countries confirm the dominant role of internal resources, but it was also found that banks have participated prominently in financing innovation. In addition, the result regarding the most used public financial support mechanism for 2017 is consistent with the literature review, since the highest financed value was obtained using BANCOLDEX-INNpulsa-MinComercio (37%), however, in 2018 the highest amount of money was financed by COLCIENCIAS (Locomotive of innovation for companies) with 47% of the total of public resources.
It is also important to analyze the difficulties that companies encountered in accessing external financial resources since the financial restriction generates a limitation to carry out innovation activities and it was possible to find that 50.16% of the companies had Difficulties in accessing financing external to the company and that 52% had as an obstacle Little information on public support instruments.
In addition, if the obstacles that the firms involved in STI activities considered as the main obstacles to access public resources are verified, it is highlighted that: i)Excessive Processing Time was considered as an important impediment by 81.68% of the surveyed companies. ii) Difficulty meeting requirements or completing paperwork was considered highly relevant by 78.33% of the companies. iii) Lack of knowledge of existing public financing lines was classified as highly important by 66.67% of companies.
From this and given that the way in which companies finance their innovation activities not only depends on the characteristics of the organization, but also on the policies of the country in which it is located, because these can favor or hinder said process, it is necessary to establish policies to promote financing lines and public instruments, so that companies are more aware of the sources to which they can resort if they do not have sufficient internal resources to finance their innovation activities. Also, it is necessary to
78
offer exclusive credits for innovation, with qualified personnel to evaluate and select the projects to be financed, since in general, the requirements and processing times are similar to loans required for projects of any kind, in the which mechanisms are not developed to value intangibles associated with innovation and its quality.
Thus, the government, must also create and maintain links between public entities, the University and the industry, prioritizing projects of collaboration through incentives for professors who generate developments in science, technology and innovation, in addition to guaranteeing an education that stimulates innovation and entrepreneurship, since the idea is to develop human talent that is involved in these projects. All the above, placing the enterprises at the center of the Colombian innovation system, since they convert knowledge into new goods, which is why Colombia must continue to implement tax incentives in order to encourage investment in innovation by companies and thus improve their competitiveness.
On the other hand, given the importance of the economy in which the firm operates for the innovative project success, the government must develop a public policy in a macro environment in order to promote the exchange of information of the company for investors, thus allowing to generate trust between the actors, and in order to guarantee fair conditions of competition in the market, as well as high appropriability of innovations and to allow companies to get loans from the bank more easily. Finally, according to the results of the review of the literature about the Colombian capital market problems, it is necessary to review access to capital for companies and develop policies that aim to correct information asymmetries between actors, and to generate incentives to use this funding source more frequently.
5. RECOMMENDATIONS ✓ It is recommended to include some variables of interest in the databases related
to the age of the companies to analyze the change in the sources of financing for innovation and, thus, the stage of the life cycle in which the company is, since it could allow to analyze the difficulties that younger companies have to meet the requirements to accessing external financing sources.
✓ This analysis is based on data of a micro nature, which is why it is
recommended to carry out studies that involve macroeconomic aspects, (the economic and legal environment) that allow evidence of the impact of the market in which companies operate and its effects on decisions related to innovation.
✓ The significant negative relationships between the investment percentage of
Own Resources and Private Banking and between Own resources and Private Equity Funds raises a research question not examined here: the possible
79
Pecking Order Theory between the use of these three types of financing sources, in which the literature review is still contradictory, especially for developing countries.
✓ To promote and create an adequate context for innovation, proper public
policies are necessary to increase public resources and their allocation. Therefore, the Colombian State should take a more proactive stance in improving the opportunities/sources to finance innovation by considering incentives that facilitate the development of the capital market in Colombia, by introducing policies that promote simples procedures to access external sources of financing, and by improving fiscal incentives so that firms increase the internal resources used to finance innovation.
✓ It is important that when developing policies focused on the use of public resources and their allocation in innovation activities, Colombian State does not take the example of developed countries, since how companies finance their innovations depends not only on themselves but also on the market that characterizes the country where the firm operates.
80
REFERENCES Arbeláez, M. A. y Parra, M. (2011). Innovation, R&D investment and productivity in Colombian Firms (Working Paper IDB-WP-251). Washington: Banco Interamericano de Desarrollo.
Arrow, K. J. (1972). Economic welfare and the allocation of resources for invention. In Readings in industrial economics (pp. 219-236). Palgrave, London.
Ayyagari, M., Demirgüc-Kunt, A. y Maksimovic, V. (2011). Firm innovation in emerging markets: The role of finance, governance and competition. Journal of Financial and Quantitative Analysis, 46, 1545-1580.
Barona-Zuluaga, B., & Rivera-Godoy, J. A. (2012). Análisis empírico de la financiación de nuevas empresas en Colombia. Innovar, 22(43).
Barona, B., Rivera, J., Aguilera, I. y Garizado, P. (2014). La financiación de la innovación de las empresas del sector manufacturero en Colombia. Un análisis de los resultados de la EDIT IV. Documento no publicado. Cali: Universidad del Valle
Barona-Zuluaga, B., Rivera-Godoy, J. A., Aguilera-Cifuentes, C. I., & Garizado-Román, P. A. (2015). Financiación de la innovación en Colombia. Entramado, 11(1), 80-93.
Barona-Zuluaga, B., & Rivera-Godoy, J. A. (2017). Análisis comparativo de la inversión- financiación de la innovación entre sectores manufacturero y de servicios en Colombia. Libre Empresa, 14(1), 11-27. Barona-Zuluaga, B., Rivera-Godoy, J. A., & Garizado-Román, P. A. (2017). Inversión y financiación en empresas innovadoras del sector servicios en Colombia. Revista Finanzas y Política Económica, 9(2), 345-372.
Bartoloni, E. (2013). Capital structure and innovation: causality and determinants. Empirica, 40(1), 111-151.
Becerra, A. (2001). Restricciones financieras para la innovación en la industria manufacturera colombiana. Coyuntura Económica, 41, 185-224.
Berger, A., & Udell, G. (1998) The Economics of Small Business Finance: The Roles of Private Equity and Debt Markets in the Financial Growth Cycle. Journal of Banking and Finance, 22, 1-69.
Bolsa de Valores de Colombia (2002). Presentación “Mercado de Valores Colombiano” en el marco del programa MBA Executive de la Universidad de los Andes.
Brereton, R. G. (2019). The use and misuse of p values and related concepts. Chemometrics and Intelligent Laboratory Systems, 195, 103884.
81
Ćalasan, M., Aleem, S. H. A., & Zobaa, A. F. (2020). On the root mean square error (RMSE) calculation for parameter estimation of photovoltaic models: A novel exact analytical solution based on Lambert W function. Energy Conversion and Management, 210, 112716. Campbell, D., & Kelly, J. (1994). Trade-off Theory. The American Economic Review, 84(2), 422- 426.
Carpenter,R., & Petersen, B. (2002). Capital market imperfections, high-tech investment, and new equity financing. The Economic Journal, 112, F54-F72.
Casson, P. D., Martin, R., & Nisar, T. M. (2008). The financing decisions of innovative firms. Research in international Business and Finance, 22(2), 208-221.
Consejo Nacional de Política Económica y Social - CONPES (2016). Documento CONPES. Política de Ciencia, Tecnología e Innovación, 2016-2025. Versión para discusión: 22/06/2016. República de Colombia: Departamento Nacional de Planeación.
Consejo Privado de Competitividad (CPC), (2007). Informe nacional de competitividad 2007. Bogotá.
Daoud, J. I. (2017, December). Multicollinearity and regression analysis. In Journal of Physics: Conference Series (Vol. 949, No. 1, p. 012009). IOP Publishing.
Departamento Administrativo Nacional de Estadística – DANE (2017). Documento Metodológico Encuesta de Desarrollo e Innovación Tecnológica en la Industria Manufacturera EDIT. Bogotá.
Departamento Administrativo Nacional de Estadística (2017-2018) - DANE. Encuesta de desarrollo e innovación tecnológica en la industria manufacturera.
De Faria, A. M., Junior, M. D. M. O., & Borini, F. M. (2019). Pubic funding for innovation: The importance of individual resources of the entrepreneur and the relational resources of the firm. Technology in Society, 59, 101159.
Fayomi, O. S. I., Okokpujie, I. P., & Fayomi, G. U. (2019). An Innovation Concept towards Bridging the Gaps Between Teaching and Research. Procedia Manufacturing, 35, 775-781.
García, D., Barona, B., & Madrid, A. (2013). Financiación de la Innovación en las Mipymes Iberoamericanas. Estudios Gerenciales, 29, (126), 12-16.
Giudici, G., & Paleari, S. (2000). The Provision of Finance to Innovation: A Survey Conducted among Italian Technology-based Small Firms. Small BusinessEconomics, 14(1), 37-53.
Gómez, H. J., & Mitchell, D. (2014). Innovación y emprendimiento en Colombia-Balance, perspectivas y recomendaciones de política: 2014-2018.
Hall, B. (2002) The Financing of Research and Development. Oxford Review of Economic Policy, 18(1), 35-51.
82
Hall, B., & Lerner, J. (2009). The financing of R&D and innovation. Handbook of the Economics of Innovation, 1(1 C), 609-639.
Hall, B. H., Moncada-Paternò-Castello, P., Montresor, S., & Vezzani, A. (2016, abril 2). Financing constraints, R&D investments and innovative performances: new empirical evidence at the firm level for Europe. Economics of Innovation and New Technology, 25(3), 183-196.
Ingdal, M., Johnsen, R., & Harrington, D. A. (2019). The Akaike information criterion in weighted regression of immittance data. Electrochimica Acta, 317, 648-653.
Langebaek, A., & Vásquez, D. (2007). Determinantes de la actividad innovadora en la industria manufacturera colombiana. Borradores de Economía, 433, 1-35.
López, P. A., Ortega, C. V., & Cantó, C. F. (1986). Estudio econométrico sobre el mercado de la tierra en las provincias de Sevilla y Córdoba. Agricultura y sociedad, (41), 73-137.
Manigart, S., & Struyf, C. (1997). Financing High Technology Startups in Belgium: An Explorative Study. Small Business Economics, 9(2), 125-135.
Ministerio de Hacienda, Banco Mundial y Fedesarrollo, (1996). Misión de Estudios del Mercado de Capitales.
Moncho, J. (2015). Capítulo 4 Análisis de la varianza. ANOVA. Estadística aplicada a las ciencias de la salud, Elsevier, 135-156.
Morales, E. A. M. (2019). Show me the money: Pecking order and funding sources for innovative firms in Colombia. Cuadernos de Administración, 32(59).
Myers, S. (1984). The Capital Structure Puzzle. The Journal of Finance, 39(3), 575-592. doi:10.2307/2327916
Neath, A. A., & Cavanaugh, J. E. (2012). The Bayesian information criterion: background, derivation, and applications. Wiley Interdisciplinary Reviews: Computational Statistics, 4(2), 199-203.
OCDE (2005). The Measurement of Scientific and Technological Activities. Proposed guidelines for Collecting and Interpreting Technological innovation data. OSLO MANUAL. European Commission. Eurostat.
Osborne J., & Waters E. (2002). Four Assumptions of Multiple Regressions that Researchers should always Test. Practical Assessment, Research, and Evaluation. Vol.8, No.2, PP1-5. Pineda, L., (2002). “Plan de Acción para el Posicionamiento del Sistema Nacional de Innovación de Colombia como Acelerador de la Investigacion y Desarrollo Tecnológico del Sector productivo”. En el marco del Primer Encuentro Nacional de Innovación. DNP, Colciencias y Alide.
83
Popa, I. L., Preda, G., & Boldea, M. (2010). A theoretical approach of the concept of innovation. Managerial Challenges of the Contemporary Society. Proceedings, 151. Porter, M. E. (1990). The competitive advantage of nations. Competitive Intelligence Review. Rodrigo, J. A. (2016). Ciencia de Datos. Obtenido de https://www.cienciadedatos.net/documentos/25_regresion_lineal_multiple Rousson, V., & Goşoniu, N. F. (2007). An R-square coefficient based on final prediction error. Statistical Methodology, 4(3), 331-340. Salazar Arbeláez, J. C. (2003). La financiación de la innovación empresarial en Colombia (Master's thesis, Maestría en Administración). Schumpeter (2008), Joseph. Capitalism, Socialism and Democracy. Harper Perennial.
Sierra, J., Malaver, F., Vargas, M., Robledo, J., & Malaver, F. (2009). La financiación de la innovación: un análisis a partir de la encuesta de innovación de Bogotá y Cundinamarca. Encuestas, datos y descubrimiento de conocimiento sobre la innovación en Colombia. Sierra, J. (2019). “How financial systems and firm strategy impact the choice of innovation funding”, European Journal of Emerging Markets, Vol. 14 No. 3, pp. 410-435. Spiezia, Vincenzo (2011), “Are ICT Users More Innovative?: an Analysis of ICT-Enabled Innovation in OECD Firms”, OECD Journal: Economic Studies, Vol. 2011/1. The Concise Encyclopedia of Statistics. (2008). Type I Error. Springer, New York, NY. Thiangchanta, S., & Chaichana, C. (2020). The multiple linear regression models of heat load for air-conditioned room. Energy Reports, 6, 972-977.
Ventosa, D. (2012). ¿Qué es la Econometría? Acta Universitaria, (16), 47-51
Wellalage, N. H., & Fernandez, V. (2019). Innovation and SME finance: Evidence from developing countries. International Review of Financial Analysis, 66, 101370.
Zambrano, S. & Acuña, G. (2011). Estructura de capital. Evolución teórica. Revista Criterio Libre, 9 (15), 81-102.
Zambrano Vargas, S. M., & Acuña Corredor, G. A. (2013). Theory of the Pecking Order versus theory of the Trade Off for the company Coservicios SAESP. Apuntes del CENES, 32(56), 205-236. Zuluaga, B. B., Godoy, J. A. R., & Cifuentes, C. I. A. (2015). Análisis de la relación de la innovación empresarial con la financiación en Colombia. Cuadernos de administración.
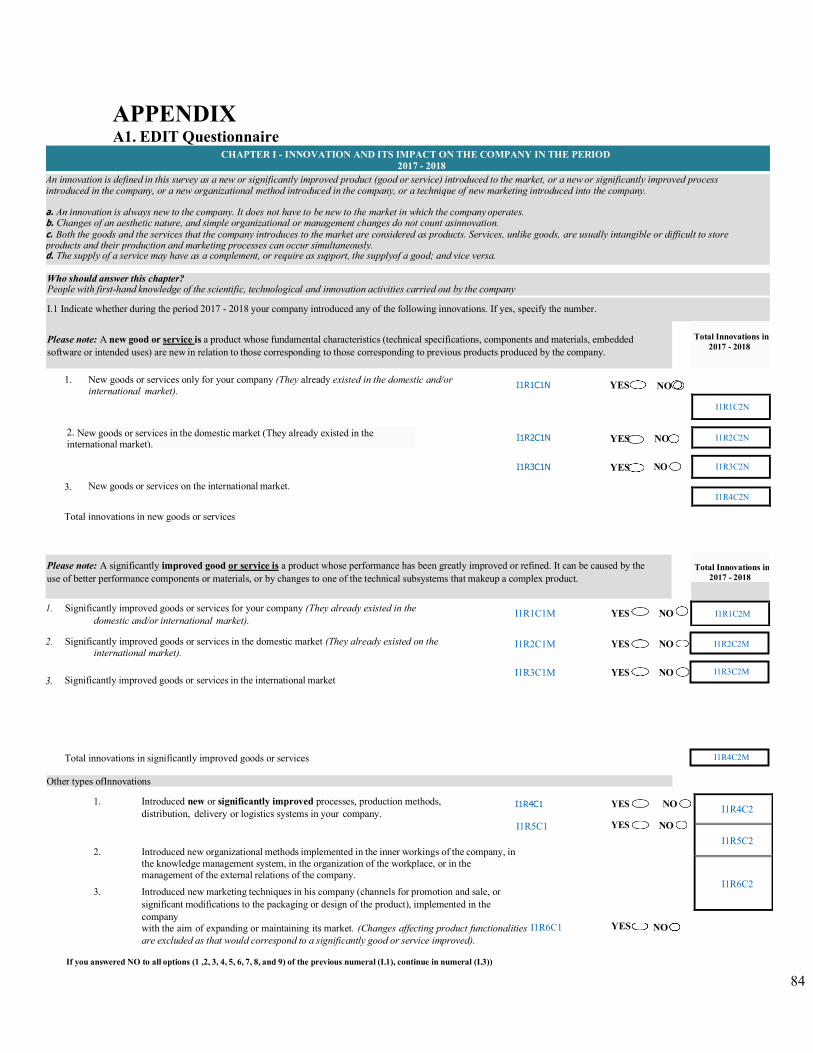
84
APPENDIX A1. EDIT Questionnaire
CHAPTER I - INNOVATION AND ITS IMPACT ON THE COMPANY IN THE PERIOD 2017 - 2018
An innovation is defined in this survey as a new or significantly improved product (good or service) introduced to the market, or a new or significantly improved process introduced in the company, or a new organizational method introduced in the company, or a technique of new marketing introduced into the company. a. An innovation is always new to the company. It does not have to be new to the market in which the company operates. b. Changes of an aesthetic nature, and simple organizational or management changes do not count asinnovation. c. Both the goods and the services that the company introduces to the market are considered as products. Services, unlike goods, are usually intangible or difficult to store products and their production and marketing processes can occur simultaneously. d. The supply of a service may have as a complement, or require as support, the supplyof a good; and vice versa.
Who should answer this chapter? People with first-hand knowledge of the scientific, technological and innovation activities carried out by the company
I.1 Indicate whether during the period 2017 - 2018 your company introduced any of the following innovations. If yes, specify the number.
Please note: A new good or service is a product whose fundamental characteristics (technical specifications, components and materials, embedded software or intended uses) are new in relation to those corresponding to those corresponding to previous products produced by the company.
Total Innovations in
2017 - 2018
1. New goods or services only for your company (They already existed in the domestic and/or international market).
3. New goods or services on the international market.
Total innovations in new goods or services
1. Significantly improved goods or services for your company (They already existed in the
domestic and/or international market).
2. Significantly improved goods or services in the domestic market (They already existed on the international market).
3. Significantly improved goods or services in the international market
I1R1C1M YES NO
I1R2C1M YES NO
I1R3C1M YES NO
Total innovations in significantly improved goods or services
Other types ofInnovations
1. Introduced new or significantly improved processes, production methods, distribution, delivery or logistics systems in your company.
I1R4C1 YES NO
I1R5C1 YES NO
2. Introduced new organizational methods implemented in the inner workings of the company, in the knowledge management system, in the organization of the workplace, or in the management of the external relations of the company.
3. Introduced new marketing techniques in his company (channels for promotion and sale, or significant modifications to the packaging or design of the product), implemented in the company with the aim of expanding or maintaining its market. (Changes affecting product functionalities I1R6C1 YES NO are excluded as that would correspond to a significantly good or service improved).
If you answered NO to all options (1 ,2, 3, 4, 5, 6, 7, 8, and 9) of the previous numeral (I.1), continue in numeral (I.3))
Please note: A significantly improved good or service is a product whose performance has been greatly improved or refined. It can be caused by the use of better performance components or materials, or by changes to one of the technical subsystems that makeup a complex product.
I1R4C2M
I1R3C2M
I1R2C2M
Total Innovations in 2017 - 2018
I1R1C2M
I1R4C2
I1R5C2
I1R6C2
I1R1C1N YES NO
I1R1C2N
I1R2C1N YES NO I1R2C2N
I1R3C1N YES NO I1R3C2N
I1R4C2N
2. New goods or services in the domestic market (They already existed in the international market).
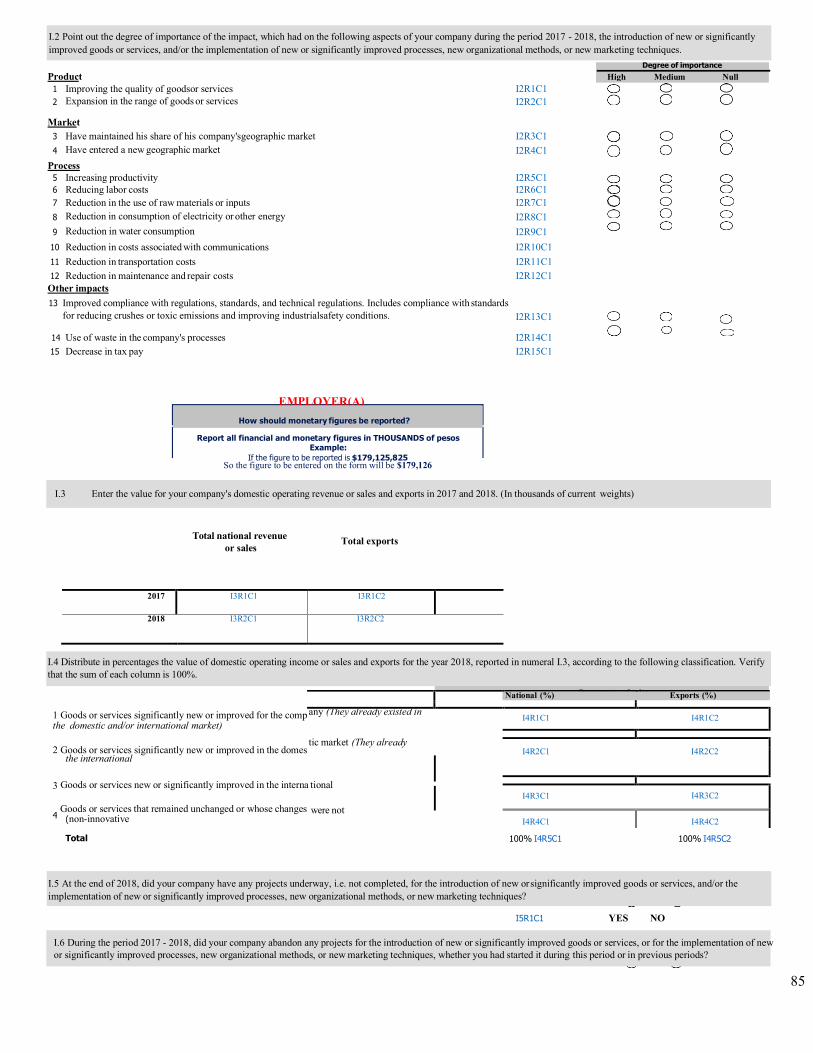
85
Product 1 Improving the quality of goodsor services I2R1C1 2 Expansion in the range of goods or services I2R2C1
Market 3 Have maintained his share of his company'sgeographic market I2R3C1 4 Have entered a new geographic market I2R4C1
Process 5 Increasing productivity I2R5C1 6 Reducing labor costs I2R6C1 7 Reduction in the use of raw materials or inputs I2R7C1 8 Reduction in consumption of electricity or other energy I2R8C1 9 Reduction in water consumption I2R9C1 10 Reduction in costs associated with communications I2R10C1 11 Reduction in transportation costs I2R11C1 12 Reduction in maintenance and repair costs I2R12C1
Other impacts 13 Improved compliance with regulations, standards, and technical regulations. Includes compliance with standards
for reducing crushes or toxic emissions and improving industrialsafety conditions. I2R13C1
14 Use of waste in the company's processes I2R14C1 15 Decrease in tax pay I2R15C1
So the figure to be entered on the form will be $179,126
Total national revenue
or sales
Total exports
2017 I3R1C1 I3R1C2
2018 I3R2C1 I3R2C2
Percentage of sales
1 Goods or services significantly new or improved for the comp the domestic and/or international market)
2 Goods or services significantly new or improved in the domes
the international
3 Goods or services new or significantly improved in the interna
Goods or services that remained unchanged or whose changes (non-innovative
Total
100% I4R5C1
100% I4R5C2
I5R1C1 YES NO
I.2 Point out the degree of importance of the impact, which had on the following aspects of your company during the period 2017 - 2018, the introduction of new or significantly improved goods or services, and/or the implementation of new or significantly improved processes, new organizational methods, or new marketing techniques.
I.5 At the end of 2018, did your company have any projects underway, i.e. not completed, for the introduction of new or significantly improved goods or services, and/or the implementation of new or significantly improved processes, new organizational methods, or new marketing techniques?
Null Medium High Degree of importance
4
National (%) Exports (%)
any (They already existed in tic market (They already
I4R1C1 I4R1C2
I4R2C1 I4R2C2
tional
were not
I4R3C1 I4R3C2
I4R4C1 I4R4C2
EMPLOYER(A)
Report all financial and monetary figures in THOUSANDS of pesos Example:
If the figure to be reported is $179,125,825
How should monetary figures be reported?
I.3 Enter the value for your company's domestic operating revenue or sales and exports in 2017 and 2018. (In thousands of current weights)
I.4 Distribute in percentages the value of domestic operating income or sales and exports for the year 2018, reported in numeral I.3, according to the following classification. Verify that the sum of each column is 100%.
I.6 During the period 2017 - 2018, did your company abandon any projects for the introduction of new or significantly improved goods or services, or for the implementation of new or significantly improved processes, new organizational methods, or new marketing techniques, whether you had started it during this period or in previous periods?
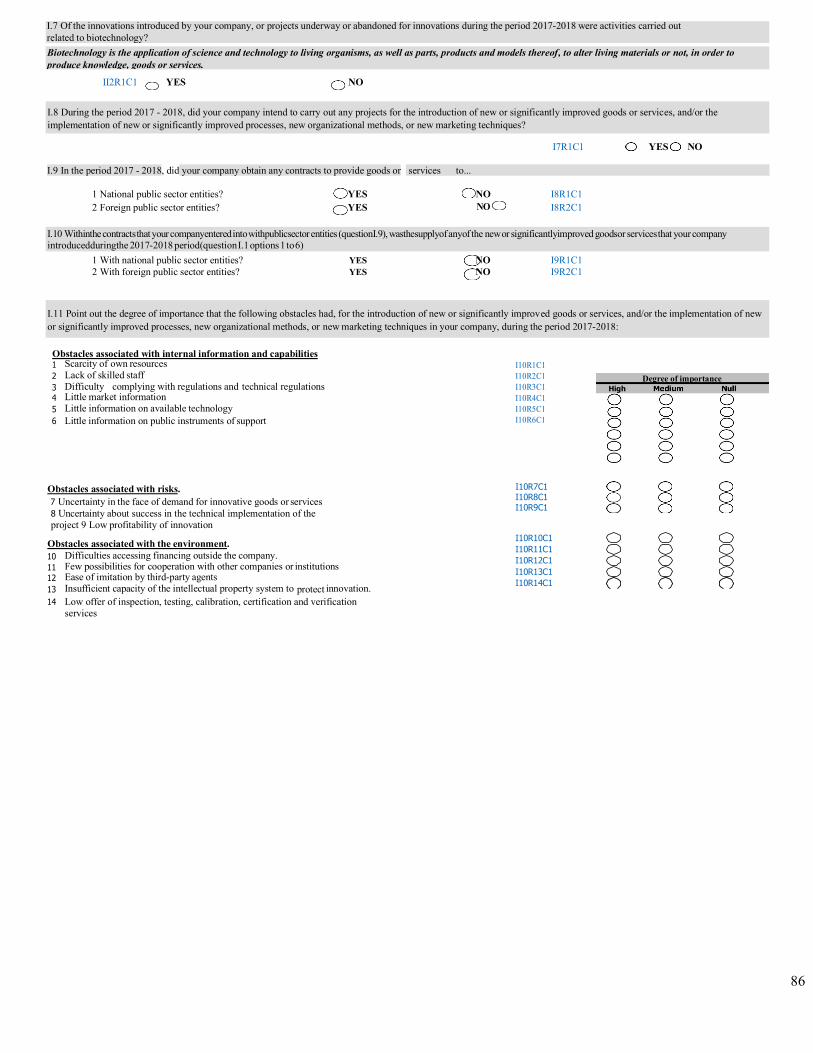
86
II2R1C1 YES NO
I7R1C1 YES NO
I.9 In the period 2017 - 2018, did your company obtain any contracts to provide goods or services to...
1 National public sector entities? YES NO I8R1C1 2 Foreign public sector entities? YES NO I8R2C1
1 With national public sector entities? YES NO I9R1C1 2 With foreign public sector entities? YES NO I9R2C1
Obstacles associated with internal information and capabilities 1 Scarcity of own resources 2 Lack of skilled staff 3 Difficulty complying with regulations and technical regulations 4 Little market information 5 Little information on available technology 6 Little information on public instruments of support
I10R1C1 I10R2C1 I10R3C1 I10R4C1 I10R5C1 I10R6C1
Obstacles associated with risks. 7 Uncertainty in the face of demand for innovative goods or services 8 Uncertainty about success in the technical implementation of the project 9 Low profitability of innovation
Obstacles associated with the environment. 10 Difficulties accessing financing outside the company. 11 Few possibilities for cooperation with other companies or institutions 12 Ease of imitation by third-party agents 13 Insufficient capacity of the intellectual property system to protect innovation. 14 Low offer of inspection, testing, calibration, certification and verification
services
I10R7C1 I10R8C1 I10R9C1
I10R10C1
I10R11C1
I10R12C1
I10R13C1
I10R14C1
I.7 Of the innovations introduced by your company, or projects underway or abandoned for innovations during the period 2017-2018 were activities carried out related to biotechnology? Biotechnology is the application of science and technology to living organisms, as well as parts, products and models thereof, to alter living materials or not, in order to produce knowledge, goods or services.
Degree of importance High
I.8 During the period 2017 - 2018, did your company intend to carry out any projects for the introduction of new or significantly improved goods or services, and/or the implementation of new or significantly improved processes, new organizational methods, or new marketing techniques?
I.10 Withinthe contracts that your companyentered into withpublicsector entities (questionI.9), wasthesupplyof anyof the new or significantlyimproved goodsor services that your company introducedduringthe 2017-2018 period(question I.1 options 1 to 6)
I.11 Point out the degree of importance that the following obstacles had, for the introduction of new or significantly improved goods or services, and/or the implementation of new or significantly improved processes, new organizational methods, or new marketing techniques in your company, during the period 2017-2018:

87
Example: If the figure to be reported is
$179,125,825
How should monetary figures be reported? Report all financial and monetary figures in THOUSANDS of pesos
II1R1C1 II1R1C2
Amount invested 2017 (Thousands of current
pesos)
EMPLOYER
So the figure to be entered on the form will be $179,126
1 Internal R&D Activities
Systematic creation work carried out within the company in order to increase the volume of knowledge and its use to devise and validate new or significantly improved services, goods or processes. (Corresponds only to the investment amounts associated with the research and development stage, prior to the production of new or significantly new services, goods or processes improved).
2 Acquisition of R&D (external)
Acquisition or financing of the same activities as those indicated above (R&D) but carried out by other public or private organizations (includes research bodies).
3 Acquisition of machinery and equipment
Machinery and equipment, specifically purchased for the production or introduction of new or significantly improved services, goods or processes. (Do not include R&D machinery and equipment registered in item 1, nor the machinery purchased simply for the replacement or expansion of installed capacity, i.e. those dedicated to traditional production).
4 Information and telecommunications technologies
Acquisition, generation, outsourcing or leasing of hardware, software and/or services for the handling or processing of information, specifically intended for the production or introduction of new or significantly improved services, goods or processes. (Do not include information and telecommunications technologies for R&D recorded in item 1, or those purchased simply for the replacement or expansion of installed capacity, i.e. those dedicated to traditional production).
5 Marketing
It is the investment in a new marketing method that involves significant changes in the design or packaging of a product - whether new or not - as well as its positioning, promotion or pricing. It includes new market research techniques and launch advertising.
CHAPTER II - INVESTMENT IN SCIENTIFIC, TECHNOLOGICAL AND INNOVATION ACTIVITIES IN 2017 AND 2018
Scientific, Technological and Innovation Activities (ACTI) are all those activities that the company carries out to produce, promote, disseminate and / or apply scientific and technical knowledge; as well as for the development or introduction of new or significantly improved goods or services, new or significantly improved processes, new organizational methods, or new marketing techniques .
Who should answer this chapter? People in the financial area who know the investments and expenses of the company in scientific, technological and innovation activities
II1R2C1 II1R2C2
II1R3C1 II1R3C2
II1R4C1 II1R4C2
II1R5C1 II1R5C2
II.1 Indicate the value invested by your company in 2017 and 2018, in each of the following scientific, technological and innovati on activities, for the introduction of new or significantly improved goods or services, and/or the implementation of new or significantly improved processes, new organizational methods, or new marketing techniques.
Amount invested 2018 (Thousands of current pesos)
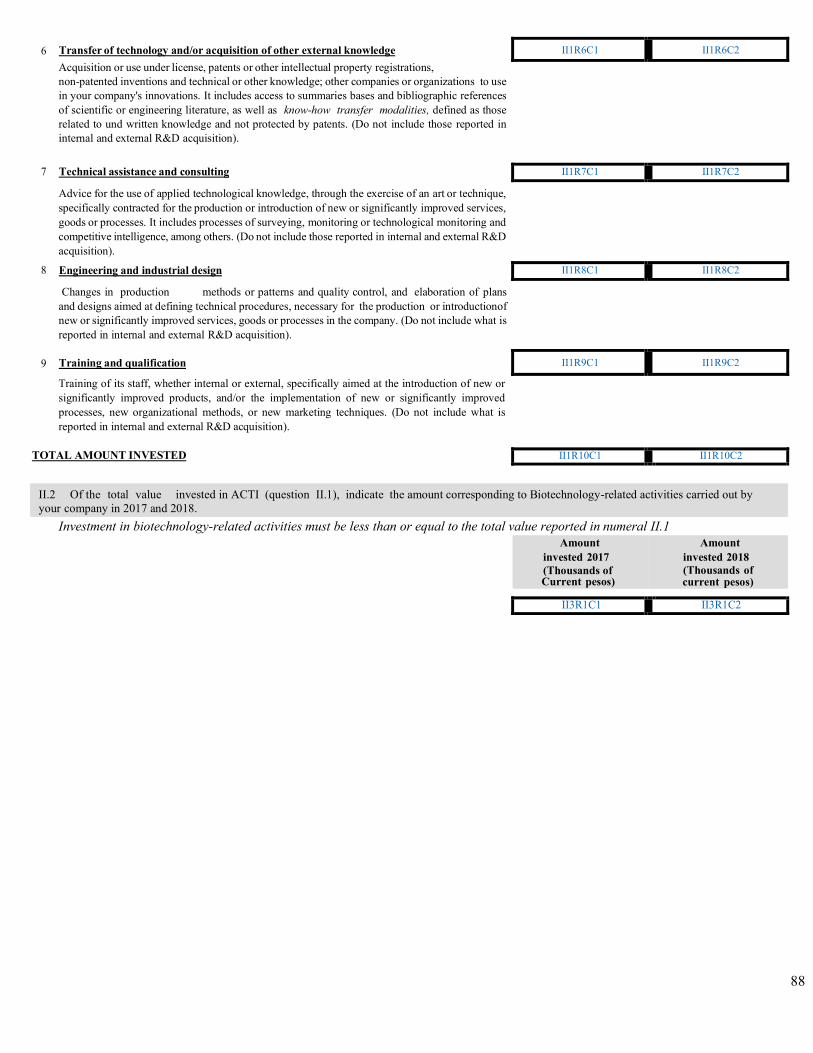
88
6 Transfer of technology and/or acquisition of other external knowledge II1R6C1 II1R6C2 Acquisition or use under license, patents or other intellectual property registrations, non-patented inventions and technical or other knowledge; other companies or organizations to use in your company's innovations. It includes access to summaries bases and bibliographic references of scientific or engineering literature, as well as know-how transfer modalities, defined as those related to und written knowledge and not protected by patents. (Do not include those reported in internal and external R&D acquisition).
7 Technical assistance and consulting II1R7C1 II1R7C2
Advice for the use of applied technological knowledge, through the exercise of an art or technique, specifically contracted for the production or introduction of new or significantly improved services, goods or processes. It includes processes of surveying, monitoring or technological monitoring and competitive intelligence, among others. (Do not include those reported in internal and external R&D acquisition).
8 Engineering and industrial design II1R8C1 II1R8C2
Changes in production methods or patterns and quality control, and elaboration of plans and designs aimed at defining technical procedures, necessary for the production or introduction of new or significantly improved services, goods or processes in the company. (Do not include what is reported in internal and external R&D acquisition).
9 Training and qualification II1R9C1 II1R9C2
Training of its staff, whether internal or external, specifically aimed at the introduction of new or significantly improved products, and/or the implementation of new or significantly improved processes, new organizational methods, or new marketing techniques. (Do not include what is reported in internal and external R&D acquisition).
TOTAL AMOUNT INVESTED II1R10C1 II1R10C2
II.2 Of the total value invested in ACTI (question II.1), indicate the amount corresponding to Biotechnology-related activities carried out by your company in 2017 and 2018.
Investment in biotechnology-related activities must be less than or equal to the total value reported in numeral II.1 Amount
invested 2017 (Thousands of Current pesos)
Amount invested 2018 (Thousands of current pesos)
II3R1C1 II3R1C2
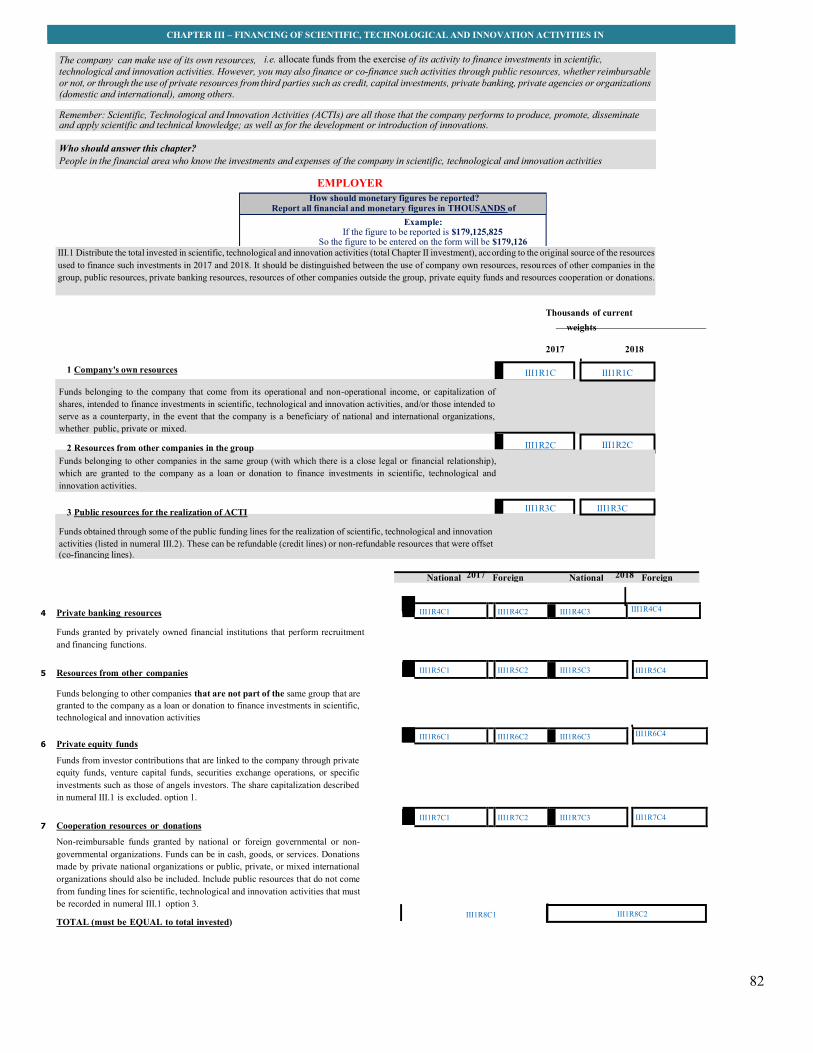
82
Funds belonging to the company that come from its operational and non-operational income, or capitalization of shares, intended to finance investments in scientific, technological and innovation activities, and/or those intended to serve as a counterparty, in the event that the company is a beneficiary of national and international organizations, whether public, private or mixed.
III1R2C III1R2C
III1R1C III1R1C
Funds belonging to other companies in the same group (with which there is a close legal or financial relationship), which are granted to the company as a loan or donation to finance investments in scientific, technological and innovation activities.
Funds obtained through some of the public funding lines for the realization of scientific, technological and innovation activities (listed in numeral III.2). These can be refundable (credit lines) or non-refundable resources that were offset (co-financing lines).
III1R3C III1R3C
National Foreign National Foreign
CHAPTER III – FINANCING OF SCIENTIFIC, TECHNOLOGICAL AND INNOVATION ACTIVITIES IN
The company can make use of its own resources, i.e. allocate funds from the exercise of its activity to finance investments in scientific, technological and innovation activities. However, you may also finance or co-finance such activities through public resources, whether reimbursable or not, or through the use of private resources from third parties such as credit, capital investments, private banking, private agencies or organizations (domestic and international), among others.
Remember: Scientific, Technological and Innovation Activities (ACTIs) are all those that the company performs to produce, promote, disseminate and apply scientific and technical knowledge; as well as for the development or introduction of innovations.
Who should answer this chapter? People in the financial area who know the investments and expenses of the company in scientific, technological and innovation activities
EMPLOYER
Thousands of current weights
2017 2018
1 Company's own resources
2 Resources from other companies in the group
3 Public resources for the realization of ACTI
4 Private banking resources
Funds granted by privately owned financial institutions that perform recruitment and financing functions.
5 Resources from other companies
Funds belonging to other companies that are not part of the same group that are granted to the company as a loan or donation to finance investments in scientific, technological and innovation activities
6 Private equity funds
Funds from investor contributions that are linked to the company through private equity funds, venture capital funds, securities exchange operations, or specific investments such as those of angels investors. The share capitalization described in numeral III.1 is excluded. option 1.
7 Cooperation resources or donations
Non-reimbursable funds granted by national or foreign governmental or non- governmental organizations. Funds can be in cash, goods, or services. Donations made by private national organizations or public, private, or mixed international organizations should also be included. Include public resources that do not come from funding lines for scientific, technological and innovation activities that must be recorded in numeral III.1 option 3.
TOTAL (must be EQUAL to total invested)
2017 2018
III1R4C1 III1R4C2 III1R4C3 III1R4C4
III1R5C1 III1R5C2 III1R5C3 III1R5C4
III1R6C1 III1R6C2 III1R6C3 III1R6C4
III1R7C1 III1R7C2 III1R7C3 III1R7C4
III1R8C1
III.1 Distribute the total invested in scientific, technological and innovation activities (total Chapter II investment), according to the original source of the resources used to finance such investments in 2017 and 2018. It should be distinguished between the use of company own resources, resources of other companies in the group, public resources, private banking resources, resources of other companies outside the group, private equity funds and resources cooperation or donations.
III1R8C2
Example: If the figure to be reported is $179,125,825
So the figure to be entered on the form will be $179,126
How should monetary figures be reported? Report all financial and monetary figures in THOUSANDS of
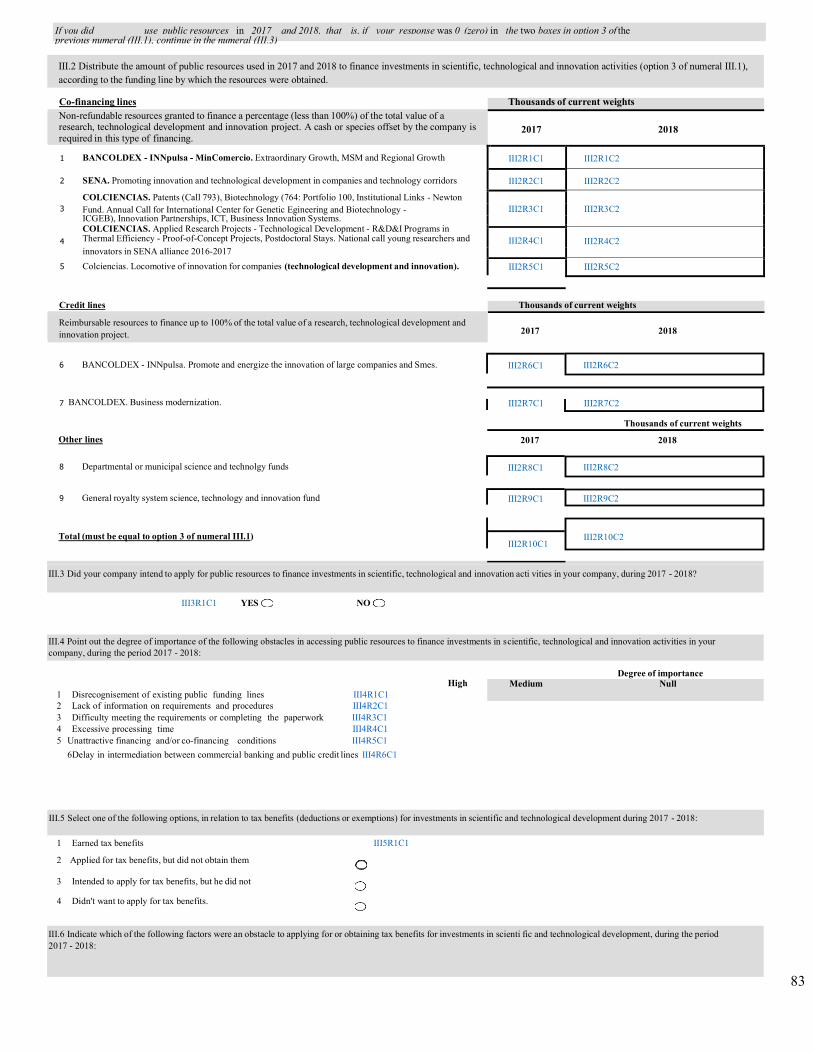
83
Co-financing lines Thousands of current weights Non-refundable resources granted to finance a percentage (less than 100%) of the total value of a research, technological development and innovation project. A cash or species offset by the company is required in this type of financing.
2017
2018
1 BANCOLDEX - INNpulsa - MinComercio. Extraordinary Growth, MSM and Regional Growth III2R1C1 III2R1C2
2 SENA. Promoting innovation and technological development in companies and technology corridors III2R2C1 III2R2C2 COLCIENCIAS. Patents (Call 793), Biotechnology (764: Portfolio 100, Institutional Links - Newton
3 Fund. Annual Call for International Center for Genetic Egineering and Biotechnology - III2R3C1 III2R3C2 ICGEB), Innovation Partnerships, ICT, Business Innovation Systems.
COLCIENCIAS. Applied Research Projects - Technological Development - R&D&I Programs in Thermal Efficiency - Proof-of-Concept Projects, Postdoctoral Stays. National call young researchers and
4 III2R4C1 III2R4C2 innovators in SENA alliance 2016-2017
5 Colciencias. Locomotive of innovation for companies (technological development and innovation). III2R5C1 III2R5C2
Credit lines Thousands of current weights
Reimbursable resources to finance up to 100% of the total value of a research, technological development and innovation project.
2017 2018
6 BANCOLDEX - INNpulsa. Promote and energize the innovation of large companies and Smes.
7 BANCOLDEX. Business modernization.
Thousands of current weights
Other lines 2017 2018
8 Departmental or municipal science and technolgy funds
9 General royalty system science, technology and innovation fund
Total (must be equal to option 3 of numeral III.1)
III3R1C1 YES NO
1 Disrecognisement of existing public funding lines III4R1C1 2 Lack of information on requirements and procedures III4R2C1 3 Difficulty meeting the requirements or completing the paperwork III4R3C1 4 Excessive processing time III4R4C1 5 Unattractive financing and/or co-financing conditions III4R5C1
6Delay in intermediation between commercial banking and public credit lines III4R6C1
High
Degree of importance
1 Earned tax benefits III5R1C1
2 Applied for tax benefits, but did not obtain them
3 Intended to apply for tax benefits, but he did not
4 Didn't want to apply for tax benefits.
III.2 Distribute the amount of public resources used in 2017 and 2018 to finance investments in scientific, technological and innovation activities (option 3 of numeral III.1), according to the funding line by which the resources were obtained.
III.5 Select one of the following options, in relation to tax benefits (deductions or exemptions) for investments in scientific and technological development during 2017 - 2018:
III2R6C1 III2R6C2
III2R8C1 III2R8C2
III2R9C1 III2R9C2
III2R10C1
III2R10C2
III.3 Did your company intend to apply for public resources to finance investments in scientific, technological and innovation acti vities in your company, during 2017 - 2018?
Medium Null
III.4 Point out the degree of importance of the following obstacles in accessing public resources to finance investments in scientific, technological and innovation activities in your company, during the period 2017 - 2018:
III2R7C1 III2R7C2
III.6 Indicate which of the following factors were an obstacle to applying for or obtaining tax benefits for investments in scienti fic and technological development, during the period 2017 - 2018:
If you did use public resources in 2017 and 2018, that is, if your response was 0 (zero) in the two boxes in option 3 of the previous numeral (III.1), continue in the numeral (III.3)

84
Investment rental deduction for science, technology and
Innovation
Income and/or VAT exemptions from investments for science, technology and innovation projects
1 Lack of Information on Benefits and Requirements III6R1C1 III6R1C2
2 Difficulties with the online application tool through the Comprehensive
Project Management System (SIGP) III6R2C1 III6R2C2
3 Difficulty diligence of the electronic form III6R3C1 III6R3C2 4 Excessive and/or complex requirements and formalities III6R4C1 III6R4C2
5 Excessive approval processing time III6R5C1 III6R5C2
6 Little profit from tax benefit III6R6C1 III6R6C2
7 The law partially excludes innovation activities and projects that develops the company III6R7C1 III6R7C2
8 Found no obstacles III6R8C1 III6R8C2
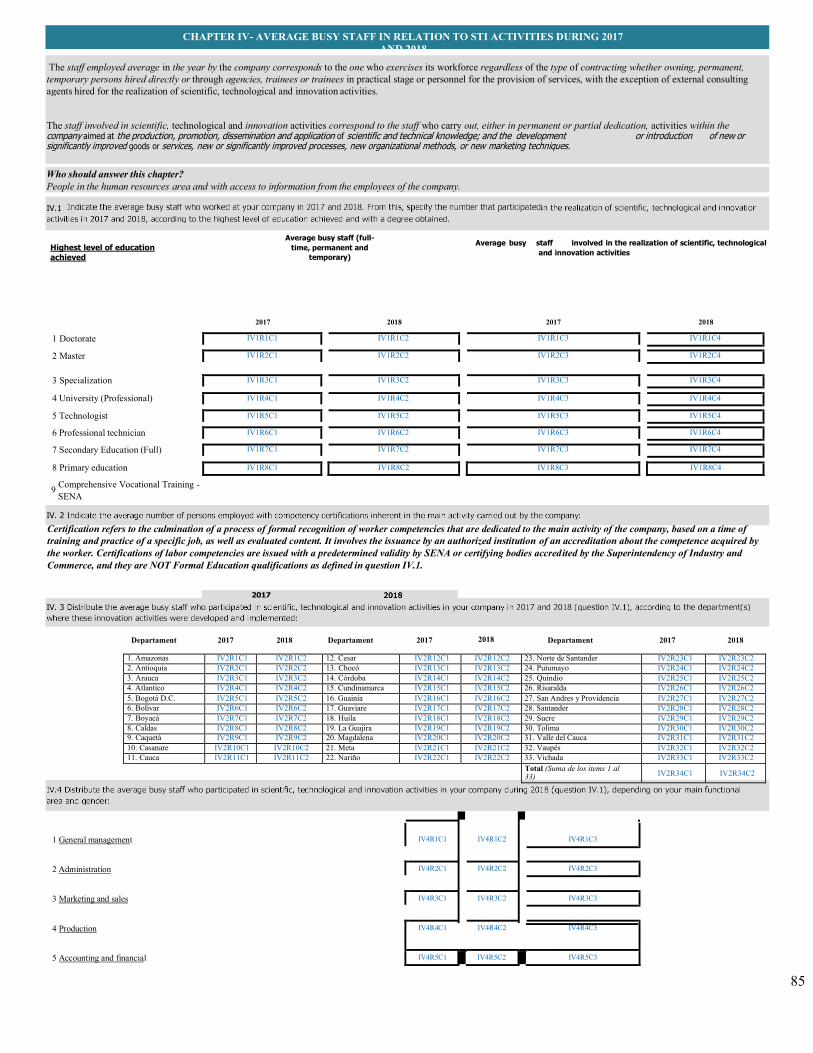
85
Highest level of education
achieved
Average busy staff (full-
time, permanent and
temporary)
Average busy staff involved in the realization of scientific, technological
and innovation activities
2017 2018 2017 2018
1 Doctorate IV1R1C1 IV1R1C2 IV1R1C3 IV1R1C4
2 Master IV1R2C1 IV1R2C2 IV1R2C3 IV1R2C4
3 Specialization IV1R3C1 IV1R3C2 IV1R3C3 IV1R3C4
4 University (Professional) IV1R4C1 IV1R4C2 IV1R4C3 IV1R4C4
5 Technologist IV1R5C1 IV1R5C2 IV1R5C3 IV1R5C4
6 Professional technician IV1R6C1 IV1R6C2 IV1R6C3 IV1R6C4
7 Secondary Education (Full) IV1R7C1 IV1R7C2 IV1R7C3 IV1R7C4
8 Primary education IV1R8C1 IV1R8C2 IV1R8C3 IV1R8C4
9 Comprehensive Vocational Training - SENA
Certification refers to the culmination of a process of formal recognition of worker competencies that are dedicated to the main activity of the company, based on a time of training and practice of a specific job, as well as evaluated content. It involves the issuance by an authorized institution of an accreditation about the competence acquired by the worker. Certifications of labor competencies are issued with a predetermined validity by SENA or certifying bodies accredited by the Superintendency of Industry and Commerce, and they are NOT Formal Education qualifications as defined in question IV.1.
Departament 2017 2018 Departament 2017 2018 Departament 2017 2018
1. Amazonas IV2R1C1 IV2R1C2 12. Cesar IV2R12C1 IV2R12C2 23. Norte de Santander IV2R23C1 IV2R23C2 2. Antioquia IV2R2C1 IV2R2C2 13. Chocó IV2R13C1 IV2R13C2 24. Putumayo IV2R24C1 IV2R24C2 3. Arauca IV2R3C1 IV2R3C2 14. Córdoba IV2R14C1 IV2R14C2 25. Quindio IV2R25C1 IV2R25C2 4. Atlantico IV2R4C1 IV2R4C2 15. Cundinamarca IV2R15C1 IV2R15C2 26. Risaralda IV2R26C1 IV2R26C2 5. Bogotá D.C. IV2R5C1 IV2R5C2 16. Guainía IV2R16C1 IV2R16C2 27. San Andres y Providencia IV2R27C1 IV2R27C2 6. Bolivar IV2R6C1 IV2R6C2 17. Guaviare IV2R17C1 IV2R17C2 28. Santander IV2R28C1 IV2R28C2 7. Boyacá IV2R7C1 IV2R7C2 18. Huila IV2R18C1 IV2R18C2 29. Sucre IV2R29C1 IV2R29C2 8. Caldas IV2R8C1 IV2R8C2 19. La Guajira IV2R19C1 IV2R19C2 30. Tolima IV2R30C1 IV2R30C2 9. Caquetá IV2R9C1 IV2R9C2 20. Magdalena IV2R20C1 IV2R20C2 31. Valle del Cauca IV2R31C1 IV2R31C2 10. Casanare IV2R10C1 IV2R10C2 21. Meta IV2R21C1 IV2R21C2 32. Vaupés IV2R32C1 IV2R32C2 11. Cauca IV2R11C1 IV2R11C2 22. Nariño IV2R22C1 IV2R22C2 33. Vichada IV2R33C1 IV2R33C2
Total (Suma de los ítems 1 al 33) IV2R34C1 IV2R34C2
1 General management
IV4R1C1
IV4R1C2
IV4R1C3
2 Administration IV4R2C1 IV4R2C2 IV4R2C3
3 Marketing and sales IV4R3C1 IV4R3C2 IV4R3C3
4 Production IV4R4C1 IV4R4C2 IV4R4C3
5 Accounting and financial IV4R5C1 IV4R5C2 IV4R5C3
CHAPTER IV- AVERAGE BUSY STAFF IN RELATION TO STI ACTIVITIES DURING 2017 AND 2018
The staff involved in scientific, technological and innovation activities correspond to the staff who carry out, either in permanent or partial dedication, activities within the
The staff employed average in the year by the company corresponds to the one who exercises its workforce regardless of the type of contracting whether owning, permanent, temporary persons hired directly or through agencies, trainees or trainees in practical stage or personnel for the provision of services, with the exception of external consulting agents hired for the realization of scientific, technological and innovation activities.
Who should answer this chapter? People in the human resources area and with access to information from the employees of the company.
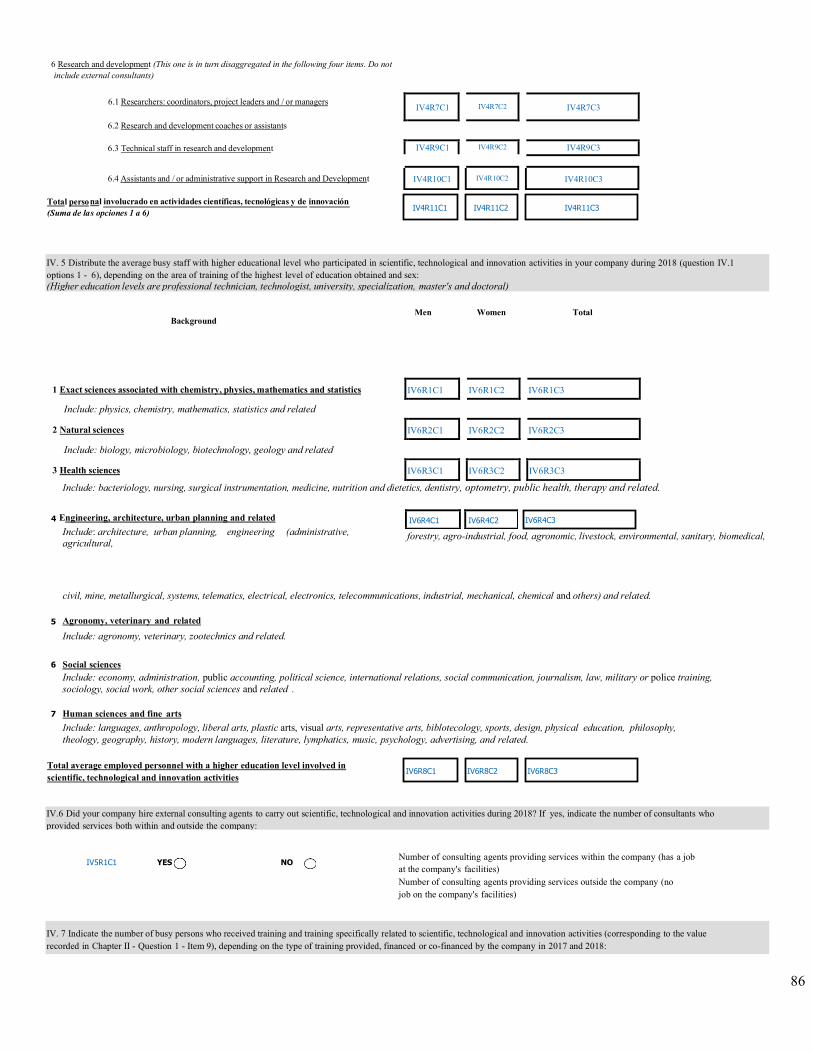
86
6 Research and development (This one is in turn disaggregated in the following four items. Do not include external consultants)
Total perso
(Suma de la
Background
Men Women Total
1 Exact sciences associated with chemistry, physics, mathematics and statistics IV6R1C1 IV6R1C2 IV6R1C3
Include: physics, chemistry, mathematics, statistics and related
2 Natural sciences IV6R2C1 IV6R2C2 IV6R2C3
Include: biology, microbiology, biotechnology, geology and related
3 Health sciences IV6R3C1 IV6R3C2 IV6R3C3
Include: bacteriology, nursing, surgical instrumentation, medicine, nutrition and dietetics, dentistry, optometry, public health, therapy and related.
4 Engineering, architecture, urban planning and related
Include: architecture, urban planning, engineering (administrative, agricultural,
forestry, agro-industrial, food, agronomic, livestock, environmental, sanitary, biomedical,
civil, mine, metallurgical, systems, telematics, electrical, electronics, telecommunications, industrial, mechanical, chemical and others) and related.
5 Agronomy, veterinary and related
Include: agronomy, veterinary, zootechnics and related.
6 Social sciences Include: economy, administration, public accounting, political science, international relations, social communication, journalism, law, military or police training, sociology, social work, other social sciences and related .
7 Human sciences and fine arts
Include: languages, anthropology, liberal arts, plastic arts, visual arts, representative arts, biblotecology, sports, design, physical education, philosophy, theology, geography, history, modern languages, literature, lymphatics, music, psychology, advertising, and related.
Total average employed personnel with a higher education level involved in scientific, technological and innovation activities
IV5R1C1 YES NO Number of consulting agents providing services within the company (has a job at the company's facilities) Number of consulting agents providing services outside the company (no job on the company's facilities)
IV6R4C1 IV6R4C2
IV6R4C3
IV. 7 Indicate the number of busy persons who received training and training specifically related to scientific, technological and innovation activities (corresponding to the value recorded in Chapter II - Question 1 - Item 9), depending on the type of training provided, financed or co-financed by the company in 2017 and 2018:
IV6R8C3 IV6R8C2 IV6R8C1
6.1 Researchers: coordinators, project leaders and / or managers IV4R7C1
IV4R7C2
IV4R7C3
6.2 Research and development coaches or assistants
6.3 Technical staff in research and development IV4R9C1 IV4R9C2 IV4R9C3
6.4 Assistants and / or administrative support in Research and Development nal involucrado en actividades científicas, tecnológicas y de innovación s opciones 1 a 6)
IV4R10C1
IV4R11C1
IV4R10C2
IV4R11C2
IV4R10C3
IV4R11C3
IV. 5 Distribute the average busy staff with higher educational level who participated in scientific, technological and innovation activities in your company during 2018 (question IV.1 options 1 - 6), depending on the area of training of the highest level of education obtained and sex: (Higher education levels are professional technician, technologist, university, specialization, master's and doctoral)
IV.6 Did your company hire external consulting agents to carry out scientific, technological and innovation activities during 2018? If yes, indicate the number of consultants who provided services both within and outside the company:
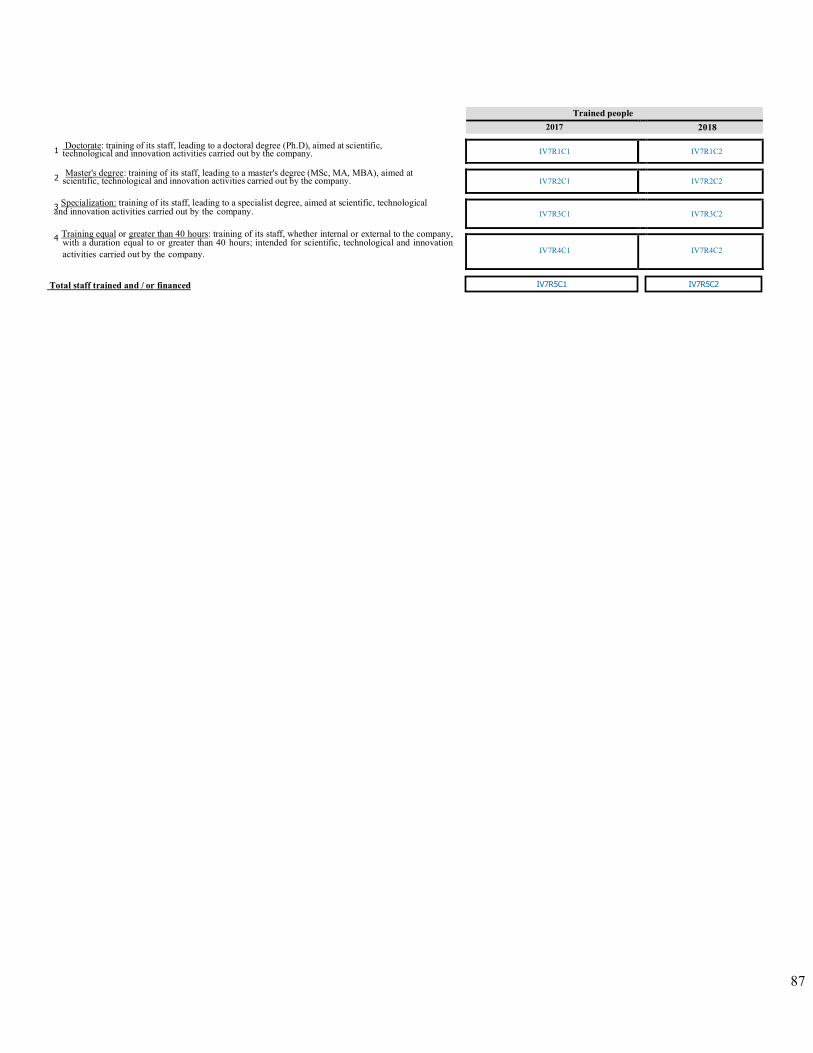
87
Doctorate: training of its staff, leading to a doctoral degree (Ph.D), aimed at scientific, technological and innovation activities carried out by the company.
Master's degree: training of its staff, leading to a master's degree (MSc, MA, MBA), aimed at
scientific, technological and innovation activities carried out by the company.
3 Specialization: training of its staff, leading to a specialist degree, aimed at scientific, technological and innovation activities carried out by the company.
4 Training equal or greater than 40 hours: training of its staff, whether internal or external to the company,
with a duration equal to or greater than 40 hours; intended for scientific, technological and innovation activities carried out by the company.
Total staff trained and / or financed IV7R5C2 IV7R5C1
1
2
Trained people 2017 2018
IV7R1C1
IV7R1C2
IV7R2C1
IV7R2C2
IV7R3C1
IV7R3C2
IV7R4C1
IV7R4C2
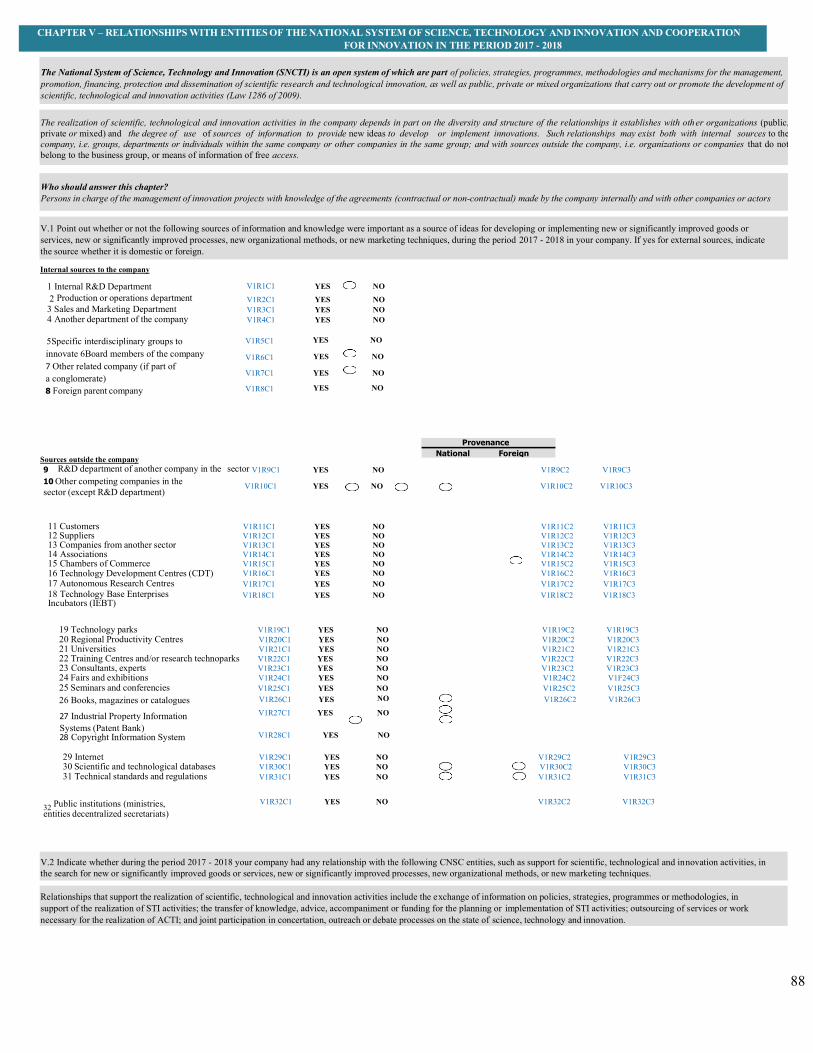
88
The National System of Science, Technology and Innovation (SNCTI) is an open system of which are part of policies, strategies, programmes, methodologies and mechanisms for the management, promotion, financing, protection and dissemination of scientific research and technological innovation, as well as public, private or mixed organizations that carry out or promote the development of scientific, technological and innovation activities (Law 1286 of 2009).
The realization of scientific, technological and innovation activities in the company depends in part on the diversity and structure of the relationships it establishes with other organizations (public, private or mixed) and the degree of use of sources of information to provide new ideas to develop or implement innovations. Such relationships may exist both with internal sources to the company, i.e. groups, departments or individuals within the same company or other companies in the same group; and with sources outside the company, i.e. organizations or companies that do not belong to the business group, or means of information of free access.
Who should answer this chapter? Persons in charge of the management of innovation projects with knowledge of the agreements (contractual or non-contractual) made by the company internally and with other companies or actors
V.1 Point out whether or not the following sources of information and knowledge were important as a source of ideas for developing or implementing new or significantly improved goods or services, new or significantly improved processes, new organizational methods, or new marketing techniques, during the period 2017 - 2018 in your company. If yes for external sources, indicate the source whether it is domestic or foreign.
Internal sources to the company
1 Internal R&D Department V1R1C1 YES NO 2 Production or operations department V1R2C1 YES NO
3 Sales and Marketing Department V1R3C1 YES NO 4 Another department of the company V1R4C1 YES NO
5Specific interdisciplinary groups to innovate 6Board members of the company 7 Other related company (if part of a conglomerate) 8 Foreign parent company
V1R5C1 YES NO
V1R6C1 YES NO
V1R7C1 YES NO
V1R8C1 YES NO
Sources outside the company 9 R&D department of another company in the sector V1R9C1 YES NO V1R9C2 V1R9C3
10 Other competing companies in the sector (except R&D department)
V1R10C1 YES NO V1R10C2 V1R10C3
11 Customers V1R11C1 YES NO V1R11C2 V1R11C3 12 Suppliers V1R12C1 YES NO V1R12C2 V1R12C3 13 Companies from another sector V1R13C1 YES NO V1R13C2 V1R13C3 14 Associations V1R14C1 YES NO V1R14C2 V1R14C3 15 Chambers of Commerce V1R15C1 YES NO V1R15C2 V1R15C3 16 Technology Development Centres (CDT) V1R16C1 YES NO V1R16C2 V1R16C3 17 Autonomous Research Centres V1R17C1 YES NO V1R17C2 V1R17C3 18 Technology Base Enterprises Incubators (IEBT)
V1R18C1 YES NO V1R18C2 V1R18C3
19 Technology parks V1R19C1 YES NO V1R19C2 V1R19C3 20 Regional Productivity Centres V1R20C1 YES NO V1R20C2 V1R20C3 21 Universities V1R21C1 YES NO V1R21C2 V1R21C3 22 Training Centres and/or research technoparks V1R22C1 YES NO V1R22C2 V1R22C3 23 Consultants, experts V1R23C1 YES NO V1R23C2 V1R23C3 24 Fairs and exhibitions V1R24C1 YES NO V1R24C2 V1F24C3 25 Seminars and conferencies V1R25C1 YES NO V1R25C2 V1R25C3 26 Books, magazines or catalogues V1R26C1 YES NO V1R26C2 V1R26C3
27 Industrial Property Information Systems (Patent Bank) 28 Copyright Information System
V1R27C1
V1R28C1
YES
YES
NO
NO
29 Internet V1R29C1 YES NO V1R29C2 V1R29C3 30 Scientific and technological databases V1R30C1 YES NO V1R30C2 V1R30C3 31 Technical standards and regulations V1R31C1 YES NO V1R31C2 V1R31C3
32 Public institutions (ministries, entities decentralized secretariats)
V1R32C1 YES NO V1R32C2 V1R32C3
CHAPTER V – RELATIONSHIPS WITH ENTITIES OF THE NATIONAL SYSTEM OF SCIENCE, TECHNOLOGY AND INNOVATION AND COOPERATION FOR INNOVATION IN THE PERIOD 2017 - 2018
V.2 Indicate whether during the period 2017 - 2018 your company had any relationship with the following CNSC entities, such as support for scientific, technological and innovation activities, in the search for new or significantly improved goods or services, new or significantly improved processes, new organizational methods, or new marketing techniques.
Relationships that support the realization of scientific, technological and innovation activities include the exchange of information on policies, strategies, programmes or methodologies, in support of the realization of STI activities; the transfer of knowledge, advice, accompaniment or funding for the planning or implementation of STI activities; outsourcing of services or work necessary for the realization of ACTI; and joint participation in concertation, outreach or debate processes on the state of science, technology and innovation.
Foreign National
Provenance
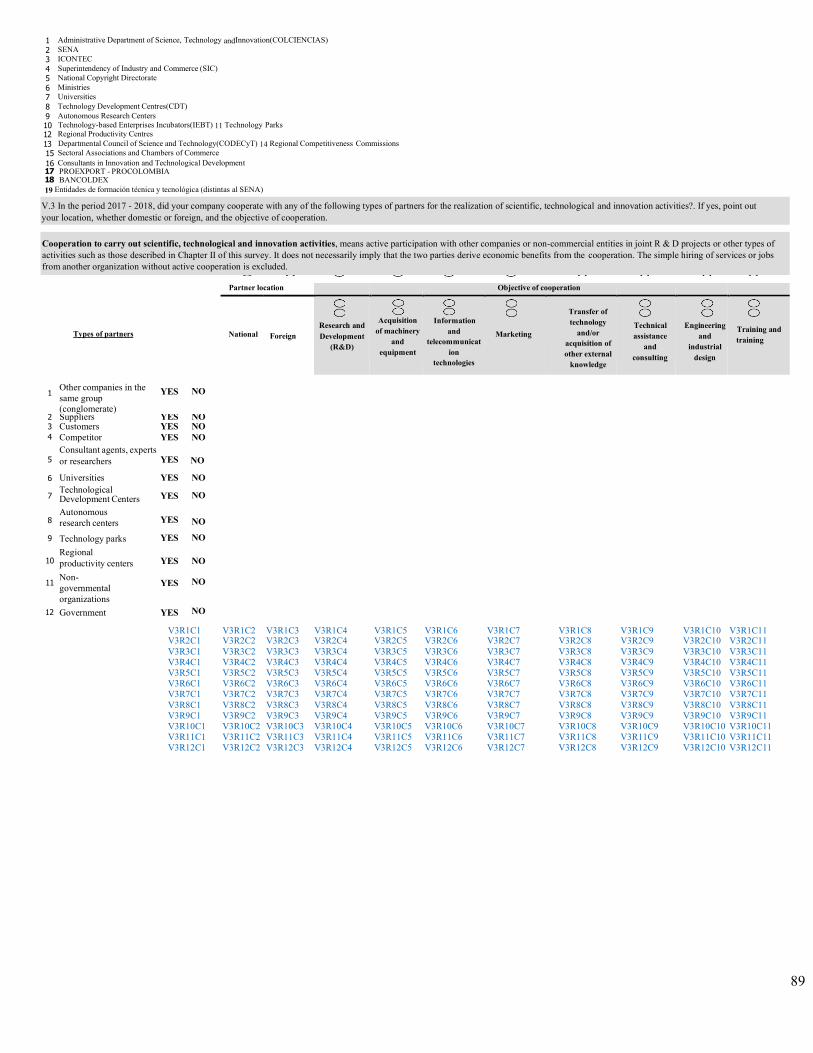
89
1 Administrative Department of Science, Technology andInnovation(COLCIENCIAS) 2 SENA 3 ICONTEC 4 Superintendency of Industry and Commerce (SIC) 5 National Copyright Directorate 6 Ministries 7 Universities 8 Technology Development Centres(CDT) 9 Autonomous Research Centers 10 Technology-based Enterprises Incubators(IEBT) 11 Technology Parks 12 Regional Productivity Centres 13 Departmental Council of Science and Technology(CODECyT) 14 Regional Competitiveness Commissions 15 Sectoral Associations and Chambers of Commerce 16 Consultants in Innovation and Technological Development 17 PROEXPORT - PROCOLOMBIA 18 BANCOLDEX 19 Entidades de formación técnica y tecnológica (distintas al SENA)
V.3 In the period 2017 - 2018, did your company cooperate with any of the following types of partners for the realization of scientific, technological and innovation activities?. If yes, point out your location, whether domestic or foreign, and the objective of cooperation.
Cooperation to carry out scientific, technological and innovation activities, means active participation with other companies or non-commercial entities in joint R & D projects or other types of activities such as those described in Chapter II of this survey. It does not necessarily imply that the two parties derive economic benefits from the cooperation. The simple hiring of services or jobs from another organization without active cooperation is excluded.
Partner location Objective of cooperation
Types of partners
National
Foreign
Research and Development
(R&D)
Acquisition
of machinery and
equipment
Information
and telecommunicat
ion technologies
Marketing
Transfer of technology
and/or acquisition of other external
knowledge
Technical assistance
and consulting
Engineering
and industrial
design
Training and training
1
Other companies in the same group (conglomerate)
YES
NO
2 Suppliers YES NO
3 Customers YES NO
4 Competitor YES NO
5
Consultant agents, experts or researchers
YES
NO
6 Universities YES NO
7 Technological Development Centers YES NO
8
Autonomous research centers YES
NO
9 Technology parks YES NO
10
Regional productivity centers YES NO
11 Non- governmental organizations
YES NO
12 Government YES NO
V3R1C1 V3R1C2 V3R1C3 V3R1C4 V3R1C5 V3R1C6 V3R1C7 V3R1C8 V3R1C9 V3R1C10 V3R1C11 V3R2C1 V3R2C2 V3R2C3 V3R2C4 V3R2C5 V3R2C6 V3R2C7 V3R2C8 V3R2C9 V3R2C10 V3R2C11 V3R3C1 V3R3C2 V3R3C3 V3R3C4 V3R3C5 V3R3C6 V3R3C7 V3R3C8 V3R3C9 V3R3C10 V3R3C11 V3R4C1 V3R4C2 V3R4C3 V3R4C4 V3R4C5 V3R4C6 V3R4C7 V3R4C8 V3R4C9 V3R4C10 V3R4C11 V3R5C1 V3R5C2 V3R5C3 V3R5C4 V3R5C5 V3R5C6 V3R5C7 V3R5C8 V3R5C9 V3R5C10 V3R5C11 V3R6C1 V3R6C2 V3R6C3 V3R6C4 V3R6C5 V3R6C6 V3R6C7 V3R6C8 V3R6C9 V3R6C10 V3R6C11 V3R7C1 V3R7C2 V3R7C3 V3R7C4 V3R7C5 V3R7C6 V3R7C7 V3R7C8 V3R7C9 V3R7C10 V3R7C11 V3R8C1 V3R8C2 V3R8C3 V3R8C4 V3R8C5 V3R8C6 V3R8C7 V3R8C8 V3R8C9 V3R8C10 V3R8C11 V3R9C1 V3R9C2 V3R9C3 V3R9C4 V3R9C5 V3R9C6 V3R9C7 V3R9C8 V3R9C9 V3R9C10 V3R9C11 V3R10C1 V3R10C2 V3R10C3 V3R10C4 V3R10C5 V3R10C6 V3R10C7 V3R10C8 V3R10C9 V3R10C10 V3R10C11 V3R11C1 V3R11C2 V3R11C3 V3R11C4 V3R11C5 V3R11C6 V3R11C7 V3R11C8 V3R11C9 V3R11C10 V3R11C11 V3R12C1 V3R12C2 V3R12C3 V3R12C4 V3R12C5 V3R12C6 V3R12C7 V3R12C8 V3R12C9 V3R12C10 V3R12C11
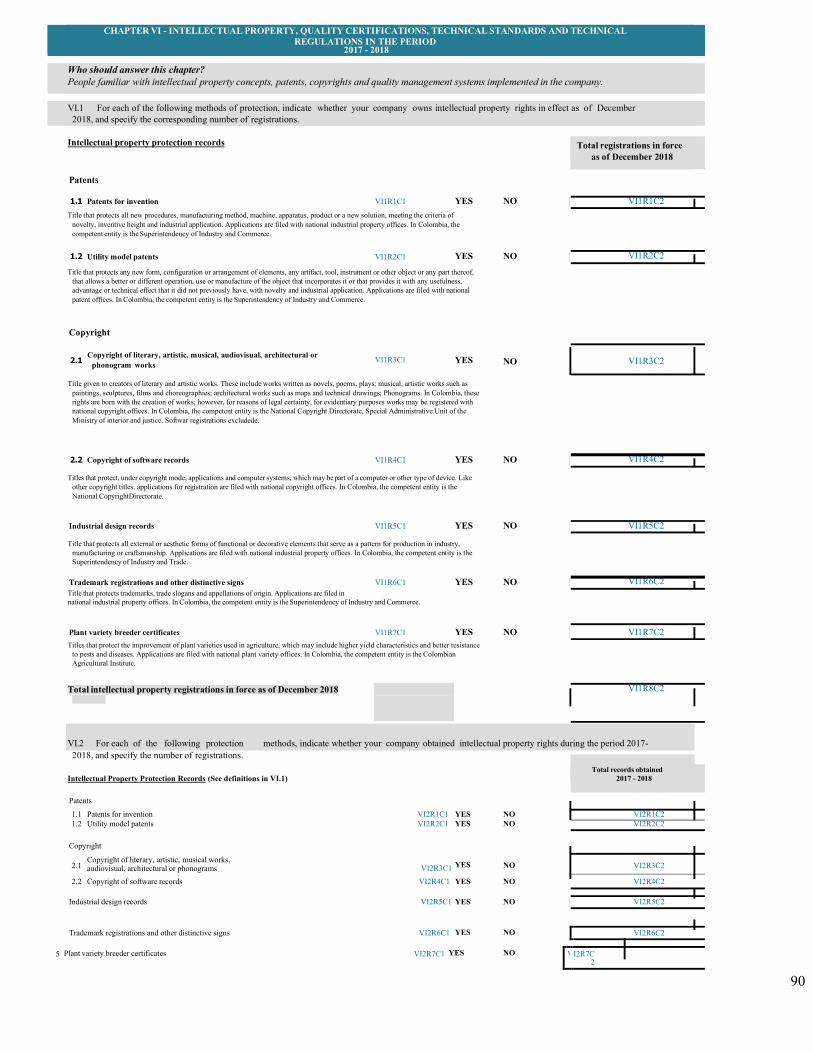
90
CHAPTER VI - INTELLECTUAL PROPERTY, QUALITY CERTIFICATIONS, TECHNICAL STANDARDS AND TECHNICAL REGULATIONS IN THE PERIOD
2017 - 2018
Who should answer this chapter? People familiar with intellectual property concepts, patents, copyrights and quality management systems implemented in the company.
VI.1 For each of the following methods of protection, indicate whether your company owns intellectual property rights in effect as of December 2018, and specify the corresponding number of registrations.
Intellectual property protection records Total registrations in force as of December 2018
Patents
1.1 Patents for invention VI1R1C1 YES NO VI1R1C2 Title that protects all new procedures, manufacturing method, machine, apparatus, product or a new solution, meeting the criteria of
novelty, inventive height and industrial application. Applications are filed with national industrial property offices. In Colombia, the competent entity is the Superintendency of Industry and Commerce.
1.2 Utility model patents VI1R2C1 YES NO VI1R2C2
Title that protects any new form, configuration or arrangement of elements, any artifact, tool, instrument or other object or any part thereof, that allows a better or different operation, use or manufacture of the object that incorporates it or that provides it with any usefulness, advantage or technical effect that it did not previously have, with novelty and industrial application. Applications are filed with national patent offices. In Colombia, the competent entity is the Superintendency of Industry and Commerce.
Copyright
2.1
Copyright of literary, artistic, musical, audiovisual, architectural or phonogram works
VI1R3C1
YES
NO
VI1R3C2
Title given to creators of literary and artistic works. These include works written as novels, poems, plays; musical, artistic works such as paintings, sculptures, films and choreographies; architectural works such as maps and technical drawings; Phonograms. In Colombia, these rights are born with the creation of works; however, for reasons of legal certainty, for evidentiary purposes works may be registered with national copyright offices. In Colombia, the competent entity is the National Copyright Directorate, Special Administrative Unit of the Ministry of interior and justice. Softwar registrations excludede.
2.2 Copyright of software records VI1R4C1 YES NO VI1R4C2
Titles that protect, under copyright mode, applications and computer systems, which may be part of a computer or other type of device. Like other copyright titles, applications for registration are filed with national copyright offices. In Colombia, the competent entity is the National CopyrightDirectorate.
Industrial design records VI1R5C1 YES NO VI1R5C2
Title that protects all external or aesthetic forms of functional or decorative elements that serve as a pattern for production in industry, manufacturing or craftsmanship. Applications are filed with national industrial property offices. In Colombia, the competent entity is the Superintendency of Industry and Trade.
Trademark registrations and other distinctive signs VI1R6C1 YES NO VI1R6C2 Title that protects trademarks, trade slogans and appellations of origin. Applications are filed in national industrial property offices. In Colombia, the competent entity is the Superintendency of Industry and Commerce.
Plant variety breeder certificates VI1R7C1 YES NO VI1R7C2 Titles that protect the improvement of plant varieties used in agriculture, which may include higher yield characteristics and better resistance
to pests and diseases. Applications are filed with national plant variety offices. In Colombia, the competent entity is the Colombian Agricultural Institute.
Total intellectual property registrations in force as of December 2018 VI1R8C2
VI.2 For each of the following protection methods, indicate whether your company obtained intellectual property rights during the period 2017- 2018, and specify the number of registrations.
Intellectual Property Protection Records (See definitions in VI.1)
Total records obtained 2017 - 2018
Patents 1.1 Patents for invention VI2R1C1 YES NO VI2R1C2 1.2 Utility model patents VI2R2C1 YES NO VI2R2C2
Copyright
2.1
Copyright of literary, artistic, musical works, audiovisual, architectural or phonograms
VI2R3C1 YES NO
VI2R3C2
2.2 Copyright of software records VI2R4C1 YES NO VI2R4C2
Industrial design records VI2R5C1 YES NO VI2R5C2
Trademark registrations and other distinctive signs VI2R6C1 YES NO VI2R6C2
5 Plant variety breeder certificates VI2R7C1 YES NO V I2R7C 2
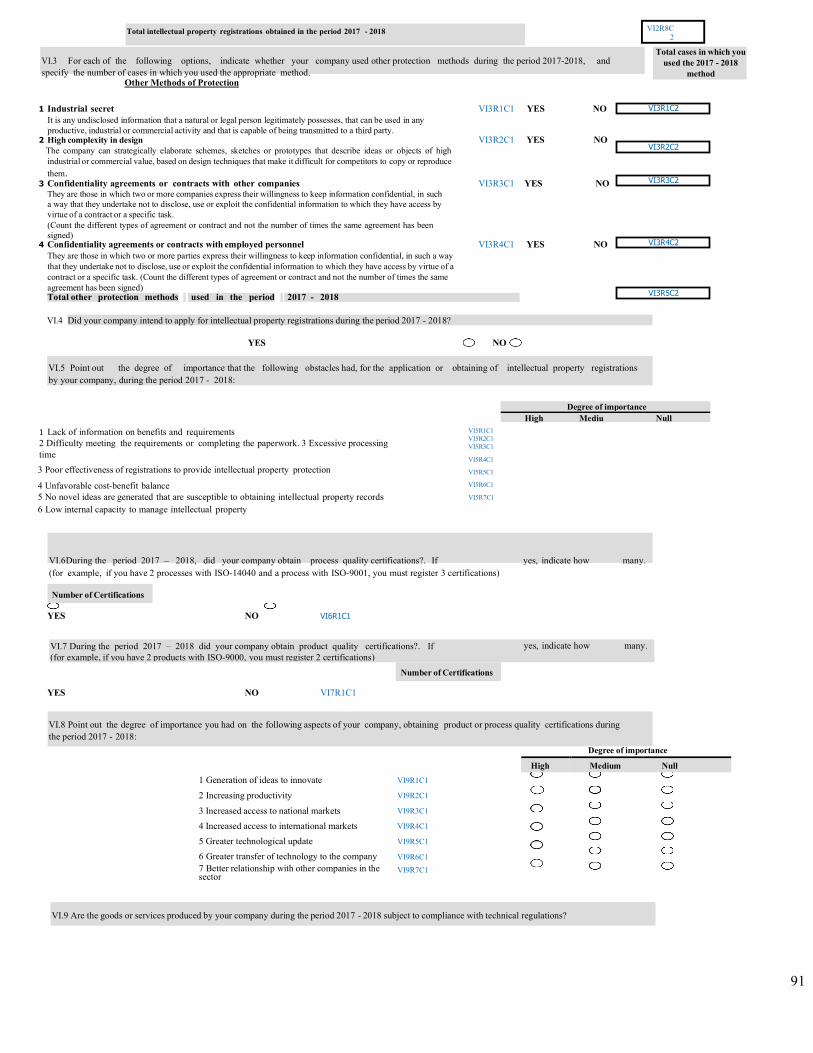
91
VI7R1C2
VI.3 For each of the following options, indicate whether your company used other protection methods during the period 2017-2018, and specify the number of cases in which you used the appropriate method.
Other Methods of Protection
VI2R8C 2
Total cases in which you used the 2017 - 2018
method
1 Industrial secret VI3R1C1 YES NO It is any undisclosed information that a natural or legal person legitimately possesses, that can be used in any productive, industrial or commercial activity and that is capable of being transmitted to a third party.
2 High complexity in design VI3R2C1 YES NO The company can strategically elaborate schemes, sketches or prototypes that describe ideas or objects of high industrial or commercial value, based on design techniques that make it difficult for competitors to copy or reproduce them.
3 Confidentiality agreements or contracts with other companies VI3R3C1 YES NO They are those in which two or more companies express their willingness to keep information confidential, in such a way that they undertake not to disclose, use or exploit the confidential information to which they have access by virtue of a contract or a specific task. (Count the different types of agreement or contract and not the number of times the same agreement has been signed)
4 Confidentiality agreements or contracts with employed personnel VI3R4C1 YES NO They are those in which two or more parties express their willingness to keep information confidential, in such a way that they undertake not to disclose, use or exploit the confidential information to which they have access by virtue of a contract or a specific task. (Count the different types of agreement or contract and not the number of times the same agreement has been signed) Total other protection methods used in the period 2017 - 2018
VI.4 Did your company intend to apply for intellectual property registrations during the period 2017 - 2018?
YES NO
1 Lack of information on benefits and requirements 2 Difficulty meeting the requirements or completing the paperwork. 3 Excessive processing time 3 Poor effectiveness of registrations to provide intellectual property protection
4 Unfavorable cost-benefit balance 5 No novel ideas are generated that are susceptible to obtaining intellectual property records 6 Low internal capacity to manage intellectual property
VI5R1C1 VI5R2C1 VI5R3C1
VI5R4C1
VI5R5C1
VI5R6C1
VI5R7C1
YES NO VI6R1C1
YES NO VI7R1C1
Degree of importance High Medium Null
1 Generation of ideas to innovate VI9R1C1
2 Increasing productivity VI9R2C1
3 Increased access to national markets VI9R3C1
4 Increased access to international markets VI9R4C1
5 Greater technological update VI9R5C1
6 Greater transfer of technology to the company VI9R6C1
7 Better relationship with other companies in the sector
VI9R7C1
Total intellectual property registrations obtained in the period 2017 - 2018
Null Mediu High Degree of importance
VI.6During the period 2017 – 2018, did your company obtain process quality certifications?. If (for example, if you have 2 processes with ISO-14040 and a process with ISO-9001, you must register 3 certifications)
yes, indicate how many.
Number of Certifications
VI.8 Point out the degree of importance you had on the following aspects of your company, obtaining product or process quality certifications during the period 2017 - 2018:
VI3R5C2
VI3R4C2
VI3R3C2
VI3R2C2
VI3R1C2
VI.5 Point out the degree of importance that the following obstacles had, for the application or obtaining of intellectual property registrations by your company, during the period 2017 - 2018:
Number of Certifications
VI.7 During the period 2017 – 2018 did your company obtain product quality certifications?. If (for example, if you have 2 products with ISO-9000, you must register 2 certifications)
yes, indicate how many.
VI.9 Are the goods or services produced by your company during the period 2017 - 2018 subject to compliance with technical regulations?
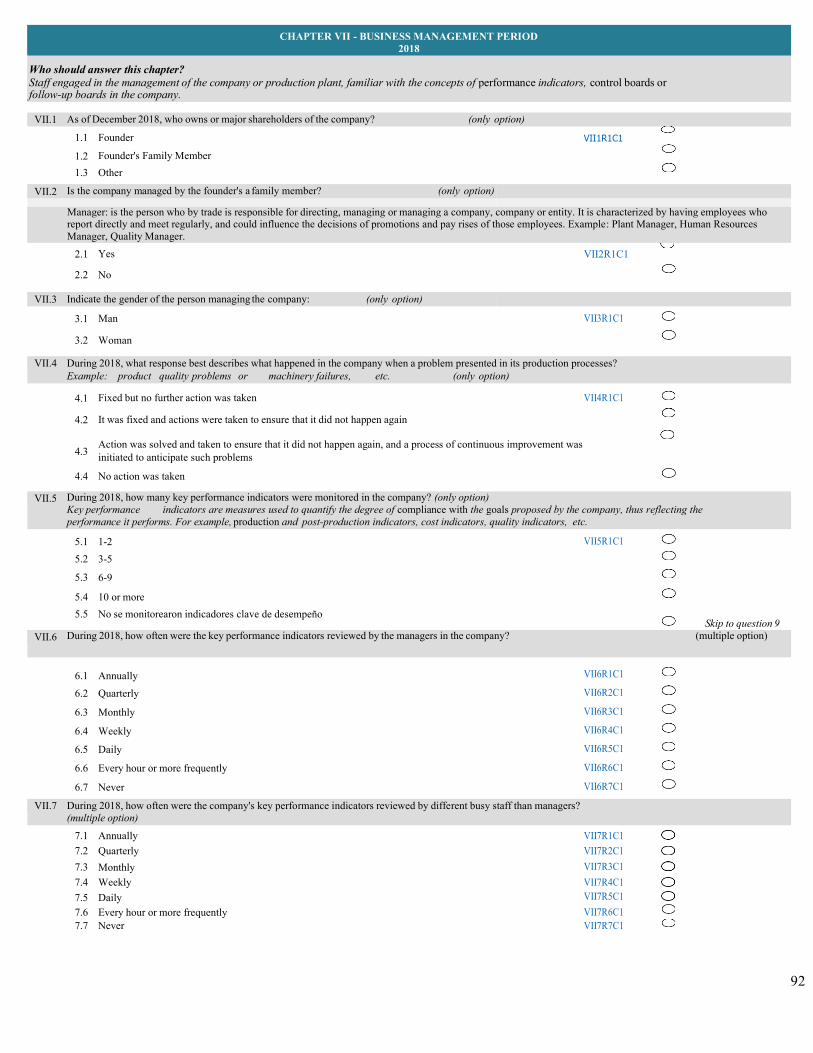
92
CHAPTER VII - BUSINESS MANAGEMENT PERIOD 2018
Who should answer this chapter? Staff engaged in the management of the company or production plant, familiar with the concepts of performance indicators, control boards or follow-up boards in the company.
VII.1 As of December 2018, who owns or major shareholders of the company? (only option) 1.1 Founder
VII1R1C1
1.2 Founder's Family Member
1.3 Other
VII.2 Is the company managed by the founder's a family member? (only option)
Manager: is the person who by trade is responsible for directing, managing or managing a company, company or entity. It is characterized by having employees who report directly and meet regularly, and could influence the decisions of promotions and pay rises of those employees. Example: Plant Manager, Human Resources Manager, Quality Manager.
2.1 Yes VII2R1C1 2.2 No
VII.3 Indicate the gender of the person managing the company: (only option)
3.1 Man VII3R1C1 3.2 Woman
VII.4 During 2018, what response best describes what happened in the company when a problem presented in its production processes? Example: product quality problems or machinery failures, etc. (only option)
4.1 Fixed but no further action was taken VII4R1C1
4.2 It was fixed and actions were taken to ensure that it did not happen again
4.3
Action was solved and taken to ensure that it did not happen again, and a process of continuous improvement was initiated to anticipate such problems
4.4 No action was taken
VII.5 During 2018, how many key performance indicators were monitored in the company? (only option) Key performance indicators are measures used to quantify the degree of compliance with the goals proposed by the company, thus reflecting the performance it performs. For example, production and post-production indicators, cost indicators, quality indicators, etc.
5.1 1-2 VII5R1C1 5.2 3-5
5.3 6-9
5.4 10 or more
5.5 No se monitorearon indicadores clave de desempeño Skip to question 9
VII.6 During 2018, how often were the key performance indicators reviewed by the managers in the company? (multiple option)
6.1
Annually VII6R1C1
6.2 Quarterly VII6R2C1 6.3 Monthly VII6R3C1 6.4 Weekly VII6R4C1 6.5 Daily VII6R5C1 6.6 Every hour or more frequently VII6R6C1 6.7 Never VII6R7C1
VII.7 During 2018, how often were the company's key performance indicators reviewed by different busy staff than managers? (multiple option)
7.1 Annually VII7R1C1 7.2 Quarterly VII7R2C1 7.3 Monthly VII7R3C1 7.4 Weekly VII7R4C1 7.5 Daily VII7R5C1 7.6 Every hour or more frequently VII7R6C1 7.7 Never VII7R7C1
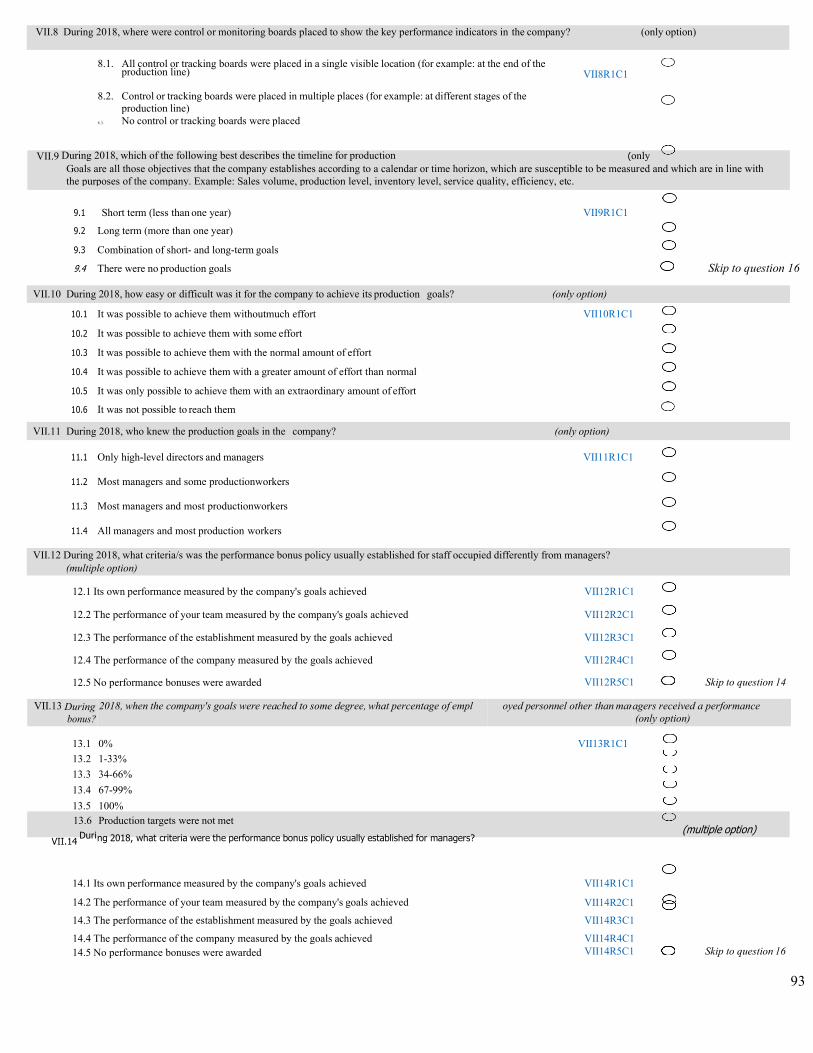
93
8.1. All control or tracking boards were placed in a single visible location (for example: at the end of the production line)
8.2. Control or tracking boards were placed in multiple places (for example: at different stages of the
production line) 8.3. No control or tracking boards were placed
VII8R1C1
9.1 Short term (less than one year) VII9R1C1
9.2 Long term (more than one year)
9.3 Combination of short- and long-term goals
9.4 There were no production goals Skip to question 16
10.1 It was possible to achieve them withoutmuch effort VII10R1C1
10.2 It was possible to achieve them with some effort
10.3 It was possible to achieve them with the normal amount of effort
10.4 It was possible to achieve them with a greater amount of effort than normal
10.5 It was only possible to achieve them with an extraordinary amount of effort
10.6 It was not possible to reach them
11.1 Only high-level directors and managers VII11R1C1
11.2 Most managers and some productionworkers
11.3 Most managers and most productionworkers
11.4 All managers and most production workers
12.1 Its own performance measured by the company's goals achieved VII12R1C1
12.2 The performance of your team measured by the company's goals achieved VII12R2C1
12.3 The performance of the establishment measured by the goals achieved VII12R3C1
12.4 The performance of the company measured by the goals achieved VII12R4C1
12.5 No performance bonuses were awarded VII12R5C1 Skip to question 14
VII.13 During bonus?
2018, when the company's goals were reached to some degree, what percentage of empl oyed personnel other than man agers received a performance (only option)
13.1
0%
VII13R1C1
13.2 1-33%
13.3 34-66%
13.4 67-99%
13.5 100%
13.6
VII.14 Duri
Production targets were not met ng 2018, what criteria were the performance bonus policy usually established for managers?
(multiple option)
14.1 Its own performance measured by the company's goals achieved VII14R1C1
14.2 The performance of your team measured by the company's goals achieved VII14R2C1
14.3 The performance of the establishment measured by the goals achieved VII14R3C1
14.4 The performance of the company measured by the goals achieved VII14R4C1 14.5 No performance bonuses were awarded VII14R5C1 Skip to question 16
VII.8 During 2018, where were control or monitoring boards placed to show the key performance indicators in the company? (only option)
VII.9 During 2018, which of the following best describes the timeline for production (only Goals are all those objectives that the company establishes according to a calendar or time horizon, which are susceptible to be measured and which are in line with the purposes of the company. Example: Sales volume, production level, inventory level, service quality, efficiency, etc.
VII.10 During 2018, how easy or difficult was it for the company to achieve its production goals? (only option)
VII.11 During 2018, who knew the production goals in the company? (only option)
VII.12 During 2018, what criteria/s was the performance bonus policy usually established for staff occupied differently from managers? (multiple option)
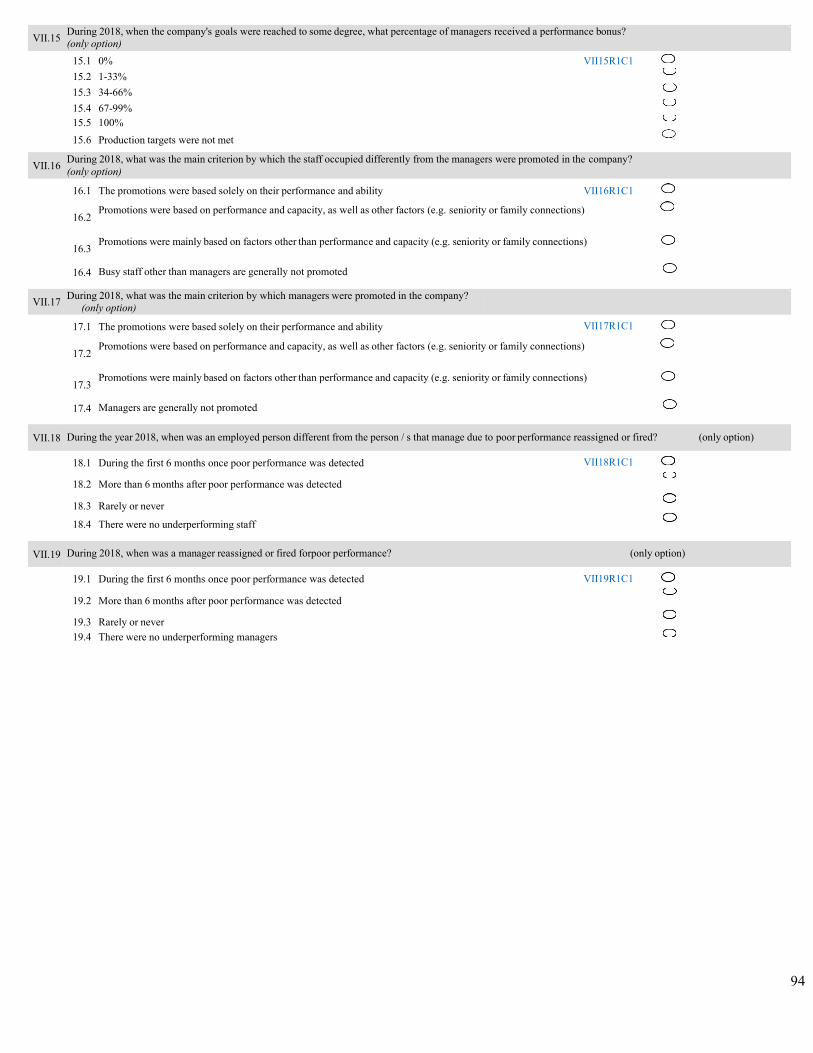
94
VII.15 During 2018, when the company's goals were reached to some degree, what percentage of managers received a performance bonus? (only option)
15.1 0% VII15R1C1 15.2 1-33%
15.3 34-66%
15.4 67-99%
15.5 100%
15.6 Production targets were not met
VII.16 During 2018, what was the main criterion by which the staff occupied differently from the managers were promoted in the company? (only option)
16.1 The promotions were based solely on their performance and ability VII16R1C1
16.2 Promotions were based on performance and capacity, as well as other factors (e.g. seniority or family connections)
16.3
Promotions were mainly based on factors other than performance and capacity (e.g. seniority or family connections)
16.4 Busy staff other than managers are generally not promoted
VII.17 During 2018, what was the main criterion by which managers were promoted in the company? (only option)
17.1 The promotions were based solely on their performance and ability VII17R1C1
17.2 Promotions were based on performance and capacity, as well as other factors (e.g. seniority or family connections)
17.3
Promotions were mainly based on factors other than performance and capacity (e.g. seniority or family connections)
17.4 Managers are generally not promoted
VII.18 During the year 2018, when was an employed person different from the person / s that manage due to poor performance reassigned or fired? (only option)
18.1 During the first 6 months once poor performance was detected VII18R1C1
18.2 More than 6 months after poor performance was detected
18.3 Rarely or never
18.4 There were no underperforming staff
VII.19 During 2018, when was a manager reassigned or fired forpoor performance? (only option)
19.1 During the first 6 months once poor performance was detected VII19R1C1
19.2 More than 6 months after poor performance was detected
19.3 Rarely or never
19.4 There were no underperforming managers