Embed Size (px)
Citation preview

POLITECNICO DI MILANO
DEPARTMENT OF MANAGEMENT, ECONOMICS AND INDUSTRIAL
ENGINEERING
IMPLEMENTING AN ENERGY MANAGEMENT SYSTEM:
STATUS EVALUATION AND CONCEPT FOR IMPLEMENTING ENERGY
CONSUMPTION DATA MONITORING INSTRUMENTS USING THE
EXAMPLE OF KNORR-BREMSE
Supervisor: Prof. Marco Taisch
Assistant Supervisor: Eng. Alessandro Cannata
Master Graduation Thesis by: Daiane Pandolfo
Student Id. Number: 716296
Academic Year 2009/2010

ACKNOWLEDGEMENTS
I want to acknowledge to the ICE-UNIONCAMERE for the scholarship that made possible
studying in Italy and to the professors and staff from Politecnico di Milano Campus Como
for the attention and the help, especially to Alessandro Cannata and Marco Taisch.
I thank to Knorr-Bremse Group that made possible to develop my final work in a
professional environment, thanks to Mr. Heist, Mr. Pförtner and Mr. Leierseder for
welcoming and helping me.
I am grateful to Professor Peter Bent Hansen from PUCRS for motivating me to continue
studying. To my family and old friends that were always there for me and to the new ones
that came with my experience abroad.
Special thanks to my parents Norena and Djalmo for supporting me and believe in my
decisions and to my little sister Luana and my big friend Liliane for being there for me.

ABSTRACT
In the context of the ever increasing concern about reducing energy costs and
environmental impacts, there is an intensification of the importance on Energy
Management. The similarity of Quality, Environmental and Energy Management Systems
makes possible not starting the implementation of the Energy Management System from
the very beginning, allowing the reduction of related costs and efforts. Even having the
basis of the previous management systems, the Energy Management System requires
particular actions, such as a more detailed energy measuring and monitoring system. This
research is aimed to present instruments for helping the implementation of Energy
Management System in a company. The analysis is divided in two parts; the first one
makes a comparison between the international environmental and energy management
standards and presents a tool for assisting the status evaluation of the company regarding
an Energy Management System, the second part is a concept, focused on implementing or
improving instruments for energy consumption data monitoring.

Executive Summary
i
EXECUTIVE SUMMARY
The concern about the impact of the energy consumption in the environment and
the possibility of scarcity of energy resources, together with the potential cost reductions in
this area, turns the organizations‟ attention to the importance of energy efficiency issues.
Energy efficient activities generate the same results using fewer energy resources
and to help companies organizing themselves in a way to achieve energy efficiency,
several instruments are available nowadays, such as international standards, procedures,
guidelines and so on.
This paper is focused in the international standard for energy management, ISO
50001:2009 (draft version) and the European standard EN 16001:2009. The aim is to start
introducing an energy management system in an organization.
To fulfil the objectives two steps were developed, first the analysis of the as is
situation of the company in respect to an energy management system. Taking into account
that companies that already have other management systems ongoing may not have to start
the implementation of the energy management system from the zero.
A comparison between environmental and energy management standards was done
and from the analysis of the standards and their comparison a checklist was developed.
This checklist aims to evaluate the status of the energy management system in a company,
and for testing its applicability it was applied in 17 sites from Knorr-Bremse Group, the
results obtained with the tool led to the second objective.
In the second part a concept was developed with the intent to assist companies in
deciding when to invest in energy consumption monitoring instruments. Since it is hard to
manage what cannot be measured and the more accurate the data the better the final results,
investment in equipments for metering energy consumption may be required.
Having in mind that the return on investment in metering equipments is hard to
estimate and at a first sight they represent only costs, the suggestion is a plan for
implementing or improving energy consumption data monitoring schemes that can be
gradually and continuously upgraded.
Both instruments the checklist and the plan, help giving a direction for starting the
implementation of a management system that may become increasingly demanded in the
course of time.

Executive Summary
ii
Management System Status Evaluation
The status evaluation of a management system is made to verify if some of the
requirements of the new management system, which shall be implemented, were already
accomplished. This avoids replicated work and consequently reduces related efforts and
costs.
For starting the analysis a research about management systems was done, the
literature review embraces the following main topics:
1. Quality Management System and ISO 9001:2008;
2. Environmental Management System and ISO 14001:2006;
3. Energy Management System, EN 16001:2009 and ISO 50001:2009 (draft
version);
4. Integrated Management System;
5. Sustainability and international climate policies.
Method and Instrument for Status Verification of an Energy Management System
Analysing the international management standards it was verified that they have
more or less the same structure and similar requirements. The most alike were ISO
14001:2008 and ISO 50001:2009 (draft version).
The first step was to make a comparison between the requirements of the
environmental and the energy international standards, assuming that with this comparison
it is possible to have an overview of the similarities.
The main differences identified are shown blue and orange in Table 1. The
requirements in blue represent the slight differences, where it was only done a more
detailed description of the requirement, such as in „4.3.1-Environmental aspects‟ in the
environmental standard that was divided into „4.4.2-Energy profile, 4.4.3-Energy baseline
and 4.4.4-Energy performance indicators‟ in the energy standard.
The lines in orange show the new points added into the standard, for example, it is
relevant for the ISO 50001:2009 (draft version) to direct a specific attention to the process
of buying energy, so it was included as a particular requirement in the standard.

Executive Summary
iii
Table 1: Comparison between the international environment and energy standards
ISO 50001:2011 Energy Management ISO 14001:2009 Environmental Management
4.1 General requirements 4.1 General requirements
4.2 Management Responsibility
4.2.1 Commitment of top management
4.2.2 Roles, responsibility and authority 4.4.1 Structure and resposibility
4.3 Energy policy 4.2 Environmental Policy
4.4 Planning 4.3 Planning
4.4.1 General
4.4.2 Energy profile 4.3.1 Environmental aspects
4.4.3 Energy Baseline
4.4.4 Energy performance indicators
4.4.5 Legal and other requirements 4.3.2 Legal and other requirements
4.4.6 Objectives, targets and action plans 4.3.3 Objectives and targets
4.3.4 Environmental management programme (s)
4.5 Implementation and operation 4.4 Implementation and operation
4.5.1 Competence, training and awareness 4.4.2 Competence, training and awarness
4.5.2 Documentation 4.4.4 Documentation
4.5.2.1 Documentation requirements
4.5.2.2 Control of documents 4.4.5 Control of documents
4.5.3 Operational control 4.4.6 Operational control
4.5.4 Communication 4.4.3 Communication
4.5.5 Design
4.5.6 Purchasing energy services, goods and energy
4.5.6.1 Purchasing of energy services and goods
4.5.6.2 Purchasing of energy
4.4.7 Emergency preparedness and response
4.6 Checking performance 4.5 Checking and corrective action
4.6.1 Monitoring, measurement and analysis 4.5.1 Monitoring and measurement
4.6.2 Evaluation of legal/other compliances
4.6.3 Internal audit 4.5.4 Environmental management system audit
4.6.4Nonconformities, corrective, preventive and
improvement actions4.5.2 Nonconformities, corrective and preventive actions
4.6.4.1 Nonconformities
4.6.4.2 Corrective and preventive actions
4.6.5 Control of records 4.5.3 Control of records
4.7 Review of the energy mgmt system by top management 4.6 Management review
4.7.1 Inputs to management review
4.7.2 Outputs from management review
Comparison between standards
(blue: slight differences; orange: new inclusions)
The analysis of both international standards and their comparison confirmed that
there are some activities carried out in the environmental standard that do not have to be
repeated while implementing the energy standard. For instance, the communication‟s,
documentation‟s and control of records‟ plan.
From this analysis the checklist represented in Figure 1 was formulated and applied
in the sites of Knorr-Bremse, division for Commercial Vehicle Systems.

Executive Summary
iv
Status evaluation for the implementation of LOCATION: please enter here location name
an Energy Management System according to DATE: DD.MM.YYYY
ISO 50001 draft NAME: please enter here contact person
No
t F
ulf
illed
Par
t ly
Fu
lfil
led
no
t
app
licab
le
4.1 General requirements 0%
1Has the organization defined an Energy Management System
accordingly to ISO 50001?0
4.2 Management responsibility (4.2.1/ 4.2.2) 0%
1
Has the organization defined an energy management representative
(energy manager) and defined their roles, responsibilities and
authorities?
0
2
Are the specialized skills, human, financial and technological
resources necessary for energy management identified and provided
by the board?
0
4.3 Energy policy 0%
1Has the board defined in writing a policy, which includes also a
commitment to continuous improvement of energy efficiency?0
2Does the policy show a commitment to achieve the energy
management objectives and to reduce energy related emissions?0
3 Is the policy available to internal and external public? 0
Please use 'x' in evaluation box
Comments to explain the evaluation i.e. evidences
rating
score
and inter-
mediate
results
(%)
Req.
NoElement Requirement Questions
Evaluation
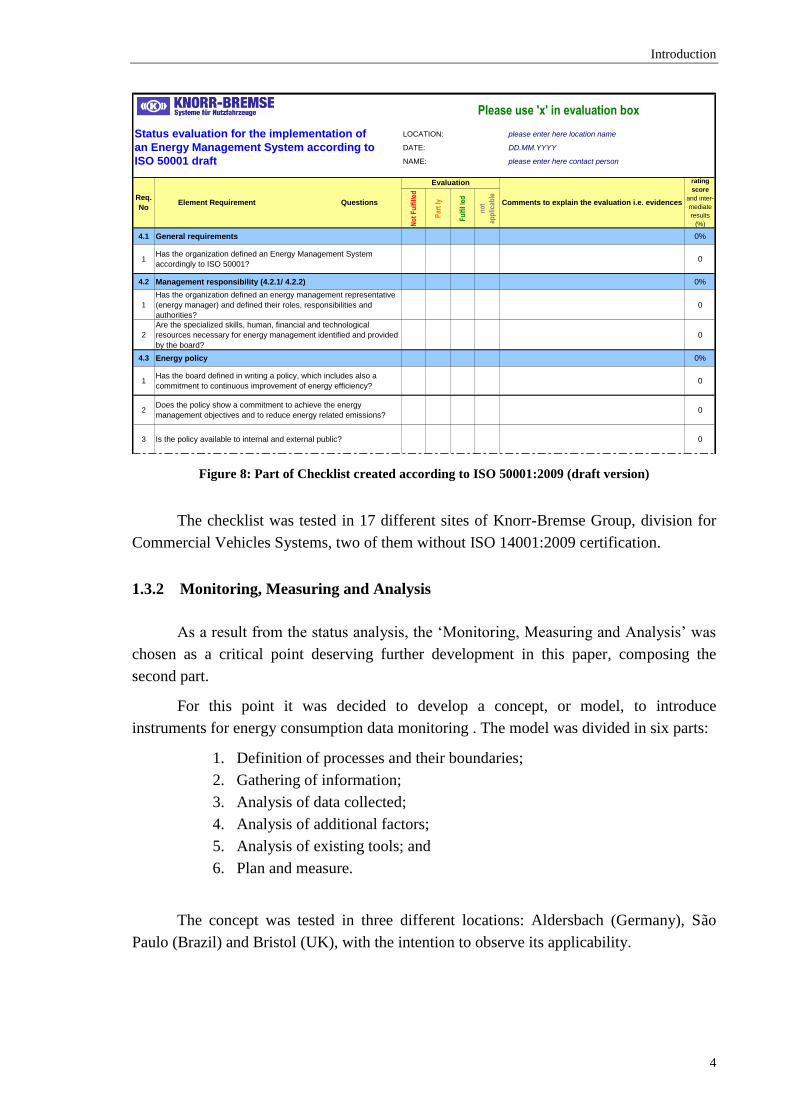
Figure 1: Part of Checklist created according to ISO 50001:2009 (draft version)
The checklist was sent to all the 17 division‟s locations, only one did not answer the
checklist (Japan), and the final analysis was done based on the region named „Europe +
São Paulo‟ considered the most likely to start the implementation of an energy
management system.
The tool generates a graph as the Figure 2, where it is possible to identify how
much from each requirement analysed was fulfilled. Green means fulfilled, orange means
partially fulfilled and red stands for not fulfilled. The last column, in blue, indicates the
final general score.
Figure 2: Results per requirement - Bristol

Executive Summary
v
Figure 2 shows the results from the location Bristol (UK), which is already
certificated with ISO 14001:2006, and the figure bellow (Figure 3) displays the results
from Dalian (China) that does not have ISO 14001:2006 certification.
Figure 3: Results per requirement - Dalian
The problem identified in the checklist was related to the interpretation of the
questions, different locations had a different view of the purpose of the tool, such as São
Paulo, who understood that it should analyse requirements fulfilled by only an energy
management system, i.e. they did not assumed the possibility of an integrated management
system, where some requirements of other management systems could be used in the
energy management system as well, as mentioned before.
Results
Results obtained with the answers from Knorr-Bremse locations (Region Europe +
São Paulo) were analysed and three main gaps were identified, in requirements:
4.5.6-Purchasing , 43% not fulfilled;
4.5.1-Competence, training and awareness, 50%
not fulfilled; and
4.6.1-Monitoring, measurement and analysis,
35% not fulfilled (Figure 4).
Figure 4: Requirement 4.6.1
4.6.1 Monitoring, measurement
and analysis
31%
35%34%
Not Fulfilled Part ly Fulfil led
Executive Summary
vi
Considering that for improving the results of requirement „4.5.6-Purchasing‟ the
main actions to be taken are related basically to changes in processes and improvements in
„4.5.1-Competence, training and awareness‟ involve mainly the inclusion of energy related
issues in the already existing competence and training plans, the decision of developing the
next concept was based in requirement „4.6.1-Monitoring, measurement and analysis‟.
Even showing the lower percentage, the requirement 4.6.1 represents an important
step in implementing a management system, since other decisions also depend on
monitoring, measurement and analysis, such as the definition of energy profile, baseline
and performance indicators, which also will be the basis for setting objectives, targets and
formulating action plans.
Conclusion
The checklist turned out to be an applicable instrument, direct and simple, that does
not require much time for answering. Even though some attention should be drawn to the
fact that may be different interpretations of the use of the checklist, it still helps to have a
general overview about the status of an energy management system inside the
organization.
Different interpretations may occur not only in the case mentioned previously (São
Paulo), other reasons to misinterpretation can be related to the fact that the checklist will be
received by the employees as a control tool, used to investigate if they are doing their work
well, this leads to wrong answers, normally driven by fear.
In any case, the checklist is still useful, once having the answers in hands, they can
be the basis for further investigations.
Monitoring Measuring and Analysis
Deciding that the further step would be taken regarding the requirement „4.6.1-
Monitoring, measurement and analysis‟, it was identified the lack of energy consumption
metering instruments, which can provide more accurate monitoring and analysis.
At this point, the objective became to develop a concept to start the introduction of
instruments for energy consumption data monitoring where better suited, or implementing
where they already exist but do not provide the desired information.
The literature review of this chapter approached some basic information about
energy metering and the identification of energy consumption systems that can be found
inside industry. Being aware of how these energy consumption systems work, helps to
understand where energy is used inside the industry.

Executive Summary
vii
Methodology: Concept for introducing instruments for energy consumption data
collection
Aiming a gradually and continuously improvement of the energy consumption
monitoring, measuring and analysis, a concept with six steps was proposed to guide the
activity, as represented in Figure 4.
Figure 5: Steps for Implementing an Energy Consumption Monitoring System
In the first step the types of energy input and energy output are defined, as well as
the scope (or level of detail). Energy output, in this case, means all sort of energy that is
lost in the process, for different reasons, due to leakages or lack of an appropriate reuse
system.
Level of detail represents how deep the information will be investigated, for
instance if data will relate to the whole production, to the single process line, to the process
or to the specific machine, and so on.
Table 2 shows the tool created for assisting in the identification of energy inputs,
outputs and level of detail that exist inside a company. Pointing out that energy inputs and
outputs may vary from company to company as well as the number of level of detail.

Executive Summary
viii
Table 2: Identification of Energy Sources and Consumers
Location:
Date:
Ga
s
Ele
ctr
icity
Fu
el (o
il /
co
al)
Co
mp
resse
d a
ir
Ste
am
Wa
ter
Ele
ctr
icity
Co
mp
resse
d a
ir
Th
erm
al e
ne
rgy
Ste
am
Wa
ter
Level 1 Level 2 Level 3 (…)
IDENTIFICATION OF ENERGY SOURCES AND CONSUMERS
Identification of energy inputs/ outputs
Energy Input Energy Output
Step 2 is the gathering of information, that depends on the information available and
step 3 is the analysis of data collected, for work in both steps it was formulated the Table 3,
where data can be gathered and facilitates its observation.
The 3 first columns of „electricity-input‟ are dedicated to data analysis that is done
with the help of a Pareto Chart. The column of level, frequency, mobility, data collection,
focus, history and type indicate characteristics of the instrument used for the data
collection. In the output part there are two types of information, if any kind of energy
output (loss) is measured (yes/no) and which.
Table 3: Electricity Consumption Analysis
Location:
Date:
Con
su
mp
tio
n
Pe
rce
nta
ge
Cum
ula
tive
pe
rce
nta
ge
Le
ve
l
Fre
qu
en
cy
Mo
bili
ty
Data
co
llectio
n
Fo
cu
s
His
tory
Typ
e/
Mo
de
l/ N
am
e o
f
me
teri
ng
eq
uip
me
nt
Typ
e o
f e
ne
rgy
ou
tpu
t/ lo
ss
Me
asu
red
(y /
n )
Level 1 Level 2 Level 3 (…)
Production Assembly A1
Assembly A2
Assembly A3
Assembly A4
Machining M1
Machining M2
Machining M3
Machining M4
Machining M5
Machining M6
TOTAL
ELECTRICITY CONSUMPTION ANALYSIS
Identification of energy inputs/ outputs
Electricity - Input Output
Using the Pareto principle (80-20) the focus of the analysis is established. This
focus can still change, after step 4 that verifies the possibility of any anomaly in the energy
consumption that even do not representing a large energy consumer, may deserve priority.

Executive Summary
ix
The step 5 investigates if there are any instruments for energy consumption data
collection, the Table 3 is also useful in this case.
Last part, step 6, is the deployment of a plan for introducing instruments for energy
consumption data monitoring, represented in the example of Figure 6.
Figure 6: São Paulo, Plan to Introduce Instruments for Energy Consumption Data Monitoring
The introduction of instruments for energy consumption data monitoring is not
supposed to be a „one time‟ activity. The intention is to introduce an activity of continuous
improvement.
Test and results
For testing the applicability of the concept, three examples were used. The tool was
applied in the site productions of Knorr-Bremse Group, division of Commercial Vehicles
Systems, in the locations of Aldersbach (Germany), Bristol (UK) and São Paulo (Brazil).
Different results were achieved. In the case of Aldersbach it was possible to define
a plan for each large energy consumer, in the other hand the information handed for Bristol
did not allow an accurate verification of the situation, being not possible the Pareto
analysis. Considering this, the plan for Bristol was settled in a way to gather better
information for further analysis.

Executive Summary
x
São Paulo turned out to be an atypical situation, a new plant is being built and in
this case, the plan was established in order to avoid in the new plant the typical anomalies
that can occur and cause waste of energy.
Conclusion
The concept developed happens to be applicable and flexible. It can be used not
only to plan the installation of instruments for energy consumption data monitoring, but
also to continuously improve the monitoring, measurement and analysis of energy
consumption data.
General Conclusion
Apart from the conclusions reached applying the tools developed during this work,
important benefits for companies while implementing an energy management system, were
identified.
The benefits were categorized in three scopes described in Figure 7.
Internal External
Flaw's detection Bargaining power Sustainable thinking Stakeholders' attention
Identification of quick wins Better cost control Staff engagementAccordance with legal
issues
Overview of problems, which
require fast actionsPossibility of cost alignments
Nicer environment for
employees
Acces to external
environmental programs
Cost of energy usage Cost of energy contracts Organization's image
Summary of benefits implementing an Energy Management System
Figure 7: Summary of benefits
The reduction of costs applied to flaw‟s detection does not resume only in costs of
energy consumption, but also embraces general production costs, for example, the number
of scraps generated due failures in the processes.
Despite the necessity of investments and the not easily visible return these
investments can bring to an organization, an energy management system still demonstrates
to bring significant benefits to a company. Not mention the increasingly significance,
which has assumed in industrial scenarios, both to reduce costs and to sustain a positive
image before the stakeholders.
Further investigations are suggested, for instance the creation of a concept for
analysing purchasing processes and adapt them to the new reality about energy
consumption, and also the development of a model to assess cost-benefit of energy
metering practices, in order to continuously improve the energy management system.

Index
xi
INDEX
1 INTRODUCTION 1
1.1 PROBLEM STATEMENT 2 1.2 OBJECTIVES 2 1.3 METHODOLOGIES 3 1.3.1 MANAGEMENT SYSTEM STATUS EVALUATION 3 1.3.2 MONITORING, MEASURING AND ANALYSIS 4 1.4 OUTLINE 5
2 THE COMPANY KNORR-BREMSE GROUP 6
2.1 KNORR-BREMSE RAIL VEHICLE SYSTEMS DIVISION 7 2.2 KNORR-BREMSE SYSTEMS FOR COMMERCIAL VEHICLES DIVISION 9 2.3 KNORR-BREMSE ENVIRONMENTAL COMMITMENT 10
3 MANAGEMENT SYSTEM STATUS EVALUATION 12
3.1 LITERATURE REVIEW 12 3.1.1 SUSTAINABILITY 12 3.1.2 QUALITY MANAGEMENT SYSTEM 16 3.1.3 ENVIRONMENTAL MANAGEMENT SYSTEM 20 3.1.4 ENERGY MANAGEMENT SYSTEM 24 3.1.5 INTEGRATED MANAGEMENT SYSTEMS 29
3.2 METHODS AND INSTRUMENTS FOR STATUS VERIFICATION OF AN ENERGY MANAGEMENT
SYSTEM 31 3.2.1 PURPOSE OF DEVELOPING A CHECKLIST 31 3.2.2 COMPARISON BETWEEN INTERNATIONAL ENERGY MANAGEMENT AND ENVIRONMENTAL
MANAGEMENT STANDARDS 31 3.2.3 CHECKLIST FOR GAP ANALYSIS OF AN ENERGY MANAGEMENT SYSTEM 34
3.3 ANALYSIS OF RESULTS FROM CHECKLIST 37

Index
xii
4 MONITORING, MEASURING AND ANALYSIS 45
4.1 LITERATURE REVIEW 45 4.1.1 ENERGY CONSUMPTION SYSTEMS 45 4.1.2 BASICS FOR ENERGY MEASURING AND MONITORING 51
4.2 METHODS AND INSTRUMENTS: CONCEPT FOR IMPLEMENTING OR IMPROVING
EQUIPMENTS FOR ENERGY DATA COLLECTION 57 4.2.1 DEFINE THE PROCESSES AND THEIR BOUNDARIES 58 4.2.2 GATHERING OF INFORMATION 61 4.2.3 ANALYSIS OF ENERGY CONSUMPTION DATA COLLECTED 64 4.2.4 IDENTIFICATION OF OTHER FACTORS THAT SHOULD BE TAKEN IN CONSIDERATION 70 4.2.5 ANALYSIS OF EXISTING TOOLS 72 4.2.6 PLAN METERING AND MEASUREMENT 73
4.3 ANALYSIS OF RESULTS: USING THE CONCEPT FOR IMPLEMENTING OR IMPROVING
INSTRUMENTS FOR ENERGY DATA COLLECTION 79 4.3.1 PRODUCTION SITE ALDERSBACH (GERMANY) 79 4.3.2 LOCATION BRISTOL – UNITED KINGDOM 83 4.3.3 LOCATION SÃO PAULO - BRAZIL 86
5 CONCLUSIONS 90
5.1 MANAGEMENT SYSTEM STATUS EVALUATION 90 5.2 IMPLEMENTING OR IMPROVING ENERGY CONSUMPTION DATA INSTRUMENTS 94 5.3 EXPLORATION OF POSSIBLE BENEFITS IMPLEMENTING AN ENERGY MANAGEMENT
SYSTEM 96
6 REFERENCES 99
7 APPENDIX 103
7.1 APPENDIX I – CHECKLIST 103 7.2 APPENDIX II - CHECKLIST RESULTS 108 7.3 APPENDIX III - ENERGY SOURCES IDENTIFICATION, ALDERSBACH 114 7.4 APPENDIX IV - ELECTRICITY CONSUMPTION ANALYSIS – 2009 ALDERSBACH 115 7.5 APPENDIX V - ENERGY SOURCES IDENTIFICATION, BRISTOL 116 7.6 APPENDIX VI - ELECTRICITY CONSUMPTION ANALYSIS - 2009 BRISTOL 116 7.7 APPENDIX VII - ELECTRICITY CONSUMPTION ANALYSIS - 2009 SÃO PAULO 116 7.8 APPENDIX VIII – PLAN: METERING EQUIPMENT INSTALLATION / IMPROVEMENT 117 7.9 APPENDIX IX – COMPARISON OF RESULTS BETWEEN GROUPS 117

Figures
xiii
FIGURES
FIGURE 1: PART OF CHECKLIST CREATED ACCORDING TO ISO 50001:2009 (DRAFT VERSION) .......................... IV
FIGURE 2: RESULTS PER REQUIREMENT - BRISTOL ............................................................................................ IV
FIGURE 3: RESULTS PER REQUIREMENT - DALIAN .............................................................................................. V
FIGURE 4: REQUIREMENT 4.6.1 ........................................................................................................................... V
FIGURE 5: STEPS FOR IMPLEMENTING AN ENERGY CONSUMPTION MONITORING SYSTEM ............................... VII
FIGURE 6: SÃO PAULO, PLAN TO INTRODUCE INSTRUMENTS FOR ENERGY CONSUMPTION DATA MONITORINGIX
FIGURE 7: SUMMARY OF BENEFITS ..................................................................................................................... X
FIGURE 8: PART OF CHECKLIST CREATED ACCORDING TO ISO 50001:2009 (DRAFT VERSION) ........................... 4
FIGURE 9: KNORR-BREMSE STRUCTURE (SOURCE: KNORR-BREMSE WEBSITE) ................................................. 7
FIGURE 10: INTERNAL COMPONENTS FOR TRAIN (SOURCE: KNORR-BREMSE WEBSITE) ...................................... 8
FIGURE 11: EXTERNAL COMPONENTS FOR TRAIN (SOURCE: KNORR-BREMSE WEBSITE) .................................... 9
FIGURE 12: COMPONENTS FOR TRUCKS (SOURCE: KNORR-BREMSE WEBSITE) ................................................. 10
FIGURE 13: PROJECT LOGO (SOURCE: KNORR-BREMSE INTRANET) .................................................................. 11
FIGURE 14: SUSTAINABILITY (SOURCE: MCKINSEY) ........................................................................................ 13
FIGURE 15: MODEL OF A PROCESS ORIENTED QUALITY MANAGEMENT SYSTEM (SOURCE: ISO9001:2008) ... 19
FIGURE 16: PDCA CYCLE (SOURCE: WWW.JWSSOLUTIONS.COM, 2010) .......................................................... 20
FIGURE 17: ENVIRONMENTAL MANAGEMENT SYSTEM MODEL FOR ISO 14001 (SOURCE: ISO14001:2004) ... 22
FIGURE 18: EMAS LOGO (SOURCE: EUROPEAN COMMISSION WEBSITE, 2010) ................................................ 23
FIGURE 19: ENERGY SOURCES .......................................................................................................................... 25
FIGURE 20: RENEWABLE AND NON-RENEWABLE ENERGY (SOURCE: WWW.WINDY-FUTURE.INFO, 2010) ......... 25
FIGURE 21: ENERGY MANAGEMENT SYSTEM MODEL (SOURCE: ISO 50001 DRAFT VERSION) ......................... 28
FIGURE 22: INTEGRATED MANAGEMENT SYSTEM ............................................................................................ 30
FIGURE 23: PART OF CHECKLIST CREATED ACCORDING TO ISO 50001:2009 (DRAFT VERSION) ....................... 35
FIGURE 24: EXAMPLE – RESULTS OF REQUIREMENTS PER LOCATION (ALD) .................................................... 36
FIGURE 25: RESULTS PER REQUIREMENT - BRISTOL ......................................................................................... 38
FIGURE 26: FIELD FOR COMMENTS AND EVIDENCES (A) .................................................................................... 38
FIGURE 27: FIELD FOR COMMENTS AND EVIDENCES (B) .................................................................................... 39
FIGURE 28: FIELD FOR COMMENTS AND EVIDENCES (C) .................................................................................... 39
FIGURE 29: RESULTS PER LOCATION – REQUIREMENT 4.6.1 ............................................................................. 39
FIGURE 30: REQUIREMENT 4.4.1 ....................................................................................................................... 40
FIGURE 31: REQUIREMENT 4.4.6 ....................................................................................................................... 41
FIGURE 32: FIELD FOR COMMENTS AND EVIDENCES (D) .................................................................................... 41
FIGURE 33: REQUIREMENT 4.5.1 ....................................................................................................................... 41
FIGURE 34: REQUIREMENT 4.5.3 ....................................................................................................................... 42
FIGURE 35: REQUIREMENT 4.5.5 ....................................................................................................................... 42
FIGURE 36: REQUIREMENT 4.5.6 ....................................................................................................................... 43
FIGURE 37: REQUIREMENT 4.6.1 ....................................................................................................................... 43
FIGURE 38: OVERALL STEAM SYSTEM DEFINITION (SOURCE: MORVAY & GVOZDENAC, 2008) ...................... 46
FIGURE 39: COMPRESSED AIR SYSTEM DIAGRAM (SOURCE: SCALES AIR COMPRESSOR CORP.) ....................... 48

Tables
xiv
FIGURE 40: CONCEPTUAL SCHEME FOR COGENERATION SYSTEM (SOURCE: MORVAY & GVOZDENAC, 2008) 51
FIGURE 41: EXAMPLE OF SEASONALITY (SOURCE: MORVAY & GVOZDENAC, 2008) ........................................ 54
FIGURE 42: STEPS FOR IMPLEMENTING AN ENERGY CONSUMPTION MONITORING SYSTEM ............................. 58
FIGURE 43: ENERGY FLOW DIAGRAM ............................................................................................................... 59
FIGURE 44: BIG AREAS OF ENERGY CONSUMPTION ........................................................................................... 59
FIGURE 45: PRODUCTION – KEY PROCESS IDENTIFICATION ............................................................................... 60
FIGURE 46: EXAMPLE, PARETO CHART ............................................................................................................ 68
FIGURE 47: EXAMPLE, PARETO CHART 2 .......................................................................................................... 69
FIGURE 48: EXAMPLE, PARETO ANALYSIS ....................................................................................................... 69
FIGURE 49: PLAN TO INTRODUCE INSTRUMENTS FOR ENERGY CONSUMPTION DATA MONITORING ................. 74
FIGURE 50: EXAMPLE OF ENERGY COST CENTRES (ECC) ................................................................................ 77
FIGURE 51: SUMMARY OF THE FLOW OF THE ACTIVITIES .................................................................................. 78
FIGURE 52: ALDERSBACH – ELECTRICITY CONSUMPTION 2009 (SOURCE: KB INTRANET) ............................... 80
FIGURE 53: ALDERSBACH – PARETO ANALYSIS ............................................................................................... 81
FIGURE 54: ALDERSBACH, PLAN TO INTRODUCE INSTRUMENTS FOR ENERGY CONSUMPTION DATA
MONITORING ............................................................................................................................................ 82
FIGURE 55: BRISTOL – ELECTRICITY CONSUMPTION 2009 (SOURCE: KB INTRANET) ....................................... 84
FIGURE 56: BRISTOL – PLAN TO INTRODUCE INSTRUMENTS FOR ENERGY CONSUMPTION DATA MONITORING 86
FIGURE 57: SÃO PAULO - ELECTRICITY CONSUMPTION 2009 (SOURCE: KB INTRANET) ................................... 87
FIGURE 58: SÃO PAULO – PARETO ANALYSIS................................................................................................... 88
FIGURE 59: SÃO PAULO, PLAN TO INTRODUCE INSTRUMENTS FOR ENERGY CONSUMP. DATA MONITORING ... 89
FIGURE 60: RESULTS PER REQUIREMENT - BRISTOL ......................................................................................... 92
FIGURE 61: RESULTS PER REQUIREMENT - DALIAN .......................................................................................... 92
FIGURE 62: REQUIREMENT 4.5.1 FIGURE 63: REQUIREMENT 4.5.6 ............................................................. 93
FIGURE 64: REQUIREMENT 4.6.1 ....................................................................................................................... 93
FIGURE 65: SUMMARY OF THE FLOW OF THE ACTIVITIES .................................................................................. 95
FIGURE 66: SUMMARY OF BENEFITS ................................................................................................................. 97
TABLES
TABLE 1: COMPARISON BETWEEN THE INTERNATIONAL ENVIRONMENT AND ENERGY STANDARDS ................... III
TABLE 2: IDENTIFICATION OF ENERGY SOURCES AND CONSUMERS ................................................................ VIII
TABLE 3: ELECTRICITY CONSUMPTION ANALYSIS .......................................................................................... VIII
TABLE 4: KNORR-BREMSE HISTORY (SOURCE: KNORR-BREMSE WEBSITE) ....................................................... 6
TABLE 5: COMPARISON BETWEEN THE REQUIREMENTS OF EN 16001:2009 AND ISO 14001:2004 ................... 27
TABLE 6: COMPARISON BETWEEN THE REQUIREMENTS OF ISO 50001 AND EN 16001 ..................................... 29
TABLE 7: COMPARISON BETWEEN ISO 50001 AND ISO 14001 (A) ................................................................... 32
TABLE 8: COMPARISON BETWEEN ISO 50001 AND ISO 14001 (B) ................................................................... 33
TABLE 9: LOCATIONS OF KNORR-BREMSE CVS ............................................................................................... 37
TABLE 10: IDENTIFICATION OF ENERGY SOURCES AND CONSUMERS ............................................................... 61
TABLE 11: ENERGY CONSUMPTION DATA - ELECTRICITY ................................................................................ 63
TABLE 12: DATA THAT CAN BE COLLECTED IN THE MANUFACTURING SECTOR ................................................. 64

Tables
xv
TABLE 13: ENERGY CONVERSION FACTORS (SOURCE: BRITISH STANDARD INSTITUTE) .................................. 65
TABLE 14: EXAMPLE, IDENTIFICATION OF ENERGY SOURCES AND CONSUMERS .............................................. 66
TABLE 15: EXAMPLE, ENERGY CONSUMPTION DATA ....................................................................................... 67
TABLE 16: EXAMPLE, DATA FOR PARETO ANALYSIS........................................................................................ 68
TABLE 17: TYPICAL PROBLEMS THAT CAN CAUSE ENERGY WASTE (SOURCE: AUSTRALIAN GOVERNMENT,
2008) ........................................................................................................................................................ 71
TABLE 18: METERING CHARACTERISTICS ........................................................................................................ 72
TABLE 19: ELECTRICITY CONSUMPTION ANALYSIS (FINAL TABLE) .................................................................. 73
TABLE 20: BRISTOL – IDENTIFICATION OF ENERGY SOURCES AND CONSUMERS .............................................. 83
TABLE 21: BRISTOL – ELECTRICITY CONSUMPTION 2009................................................................................. 85
TABLE 22: SÃO PAULO – ELECTRICITY CONSUMPTION 2009 ............................................................................ 87
TABLE 23: COMPARISON BETWEEN THE REQUIREMENTS OF ISO 50001 AND ISO 14001 .................................. 91

Introduction
1
1 INTRODUCTION
As an economy grows, demand for energy increases. According to the Reference
case projection from the International Energy Outlook of 2009 (IEO 2009) it was predicted
a rise of 44% in energy consumption between 2006 and 2030, driven by economic growth
in developing countries.
The results changed in the forecast of the Reference case projection presented in
2010, showing a rise of 49% in the marketed energy consumption by 2035, increasing
mainly in non-OECD1 countries.
Along with the increase of energy consumption it was also projected a growth of
43% energy-related carbon dioxide emissions. These considerable figures turn everyone‟s
attention to the urgent need to reduce energy consumption, and what was an issue for large
energy consumers, has become of interest to all industries, bringing more weight to the
subject „energy efficiency‟.
Importance of energy efficiency lies in the fact that it ensures provision of same
level of energy using fewer amounts of resources. Due to the rising demand and limited
availability of resources, the whole world has become aware of the relevance of energy
efficiency, which also helps in reducing energy consumption and costs.
Organizations‟ concern, related to energy and climate change issues, has growing
significantly in the last years, not only because of their impacts in costs and governmental
legislations, but also because they are calling the attention of several stakeholders and
affecting the company‟s image.
Companies are resorting to various instruments to guide them to direct their efforts
regarding energy issues, among them are national standards and guides.
In the last years, several countries launched their own guidelines with the intent to
start changing the critical situation of energy, in Europe the requirements of the European
standard EN 16001:2009 have already been applied in several companies.
International Organization for Standardization (ISO) also realized the need for
effective energy management and started working in a new international standard, which
should come out the beginning of 2011. The standard shall be known as ISO 50001:2011
and can already be found in its draft version, ISO 50001:2009.
This thesis regards the importance of an Energy Management System as a value
adding activity, not only as a significant potential to save energy and reduce costs, but also
1 Organization for Economic Co-operation and Development

Introduction
2
because of its role in reducing greenhouse gas (GHG) emissions and other environmental
impacts.
1.1 Problem Statement
The current need for companies to improve their processes in terms of energy
efficiency, first to be competitive and further to be social responsible and environmentally
friendly, conduce to the necessity of implementing actions that lead to proper management
of resources, by monitoring, control and verification of the aspects that characterize energy
consumption.
Considering the rising costs of energy in industrial processes, the growing concern
with the shortage of energy resources and the significant increase of GHG emissions, it
was verified the importance of developing an Energy Management System inside a
company.
The use of management system as a tool to fulfil these needs, specify the
requirements necessary for a company to develop and implement policies and objectives
taking into account legal issues and relevant information that have to be considered.
From the urgency to reduce consumption of fossil fuel, GHG emissions and at the
same time to promote energy efficiency and the use of renewable energy sources, the
International Organization for Standardization started developing the ISO 50001, which
will provide management system requirements combined with guidance for use,
implementation, measurement and metrics.
For starting guiding the implementation of an Energy Management System it was
chosen the international standard ISO 50001:2009 (draft version).
1.2 Objectives
The main objective of this thesis is to give an orientation for starting the
implementation of an Energy Management System and it was divided into three specific
objectives, first of all the comparison between environmental and energy management
standards, taking into account that their similarities can shorten the path and diminish costs
in implementing a second standard in organizations that already have applied one of them.
From the ISO 50001:2009 (draft version), develop a status analysis tool, a checklist
to verify the fulfilment of ISO 50001:2009 (draft version) requirements by an organization,
with the intent to know how far a company is to complete the implementation of an Energy
Management System.
Based in the results of the status evaluation (checklist), indentify the gaps or
weaknesses in the process and develop a concept or tool to facilitate starting the
implementation of the Energy Management System.

Introduction
3
The developed tools were tested inside the Knorr-Bremse Group, division for
Commercial Vehicles System, in this way the decision about the tool developed to
accomplish the third specific objective, is based on the results of the status evaluation of
this company.
1. Comparison between international energy and environmental management
standards;
2. Status evaluation tool, checklist;
3. Analysis of status evaluation and development of a concept to further
implement energy consumption data monitoring instruments.
Even identifying more than one gap in the analysis of the status evaluation, only
one is chosen, according to its relevance, to be further exploited in this paper
1.3 Methodologies
The paper was divided in two main parts, Management System Status Evaluation
and Monitoring, Measuring and Analysis.
1.3.1 Management System Status Evaluation
In the first part it was developed the comparison between ISO 14001:2004 and ISO
50001:2009 (draft version) using an excel table (see Tables 4 and 5). The table has four
columns, being:
1. Item: describing the point compared in that line;
2. ISO 14001:2004 EMS, explaining how the standard works for the
Environmental Management System;
3. ISO 50001:2009 (draft version) EnMS, explaining how the standard works
for the Energy Management System;
4. Remarks: observations about the comparison made in a specific line.
The column „Item‟ presents 29 points, most of them based in the requirements of
the standards and the others related to its characteristics such as concept, scope, control
degree and so on.
After that, a checklist was developed, based on the requirements of ISO 50001:2009
(draft version) and the analysis of the comparison, as observed in the Figure bellow.
Introduction
4
Status evaluation for the implementation of LOCATION: please enter here location name
an Energy Management System according to DATE: DD.MM.YYYY
ISO 50001 draft NAME: please enter here contact person
No
t F
ulf
illed
Par
t ly
Fu
lfil
led
no
t
app
licab
le
4.1 General requirements 0%
1Has the organization defined an Energy Management System
accordingly to ISO 50001?0
4.2 Management responsibility (4.2.1/ 4.2.2) 0%
1
Has the organization defined an energy management representative
(energy manager) and defined their roles, responsibilities and
authorities?
0
2
Are the specialized skills, human, financial and technological
resources necessary for energy management identified and provided
by the board?
0
4.3 Energy policy 0%
1Has the board defined in writing a policy, which includes also a
commitment to continuous improvement of energy efficiency?0
2Does the policy show a commitment to achieve the energy
management objectives and to reduce energy related emissions?0
3 Is the policy available to internal and external public? 0
Please use 'x' in evaluation box
Comments to explain the evaluation i.e. evidences
rating
score
and inter-
mediate
results
(%)
Req.
NoElement Requirement Questions
Evaluation
Figure 8: Part of Checklist created according to ISO 50001:2009 (draft version)
The checklist was tested in 17 different sites of Knorr-Bremse Group, division for
Commercial Vehicles Systems, two of them without ISO 14001:2009 certification.
1.3.2 Monitoring, Measuring and Analysis
As a result from the status analysis, the „Monitoring, Measuring and Analysis‟ was
chosen as a critical point deserving further development in this paper, composing the
second part.
For this point it was decided to develop a concept, or model, to introduce
instruments for energy consumption data monitoring . The model was divided in six parts:
1. Definition of processes and their boundaries;
2. Gathering of information;
3. Analysis of data collected;
4. Analysis of additional factors;
5. Analysis of existing tools; and
6. Plan and measure.
The concept was tested in three different locations: Aldersbach (Germany), São
Paulo (Brazil) and Bristol (UK), with the intention to observe its applicability.

Introduction
5
1.4 Outline
This academic paper is divided into two main parts, each one with three other
subparts, which are literature review, methods and instruments and analysis of results.
The first part is Management System Status Evaluation that makes a comparison
between two international management standards and its implementation in the
organization. In its literature review subjects related to management systems and
international environmental policies are covered.
The second section is Monitoring, Measuring and Analysis and describes a concept
for installing or improving energy consumption data monitoring instruments inside the
organization. Its literature review describes some energy consumption systems inside an
industry and presents some basics for understanding energy monitoring.
The instruments developed in each part of the paper were tested in the real case of
Knorr-Bremse Group, division for Commercial Vehicle Systems. Further chapters are
introduction, presentation of the company and conclusions.

The Company Knorr-Bremse Group
6
2 THE COMPANY KNORR-BREMSE GROUP
The Knorr-Bremse Group is the world‟s leading manufacturer of braking systems
for rail and commercial vehicles that has operated in the field for over 100 years.
Other lines of business include automatic door systems for rail vehicles air
conditioning systems and torsional vibration dampers for internal combustion engines.
In the fiscal year of 2009, the Knorr-Bremse Group achieved sales of EUR 2.76
billion, in contrast with the EUR 3,38 billion of the previous year. The group employed
around 15.000 people in over 60 locations in 25 countries.
The Table below gives an overview about the history of the company.
Table 4: Knorr-Bremse History (Source: Knorr-Bremse website)
Knorr-Bremse History
1905 Knorr-Bremse GmbH founded in Berlin by Georg Knorr.
1910
1924
Development of air brakes for freight trains turns Knorr-Bremse into the largest European
brake manufacturer for rail vehicles.
1922 Development of air brakes for commercial vehicles commences
1931
1939
The Hildebrand-Knorr (HiK) braking system is used for express trains in 17 countries. 90%
of all German trucks in the 7-16 t range are fitted with Knorr breaking systems
1945
1953
Development and manufacture of braking systems begins again in the western part of
Germany, with the main emphasis on the HiK system. Berlin plant is confiscated after
WWII, company headquarters are relocated to Munich.
1985
1993
During a difficult phase in the company's development, Heinz Hermann Thiele acquires a
majority share in Knorr-Bremse and launches a radical restructuring program and becomes
a global player.
The AAR DB60 control valve gains Knorr-Bremse access to the North American market.
1996 Series production of pneumatic disc brakes for commercial vehicles begins.
1999 Robert Bosch GmbH merges its activities in the electronic brake control sector with Knorr-
Bremse Commercial Vehicle Systems. Knorr-Bremse takes a 60% share, giving it overall
managerial control of the joint venture; Bosch retains a 20% share.
2002 Knorr-Bremse takes over from Honeywell International Inc., USA its share of joint
ventures in Europe, Brazil and the USA. Bendix Commercial Vehicle Systems becomes a
subsidiary of Knorr-Bremse AG. The Knorr-Bremse Group achieves sales of EUR 2.1
billion for the first time.
2005 Centenary of operation.
2008 Joint ventures in the Chinese and Russian markets.

The Company Knorr-Bremse Group
7
Knorr-Bremse is structure based in two corporate divisions: Commercial Vehicles
Systems and Rail Vehicle Systems. Within each division resides a set of Business Units
(BU) and these Business Units are divided into Centres of Competence (CoC) and central
support functions.
Centres of Competence are departments that cluster a group of product and have
their own head of department, purchase and development areas.
The structure leads to a flexible product- and system-oriented approach, the figure
below shows the presence of Knorr-Bremse in four different regions.
Figure 9: Knorr-Bremse Structure (Source: Knorr-Bremse website)
2.1 Knorr-Bremse Rail Vehicle Systems Division
The division „Rail Vehicle Systems‟ is formed by the following Competence
Centres:
Hydraulics;
Brake Control;
Air Supply;
Bogie Equipment;
Platform Screen Doors;
Toilets; and
Zelisco, subdivided into three areas:
o Medium-voltage instrument transformers;
o Signalling systems for roads and railways; and
o Traffic management systems for the public traffic.

The Company Knorr-Bremse Group
8
Apart from the seven CoCs the division has six associated companies:
Westinghouse: manufacture, installation and maintenance of platform screen systems.
Merak: specialized in design and production of heating, ventilation and air conditioning
equipment for railway vehicles.
IFE (Innovation for Entrance Systems): manufacturer of Automatic Door Systems for
Railway Vehicles.
Microelettrica Scientifica: electromechanical and electronic components for rail
vehicles, traction power and industrial applications.
Rail Services: maintenance, overhaul and repair of brake systems and on-board systems
of rail vehicles. Rail Services provides the ideal tailor made service package for every
requirement, whether for freight wagons, tramways, metros or for locomotives and
high-speed trains.
New York Air Brake: is a supplier of innovative train control systems for the American
railroad industry.
In the Figure 10 and Figure 11 it is possible to identify the presence of Knorr-
Bremse in the rail industry.
Figure 10: Internal components for train (Source: Knorr-Bremse website)

The Company Knorr-Bremse Group
9
Figure 11: External components for train (Source: Knorr-Bremse website)
2.2 Knorr-Bremse Systems for Commercial Vehicles Division
Knorr-Bremse Commercial Vehicle Systems (CVS) is a leading worldwide supplier
of medium and heavy-duty vehicle braking systems, active vehicle safety systems, and
other related components. The division is organized as follow:
BU 1 - Air Supply; comprising the following CoCs:
o Compressors: compressed air provides the basic „energy‟ for all commercial
vehicle air braking and suspension systems.
o Dampers: reduce torsional vibrations in crankshafts, camshafts, and injection
pumps, prevent noise and thereby guarantee a long and reliable engine
performance.
o Air Treatment: for optimum performance and protection of the pneumatic
systems, the compressed air must be dried, regulated and distributed efficiently.
BU 2 - Brake Control; having the CoCs:
o Electronic Systems: in braking and suspension systems, electronics can provide
not only Antilock functions but full Electronic Braking Systems and Systems to
control coupling forces, vehicle stability and suspension levelling.
o Valves: control the supply of compressed air to the braking actuators and
suspension below.
BU 3 - Wheel Brake; encompasses the CoCs:
o Drum Brakes.

The Company Knorr-Bremse Group
10
o Actuators: by utilizing the energy of compressed air or a mechanical spring,
Brake Actuators provide the input force to operate the braking mechanisms at
each level.
o Disc Brakes: provide a highly efficient means of converting the output force of
the Brake Actuator to a braking torque at the wheel.
Bendix: compressors, valves, ABS, stability systems, driver assistance systems, and
industry standard air dryers, total foundation brake coverage through Bendix Spicer
Foundation Brake (joint venture with Dana Corporation).
Hasse & Wrede: develops, manufactures and markets Visco-Dampers for combustion
engines for automotive, naval and stationary applications. Visco-Dampers balance out
torsional vibrations, preventing crankshaft cracks, and thus ensure safe reliable motor
operation.
An example of the products of Knorr-Bremse for the truck industry can be observed
in the Figure 12.
Figure 12: Components for trucks (Source: Knorr-Bremse website)
2.3 Knorr-Bremse Environmental Commitment
Energy is becoming increasingly costly and raw materials ever scarcer, the Knorr-
Bremse group started doing its bit by launching in 2009 the ECCO2 initiative.
The new ECCO2 project initiative for saving energy and resources is designed to cut
costs long-term and to make an important contribution to the environment. Constant
Actuators
Disk Brakes Electronic Systems
Valves
Air Treatment Compressors

The Company Knorr-Bremse Group
11
improvements in the company‟s ecological balance sheet and innovative, energy-efficient
products will help to secure and strengthen Knorr-Bremse‟s competitive position.
ECCO2 is an energy- and resource-saving project and stands for Efficient Cut of
CO2; the logo of the initiative is shown in the figure below.
Figure 13: Project logo (Source: Knorr-Bremse intranet)
In the long term, increasing worldwide shortages will make the use of energy and
natural resources more critical in environmental terms and more expensive in financial
terms. The stakeholders are therefore calling for continuous improvements in the
ecological balance sheets of companies. Stricter legislation is expected in several countries
in the fields of climate protection, energy management and use of resources.
The easy-to-remember 20/20/202 formula, based on the climate targets agreed by
the EU at the beginning of 2008, is the basis for the ECCO2 initiative. It is translated inside
the company as improving energy efficiency across the group by 20 per cent in order to
achieve a 20 per cent reduction in carbon dioxide emissions by 2020. (20 per cent related
to data from 2009)
The ECCO2 initiative should be supplemented in the long term by an energy
management system, which can be identified as a priority focus because of the significant
potential to save energy and reduce greenhouse gas (GHG) emissions.
Summarizing, it is possible to say that the ECCO2 initiative aims:
To increase the energy efficiency by 20% until 2014 related to 2009;
To reduce the emissions of CO2 by 20% until 2014 related to 2009;
To reduce costs;
To introduce a systematic energy management;
To raise environmental awareness of all Knorr-Bremse employees.
For achieving this targets, all Knorr-Bremse locations should make a contribution to
climate protection, help to contribute to the necessary reduction of costs and strengthen its
future competitiveness.
The involvement of all the group‟s sites and operations around the world and the
awareness of the importance of improving energy and resource efficiency, not only benefit
the environment, but also contribute to the group‟s long-term competitive ability.
2 The EU Clima and Energy Package, European Commission, Jan. 2008

Management System Status Evaluation
12
3 MANAGEMENT SYSTEM STATUS EVALUATION
3.1 Literature Review
This literature review starts with a broader view, describing sustainability and
climate policies in some countries, since nowadays these subjects are related to energy
consumption an greenhouse gas emissions.
In addition, this secion provides an insight of management systems, its roots and
some of the standards and tools recognized in Europe and internationally. Management
systems are frameworks for managing and continually improving an organization‟s
policies, processes and procedures.
An energy management system has the same intention of the other management
systems, however regarding energy consumption issues.
3.1.1 Sustainability
One of the most widely accepted definition for sustainability is that found in the
Brundtland Report (UN, 1987): “Sustainable development is development that meets the
needs of the present without compromising the ability of future generations to meet their
own needs.”
A significant event that marks the first step toward sustainability was the 1972
United Nations Conference on the Human Environment in Stockholm, Sweden. “This
global forum began the attempt to find positive links between environmental concerns and
economic issues such as development, growth and employment”. (Edwards, 2006)
However the emergence of sustainability in its contemporary forms have roots in
1983 in the UN‟s creation of The World Commission on Environment and Development,
headed by Gro Harlem Brundtland, former prime minister of Norway.
Giving sequence to the main events related to sustainability, held in 1992 in Rio de
Janeiro, Brazil, the United Nations Conference on Environment and Development
(UNCED), also known as the Earth Summit.
“Those attending the Earth Summit agreed to the 27 principles on environment and
development of the Rio Declaration - which “made it plain that we can no longer think of
environment and economic and social development as isolated fields”- and adopted a
global program for action on sustainable development through Agenda 21 (…)” (Edwards,
2006)

Management System Status Evaluation
13
With the signing of Agenda 21, the international community has committed itself to
promote the transition to sustainable development in industrialized and developing
countries.
In 1997 the „Kyoto Protocol‟, named after the Kyoto conference, was signed by
several countries. It entered into force in 2005 and expires in 2012. The Kyoto Protocol is a
supplement to the United Nations Framework Convention on Climate Change (UNFCCC).
The UNFCCC is a part of the negotiation results of the UNCED of 1992. The protocol
provides for reducing the GHG emissions of industrialized countries in 5,2% a year,
between 2008 and 2012.
At the UN Climate Conference in Copenhagen in 2009 should be found a
replacement for the Kyoto Protocol that expires in 2012. Since no regulation could be
adopted, the aim is to do this at the UN Climate Change Conference 2010 in Mexico.
The basis of contemporary sustainability, as stated by Edwards (2006), is also
known as the Three Es, which are: ecology/environment, economy/employment and
equity/equality. The author also suggests a „plus one‟ adding education in the list. In his
opinion, “Through education we gain knowledge with which to overcome the cognitive
and normative – and hence emotional – obstacles to understanding our global dilemma.”
Figure 14: Sustainability (Source: McKinsey)

Management System Status Evaluation
14
Sustainability is considered an important issue for an organization. In the research
made by McKinsey in 2010 (Figure 14), it is possible to identify the different reasons why
companies are investing in sustainability, such as building or managing a corporate
reputation or seeking new growth opportunities through sustainable activities.
Inside organizations, in some cases, the concern with sustainability is closely
related to the issues of social responsibility.
3.1.1.1 Corporate Social Responsibility
Corporate Social Responsibility is defined by Kotler & Lee (2005) as “… a
commitment to improve community well-being through discretionary business practices
and contributions of corporate resources”.
In other words it is possible to state that Corporate Social Responsibility represents
a responsible and sustainable corporate conduct, a voluntary business contribution to
sustainable development that goes beyond the legal requirements.
The International Organization for Standardization plans to publish in 2010 a
standard providing guideline for social responsibility. It will be identified as ISO
26000:2009 and it will not include requirements, therefore will not be a certification
standard.
3.1.1.2 Climate Policies
The chapter about sustainability shows at the beginning the international concern
with the environment in general, the following topics give an overview of what has been
done by some big players regarding GHG emissions and energy consumption.
3.1.1.2.1 European Climate Policy
In 1995 was written the White Paper “An Energy Policy for the European Union”,
in which three fundamental goals were defined: competitiveness, security of energy supply
and environmental protection, this goals have been replicated in the subsequent years.
For the achievement of the goals, the first step was the submission of the White
Paper “Energy for the Future: Renewable Sources of Energy”, adopted in November 1997.
In that document the European Commission decided for a “… objective of 12% for the
contribution by renewable sources of energy to the European Union‟s gross inland energy
consumption by 2010.” against a value of 6% from 1995.
This objective was further formalized in the Directive 2001/77/EC, “Promotion of
electricity produced form renewable energy sources in the internal electricity market”,
where reaffirms the non-binding nature of the objective.

Management System Status Evaluation
15
After those directives two other important steps were taken, the Directive
2003/30/EC “Promotion of the use of bio fuels or other renewable fuels for transport” and
Directive 2003/87/EC “Establishing a scheme for greenhouse gas emission allowance
trading within the Community and amending Council Directive 96/61/EC”.
In 17th December 2008, the European Parliament launched an Energy and Climate
Package that proffered ample occasion for discussion.
Overall, the package includes six areas of regulation, including the revision of the
Directive 2003/87/EC, this directive defines the European emissions trading for the third
trading period (2013 to 2020). As part of the climate package, the Parliament confirmed
the EU commitment to reduce GHG emissions by 2020 compared to 1990 at least 20
percent and 30 percent, if another developed countries commit themselves to comparable
emission reductions.
The package, adopted in 2009, focuses on three areas: emissions cuts, renewables
and energy efficiency, where the overall targets can be summarized in 20% cut in
emissions of GHG by 2020, compared with 1990 levels; a 20% increase in the share of
renewables in the energy mix; and a 20% cut in energy consumption.
3.1.1.2.2 Chinese Climate Policy
In May 2009, China defined its basic position for climate negotiations in
Copenhagen in December 2009. Thereafter industrialized countries, among other things,
have to reduce emissions of greenhouse gases by 40% by 2020, with reference to 1990,
while developing countries and emerging economies should reduce within their national
capacities and needs, as well as sustainable development. The People's Republic of China,
which sees itself as a developing country, confirmed this position in August 2009 and
declared to reduce its carbon intensity until 2020 in 40 to 45 percent over 2005. This is not
an absolute reduction target, as the Chinese government does not want to jeopardize the
country's economic growth.
The Chinese market for environmental technologies can reach until 2013 a volume
of 500 billion USD to 1,000 billion USD or respectively 15 percent of Chinese gross
domestic product. This as a result from “China Greentech Report 2009”, presented for the
public by the China Greentech Initiative in 10th September 2009. The report focuses on the
areas of energy, energy supply, buildings, transport, industry and water. The China Green
Initiative is a consortium of 80 companies, which are leaders in their technological sector.
3.1.1.2.3 Climate Policy in USA
The US House of Representatives approved the energy and climate legislation in
26th June 2009, but a draft for the US Climate Protection Legislation is still being
discussed in the US Senate. The presentation of the House of Representatives consists of

Management System Status Evaluation
16
around 1300 pages and is divided into four chapters (clean energy, energy efficiency,
reduction of greenhouse gases and the transition into a clean energy economy).
At the beginning of the UN World Climate Change Conference in Copenhagen, the
U.S. Environmental Protection Agency (EPA) declared six greenhouse gases as harmful,
including CO2, and announced that a regulation for their emissions is necessary.
EPA can assess the GHG emission through the Clear Air Act of 1990, according the
decision of the U.S. Supreme Court in 2007.
This official assessment of EPA is a formal condition that the U.S. government may
adopt if necessary, without the consent of the Climate Protection Laws from the U.S.
Congress. EPA regulations maybe different than laws, they can be changed, for example,
after a change in the government.
The focus of the U.S. government is more on the ongoing legislative procedure with
binding reduction targets and a national Emission Trade System.
In the UN Climate Conference in Copenhagen, the USA announced a reduction of
17% of their GHG Emissions until 2020 over 2005, what corresponds to a reduction of 3 to
4 percent over 1990.
3.1.2 Quality Management System
The Quality Management can be considered as a collection of activities that
organizations use to direct, control and coordinate quality.
“A Quality Management System is the organizational structure of responsibilities,
activities, resources and events that together provide procedures and methods of
implementation to ensure the capability of an organization to meet quality requirements.”
(Tricker & Lucas, 2005)
The Quality Management System can also be described as a set of tolls, process and
procedures that a company applies to ensure that customer satisfaction and quality
requirements are met or exceeded. It provides a platform for continual improvement of
company performance.
3.1.2.1 Historical Background
The advent of industrialization is considered by different authors as the starting
point for quality assurance as a critical step in the production process.
According to Sallis (2002) before the industrialization craftsmen set and maintained
their own standards, on which their reputation and livelihoods depended. The start of the
mass-production changed the emphasis completely. The individuals were no longer
responsible for the manufacturing of the whole product and this, took away from the
worker the possibility of self-checking quality.

Management System Status Evaluation
17
At this moment, the specialized function of inspection conduced by individuals not
directly involved in the production process took the place of the inspection by a skilled
craftsman.
Vasconcelos (2004) mentioned that specialization of labour and quality assurance
took a giant step forward in the late 1800s, when Frederick Taylor developed his system of
scientific management, which emphasized productivity at the expense of quality. Taylor
separated the planning from the execution and put the quality assurance in the hands of
inspectors.
Graves et al. (1993) identifies the beginning of the modern scientific quality
management with the creation of a method for quality control for production, using
statistical methods, proposed by Walter A. Shewhart in 1924.
According to Arcaro (1995) Shewhart‟s work was later developed by Deming, who
recognized that a statistically controlled management process gave the manager a
newfound capability to systematically determine when to intervene and, equally important,
when to leave a process alone.
Arcaro (1995) stated that Deming applied statistical process control methods in the
United States during the World War II, achieved successful quality improvements in the
manufacture of munitions and other strategically important products.
The Department of Trade and Industry (UK, 2000) points out that the early work of
Shewhart, Deming, Dodge and Romig constitutes much of what today comprises the
theory of statistical process control (SPC).
After the World War II, Japan decided to make quality improvements to rebuild
their economy and required the help of Shewhart, Deming and Juran amongst others. The
Japanese developed the ideas of Juran and Deming into what they call Total Quality
Control (TQC).
In 1951, the Union of Japanese Scientists and Engineers (JUSE) instituted the
Deming Prize to reward individuals and companies who meet stringent criteria for quality
management practice.
Vasconcellos (2004) brings up that in the early 1960 the Japanese contribution to
quality came from Genichi Taguchi, who developed the Quality Loss Function, and Kaoru
Ishikawa, who developed, for example, the cause-and-effect diagram as a device to assist
groups or quality circles in quality improvement.
Improvements in Japanese quality were slow and steady, around 20 years passed
until the quality of Japanese products exceeded that of Western manufacturers and by the
1970s Japanese companies‟ penetration into Western markets was significant, mostly as a
result of the higher quality levels of their products.
“With the 80s came a radical change. It should not just product quality but also the
entire process chain from the supplier are tested up to the customer. This was no longer a

Management System Status Evaluation
18
purely technical problem, but also a management task, in which many managers and
employees were involved.” (Evans, 2008)
Evans (2008) states that as organizations began to integrate quality principles into
their management systems, the concept of total quality management (TQM) became
popular.
In 1987 the Malcom Baldrige National Quality Award was established in the USA.
Vasconcellos (2004) mentions the award as “…one of the most important factors
for the transformation of American business; the award criteria have evolved to become a
national standard, providing a framework any organization can use to achieve superior
competitiveness.”
In 1988 the presidents of 14 major European companies founded the European
Foundation for Quality Management (EFQM). According to Thorpe & Sumner (2004), the
idea was to develop an European framework along the lines of the Malcom Baldridge
Model in the USA and the Deming Prize in Japan, since these awards have demonstrably
improved service and manufacturing quality in the organizations that used them.
Nowadays the Deming Prize, the Malcom Baldridge Model and the EFQM are the
most known business excellence models, they provide a stimulus to companies to develop
quality improvement initiatives and demonstrate sustainable superior performance in all
aspects of the business.
The quality concern in the companies grew from simple control activities,
predominant in the 1940s, 1950s, and 1960s, to quality engineering in the 1970s and
finally to quality systems in the 1990s, which are taking into account the whole business
activity.
3.1.2.2 International Organization for Standardization (ISO)
ISO was established in 1946 from two organizations: the ISA (International
Federation of the National Standardizing Associations) and the UNSCC (United Nations
Standards Coordinating Committee).
The intention was to create a new international organization, of which the object
would be to facilitate the international coordination and unification of industrial standards.
The name ISO, derived from the Greek isos (equal), was chosen with the intention
to unify the short form of the organization‟s name worldwide, since the use of different
acronyms would be possible (“IOS” International Organization for Standardization; “OIN”
Organisation Internationale de Normalisation).
The ISO (2010) states that so far about 8800 standards were created and published.
Among them the standards of ISO 9000 family, which are applied in about over 129
countries.

Management System Status Evaluation
19
3.1.2.3 ISO 9000 for Quality Management
In May 1987, after seven years of preparatory work, the ISO 9000:1987 was
introduced.
In accordance with Hutchins (1997), the ISO 9000 evolved from different existing
standards, among them the military quality standard from 1963, MIL-Q 9858A, the NATO
quality standard, AQAP 1 and the British quality standard, BS 5750.
ISO 9000 primarily exists to give the customer confidence that the product or
service being provided will meet certain specified standards of performance and that the
product or service will always be consistent with those standards. (ISO, 2010)
The ISO 9000 family is comprised of the following elements:
ISO 9000:2005 Quality Management Systems – Fundamentals and Vocabulary
ISO 9001:2008 Quality Management Systems – Requirements
ISO 9004:2009 Quality Management System – Guidelines for Performance
Improvements
The new model described in ISO 9001:2008 requires a process-oriented approach,
as shown in Figure 15.
According to ISO 9000 (clause 2.4), a process approach considers the interaction
between process, inputs and outputs that tie the processes together, where the output of one
process is often an input to another.
Figure 15: Model of a Process Oriented Quality Management System (Source: ISO9001:2008)
The intention of the ISO 9000 is to promote process approach in the management of
a company, however any company can decide to make changes (or exclusions) if, at the
end, the operational requirements are met.

Management System Status Evaluation
20
Borror (2009) states that the requirements of the Quality Management System are
divided into: Management Responsibility, Resource Management, Product Realization and
Measurement, Analysis and Improvement.
Ernst (2008) says that the above represented model can be identified as a
representation of PCDA Cycle, also known as Deming Cycle.
3.1.2.3.1 Deming Cycle
According to Campbell & Craig (2005) the PDCA cycle, represented in Figure 16,
was at first developed by Walter Shewhart, but it was popularized by Edward Deming,
who promoted the cycle as an effective continuous improvement tool.
Figure 16: PDCA Cycle (Source: www.jwssolutions.com, 2010)
They refer to the PDCA cycle as a checklist of the fours stages to be addressed in
facilitating processes from „problem facing‟ to „problem solving‟ situations:
Plan: planning of components of a process, in order to improve the results.
Do: execution of necessary actions, conform concepts established in the
planning phase.
Check: monitor results, according to pre-defined criteria, to know if the
changes are working.
Act: analysing the gains, if successful or deciding about important changes
to improve the process.
When the Act stage is achieved the attention moves again to the Plan stage, giving
the PDCA cycle the characteristics of continuous improvement.
3.1.3 Environmental Management System
After the Quality Management System another important and widely used
instrument is the management system for an organization‟s environmental program.
Environment is defined by the International Standards Organization (2010) as the
“…surroundings in which an organization operates, including air, water, land, natural
resources, flora, fauna, humans, and their interrelation”.
Management System Status Evaluation
21
“Environmental Management should consider the relevant legislation, regulation
and standards and should aim at achieving environmental compliance, controlling and
reducing pollution and environmental impacts from resource use in industrial operations.”
(Morvay & Gvozdenac, 2008)
Coglianese & Nash (2001) wrote that the Environmental Management System
should consist of a regulatory structure that arises from within an organization and not like
public regulations, which impose requirements from the outside.
According to the Institute of Environmental Management and Assessment (IEMA,
2010) an Environmental Management System (EMS) is a structured framework for
managing an organization‟s significant environmental impacts.
The following statements are mentioned as parts of this framework:
Environmental policy;
Environmental impact identification;
Objectives and targets;
Consultation;
Operational and emergency procedures;
Environmental Management Plan;
Documentation;
Responsibilities and reporting structure;
Training;
Review audits and monitoring compliance;
Continual improvement.
Pinero (cit. in Harrisson, 2007) stated that environmental management is a broader
term that also encompasses the organization‟s overall culture, commitment, and approach
to achieve performance goal.
3.1.3.1 Environmental Management System Standard – ISO 14000
The International Organization for Standardization (ISO, 2004) explains an
Environmental Management System as that “... part of the overall management system that
includes organizational structure, planning activities, responsibilities, practices,
procedures, processes and resources for developing, implementing, achieving, reviewing
and maintaining the environmental policy”.
For an Environmental Management System to work successfully, several conditions
have to be satisfied, Morris (2004) suggests basically the following requirements: the
orientation towards prevention of the occurrence instead of merely fault detection, the
awareness and engagement of all employees in all levels, the designation of an EMS
manager, the evolution and development of environmental management procedures over
the time (in technological and regulatory terms) and the necessity of measurement.

Management System Status Evaluation
22
These general principles orientating the establishment of an efficient EMS have
been developed over a number of years, and national standards, such as the British
Standard BS 7750 existed before the publication of ISO 14001 and contained many of the
clauses and recommended procedures that are now included in ISO 14001.
“Thus, ISO 14001 has resulted from the international community getting together
under a technical committee set up by the International Standards Organization and
agreeing a common international standard that now supersedes the earlier national ones.”
(Morris, 2004)
According to the International Standards Organization (2010):
“ISO 14001:2004 specifies requirements for an environmental management
system to enable an organization to develop and implement policy and objectives
which take into account legal requirements and other requirements to which the
organization subscribes, and information about significant environmental
aspects. It applies to those environmental aspects that the organization identifies
as those which it can control and those which it can influence. It does not itself
state specific environmental performance criteria.”
The ISO 14001 is based, such as the ISO 9001, on the Deming Cycle, i.e. Plan, Do,
Check and Act (optimize). This process, represented in the Figure 17, is intended to ensure
the continuous improvement of the environmental management system.
Figure 17: Environmental Management System Model for ISO 14001 (Source: ISO14001:2004)
Management System Status Evaluation
23
3.1.3.2 Eco-Management and Audit Schemes (EMAS)
The Eco-Management and Audit Scheme also known as EMAS is a voluntary
environmental management tool active since 1995, which allows a better management of
environmental issues and credible information on these issues.
This tool aims to help companies and other organizations in evaluating, reporting
and improving their environmental performance, focusing the continual improvement.
The core elements of EMAS are:
Performance: carrying out annual updates of environmental policy targets
and actions to implement and evaluate these targets;
Credibility: third party verification from independent auditors guarantees
the value of both actions taken and disclosed information;
Transparency: environmental statement provides information to the public
on environmental impact and performance of the organization.
Organizations operating in all economic sectors and the ones located inside or
outside the European Union (EU), the European Economic Association (EEA) and
Accession countries can register for EMAS.
To register for EMAS an organization needs:
Environmental policy;
Environmental review;
Environmental management system;
Environmental audit;
Environmental statement;
Registration by competent body and use of EMAS logo (Figure 18).
Figure 18: EMAS logo (Source: European Commission website, 2010)
The benefits identified are cost reductions through better management of resources,
risk minimisation, great awareness of regulatory requirements, regulatory relief, improved
relations with internal stakeholders due to employee involvement and training, improved

Management System Status Evaluation
24
relations with external stakeholders leading to an increase of credibility and transparency,
and competitive advantage.
The first form of EMAS, known as EMAS I, was based on the idea that the
companies are independently responsible for implementing environmental protections and
acting sustainably.
In April 2001 the scheme was reviewed, extended and called as EMAS II, the main
improvement was the addition of an environmental advisory committee.
In 2009 the EMAS Regulation has been revised and modified for the second time.
The new provisions of EMAS III include the improvement of applicability of scheme and
the strengthening visibility and outreach of scheme.
EMAS expects more than ISO 14001, it requires more employee participation, more
public reporting, more performance improvement, more legal compliance and the final
registration by public authority.
When an organization is already ISO 14001:2004 certified, it still needs additional
steps for EMAS registration, such as an initial environmental review; an environmental
statement based on the data generated by the environmental management system and the
validation of the environmental statement and performance.
3.1.4 Energy Management System
Closely related to the Environmental Management System is the Energy
Management System, which has become more attention due to the current concern in
reducing energy consumption and GHG emissions.
Depending on the use or function, there are different designations for energy, as
illustrated in the Figure 19:

Management System Status Evaluation
25
Figure 19: Energy sources
Morvay & Gvozdenac (2008) explain primary energy as all types of energy
extracted or captured directly from natural resources, they can be further divided into
renewable and non-renewable, as shown in Figure 20. Intermediate energy is primary
energy converted into other forms and final energy is the one that consumers buy or
receive in order to carry out desired activities.
Figure 20: Renewable and Non-renewable energy (Source: www.windy-future.info, 2010)
For some authors, as for Capehart et all. (2008), Energy Management is related to
the efficient and effective use of energy to maximize profits and augment competitive
position.

Management System Status Evaluation
26
Patterson (1996) explains energy efficiency as a generic term, that in general “...
refers to using less energy to produce the same amount of services or useful output”.
Morvay & Gvozdenac (2008) broadened the definition of Energy Management
saying that it is “… concerned with the efficient use of energy, water and other material
resources, waste minimization in manufacturing operations and continuous improvement
of performance of resources use in a company.” The authors said also that “… energy
management specifically links and relates energy use to production output, aimed at
achieving the required level of output with the minimum use of energy and other
resources.”
Hence we can define Energy Management System (EnMS) as a framework for the
systematic management of energy, in order to enhance energy efficiency, reduce related
costs and reduce greenhouse gas emissions.
Nowadays the EN 16001 is recognized in Europe as an Energy Management
Standard and the ISO 50001 is being developed as an international Energy Management
Standard.
3.1.4.1 European Standard for Energy Management System: EN 16000
The EN 16001 Energy Management Systems was published by the European
Committee for Standardization in the summer of 2009.
“The standard aims to help organizations systematically evaluate their energy
consumption in order to continuously improve energy efficiency, reduce costs and comply
with relevant legislation.” (EMAS website, 2010)
The Workpress Law Group (2010) defined the EN 16001 as a framework for the
systematic management of energy, a management system standard that demonstrates how
to establish the systems and processes necessary to improve energy efficiency across all
operations. Published by BSi in the UK the standard potentially enable organizations to
make energy cost savings and reduce their greenhouse gas emissions.
The standard has a similar structure as the ISO 14001, as it is possible to identify in
the Table 5.

Management System Status Evaluation
27
Table 5: Comparison between the requirements of EN 16001:2009 and ISO 14001:2004
ISO 14001:2004 Environmental EN 16001:2009 Energy
4.1 General requirements 3.1 General requirements
4.2 Environmental Policy 3.2 Energy Policy
4.3 Planning 3.3 Planning
4.3.1 Environmental aspects 3.1.1 Identification and review of energy aspects
4.3.2 Legal and other requirements 3.3.2 Legal obligations and other requirements
4.3.3 Objectives and targets 3.3.3 Energy objectives, targets and programs
4.3.4 Program with responsible, means and time frame
4.4 Implementation and operation 3.4 Implementation and operation
4.4.1 Structure and responsibility 3.4.1 Resources, roles, responsibilities and authority
4.4.2 Training, awareness and competence 3.4.2 Awareness, training and competence
4.4.3 Communication 3.4.3 Communication
4.4.4 Environmental management system documentation 3.4.4 Energy management system documentation
4.4.5 Document control 3.4.5 Control of documents
4.4.6 Operational Control 3.4.6 Operational Control
4.4.7 Emergency preparedness and response
4.5 Checking and corrective action 3.5 Checking
4.5.1 Monitoring and measurement 3.5.1 Monitoring and measurement
4.5.2 Nonconformance and corrective and preventive action 3.5.3 Nonconformity, corrective action and preventive action
4.5.3 Records 3.5.4 Control of records
4.5.4 Environmental management system audit 3.5.5 Internal audit of the energy management system
4.6 Management review 3.6 Review of the energy management system by top management
3.6.1 General
3.6.2 Inputs to management review
3.6.3 Outputs from management review
Comparison between standards
EN stands for Europäische Norm or European Standards, which are rules that have
been ratified by one of the three institutions: European Committee for Standardization, or
Comité Européen de Normalisation (CEN), European Committee for Electro-technical
Standardization, or Comité Européen de Normalisation Electrotechnique (CENELEC) and
European Telecommunications Standards Institute (ETSI). All EN Standards are created
by a public standardization process.
3.1.4.2 International Standard for Energy Management System: ISO 50001
In February 2008, based on the idea that effective energy management is a priority
focus because of the significant potential to save energy and reduce greenhouse gas (GHG)
emissions worldwide, the Technical Management Board of ISO approved the
establishment of a new project committee to develop the new ISO Management System
Standard for Energy. (ISO, 2008)
According to draft version of the ISO 50001 created in 2009:
“This International Standard (ISO 50001) specifies requirements for an
organization to establish, implement, maintain, and improve an energy
management system, which enables an organization to take a systematic
approach in order to achieve continual improvement of energy performance,
energy efficiency, and energy conservation.”
As seen in the standards before (ISO 14001:2004 and ISO 9001:2008) the standard
for energy management is also based on the Plan-Do-Check-Act continual improvement
framework and it is represented as in the following figure:

Management System Status Evaluation
28
Figure 21: Energy Management System Model (Source: ISO 50001 draft version)
The International Organization for Standardization assures that the document is
based on the common elements found in all of ISO‟s management system standards, this
guarantee the high level of compatibility with ISO 9001 and ISO 14001.
According to the International Organization of Standardization, following benefits
can be achieved with the implementation of an Energy Management Standard:
A framework for integrating energy efficiency into management practices;
Making better use of existing energy-consuming assets;
Benchmarking, measuring, documenting, and reporting energy intensity
improvements and their projected impact on reduction in GHG emissions;
Transparency and communication on the management of energy resources;
Energy management best practices and good energy management
behaviours;
Evaluating and prioritizing the implementation of new energy-efficiency
technologies;
A framework for promoting energy efficiency throughout the supply
chain;
Energy management improvements in the context of GHG emission
reduction projects.
Table 6 shows the comparison between the European and the International
Standards for Energy Management.

Management System Status Evaluation
29
Table 6: Comparison between the requirements of ISO 50001 and EN 16001
ISO 50001:2009 Energy Management (draft version) EN 16001:2009 Energy Management
4.1 General requirements 3.1 General requirements
4.2 Management Responsibility 3.4.1 Structure and responsibility
4.2.1 Commitment of top management
4.2.2 Roles, responsibility and authority
4.3 Energy policy 3.2 Energy policy
4.4 Planning
4.4.1 General
4.4.2 Energy profile 3.3.1 Energy aspects
4.4.3 Energy Baseline 3.3.1 Energy aspects
4.4.4 Energy performance indicators 3.3.1 Energy aspects
4.4.5 Legal and other requirements 3.3.2 Legal and other requirements
4.4.6 Objectives, targets and action plans 3.3.3 Objectives, targets and programme(s)
4.5 Implementation and operation
4.5.1 Competence, training and awareness 3.4.2 Training, awareness and competence
4.5.2 Documentation 3.4.4 Energy mgmt sys. documentation
4.5.2.1 Documentation requirements 3.4.4 Energy mgmt sys. documentation
4.5.2.2 Control of documents 3.4.5 Document control
4.5.3 Operational control 3.4.6 Operational control
4.5.4 Communication 3.4.3 Communication
4.5.5 Design 3.4.6 Operational control
4.5.6 Purchasing energy services, goods and energy 3.4.6 Operational control
4.5.6.1 Purchasing of energy services and goods 3.4.6 Operational control
4.5.6.2 Purchasing of energy 3.4.6 Operational control
4.6 Checking performance
4.6.1 Monitoring, measurement and analysis 3.5.1 Monitoring and measurement
4.6.2 Evaluation of legal/other compliances 3.5.2 Evaluation of compliance
4.6.3 Internal audit 3.5.5 Energy management system audit
4.6.4 Nonconformities, corrective, preventive and improvement actions 3.5.3 Non-conf., corrective/preventive action
4.6.4.1 Nonconformities
4.6.4.2 Corrective and preventive actions
4.6.5 Control of records 3.5.4 Control of records
4.7 Review of the energy management system by top management 3.6 Energy Management Review
4.7.1 Inputs to management review
4.7.2 Outputs from management review
Comparison between standards
ISO 50001 is expected to be published as an International Standard by early 2011.
3.1.5 Integrated Management Systems
Nowadays organizations have to fulfil different requirements to satisfy the demand
of various stakeholders. The business drivers are regulatory, statutory, customer, quality,
environmental, IT, health and safety to name but a few, and the list seems to be growing all
the time.
Several management systems are developed to comply with the different
requirements for those drivers. These management systems, when developed isolated from
each other, can end up conflicting, due to the use of different performance indicators, the
rework of similar activities, etc.

Management System Status Evaluation
30
The optimal solution would be to have only one management system that fits to all
the requirements and converges the organization‟s objectives.
According to the British Standards Institution (2010) an integrated management
system incorporates all of an organization‟s systems and processes into one complete
framework, permitting the organization to work as a single unit with unified objectives.
Whitelaw (2004) stated that the integration is concerned with elements of
„compliance of procedures‟ and “…considers a narrow set of criteria of running a business
such as: management responsibilities and accountabilities; business processes; deployment
of resources, skills, knowledge and technology”.
Figure 22 illustrates the integration of management systems concerning quality
management and responsible care.
Figure 22: Integrated Management System
Combined management systems should run concurrently with each other and both
should be capable of being audited by an external body to a recognized standard. Thus
should create less workloads, reduced certification time, costs and documentation.

Management System Status Evaluation
31
3.2 Methods and Instruments for Status verification of an Energy
Management System
This academic paper started with the study of standards EN 16001:2009 and ISO
50001:2009, given that they are important tools to assist the implementation of an Energy
Management System.
After comparing both standards, a checklist was developed, the intention of the
checklist is to visualize the status “as is” of the company and have an overview to define
the priorities in the implementation of an energy management system.
Taking into account that the objective in implementing an Energy Management
System does not only embraces one branch of the organizations and also the fact that the
tool has to be useful in all locations from a company, not only Europe, the main basis for
the creation of the checklist was the International Standard for Energy Management ISO
50001:2009.
3.2.1 Purpose of developing a checklist
The aim of the checklist is to have a tool to facilitate the evaluation of the current
situation of the company with respect to the introduction of an Energy Management
System.
It is an instrument that can be easily used by other branches of the organization or
even by other companies.
3.2.2 Comparison between International Energy Management and Environmental
Management Standards
As seen in the literature review chapter, an Integrated Management system brings
several benefits for a company, such as avoiding duplicity of information, costs and data
conflict.
The Management Systems that follow the ISO logic have certain requirements in
common. Having this idea in mind, this work began with an analysis of the requirements of
ISO 14001, EN 16001 and ISO 50001, mainly identifying their similarities, according to
Table 7 and Table 8.

Management System Status Evaluation
32
Table 7: Comparison between ISO 50001 and ISO 14001 (a)
Item ISO 14001:2004 - EMS ISO50001:2008 draft - EnMS Remarks
Core concept
Environment – it determines relevant
requirements based on the “identification of
significant external environmental aspects of
the production process” which may or may not
include issues as delivery and after sales
service
Energy - it determines relevant requirements
based on “energy consumption of the whole
organization/ production process”
Control scope
Focus mainly on production process.
Activities of the suppliers and customers may
also be within the control of EMS, but not
explicitly required, therefore less applied
“It applies to all factors affecting energy use
that can be monitored and influenced by the
organization”. Energy supply, procurement
and design practices for energy-using
equipment, system and processes are within
the control scope.
Control objects
Environmental targets which are mainly
related to the EMS objectives, which requires
the consideration of environmental aspects,
relevant laws and regulations and other
mandatory requirements
Energy performance and consumption targets
which should be determined by the
organization‟s policy and objectives, and by
the requirements of laws and regulations,
where relevant
Control degree“Absolute” control but without the
“concession” option
“Relative” control. It pays more attention on
continual improvement of energy
performance, energy conservation practices
and energy efficiency
Application scope
is widely used in raw material and production
sectors. In general the software and service
industry have less environmental impact
Expected to be widely used in production, raw
materials and services sectors. According
with ISO, ISO 50001 could potential impact
60% of global energy consumption
Management
performance
The performance is mainly seen from the
"conformity", namely whether the emission
targets conform to the specified requirements
The performance is related to conformity with
requirements, continual identification and
implementation of energy performance
improvement interventions, measured by
means of quantitative comparison against an
organization's baseline
Management
responsibility
(4.2)
Definition of an Energy Manager
Mainly about commitment and support of Top
Management. The HSE Manager can include
in its responsibilities the energy issues, for
that he/she has to have the appropriate skills,
time and their responsibility has to be defined
and communicated
Policy
(4.3)
The organization's significant environmental
impacts together with applicable legal and
regulatory requirements are the main concern
The organization striving for profits, reduced
production costs, enhanced competitiveness
combined with relevant law and regulation
requirements, where relevant, will be the main
concern
There is no need of a policy only for energy,
the energy policy may be combined into
another already existent
Planning
(4.4.1 to 4.4.6)
To identify environmental aspects,
requirements of relevant laws and regulations.
Then to establish the environmental
objectives, targets and programmes
To develop an energy profile, identify
significant energy uses, define an energy
baseline and energy performance indicators.
Identify applicable laws and regulations, and
then establish objectives, targets and action
plans
It requires efforts identifying detailed
information about energy consumption, since
in the environmental management system the
information about energy consumption is
roughly analyzed
Baseline
(4.4.3)
No specific requirement beyond continual
improvement
The establishment of an organization‟s energy
baseline is a fundamental element of the
EnMS, since “Changes in energy
performance shall be measured against the
energy baseline”
Specific for EnMS
Objectives and
targets
(4.4.6)
Environmental objectives and targets are
either related to an organization‟s significant
environmental impacts or to “external
mandatory requirements” set mainly by
relevant laws and regulations
Energy objectives and targets are primarily
“internal management objectives”, mixed with
“external requirements” where laws and
regulations may apply (i.e. greenhouse gas
reduction targets for large emitters)
More detailed information for Energy
Competence,
training and
awareness (4.5.1)
General training plan General training planInformation about energy use has to be
included in training plans
Documentation
(4.5.2)Define how to keep the documents Define how to keep the documents It can follow the same logic
Operational
Control
(4.5.3)
Identification and planning of activities that
have any environmental impact
Identification and planning of activities that
impact in the energy consumption
It is necessary to review activities and
processes to ensure that energy consumption
is taken in consideration
Communication
(4.5.4)Communication procedure Communication procedure It can follow the same logic
Design
(4.5.5)
Design control is not included as a separate
clause. The production process, which sets
the design specifications, is indeed related to
the environmental aspects. The focus is
therefore mainly on “production processes”
Design is part of ISO 50001 Implementation &
Operation, “..consider energy performance
improvement opportunities in the design,
modification and renovation of significant
energy consuming facilities, equipment,
systems and processes”
New in energy management

Management System Status Evaluation
33
Table 8: Comparison between ISO 50001 and ISO 14001 (b)
Item ISO 14001:2004 - EMS ISO50001:2008 draft - EnMS Remarks
Purchasing
(4.5.6)
Purchase control is not included as separate
sub-clause, but is mentioned under
operational control
It includes separate sub-clauses for the
purchasing of energy services and goods and
purchasing of energy (the applicability of the
latter is subject to the specificities of the
market in which an organization operates)
New in energy management
Monitoring and
Measurement
(4.6.1)
It should monitor & measure key “process
characteristics” that are related to identified
significant environmental impacts, and
consequently objectives and targets
It requires to monitor, measure and analyze
the key characteristics of an organization‟s
operations that determine energy
performance. Key characteristics include also
effectiveness of actions plans in achieving
objectives and targets
It may be necessary to improve monitoring
and measuring methods
Evaluation of
legal and other
compliances
(4.6.2)
Plan to evaluate legal and other compliances
at determined intervals
Plan to evaluate legal and other compliances
at determined intervalsIt can follow the same logic
Internal Audit
(4.6.3)Internal audit procedure Internal audit procedure
A new audit procedure has to be designed,
since different aspects are going to be audited
Nonconformities,
corrective,
preventive and
improvement
actions (4.6.4)
Procedures for dealing with nonconformities Procedures for dealing with nonconformities It can follow the same logic
Control of records
(4.6.5)Maintenance of records Maintenance of records It can follow the same logic
Management
Review
(4.7)
Review from top management at planned
intervals
Review from top management at planned
intervalsIt can follow the same logic
Implementation
ISO 50001 is based on the same Plan-Do-
Check-Act approach of ISO 9001 and ISO
14001 and it draws extensively on the
structure and content of the QMS and EMS.
I: Laws and
regulations
The „legal-drive‟ for implementation is
comparatively strong. However, ISO 14000
family standards are voluntary standards and
they do not substitute the control to be
exerted from authorities related to legal
compliance
The company‟s bottom line will be the primary
driver for implementation. However,
regulatory or agreed requirements may
become relevant as part of a country‟s
policies and/or obligations towards the
achievement of energy security and/or
Climate Change mitigation
I: Benefit and
management
performance
Implementation of EMS can bring direct
economic benefits through resource savings
and cleaner production, latter saving the costs
of regulated “clean-up”. The “instant”
achievement of EMS can be made evident by
monitoring of environmental indexes
Implementation of EnMS brings direct
economic benefits in the form of reduced
energy costs originating entirely within an
organization‟s fence. EnMS‟ achievements
can be measured by the energy performance
indicators.
I: Market drive
The market drive (i.e. customers demand and
supply chain) is playing an increasingly
important role in motivating companies to
implement EMS
Currently the market drive has primarily the
form of rising and volatile energy cost. Other
market drivers may result from the
establishment of policy-driven mechanisms
(i.e. govt. procurement rules, white
certificates, GHG emission reduction targets,
etc.) or customers demand
I: Certification
program support
Certification is also an important way to
promote EMS
Whether certification will play an important
role in promoting implementation of ISO
50001 is likely to depend on the strength of
the energy-cost-reduction thrust, the market
drivers that may arise, the policy requirements
and support that could be established
I: Technical
support
It also employs typical management
technologies & methods as backup. In
addition, specific control technologies and
methods targeting special industrial sectors
are very important to EMS
It will employ specific technologies and
management methods as backup, such as
energy audits. But Best Practice Guides on
the application of energy conservation
technologies & methods in specific industrial
sectors will prominently boost wide-spread
implementation of EnMS.
From this comparison, a checklist was developed to verify which of the
requirements were already accomplished by the organization, i. e., a gap analysis to show
how far the company is from an Energy Management System implementation.

Management System Status Evaluation
34
3.2.3 Checklist for gap analysis of an Energy Management System
The development of the checklist was mainly based on the draft version of the ISO
50001:2009, questions were formulated from the requirements of the standards and they
were grouped into the following points:
Requirements ISO 50001:2009 (draft version)
4.1 General requirements
4.2 Management responsibility ( incl. 4.2.1/ 4.2.2)
4.3 Energy policy
4.4.1 Energy profile/ Baseline/ Energy Performance Indicators (incl. 4.4.2/ 4.4.3/ 4.4.4)
4.4.5 Legal obligations and other requirements
4.4.6 Objectives, targets and action plans
4.5.1 Competence, training and awareness
4.5.2 Documentation (incl. 4.5.2.1/4.5.2.2)
4.5.3 Operational control
4.5.4 Communication
4.5.5 Design
4.5.6 Purchasing (incl. 4.5.6.1/ 4.5.6.2)
4.6.1 Monitoring, measurement and analysis
4.6.2 Evaluation of legal/ other compliances
4.6.3 Internal audit
4.6.4 Nonconformities, corrective, preventive and improvement actions (incl. 4.6.4.1/
4.6.4.2)
4.6.5 Control of records
4.7 Energy Management Review ( incl. 4.7.1/ 4.7.2)
For each question it was possible to choose one of the options: not fulfilled,
partially fulfilled, fulfilled and not applicable, simply filling the space with an X.
The Figure 23 shows a part of the checklist for “Status evaluation for the
implementation of an Energy Management System according to ISO 50001:2009 (draft
version)”, the complete list can be found in Appendix I.

Management System Status Evaluation
35
Status evaluation for the implementation of LOCATION: please enter here location name
an Energy Management System according to DATE: DD.MM.YYYY
ISO 50001 draft NAME: please enter here contact person
No
t F
ulf
illed
Par
t ly
Fu
lfil
led
no
t
app
licab
le
4.1 General requirements 0%
1Has the organization defined an Energy Management System
accordingly to ISO 50001?0
4.2 Management responsibility (4.2.1/ 4.2.2) 0%
1
Has the organization defined an energy management representative
(energy manager) and defined their roles, responsibilities and
authorities?
0
2
Are the specialized skills, human, financial and technological
resources necessary for energy management identified and provided
by the board?
0
4.3 Energy policy 0%
1Has the board defined in writing a policy, which includes also a
commitment to continuous improvement of energy efficiency?0
2Does the policy show a commitment to achieve the energy
management objectives and to reduce energy related emissions?0
3 Is the policy available to internal and external public? 0
Please use 'x' in evaluation box
Comments to explain the evaluation i.e. evidences
rating
score
and inter-
mediate
results
(%)
Req.
NoElement Requirement Questions
Evaluation
Figure 23: Part of Checklist created according to ISO 50001:2009 (draft version)
For a further analysis, it was included a field for comments and evidences, to know
the reasons for the status of each requirement.
In the superior corner on the right side of the checklist, it was included a notice
displaying its status.
If the checklist is totally blank appears the sentence “Please use „x‟ in evaluation
box”. After starting answering the completion the information changes to “Not all
questions answered! Please complete!”. Once completed it shows “Completed! Thank
you!” and in case of more than one answer for each question, the document is considered
not correct “Completion not correct. Please check!”
By answering the questions a graph is obtained, this graph can be used for gathering
two kinds of information. The columns in green, red and yellow show which percentage of
each requirement is fulfilled, partially fulfilled or not fulfilled and the blue column allows
the comparison of the results between different location, providing a general percentage, as
in the example in the Figure 24.

Management System Status Evaluation
36
Aldersbach
Detailed results of score per requirement
59%
0%
25%
50%
75%
100%
4.1
4.2
4.3
4.4
.1
4.4
.5
4.4
.6
4.5
.1
4.5
.2
4.5
.3
4.5
.4
4.5
.5
4.5
.6
4.6
.1
4.6
.2
4.6
.3
4.6
.4
4.6
.5
4.7
Score
# requirements Not Fulf illed Part ly Fulf il led
Figure 24: Example – Results of requirements per location (ALD)
In other words, the red, yellow and green columns show how far the specific
location is from completing each requirement and the blue column shows the score for the
implementation of an Energy Management System.
In the blue column, in order to differentiate the importance of fulfilled, partially
fulfilled and not fulfilled requirements, the following score were given for each of the
possible answers:
Fulfilled – 1 point;
Partially – 0,50 points;
Not fulfilled – 0 points;
Not applicable – when crossed, eliminate that question from the
calculation of the final percentage.
This checklist was sent to the 17 locations of Knorr-Bremse CVS, with the results it
was defined that this paper would focus on the point 4.6.1 of the standard - Monitoring,
Measuring and Analysis - more specifically Metering Equipments.
The focus on requirement 4.6.1-Monitoring, Measuring and Analysis was chosen
according to the final results obtained applying the checklist in the Knorr-Bremse (Region
Europe + São Paulo), it turned out to be one of the more relevant gaps identified, the
outcome can be seen in the next section, the analysis of results.
Graphs showing the results received from the locations can be found in the
Appendix II.

Management System Status Evaluation
37
3.3 Analysis of results from Checklist
The checklist was sent to the locations of Knorr-Bremse CVS represented in the list
below, from those, only India and China have not implemented ISO 14001:2009 yet.
Table 9: Locations of Knorr-Bremse CVS
Region Europe + SAO
1 Brazil São Paulo SAO
1 Czech Republic Liberec LIB
1 France Lisieux LIS
1 Germany Aldersbach ALD
1 Germany Berlin BER
1 Germany Schwieberdingen STR
1 Hungary Budapest BUD
1 Hungary Kecskemét KEC
1 Italy Arcore ARC
1 United Kingdon Bristol BRI
Region Asia
2 China Dalian DAL
2 India Pune PUN
2 Japan Tokyo TKY
Region North America - Bendix
3 Mexico Acuña Bendix
3 USA Bowling Green (Kentucky) Bendix
3 USA Elyria (Ohio) Bendix
3 USA Huntington (Indiana) Bendix
The intention of the checklist was to compare the “as is” situation of each location
with the requirements of ISO 50001:2009 (draft version) and identify the possible gaps that
would need more attention in the implementation of an Energy Management System.
To exemplify how the checklist works and its analysis can be done, some results
were chosen, such as in the Figure 25 that shows the results for the location Bristol (UK):

Management System Status Evaluation
38
Bristol
Detailed results of score per requirement
70%
0%
25%
50%
75%
100%
4.1
4.2
4.3
4.4
.1
4.4
.5
4.4
.6
4.5
.1
4.5
.2
4.5
.3
4.5
.4
4.5
.5
4.5
.6
4.6
.1
4.6
.2
4.6
.3
4.6
.4
4.6
.5
4.7
Score
# requirements Not Fulf illed Part ly Fulf il led
Figure 25: Results per requirement - Bristol
This graph shows that the location Bristol is doing very well in preparing for an
Energy Management System, having a final score of 70%.
The requirements represented by the bars in 100 percent green (4.4.5-legal
obligation and other requirements, 4.5.4-communication, 4.6.2-evaluation of legal and
other compliances and 4.6.5-control of records), can be directly related to the requirements
of ISO 14001:2009, as can be observed in Table 7 and Table 8.
In the other bars is possible to identify characteristics closely related to energy, in
which the organization is still working.
The requirement that shows the greatest percentage in red refers to monitoring,
measurement and analysis. Observing more carefully the questions elaborated for this
point, it is possible to identify the absence of appropriate equipments for measuring energy
consumption, since 5 from 6 questions not fulfilled in this area, are about metering
equipments.
In a further analysis, the figures below shows how the field dedicated to comments
and evidences helped to understand the answers:
4.3 Energy policy Not Partly Yes N/A Comments 33%
1Has the board defined in writing a policy, which includes also a
commitment to continuous improvement of energy efficiency? xNo energy policy known. However, some related
elements in the HSE policy 0,5
Figure 26: Field for comments and evidences (a)
In this case, there is no policy set specifically for an Energy Management System,
but the Environmental Policy recognizes the significance of sustainable use of energy.
It is a matter of interpretation, it shows that this location knows about the policy and
the standard, because the standard says that it is not necessary to have an specific policy
for the Energy Management System: “If there are other policies in place within the
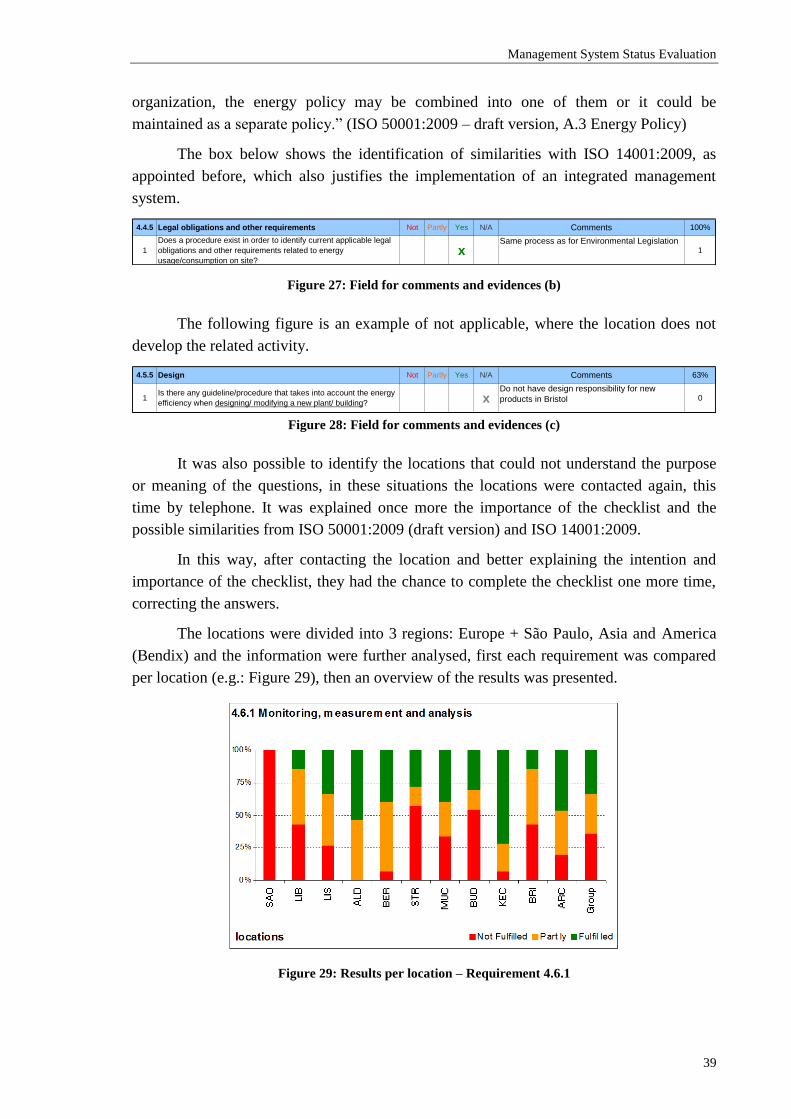
Management System Status Evaluation
39
organization, the energy policy may be combined into one of them or it could be
maintained as a separate policy.” (ISO 50001:2009 – draft version, A.3 Energy Policy)
The box below shows the identification of similarities with ISO 14001:2009, as
appointed before, which also justifies the implementation of an integrated management
system.
4.4.5 Legal obligations and other requirements Not Partly Yes N/A Comments 100%
1
Does a procedure exist in order to identify current applicable legal
obligations and other requirements related to energy
usage/consumption on site?x
Same process as for Environmental Legislation1
Figure 27: Field for comments and evidences (b)
The following figure is an example of not applicable, where the location does not
develop the related activity.
4.5.5 Design Not Partly Yes N/A Comments 63%
1Is there any guideline/procedure that takes into account the energy
efficiency when designing/ modifying a new plant/ building? xDo not have design responsibility for new
products in Bristol 0
Figure 28: Field for comments and evidences (c)
It was also possible to identify the locations that could not understand the purpose
or meaning of the questions, in these situations the locations were contacted again, this
time by telephone. It was explained once more the importance of the checklist and the
possible similarities from ISO 50001:2009 (draft version) and ISO 14001:2009.
In this way, after contacting the location and better explaining the intention and
importance of the checklist, they had the chance to complete the checklist one more time,
correcting the answers.
The locations were divided into 3 regions: Europe + São Paulo, Asia and America
(Bendix) and the information were further analysed, first each requirement was compared
per location (e.g.: Figure 29), then an overview of the results was presented.
Figure 29: Results per location – Requirement 4.6.1
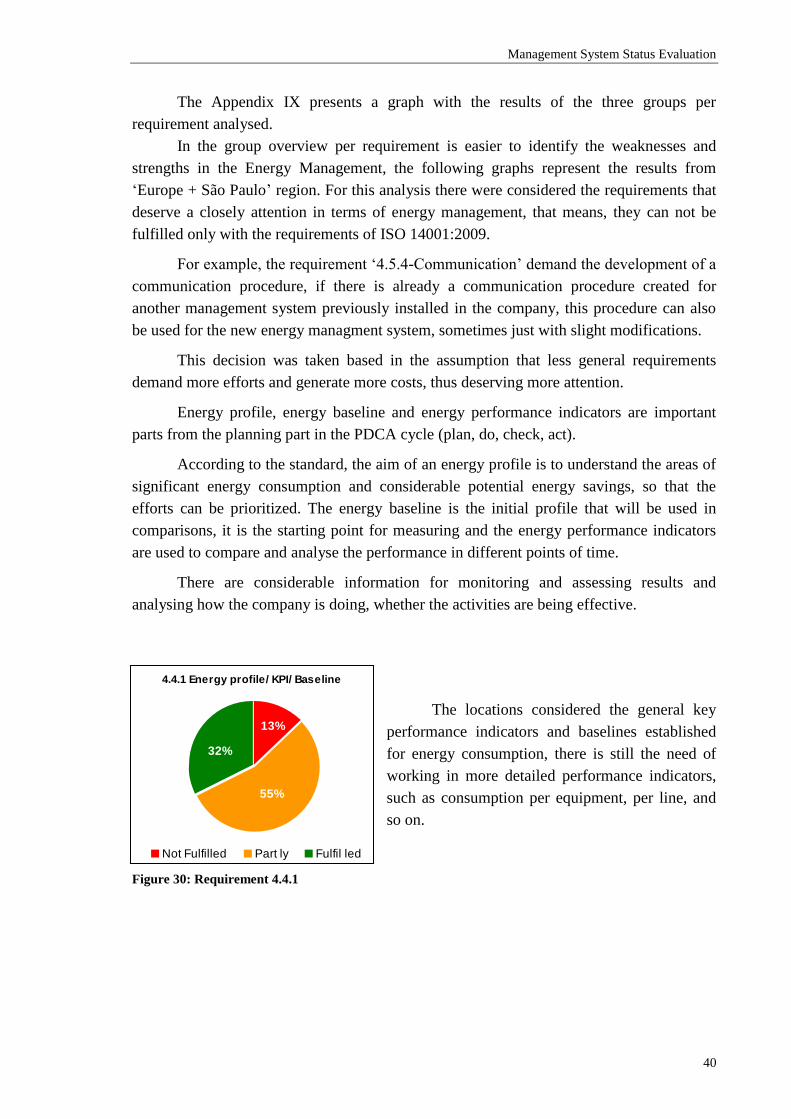
Management System Status Evaluation
40
The Appendix IX presents a graph with the results of the three groups per
requirement analysed.
In the group overview per requirement is easier to identify the weaknesses and
strengths in the Energy Management, the following graphs represent the results from
„Europe + São Paulo‟ region. For this analysis there were considered the requirements that
deserve a closely attention in terms of energy management, that means, they can not be
fulfilled only with the requirements of ISO 14001:2009.
For example, the requirement „4.5.4-Communication‟ demand the development of a
communication procedure, if there is already a communication procedure created for
another management system previously installed in the company, this procedure can also
be used for the new energy managment system, sometimes just with slight modifications.
This decision was taken based in the assumption that less general requirements
demand more efforts and generate more costs, thus deserving more attention.
Energy profile, energy baseline and energy performance indicators are important
parts from the planning part in the PDCA cycle (plan, do, check, act).
According to the standard, the aim of an energy profile is to understand the areas of
significant energy consumption and considerable potential energy savings, so that the
efforts can be prioritized. The energy baseline is the initial profile that will be used in
comparisons, it is the starting point for measuring and the energy performance indicators
are used to compare and analyse the performance in different points of time.
There are considerable information for monitoring and assessing results and
analysing how the company is doing, whether the activities are being effective.
The locations considered the general key
performance indicators and baselines established
for energy consumption, there is still the need of
working in more detailed performance indicators,
such as consumption per equipment, per line, and
so on.
Figure 30: Requirement 4.4.1
4.4.1 Energy profile/ KPI/ Baseline
32%
13%
55%
Not Fulfilled Part ly Fulfil led

Management System Status Evaluation
41
Objectives, targets and action plan show the direction the organization have to take
to improve energy performance, in other words, there are the means to transform the policy
into action.
The Figure 31 shows that even without a
complete Energy Management System the
organization has good results in „objectives, targets
and action plan‟.
Figure 31: Requirement 4.4.6
The 53 percent of fulfilled points results from the ECCO2 initiative, as it is
confirmed in the answers given by the example below.
4.4.6 Objectives, targets and action plans Not Partly Yes N/A Comments 88%
1Has the organization defined an objective related to consumption of
energy; eg. increasing of energy efficiency? xEnergy Consumption Ratio is monitored against
predefined targets on monthly basis 1
2Are specific and measurable targets, and related specific indicators,
defined for significant energy usages? xAverage PF, compressors duty cycle etc. are
monitored on monthly basis 0,5
3Has the organisation defined an action plan for achieving objectives
and targets? xECCO2 project action plan is prepared
1
4Has the organization put in documented action plans, the
responsabilities, times and means for their achievement? xECCO2 project action plan is prepared
1
Figure 32: Field for comments and evidences (d)
In general a local training plan already exists, nevertheless it was considered as a
requirement closely related to energy management, because a general training plan usually
does not cover energy related information, it was the case of Knorr-Bremse, as stated in the
graph below.
It is possible to identify the necessity of
including more specific energy related information
in the already existent training plans.
Figure 33: Requirement 4.5.1
4.5.1 Competence, training and
awareness
10%
50%40%
Not Fulfilled Part ly Fulfil led
4.4.6 Objectives, targets and action
plan
53%
11%
36%
Not Fulfilled Part ly Fulfil led

Management System Status Evaluation
42
The group of requirements 4.5 – Implementation and operation, represents also the
„D‟, or do, part of the PDCA cycle and includes the following points:
4.5.1 Competence, training and awareness
4.5.2 Documentation and 4.5.2.2 control of documents
4.5.3 Operational control
4.5.4 Communication
4.5.5 Design
4.5.6 Purchasing energy services, goods and energy (4.5.6.1 and 4.5.6.2)
In this part the requirements about operational control, design and purchasing need
a closer attention, as detailed in Table 7 and Table 8.
Operational control includes identifying activities with significant impact in energy
consumption and ensuring that they are conducted in a way to improve company‟s energy
performance.
This information can be superficially found
in the processes‟ descriptions of the organization,
though some effort has already been done to fulfil
this requirement.
Figure 34: Requirement 4.5.3
Design and Purchasing were not specifically mentioned in standards before ISO
50001.
Energy performance improvements have to
be considered in the design of new and modified
production lines, products, buildings, equipments,
processes and activities. This requires a closely
review of the processes.
Figure 35: Requirement 4.5.5
4.5.3 Operational Control
29% 28%
43%
Not Fulfilled Part ly Fulfil led
4.5.5 Design
68%
16%16%
Not Fulfilled Part ly Fulfil led
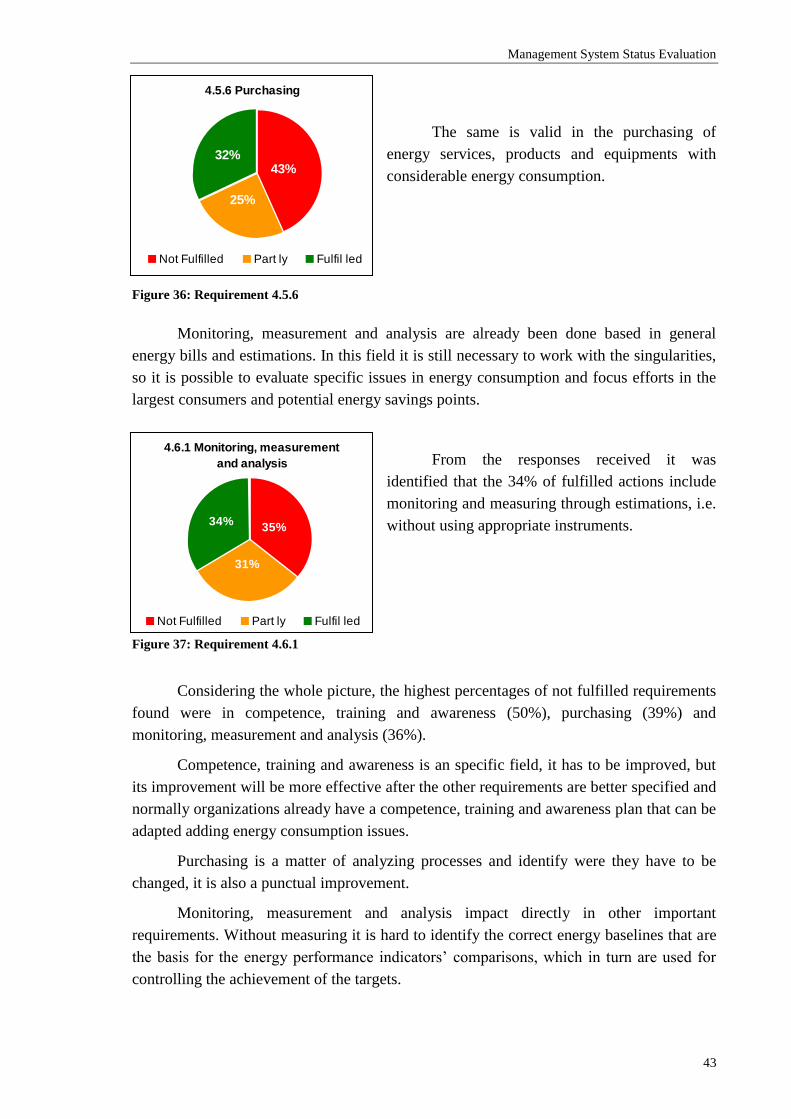
Management System Status Evaluation
43
The same is valid in the purchasing of
energy services, products and equipments with
considerable energy consumption.
Figure 36: Requirement 4.5.6
Monitoring, measurement and analysis are already been done based in general
energy bills and estimations. In this field it is still necessary to work with the singularities,
so it is possible to evaluate specific issues in energy consumption and focus efforts in the
largest consumers and potential energy savings points.
From the responses received it was
identified that the 34% of fulfilled actions include
monitoring and measuring through estimations, i.e.
without using appropriate instruments.
Figure 37: Requirement 4.6.1
Considering the whole picture, the highest percentages of not fulfilled requirements
found were in competence, training and awareness (50%), purchasing (39%) and
monitoring, measurement and analysis (36%).
Competence, training and awareness is an specific field, it has to be improved, but
its improvement will be more effective after the other requirements are better specified and
normally organizations already have a competence, training and awareness plan that can be
adapted adding energy consumption issues.
Purchasing is a matter of analyzing processes and identify were they have to be
changed, it is also a punctual improvement.
Monitoring, measurement and analysis impact directly in other important
requirements. Without measuring it is hard to identify the correct energy baselines that are
the basis for the energy performance indicators‟ comparisons, which in turn are used for
controlling the achievement of the targets.
4.5.6 Purchasing
25%
43%32%
Not Fulfilled Part ly Fulfil led
4.6.1 Monitoring, measurement
and analysis
31%
35%34%
Not Fulfilled Part ly Fulfil led

Management System Status Evaluation
44
In this way, inaccurate monitoring and measurement of energy data affects further
requirements of the international standard, such as energy baselines, profile, performance
indicators, targets and objectives.
It can be considered the starting point for a solid Energy Management System.
Without information on energy consumption it is not possible to establish any of the just
mentioned requirements.
This reasoning led to the choice of focus the starting point of the implementation of
the Energy Management System in the requirement „4.6.1-Monitoring, measurement and
analysis‟ of ISO 50001:2009 (draft version), considering it as a cruscial point in energy
management.
For this reason in the next chapter the foucus will be on a concept to introduce
instruments for energy data consumption monitoring.

Monitoring, Measuring and Analysis
45
4 MONITORING, MEASURING AND ANALYSIS
After analysing the results obtained collecting information with the checklist, it was
evident the lack of data for managing energy consumption and without this kind of data,
baselines, targets and objectives are unlikely to be established, as well as a energy savings
plan.
In this way it was decided that monitoring and measurement were important issues,
since what cannot be measured, can also not be managed.
Talking to the HSE (health, safety and environment) managers from the locations, it
was possible to find out that the energy consumption is almost everywhere controlled
through reading energy bills sent by the energy supply companies.
The chapter of Monitoring, Measuring and Analysis is dedicated to describe a
concept to facilitate starting the implementation of metering instruments to improve the
energy monitoring conditions of a company.
It is divided into review of the literature that describes some aspects related to
energy consumption monitoring, such as energy consumption systems, to understand
where energy can be monitored inside the industry, and basics about energy metering.
The methods and instruments part describes the concept developed to introduce
instruments for energy consumption data monitoring inside an organyzation and the
analysis section gives three examples where the concept was used to test its applicability.
4.1 Literature Review
In this chapter are reviewed the concepts that are important to know in order to
better understand the research problem and analysis of this paper, it is divided in two parts:
energy consumption systems and basics for energy measuring and monitoring.
“Having the meters is not enough. A system must be designed to gather and record
the data in a useful form. Meters can be read manually, they can record information on
charts for permanent records, and/or they can be interfaced with microcomputers for real-
time reporting and control.” (Capehart, 2008, p. 33)
4.1.1 Energy Consumption Systems
This part of the literature review describes some of the scopes that can be analysed
in an industrial company, regarding energy consumption.

Monitoring, Measuring and Analysis
46
4.1.1.1 Industrial Steam System
Steam systems generate and distribute thermal energy in the form of steam, which is
then used for several process applications, such as heating raw materials and treat semi-
finished products, it is also a source of power for equipments plus for heat and electricity
generation.
“Steam is one of the most abundant, least expensive and most effective heat-transfer
media obtainable.” (Schmidt cit. in Doty 2009)
The Figure 38 represents a typical steam system:
Figure 38: Overall Steam System Definition (Source: Morvay & Gvozdenac, 2008)
Schmidt (cit. in Doty 2009) also says that steam processes are relevant energy
consumers among the industries.
Morvay & Gvozdenac (2008) corroborate the statement saying that normally 40%
of all fuel burned in industry is consumed to raise steam.
The efficiency of steam systems depends on the fuel utilization in boilers and varies
broadly depending on their design, manufacture, control and mode of operation. Efficiency
can also be improved by implementing several measures to reduce the loss of heat from the
boiler and related systems. (Ireland-SEAI, 2010)
4.1.1.2 Industrial Electric Power System
“Electric power systems provide clean and convenient energy to light homes, drive
motors, run manufacturing plants and business and power our communication and digital
systems”. (Ray, 2007)

Monitoring, Measuring and Analysis
47
According to Morvay & Gvozdenac (2008) an industrial electric power system
normally starts from one or more medium voltage transformers located within a company‟s
perimeter. Some companies may be connected to the grid on high voltage or low voltage,
and some may have their own power generation or co-generation.
Anyway, an industrial distribution network ramifies to form the busbars of a
transformer substation. The feeders will take electricity flows to the main departments and
units of an organization, where local electrical installations will branch out further to reach
every end-user. (Ray, 2007)
A set of an electric motor and the attached mechanical device is frequently
identified as an electric motor drive, due to their usage as sources of power for driving
some mechanical devices.
4.1.1.3 Compressed Air System
According to Vesma (2009) the usage of compressed air includes, among others, the
delivering of mechanical power, pneumatic controls, sorting and separating small items on
production lines, blowing dust or swarf in manufacturing workshops, transporting powder,
atomizing water in humidification systems and agitating the contents of tanks and vats.
It is considered as a safe and reliable power source, since it is generated on-site,
giving users greater control over usage and air quality. This also contributes to the fact that
it is widely used throughout industry.
Compressed air systems include compressor, after-cooler, air receiver (which works
like a buffer), air dryer and distribution system, as represented in the Figure 39.

Monitoring, Measuring and Analysis
48
Figure 39: Compressed air system diagram (Source: Scales Air Compressor Corp.)
“The total cost of compressed air over a ten-year period can be estimated as 75%
energy, 15% capital and 10% maintenance, representing the relevance of measuring and
monitoring of its energy consumption.” (Morvay & Gvozdenac, 2008)
From electricity to compressed air, much loss of energy may be identified, to assess
this information power, pressure, flow rate and temperature values, shall be monitored.
Measuring power the annual electricity consumption of the compressed air system
is assessed. Pressure is measured in order to provide feedback for control adjustments and
to determine pressure drops throughout the system.
Flow meters help to determine air consumption and temperature measurements are
needed to indicate whether equipment is operating properly. (Doty, 2009)
Apart from the measurements cited above, it is extremely important to determine
compressed air leakages, which are responsible for high volume of air losses, they can
occur due to small holes in the pipes, when a drain valve is left open or excessive pressure
is lifting safety valves, to name but a few.
Is fair to say that through the measurement of energy consumption of a compressed
air system it is possible to identify increased uncontrolled leakages, changes in price of
electricity, increased maintenance costs and significant changes in the volume of
production. (Morvay & Gvozdenac, 2008)

Monitoring, Measuring and Analysis
49
4.1.1.4 Industrial Refrigeration System
Morvay & Gvozdenac (2008) stated that a “… refrigeration system is a combination
of components, equipment and piping, connected in a sequential order to produce a
refrigeration effect.” A refrigeration effect is the process of removing heat from a lower
temperature heat source, a substance or cooling medium and transferring it to a higher
temperature heat sink, commonly atmospheric air and surface water, in order to maintain
the temperature of the heat source below that of the surroundings.
They can be classified in two categories:
Chilling and chilled storage. The temperature normally varies between 0 to
10°C.
Freezing, deep freezing, cold storage and deep cold, where the temperature
ranges from 0 to minus 40°C.
A mechanical refrigeration system encompasses compressors, condensers,
expansion devices, evaporator coils and fans. The refrigerant compressor requires the most
of the energy of the system and the overall efficiency of the system can be improved by
reducing the work the compressor does.
The heat discharged by the compressor can be used to heat water for domestic use
or for heating the halls.
4.1.1.5 Heating, Ventilating and Air Conditioning (HVAC)
“HVAC is an important technology for the conditioning of spaces in modern
buildings. It can represent 25–30% of the energy use in a typical building in warm
climates.” (Ireland-SEAI, 2010)
Heating is normally used in cold climates to heat buildings. There are different
heating systems, such as central heating, which normally contains a boiler, a furnace, or
heat pump to heat water, steam or air, all in a central location; or heating units located
around the building to provide heating when necessary.
Ventilating is the practice of replacing air in any space to control temperature or
remove moisture, odours, smoke, dust, airborne bacteria, carbon dioxide, and to refill
oxygen, it can be both the exchange of air to the outside or circulation of air within the
building.
Air conditioning is provided through the removal of heat, an air conditioning
system provides cooling, ventilation and humidity control for a certain space.
In the HVAC system, Vesma (2009) suggests the installation of heat meters capable
to assess the fuel used against heat generated and heat generated against degree days. This
assists discriminating between faults within the boiler house and waste in the delivery of
heat.

Monitoring, Measuring and Analysis
50
4.1.1.5.1 Building Envelope
The building envelope is the interface between the interior of the building and the
outdoor environment, comprising walls, roofs and foundation, works as a thermal barrier
and plays an important role in determining the amount of energy necessary to maintain a
comfortable indoor environment.
According to Vesma (2009) “The significance of building fabric to the energy
manager lies in the opportunities that could present themselves to reduce heat loss from
buildings in cold weather.”
4.1.1.6 Lighting
Lighting is mostly not one of the largest energy consumers in industrial companies,
but it draws attention of most employees, it is one of the first points to be raised when
suggestions for saving energy are requested. (Vesma, 2009)
Most buildings usually provide opportunities to reduce the electrical energy use of
lighting systems. Savings are generally achieved by improved fixture efficiency, reduced
operating hours and reduced lighting levels.
However it should be considered that the objective of a lighting system is to provide
illumination at the times it is required, where it is required, at an appropriate level of
illumination, without causing distractions and without compromising safety, it means that
the overall lighting levels and colour of the light provided by the upgraded lighting systems
must be suitable for the tasks or objects being illuminated in each case.
4.1.1.7 Hot Water Services
According to Vesma (2009) the most costs in hot water services are directed to its
utilization in process applications, more common in drink, food, paper, plastic, chemicals
and textile industries.
Domestic hot water services (DHW) are essentially those needed for hygiene and
catering, they are not supposed to incur major costs.
Fossil fuels are used to generate hot water in boilers, such as natural gas, fuel oil,
coal and peat. The choice of fuel depends on availability and cost.
Hot water services also entail energy costs and should be evaluated in cases of
energy savings plan.
4.1.1.8 Industrial Cogeneration
Cogeneration is generally described as the simultaneous generation of combined
heat and power (CHP).

Monitoring, Measuring and Analysis
51
Morvay & Gvozdenac (2008) explain that it “…refers to the recuperation of waste
heat when electricity is generated and using it to create high temperature hot water or
steam or hot gases.”
The Figure 40 shows how an industrial cogeneration usually works.
Figure 40: Conceptual Scheme for Cogeneration System (Source: Morvay & Gvozdenac, 2008)
Cogenerated power is usually in the form of mechanical or electrical energy, while
the recovered heat is typically steam, hot water or hot gases, which can be used for some
production processes, space heating, producing sanitary hot water, or powering absorption
chillers for chilled water production.
The basic difference between cogeneration and CHP is that the first one is generally
identified with district heating and large utility owned power plants or industrial power
production and plant operation, while CHP is generally associated with smaller scale
energy units. (Patrick et al., 1993)
The best cogeneration situation is when there is a correspondence between power
and thermal demands, what not always happens, due to different reasons, like in the case of
seasonality where the consumption of space heating decreases in summer.
4.1.2 Basics for energy measuring and monitoring
In this part of the analysis some terms related to energy consumption are described,
in order to elucidate the concepts used in the paper.

Monitoring, Measuring and Analysis
52
4.1.2.1 Energy Baseline
Energy baseline is a quantitative reference that provides a basis for comparing
energy performance. (ISO 50001:2009 draft version)
The baseline defines the energy consumption of an organization before any energy
saving project, it is necessary for later comparisons and to quantify the benefits of the
projects.
4.1.2.2 Factors affecting Energy Baseline
“Some operational variables will have a significant impact on energy use in a
particular process while other variables will have only a minor impact.” (Australian
Government, 2008)
These aspects that affect the energy consumption must to be regarded when
establishing the energy baselines, they can be identified as:
Ambient conditions: like humidity and temperature, they can be
compensated with degree days;
Production rate: fixed energy overheads spread over greater production;
Product mix: some products are more energy intensive than others;
Raw materials: changes can increase or decrease energy consumption;
Occupancy: increasing number of employees raises energy consumption.
4.1.2.3 Degree Days
Is a measure of the variation of outside temperature and enable building designers
and users to determine how the energy consumption of a building is related to the weather.
It is calculated though the sum of the product of the difference in temperature
between the average outdoor and hypothetical average indoor temperatures and the number
of days the outdoor temperature is below 15.5°C. (Thumann, 2008)
That means: DD = ΔT x t
The daily data can then be totalled for any required period – a week, month or year
etc and compared directly with energy data.
“Degree days divided by the total number of days on which degree days were
accumulated will yield an average ΔT for the season, based on an assumed indoor
temperature of 15.5°C.” (Thumann, 2008)
4.1.2.4 Energy Efficiency
Energy efficiency refers basically to a ratio between useful energy or final energy
services and input energy. (Morvay & Gvozdenac, 2008)

Monitoring, Measuring and Analysis
53
According to McLean-Conner (2009) energy efficiency can also be considered as
an investment with a focus on reducing energy waste.
Energy efficiency can be improved in several ways, Moeller (2002) gives examples
suggesting technical changes in devices, which will enable the device to produce more
energy from the same amount of fuel, or provide the same service while using less energy.
The factors below tend to improve energy efficiency:
Increasing production levels;
Production of components from lower energy intensity materials;
Improving plant-running efficiency;
Reduction the fixed energy component of the plant;
Decreasing reject or scrap levels.
4.1.2.5 Energy Performance Targets
Energy performance targets can be established in different levels, they may be
presented to the top management as a general result from the organization, or may be
required by each line manager in the company in a more detailed level.
“The energy performance of an activity is expressed by the ratio of energy units and
the quantified results or aspects of this activity.” (Morvay & Gvozdenac, 2008)
The main consideration is that the targets should be realistic rather than theoretical.
Wherever possible, historical data are collected and energy utilization performance is
evaluated and targets are set.
4.1.2.6 Measurement Frequency
Measurement frequency has to be established for an accurate data collection,
excessively frequent data recording can overload operator with analysis requirements and
lack of data leads to errors. (Morvay & Gvozdenac, 2008)
To establish the moment of data reading is also important, a routine enable the
impartial assessment of energy performance.
For example, in a three-shift production site, the optimal meter reading can be set
up for the beginning of each shift.
Still according to Morvay & Gvozdenac (2008) all of the meters must be read at the
same time in order to ensure that the energy used corresponds to the amount of products
produced.
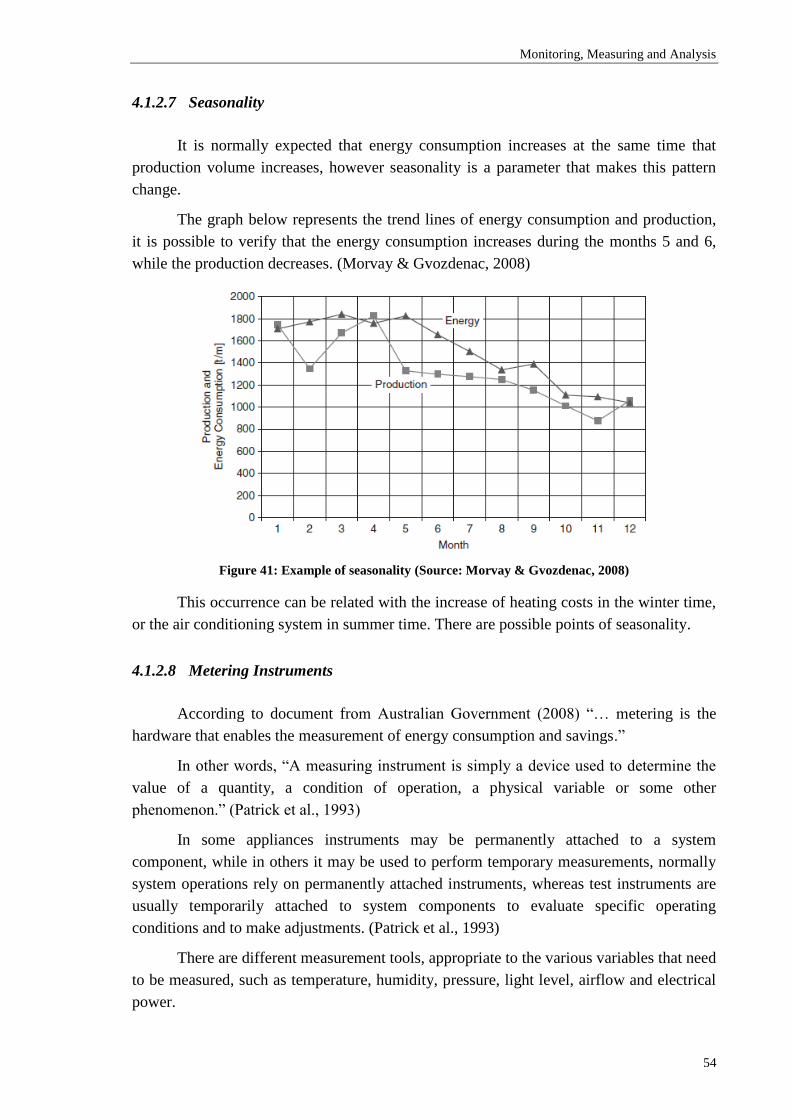
Monitoring, Measuring and Analysis
54
4.1.2.7 Seasonality
It is normally expected that energy consumption increases at the same time that
production volume increases, however seasonality is a parameter that makes this pattern
change.
The graph below represents the trend lines of energy consumption and production,
it is possible to verify that the energy consumption increases during the months 5 and 6,
while the production decreases. (Morvay & Gvozdenac, 2008)
Figure 41: Example of seasonality (Source: Morvay & Gvozdenac, 2008)
This occurrence can be related with the increase of heating costs in the winter time,
or the air conditioning system in summer time. There are possible points of seasonality.
4.1.2.8 Metering Instruments
According to document from Australian Government (2008) “… metering is the
hardware that enables the measurement of energy consumption and savings.”
In other words, “A measuring instrument is simply a device used to determine the
value of a quantity, a condition of operation, a physical variable or some other
phenomenon.” (Patrick et al., 1993)
In some appliances instruments may be permanently attached to a system
component, while in others it may be used to perform temporary measurements, normally
system operations rely on permanently attached instruments, whereas test instruments are
usually temporarily attached to system components to evaluate specific operating
conditions and to make adjustments. (Patrick et al., 1993)
There are different measurement tools, appropriate to the various variables that need
to be measured, such as temperature, humidity, pressure, light level, airflow and electrical
power.

Monitoring, Measuring and Analysis
55
These variables must be measured and evaluated periodically to maintain the
system at its peak level of efficiency, instrumentation and measurement are designed to
perform this function. (Patrick et al., 1993)
Energy metering technologies provide solutions for energy management by the use
of emerging technology advances in metering and communication systems. (EEOA -
Australian Government, 2008)
4.1.2.8.1 Temperature Meters
Temperature is one of the most common and most important measurement made in
evaluation of building equipments nowadays. Comfort heating equipment, air-conditioning
system operation, hot water equipment operation all demand some type of temperature
assessment. (Patrick et al., 1993)
For example, when measuring the temperature of an environment and it appears that
it is being heated more than necessary, it may indicate an energy waste, where more energy
is being used to achieve a heat level above than the desired one.
Two kinds of temperature meters can be identified: electrical or electronically and
nonelectrical meters.
4.1.2.8.2 Humidity Meters
“Control of the moisture content of air is a very important consideration in the
evaluation of air-conditioning equipment and heating system effectiveness.” (Patrick et al.,
1993)
Dry air can cause eye, nose, and throat irritation to people and employees may feel
uncomfortable, to improve the quality of the environment, in this case, it is generally
necessary to raise the room temperature. This obviously demands for longer equipment
operation cycles and increased energy consumption.
Not only people bear with the incorrect air moisture, it can also result in static
electric discharge, which can damage electronic equipments.
4.1.2.8.3 Pressure Meters
“Measurements of this type are used to evaluate equipment performance,
operational efficiency testing, and in routine maintenance procedures. Some pressure
measurements are performed on a continuous basis, whereas others are made temporarily.”
(Patrick et al., 1993)
For measure pressure equipments like Pressure Gauges and Manometers are used.

Monitoring, Measuring and Analysis
56
4.1.2.8.4 Power Measuring Instruments
Electricity meters are devices for measuring and recording the electricity flow and
consumption. Electrical power meters are known as wattmeter.
Not only electricity flow can be measured, Patrick et al. (1993) explains that the
power factor and power demand may also give important information.
Power factor is described as ratio of true power to apparent power. True power,
which is measured in watts (W), is an indication of the actual power being
converted into work by a particular component of system. Apparent power,
which is measured in volt-amperes (VA), is an indication of the power being
delivered to a system. It is important to monitor the power factor of an electrical
system in order to examine its efficiency. This has a great deal to do with the
amount of power that is being turned into work and that which is actually being
supplied by the system.
Power demand meters aim to measure the peak power (kW) used as compared with
the average power (kW) being used. This ratio of power consumption is an indication of
the amount of power that the utility company must supply above its predicted average
value for a particular building.
“The reading of a kilowatt-hour demand meter is similar in many cases to that of
the kilowatt-hour power meter.” (Patrick et al., 1993)
4.1.2.8.5 Flow Measuring Instruments
The understanding of flow instruments helps to recognize malfunctions and
evaluate the system consumption.
“Totalized flow measurement, instruments are designed primarily to respond to the
total amount of flow that moves past a given point during a specified period of time.”
(Patrick et al., 1993)
The measurement of liquid fuel, gas, and water all respond to some type of totalized
flow instrumentation.
4.1.2.8.6 Automated Meter Reading Systems (AMR)
Automated meter reading technique replaces the existing manual meter reading
operation, transferring meter reading data automatically to a central station or operator for
billing and monitoring purposes. (Shibu, 2009)
As stated by Shibu (2009) the meter reading data may be transferred over a wireless
communication channel or a wired communication medium. In the case of a wireless
channel it can be through radio frequency or power line communication module, radio
frequency is normally used with handheld equipments.

Monitoring, Measuring and Analysis
57
4.2 Methods and Instruments: Concept for Implementing or Improving
Equipments for Energy Data Collection
To manage energy successfully, it is necessary to measure how much energy has in
fact been used, that means collecting information and not simply relying on figures
provided by the utility companies.
Neither monitoring nor saving actions can be planned without appropriate metering
resources, this assumption defined the starting point for the analysis, the necessity of
installation or improvement of energy metering equipments.
Most of the companies do already keep track of their energy consumption numbers,
some using daily log sheets, others using manual meter readings and there are also
situations where remote metering and automatic recording is done.
Nevertheless, even in companies that already have established some parameters to
monitor energy consumption, not all data may be readily available. Usually they do not
have enough meters to control at a more detailed level, in these cases some additional
meters shall need to be installed on top of the existing ones to complete the performance
measurement system.
The higher the level of detail of a measurement system the better the accuracy of
the results but also the costs increase significantly.
Cost cutting has always been a subject present in the organizations routine, in this
way, even if it is important to have more detailed information about energy consumption,
sometimes it is not economically feasible.
Having in mind that a strategy for obtaining accurate energy data supports the
estimation, evaluation, measurement and tracking of energy efficiency and potential
savings opportunities, and that inaccurate meters are worse than not meter at all, but
excessive accuracy is neither required, nor economically justified, this part of the paper
describes a concept for guiding in the decision of implementing energy metering
equipments in a company, which assists the improvement of the Energy Management
System.
The process is divided into six steps, as shown in the Figure 42, the choice of the
steps was made based in experience inside the Knorr-Bremse Group, observing the flow of
information about energy consumption and complaints about difficulties to collect data.

Monitoring, Measuring and Analysis
58
Figure 42: Steps for Implementing an Energy Consumption Monitoring System
The extent of investment in new meters will vary from factory to factory depending
on the scope and sophistication of desired meters. Regardless of the data collection system
that will be implemented, the critical factors that must be ensured are data adequacy,
reliability and accuracy.
4.2.1 Define the processes and their boundaries
For identifying the priorities in positioning metering equipments, it is important
firstly to understand the processes, their energy inputs and outputs.
To help in the identification of the processes, the following steps are underlined:
1. Start with a general overview of the inputs and outputs;
2. Divide the possibilities of energy consumption in „big areas‟;
3. Divide the „big areas‟ in more specific fields.
4.2.1.1 General overview of inputs and outputs
It is not possible to effectively manage what we do not understand, therefore a
mapping of general energy inputs and outputs in an organization is required.
The suggestion is to start drawing a sketch or schematic of the energy flow, to have
an overview about what is included and what is not included in the analysis, this will help

Monitoring, Measuring and Analysis
59
to set up the ways that energy and mass can enter or exit the system and if there are any
internal sources or transformations of energy within the scheme.
Figure 43: Energy flow diagram
Figure 43 is an example of an energy flow diagram, the types of energy input/
output and the utilization of energy will vary according to each company.
4.2.1.2 Appointing “big areas”
The next step can define the big areas of an industrial company into which the
analysis can be split, this can also be considered as the first action that will help defining
the level of detail of data that will be analysed.
The following division was made based on the different characteristics that may
affect the comparison of performance indicators. (see Figure 44)
Figure 44: Big areas of energy consumption
This means that, in this case, it was considered the fact that it is not recommended
to compare an energy performance indicator used for analyse the energy consumption in an
office such as „kW/square meter‟ with an indicator used for production „kW/piece
produced‟.
This is not a pattern, other aspects can be taken into consideration, for example the
simple familiarity with the processes, where the choice of the criteria is a matter of
interpretation, or purely based in the knowledge of the person who is analysing the system.

Monitoring, Measuring and Analysis
60
4.2.1.3 The level of detail
The level of detail shall help to understand how deep to analyse the data, in some
cases it is necessary to go further in the investigation, analysing the energy consumers
more specifically and in other cases only a broad view is enough or economically viable.
The level of detail depends on the organization, it does not mean that all
measurements have to be in the same level of detail, but the description of the data and the
gathering of this kind of information help to have a general view of the energy consumers,
their inputs and outputs. It is a document that can be useful in further analysis.
The levelling can be done for each „big area‟ identified.
In the example below (Figure 45), the production area is used, initially a second
level is defined, where the different activities can be identified.
Figure 45: Production – key process identification
After identifying the main activities, a further step can be taken, dividing once more
the main activities, detailing the third and more specific level.

Monitoring, Measuring and Analysis
61
The following matrix was developed to help with the identification of activities,
their level of detail and their energy input/output, providing a general idea of where data
shall be collected. (See Table 10)
The levels indicate how the groups of energy consumers can be divided to facilitate
the data collection, they can be divided into process, systems, production line, machines,
halls, activities, specific tools, to name but a few.
The energy input part refers to the energy sources that can be measured, through
exact values or estimations and direct costs can be analysed.
The energy output part mention the energy that may be lost in each process. In
different situations, for example, energy lost due to malfunction of equipments that can be
illustrated by lost of compressed air in leakages during the process or energy that could be
reused but it is not being, for instance the possibility of reusing the thermal energy
(generated by steam processes) for heating halls, in this case it is the lost of a possibility to
use energy generated by an internal process.
Energy sources and energy loss were chosen as parameters in order that may
indicate potential sources of savings.
Table 10: Identification of Energy Sources and Consumers
Location:
Date:
Ga
s
Ele
ctr
icity
Fu
el (o
il /
co
al)
Co
mp
resse
d a
ir
Ste
am
Wa
ter
Ele
ctr
icity
Co
mp
resse
d a
ir
Th
erm
al e
ne
rgy
Ste
am
Wa
ter
Level 1 Level 2 Level 3 (…)
IDENTIFICATION OF ENERGY SOURCES AND CONSUMERS
Identification of energy inputs/ outputs
Energy Input Energy Output
This is an example; the characteristics may change for each different organization.
The choice of quantity of levels depends on accuracy required and the cost of
installing and maintaining metering equipments.
4.2.2 Gathering of information
Once having the overview of the energy sources and consumers that can be
analysed, the gathering of data about energy consumption can begin, which will help
defining where to concentrate efforts and investments.

Monitoring, Measuring and Analysis
62
This paper starts from the assumption that the organization that will use it does not
have enough metering equipments or measuring capacity to do a very detailed data
collection, in this case, some suggestions about potential sources to find the data are
presented in the next points:
Direct performance measurement, where metering equipments already exist;
1. Utility billing analysis;
2. Mathematical models and engineering calculations;
3. Supplier‟s classifications;
4. Estimations;
5. Analysis of data from manufacturers, contracts, design, recipes and etc.;
To improve the quality of the captured data, it is important to pay attention in the
following considerations:
1. Measurement parameters shall be established;
2. Existent meters and sub-meters shall be calibrated;
3. Measurement points shall be appointed;
4. Reasonable time intervals for collecting data shall be defined;
5. Data shall be collected over a sufficient time period.
External impacts, such as seasonal load, start-up and shut-down transients, weather
conditions and other process changes should be observed.
The data gathering is an important step to help quantifying the energy consumption
and their relevance, normally the most energy intensive processes are also a big potential
in energy savings opportunities.
For assisting the gathering of information, the Table 11 shown below, will be split
per energy source what helps to visualize what is required for each source. The fantasy
location of Wunderland was used to exemplify the procedures.

Monitoring, Measuring and Analysis
63
Table 11: Energy Consumption Data - Electricity
Location: Wunderland
Date: 22.10.2010
Co
nsu
mp
tio
n (
kW
h)
Pe
rce
nta
ge
Cu
mu
lative
pe
rce
nta
ge
Level 1 Level 2 Level 3 (…)
Production Machining M1
Machining M2
Machining M3
Machining M4
Machining M5
Machining M6
Assembly A1
Assembly A2
Assembly A3
Assembly A4
TOTAL:
* theoretical values, just for this example
ENERGY CONSUMPTION
Electricity
Different sort of data can be captured in the Manufacturing Sector, the Table 12
presents some examples.
The measurement units mentioned in the Table 12 are:
T / y: ton per year ;
M3 / y: cubic meter per year;
°C: Degree Celsius
kWh / y: Kilowatt-hour per year;
GJ / y: Giga joule per year.

Monitoring, Measuring and Analysis
64
Table 12: Data that can be collected in the manufacturing sector
(Source: Energy Savings Measurement Guide)
Category Quantifiable parameter Units
Mass balance Process streams Raw material purchased t / y
Material flows through each process stage t / y
Wasted product t / y
Finished product t / y
Water Incoming to site m3 / y
Discharged to sewer m3 / y
Water flows in each process and individual equipmentm3 / y
Energy balance Process water Temperature before heating/ cooling °C
Temperature after heating/ cooling °C
Process streams Temperature before heating/ cooling °C
Temperature after heating/ cooling °C
Electricity Electricity kWh / y
Steam Steam flow t / y
Gas Gas flow GJ / y or m3 / y
Chilled water Chilled water load kWh / y
Chilled water flow m3 / y
Hot water Hot water load kWh / y
Hot water flow m3 / y
Examples of data that can be captured in the manufacturing sector
After collecting this information, energy flows can be quantified and combined with
production inputs and outputs data to define consistent baselines, energy profile and energy
performance indicators and start a more accurate monitoring of energy consumption.
4.2.3 Analysis of energy consumption data collected
As soon as the data about energy consumption is pulled together, the next step is to
analysis the data to identify the priorities, where the resources should be directed. That
means, deciding which are the consumers that need more energy, in order to focus the
implementation of metering equipments in those cases, considering that the higher the
consume, the greater the saving potentials.
In this case, the Pareto Analysis is used.
Pareto analysis is the method of looking at all the root causes of a problem and
trying to determine which ones have the greatest frequency. In this case, it is to look at the
energy consumers and identify which ones have the greatest significance.
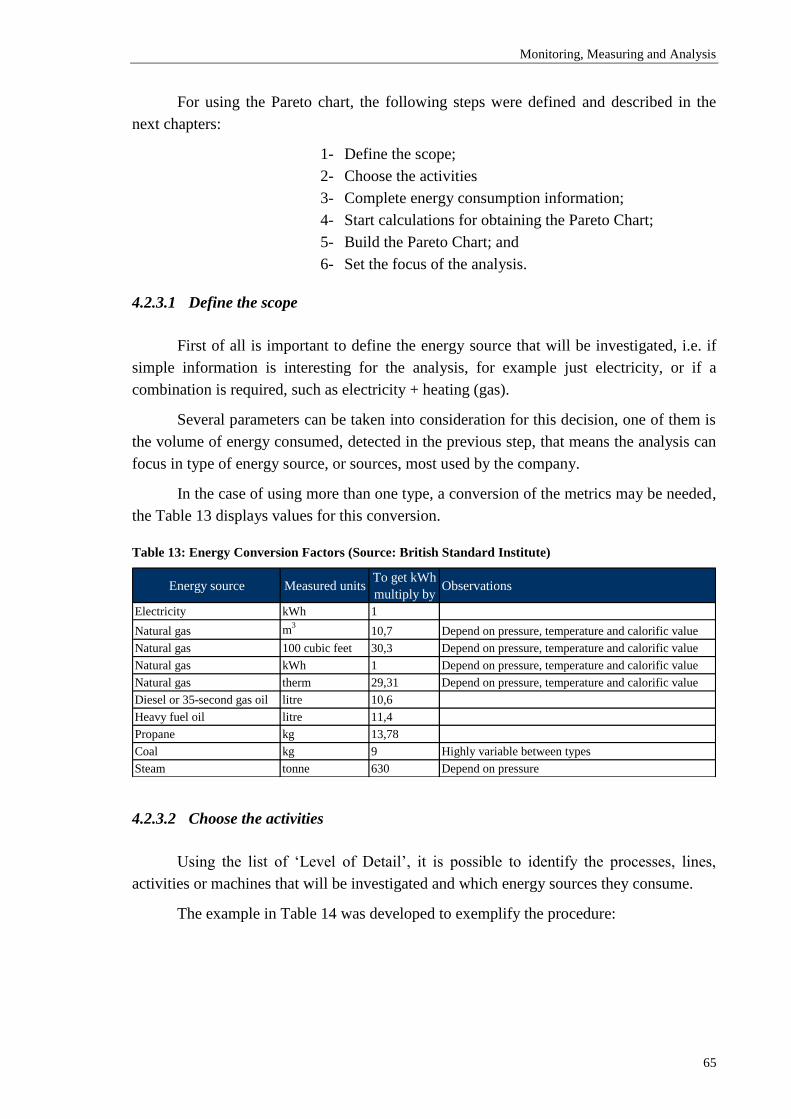
Monitoring, Measuring and Analysis
65
For using the Pareto chart, the following steps were defined and described in the
next chapters:
1- Define the scope;
2- Choose the activities
3- Complete energy consumption information;
4- Start calculations for obtaining the Pareto Chart;
5- Build the Pareto Chart; and
6- Set the focus of the analysis.
4.2.3.1 Define the scope
First of all is important to define the energy source that will be investigated, i.e. if
simple information is interesting for the analysis, for example just electricity, or if a
combination is required, such as electricity + heating (gas).
Several parameters can be taken into consideration for this decision, one of them is
the volume of energy consumed, detected in the previous step, that means the analysis can
focus in type of energy source, or sources, most used by the company.
In the case of using more than one type, a conversion of the metrics may be needed,
the Table 13 displays values for this conversion.
Table 13: Energy Conversion Factors (Source: British Standard Institute)
Energy source Measured unitsTo get kWh
multiply byObservations
Electricity kWh 1
Natural gas m3
10,7 Depend on pressure, temperature and calorific value
Natural gas 100 cubic feet 30,3 Depend on pressure, temperature and calorific value
Natural gas kWh 1 Depend on pressure, temperature and calorific value
Natural gas therm 29,31 Depend on pressure, temperature and calorific value
Diesel or 35-second gas oil litre 10,6
Heavy fuel oil litre 11,4
Propane kg 13,78
Coal kg 9 Highly variable between types
Steam tonne 630 Depend on pressure
4.2.3.2 Choose the activities
Using the list of „Level of Detail‟, it is possible to identify the processes, lines,
activities or machines that will be investigated and which energy sources they consume.
The example in Table 14 was developed to exemplify the procedure:
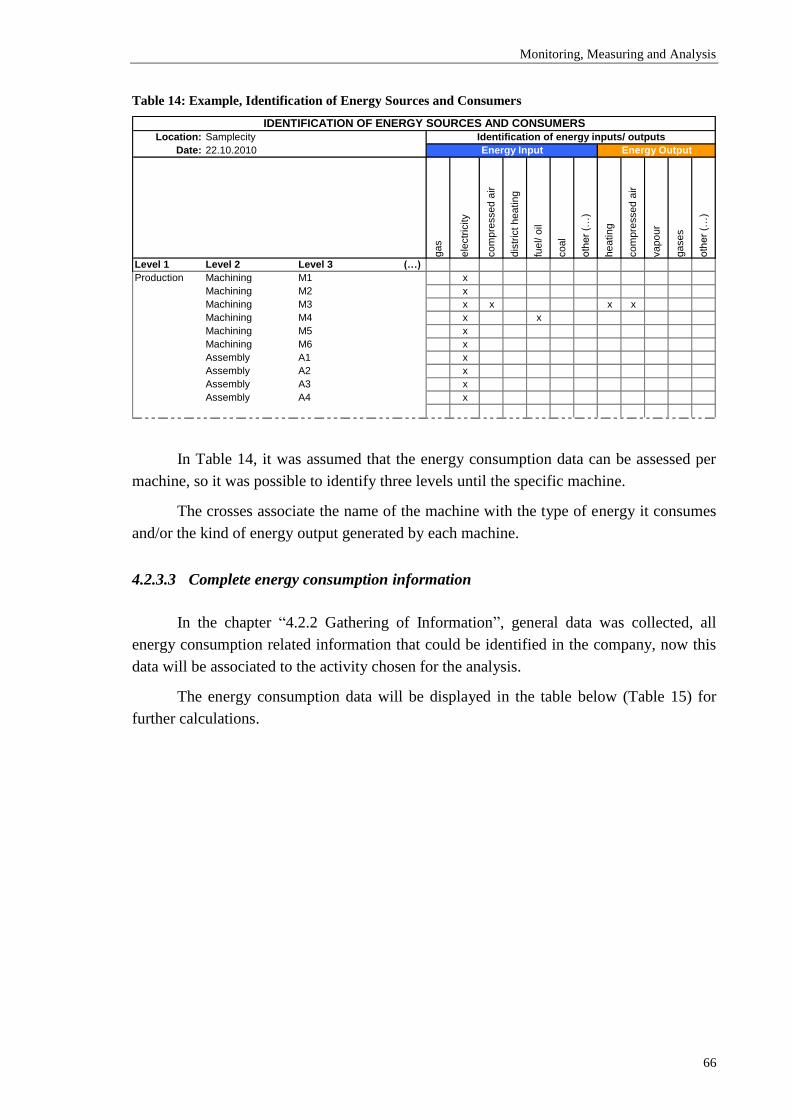
Monitoring, Measuring and Analysis
66
Table 14: Example, Identification of Energy Sources and Consumers
Location: Samplecity
Date: 22.10.2010
ga
s
ele
ctr
icity
co
mp
resse
d a
ir
dis
tric
t h
ea
tin
g
fue
l/ o
il
co
al
oth
er
(…)
he
atin
g
co
mp
resse
d a
ir
va
po
ur
ga
se
s
oth
er
(…)
Level 1 Level 2 Level 3 (…)
Production Machining M1 x
Machining M2 x
Machining M3 x x x x
Machining M4 x x
Machining M5 x
Machining M6 x
Assembly A1 x
Assembly A2 x
Assembly A3 x
Assembly A4 x
IDENTIFICATION OF ENERGY SOURCES AND CONSUMERS
Identification of energy inputs/ outputs
Energy Input Energy Output
In Table 14, it was assumed that the energy consumption data can be assessed per
machine, so it was possible to identify three levels until the specific machine.
The crosses associate the name of the machine with the type of energy it consumes
and/or the kind of energy output generated by each machine.
4.2.3.3 Complete energy consumption information
In the chapter “4.2.2 Gathering of Information”, general data was collected, all
energy consumption related information that could be identified in the company, now this
data will be associated to the activity chosen for the analysis.
The energy consumption data will be displayed in the table below (Table 15) for
further calculations.

Monitoring, Measuring and Analysis
67
Table 15: Example, Energy Consumption Data
Location: Wunderland
Date: 22.10.2010
Co
nsu
mp
tio
n (
kW
h)
Pe
rce
nta
ge
Cu
mu
lative
pe
rce
nta
ge
Level 1 Level 2 Level 3 (…)
Production Machining M6 32
Machining M5 498
Machining M4 22
Machining M3 302
Machining M2 12
Machining M1 80
Assembly A4 4
Assembly A3 2
Assembly A2 38
Assembly A1 10
TOTAL: 1000
* theoretical values, just for this example
Electricity
ENERGY CONSUMPTION
4.2.3.4 Start calculations for obtaining Pareto Chart
As soon as the relevant data is chosen, collected and organized, it is possible to start
the calculations.
For calculating:
First organize the values from the highest to the smallest;
Then, calculate the total of energy consumed;
Calculate percentages, related to the total amount;
100*1
1
n
M
Mx
Being:
( 1 )
β = consumption of Machine in %
Mx = consumption of Machine x
Calculate cumulative percentages; will include the percentage of
consumption for that category plus the percentage for all categories
preceding it in the list.

Monitoring, Measuring and Analysis
68
The table below exhibits the four steps for calculating, the first column shows the
values of energy consumption already organized from the largest to the smallest, the
second column is the percentage from each consumer and the third one displays the
cumulative percentages.
Table 16: Example, Data for Pareto Analysis
Location: Wunderland
Date: 22.10.2010
Co
nsu
mp
tio
n (
kW
h)
Pe
rce
nta
ge
Cu
mu
lative
pe
rce
nta
ge
Level 1 Level 2 Level 3 0 0
Production Machining M5 1 498 49,80% 49,80%
Machining M3 2 302 30,20% 80,00%
Machining M1 3 80 8,00% 88,00%
Assembly A2 4 38 3,80% 91,80%
Machining M6 5 32 3,20% 95,00%
Machining M4 6 22 2,20% 97,20%
Machining M2 7 12 1,20% 98,40%
Assembly A1 8 10 1,00% 99,40%
Assembly A4 9 4 0,40% 99,80%
Assembly A3 10 2 0,20% 100,00%
TOTAL: 1000 100%
* theoretical values, just for this example
Data for Pareto Analysis
Electricity
4.2.3.5 Build the Pareto Chart
After the calculations, it is possible to build the Pareto Chart using the excel, the
results can be represented in several forms, such as in Figure 46 and Figure 47.
0%
10%
20%
30%
40%
50%
60%
70%
80%
90%
100%
1 2 3 4 5 6 7 8 9 10
Percent Cumulative
Figure 46: Example, Pareto Chart

Monitoring, Measuring and Analysis
69
The Figure 39 features the percentage and cumulative percentage values, while the
Figure 40 trace a curve with the sum.
0%
10%
20%
30%
40%
50%
60%
70%
80%
90%
100%
0 2 4 6 8 10
Figure 47: Example, Pareto Chart 2
Knowing that this example was developed with 10 machines, it is easy to see that
two of the machines from the third level consume 80% of electricity, while the other eight
are responsible for the rest 20%.
4.2.3.6 Set the focus of the analysis
The next step is to analyse the results of the Pareto chart, to define the focus for
implementing energy metering equipments.
Dividing the Pareto in areas of impact helps visualising the analysis.
Figure 48: Example, Pareto Analysis

Monitoring, Measuring and Analysis
70
The Figure 48 shows that 20% of the machines/ activities use 80% of energy, 50%
consumes 95% and the other 50% utilizes the rest 5%.
Sometimes the actual percentage may differ from 80% - 20%, the important thing is
to identify and focus the group of largest energy consumers.
The alternative is to start focusing in the region „A‟ of the Pareto chart, assuming
that for being the largest energy consumers, they will also present the greatest saving
potentials.
Part „A‟ is formed by M5 and M3, both from the Machining process.
It does not mean that the other 80% of the consumers will be totally ignored, it just
suggests starting the investigation focusing consumption characteristics.
4.2.4 Identification of other factors that should be taken in consideration
It does not mean that after having identified the largest energy consumers the
implementation or improvement of metering system can immediately begin, before starting
to define where to take actions, other aspects should be taken into consideration.
In every industry there are recurring problems driving to higher energy
consumption rates and costs. If adequately metered, these problems can be actively
monitored and prevented, generating quick wins.
An investigation of anomalies in performance should be carried out, with the
purpose of removing likely causes of poor energy efficiency performance.
Tracking and reporting the energy use allows itself to prompt intervention in cases
where the correction should be required, and will also help to lock in and maintain energy
savings that have currently been achieved.
It means that also trend analysis must be performed, where information is available,
in the example used in this paper, the M1 is not included in the „A‟ area of the Pareto chart,
however assuming that the analysis of the trends of M1 shows energy consumption ranging
during weekends when the factory is shut down. It may indicate an anomaly, showing that
even if M1 was not identified as a higher potential for energy savings due to level of
consumption, it deserves closer attention.
The Table 17 shows the possible typical problems that can cause anomalies in
energy consumption trends.

Monitoring, Measuring and Analysis
71
Table 17: Typical problems that can cause energy waste (Source: Australian Government, 2008)
System Typical problems
1 Process Operations incorrect set-points
fouled heat exchangers
advanced controls switched off
poor control timing
2 Boilers operating conditions hours (on/off) and outputs (low/high)
poor air-fuel ratio
fouled heat exchangers
excessive blow-down
incorrect excess air ratio
air leakages
poor fuel quality
3 Steam leaks
failed traps
poor isolation insulation
incorrect set-points
low condensate return
4 Refrigeration reduced air flow (e.g. fouled condenser, faulty fan/motor)
air in condenser
incorrect superheat settings
high head pressure settings
incorrect compressor selection
5 Compressed air leaks
poor compressor control
incorrect pressure
6 Space heating/ cooling excessive space temperature
excessive fun power use
overcooling
heating and cooling
high chilled water temperature
7 Power generation poor engine performance
incorrect control settings
poor cooling tower operation
fouled heat exchanges
8 Transport real time driver tracking (idling time, behaviour)
traffic congestion
engine running hours high (truck maintenance due)
Where a trend analysis is not feasible, the analysis of historical data can be carried
out, verifying the relevance and occurrence of these problems. Each of them should be
treated separately and their causes should be identified.

Monitoring, Measuring and Analysis
72
4.2.5 Analysis of existing tools
Until this point it was possible to identify:
Energy sources and energy consumers;
General values of energy consumption;
Largest energy consumers;
Possible anomalies in energy consumption trends, or typical problems.
Based on this information, a list can be prepared, containing the order of priorities
for the establishment of energy metering equipments, thus it is possible an overview from
the deployment needs.
However, it may be that some of the priorities already have suitable metering
equipments, in this case a survey of existing equipments is required. An investment in new
equipments where they already exist means unnecessary costs.
For assisting the comparison between what should be implemented and what
already exists, it is suggested to use the information that follows.
The identified methods used for metering were divided into five categories:
Frequency: how often is possible to use the equipment and acquire desired
information;
Mobility: the likelihood of using the equipment in more than one machine;
Data collection: the ease of collecting data, if it is an automatic meter
reading or manual;
Focus: if it is possible to assemble more than one kind of data;
History: if the data is recorded.
For each of the categories were given a value in order to simplify the survey:
Table 18: Metering Characteristics
V Frequency Mobility Data collection Focus History
3 daily to bimonthly remote Wireless AMR multi indicators with data storage
2 montly to biannual portable AMR with records
1 annualy fixed manual specific parameters without records
For sake of simplicity, the punctuation of column „V‟ can be use to fulfil the table,
being 3 the most accurate and complete and 1 the simplest condition.
The Table 19 can assist in the assessment, it was combined with the consumption
data table and the fields are to be filled in as follows:
A – Value in the metric chosen (kWh, Btu, m3, etc);
B – Percentage related to the total amount;
C – Cumulative percentage;

Monitoring, Measuring and Analysis
73
D – Position where the metering equipment is located;
E – Frequency of measuring;
F – Mobility of the metering equipment;
G – The automaticity of data collection;
H – The specificity of the equipment;
I – How the equipment records the data collected;
J – Name or type of metering system or metering equipment used;
K – Type of energy output/ loss;
L – If the output/ loss is measured (yes or no)
M – Total amount of consumption of energy;
N – Location where the data was collected;
O – When the data was collected.
Table 19: Electricity Consumption Analysis (final table)
Location: N
Date: O
Con
su
mp
tio
n
Pe
rce
nta
ge
Cum
ula
tive
pe
rce
nta
ge
Le
ve
l
Fre
qu
en
cy
Mo
bili
ty
Data
co
llectio
n
Fo
cu
s
His
tory
Typ
e/
Mo
de
l/ N
am
e o
f
me
teri
ng
eq
uip
me
nt
Typ
e o
f e
ne
rgy
ou
tpu
t/ lo
ss
Me
asu
red
(y /
n )
Level 1 Level 2 Level 3 (…)
A B C D E F G H I J K L
Production Assembly A1
Assembly A2
Assembly A3
Assembly A4
Machining M1
Machining M2
Machining M3
Machining M4
Machining M5
Machining M6
TOTAL M
ELECTRICITY CONSUMPTION ANALYSIS
Identification of energy inputs/ outputs
Electricity - Input Output
In ownership of such data, one can verify which equipments already exist and what
are their characteristics.
4.2.6 Plan metering and measurement
Bearing in hand the information suggested in the previous points, the plan phase can
be undertaken. The following table was formulated to clarify the actions that can be taken
in planning.

Monitoring, Measuring and Analysis
74
Figure 49: Plan to Introduce Instruments for Energy Consumption Data Monitoring
The field priority is to be filled in with the importance of the activity to achieve the
results of the planned action, considering 1 high, 2 medium and 3 low.
4.2.6.1 Budget
The definition of a budget serves as an input to know what measures are possible to
be taken, which limits implementation or improvements can reach.
The optimal is a definition of budget made by the top management, where they use
the specific parameters established for each case, each organization.
Another option, according to literature consulted, is to define a budget of maximum
1,5%3 of annual cost of energy. (Australian Government, 2008)
The U.S Department of Energy, in the International Performance Measurement and
Verification Protocol of 2002, suggests that the investments should not be higher than 50%
3 This number was achieved making a comparison with the salary of a worker. Example, considering €
60.000/ year as the salary of the employee. That would mean metering and monitoring at € 60.000 of energy
/year, which refers to a motor running continuosly that work out at about 60kW, generating a cost of 10
cents/kWh. Supplying and installing an appropriate sub-meter, communications and monitoring would cost
about € 1.000, so we come to around 1,5%.

Monitoring, Measuring and Analysis
75
of the cost-effectiveness of decreasing uncertainty in savings calculations by implementing
the new meters, in other words, it is not recommended to spend more than 50% from the
value of the guaranteed savings achieved due to improved accuracy obtained by installing
new equipments.
4.2.6.2 Instruments
The choice of instruments can be done with the help of a sub-contractor or with an
internal research conduced by facility manager, production manager or any other
responsible for energy consumption monitoring.
Specification of frequency, mobility, the way the data is recorded, all the
characteristics previously mentioned in Table 16, have to be taken into consideration when
choosing the most suitable metering equipment.
Specification of the metering points, periods of metering, meter characteristics,
meter reading and witnessing protocol, meter commissioning procedure, routine calibration
process and method of dealing with lost data, shall be taken into consideration.
The acquisition of the equipment, its installation, its calibration, its handling, the
possibility of contracting a third party for assisting choosing and installing and all other
costs incurred in this activity, have to be coherent with the budget previously defined.
4.2.6.3 Saving potentials
Just measuring does not help, right after having defined what and how to measure,
objectives, targets and performances shall be determined.
Before determining targets, saving potentials should be identified, so targets can be
related to them. Saving potential can be identified in all parts of an organization and may
represent quick wins.
An example is the case of the company 3M, where investments in different ambits
were made, such as heat recovery systems, high efficiency motors, variable speed drivers,
computerized facility management systems, steam trap maintenance, combustion
improvements, variable air volume systems, thermal insulation, cogeneration, waste steam
utilization and shifting to non-hazardous solvents. Such modifications resulted in
remarkable improvements in energy efficiency, 3M counts with 3% of energy savings per
year for the next 5 years, as results of these improvements. (Capehart, 2008)
4.2.6.4 Targets definition
Knowing where improvements can be done, it becomes easier to recognize where to
focus the efforts and consequently measure the results of these efforts.
Monitoring, Measuring and Analysis
76
Energy efficiency goals are set and then the results are measured against a baseline,
or set standard, in order to determine the success of the programs.
4.2.6.5 Baseline adjustments
After having the real data provided by the new metering system, an adjustment in
the baselines is reasonable, it can be planned from the second year of the new system.
4.2.6.6 Responsible
Holding people responsible for specific results facilitates the achievement of
targets, there are different ways to define the person in charge, it may be the operator of the
machine, someone that works in the production line or is more familiarized with the
process.
The concept of Energy Cost Centre can also be used to support defining the
responsibilities
4.2.6.6.1 The Energy Cost Centres (ECC)
“Energy Cost Centre can be a department, a process, or unit of equipment, where
the use of raw materials, energy consumption and environmental impacts can be related to
ongoing activities and be continuously monitored.” (Morvay & Gvozdenac, 2008)
There are no defined rules to arrange an ECC, a good way is by defining
parameters, for instance a product, line or type of machine, where it is possible to directly
measure the output, define the cost of measurement, designate responsibility to a person
working in that area, standardized performance indicators and set realistic targets for
improvements.
Thereby the ECC helps to decentralize responsibilities inside the organization and
assigns responsibilities centres for energy cost and performance, this enables to allocate the
responsibilities to an individual or a team of people.
The Figure 50 represents an example for different forms of defining ECCs:

Monitoring, Measuring and Analysis
77
Figure 50: Example of Energy Cost Centres (ECC)
The proposed approach can be changed and adapted in the ways most suitable for
any particular case.
4.2.6.7 Continuous improvement
The installation or implementation of energy metering equipments should not be a
„one time‟ activity. The idea is to keep improving until all areas will be covered, something
that should take a long time period.
Every year, after the analysis of energy consumption it will be possible to identify
new improvement potentials and new implementation plans should start.
4.2.6.8 Communication
Decisions should be reported and communicated, responsible must be recognized
by the teams, the status of the budget and resources shall be updated, comments about
benefits and failures shall be divulgated as well as both initial setup costs and ongoing
costs throughout the adjustment period.
Well-informed employees are more motivated to participate in the results.

Monitoring, Measuring and Analysis
78
The Figure 51 helps to identify the main steps created for this concept, it is a
summary of the flow of the activities.
Figure 51: Summary of the flow of the activities
The next chapter presents three examples where the concept was applied, the data
was collected with help of the employees from the Health Safety and Environment (HSE)
department of each location analysed.

Monitoring, Measuring and Analysis
79
4.3 Analysis of results: Using the Concept for Implementing or Improving
Instruments for Energy Data Collection
The process identified in the Figure 51 was applied in three different production
sites of Knorr-Bremse Group: Aldersbach (Germany), São Paulo (Brazil) and Bristol (UK).
The results are described in this chapter.
4.3.1 Production Site Aldersbach (Germany)
The location of Aldersbach (ALD), with 800 employees, produces mainly disk
brakes and electronic air control (EAC), it was chosen due to the size and relevance of its
site. A visit to the location was made where the information was collected.
4.3.1.1 Define processes and boundaries (ALD)
First of all the sources of energy were identified together with the potential losses of
energy, see Appendix III.
Then the „big areas‟ were defined, being:
Production, understanding the energy expenditures directed related to the
activities of producing;
Plant, comprehending the energy costs for facilities in the production, such
as lighting and heating;
Warehouse, being the facilities for the storage area; and
Office, relating the facilities for the office area.
The „big areas‟ were further divided according to the rooms, this occurred because
the buildings in Aldersbach were constructed in different periods, having different
electricity installations.
In this case it was possible to define five levels, because of the information
available, this information was not collected by electricity metering equipments, but
through estimations.
It was concluded in the meeting that electricity consumption counts the most in
Aldersbach, this was the starting point.
4.3.1.2 Gathering of information (ALD)
Data was collected in two ways, first the general electricity consumption obtained
in the electricity bills, how presented in Figure 52.

Monitoring, Measuring and Analysis
80
It was identified a representative fall of energy consumption between the years of
2008 and 2009. That does not occur due to planned activities to improve energy efficiency,
but because the economical crises of 2008/2009.
ALD - Electricity Energy Consumption (kWh)x 1.000.000
27,9
16,9
4,64,33,84,3
0
5
10
15
20
25
30
2008 Q1 Q2 Q3 Q4 2009 Total
Figure 52: Aldersbach – Electricity Consumption 2009 (Source: KB intranet)
Taking into consideration that Aldersbach does not have the suitable electricity flow
meters for measuring specific processes, lines, machines and so on, it was necessary to
estimate the consumption.
The data from 2008 was considered for the estimation, since the crisis affected the
numbers from 2009 taking from them the characteristics they should have to be appropriate
to be used as baseline.
In the second place, it was identified that € 2.858.344 were spend in 2008 in
Aldersbach in electricity.
4.3.1.3 Analysis of data collected (ALD)
For sake of simplicity in this paper, the scope was defined before collecting the
data, being defined that only electricity consumption would be analysed.
Having the scope defined, the activities and their level of detail were chosen and
can be identified in the Appendix IV, together with respective energy consumption
information and calculations for obtaining the Pareto Chart.
After the calculations of available data it was possible to draw the Pareto Chart,
which is represented in Figure 53:

Monitoring, Measuring and Analysis
81
ALD - Electricity Consumption (%)
0%
10%
20%
30%
40%
50%
60%
70%
80%
90%
100%
1 3 5 7 9 11 13 15 17 19 21 23 25 27 29 31 33 35 37 39
Figure 53: Aldersbach – Pareto Analysis
With the aid of the Pareto Analysis, the identification of largest electricity
consumers was made.
Only six (representing 16%) from the 38 estimations account for 81,45% of
electricity costs, the main consumers are phosphating, anodizing, comprising all activities
from surface treatment and production facilities, finishing 1 and 2 from halls 9.3 and 9.4
that produce disk brakes.
After recognizing the largest electricity consumers, the next step would be to
analyse the typical problems that can cause energy waste and consequently, are potential
energy savings opportunities.
4.3.1.4 Identification of other factors (ALD)
From the activities that were outside the list of largest consumers, basically
assembly, forklift charging and office facilities, it is possible to relate typical problems in
process operations, compressed air and transport.
The facility manager and the HSE manager at Aldersbach mentioned the loss of
compressed air in the tools from assembly processes, in this case, it would be more
reasonable to analyse the losses of compressed air, and not of electricity for generating the
compressed air.
The analysis of losses in electricity for generating compressed air shall be done in
the beginning of the process, directly by the compressors, there are no data available in this
case.
Staying with the analysis of the six largest electricity consumers in Aldersbach and
continuing the study, before planning the implementation of new metering equipments, it is
necessary to verify which ones already exist.

Monitoring, Measuring and Analysis
82
4.3.1.5 Analysis of existing instruments (ALD)
Some metering equipments were identified in the location, however all of them had
only the purpose of measuring the instantaneous capacity, no one of them are suited for
assisting the management of data.
The last step is a plan for installing (adapting or improving) electricity metering
equipments.
4.3.1.6 Plan and measure
For the definition of the budget, this example will take into consideration the studies
from the Australian Government and use the 1,5% of the total energy consumption of the
previous year.
In Aldersbach, in 2009, were spent € 2.858.344,00 in electricity, from which 1,5%
is equal to € 42.875,16 , considering that implementations will be made in 6 different
areas, this value were divided into 6, resulting € 7.145,86 per activity.
The plan for the Phosphating area is represented in the figure below:
Figure 54: Aldersbach, Plan to Introduce Instruments for Energy Consumption Data Monitoring

Monitoring, Measuring and Analysis
83
The figure representing the plan for Aldersbach is just an example about how the
process would work, the actual implementation is the next step planned, which requires
considerable time.
4.3.2 Location Bristol – United Kingdom
The location of Bristol (BRI) is dedicated to remanufacturing of compressors and
brake chambers and count with circa 180 employees, it was chosen due to the high level of
organization in terms of quality and environmental management systems.
The production site is divided in two parts, being Kingswood where the
remanufacturing factory is and Century House formed by office, warehouse and facility.
Both sites are only 7km apart from each other.
4.3.2.1 Define processes and boundaries (BRI)
In this site, the definition of energy consumers was done only until level 4, as
shown in the Table 20. The „big areas‟ were defined in the level 2 as production,
administration, quality, stores, plant, support services, warehouse and offices.
Table 20: Bristol – Identification of Energy Sources and Consumers
Location: Bristol
Date:
Ga
s
Ele
ctr
icity
Fu
el (o
il /
co
al)
Com
pre
sse
d a
ir
Ste
am
Wa
ter
Ele
ctr
icity
Com
pre
sse
d a
ir
Th
erm
al e
ne
rgy
Ste
am
Wa
ter
Level 1 Level 2 Level 3 Level 4
Kingswood Site Production Remanufacture X X X X X X X X
Kingswood Site Production Basement Valve Assembly X X X X
Kingswood Site Production Machine Shop X X X X X X
Kingswood Site Production Welding Shop X X X X X X
Kingswood Site Production Assembly Shop X X X X X
Kingswood Site Administration Office X X
Kingswood Site Quality Standards Room X X
Kingswood Site Quality Customer Quality X X X X X
Kingswood Site Stores Machine Shop Raw material storage X
Kingswood Site Stores Assembly shop Detail part storage X
Kingswood Site Stores Basement Goods receiving X X X
Kingswood Site Plant Facilties X X X X X X X X
Kingswood Site Support services Maintenance/Labels X X X X X
Kingswood Site Plant Computer support areas X X
Kingswood Site Plant Facilties Air Compressors X X X X X
Century House Warehouse Finished goods storage X X
Century House Warehouse Product kitting X X
Century House Offices Ground Floor X X
Century House Offices First Floor X X
Century House Plant Facilties X X X X X X X
Century House Warehouse Service Area Compressor X X
Century House Plant Common rooms Computer support X X X
IDENTIFICATION OF ENERGY SOURCES AND CONSUMERS
Identification of energy inputs/ outputs
Energy Input Energy Output

Monitoring, Measuring and Analysis
84
4.3.2.2 Gathering of information (BRI)
The same general electricity consumption data, as Aldersbach, is available for
Bristol, the electricity consumption acquired from the supplier‟s bills, showing the same
patterns due to the crisis, as in Figure 55.
BRI - Electricity Energy Consumption (kWh)x 1.000.000
1,41,6
0,40,3 0,3
0,4
0
0
0
1
1
1
1
1
2
2
2008 Q1 Q2 Q3 Q4 2009 Total
Figure 55: Bristol – Electricity Consumption 2009 (Source: KB intranet)
In 2008, Bristol had expenses of € 205.640,00 in electricity, for both together
Century House and Kingswood.
4.3.2.3 Analysis of data collected (BRI)
As in the previous case, to make possible the comparison of analysis, it was chosen
the investigation of electricity data.
In this case, however, there are no detailed data, not even gathered through
estimations, the only available data were the electricity bills and a resource about
electricity consumption by compressors.
This research has been done during the last six months, in the results it was possible
to identify that compressors have an average electricity consumption of 1,06% per month
over the total amount.
For these reasons, the analysis was divided in two groups of activities: office +
production and compressed air.
Having these data in hands, the calculation of consumption was done and is
represented in the Table 21, as follows.

Monitoring, Measuring and Analysis
85
Table 21: Bristol – Electricity Consumption 2009
Location: Bristol
Date: 17.09.2010
Con
su
mp
tio
n (
kW
h)
Pe
rce
nta
ge
Cum
ula
tive
pe
rce
nta
ge
Le
ve
l w
he
re m
ete
rin
g
eq
uip
me
nts
alr
ea
dy
exis
t
Fre
qu
en
cy
Mo
bili
ty
Data
co
llectio
n
Fo
cu
s
His
tory
Typ
e/
Mo
de
l/ N
am
e
Typ
e
Me
asu
red
(y /
n )
Level 1 Level 2
Production + Office 1,58 98,94% 98,94% 1 1 1 Estimation no
Compressed air Compressed air 0,02 1,06% 100,00% 1 1 1 Estimation no
TOTAL 1,6 100,00% Electricity bill
Electricity Consumption 2009 (Analysis)
Identification of energy inputs/ outputs
Electricity - Input Output
The Pareto Analysis makes no sense in this situation, where only two factors are
presented, it is possible to skip it and go straight to the analysis of other factors or
anomalies.
4.3.2.4 Identification of other factors and existing instruments (BRI)
In this case, the identification of other factors or anomalies will be part of the main
final plan.
The next step would be to identify the existing metering equipments, but no meters
were identified.
4.3.2.5 Plan and measure (BRI)
Considering that Bristol consumed € 205.640,00 of electricity in 2009, and using
the same assumption as the example before, 1,5% of this amount is equal to € 3.084,60,
which is the value budgeted for the next period.
The plan for Bristol is shown below in the Figure 56:

Monitoring, Measuring and Analysis
86
Figure 56: Bristol – Plan to Introduce Instruments for Energy Consumption Data Monitoring
The plan for Bristol is also just an example, further work in developing an adequate
plan is required and considerable time should be dedicated for it.
4.3.3 Location São Paulo - Brazil
The site production of São Paulo has 727 employees and there, practically all sort of
Knorr-Bremse products are manufactured, it was chosen randomly.
The construction of a new plant in São Paulo is planned for the next year, in this
way the employees that sent the information about the location suggested to start doing the
identification of the levels of energy consumers after the plant is ready.
Until this moment the analysis of the electricity consumption in São Paulo is made
through estimation and distributed into Rail and Truck (CVS) that are further divided into
two „big areas‟, office and production.
4.3.3.1 Gathering of information (SAO)
Data found for the year 2008 shows that the whole location consumed 5.500.000
kWh as showed in Figure 57, from which 25% are considered to be spent by the office and
75% by the production, as represented in the Table 22.
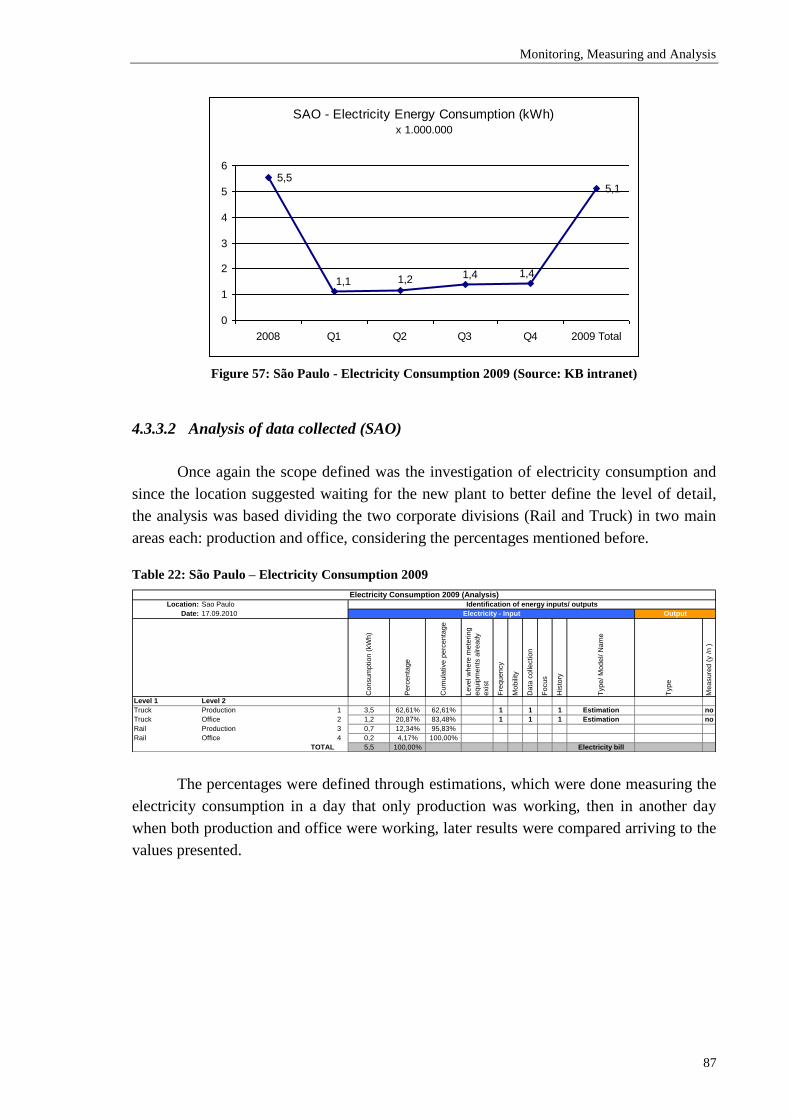
Monitoring, Measuring and Analysis
87
SAO - Electricity Energy Consumption (kWh)x 1.000.000
5,55,1
1,1 1,2 1,4 1,4
0
1
2
3
4
5
6
2008 Q1 Q2 Q3 Q4 2009 Total
Figure 57: São Paulo - Electricity Consumption 2009 (Source: KB intranet)
4.3.3.2 Analysis of data collected (SAO)
Once again the scope defined was the investigation of electricity consumption and
since the location suggested waiting for the new plant to better define the level of detail,
the analysis was based dividing the two corporate divisions (Rail and Truck) in two main
areas each: production and office, considering the percentages mentioned before.
Table 22: São Paulo – Electricity Consumption 2009
Location: Sao Paulo
Date: 17.09.2010
Con
su
mp
tio
n (
kW
h)
Pe
rce
nta
ge
Cum
ula
tive
pe
rce
nta
ge
Le
ve
l w
he
re m
ete
rin
g
eq
uip
me
nts
alr
ea
dy
exis
t
Fre
qu
en
cy
Mo
bili
ty
Data
co
llectio
n
Fo
cu
s
His
tory
Typ
e/
Mo
de
l/ N
am
e
Typ
e
Me
asu
red
(y /
n )
Level 1 Level 2
Truck Production 1 3,5 62,61% 62,61% 1 1 1 Estimation no
Truck Office 2 1,2 20,87% 83,48% 1 1 1 Estimation no
Rail Production 3 0,7 12,34% 95,83%
Rail Office 4 0,2 4,17% 100,00%
TOTAL 5,5 100,00% Electricity bill
Electricity Consumption 2009 (Analysis)
Identification of energy inputs/ outputs
Electricity - Input Output
The percentages were defined through estimations, which were done measuring the
electricity consumption in a day that only production was working, then in another day
when both production and office were working, later results were compared arriving to the
values presented.

Monitoring, Measuring and Analysis
88
SAO - Electricity Consumption (%)
0%
10%
20%
30%
40%
50%
60%
70%
80%
90%
100%
1 2 3 4
Figure 58: São Paulo – Pareto Analysis
The Pareto Analysis was made (see Figure 58) and the results presented that
83,53% of the electricity consumption is in the CVS division (truck), from which 41,5% is
spent in production.
4.3.3.3 Identification of other factors and existing instruments (SAO)
After analysing the data, the anomalies and other factors, according to Table 14,
should be identified, as well as the already existing meters.
Considering the fact that a new plant is planed for the next year and assuming that
this plant will be already provided with some kind of metering equipments, the focus of the
efforts in this case may be in other activities, such as the study of possible anomalies.
4.3.3.4 Plan and measure (SAO)
The focus for this plan was defined as the study of typical problems and possible
anomalies, for this activity the budget was stipulated with the same logic as the previous
examples, being the electricity consumption of € 635.553,22 in 2008, 1,5% of this amount
is equivalent to € 9.533,30.
An example for the plan for São Paulo is represented in the Figure 59.

Monitoring, Measuring and Analysis
89
Figure 59: São Paulo, Plan to Introduce Instruments for Energy Consump. Data Monitoring
Further analysis are required, the suggestion is to work in the typical problems to
avoid them to be present in the new plant and study the metering system in next plans, to
keep improving.

Conclusions
90
5 CONCLUSIONS
It is known that companies prioritize investments where immediate cost reductions
can be identified, this may be addressed as one of the main reasons why they are not
interested in implementing an Energy Management System.
Usually returns on investments made in energy consumption field are not possible
to be predicted, still less likely when referring to investments in metering equipments.
Benefits in implementing an Energy Management System are not easily identified, even
though the importance in controlling energy consumption and its impacts has been
intensified lately.
This paper shows how simple tools can help starting the implementation of an
Energy Management System in a company. It is for sure time consuming and requires
resources such as people and money, nevertheless it becomes more and more necessary
and calls for everyone‟s attention.
5.1 Management System Status Evaluation
Management System Status Evaluation part in a first place, identified the
similarities between the international standards for energy and environmental management.
The Table 23 shows that the energy standard is more detailed as the environmental
standard, but even though it does not have many extra requirements.
The main differences identified between the energy and the environmental
standards are represented in the Table 23 in blue and orange.
Sentences in blue correspond to the requirements that were only more specifically
detailed, for example, while in the ISO 50001:2009 (draft version) the energy aspects were
described in 3 points (energy profile, energy baseline and energy performance indicators)
in the ISO 14001 this characteristics were grouped under one topic simply called
„environmental aspects‟.
Lines in orange represent the most significant changes. The energy standard
recognized the need of highlighting the impact of energy in energy purchasing contracts, in
purchasing of goods and services and in designing new plants, production lines, products,
etc. To fulfil these specific requirements, processes should be reviewed.
For starting the implementation, it was identified that fulfilling the requirements
4.4.2 energy profile, 4.4.3 energy baseline and 4.4.4 energy performance indicators would
involve more efforts. Some energy aspects may already be found in the environmental
aspects, but the ISO 50001:2009 demand more detailed energy characteristics.

Conclusions
91
Table 23: Comparison between the requirements of ISO 50001 and ISO 14001
ISO 50001:2011 Energy Management ISO 14001:2009 Environmental Management
4.1 General requirements 4.1 General requirements
4.2 Management Responsibility
4.2.1 Commitment of top management
4.2.2 Roles, responsibility and authority 4.4.1 Structure and resposibility
4.3 Energy policy 4.2 Environmental Policy
4.4 Planning 4.3 Planning
4.4.1 General
4.4.2 Energy profile 4.3.1 Environmental aspects
4.4.3 Energy Baseline
4.4.4 Energy performance indicators
4.4.5 Legal and other requirements 4.3.2 Legal and other requirements
4.4.6 Objectives, targets and action plans 4.3.3 Objectives and targets
4.3.4 Environmental management programme (s)
4.5 Implementation and operation 4.4 Implementation and operation
4.5.1 Competence, training and awareness 4.4.2 Competence, training and awarness
4.5.2 Documentation 4.4.4 Documentation
4.5.2.1 Documentation requirements
4.5.2.2 Control of documents 4.4.5 Control of documents
4.5.3 Operational control 4.4.6 Operational control
4.5.4 Communication 4.4.3 Communication
4.5.5 Design
4.5.6 Purchasing energy services, goods and energy
4.5.6.1 Purchasing of energy services and goods
4.5.6.2 Purchasing of energy
4.4.7 Emergency preparedness and response
4.6 Checking performance 4.5 Checking and corrective action
4.6.1 Monitoring, measurement and analysis 4.5.1 Monitoring and measurement
4.6.2 Evaluation of legal/other compliances
4.6.3 Internal audit 4.5.4 Environmental management system audit
4.6.4Nonconformities, corrective, preventive and
improvement actions4.5.2 Nonconformities, corrective and preventive actions
4.6.4.1 Nonconformities
4.6.4.2 Corrective and preventive actions
4.6.5 Control of records 4.5.3 Control of records
4.7 Review of the energy mgmt system by top management 4.6 Management review
4.7.1 Inputs to management review
4.7.2 Outputs from management review
Comparison between standards
Some actions required by the energy standard can be combined with the ones from
the environmental standard, such as communication, control of records, documentation and
even the energy policy or the responsible.
The requirement 4.6.1 (monitoring, measurement and analysis) is, in a certain way,
connected to the energy aspects, once establishing the energy profile, baseline and
performance indicators, the monitoring, measurement and analysis will have the directions

Conclusions
92
to be carried out. For example, every analysis needs a baseline to compare results and
energy consumption may be monitored through energy performance indicators.
In the second part of Management System Evaluation section, a checklist was
formulated with the aim to identify how far an organization is to implement an Energy
Management System, its formulation was based on the ISO 50001:2009 (draft version).
Results showed that sites that already had ISO 14001:2004 certification were closer
to the implementation of an Energy Management System, such as the case represented in
Figure 60 of Knorr-Bremse Bristol (UK) that has already fulfilled 70% of the
requirements.
Figure 60: Results per requirement - Bristol
By another hand, the production location of Knorr-Bremse Dalian (China), which is
not certificated by ISO 14001:2004 shows to have a long way to go for completing the
energy management standard requirements. (Figure 61)
Figure 61: Results per requirement - Dalian

Conclusions
93
The checklist is a simple tool, but requires attention on the answers, even having
direct questions they may be interpreted in different ways, an example is what happened in
São Paulo, when receiving the questionnaire, they thought that the case should be treated
totally separated from the environmental management system, that an energy management
system should start from zero other than using an integrated management system.
Having this point of view their answers did not consider structures already existent,
such as the system documentation structure used by ISO 9001:2008 and ISO 14001:2006,
that could also be applied for ISO 50001:2009.
Considering cases such as São Paulo, further investigations may be needed, to
accurately understand the real situation in each case where the checklist is applied.
In the case of Knorr-Bremse (Region Europe + São Paulo), analysing the results of
the status evaluation of Knorr-Bremse, three main weaknesses were identified:
competence, training and awareness; purchasing and monitoring, measurement and
analysis.
Figure 62: Requirement 4.5.1 Figure 63: Requirement 4.5.6
Figure 64: Requirement 4.6.1
The conclusion was that for improving the situation of purchasing a simple action is
required, the review of processes to identify where the energy use is relevant and the
introduction in the processes where it is relevant.
4.5.6 Purchasing
25%
43%32%
Not Fulfilled Part ly Fulfil led
4.6.1 Monitoring, measurement
and analysis
31%
35%34%
Not Fulfilled Part ly Fulfil led
4.5.1 Competence, training and
awareness
10%
50%40%
Not Fulfilled Part ly Fulfil led

Conclusions
94
Competence, training and awareness requirement is a matter of adding references to
energy use in the already existing plans.
Monitoring, measuring and analysis requirement demands a deeper investigation,
since may involve the acquisition of new equipments to enable the energy data
consumption collection and it will the basis for establishing objectives, targets and action
plans.
Having the results acquired in Knorr-Bremse (Region Europe + São Paulo) in mind,
it was decided to develop a concept that helps introducing or implementing energy
consumption data monitoring equipments, to create a solid basis for the energy
management system.
The checklist turned out to be a simple tool that helps companies to identify where
to start focusing attention in an energy management system implementation. It was also
observed that a company ISO 14001:2004 certificated it is very close to the completion of
the requirements of ISO 50001:2009, this fact reduces the amount of resources required for
the implementation of the new standard.
Different companies will have different results applying the same checklist, but in
any case it is possible to identify the strengths and weaknesses of the management system,
simply by looking at the graphs generated by answering the questions.
5.2 Implementing or Improving Energy Consumption Data Instruments
Another objective of this paper is to create an approach that helps the fulfilment of
the gaps identified in the status analysis, for accomplish with this objective it was chosen
the topic monitoring, measurement and analysis, since it was considered of great relevance
when starting the energy management system implementation.
It is necessary to know if the efforts made managing the energy system are leading
to the expected results. It is not possible to manage what can not be measured
A concept for guiding the implementation or improvement of energy consumption
metering equipments was developed, the concept is quite simple and embraces two main
characteristics that affect energy consumption, which are volume of energy consumed and
the typical problems that cause energy waste.
The analysis of these two characteristics gives the directions about how to focus the
further implementations.
The concept created has 6 main steps, for supporting the completion of step „1-
Define process and boundaries‟, the tool „Identification of energy sources and consumers‟
was created (see the example of Appendix III), for helping the steps „2-Gathering of
information‟ and „3-Analysis of data collected‟ the tool „Energy consumption analysis‟
was developed, as seen in appendix IV.

Conclusions
95
For the step „6-Plan and measure‟ the instrument „Plan: metering equipment
installation/ improvement‟ was built, as shown in appendix VIII. The Figure 65 represents
the summary of the concept.
Figure 65: Summary of the flow of the activities
The concept was applied in three production sites: Aldersbach (Germany), Bristol
(UK) and São Paulo (Brazil) and observing their results it is possible to conclude that
despite of the differences such as organization of processes, size, volume of energy
consumed and particular characteristics of each production site (for example, the moment
of building a new plant as in São Paulo), the tool developed in this paper can still be
applied.
In the case of Aldersbach the information received was more complete, allowing a
definition of an action plan for each of the largest electricity consumers founded.

Conclusions
96
Bristol does not have estimations in the same level of detail as Aldersbach, for this
location the action plan suggested was to start doing more detailed estimations, so that a
better analysis will be possible in the near future.
São Paulo did not accept the fact of spending time looking for metering equipments
in a plant that will be deactivated. It does not mean that any action can be taken, so the
suggestion was to investigate typical problems that occur in this kind of manufacturing
system in the way to avoid their occurrence in the new plant.
There are three different directions found, each case with its particular results, the
main idea is to start doing something with the aim to continuous improve the processes.
The concept for implementing or improving instruments for energy data collection
turned out to be useful in order to give a direction about how to enrich a measuring and
monitoring system and to sustain a continuous improvement process.
5.3 Exploration of Possible Benefits Implementing an Energy Management
System
Since this work was developed in an industry, some conclusions came with the
experience, observing the system, the behaviour of workers and their response to the issues
of an Energy Management System.
As a result, benefits of the implementation of an Energy Management System were
raised. These benefits can be recognized into different scopes, for instance: cost of energy
usage, cost of energy contracts and image of the organization.
Several flaws responsible for misuse of energy fail to be identified due to lack of
investments in measurement equipments, in some cases, these problems are not avoided
only because they can not be detected.
The identification and management of such failures can turn continuous sources of
waste into quick wins. Through a permanent measurement system, these sources of waste
become evident and possible to be eliminated.
These sources can be leakages in compressed air system, lack of adjustments in
temperatures, absence of heat recover, flooded heaters, poor feed water heater
performance, unnecessary usage of compressors, etc.
The cost reduction, in this case, may not occure only by reducing energy
consumption, but also in reducing costs related to the production, such as decrease of
number of scraps generated due to wrong adjustments in the machine.
Simple actions can be taken to change the scenario, such as improving plant
utilization, reducing material inputs, improving efficiency of existing equipments, reducing
capacity requirements, to name but a few. All of them lead to the energy efficiency
improvement.

Conclusions
97
The benefits, brought by focusing on these issues, are the control of rising energy
costs as well as their reduction.
A good understand of energy contracts can bring a cost reduction in the cases where
the contracts and the way that energy is billed are carefully examined. Contracts may
contain penalties for reducing energy demand, or annual pricing linked to periods of peak
demand, i.e. to make a closer alignment of energy procurement with actual energy needs of
the company.
The concern about energy consumption brings up also the matter of global
warming, and the company starts to introduce a sustainable thinking among the employees,
engaging staff in programs to identify energy efficiency opportunities can make them feel
more involved in decision making and contribute to improved levels of job satisfaction.
It provides a nicer environment, improving work conditions for personnel, in cases
such as reducing heat from process, improving lighting or reducing noise. It also presents
the possibility to direct the attention to health and safety issues related to risks using high
temperatures and steam.
Energy efficiency improvements contribute directly to an organization‟s greenhouse
gas (GHG) reduction performance and carbon costs, providing access to external funds for
energy efficiency and GHG projects.
The employees‟ awareness and apparent concern with the environment, improve
corporate reputation and image.
Internal External
Flaw's detection Bargaining power Sustainable thinking Stakeholders' attention
Identification of quick wins Better cost control Staff engagementAccordance with legal
issues
Overview of problems, which
require fast actionsPossibility of cost alignments
Nicer environment for
employees
Acces to external
environmental programs
Cost of energy usage Cost of energy contracts Organization's image
Summary of benefits implementing an Energy Management System
Figure 66: Summary of benefits
Apart from the benefits, some barriers to implement an Energy Management
System and consequently improve industrial energy efficiency were identified during this
research, the most common include lack of information or energy data, limited awareness
of the benefits arising from energy efficiency measures, lack of knowledge from the
employees, deficiency in communication about the topic, capital constraints and corporate
culture leading to more investment in production capacity rather than energy efficiency.
Nevertheless, an energy management system will deliver significant benefits by
reducing energy usage and simple actions often identify problems, a simple spreadsheet

Conclusions
98
based on basic information, such as a nominal motor size and estimated running hours,
gives a lot of information, the matter is, it always needs to start somehow.
For continuing the implementation of an energy managment system, further work is
suggested, first the development of models to perform cost-benefit assessment of energy
metering practices for energy efficiency, based on such model values can be better
estimated and directed to investments in process improvements.
Having in mind the results of the gap analysis, another suggestion is in the
purchasing aspect, investigating if all process that affect energy consumption are taken into
account and developing a concept to introduce the suitable changes.
The implementation of an energy management system may be a hard work, that
demand resources and in a first sight increases cost, it also does not bring visible results
immediately and savings are hard to be accurately calculated. It is, anyway, a subject of
increasingly importance and work has to start to be done in order to begin understanding
the energy consumption impacts and turn them into actual advantages inside an
organization.

References
99
6 REFERENCES
Arcaro, J. S. Quality in Education: An Implementation Handbook. St. Lucie Press, 1995.
AUSTRALIA. Department of Resources, Energy and Tourism. Energy Savings
Measurement Guide: How to estimate, measure, evaluate and track energy efficiency
opportunities. Department of resources, energy and tourism, 2008.
Borror, C. M. The Certified Quality Engineer Handbook. Amer Society for Quality,
2008.
British Standard Institution (BSI). Integrated Management PAS 99. 2007, Jul. 2010,
http://www.bsi-emea.com/Integrated+Management/Overview/index.xalter
British Standard Institution (BSI). EN 16001:2009: Energy management systems –
Requirements with guidance for use. CENELEC, 2009.
British Standard Institution (BSI). Energy Management in the UK. 2009, Set 2010.
http://shop.bsigroup.com/upload/Standards%20&%20Publications/Energy/EN_16001_UK
_Research_Report_Final.pdf
Campbell, D.; Craig, T. Organisations and the Business Environment. Elsevier
Butterworth-Heinemann, 2005.
Capehart, B. L.; Turner, W. C.; Kennedy, W. J. Guide to Energy Management. The
Fairmont Press, 2008.
Coglianese, C.; Nash, J. Regulating from the Inside: Can Environmental Management
Systems Achieve Policy Goals? Resources for the Future, 2001.
Doty, S.; Turner, W. C. Energy Management Handbook. Fairmont Press, 2009.
Edwards, A. R. The Sustainability Revolution: Portrait of a Paradigm Shift. New Society
Publishers, 2006.
EMAS, Fulfilling EN 16001 “Energy Management Systems” with EMAS III. Aug.
2010, http://www.emas.de/fileadmin/user_upload/06_service/PDF-
Dateien/EN_16001_and_EMAS_January_2010.pdf
Ernst, A. Leitfaden zur Einführung von Qualitätsmanagement-Systemen in
Arztpraxen. Salywasser Verlag, 2008.

References
100
European Commission. EMAS (Eco-Management and Audit Scheme). Aug. 2010,
http://ec.europa.eu/environment/emas/about/summary_en.htm
European Union. White paper: An Energy Policy for the European Union. 1995. Aug.
2010, http://aei.pitt.edu/1129/
European Union. Energy for the future: Renewable Sources for the Energy. 1996. Aug.
2010, http://europa.eu/documents/comm/white_papers/pdf/com97_599_en.pdf
Evans, J. R. The Management and Control of Quality. Thomson South Western, 2008.
Graves, S. C.; Rinooy Kann, A. H. G.; Zipkin, P. H. Logistics of Production and
Inventory: Handbooks in Operations Research and Management Science. Elsevier Science
and Technology, 1993.
Harrisson, M.; Coussens, C. Global Environmental Health in the 21th Century: from
Governmental Regulation to Corporate Social Responsibility. The National Academies
Press, 2007.
Hutchins, G. ISO 9000: A Comprehensive Guide to Registration, Audit Guidelines, and
Successful Certification. John Wiley & Sons, Inc., 1997.
Institute of Environmental Management & Assessment (IEMA). Environmental
Management Systems (EMS). Aug. 2010,
http://www.iema.net/readingroom/all_documents?aid=283
International Energy Outlook. World Energy Demand and Economic Outlook. 2009.
Sep. 2010. http://www.eia.doe.gov/oiaf/ieo/pdf/world.pdf
International Organization for Standardization (ISO). About ISO. Jul, 2010.
http://www.iso.org/iso/about.htm
International Organization for Standardization (ISO). ISO 9000. Jul, 2010.
http://www.iso.org/iso/search.htm?qt=iso+9000&sort=rel&type=simple&published=on
International Organization for Standardization (ISO). ISO 9001:2008: Quality
Management System - Requirements. ISO, 2008.
International Organization for Standardization (ISO). ISO 14001:2004. Aug. 2010.
http://www.iso.org/iso/iso_catalogue/catalogue_tc/catalogue_detail.htm?csnumber=31807
International Organization for Standardization (ISO). ISO 14001:2004: Environmental
Management Systems – Requirements with guidance for use. ISO: 2004.
International Organization for Standardization (ISO). ISO 50001. Aug. 2010.
http://www.iso.org/iso/iso_catalogue/catalogue_tc/catalogue_detail.htm?csnumber=51297
References
101
International Organization for Standardization (ISO). ISO 50001: Energy Management
Systems – Requirements with guidance for use. (Draft version). ISO, 2009.
IRLAND. Sustainable Energy Authority of Ireland. Energy Map. Sep. 2010.
http://www.seai.ie/energymap/About_Energy_Map/
JWS Solutions. PDCA Cycle. Jul, 2010, http://www.jwssolutions.com/
Knorr-Bremse Group. History of the Knorr-Bremse Group. Jul, 2010, http://www.knorr-
bremse.de/de/group/history/1905bis1945/history1905_group.jsp
Kotler, P.; Lee, N. Corporate Social Responsibility: Doing the Most Good for Your
Company and Your Cause. John Wiley & Sons, Inc., 2005.
KRKA. Integrated Management System: Annual Report 2007. Jul. 2010,
http://www.krka.biz/en/finance/porocila/letna/2007/?v=kakovost
McLean-Conner, P. Energy Efficiency: Principles and Practices. PennWell Corporation,
2009.
McKinsey. How Companies Manage Sustainability. Sep. 10,
https://www.mckinseyquarterly.com/Energy_Resources_Materials/Strategy_Analysis/How
_companies_manage_sustainability_McKinsey_Global_Survey_results__2558?pagenum=
2
Moeller, S.T. Energy Efficiency: Issues and Trends. Nova Science Publishers, 2002.
Morris, A. S. ISO 14000 Environmental Management Standards: Engineering and
Financial Aspects. John Wiley & Sons Ltd., 2004.
Morvay, Z. K.; Gvozdenac, D. D. Applied Industrial Energy and Environmental
Management. IEEE Press, 2008.
Oursouthwest. Quick Start Guide to Energy Monitoring and Targeting. Set 2010.
http://www.oursouthwest.com/SusBus/susbus9/m&tguide.pdf.
Patrick, S. R.; Patrick D. R.; Fardo, S. W. Energy Conservation Guidebook. Fairmont
Press, Inc. 1993.
Ray, S. Electrical Power Systems: Concepts, Theory and Practice. Asoke K. Gosch,
2007.
Sallis, E. Total Quality Management in Education. Stylus Publishing Inc., 2002.
Scales Air Compressor Corp. Compressed Air System Diagram. Ago, 2010,
http://www.scalesair.com/.

References
102
Shibu, K. V. Introduction to Embedded Systems. Tata McGraw Hill, 2009.
Thorpe, B.; Sumner, P. Quality Management in Construction. Gower Publishing
Limited, 2004.
Thumann, A.; Mehta, D. P. Handbook of Energy Engineering. The Fairmont Press, Inc.,
2008.
Tienan, Li. How ISO 50001 relates to ISO 9001 and ISO 14001. International
Organization for Standardization, 2010.
Tricker, R.; Lucas, B. S. ISO 9001:2000 In Brief. Elsevier Butterworth-Heinemann, 2005.
UNITED KINGDOM (UK), Department of Trade and Industry (DTI). From Quality to
Excellence. UK, 2000. Jun. 2010,
http://www.businessballs.com/dtiresources/quality_management_history.pdf.
UNITED NATIONS (UN). Brundtland Report. World Commission on Environment and
Development, 1987. Ago. 2010, http://www.un-documents.net/ocf-02.htm.
Vasconcellos, J. A. Quality Assurance for the Food Industry: A Practical Approach.
CRC Press, 2004.
Vesma, V. Energy Management Principles and Practice. BSI, 2009.
Whitelaw, K. ISO 14001: Environmental Systems Handbook. Elsevier Butterworth-
Heinemann, 2004.
WordPress. The Future of Wind Power. Jul, 2010, http://windy-future.info/.
Workplace Law Group. Premises, Health and Safety Handbook: Essential guidance for
workplace managers on law, regulation, policy and practice. Oriental Press, 2010.

Appendix
103
7 APPENDIX
7.1 Appendix I – Checklist
Status evaluation for the implementation of LOCATION: please enter here location name
an Energy Management System according to DATE: DD.MM.YYYY
ISO 50001 draft NAME: please enter here contact person
No
t F
ulf
illed
Par
t ly
Fu
lfil
led
no
t
app
licab
le
4.1 General requirements 0%
1Has the organization defined an Energy Management System
accordingly to ISO 50001?0
4.2 Management responsibility (4.2.1/ 4.2.2) 0%
1
Has the organization defined an energy management representative
(energy manager) and defined their roles, responsibilities and
authorities?
0
2
Are the specialized skills, human, financial and technological
resources necessary for energy management identified and provided
by the board?
0
4.3 Energy policy 0%
1Has the board defined in writing a policy, which includes also a
commitment to continuous improvement of energy efficiency?0
2Does the policy show a commitment to achieve the energy
management objectives and to reduce energy related emissions?0
3 Is the policy available to internal and external public? 0
Please use 'x' in evaluation box
Comments to explain the evaluation i.e. evidences
rating
score
and inter-
mediate
results
(%)
Req.
NoElement Requirement Questions
Evaluation
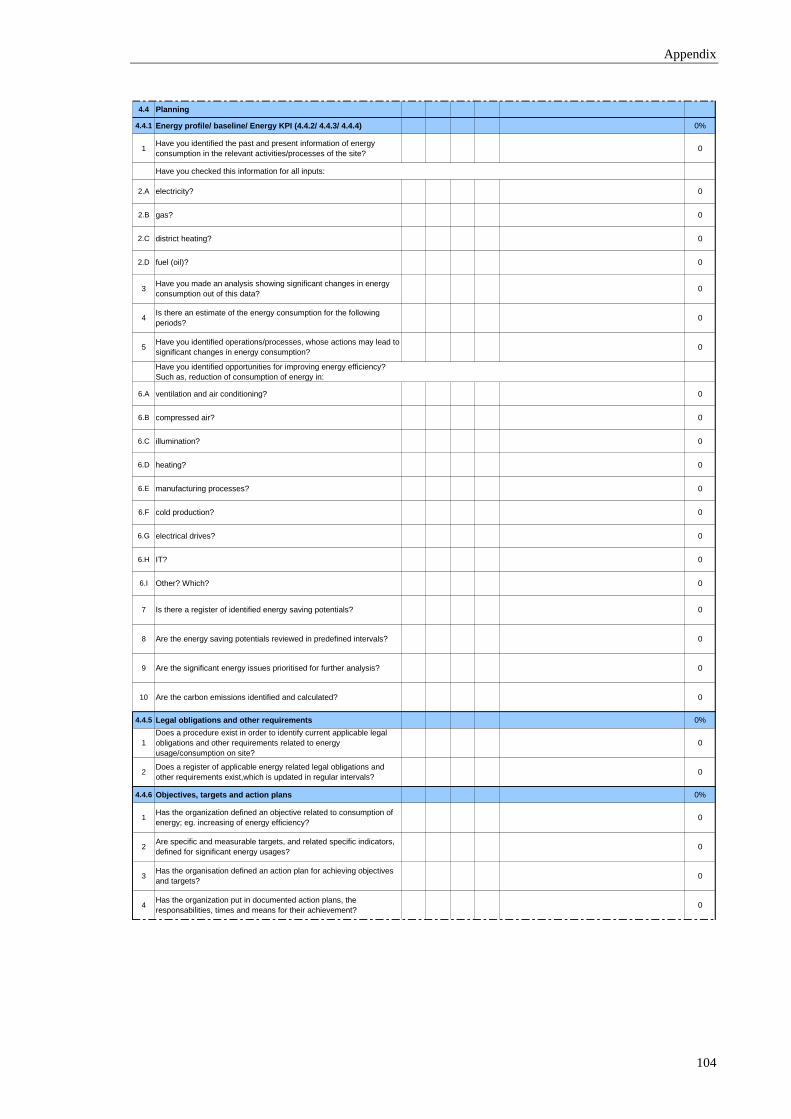
Appendix
104
4.4 Planning
4.4.1 Energy profile/ baseline/ Energy KPI (4.4.2/ 4.4.3/ 4.4.4) 0%
1Have you identified the past and present information of energy
consumption in the relevant activities/processes of the site?0
Have you checked this information for all inputs:
2.A electricity? 0
2.B gas? 0
2.C district heating? 0
2.D fuel (oil)? 0
3Have you made an analysis showing significant changes in energy
consumption out of this data?0
4Is there an estimate of the energy consumption for the following
periods?0
5Have you identified operations/processes, whose actions may lead to
significant changes in energy consumption?0
Have you identified opportunities for improving energy efficiency?
Such as, reduction of consumption of energy in:
6.A ventilation and air conditioning? 0
6.B compressed air? 0
6.C illumination? 0
6.D heating? 0
6.E manufacturing processes? 0
6.F cold production? 0
6.G electrical drives? 0
6.H IT? 0
6.I Other? Which? 0
7 Is there a register of identified energy saving potentials? 0
8 Are the energy saving potentials reviewed in predefined intervals? 0
9 Are the significant energy issues prioritised for further analysis? 0
10 Are the carbon emissions identified and calculated? 0
4.4.5 Legal obligations and other requirements 0%
1
Does a procedure exist in order to identify current applicable legal
obligations and other requirements related to energy
usage/consumption on site?
0
2Does a register of applicable energy related legal obligations and
other requirements exist,which is updated in regular intervals?0
4.4.6 Objectives, targets and action plans 0%
1Has the organization defined an objective related to consumption of
energy; eg. increasing of energy efficiency?0
2Are specific and measurable targets, and related specific indicators,
defined for significant energy usages?0
3Has the organisation defined an action plan for achieving objectives
and targets?0
4Has the organization put in documented action plans, the
responsabilities, times and means for their achievement?0

Appendix
105
4.5 Implementation and operation
4.5.1 Competence, training and awarness 0%
1Is the energy management representative (energy manager)
appropriate, competent and qualified?0
2Are the training needs identified, for those activities that may have an
effect on the energy efficiency?0
3Are the special energy management related training included in the
local training plan?0
4
Are any information/training given to temporary workers and
subcontractors' personnel working on site so that they are aware of
the energy management system of the company?
0
5
Are there any events performed to promote awarness for employees
about energy usage and consumption, as well as climate
protections? (quizz, energy day, etc)
0
4.5.2 Documentation (requirements and control; 4.5.2.1/4.5.2.2) 0%
1Is the system documentation structured for energy management and
the interaction between documents defined?0
2
Are the core elements of the energy management system identified?
(eg. Enery related requirements in purchasing, production planning,
product development processes, etc)
0
3
Are any existing energy related documentation integrated into the
documentation management system? (eg. energy saving concepts,
guidelines, standards, procedures, etc)
0
4.5.3 Operational control 0%
1.A compressed air system? 0
1.B heating/ cooling of buildings? 0
1.B illumination? 0
1.D machines? 0
1.E Other? Which? 0
2Do the rules to improve energy efficiency cover the maintenance of
the equipment?0
3Is the use of equipment included in the rules to improve energy
efficiency, including start up and shut down stages?0
4Do the rules to improve energy efficiency cover building works and
equipment modifications?0
5Does the organization plan monitoring and measuring of all
significant energy consumption and energy factors?0
6Are any energy efficiency assessments undertaken in the
identificated activities?0
7 Are energy load trends monitored? 0
4.5.4 Communication 0%
1Does the company communicate internally the policy, targets, actions
and results concerning energy efficiency?0
2Does a procedure exist which manages communication about the
energy issues inside the organization, and to and from outside?0
Do exist guidelines/ concepts for basic and detailed analysis of high energy
consuming processes in order to identify saving potentials, (optimization in
general or based on any changes of operations) on site, in the fields:
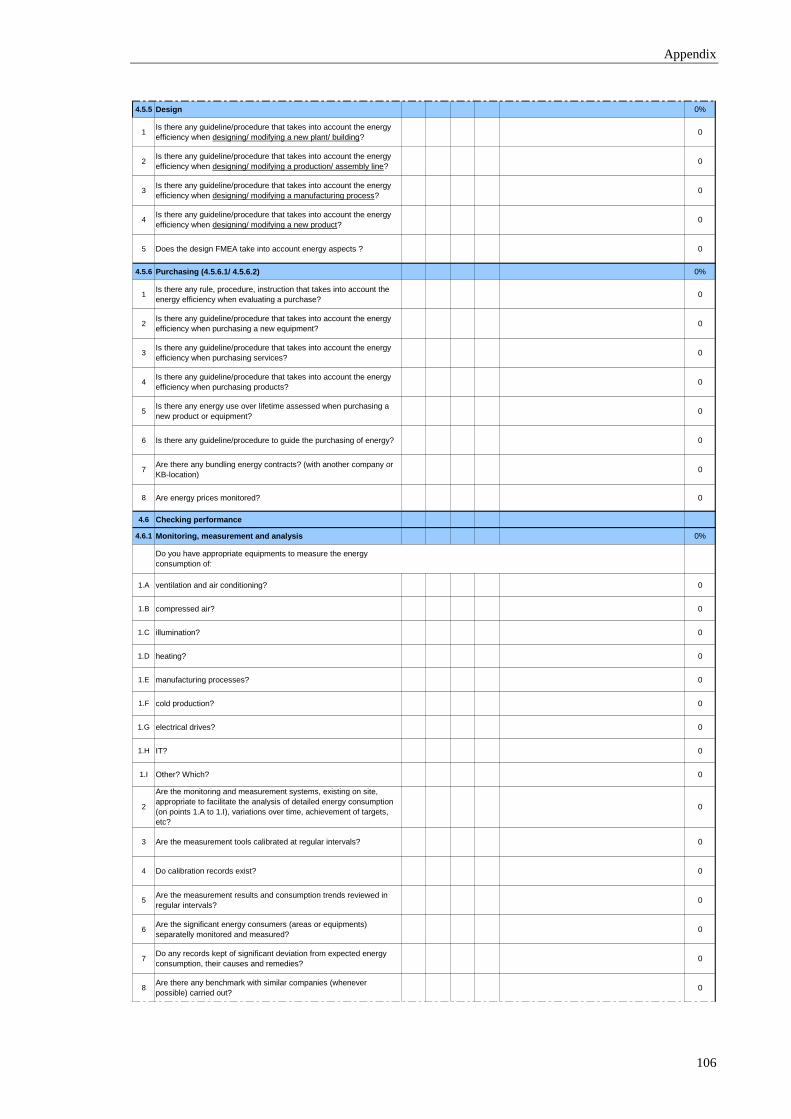
Appendix
106
4.5.5 Design 0%
1Is there any guideline/procedure that takes into account the energy
efficiency when designing/ modifying a new plant/ building?0
2Is there any guideline/procedure that takes into account the energy
efficiency when designing/ modifying a production/ assembly line?0
3Is there any guideline/procedure that takes into account the energy
efficiency when designing/ modifying a manufacturing process?0
4Is there any guideline/procedure that takes into account the energy
efficiency when designing/ modifying a new product?0
5 Does the design FMEA take into account energy aspects ? 0
4.5.6 Purchasing (4.5.6.1/ 4.5.6.2) 0%
1Is there any rule, procedure, instruction that takes into account the
energy efficiency when evaluating a purchase?0
2Is there any guideline/procedure that takes into account the energy
efficiency when purchasing a new equipment?0
3Is there any guideline/procedure that takes into account the energy
efficiency when purchasing services?0
4Is there any guideline/procedure that takes into account the energy
efficiency when purchasing products?0
5Is there any energy use over lifetime assessed when purchasing a
new product or equipment?0
6 Is there any guideline/procedure to guide the purchasing of energy? 0
7Are there any bundling energy contracts? (with another company or
KB-location)0
8 Are energy prices monitored? 0
4.6 Checking performance
4.6.1 Monitoring, measurement and analysis 0%
Do you have appropriate equipments to measure the energy
consumption of:
1.A ventilation and air conditioning? 0
1.B compressed air? 0
1.C illumination? 0
1.D heating? 0
1.E manufacturing processes? 0
1.F cold production? 0
1.G electrical drives? 0
1.H IT? 0
1.I Other? Which? 0
2
Are the monitoring and measurement systems, existing on site,
appropriate to facilitate the analysis of detailed energy consumption
(on points 1.A to 1.I), variations over time, achievement of targets,
etc?
0
3 Are the measurement tools calibrated at regular intervals? 0
4 Do calibration records exist? 0
5Are the measurement results and consumption trends reviewed in
regular intervals?0
6Are the significant energy consumers (areas or equipments)
separatelly monitored and measured?0
7Do any records kept of significant deviation from expected energy
consumption, their causes and remedies?0
8Are there any benchmark with similar companies (whenever
possible) carried out?0
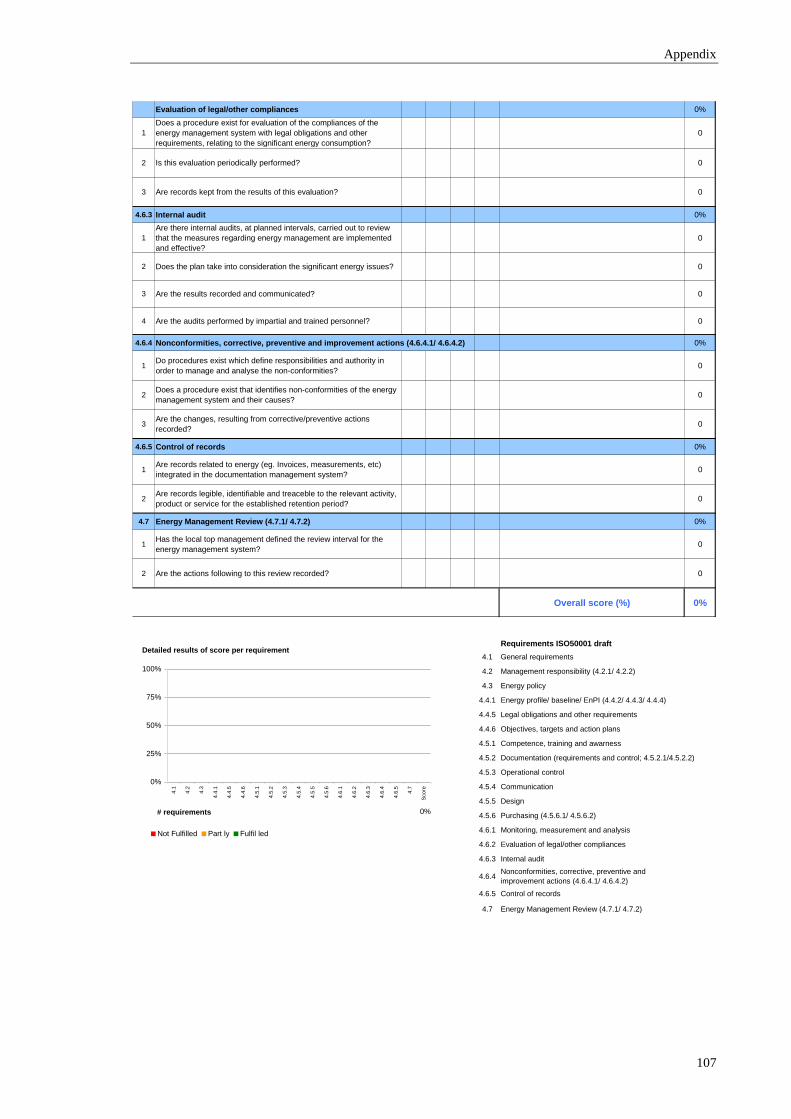
Appendix
107
Evaluation of legal/other compliances 0%
1
Does a procedure exist for evaluation of the compliances of the
energy management system with legal obligations and other
requirements, relating to the significant energy consumption?
0
2 Is this evaluation periodically performed? 0
3 Are records kept from the results of this evaluation? 0
4.6.3 Internal audit 0%
1
Are there internal audits, at planned intervals, carried out to review
that the measures regarding energy management are implemented
and effective?
0
2 Does the plan take into consideration the significant energy issues? 0
3 Are the results recorded and communicated? 0
4 Are the audits performed by impartial and trained personnel? 0
4.6.4 Nonconformities, corrective, preventive and improvement actions (4.6.4.1/ 4.6.4.2) 0%
1Do procedures exist which define responsibilities and authority in
order to manage and analyse the non-conformities?0
2Does a procedure exist that identifies non-conformities of the energy
management system and their causes?0
3Are the changes, resulting from corrective/preventive actions
recorded?0
4.6.5 Control of records 0%
1Are records related to energy (eg. Invoices, measurements, etc)
integrated in the documentation management system?0
2Are records legible, identifiable and treaceble to the relevant activity,
product or service for the established retention period?0
4.7 Energy Management Review (4.7.1/ 4.7.2) 0%
1Has the local top management defined the review interval for the
energy management system?0
2 Are the actions following to this review recorded? 0
Overall score (%) 0%
Requirements ISO50001 draft
4.1 General requirements
4.2 Management responsibility (4.2.1/ 4.2.2)
4.3 Energy policy
4.4.1 Energy profile/ baseline/ EnPI (4.4.2/ 4.4.3/ 4.4.4)
4.4.5 Legal obligations and other requirements
4.4.6 Objectives, targets and action plans
4.5.1 Competence, training and awarness
4.5.2 Documentation (requirements and control; 4.5.2.1/4.5.2.2)
4.5.3 Operational control
4.5.4 Communication
4.5.5 Design
4.5.6 Purchasing (4.5.6.1/ 4.5.6.2)
4.6.1 Monitoring, measurement and analysis
4.6.2 Evaluation of legal/other compliances
4.6.3 Internal audit
4.6.4Nonconformities, corrective, preventive and
improvement actions (4.6.4.1/ 4.6.4.2)
4.6.5 Control of records
4.7 Energy Management Review (4.7.1/ 4.7.2)
Detailed results of score per requirement
0%
0%
25%
50%
75%
100%
4.1
4.2
4.3
4.4
.1
4.4
.5
4.4
.6
4.5
.1
4.5
.2
4.5
.3
4.5
.4
4.5
.5
4.5
.6
4.6
.1
4.6
.2
4.6
.3
4.6
.4
4.6
.5
4.7
Sco
re
# requirements
Not Fulfilled Part ly Fulfil led

Appendix
108
7.2 Appendix II - Checklist Results

Appendix
109

Appendix
110

Appendix
111

Appendix
112

Appendix
113

Appendix
114
7.3 Appendix III - Energy Sources Identification, Aldersbach
Location: Aldersbach
Date: 16.09.2010
Ga
s
Ele
ctr
icity
Fu
el (o
il /
co
al)
Co
mp
resse
d a
ir
Ste
am
Wa
ter
Ele
ctr
icity
Co
mp
resse
d a
ir
Th
erm
al e
ne
rgy
Ste
am
Wa
ter
Level 1 Level 2 Level 3 Level 4
Production Hall 9.1 Assembly Disk brake LSW 6 x x x x
Production Hall 9.1 Assembly Disk brake LSW 7 x x x x
Production Hall 9.1 Assembly EAC Station 1 x x x x
Production Hall 9.1 Assembly EAC Station 2 x x x x
Production Hall 9.1 Assembly EAC Station 3 x x x x
Production Hall 9.1 Assembly EAC Station 4 x x x x
Production Hall 9.1 Assembly EAC Station 5 x x x x
Production Hall 9.1 Assembly EAC Station 6 x x x x
Production Hall 9.1 Assembly EAC Station 7 x x x x
Production Hall 9.1 Assembly EAC Station 8 x x x x
Production Hall 9.1 Assembly EAC Station 9 x x x x
Production Hall 9.1 Assembly EAC Station 10 x x x x
Production Hall 9.1 Assembly EAC Station 11 x x x x
Production Hall 9.1 Assembly EAC Station 12 x x x x
Production Hall 9.1 Assembly EAC Station 13 x x x x
Production Hall 9.1 Assembly EAC Station 14 x x x x
Production Hall 9.1 Assembly EAC Station 15 x x x x
Production Hall 9.1 Assembly EAC Station 16 x x x x
Production Hall 9.1 Assembly EAC Station 17 x x x x
Production Hall 9.1 Assembly EAC Station 18 x x x x
Production Hall 8 Assembly Disk brake LSW 1 x x x x
Production Hall 8 Assembly Disk brake LSW 3 x x x x
Production Hall 8 Assembly Disk brake LSW 4 x x x x
Production Hall 8 Assembly Disk brake LSW 8 x x x x
Production Hall 8 Assembly Disk brake Kleinserie A6 x x x x
Production Hall 9.2 Surface treatment Disk brake Phosphatierung x x x x
Production Hall 9.2 Surface treatment Disk brake Anodisierung x x x x
Production Hall 9.3/ 9.4 Assembly Disk brake Finishing x x x x x x
Production Hall 9.3/ 9.4 Assembly Disk brake Finishing x x x x x x
Production Hall 9.3/ 9.4 Assembly Disk brake Finishing x x x x x x
Plant Plant Litghting x x
Plant Plant Facility - lighting x x x x x x
Plant Plant Forklift charging x x
Production Hall 7 Testing x x x x
Warehouse Hall 9.2 Stock x x
Production A Assembly Disk brake LSW 2 x x x x
Production A Assembly Disk brake LSW 5 x x x x
Warehouse Hall 4 Stock/ Testing Disk brake x x
Production Hall 7 Technical testing x x x x
Production Hall 7 Quality x x x x
Plant Hall 10 Compressors x x x x
Production Hall 8 Assembly Disk brake Retro montage x x x x
Warehouse Hall 8 Assembly Disk brake x x x x
Production Hall 8 Assembly Disk brake Sample montage x x x x
Warehouse Hall 13 Empty goods x x
Office Hall 11 x x x x x x
IDENTIFICATION OF ENERGY SOURCES AND CONSUMERS
Identification of energy inputs/ outputs
Energy Input Energy Output

Appendix
115
7.4 Appendix IV - Electricity Consumption Analysis – 2009 Aldersbach
Lo
ca
tio
n:
Ald
ers
ba
ch
Date
:1
7.0
9.2
01
0
Consumption (kWh)
Percentage
Cumulative
percentage
Level where
metering equipments
already exist
Frequency
Mobility
Data collection
Focus
History
Type/ Model/ Name
Type
Measured (y /n )
Le
ve
l 1
Le
ve
l 2
Le
ve
l 3
Le
ve
l 4
00
,00
%
Pro
du
ctio
nH
all
9.2
Su
rfa
ce
tre
atm
en
tD
isk b
rake
Ph
osp
ha
tin
g1
5.2
74
.00
31
8,9
4%
18
,94
%1
11
es
tim
ati
on
no
Pla
nt
Fa
cili
tyF
acili
ty -
lig
htin
g2
4.6
70
.43
91
6,7
7%
35
,72
%1
11
es
tim
ati
on
no
Pro
du
ctio
nH
all
9.3
/ 9
.4A
sse
mb
lyD
isk b
rake
Fin
ish
ing
13
4.5
98
.58
61
6,5
2%
52
,23
%1
11
es
tim
ati
on
no
Pro
du
ctio
nH
all
9.2
Su
rfa
ce
tre
atm
en
tD
isk b
rake
An
od
izin
g4
3.7
50
.72
21
3,4
7%
65
,70
%1
11
es
tim
ati
on
no
Pla
nt
Fa
cili
tyL
itg
htin
g5
2.8
02
.26
31
0,0
6%
75
,77
%1
11
es
tim
ati
on
no
Pro
du
ctio
nH
all
9.3
/ 9
.4A
sse
mb
lyD
isk b
rake
Fin
ish
ing
26
1.5
80
.76
45
,68
%8
1,4
5%
11
1e
sti
ma
tio
nn
o
Pro
du
ctio
nH
all
7T
estin
g7
1.0
05
.94
13
,61
%8
5,0
6%
11
1e
sti
ma
tio
nn
o
Pla
nt
Fo
rklif
t ch
arg
ing
81
.00
5.9
41
3,6
1%
88
,67
%1
11
es
tim
ati
on
no
Wa
reh
ou
se
Hall
9.2
sto
ck
92
15
.55
90
,77
%8
9,4
5%
11
1e
sti
ma
tio
nn
o
Pro
du
ctio
nH
all
9.1
Asse
mb
lyD
isk b
rake
LS
W 6
10
21
5.5
59
0,7
7%
90
,22
%1
11
es
tim
ati
on
no
Pro
du
ctio
nH
all
9.1
Asse
mb
lyD
isk b
rake
LS
W 7
11
21
5.5
59
0,7
7%
90
,99
%1
11
es
tim
ati
on
no
Pro
du
ctio
nH
all
8A
sse
mb
lyD
isk b
rake
LS
W 1
12
21
5.5
59
0,7
7%
91
,77
%1
11
es
tim
ati
on
no
Pro
du
ctio
nH
all
8A
sse
mb
lyD
isk b
rake
LS
W 3
13
21
5.5
59
0,7
7%
92
,54
%1
11
es
tim
ati
on
no
Pro
du
ctio
nH
all
8A
sse
mb
lyD
isk b
rake
LS
W 4
14
21
5.5
59
0,7
7%
93
,32
%1
11
es
tim
ati
on
no
Pro
du
ctio
nH
all
8A
sse
mb
lyD
isk b
rake
LS
W 8
15
21
5.5
59
0,7
7%
94
,09
%1
11
es
tim
ati
on
no
Pro
du
ctio
nH
all
9.3
/ 9
.4A
sse
mb
lyD
isk b
rake
Fin
ish
ing
31
62
15
.55
90
,77
%9
4,8
6%
11
1e
sti
ma
tio
nn
o
Pro
du
ctio
nH
all
Asse
mb
lyD
isk b
rake
LS
W 2
17
21
5.5
59
0,7
7%
95
,64
%1
11
es
tim
ati
on
no
Pro
du
ctio
nH
all
Asse
mb
lyD
isk b
rake
LS
W 5
18
21
5.5
59
0,7
7%
96
,41
%1
11
es
tim
ati
on
no
Pro
du
ctio
nH
all
9.1
Asse
mb
lyE
AC
Sta
tio
n 1
51
91
79
.63
20
,65
%9
7,0
6%
11
1e
sti
ma
tio
nn
o
Pro
du
ctio
nH
all
9.1
Asse
mb
lyE
AC
Sta
tio
n 1
42
01
43
.70
60
,52
%9
7,5
7%
11
1e
sti
ma
tio
nn
o
Pro
du
ctio
nH
all
8A
sse
mb
lyD
isk b
rake
Kle
inse
rie
A6
21
86
.22
30
,31
%9
7,8
8%
11
1e
sti
ma
tio
nn
o
Off
ice
Fa
cili
ty2
24
3.1
15
0,1
5%
98
,04
%1
11
es
tim
ati
on
no
Pro
du
ctio
nH
all
9.1
Asse
mb
lyE
AC
Sta
tio
n 1
22
34
3.1
12
0,1
5%
98
,19
%1
11
es
tim
ati
on
no
Pro
du
ctio
nH
all
9.1
Asse
mb
lyE
AC
Sta
tio
n 1
24
35
.92
60
,13
%9
8,3
2%
11
1e
sti
ma
tio
nn
o
Pro
du
ctio
nH
all
9.1
Asse
mb
lyE
AC
Sta
tio
n 2
25
35
.92
60
,13
%9
8,4
5%
11
1e
sti
ma
tio
nn
o
Pro
du
ctio
nH
all
9.1
Asse
mb
lyE
AC
Sta
tio
n 3
26
35
.92
60
,13
%9
8,5
8%
11
1e
sti
ma
tio
nn
o
Pro
du
ctio
nH
all
9.1
Asse
mb
lyE
AC
Sta
tio
n 4
27
35
.92
60
,13
%9
8,7
1%
11
1e
sti
ma
tio
nn
o
Pro
du
ctio
nH
all
9.1
Asse
mb
lyE
AC
Sta
tio
n 6
28
35
.92
60
,13
%9
8,8
4%
11
1e
sti
ma
tio
nn
o
Pro
du
ctio
nH
all
9.1
Asse
mb
lyE
AC
Sta
tio
n 7
29
35
.92
60
,13
%9
8,9
7%
11
1e
sti
ma
tio
nn
o
Pro
du
ctio
nH
all
9.1
Asse
mb
lyE
AC
Sta
tio
n 8
30
35
.92
60
,13
%9
9,1
0%
11
1e
sti
ma
tio
nn
o
Pro
du
ctio
nH
all
9.1
Asse
mb
lyE
AC
Sta
tio
n 9
31
35
.92
60
,13
%9
9,2
3%
11
1e
sti
ma
tio
nn
o
Pro
du
ctio
nH
all
9.1
Asse
mb
lyE
AC
Sta
tio
n 1
03
23
5.9
26
0,1
3%
99
,35
%1
11
es
tim
ati
on
no
Pro
du
ctio
nH
all
9.1
Asse
mb
lyE
AC
Sta
tio
n 1
13
33
5.9
26
0,1
3%
99
,48
%1
11
es
tim
ati
on
no
Pro
du
ctio
nH
all
9.1
Asse
mb
lyE
AC
Sta
tio
n 1
63
43
5.9
26
0,1
3%
99
,61
%1
11
es
tim
ati
on
no
Pro
du
ctio
nH
all
9.1
Asse
mb
lyE
AC
Sta
tio
n 1
73
53
5.9
26
0,1
3%
99
,74
%1
11
es
tim
ati
on
no
Pro
du
ctio
nH
all
9.1
Asse
mb
lyE
AC
Sta
tio
n 1
83
63
5.9
26
0,1
3%
99
,87
%1
11
es
tim
ati
on
no
Pro
du
ctio
nH
all
9.1
Asse
mb
lyE
AC
Sta
tio
n 5
37
28
.74
10
,10
%9
9,9
7%
11
1e
sti
ma
tio
nn
o
Pro
du
ctio
nH
all
9.1
Asse
mb
lyE
AC
Sta
tio
n 1
33
87
.18
50
,03
%1
00
,00
%1
11
es
tim
ati
on
no
TO
TA
L2
7.8
43
.00
11
00
,00
%E
lec
tric
ity b
ill
Ele
ctr
icit
y C
on
su
mp
tio
n 2
00
9 (
An
aly
sis
)
Ide
nti
fic
ati
on
of
en
erg
y i
np
uts
/ o
utp
uts
Ele
ctr
icit
y -
In
pu
tO
utp
ut

Appendix
116
7.5 Appendix V - Energy Sources Identification, Bristol
Location: Bristol
Date:
Ga
s
Ele
ctr
icity
Fu
el (o
il /
co
al)
Com
pre
sse
d a
ir
Ste
am
Wa
ter
Ele
ctr
icity
Com
pre
sse
d a
ir
Th
erm
al e
ne
rgy
Ste
am
Wa
ter
Level 1 Level 2 Level 3 Level 4
Kingswood Site Production Remanufacture X X X X X X X X
Kingswood Site Production Basement Valve Assembly X X X X
Kingswood Site Production Machine Shop X X X X X X
Kingswood Site Production Welding Shop X X X X X X
Kingswood Site Production Assembly Shop X X X X X
Kingswood Site Administration Office X X
Kingswood Site Quality Standards Room X X
Kingswood Site Quality Customer Quality X X X X X
Kingswood Site Stores Machine Shop Raw material storage X
Kingswood Site Stores Assembly shop Detail part storage X
Kingswood Site Stores Basement Goods receiving X X X
Kingswood Site Plant Facilties X X X X X X X X
Kingswood Site Support services Maintenance/Labels X X X X X
Kingswood Site Plant Computer support areas X X
Kingswood Site Plant Facilties Air Compressors X X X X X
Century House Warehouse Finished goods storage X X
Century House Warehouse Product kitting X X
Century House Offices Ground Floor X X
Century House Offices First Floor X X
Century House Plant Facilties X X X X X X X
Century House Warehouse Service Area Compressor X X
Century House Plant Common rooms Computer support X X X
IDENTIFICATION OF ENERGY SOURCES AND CONSUMERS
Identification of energy inputs/ outputs
Energy Input Energy Output
7.6 Appendix VI - Electricity Consumption Analysis - 2009 Bristol
Location: Bristol
Date: 17.09.2010
Con
su
mp
tio
n (
kW
h)
Pe
rce
nta
ge
Cum
ula
tive
pe
rce
nta
ge
Le
ve
l w
he
re m
ete
rin
g
eq
uip
me
nts
alr
ea
dy
exis
t
Fre
qu
en
cy
Mo
bili
ty
Data
co
llectio
n
Fo
cu
s
His
tory
Typ
e/
Mo
de
l/ N
am
e
Typ
e
Me
asu
red
(y /
n )
Level 1 Level 2
Production + Office 1,58 98,94% 98,94% 1 1 1 Estimation no
Compressed air Compressed air 0,02 1,06% 100,00% 1 1 1 Estimation no
TOTAL 1,6 100,00% Electricity bill
Electricity Consumption 2009 (Analysis)
Identification of energy inputs/ outputs
Electricity - Input Output
7.7 Appendix VII - Electricity Consumption Analysis - 2009 São Paulo
Location: Sao Paulo
Date: 17.09.2010
Con
su
mp
tio
n (
kW
h)
Pe
rce
nta
ge
Cum
ula
tive
pe
rce
nta
ge
Le
ve
l w
he
re m
ete
rin
g
eq
uip
me
nts
alr
ea
dy
exis
t
Fre
qu
en
cy
Mo
bili
ty
Data
co
llectio
n
Fo
cu
s
His
tory
Typ
e/
Mo
de
l/ N
am
e
Typ
e
Me
asu
red
(y /
n )
Level 1 Level 2
Truck Production 1 3,5 62,61% 62,61% 1 1 1 Estimation no
Truck Office 2 1,2 20,87% 83,48% 1 1 1 Estimation no
Rail Production 3 0,7 12,34% 95,83%
Rail Office 4 0,2 4,17% 100,00%
TOTAL 5,5 100,00% Electricity bill
Electricity Consumption 2009 (Analysis)
Identification of energy inputs/ outputs
Electricity - Input Output

Appendix
117
7.8 Appendix VIII – Plan: Metering Equipment Installation / Improvement
7.9 Appendix IX – Comparison of results between groups
Comparison of results between groups
0%
25%
50%
75%
100%
4.4.
1 Ben
dix
4.4.
1 EU+B
R
4.4.
1 Asia
4.4.
6 Ben
dix
4.4.
6 EU+B
R
4.4.
6 Asia
4.5.
1 Ben
dix
4.5.
1 EU+B
R
4.5.
1 Asia
4.5.
3 Ben
dix
4.5.
3 EU+B
R
4.5.
3 Asia
4.5.
5 Ben
dix
4.5.
5 EU+B
R
4.5.
5 Asia
4.5.
6 Ben
dix
4.5.
6 EU+B
R
4.5.
6 Asia
4.6.
1 Ben
dix
4.6.
1 EU+B
R
4.6.
1 Asia
requirements in each group
Not Fulfilled Part ly Fulfil led