Embed Size (px)
Citation preview
POLISH ACADEMY OF SCIENCES COMMITTEE OF MACHINE ENGINEERING
SCIENTIFIC PROBLEMS OF MACHINES OPERATION AND MAINTENANCE
ZAGADNIENIA EKSPLOATACJI MASZYN
TRIBOLOGY • RELIABILITY • TEROTECHNOLOGY DIAGNOSTICS
TRIBOLOGIA • NIEZAWODNOŚĆ • EKSPLOATYKA DIAGNOSTYKA
Z. 4 (156)
Vol. 43 2008
Institute for Sustainable Technologies – National Research Institute, Radom

EDITORIAL BOARD:
Editor in Chief Stanisław Pytko Deputy Editor in Chief Marian Szczerek Editor of Tribology Marian Szczerek Editor of Reliability Janusz Szpytko Editor of Terotechnology Tomasz Nowakowski Editor of Diagnostics Wojciech Moczulski Editor of Safety Kazimierz Kosmowski Scientific Secretary Jan Szybka Secretary Ewa Szczepanik EDITORIAL ADVISORY BOARD Bolesław Wojciechowicz (Chairman) Alfred Brandowski, Tadeusz Burakowski, Czesław Cempel, Wojciech Cholewa, Zbigniew Dąbrowski, Józef Gawlik, Jerzy Jaźwiński, Jan Kiciński, Ryszard Marczak, Adam Mazurkiewicz, Leszek Powierża, Stanisław Radkowski, Tadeusz Szopa, Wiesław Zwierzycki, Bogdan Żółtowski and Michael J. Furey (USA), Anatolij Ryzhkin (Russia), Zhu Sheng (China), Gwidon Stachowiak (Australia), Vladas Vekteris (Lithuania).
Mailing address: Scientific Problems of Machines Operation and Maintenance Institute for Sustainable Technologies – National Research Institute ul. Pułaskiego 6/10, 26-600 Radom, Poland Phone (48-48) 364 47 90 E-mail: [email protected]
The figures have been directly reproduced from the originals submitted by the Authors.
Publishing House of Institute for Sustainable Technologies – National Research Institute
26-600 Radom, ul. K. Pułaskiego 6/10, phone. (48-48)) 36 442-41, (048) fax 36 44765 www.tribologia.eu
SCIENTIFIC PROBLEMS OF MACHINES OPERATION AND MAINTENANCE
4 (156) 2008
CONTENTS Z. Broniec, J. Daca, W. Figiel: The surface topography influence on
tribology phenomenon proceedings in exploitation investiga-tion of drawing dies.................................................................... 7
J.A. Ortega-Saenz, M. Kalbarczyk, R. Michalczewski, W. Piekoszew-
ski, M. Szczerek: Comparison of wear processes of biomate-rials used in hip joints implants ................................................. 15
H. Tomaszek, M. Jasztal: Comments on the improvement of the mili-tary aircraft operation by limiting the possibilities of damage formation .................................................................................. 27
H. Tomaszek, J. Żurek, S. Stępień: The airship maintenance with its
renovation and the risk of its loss ............................................. 39 B. Karwat: Analysis of materials’ flow in a steel mill in order to deter-
mine exploitation parameters of technological line’s devices......... 51 E. Marecka-Chłopek, E. Budny, Z. Chłopek, M. Chłosta: Identifica-
tion of combustion engine static states in real operation condi-tions of an earthmoving machine ............................................... 69
S. Duer: Determination of diagnostic information of a reparable tech-
nical object on the basis of a functional and diagnostic analy-sis on example of a car engine ................................................... 85
B. Żółtowski: Diagnostic investigations of critical technical systems ........... 95

SPIS TREŚCI
Z. Broniec, J. Daca, W. Figiel: Wpływ topografii powierzchni na
przebieg zjawisk tribologicznych w eksploatacyjnych bada-niach zużycia ciągadeł ............................................................... 7
J.A. Ortega-Saenz, M. Kalbarczyk, R. Michalczewski, W. Piekoszew-
ski, M. Szczerek: Porównanie procesów zużywania biomate-riałów przeznaczonych na protezy stawu biodrowego ............... 15
H. Tomaszek, M. Jasztal: Uwagi na temat doskonalenia eksploatacji
wojskowych statków powietrznych przez ograniczenie możli-wości powstawania uszkodzeń .................................................. 27
H. Tomaszek, J. Żurek, S. Stępień: Eksploatacja statku powietrznego
z odnową i ryzykiem jego utraty ................................................ 39 B. Karwat: Analiza przepływu materiałów w hucie stali w celu określenia
parametrów eksploatacji urządzeń ciągu technologicznego ............. 51 E. Marecka-Chłopek, E. Budny, Z. Chłopek, M. Chłosta: Identyfika-
cja statycznych stanów pracy silnika spalinowego w warun-kach rzeczywistego użytkowania maszyny roboczej ................. 69
S. Duer: Wyznaczanie informacji diagnostycznej obiektu techniczne-
go na podstawie analizy funkcjonalno-diagnostycznej na przy-kładzie silnika samochodowego ................................................ 85
B. Żółtowski: Badania diagnostyczne krytycznych systemów tech-
nicznych .................................................................................... 95

SCIENTIFIC PROBLEMS OF MACHINES OPERATION AND MAINTENANCE
4 (156) 2008
ZDZISŁAW BRONIEC*, JANINA DACA*, WŁODZIMIERZ FIGIEL*
The surface topography influence on tribology phenomenon proceedings in exploitation investigation of drawing dies
K e y w o r d s
Coarseness, profile, cooling lubricant agent, surface layer.
S ł o w a k l u c z o w e
Chropowatość, profile, ciecze chłodząco-smarujące, warstwa wierzchnia.
S u m m a r y
The actual contact area of cooperating surfaces is dependent on the geometric sketch of surface profile and the loud accrued on it. Cooperating surfaces have very small actual contact areas, produc-ing an effect in that the friction and wear are determined by high tension in contact zone and extreme concentration friction energy. Many tribology phenomena can happen due to the reciprocal coerced effects of the unevenness of being in the contact surface, before surface wear. During the conducted experiments, surface profile measurements were taken using Talysurf 4 and Taylor-Hobson type profile meters. It was done to determine the characteristic value of the geometric structure surface of material and tool parts being in contact. The goal of the mentioned measurements is to gain informa-tion for the analysis of topology surface influence on the final co-operation effect.
Introduction
Surface unevenness of cooperating parts can be considered as set of singu-lar atoms or an apparent set of rows and bulges (protrusion), depending of their dimension. Most of that unevenness have a crucial influence on friction and wear processes. The basic friction principles are the research result of the actual
* AGH University of Science and Technology, Al. Mickiewicza 30, 30-059 Kraków.
TRIBOLOGY •

Z. Broniec, J. Daca, W. Figiel 8
area contact of uneven surfaces. In spite of that, the parameter of unevenness base on linear measurements and the unevenness has a three-dimensional char-acter, and the unevenness parameters can provide important information on the specified tribology process. Acquired information of surface topography can help in the analysis of upper layer changes during the friction and wear process. This is true when friction and wear process occur during drawing process. Sur-faces of tools used in the drawing process are particularly exposed to changes of surface unevenness (from micro to macro scale), which is caused by tribology phenomenon and by process of plastic deformation as well as.
2.1. Measurement of THE topogrphy parameters of investigated surfaces
2.1. Introduction
The investigated dies of the drawing process were made of sintering carbide G10. The material is processed by drawing a copper wire aggregate. The draw-ing process was conducted in operational (terotechnology) conditions in four series with the application of four different lubricating cooling agents [1]. The drawing experiment lasted 8 hours for the all mentioned die series.
2.2. Investigation method
In frame of investigation the surface profile measurements were conducted using Talysurf 4 and Taylor-Hobson type profile meters. It was done to deter-mine the characteristic value of geometric structure surface of parts in contact. The determination of the Ra parameter on sample surface was impossible, be-cause the length of minimum measurement distance was bigger than the actual measurement length of investigated sample. Technology condition of measure-ments allows only the measurements along the trace of plane section including die axis. The tester tip edge copying profile, runs perpendicular to processing traces of investigated die for new samples. The trace of tester tip edge cuts the trace line of drawing process with a very small angle for dies after time of work.
a
b
Fig. 1. Drawing die – a & b the unevenness measurement places Rys. 1. Ciągadło – a i b miejsca dokonania pomiarów chropowatości
Basic problems of surface topography influence on tribology phenomenon...
9
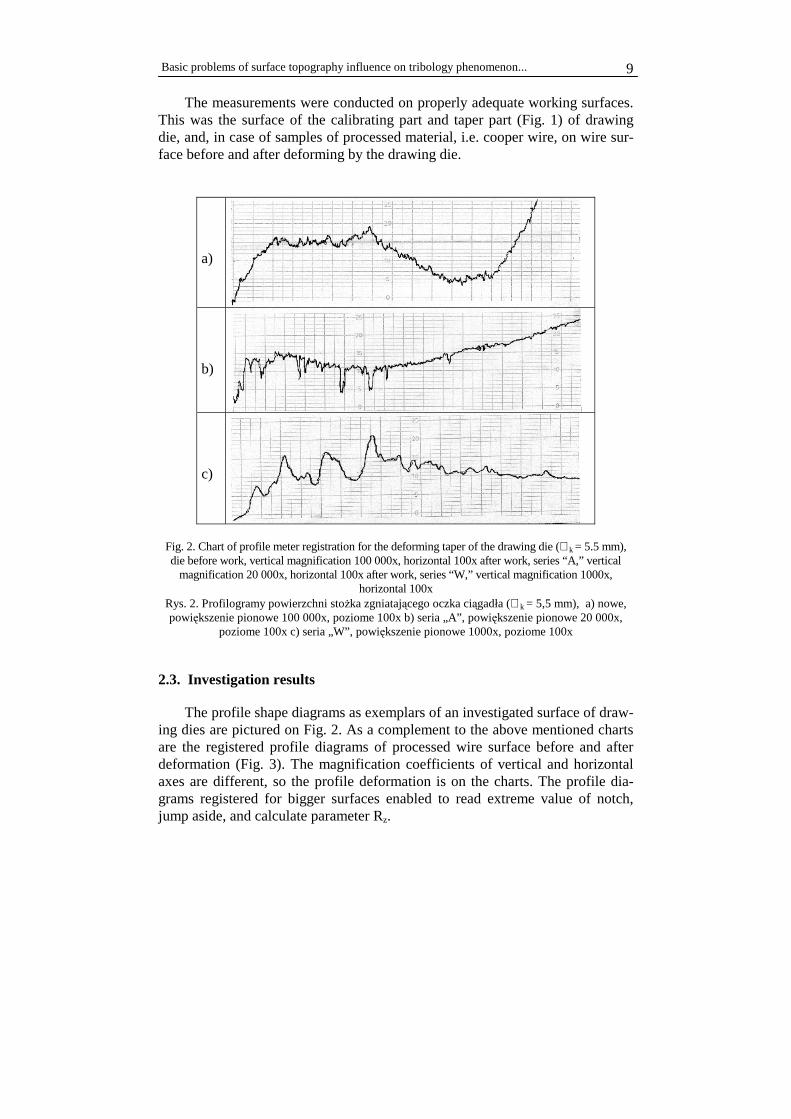
The measurements were conducted on properly adequate working surfaces. This was the surface of the calibrating part and taper part (Fig. 1) of drawing die, and, in case of samples of processed material, i.e. cooper wire, on wire sur-face before and after deforming by the drawing die.
a)
b)
c)
Fig. 2. Chart of profile meter registration for the deforming taper of the drawing die (∅ k = 5.5 mm), die before work, vertical magnification 100 000x, horizontal 100x after work, series “A,” vertical
magnification 20 000x, horizontal 100x after work, series “W,” vertical magnification 1000x, horizontal 100x
Rys. 2. Profilogramy powierzchni stożka zgniatającego oczka ciągadła (∅ k = 5,5 mm), a) nowe, powiększenie pionowe 100 000x, poziome 100x b) seria „A”, powiększenie pionowe 20 000x,
poziome 100x c) seria „W”, powiększenie pionowe 1000x, poziome 100x
2.3. Investigation results
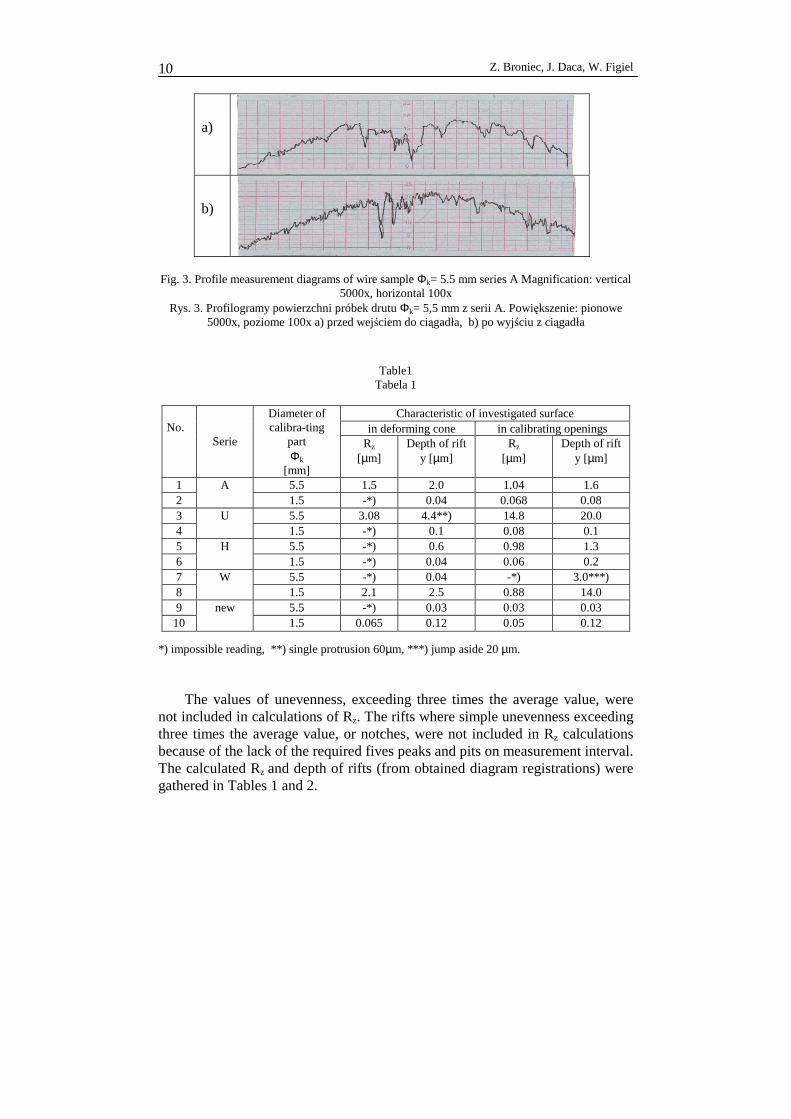
The profile shape diagrams as exemplars of an investigated surface of draw-ing dies are pictured on Fig. 2. As a complement to the above mentioned charts are the registered profile diagrams of processed wire surface before and after deformation (Fig. 3). The magnification coefficients of vertical and horizontal axes are different, so the profile deformation is on the charts. The profile dia-grams registered for bigger surfaces enabled to read extreme value of notch, jump aside, and calculate parameter Rz.
Z. Broniec, J. Daca, W. Figiel 10
a)
b)
Fig. 3. Profile measurement diagrams of wire sample Φk= 5.5 mm series A Magnification: vertical 5000x, horizontal 100x
Rys. 3. Profilogramy powierzchni próbek drutu Φk= 5,5 mm z serii A. Powiększenie: pionowe 5000x, poziome 100x a) przed wejściem do ciągadła, b) po wyjściu z ciągadła
Table1 Tabela 1
Characteristic of investigated surface
in deforming cone in calibrating openings No.
Serie
Diameter of calibra-ting
part Φk
[mm]
Rz [µm]
Depth of rift y [µm]
Rz [µm]
Depth of rift y [µm]
1 A 5.5 1.5 2.0 1.04 1.6 2 1.5 -*) 0.04 0.068 0.08 3 U 5.5 3.08 4.4**) 14.8 20.0 4 1.5 -*) 0.1 0.08 0.1 5 H 5.5 -*) 0.6 0.98 1.3 6 1.5 -*) 0.04 0.06 0.2 7 W 5.5 -*) 0.04 -*) 3.0***) 8 1.5 2.1 2.5 0.88 14.0 9 new 5.5 -*) 0.03 0.03 0.03 10 1.5 0.065 0.12 0.05 0.12
*) impossible reading, **) single protrusion 60µm, ***) jump aside 20 µm. The values of unevenness, exceeding three times the average value, were
not included in calculations of Rz. The rifts where simple unevenness exceeding three times the average value, or notches, were not included in Rz calculations because of the lack of the required fives peaks and pits on measurement interval. The calculated Rz and depth of rifts (from obtained diagram registrations) were gathered in Tables 1 and 2.

Basic problems of surface topography influence on tribology phenomenon...
11
Table 2 Tabela 2
Wire before deformation φk = 5.5 mm Wire after deformation φk = 5.5 mm No
Serie Rz [µm] Depth of rift y [µ] Rz [µm] Depth of rift y [µm]
1 A 1.5 5.0 0.76 3.8 2 U 2.8 5.2 1.6 3.0 3 H 1.54 4.0 0.6 2.8 4 W 1.5 6.0 *) 3.0
*) measurement impossible *) nie można zmierzyć
2.4. Result validations
The smallest coarseness of the eyelet surface of drawing die was obtained in the exploitation condition using “Hydropol” as a lubricating and cooling agent. Next in sequence of roughness were the surfaces of drawing dies working with “Alumol,” “W-35,” and “Unipol.” The obtained results of rift depth measurements of drawn wire samples allow us to state that the lowest destruction of the surface of the work-ing tool is at the point of applying the “Hydropol” agent. The surface coarseness of the drawn wire sample is smallest when using “Hydropol” as a lubricating and cool-ing agent. Next in sequence are the values when applying “Alumol,” “Unipol,” and “W-35” (a different order exists in the coarseness of the working tool surface). The results obtained in rift depth measurements of the drawn wire indicate the lubricating and cooling agent “Hydropol” as the best from those under consideration. The sur-face profiles of the calibrating part of die eyelets with φk = 1.5 mm and φk = 5.5 mm are considerably deformed, compared to unused dies, for all tested lubricating and cooling agents (Fig. 4).
a)
b)
c)
Fig. 4. Profile of calibrating part of the die with Φk= 1.5 mm magnification: vertical 500x, hori-zontal 20x a) unused die (new one), b) series A die, c) series W die
Rys. 4. Profile części kalibrującej oczek ciągadeł o Φk= 1,5 mm powiększenie: pionowe 500x, poziome 20x a) ciągadło nowe, b) ciągadło z serii A, c) ciągadło z serii W
Z. Broniec, J. Daca, W. Figiel 12
Heterogeneity of coarseness in particular places of the investigated surface of drawing die eyelets, and not recurrent periodically macroscopic surface de-viations, e.g. working surface concaveness, or big rift depth, especially for tool working with “W-35” and “Unipol” agents, prove the heterogeneity of the tool surface layer. They (surface concaveness or big rift depth) can be caused by non-uniform and different genus of surface wear. The mechanism of that phe-nomenon is very complicated, which is confirmed by observation of SEI elec-tron images under surface layers of investigated die eyelet [2].
3. Influence analysis of topography changes of investigated surfaces on THE constitution process of THE surface layer of drawing die eyelets
The actual contact area in tribology is from the deformation of higher pro-truding elements of surfaces being in contact. The contact stress between those elements can lead to local plastic deformation. It is common opine that the most contacts between course surfaces have elastic form. The relationship between contact area and stress is exceptionally important in tribology considerations and wear processes. The values of the friction forces are independent of the actual contact area. The friction principles are compatible with elastic deforma-tion principles at the contact of course surfaces but under the condition that the surfaces reveal existence of complicated [3] and hierarchical structure with the characteristic few micro-contact scales. The actual contact is distributed be-tween plenty of micro-contact areas.
Friction energy concentration on small local contact surfaces has a crucial influence on wear process. Real contact executed by the actual contact area can be found only if contact stress is extremely high, for example, in shaping proc-ess between machining tools and the shaped material. During the plastic shaping process, local temperature increases appear up to a very high value even with a relatively small share of friction energy. The obtained surface coarseness and the evaluation of structural deformation [2] of the upper layer of drawing die eyelets are the results of drawing process conditions and the influence of physi-cal and chemical features of the lubricating and cooling agents. The drawing process is associated with high plastic deformation tensions. The deformation tensions are responsible for the plastic deformation of shaped material and the upper layer of shaping tool, i.e. the working surface of die eyelet. Cumulated process tensions may affect surface corrugation. That corrugation can be caused by vibration generated by drawn material translocation on the surface of the die eyelet. The shaped material translocation reduces the effect of actual contact areas by less of the actual contact point of working opposing surfaces. Contact restriction of opposing working surfaces is caused by particles of the lubricating and cooling agent as well. Another reason for contact restriction is the irreversi-ble process of the wear product elimination directly after their removal from the

Basic problems of surface topography influence on tribology phenomenon...
13
wear contact zone. In the case when elements of the wear product are still in-side contact zone but not joined with their original places, they may migrate. That movement is stimulated by the shifted surface of shaped material till the end of contact with the drawing die eyelet. The described phenomenon is one of the reasons for changes in the geometric structure of cooperating surfaces. The high temperature, particularly at the contact point, accompanying the drawing process, has a strong influence on the contact mechanism of moving surfaces in the drawing die eyelet. The tribology phenomenon changes continuously during process time and declining coarseness of cooperating surfaces during process have some impact on it. Secondary electron images (SEI) of the investigated surfaces of drawing die eyelets demonstrate changes in the surface layer of working tools compared to the unused ones.
Losses of binding components, i.e. cobalt, during the wear process from the surface layer cause losses of base component particles, i.e. sinter carbide, form-ing the tool surface [2]. The investigated tools with larger changes of the surface topography characterise themselves by larger structural changes of the working surface layer. The results of the residual stress investigation [4] of the surface layer of drawing die eyelets give evidence of different tribology conditions for particular series of tests. Acquired results of topology changes of investigated samples surfaces and changes in the constitution of the surface layer of the drawing die eyelets lubricated with “HYDROPOL” testify to the beneficial ef-fect of that agent on the wear mechanism [1].
4. Closing observations
The investigation of the surface topography of drawing dies and processed materials proves the large distortion and local irregularity of surface structure. Imperfections and rifts of cooperating surfaces influence the chemical reactions in the presence of the lubricating and cooling agent. Observed irregularity of surfaces indicates the contact mechanism between opposing surfaces. The cobalt impoverishment from the surface structure of drawing die eyelets is unequal on whole area of investigated samples. It can be caused by the temperature rise at contact areas of surface micro irregularity as a result of adhesion splice oppos-ing surfaces.
The investigations prove the simultaneous influence of the tribological phe-nomenon and the existing structural state of surface, which is changing during the wear process.
References
[1] Edytor Martin Jean Michel, Ohmae Nobuo, Nanolubricants, Chichester: Wiley John & Sons, Ltd., cop. 2008.

Z. Broniec, J. Daca, W. Figiel 14
[2] Grobelny J., Celichowski G., Cichomski M., Koralewski K., Piwoński I.: Friction force mi-croscopy study of porous methylsilica thin films, Tribologia, 2-2003.
[3] Daca J., Warszyński M.: Wpływ niektórych własności fizyko-chemicznych chłodziw na proces zużycia oczek ciągadeł, Zeszyty Naukowe Politechniki Opolskiej – Opole 2001.
[4] Daca J., Warszyński M., Analiza wpływu stanu warstwy wierzchniej na trwałość ciągadeł, XVIII Sympozjum PKM, Kielce 1997.
[5] Mate Mathew C.: Tribology on the small scale: a bottom up approach to friction, lubrication, and wear, Oxford: University Press, cop. 2008.
[6] Kulczycki A., Ziemkiewicz R.: Struktura warstwy granicznej a chropowatość smarowanych powierzchni, Trybologia, 4–5, 1986.
[7] Batchelor A.W.: Engineering Tribology, Butterworth - Heinemann - Woburn MA, USA, 2001.
[8] Kulczycki A., Kajdas Cz.: Influence of surface coarseness on tribochemistry of AW/EP layers produced by gear oils, Tribologia, 2–2003.
[9] Broniec Z., Daca J., Figiel W.: Analiza wyników badań naprężeń własnych warstwy wierzch-niej oczek ciągadeł, Zagadnienia Eksploatcji Maszyn, 2–2006.
Manuscript received by Editorial Board, April 27th, 2009.
Wpływ topografii powierzchni na przebieg zjawisk tribologicznych w eksplotacyjnych badaniach zużycia ciągadeł
S t r e s z c z e n i e
Rzeczywista powierzchnia styku jest funkcją geometrycznego zarysu nierówności i przypada-jącego na nią obciążenia. Współpracujące powierzchnie mają bardzo małe pola rzeczywistego styku, co powoduje, że zużycie i tarcie są zdeterminowane przez wysokie naprężenia w strefie styku i skrajne koncentracje energii tarcia. Wiele zjawisk tribologicznych może zaistnieć wskutek wymuszonych wzajemnie oddziaływań nierówności, zanim nastąpi zużycie. Dla określenia wielkości, charakteryzujących strukturę geometryczną badanych powierzchni przeprowadzono pomiary na profilometrze typu Talysurf 4, Taylor-Hobson. Celem tych pomiarów było uzyskanie informacji do przeprowadzenia analizy wpływu topografii stykających się powierzchni na koń-cowy efekt ich współpracy.
Comparison of wear processes of biomaterials used in hip joint implants
15
SCIENTIFIC PROBLEMS OF MACHINES OPERATION AND MAINTENANCE
4 (156) 2008
J.A. ORTEGA-SAENZ*, M. KALBARCZYK **, R. MICHALCZEWSKI** , W. PIEKOSZEWSKI** , M. SZCZEREK**
Comparison of wear processes of biomaterials used in hip joint implants
K e y w o r d s
Total hip joints prostheses, biomaterials, wear, metal-on-metal, tribotester.
S ł o w a k l u c z o w e
Endoproteza, biomateriały, zużycie, skojarzenie materiałowe, tester tribologiczny.
S u m m a r y
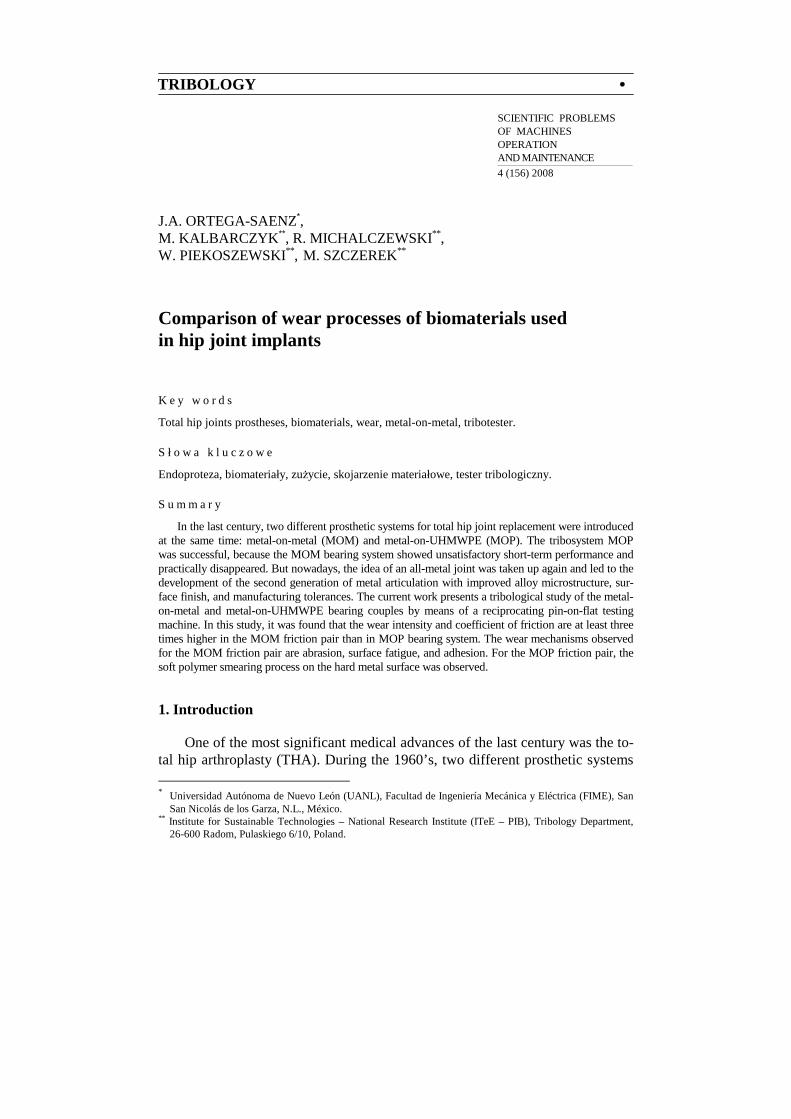
In the last century, two different prosthetic systems for total hip joint replacement were introduced at the same time: metal-on-metal (MOM) and metal-on-UHMWPE (MOP). The tribosystem MOP was successful, because the MOM bearing system showed unsatisfactory short-term performance and practically disappeared. But nowadays, the idea of an all-metal joint was taken up again and led to the development of the second generation of metal articulation with improved alloy microstructure, sur-face finish, and manufacturing tolerances. The current work presents a tribological study of the metal-on-metal and metal-on-UHMWPE bearing couples by means of a reciprocating pin-on-flat testing machine. In this study, it was found that the wear intensity and coefficient of friction are at least three times higher in the MOM friction pair than in MOP bearing system. The wear mechanisms observed for the MOM friction pair are abrasion, surface fatigue, and adhesion. For the MOP friction pair, the soft polymer smearing process on the hard metal surface was observed.
1. Introduction
One of the most significant medical advances of the last century was the to-tal hip arthroplasty (THA). During the 1960’s, two different prosthetic systems * Universidad Autónoma de Nuevo León (UANL), Facultad de Ingeniería Mecánica y Eléctrica (FIME), San
San Nicolás de los Garza, N.L., México. ** Institute for Sustainable Technologies – National Research Institute (ITeE – PIB), Tribology Department,
26-600 Radom, Pulaskiego 6/10, Poland.
TRIBOLOGY •

J.A. Ortega-Saenz, M. Kalbarczyk, R. Michalczewski, W. Piekoszewski, M. Szczerek 16
were introduced. One of these was the Charnley low-friction arthroplasty, which featured a metal-on-UHMWPE (Ultra High Molecular Weight Polyethylene) articulation, and the other was the McKee-Farrar total hip, which employed a metal-on-metal (CoCr-CoCr) articulation.
The first metal-on-metal total hip prostheses showed unsatisfactory short-term performance mostly due to geometrical inaccuracies that led to high fric-tion forces and increased wear [1- 4]. Therefore, the metal-on-polyethylene bearings became preferable, while the use of the metal-on-metal systems ex-pired.
Currently, total hip arthroplasty technology has been extended to younger or more active patients and polyethylene wear has become a major problem. Failure of total hip arthroplasties has been shown to be principally due to late aseptic loosening of acetabular components due to UHMWPE debris that in-duces bone resorption [5 - 8]. It is thought to be the phagocytic response to these wear particles that induces localised osteolysis by the release of osteolytic me-diators [5, 6, 9], which results in loosening of the joint at the fixation interface.
Since the volumetric wear of materials is inversely proportional to hardness of the material, one way of reducing this wear volume is to incorporate two hard bearing surfaces such as metal-on-metal or ceramic-on-ceramic. Metal-on-metal (MOM) hip joint bearings are gaining more and more acceptance as an alterna-tive to conventional metal-on-UHMWPE (MOP) bearings [10, 11]. Some crite-ria in favour of MOM bearings are the excellent wear resistance [12] as well as the friction torque [13, 14]. Recent developments of MOM bearings indicate a third less friction torque during simulated gait than MOP bearings [15]. This is an interesting finding, because high friction was one of the reasons that the MOM prostheses lost their popularity at the end of the 1960’s. The idea of an all-metal joint was taken up again in the mid 1980’s and led to the development of the “second generation metal-on-metal bearing joints” with improved alloy microstructure, surface finish, and manufacturing tolerances.
The aim of this paper was to analyse the wear process in the most popular prosthetic systems: metal-on-UHMWPE and metal-on-metal.
2. Experimental Details
2.1. Materials
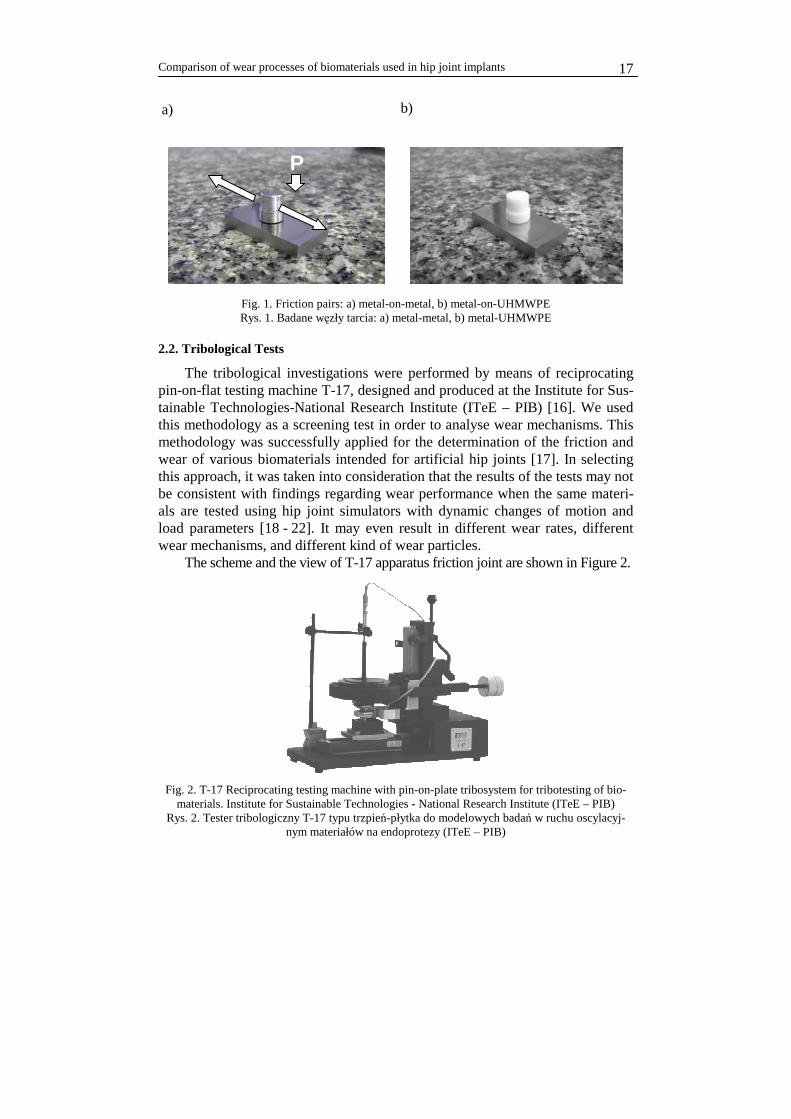
For the present study, two different friction pairs were analysed, metal-on-metal and metal-on-UHMWPE, using a pin-on plate configuration. Samples with plate and pin shape were produce from a rod of 31.25 mm in diameter of Co-Cr-Mo alloy (BioDur CCM) supplied by the Carpenter Technology. For metal-on-metal friction pair, a Co-Cr-Mo alloy pin and plate were used, and for metal-on-UHMWPE, a Co-Cr-Mo alloy plate and a UHMWPE pin were used. MOM and MOP friction pairs are shown on Figure 1.
Comparison of wear processes of biomaterials used in hip joint implants
17
Fig. 1. Friction pairs: a) metal-on-metal, b) metal-on-UHMWPE Rys. 1. Badane węzły tarcia: a) metal-metal, b) metal-UHMWPE
2.2. Tribological Tests
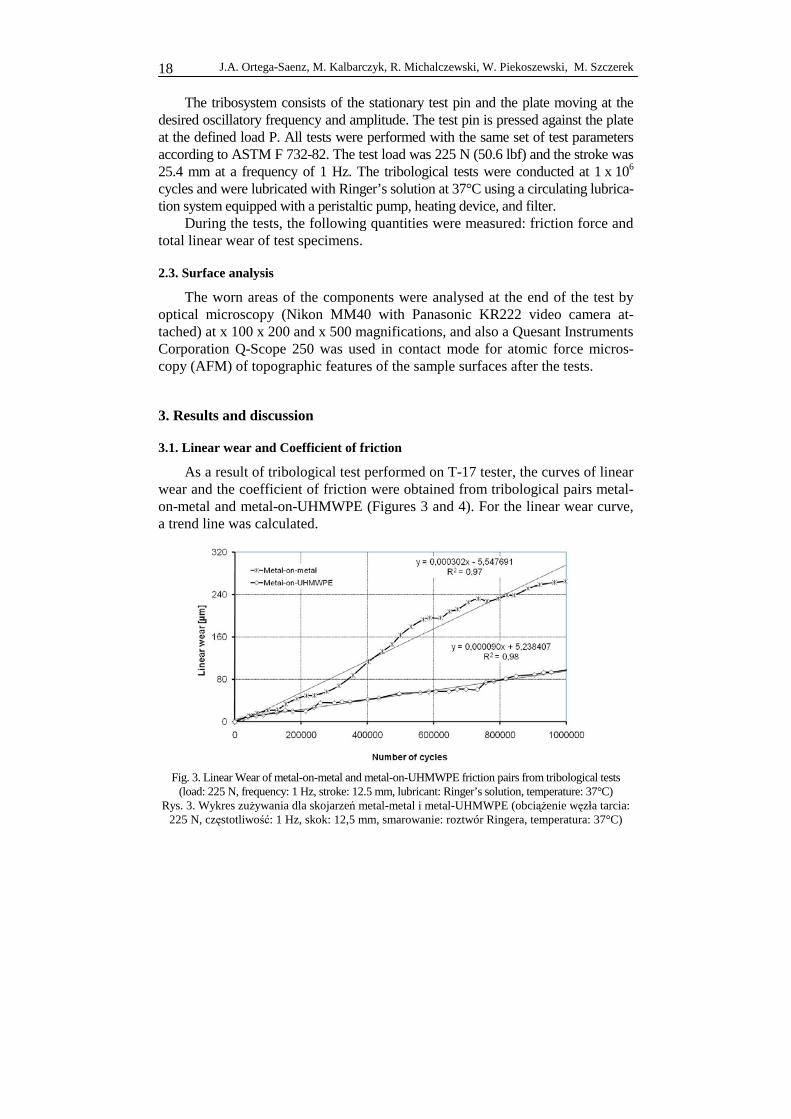
The tribological investigations were performed by means of reciprocating pin-on-flat testing machine T-17, designed and produced at the Institute for Sus-tainable Technologies-National Research Institute (ITeE – PIB) [16]. We used this methodology as a screening test in order to analyse wear mechanisms. This methodology was successfully applied for the determination of the friction and wear of various biomaterials intended for artificial hip joints [17]. In selecting this approach, it was taken into consideration that the results of the tests may not be consistent with findings regarding wear performance when the same materi-als are tested using hip joint simulators with dynamic changes of motion and load parameters [18 - 22]. It may even result in different wear rates, different wear mechanisms, and different kind of wear particles.
The scheme and the view of T-17 apparatus friction joint are shown in Figure 2.
Fig. 2. T-17 Reciprocating testing machine with pin-on-plate tribosystem for tribotesting of bio-
materials. Institute for Sustainable Technologies - National Research Institute (ITeE – PIB) Rys. 2. Tester tribologiczny T-17 typu trzpień-płytka do modelowych badań w ruchu oscylacyj-
nym materiałów na endoprotezy (ITeE – PIB)
a) b)
P
J.A. Ortega-Saenz, M. Kalbarczyk, R. Michalczewski, W. Piekoszewski, M. Szczerek 18
The tribosystem consists of the stationary test pin and the plate moving at the desired oscillatory frequency and amplitude. The test pin is pressed against the plate at the defined load P. All tests were performed with the same set of test parameters according to ASTM F 732-82. The test load was 225 N (50.6 lbf) and the stroke was 25.4 mm at a frequency of 1 Hz. The tribological tests were conducted at 1 x 10⁶ cycles and were lubricated with Ringer’s solution at 37°C using a circulating lubrica-tion system equipped with a peristaltic pump, heating device, and filter.
During the tests, the following quantities were measured: friction force and total linear wear of test specimens.
2.3. Surface analysis
The worn areas of the components were analysed at the end of the test by optical microscopy (Nikon MM40 with Panasonic KR222 video camera at-tached) at x 100 x 200 and x 500 magnifications, and also a Quesant Instruments Corporation Q-Scope 250 was used in contact mode for atomic force micros-copy (AFM) of topographic features of the sample surfaces after the tests.
3. Results and discussion
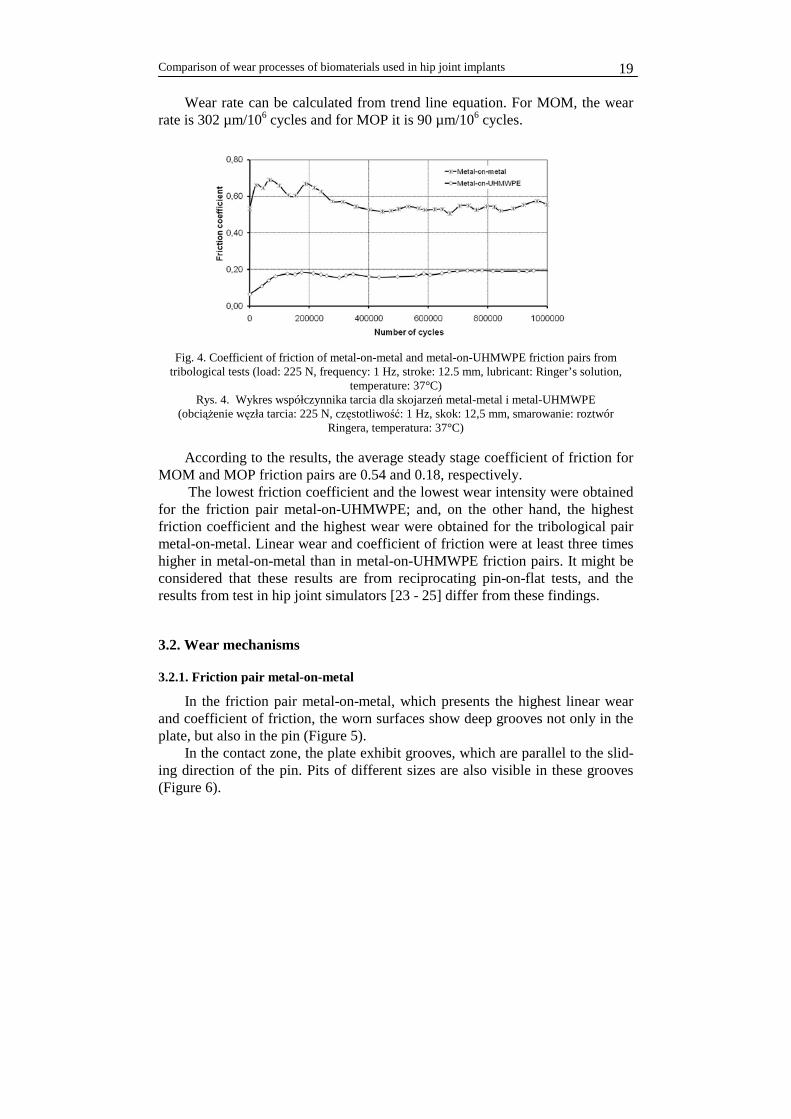
3.1. Linear wear and Coefficient of friction
As a result of tribological test performed on T-17 tester, the curves of linear wear and the coefficient of friction were obtained from tribological pairs metal-on-metal and metal-on-UHMWPE (Figures 3 and 4). For the linear wear curve, a trend line was calculated.
Fig. 3. Linear Wear of metal-on-metal and metal-on-UHMWPE friction pairs from tribological tests
(load: 225 N, frequency: 1 Hz, stroke: 12.5 mm, lubricant: Ringer’s solution, temperature: 37°C) Rys. 3. Wykres zużywania dla skojarzeń metal-metal i metal-UHMWPE (obciążenie węzła tarcia:
225 N, częstotliwość: 1 Hz, skok: 12,5 mm, smarowanie: roztwór Ringera, temperatura: 37°C)
Comparison of wear processes of biomaterials used in hip joint implants
19
Wear rate can be calculated from trend line equation. For MOM, the wear rate is 302 µm/106 cycles and for MOP it is 90 µm/106 cycles.
Fig. 4. Coefficient of friction of metal-on-metal and metal-on-UHMWPE friction pairs from
tribological tests (load: 225 N, frequency: 1 Hz, stroke: 12.5 mm, lubricant: Ringer’s solution, temperature: 37°C)
Rys. 4. Wykres współczynnika tarcia dla skojarzeń metal-metal i metal-UHMWPE (obciążenie węzła tarcia: 225 N, częstotliwość: 1 Hz, skok: 12,5 mm, smarowanie: roztwór
Ringera, temperatura: 37°C)
According to the results, the average steady stage coefficient of friction for MOM and MOP friction pairs are 0.54 and 0.18, respectively.
The lowest friction coefficient and the lowest wear intensity were obtained for the friction pair metal-on-UHMWPE; and, on the other hand, the highest friction coefficient and the highest wear were obtained for the tribological pair metal-on-metal. Linear wear and coefficient of friction were at least three times higher in metal-on-metal than in metal-on-UHMWPE friction pairs. It might be considered that these results are from reciprocating pin-on-flat tests, and the results from test in hip joint simulators [23 - 25] differ from these findings.
3.2. Wear mechanisms
3.2.1. Friction pair metal-on-metal
In the friction pair metal-on-metal, which presents the highest linear wear and coefficient of friction, the worn surfaces show deep grooves not only in the plate, but also in the pin (Figure 5).
In the contact zone, the plate exhibit grooves, which are parallel to the slid-ing direction of the pin. Pits of different sizes are also visible in these grooves (Figure 6).

J.A. Ortega-Saenz, M. Kalbarczyk, R. Michalczewski, W. Piekoszewski, M. Szczerek 20
Fig. 5. Worn surfaces of friction pair metal-on-metal friction pair after 1 x 10⁶ cycles of reciprocat-ing sliding motion in tribological tests: a) plate, b) pin
Rys. 5. Zużycie na współpracujących powierzchniach skojarzenia metal-metal po 1 x 10⁶ cykli w ruchu oscylacyjnym: a) płytka, b) trzpień
Fig. 6. Worn zones in the plate: a) grooves and pits on the worn surface of the plate in metal-on-metal friction pair at 100x magnification, b) pits in the worn surface of the plate at 200x magnification
Rys. 6. Obszary zużycia widoczne na metalowej płytce współpracującej z metalowym trzpieniem: a) bruzdy i wyrwy przy powiększeniu 100x, b) wyrwy w powierzchni przy powiększeniu 200x
The plate topography where grooves and adhesion marks are visible is
shown by AFM image (Figure 7).
Fig. 7. AFM image showing the topography of grooves, pits and adhesion of material
to the surface of the plate of MOM friction pair Rys. 7. Obraz AFM przedstawiający bruzdy, wyrwy oraz adhezję polimeru do powierzchni
metalowej płytki
a) b)
a) b)
Comparison of wear processes of biomaterials used in hip joint implants
21
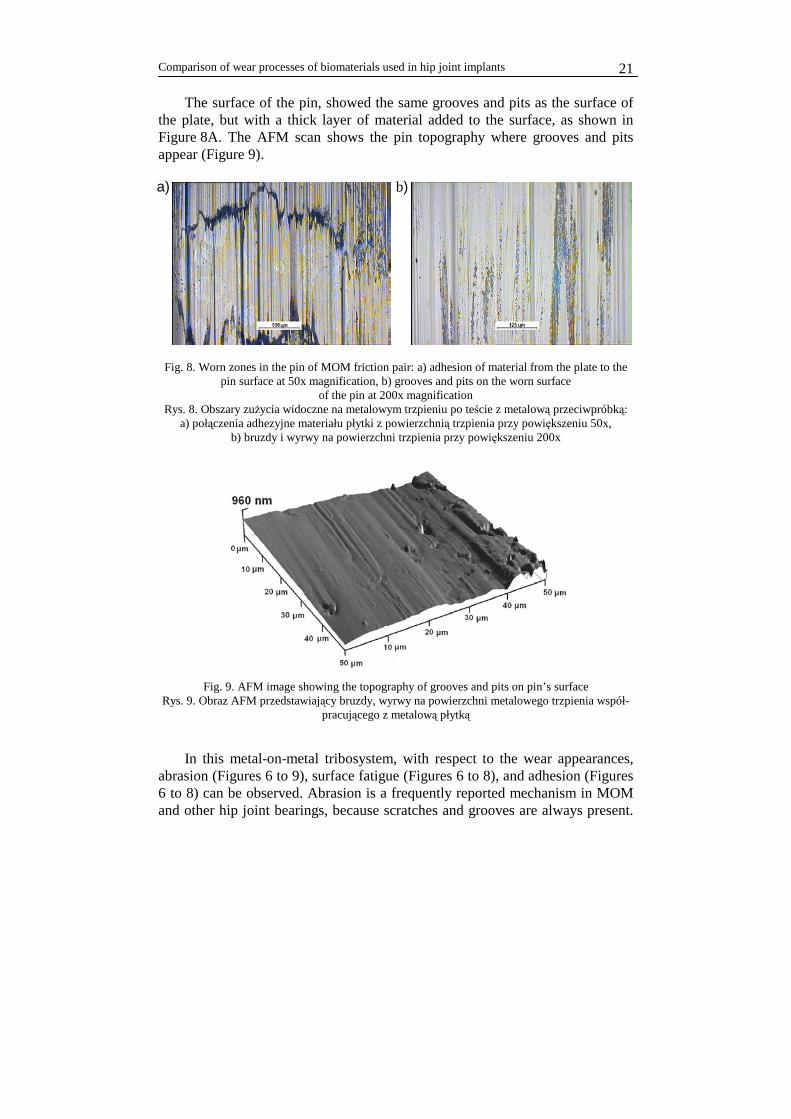
The surface of the pin, showed the same grooves and pits as the surface of the plate, but with a thick layer of material added to the surface, as shown in Figure 8A. The AFM scan shows the pin topography where grooves and pits appear (Figure 9).
Fig. 8. Worn zones in the pin of MOM friction pair: a) adhesion of material from the plate to the pin surface at 50x magnification, b) grooves and pits on the worn surface
of the pin at 200x magnification Rys. 8. Obszary zużycia widoczne na metalowym trzpieniu po teście z metalową przeciwpróbką:
a) połączenia adhezyjne materiału płytki z powierzchnią trzpienia przy powiększeniu 50x, b) bruzdy i wyrwy na powierzchni trzpienia przy powiększeniu 200x
Fig. 9. AFM image showing the topography of grooves and pits on pin’s surface Rys. 9. Obraz AFM przedstawiający bruzdy, wyrwy na powierzchni metalowego trzpienia współ-
pracującego z metalową płytką
In this metal-on-metal tribosystem, with respect to the wear appearances, abrasion (Figures 6 to 9), surface fatigue (Figures 6 to 8), and adhesion (Figures 6 to 8) can be observed. Abrasion is a frequently reported mechanism in MOM and other hip joint bearings, because scratches and grooves are always present.
a) b)

J.A. Ortega-Saenz, M. Kalbarczyk, R. Michalczewski, W. Piekoszewski, M. Szczerek 22
Abrasion may be induced by foreign particles or from system inherent particles like wear debris.
3.2.2. Friction pair metal-on-UHMWPE
In the friction pair metal-on-UHMWPE, only wear of the pin was observed, while the plate was intact only with the transferred layer of UHMWPE on the top of it (see Figure 10).
Fig. 10. Worn surfaces of metal-on-UHMWPE friction pair after 1 x 10⁶ cycles of reciprocating sliding motion in tribological tests: a) plate, b) pin
Rys. 10. Zużycie na współpracujących powierzchniach skojarzenia metal-UHMWPE po 1 x 10⁶ cykli w ruchu oscylacyjnym: a) płytka, b) trzpień
Fig. 11. Metal-on-UHMWPE friction pair: a) picture of plate after test showing adhesion of mate-rial in the surface at 50x magnification, b) pin of UHMWPE after test at 100x magnification,
showing grooves Rys. 11. Skojarzenie metal-UHMWPE: a) adhezja polimeru do powierzchni metalowej płytki przy
powiększeniu 50x, b) bruzdy na powierzchni polimerowego trzpienia przy powiększeniu 100x
The specimens were analysed before and after the test by means of atomic
force microscopy. The pictures are shown on Figure 12.
a) b)
a) b)
Comparison of wear processes of biomaterials used in hip joint implants
23
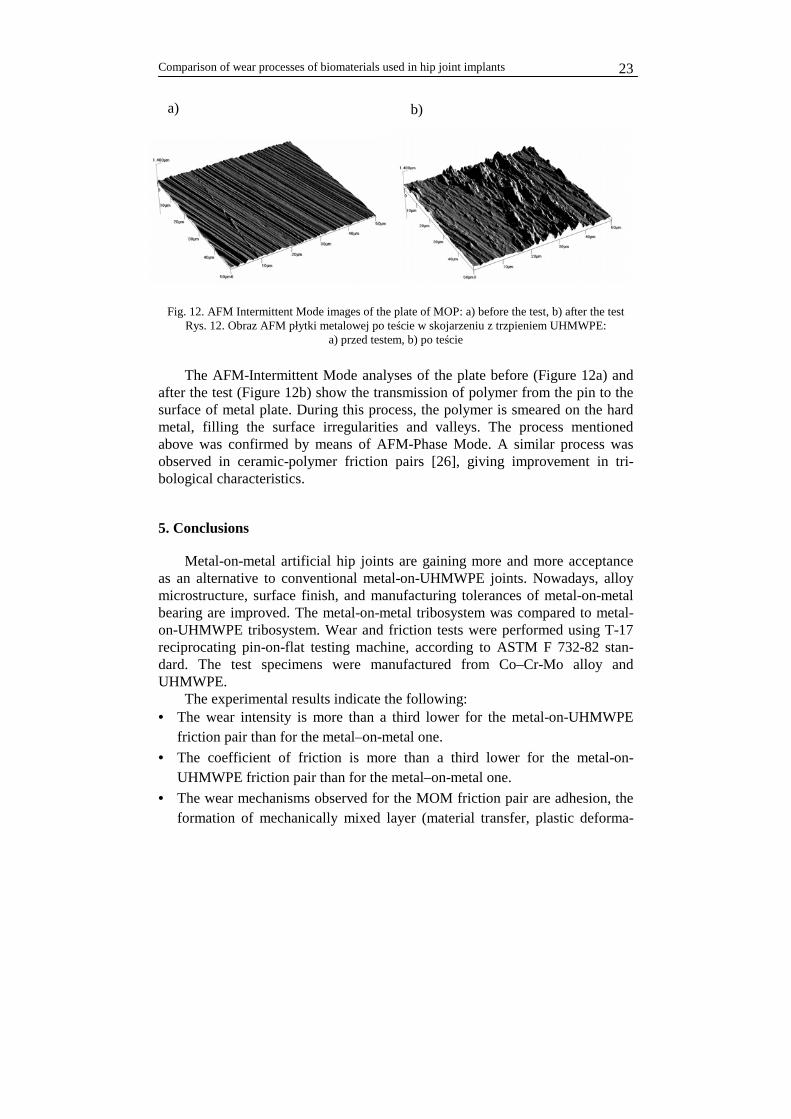
Fig. 12. AFM Intermittent Mode images of the plate of MOP: a) before the test, b) after the test Rys. 12. Obraz AFM płytki metalowej po teście w skojarzeniu z trzpieniem UHMWPE:
a) przed testem, b) po teście The AFM-Intermittent Mode analyses of the plate before (Figure 12a) and
after the test (Figure 12b) show the transmission of polymer from the pin to the surface of metal plate. During this process, the polymer is smeared on the hard metal, filling the surface irregularities and valleys. The process mentioned above was confirmed by means of AFM-Phase Mode. A similar process was observed in ceramic-polymer friction pairs [26], giving improvement in tri-bological characteristics.
5. Conclusions
Metal-on-metal artificial hip joints are gaining more and more acceptance as an alternative to conventional metal-on-UHMWPE joints. Nowadays, alloy microstructure, surface finish, and manufacturing tolerances of metal-on-metal bearing are improved. The metal-on-metal tribosystem was compared to metal-on-UHMWPE tribosystem. Wear and friction tests were performed using T-17 reciprocating pin-on-flat testing machine, according to ASTM F 732-82 stan-dard. The test specimens were manufactured from Co–Cr-Mo alloy and UHMWPE.
The experimental results indicate the following: • The wear intensity is more than a third lower for the metal-on-UHMWPE
friction pair than for the metal–on-metal one.
• The coefficient of friction is more than a third lower for the metal-on-UHMWPE friction pair than for the metal–on-metal one.
• The wear mechanisms observed for the MOM friction pair are adhesion, the formation of mechanically mixed layer (material transfer, plastic deforma-
b) a)
J.A. Ortega-Saenz, M. Kalbarczyk, R. Michalczewski, W. Piekoszewski, M. Szczerek 24
tion), debris formation, abrasion and fatigue, creating severe wear on the both metal surfaces.
• For the MOP friction pair, the soft polymer smearing process on the hard metal surface was observed. According to the results obtained by means of reciprocating pin-on-flat testing
machine, the metal-on-metal friction pair cannot be directly introduced to the arti-ficial hip joints. In real application, it is necessary to modzify at least one of the surfaces to achieve better protection against adhesion to reduce abrasion and sur-face fatigue. It must be considered that the results shown in this paper do not ex-actly correlate with results obtained by means of hip joint simulators [1, 2].
References
[1] Scholes S.C., Green S.M., Unsworth A.: The wear of metal-on-metal total hip prostheses measured in a hip simulator, Proc. Instn. Mech. Engrs. 215 Part H (2001), pp. 523–530.
[2] Amstutz H.C., Grigoris P.: Metal on metal bearing in hip arthroplasty, Clin. Orthop. 329 (Suppl.) (1996), pp. 11–34.
[3] McKee G.K.: Total hip replacement- past, present and future, Biomaterials 3 (1982), pp. 130–135.
[4] Jacobsson S.A., Djerf K., Wahlstrom O.: 20 years result of McKee-Farrar vs. Charnley prosthesis, Clin. Orthop. 329 (Suppl.) (1996), pp. 60–68.
[5] Schmalzried T.P., Jasty M., Harris W.H.: Periprosthetic bone loss in total hip arthroplasty, J. Bone Jt. Surg. 74-A (1992), pp. 849–863.
[6] Howie D.W., Vernon-Roberts B., Oakeshott R., Manthey B.: A rat model of resorption of bone at the cement–bone interface in the presence of polyethylene wear particles, J. Bone Jt. Surg. 70-A (1988), pp. 257–263.
[7] Doorn P.F., Campbell P.A., Amstutz H.C.: Metal versus polyethylene wear particles in total hip replacements, Clin. Orthop. Relat. Res. 329S (1991), pp. S206–S215.
[8] Margevicius K.J., Bauer T.W., McMahon J.T., Brown S.A., Merritt K.: Isolation and char-acterisation of debris in membranes around total joint prostheses, J. Bone Jt. Surg. 76A (1991), pp. 1664–1675.
[9] Palacios-Carvajal J., Palacios-Cabezas J., Palacios-Cabezas P.: The reason for failures of hip prostheses, Orthopaedics International Edition 4 (1996), pp. 11–16.
[10] Dorr L.D., Wan Z., Longjohn D.B., Dubois B., Murken R.: Total hip arthroplasty with use of the metasul metal-on-metal articulation: 4–7-year results, J. Bone Joint Surg. Am. 82 (6) (2000), pp. 789–798.
[11] Rieker C.B., Köttig P., Schön R., Windler M., Wyss U.P.: Clinical wear performance of metal-on-metal hip arthroplasties, in: J.J. Jacobs, T.L. Craig, (Eds.), Alternative Bearing Sur-faces in Total Joint Replacement, ASTM 1346 STP, American Society for Testing and Mate-rials, 1998, pp. 144–156.
[12] Sieber H.P., Rieker C.B., Kottig P.: Analysis of 118 second generation metal-on-metal retrieved hip implants, J. Bone Joint Surg. Br. 81 (1) (1999), pp. 46–50.
[13] Streicher R.M., Schön R., Semlitsch M.F.: Investigation of the tribological behavior of metal-on-metal combinations for artificial hip joints, Biomed. Tech. 35 (5) (1990) 107–111.
[14] Scholes S.C., A. Unsworth, Comparison of friction and lubrication of different prostheses, Proc. Inst. Mech. Eng. H 214 (1) (2000), pp. 49–57.
[15] R.A. Poggie, Afflitto R., John K.St.: The wear performance of precision Co–Cr–Mo alloy metal-on-metal hip bearings. in: Proceedings of the Conference Transactions of the 12th
Comparison of wear processes of biomaterials used in hip joint implants
25
Annual International Symposium for Technology in Arthroplasty, Chicago, 23–25 Septem-ber 1999, pp. XI:1–2.
[16] Michalczewski R., Piekoszewski W., Szczerek M., Samborski T., Wasiak J.: Metoda i urządzenie do badań tribologicznych materiałów na endoprotezy. Tribologia. 5 (2002), pp. 1491–1502.
[17] Niemczewska M.: The surface treatment of ceramic endoprosthesis components Doctoral Thesis. Politechnika Krakowska 2006.
[18] Hernandez-Rodriguez M.A.L., Mercado-Solis R.D., Perez-Unzueta A.J., Martinez- -Delgado D.I., Cantu-Sifuentes M.: Wear of cast metal–metal pairs for total replacement hip prostheses, Wear 259 (7–12) (2005), pp. 958–963.
[19] Ortega-Sáenz J.A., Hernández-Rodríguez M.A.L., Pérez-Unzueta A., Mercado-Solis R.: Development of a hip wear simulation rig including micro-separation, Wear, Volume 263, Issues 7-12, 10 September 2007, pp. 1527–1532
[20] Kaddick C., Wimmer M.A.: Hip simulator wear testing according to the newly introduced standard ISO 14242, J. Eng. Med. 215 (5) (2001), pp. 429–442.
[21] Saikko V., Ahlroos T., Calonius O., Keränen J.: Wear simulation of total hip prostheses with polyethylene against CoCr, alumina and diamond-like carbon, Biomaterials, Volume 22, Is-sue 12, 15 June 2001, pp. 1507–1514
[22] Kalbarczyk M., Piekoszewski W, Szczerek W., Wulczyński J.: The machines for testing wear and friction characteristics of materials and elements of endoprosthesis. Proc. of 9th Conference ,,Mechanics in Medicine”. Rzeszów. 2008, pp. 197–209.
[23] Dowson D., McNie C.M., Goldsmith A.A.J.: Direct experimental evidence of lubrication in metal-on-metal total hip replacement tested in a joint simulator, Proc. Inst. Mech. Eng., Part C, J. Mech. Eng. Sci. 214 (2000), pp. 75–86.
[24] Medley J.B., Bobyn J.D., Krygier J.J., Chan F.W., Tanze M., Roter G.E.: Elastohydrody-namic lubrication and wear of metal-on-metal hip implants, in: C. Rieker, S. Oberholzer, U. Wyss (Eds.), World Tribology Forum in Arthroplasty, Hans Huber, Bern, 2001, pp. 3–14.
[25] Hernandez-Rodr´yguez M.A.L.: Influencia microestructural y dimensional en el desgaste de prototipos de protesis de cadera metal-metal fabricados en Co–Cr–Mo–C. phD thesis (in spanish), Facultad de Ingenier´ya Mecanica y Electrica, Universidad Autonoma de Nuevo Leon, 2004.
[26] Kalbarczyk M., Michalczewski R., Piekoszewski W., Szczerek M.: The correlation between 3D surface parameters of ceramic element and tribological characteristics in ceramic-polymer joints. Scientific Problems of Machine Operation And Maintenance, 43 (2008), pp. 7–17.
Manuscript received by Editorial Board, December 17th, 2008.
Porównanie procesów zużywania biomateriałów przeznaczonych na protezy stawu biodrowego
S t r e s z c z e n i e
Lata 60. ubiegłego stulecia to początek alloplastyki stawów biodrowych. Skojarzenia mate-riałowe wówczas stosowane do produkcji sztucznych stawów to głównie pary: metal– –metal (MOM) i metal–polimer (MOP). Wkrótce para metal–metal została wyparta ze względu na znacznie gorsze właściwości tribologiczne.
Obecnie idea stosowania skojarzeń metalowo-metalowych powraca, między innymi z powo-du postępu w kształtowaniu mikrostruktury materiałów, technik przygotowania i wykończenia elementów endoprotez.
Praca przedstawia wyniki wstępnych modelowych badań tribologicznych materiałów na en-doprotezy w ruchu oscylacyjnym, za pomocą urządzenia typu trzpień–płytka.

J.A. Ortega-Saenz, M. Kalbarczyk, R. Michalczewski, W. Piekoszewski, M. Szczerek 26
Badaniom poddano skojarzenia metal–metal i metal–UHMWPE (polietylen wielkocząstecz-kowy).
Zaobserwowano, że intensywność zużywania oraz współczynnik tarcia jest przynajmniej trzy razy wyższy dla skojarzenia metal–metal niż dla skojarzenia metal–UHMWPE. W przypadku pary metal–metal zachodzi zużywanie ścierne, zmęczeniowe i adhezyjne. W przypadku pary metal-polimer zachodzi proces przenoszenia miękkiego polimeru z trzpienia na twardą powierzchnię metalu.
Comparison of wear processes of biomaterials used in hip joint implants
27
SCIENTIFIC PROBLEMS OF MACHINES OPERATION AND MAINTENANCE
4 (156) 2008
HENRYK TOMASZEK*, MICHAŁ JASZTAL**
Comments on the improvement of the military aircraft operation by limiting the possibilities of damage formation
K e y w o r d s
Reliability, safety, diagnostic parameter, limit state, preventive measures.
S ł o w a k l u c z o w e
Niezawodność, bezpieczeństwo, parametr diagnostyczny, stan graniczny, profilaktyka.
S u m m a r y
Aircraft safety is one of the most important issues concerning their operation. Aircraft safety has a direct influence on economic indicators. In turn, aircraft safety depends on the reliability of an aircraft. Taking care of this reliability is equivalent to concern for safety. The reliability of an aircraft depends on an appropriate technical maintenance aimed at preventive measures, which include the development of technical projects that eliminate damage causes.
This article presents an attempt at describing the reliability of an aircraft with appropriately developed preventive measures that enable an assessment of an aircraft’s reliability with the use of the exponential distribution.
1. Introduction
As far as safety aspect is concerned, the operation of aircraft mainly consist in the way of servicing (which is being developed), which is aimed at the elimi-
* Instytut Techniczny Wojsk Lotniczych, ul. Księcia Bolesława 6, 01-494 Warszawa, skr. poczt. 96,
tel. (0-22) 6851956; faks (0-22) 836 44 71. ** Wojskowa Akademia Techniczna, Wydział Mechatroniki, ul. Kaliskiego 2, 00-908 Warszawa 49,
tel. (0-22) 683 73 74, faks (0-22) 685 75 81.
RELIABILITY •

H. Tomaszek, M. Jasztal 28
nation of damage causes during flight, especially damages which may cause failures or crashes.
Despite all efforts, it is still impossible to make a full assessment of an aircraft’s technical condition under the influence of destructive processes (fatigue and other types). Non-detection (overlooking) of signalling damages results in catastrophic (sudden) damages that usually causes serious failures and plane crashes.
This way of servicing aircraft engineering and assessing the reliability re-sults in a suggestion concerning the classification of all types of damages of an aircraft. The classification is as follows: • Signalling damages that can be removed without consequences; • Signalling damages which are detectable; when such damages are not de-
tected in due time they result in serious consequences; • Catastrophic damages (non-signalling) which usually result in serious conse-
quences, for example, aircraft equipment failures and air crashes. So, it can be assumed that all damages concerning the period of an aircraft
operation can be divided into two separate groups, i.e. signalling damages and catastrophic damages. It is accepted that an aircraft maintains its fitness state till the first out of two groups of damages.
Unfitness of an aircraft can be determined in the following way:
( ) ( ) ( )tRtRtR 21 ⋅= (1)
where: ( )tR1 – probability that until t there will be no sudden damage in an aircraft;
( )tR2 – probability that until t there will be no signalling damage in an aircraft.
Above all, concern for safety includes taking care of high level of an air-
craft’s reliability during flight. In the next part of the study the possibility of assessment of the reliability and ways of its improvement are discussed.
2. The outline of the method of reliability assessment of an aircraft taking into consideration signalling and catastrophic damages
2.1. Description of the operation conditions and acceptance of assumptions
It is accepted that the operation of an aircraft includes the following as-sumptions: 1. n diagnostic parameters are used to assess technical condition. Thus, techni-
cal condition vector has the following form:
( )nxxxx ,...,, 21= .

Comments on the improvement of the military aircraft operation by limiting...
29
2. As far as the reliability assessment is concerned, instead of diagnostic pa-rameter values, the following deviations are used:
( )nixxz nomiii ,...,2,1=−= ,
where: xi – i- diagnostic parameter; xi nom – nominal value of i parameter.
3. Values of deviations zi (i=1, 2, ... , n) are positive numbers.
4. Limit values of deviations are diz . If ),...,2,1(0 nizz dii =<≤ then an air-
craft is faultless. If at least one deviation exceeds the admissible value, then an aircraft is non-operational.
5. It is assumed that deviations ),...,2,1( nizi = are independent random vari-
ables, i.e. value change of one deviation does not result in value change of another deviation.
6. Value change of deviations, zI, results from an aircraft work, i.e. during an aircraft flight.
7. Deviation value change rate can be described by the following dependency:
( )iii czg
dN
dz,= , (2)
where: zi – deviation of diagnostic parameter; ci – indicators of local operation conditions of elements which affect
the growth in deviation of a diagnostic parameter; N – the number of flights of an aircraft.
Using dependency (2), we can determine the value of deviation during one flight:
( ) Nczgz iii ∆=∆ , , for ∆N = 1. (3)
8. Intensity of aircraft flights λ is determined by the following dependency:
t
P
∆=λ , (4)
where: ∆t – time interval in which there will be flight of an aircraft with prob-ability P. Time interval ∆t shall be matched in such way (depends on functioning of an aircraft operational system) that 1≤t∆λ .
Using intensity of aircraft flights λ we can determine the number of flights performed up to t in accordance with the following dependency:
tN λ= . (5)
9. It is assumed that an aircraft is operated. Technical service is supposed to
prevent signalling damages and reduce the possibility of catastrophic dam-ages which cause failures and air crashes.

H. Tomaszek, M. Jasztal 30
2.2. Determining aircraft reliability ta king into consideration signalling and catastrophic damages
Probabilistic description of the growth in the deviation of diagnostic pa-rameters in the function of time of operation can be considered separately for each diagnostic parameter. Thus, we accept that we consider changes of devia-tion of i- a diagnostic parameter.
tizU , means the probability that at the moment t deviation of i- parameter
is zi. Dynamics of changes (growth) of i- deviation can be determined by the fol-
lowing difference equation:
( ) tzztzttz iiiiUtUtU ,,, 1 ∆−∆+ ∆+∆−= λλ , (6)
where: ( )t∆−λ1 – the probability that within time interval ∆t there will be
no flight of an aircraft; t∆λ – the probability of an aircraft flight within time interval ∆t.
Hence:
( ) 11 =∆+∆− tt λλ .
Equation (6) determines the possibility that at the moment tt ∆+ , the value of deviation of i- diagnostic parameter will be zi if, at the moment t deviation had this value and it did not increase because there was no flight of an aircraft, or at the moment t deviation had the following value: ii zz ∆− and during time
interval ∆t it increased ∆zi because the flight happened. Difference equation (6) in the functional notation has the following form:
( ) ( ) ( ) ( )tzztutzutttzu iiii ,,1, ∆−∆+∆−=∆+ λλ , (7)
where: ),( tzu i – the function of the density of deviation of i- diagnostic pa-
rameter from the nominal value.
We will transform difference equation (7) into partial differential equation using the following approximations:
( ) ( ) ( )
( ) ( ) ( ) ( ) ( ) .,
2
1,,,
,,
,,
2
2
2
ii
ii
i
iiii
iii
zz
tzuz
z
tzutzutzzu
tt
tzutzuttzu
∆∂
∂+∆∂
∂−=∆−
∆∂
∂+=∆+ (8)
Comments on the improvement of the military aircraft operation by limiting...
31
Substituting (8) into equation (7) we obtain:
( ) ( ) ( ) ( )
( ) ( ) ( ) ( )
∂
∂ +∂
∂−
+−=∂∂+
22
2
1,
21,
,
,1,
,
ii
ii
i
i
ii
i
zz
tzuz
ztzu
tzu
ttzuttz
tzutzu
∆∆
∆∆∆ λλ.
Hence, after reduction we obtain:
( ) ( ) ( ) ( )2
22 ,
2
1,,
i
ii
i
ii
i
z
tzuzt
z
tzutzt
t
tzu
∂∂∆∆+
∂∂∆∆−=∆
∂∂ λλ . (9)
Dividing both sides of equation (9) by ∆t, we obtain:
( ) ( ) ( ) ( ) ( )2
2 ,
2
1,,
i
ii
i
ii
i
z
tzuta
z
tzutb
t
tzu
∂∂+
∂∂−=
∂∂
, (10)
where: ( ) ii ztb ∆= λ – average growth in deviation of i- diagnostic pa-
rameter from the nominal value per unit of time;
( ) ( )2ii zta ∆= λ – average square of growth in deviation of i-
diagnostic parameter from the nominal value per unit of time;
iz∆ – value of diagnostic parameter deviation during one
flight (determined by dependency (3)).
We are looking for a special solution of equation (10) which meets the fol-lowing conditions: if 0→t , the solution is convergent with the Dirac function, i.e. u(zi,t) →0, for z ≠ 0 u(0,t)→∞, but in such way that the integral of function u is equal one for t > 0.
According to the accepted condition, the solution of equation (10) has the following form:
( )
( )( )( )tA
tBz
i
ii
ii
etA
tzu 2
2
2
1),(
−−=
π, (11)
where:
( ) ( )dttbtB i
t
i ∫=0
, (12)
H. Tomaszek, M. Jasztal 32
( ) ( )dttatA i
t
i ∫=0
. (13)
Dependency (12) determines the average value of deviation, and depend-
ency (13) determines the variance of deviation. Using dependency (11), we can write down the reliability in the aspect of
signalling damage for i- diagnostic parameter in the following form:
( ) ( ) ii
z
i zdtzutR
di
,∫∞−
≅ . (14)
Taking into consideration all diagnostic parameters and the above assump-
tions, we can write down formula determining the reliability in respect of signal-ling damage. The formula has the following form:
( ) ( )tRtR i
n
i∏
=
=1
2 . (15)
In order to determine the reliability defined by dependency (1), we must de-
termine the dependency for the second component of an aircraft reliability R1(t) in respect of a catastrophic damage.
Catastrophic (sudden) damages result from an incomplete control and rec-ognition of a technical condition of an aircraft.
The monitoring of aircraft operation indicates that this group of damages results from sudden changes of measurable and immeasurable parameters, which is caused by the impossibility to monitor the changes of parameter values. Moreover, the crossing of existing restrictions also increases the level of dam-age risk.
In a probabilistic description of generation of catastrophic damages, dam-age intensity is the main source of this type of damages. Damage intensity is determined by the following dependency:
( ) ( )t
tTttTtPt
t ∆>∆+<<
=+→∆ 0
limχ , (16)
where: T – random variable of time to catastrophic damage formation;
t – operation time of an aircraft; P( ) – conditional probability of an event.
Comments on the improvement of the military aircraft operation by limiting...
33
( ) { }{ }TtPt
ttTtPt
t <∆∆+≤<=
+→∆ 0limχ
( ))(
)(2
'1
tR
tRt
−=χ
Transforming dependency (16), we can obtain the following differential
equation:
( ) ( ) ( ) 02'1 =+ tRttR χ . (17)
Equation (17) for an initial condition 1)0(1 ==tR has the following solu-
tion:
( )( )∫
=−
tdtt
etR 01
χ
. (18)
If: ( ) constt == χχ , then
( ) tetRχ−=1 . (19)
To use dependency (19), we must assess parameter χ. From the monitoring
of operation of aircraft, we can obtain the times of damage formation tk, where k = 1, 2, ..., ω.
Time tk is the time of formation of the first damage in k- an aircraft. The time is calculated from the beginning of operation. To assess parameter χ, we will use the method of moments. We will compare an expected value of opera-tion time (determined from a theoretical dependency) with an average value (determined from observations).
Theoretical average time up to catastrophic damage formation is
[ ] ( )χ
χ 1
0
1
0
=== −∞∞
∫∫ dtedttRTE t .
An average value of operation time of an aircraft (up to catastrophic dam-
age formation) is
[ ]ω
ω
∑== 1k
ktTE
).
H. Tomaszek, M. Jasztal 34
Hence,
ωχ
ω
∑== 1
*
1 kkt
,
∑=
= ωωχ
1
*
kkt
. (20)
If we know the probability of sudden damage formation during one flight,
we can assess damage intensity using the following dependency:
t
Q
∆=*χ .
Dependency for the assessment of reliability R1(t) has the following form:
tetR *1 )( χ−= . (21)
Taking into consideration dependency (15) and (21), we obtain formula de-
termining the reliability of an aircraft. The formula has the following form:
)()(
1
ti
RtRn
i
te ∏==
− χ . (22)
3. Comments on the way of forming the reliability
The above-presented outline of the method for determining the dependency for aircraft reliability is conditioned by assumptions that formalise reality. The above-presented method can be modified by accepting particular assumptions. The more real assumptions, the more precise predicted reliability of an aircraft.
The above-presented method concerns events in which the results of de-structive processes are accumulated and correlated with the operation time of an aircraft. The process is disrupted by the possibility of the formation of sudden damages which are caused by, for example, overload pulses, crash landings, etc.
After some development, the method can enable the assessment of fatigue life in respect of particular diagnostic parameters. The obtained data can be used to improve technical servicing. The course of diagnostic controls that are ade-

Comments on the improvement of the military aircraft operation by limiting...
35
quately determined and distributed in operation time prevents the results of sig-nalling damages.
Thus, it can be assumed that
1),()( 11
2 ≈= ∫∏∞−=
ii
zn
i
dztzutRd
. (23)
Thus, the reliability of an aircraft, taking into consideration technical ser-
vicing, can be assessed by the following dependency:
tetR*
)( χ−= . (24)
It seems that the above-presented outline of the method for predicting the reliability of an aircraft can be used as an auxiliary material for considering specific problems concerning the assessment of the reliability and fatigue life of elements, units, and devices.
All methods that were presented in the study are used to assess the reliabil-ity and fatigue life of construction elements in the aspect of fatigue.
The above-presented models can be adapted for specified cases of deter-mining the probability of catastrophic damage taking into consideration phe-nomena physics and conditions of operation.
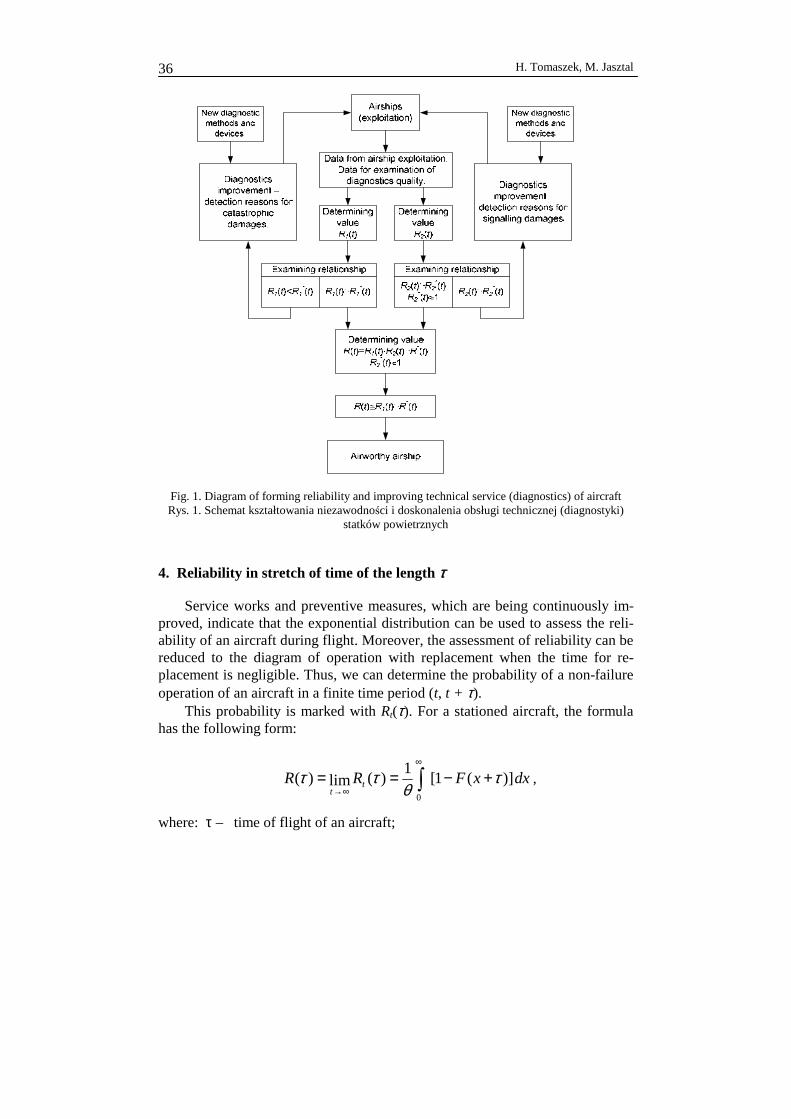
This conventional division of damages will help determine the reliability of an aircraft and present an algorithm of the reliability of an aircraft in the process of operation (Fig. 1).
The algorithm enables among other things: • The analysis of the physics of damage formation in the form of increasing
deviations of diagnostic parameters. • The assessment of risk concerning the crossing of admissible values on the
basis of the assessment of the growth in deviations. • The assessment of reliability for particular diagnostic parameters and the
determination of the range of technical interventions. • The investigation of relationship concerning reliability requirements. • The development of adjustment in respect of aircraft diagnostics in the case
of negative results connected with the assessment of reliability (not meeting requirements).
• The introduction of additional diagnostic procedures into the process of op-eration in order to obtain required values of reliability by the following: – Reducing the results of signalling damages and increasing their delecta-
bility in order to prevent their transformation into catastrophic damages; – Reducing the number of catastrophic damages and the risk of their for-
mation.
H. Tomaszek, M. Jasztal 36
Fig. 1. Diagram of forming reliability and improving technical service (diagnostics) of aircraft Rys. 1. Schemat kształtowania niezawodności i doskonalenia obsługi technicznej (diagnostyki)
statków powietrznych
4. Reliability in stretch of time of the length τ
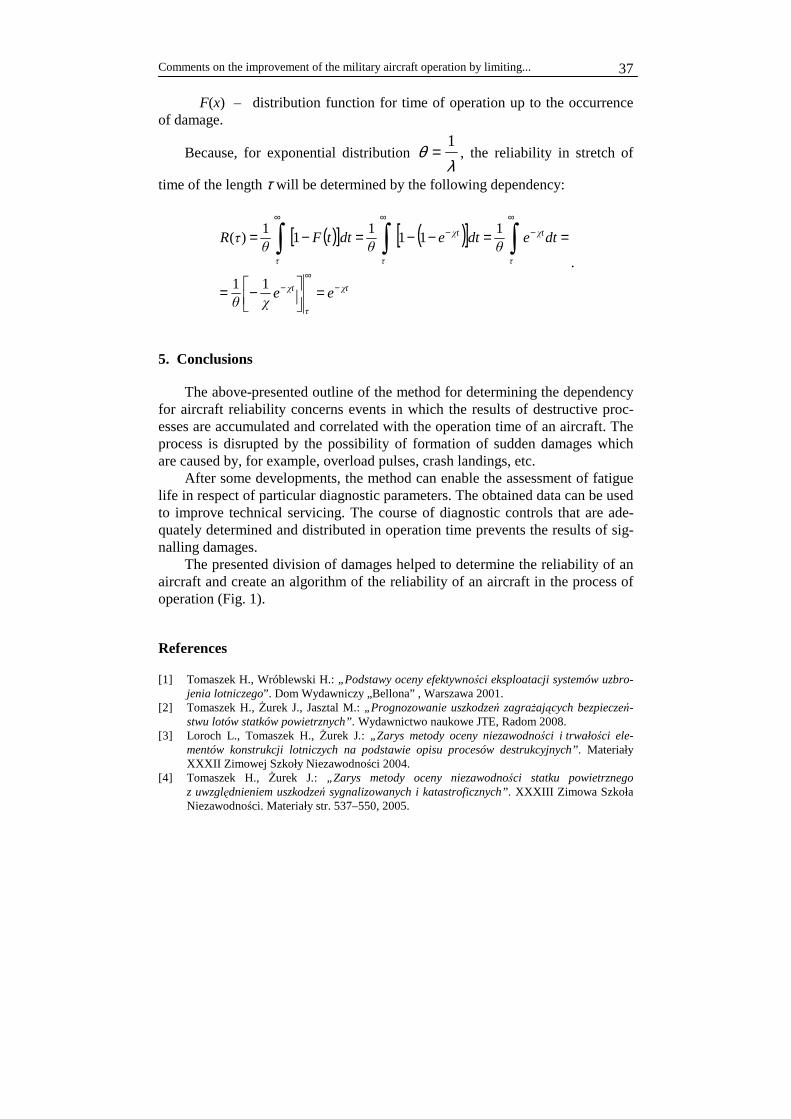
Service works and preventive measures, which are being continuously im-proved, indicate that the exponential distribution can be used to assess the reli-ability of an aircraft during flight. Moreover, the assessment of reliability can be reduced to the diagram of operation with replacement when the time for re-placement is negligible. Thus, we can determine the probability of a non-failure operation of an aircraft in a finite time period (t, t + τ).
This probability is marked with Rt(τ). For a stationed aircraft, the formula has the following form:
dxxFRR tt
)](1[1
)(lim)(0
τθ
ττ +−== ∫∞
∞→,
where: τ – time of flight of an aircraft;
Comments on the improvement of the military aircraft operation by limiting...
37
F(x) – distribution function for time of operation up to the occurrence of damage.
Because, for exponential distribution λ
θ1
= , the reliability in stretch of
time of the length τ will be determined by the following dependency:
( )[ ] ( )[ ]
tt
tt
ee
dtedtedttFR
χ
τ
χ
χ
τ
χ
ττ
χθ
θθθτ
−∞
−
−
∞
−
∞∞
=
−=
==−−=−= ∫∫∫11
111
11
1)(
.
5. Conclusions
The above-presented outline of the method for determining the dependency for aircraft reliability concerns events in which the results of destructive proc-esses are accumulated and correlated with the operation time of an aircraft. The process is disrupted by the possibility of formation of sudden damages which are caused by, for example, overload pulses, crash landings, etc.
After some developments, the method can enable the assessment of fatigue life in respect of particular diagnostic parameters. The obtained data can be used to improve technical servicing. The course of diagnostic controls that are ade-quately determined and distributed in operation time prevents the results of sig-nalling damages.
The presented division of damages helped to determine the reliability of an aircraft and create an algorithm of the reliability of an aircraft in the process of operation (Fig. 1).
References
[1] Tomaszek H., Wróblewski H.: „Podstawy oceny efektywności eksploatacji systemów uzbro-jenia lotniczego”. Dom Wydawniczy „Bellona” , Warszawa 2001.
[2] Tomaszek H., Żurek J., Jasztal M.: „Prognozowanie uszkodzeń zagrażających bezpieczeń-stwu lotów statków powietrznych”. Wydawnictwo naukowe JTE, Radom 2008.
[3] Loroch L., Tomaszek H., Żurek J.: „Zarys metody oceny niezawodności i trwałości ele-mentów konstrukcji lotniczych na podstawie opisu procesów destrukcyjnych”. Materiały XXXII Zimowej Szkoły Niezawodności 2004.
[4] Tomaszek H., Żurek J.: „Zarys metody oceny niezawodności statku powietrznego z uwzględnieniem uszkodzeń sygnalizowanych i katastroficznych”. XXXIII Zimowa Szkoła Niezawodności. Materiały str. 537–550, 2005.

H. Tomaszek, M. Jasztal 38
[5] Żurek J.: „Wykorzystanie wyników diagnozowania do oceny i sterowania eksploatacją techniki lotniczej”. Materiały konferencyjne „DIAG-2003”.
[6] Tomaszek H., Klimaszewski S.: „Zarys metody oceny resztkowej trwałości wybranych ele-mentów statku powietrznego”. X Jubileuszowy Kongres Eksploatacji Urządzeń Technic-znych. Materiały str. 209–218.
[7] Gerebach J.B., Kordoński Ch.B.: „Modele niezawodności obiektów technicznych”. WNT, Warszawa.
[8] Stępień S., Tomaszek H.: „Zarys probabilistycznego opisu rozwoju pęknięcia zmęczen-iowego oraz określanie ryzyka katastroficznego zniszczenia elementu podczas eksploatacji”. ZEM, Zeszyt 1 (133), 2003r., s. 23–31.
[9] Piasecki S.: „Elementy teorii niezawodności i eksploatacji obiektów o elementach wielosta-nowych”, Wydawnictwo Instytutu Badań Systemów PAN, Warszawa 1995. This scientific work was financed by the Ministry of Science and Higher
Education in the years 2006-2008 as a research project.
Manuscript received by Editorial Board, November 25th, 2008.
Uwagi na temat doskonalenia eksploatacji wojskowych statków powietrznych przez ograniczenie możliwości powstawania uszkodzeń
S t r e s z c z e n i e
Bezpieczeństwo statku powietrznego jest jedną z najważniejszych charakterystyk ek-sploatacji mających bezpośredni wpływ na wskaźniki ekonomiczne. Z kolei duży wpływ na bez-pieczeństwo ma niezawodność statku powietrznego. Troska o tę niezawodność jest jednocześnie troską o bezpieczeństwo. Ostateczna postać zależności opisujących niezawodność statku uzależniona jest w dużej mierze od odpowiednio opracowanej obsługi technicznej nakierowanej na profilaktykę. Natomiast profilaktyka obejmuje opracowanie takich przedsięwzięć technicznych, które usuwają przesłanki do powstania uszkodzeń.
W artykule podjęto próbę opisu niezawodności statku z odpowiednio opracowaną profilak-tyką, która umożliwia ocenę niezawodności statku z wykorzystaniem rozkładu wykładniczego.
Comments on the improvement of the military aircraft operation by limiting...
39
SCIENTIFIC PROBLEMS OF MACHINES OPERATION AND MAINTENANCE
4 (156) 2008
HENRYK TOMASZEK*, JÓZEF ŻUREK*, SŁAWOMIR STĘPIEŃ **
The airship maintenance with its renovation and the risk of its loss
K e y w o r d s
Reliability, renovation, readiness coefficient, risk.
S ł o w a k l u c z o w e
Niezawodność, odnowa, współczynnik gotowości, ryzyko.
S u m m a r y
This article presents a way of describing reliability coefficients in the case of a 3-state model of airship maintenance with its renovation. The third state, which is full fitness loss (when it is impossible to conduct renovation), was added to the 2-state model of the airship maintenance including operational and non-operational state.
Models with the exponential distribution were considered. A stationary readiness coefficient is obtained from the exponential distribution during renovation.
The formula describing the aircraft reliability for the time interval of length (t, t + τ) has the following form:
λττ −= eKR g)( ,
where: Kg – readiness coefficient.
In the case of 3-state model of the airship maintenance, the readiness coefficient is not station-ary but depends on time t.
* Instytut Techniczny Wojsk Lotniczych, ul. Księcia Bolesława 6, 01-494 Warszawa, skr. poczt. 96,
tel. (0-22) 6851956; faks (0-22) 836 44 71. ** Wojskowa Akademia Techniczna, Wydział Mechatroniki, ul. Kaliskiego 2, 00-908 Warszawa 49,
tel. (0-22) 683 73 74, faks (0-22) 685 75 81.
RELIABILITY •
H. Tomaszek, J. Żurek, S. Stępień 40
1. Introduction
During the airship maintenance process with renovation, there are two states: the operational state and the non-operational state. There are also two cases: when the time of renovation is negligible and when the time of renovation cannot be ignored.
As far as the airship maintenance process with renovation is concerned, the concept of the airship reliability for a particular time interval is introduced. This property describes the probability of a trouble-free operation of an airship in a finite time period (t, t + τ). This probability is marked with Rt(τ).
When the time of renovation is negligible, this probability is determined in the following way:
dxxhxtFtFRt
t )()](1[)(1)(0
−+−++−= ∫ τττ , (1)
where: F(t) – distribution function for working time between faults; h(x) – density function of renovation.
For a stationary case, dependency (1) has the following form:
dxxFRR tt
)](1[1
)(lim)(0
τθ
ττ +−== ∫∞
∞→. (2)
Hence,
dttFR )](1[1
)( −= ∫∞
τθτ , (3)
where: θ – expected value of working time.
When the time of renovation cannot be ignored, dependency (3) has the fol-
lowing form:
dttFKgR )](1[1
)( −= ∫∞
τθτ , (4)
where: Kg – readiness coefficient of an airship for flight.
Formula (4) indicates that the probability of a trouble-free operation of an airship in a time period of length τ equals the product of the probability of an event that, before work starts, an airship will be in an operational state and the
The airship maintenance with its renovation and the risk of its loss
41
probability of a trouble-free operation of an airship (device) in a time period of length τ for the process with an immediate renovation.
In the case of the exponential distribution, the readiness coefficient is de-termined according to the dependencies presented below:
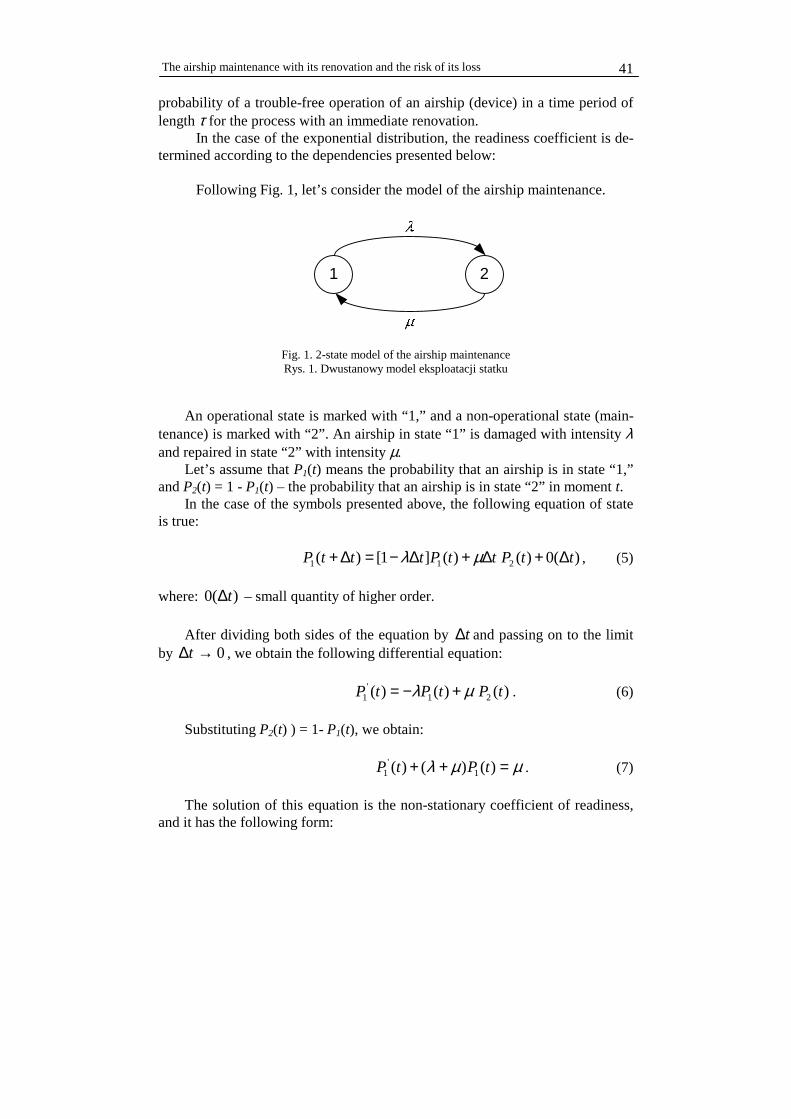
Following Fig. 1, let’s consider the model of the airship maintenance.
1 2
Fig. 1. 2-state model of the airship maintenance Rys. 1. Dwustanowy model eksploatacji statku
An operational state is marked with “1,” and a non-operational state (main-
tenance) is marked with “2”. An airship in state “1” is damaged with intensity λ and repaired in state “2” with intensity µ.
Let’s assume that P1(t) means the probability that an airship is in state “1,” and P2(t) = 1 - P1(t) – the probability that an airship is in state “2” in moment t.
In the case of the symbols presented above, the following equation of state is true:
)(0)()(]1[)( 211 ttPttPtttP ∆+∆+∆−=∆+ µλ , (5)
where: )(0 t∆ – small quantity of higher order.
After dividing both sides of the equation by t∆ and passing on to the limit
by 0→∆t , we obtain the following differential equation:
)()()( 21'
1 tPtPtP µλ +−= . (6)
Substituting P2(t) ) = 1- P1(t), we obtain:
µµλ =++ )()()( 1'
1 tPtP . (7)
The solution of this equation is the non-stationary coefficient of readiness, and it has the following form:

H. Tomaszek, J. Żurek, S. Stępień 42
λµλµ µλ
++==
+− tetPtKg
)(
1 )()( . (8)
Passing on to the limit by t →∞, we obtain the stationary value of the readi-
ness coefficient that has the following form:
µλµ+
==∞→
)(lim tKgKgt
. (9)
In the case of the exponential distribution, the probability of a trouble-free operation of an airship in the range (t, t + τ) with large t has the following form:
τλ
µλµτ −
+= eR )( . (10)
Dependency (10) indicates that the probability of a trouble-free operation of an airship equals the product of the probability that, in the initial moment, we will find an airship in an operational state and the probability of the airship operation during time period τ for a standard process with an immediate renovation.
This thesis includes an attempt to determine the readiness coefficient when a complete repair is not possible in state “2” and there is possibility that an air-ship will be withdrawn from maintenance.
In this case, the model of the airship maintenance is presented in Fig. 2.
1 2 3
P1(t) P2(t) P3(t)
Fig. 2. 3-state model of the airship maintenance Rys. 2. Trzystanowy model eksploatacji statku
2. The airship maintenance with renovation and the risk of its withdrawal
The model of the airship maintenance includes 3 states of reliability, where: )(1 tP – probability of an operational state of an airship;
)(2 tP – probability of a non-operational state with possibility of repair (renovation);
)(3 tP – probability of a non-operational state resulting from the impossibility
of renovation (in state 2).
The airship maintenance with its renovation and the risk of its loss
43
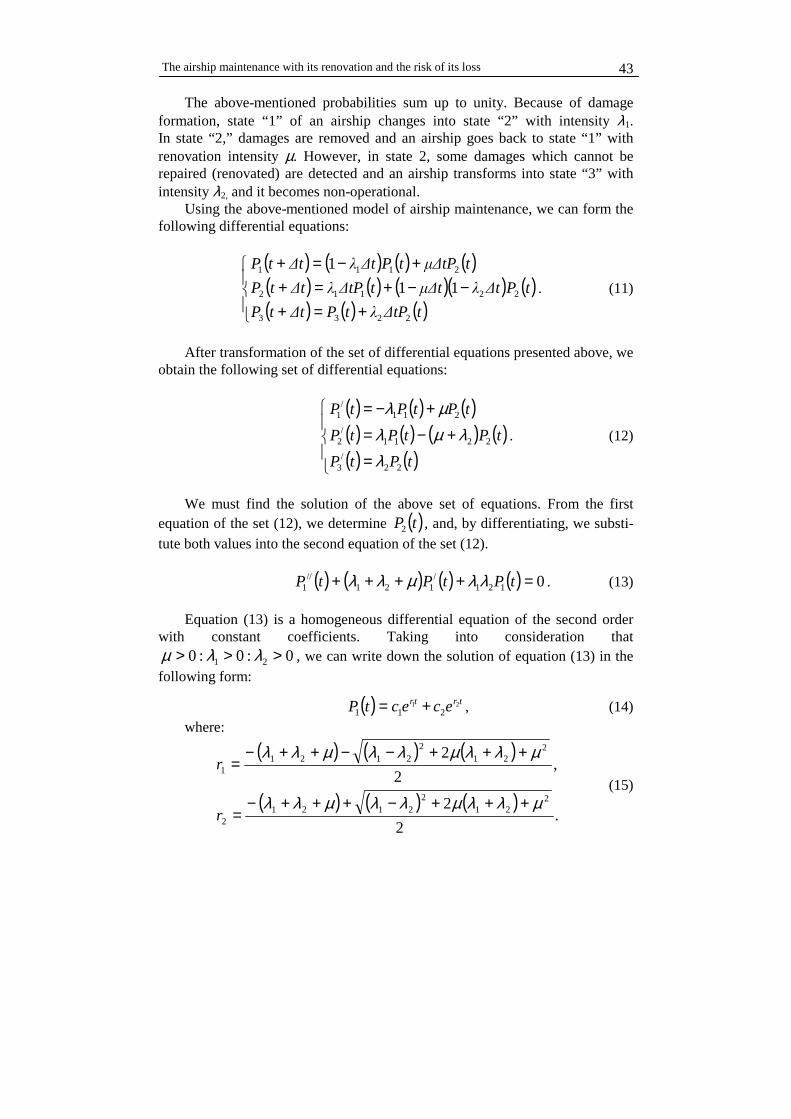
The above-mentioned probabilities sum up to unity. Because of damage formation, state “1” of an airship changes into state “2” with intensity λ1. In state “2,” damages are removed and an airship goes back to state “1” with renovation intensity µ. However, in state 2, some damages which cannot be repaired (renovated) are detected and an airship transforms into state “3” with intensity λ2, and it becomes non-operational.
Using the above-mentioned model of airship maintenance, we can form the following differential equations:
( ) ( ) ( ) ( )( ) ( ) ( )( ) ( )( ) ( ) ( )
+=+−−+=+
+−=+
t∆tPλtP∆ttP
tP∆tλµ∆tt∆tPλ∆ttP
tµ∆tPtP∆tλ∆ttP
2233
22112
2111
11
1
. (11)
After transformation of the set of differential equations presented above, we
obtain the following set of differential equations:
( ) ( ) ( )( ) ( ) ( ) ( )( ) ( )
=
+−=
+−=
tPtP
tPtPtP
tPtPtP
22/
3
2211/
2
211/
1
λλµλ
µλ. (12)
We must find the solution of the above set of equations. From the first
equation of the set (12), we determine ( )tP2 , and, by differentiating, we substi-tute both values into the second equation of the set (12).
( ) ( ) ( ) ( ) 0121/
121//
1 =++++ tPtPtP λλµλλ . (13) Equation (13) is a homogeneous differential equation of the second order
with constant coefficients. Taking into consideration that 0:0:0 21 >>> λλµ , we can write down the solution of equation (13) in the
following form:
( ) trtr ecectP 21211 += , (14)
where:
( ) ( ) ( )
( ) ( ) ( ).
2
2
,2
2
221
22121
2
221
22121
1
µλλµλλµλλ
µλλµλλµλλ
+++−+++−=
+++−−++−=
r
r (15)

H. Tomaszek, J. Żurek, S. Stępień 44
Solution (14) fulfils equation (13) for any constant values c1 and c2. Determining the next probabilities.
( ) ( ) ( )µλ tPtP
tP 11/
12
+= . (16)
After substitution
( ) trtr er
cer
ctP 21 122
1112 µ
λµ
λ +++= . (17)
We still must determine probability ( )tP3
( ) ( )tPtP 22/
3 λ= . (18)
Hence, after integration we obtain:
( ) 32
122
1
11123
21 cer
rce
r
rctP trtr +
+++=µ
λµ
λλ . (19)
In order to determine any constant values, let’s use initial conditions:
( ) ( ) ( ) 00:00:10 321 === PPP , after transformations we obtain:
( )( )111221
23
21
112
21
121 :: λλ
µλλλ ++−=
−+=
−+−= rr
rrc
rr
rc
rr
rc . (20)
As a result of the above calculations we obtain:
( )
( ) ( )( )( ) [ ]
( ) ( )( )( ) ( )( )
++−
−
−++=
−−
++=
−+−
−+=
111221
2
1221
121123
21
12112
21
12
21
111
12
12
12
11 λλµλ
µλλλ
µλλ
λλ
rrrr
er
errr
rrtP
eerr
rrtP
err
re
rr
rtP
trtr
trtr
trtr
. (21)
The airship maintenance with its renovation and the risk of its loss
45
where:
( ) ( ) ( )
( ) ( ) ( ).
2
2
,2
2
221
22121
2
221
22121
1
µλλµλλµλλ
µλλµλλµλλ
+++−+++−=
+++−−++−=
r
r
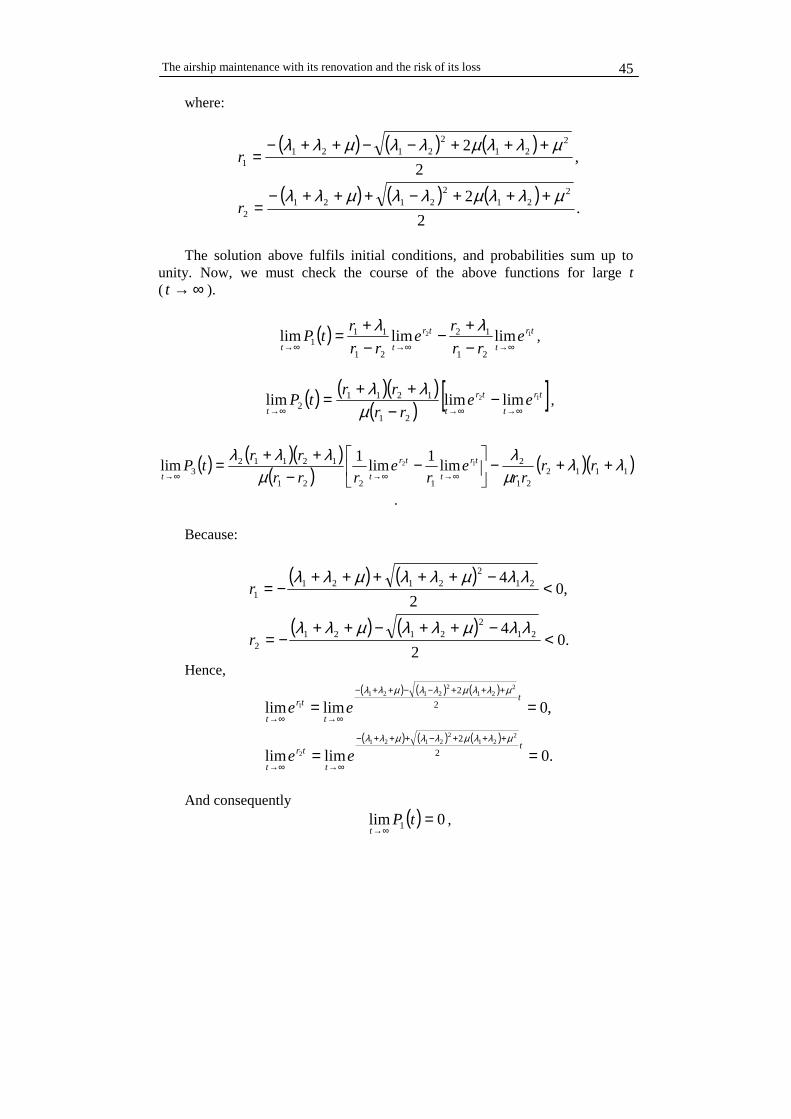
The solution above fulfils initial conditions, and probabilities sum up to
unity. Now, we must check the course of the above functions for large t ( ∞→t ).
( ) tr
t
tr
tte
rr
re
rr
rtP 12 limlimlim
21
12
21
111 ∞→∞→∞→ −
+−−+= λλ
,
( ) ( )( )( ) [ ]tr
t
tr
ttee
rr
rrtP 12 limlimlim
21
12112 ∞→∞→∞→
−−
++=
µλλ
,
( ) ( )( )( ) ( )( )1112
21
2
1221
121123
12 lim1
lim1
lim λλµλ
µλλλ
++−
−
−++
=∞→∞→∞→
rrrr
er
errr
rrtP tr
t
tr
tt
. Because:
( ) ( )
( ) ( ).0
2
4
,02
4
212
21212
212
21211
<−++−++
−=
<−+++++
−=
λλµλλµλλ
λλµλλµλλ
r
r
Hence, ( ) ( ) ( )
( ) ( ) ( ).0limlim
,0limlim
2
2
2
2
221
22121
2
221
22121
1
==
==
+++−+++−
∞→∞→
+++−−++−
∞→∞→
t
t
tr
t
t
t
tr
t
ee
ee
µλλµλλµλλ
µλλµλλµλλ
And consequently
( ) 0lim 1 =∞→
tPt
,

H. Tomaszek, J. Żurek, S. Stępień 46
( ) 0lim 2 =∞→
tPt
,
( ) ( )( ) 1lim 111221
23 =++−=
∞→λλ
µλ
rrrr
tPt
.
Eventually, we obtain:
( )
( ) ( )( )( ) [ ]
( ) ( )( )( )
+
−
−++=
−−
++=
−+−
−+=
11221
121123
21
12112
21
12
21
111
12
12
12
r
e
r
e
rr
rrtP
eerr
rrtP
err
re
rr
rtP
trtr
trtr
trtr
µλλλ
µλλ
λλ
, (22)
where:
( ) ( ) ( )
( ) ( ) ( ).
2
2
,2
2
221
22121
2
221
22121
1
µλλµλλµλλ
µλλµλλµλλ
+++−+++−=
+++−−++−=
r
r
Probability ( )tP1 is a decreasing function of time and adopts values from 1 to
0. On the other hand, probability ( )tP3 is an increasing function of time and
adopts values from 0 to 1. Probability ( )tP2 has one extreme (maximum) in point:
2
1
12
ln1
r
r
rrtt extr −
== , (23)
of value:
( ) ( ) ( )( )
( ) 212
21
21
4
21
212
2121
2
12
2
4 λλµλλ
µλλ
λλλλµλλµλλ
λλ −++
++
−++−++=extrtP . (24)

The airship maintenance with its renovation and the risk of its loss
47
Figure 3 presents changes of probabilities in time. The diagram aims at pre-senting the character of these changes, and it was prepared on the basis of hypo-thetical data: 01,0:008,0:009,0 21 === µλλ , which is the unit of intensity is the reciprocal of the unit of time.
0
0,1
0,2
0,3
0,4
0,5
0,6
0,7
0,8
0,9
1
0 50 100 150 200 250 300 350 400
P(t)
t
P1(t)
P2(t)
P3(t)
Fig. 3. Illustration of changes of probabilities Rys. 3. Ilustracja zmian wyznaczonych prawdopodobieństw
3. Reliability in time period of length τ after taking into consideration the obtained results
In this case, readiness coefficient will be:
( ) ( ) trtrg e
rr
re
rr
rtPtK 12
21
12
21
111 −
+−−+== λλ
, (25)
where: 01 ≤r i 02 ≤r .
Taking into consideration that we deal with the exponential distribution, re-liability in time period of length τ will be:
( ) ( ) ( )[ ]∫∞
−⋅=τ
gt dttFθ
tKτR 11
. (26)
Hence:
( ) ( ) λτ−= etPτRt 1 . (27)

H. Tomaszek, J. Żurek, S. Stępień 48
The first segment of formula (27) determines the probability that we will find an airship in an operational state in moment t, and the second segment de-termines reliability in flight when it is assumed that, in moment t, an airship was in an operational state.
4. Conclusions
The presented method for determining the dependency for aircraft reliabil-ity concerns the three-state model of operation with renewal. After the evalua-tion of the necessary coefficients, for example, appropriate intensities, one can evaluate the probability of aircraft operation in one of the three states. The method can enable the assessment of the availability factor and predicted reli-ability of aircraft during a finite time range (e.g. during flight). The obtained results can be used for the planning of operation, for the prediction of the num-ber of aircraft in repair condition, and for time prediction when the maximum number of aircraft are repaired.
References
[1] Gniedenko B.W., Bielajew J.K., Sołowiew A.D.: „Metody matematyczne w teorii niezawod-ności” . WNT, Warszawa 1968.
[2] Tomaszek H.; Wróblewski H.: „Podstawy oceny efektywności eksploatacji systemów uzbro-jenia lotniczego”. Dom Wydawniczy -Bellona, Warszawa 2001.
[3] Jaźwiński J., Ważyńska-Fiok K.: „Bezpieczeństwo systemów”, PWN, Warszawa 1993. [4] Lewitowicz J.: „Podstawy eksploatacji statków powietrznych. Statek powietrzny i elementy
teorii”. Wydawnictwo ITWL, Warszawa 2001. [5] Borgoń J., Jaźwiński J., Sikorski M., Ważyńska-Fiok K.: „Niezawodność statków
powietrznych”. ITWL, Warszawa 1992. [6] Richard E. Barlow, Frank Proschan: „Mathematical Theory of Reliability”. Society for
Industrial and Applied Mathematics, New Yorsk 1996. [7] Jaźwiński J., Klimaszewski S., Szpytko J.: „Optimum Controlling of the Systems Reliability
and Readiness”. NASA Office of Design, 10, Waszyngton 2003.
This scientific work was financed by the Ministry of Science and Higher
Education in the years 2006-2008 as a research project.
Manuscript received by Editorial Board, November 25th, 2008.

The airship maintenance with its renovation and the risk of its loss
49
Eksploatacja statku powietrznego z odnową i ryzykiem jego utraty
S t r e s z c z e n i e
W artykule przedstawiono sposób opisu wskaźników niezawodnościowych dla przypadku trójstanowego schematu eksploatacji statku powietrznego z odnową. Do dwustanowego schematu eksploatacji obejmującego stan zdatny i stan niezdatny z możliwością odnowy, dołączono trzeci stan, obejmujący pełną utratę zdatności, gdy odnowy nie można wykonać.
Rozważania przeprowadzono dla przypadku występowania w modelach rozkładu wykładni-czego. Dla rozkładu wykładniczego w warunkach odnowy otrzymuje się stacjonarny współczynnik gotowości.
Wzór na niezawodność statku powietrznego w odcinku czasu długości (t, t + τ) otrzymuje postać:
λττ −= eKR g)( ,
gdzie: Kg – współczynnik gotowości. W przypadku przyjętego trójstanowego schematu eksploatacji współczynnik gotowości nie
jest już stacjonowany, a zależny od czasu t.

H. Tomaszek, J. Żurek, S. Stępień 50
SCIENTIFIC PROBLEMS OF MACHINES OPERATION AND MAINTENANCE
4 (156) 2008
BOLESŁAW KARWAT*
Analysis of materials' flow in a steel mill in order to determine exploitation parameters of technological line's devices
K e y w o r d s
Optimisation the operation, scheduling process.
S ł o w a k l u c z o w e
Optymalizacja eksploatacji, harmonogramowanie produkcji.
S u m m a r y
A raw steel mill is a continuous running complex production process in relation to used tech-nologies. The above relates mainly to hot departments, such as furnaces or steel melting shops. Devices which operate in these departments are subjects to strict technological regimes. Any de-viations from optimal operational parameters may cause non-reversible damages which shorten their operation time. The above relates mainly to furnaces, which can operate for several years, or a few, when their productivity is often limited. That is why, planning and scheduling the produc-tion process in a raw steel mill is an important issue for optimal devices operation and it is a diffi-cult task as well due to production specific character.
This kind of running the production process forces deliveries to be on time and of the proper amount and set parameters components to devices of a production line.
Continuously running aggregates of steel founding are the superior devices in a production process and to which crude iron of set parameters, especially of set temperature and scheduled time, must be provided. To optimize the scheduling process, maximization of the quantity of casted items in a continu-ous sequence of production of steel casts from furnaces, must be considered as a criterion.
1. Technological system and production flow in a steel mill identification
The aim of the article is to identify a technological system and a production flow in a steel mill and to form basic principles of scheduling the production of
* AGH University of Science and Technology, Al. Mickiewicza 30, 30-059 Kraków.
TEROTECHNOLOGY •

B. Karwat 52
such technological processes as [1, …, 16], to maximize the production process simultaneously with an optimal devices usage. The exemplary steel mill will be a subject of research conducting, its main objects and production flow scheme is presented in the Figure 1.
In the Figure 1 seven main subsystems of technological process in the steel mill are presented: a) SP sintering plant – which produces iron – bearing sinter, which is a main
component of crude iron in furnaces, where: ‘ak’=1,…,k; k-number of sinter-ing lines;
b) BF furnaces – which produce crude iron for further processing in oxygen converters, with a possibility to found cast iron – its main components: sinter, coke, flux and hot air which initiate the reduction process, where: ‘bl’=1,…,l; l-number of furnaces;
c) HMDP desulfurization stations – enabling removing the sulfur excess from crude iron before processing in air converters, where: ‘cm’=1,…,m; m=desulfurization devices;
d) BOF oxygen converters – producing crude iron which is off-furnace proc-essed – the basic components of the process are: furnaces’ crude iron, steel scrap, ferroalloys, calcareous stone, where: ‘dn’=1,…,n; n=number of oxygen converters;
e) off-furnace stations, where crude iron enriching processes are conducted, in modern steel mills: AR-stations of crude steel argon-processing, LHF – ladleman off-furnaces processing, RH – steel vacuum circulation degassing, where: ‘eo’=1,…,o; o = off-furnaces steel processing devices;
f) CCM continuous steel founding aggregates, where crude steel is processed on continuous steel ignots – in modern steel mills 100% of crude steel is processed in this manner into blooms, billets, or slabs, where ‘fp’=1,…,p; p – number of continuous steel founding;
g) RM rolling , where ignots are processed into final (marketing) rolled prod-ucts, where ‘gr’=1,…,r; r- number of hot-rolling technological lines. Production scheduling is inferior to logistic view on the production system.
In the figure 1 main logistic systems for researched object were presented: 1 supply logistics; 2 complete steel mill production logistics; 3 continuous hot processes production logistics; 4 market products distribution logistics; 5 waste material distribution logistics;
Market products distribution 4 is a superior issue of the logistics system. The logistics system information forces production planning (scheduling) and covers: 1 supply logistics and 2 complete steel mill production logistics.
In the Figure 1, the field of waste material distribution logistics was pre-sented 5. This system is complex because of masses of waste material produced
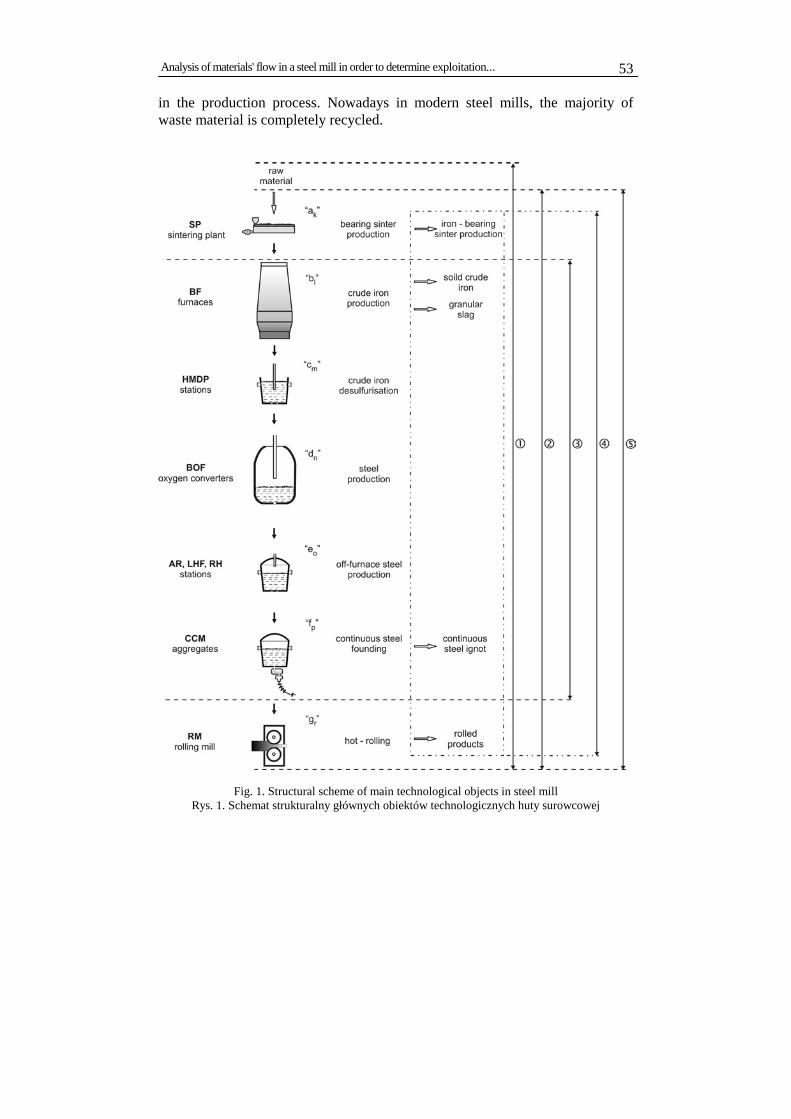
Analysis of materials' flow in a steel mill in order to determine exploitation...
53
in the production process. Nowadays in modern steel mills, the majority of waste material is completely recycled.
Fig. 1. Structural scheme of main technological objects in steel mill Rys. 1. Schemat strukturalny głównych obiektów technologicznych huty surowcowej
B. Karwat 54
The constructed model ought to cover all departments of a steel mill, start-ing from feedstock preparation to final products of rolling mill house, especially the following complex scheduling issues should be taken into consideration: hot processes production logistics 3 .
In the Figure 1, the hot processes production logistic system covers fur-naces, crude iron desulfurization, oxygen converters, off-furnaces processing and continuous steel founding aggregates. This system also covers departments of hot works, if the production optimization criterion will be delivered in a set time of continuous ingots with a set cross-section and temperature. This field of production scheduling may contribute to optimum usage of technological line devices, and lower the production costs in the same time.
2. Literature review
Many authors have tried to solve the production scheduling problem in steel industry taking advantage of various techniques of modelling these matters and various methods of solving them. Most of the world literature elaborates con-cern issues of production scheduling in plate mill departments.
Issues of production scheduling in plants in which manufactured products can be stored during the process operation are incommensurably easier than in case of a steel production plant in which the process has to be operated in a con-tinuous manner. All production planning aid methods used in steel industry can be divided into two categories: methods based on mathematical programming and methods based on expert systems.
The literature analysis presented below comprises 30 selected items of world publications dealing with steel industry's production planning and sched-uling. The analysis starts with elaborates published in 1974 and ends with elabo-rates published in 2007. All elaborates were presented chronologically as per their publishing dates.
One of the first elaborates on production planning and scheduling in steel plants was C.N. Redwine and D.A. Wismer [1] thesis dealing with arranging steel production's schedules in an "off-line" mode, not in a real-time, but with the use of a mathematical programming. The dynamic programming was used to solve the problem.
J.R. Wright and M.H. Hook [2] developed a heuristic procedure, which en-abled generating schedules of hot rolled plates production. They defined an objective function, which represents an economic efficiency dependent on three contradictory conditions, such as: production's quality, production's speed, on-time supplies of finished products. The developed heuristic algorithm modifies given input solution through the "product" shift from the initial position to the other, more beneficial from a penalty function viewpoint. The penalty function consists of several selected parameters of the finished product. The algorithm
Analysis of materials' flow in a steel mill in order to determine exploitation...
55
utilizes a trial-and-error method, up to the moment when further improvement is possible no more. The limitation of possibility of further improvement is given by the user. The method of schedule improvement finishes usually by achieving a local minimum.
B. Lally and others [3] applied a linear programming method, partially with the use of an integer programming to solve a problem of steel production sched-uling and its processing to solid ingots in installations of continuous teeming. The authors developed a very simple steel plant's model, in which electric arc-furnaces and installations of continuous teeming are in operation. Complex processes of extra-furnace steel treatment, which are essential in enabling pro-duction of high quality solid ingots, were neglected in the model.
M. Numao, S. Morishita in their elaborates [4, 5, 7, 9] developed an expert system to plastic working scheduling in hot-rolling mills with the use of a graphical user interface which enabled modification of the previously created schedule. The main substantiation of such scheduling system was the limitation of feedstock latency time for the following technological operations, and there-fore reduction of energy consumption in the whole rolling process.
H.P. Epp and others [6] in their elaborates presented a system of interactive production of scheduling for the installations of continuous teeming operating in Inland Steel Corporation, utilizing methods of artificial intelligence to solve the problem.
Y. Yimichi and others developed an expert system to determine parameters and conditions of slab bloom supplies obtained in the process of continuous teeming, in order to optimise the accomplishment of orders collected from re-cipients during hot-rolling process of these blooms.
C. M. Petersen and others [10] developed a mathematical programming model to solve the problem of hot-rolling plant production planning consisting of creating schedules for optimisation of solid ingots' passing through heating up furnaces and rolling mill's stands.
In their elaborate [11], K. Sthol, W. Spopek presented a model of hybrid cooperative production scheduling in the process of continuous steel teeming in Stahl Linz GmbH steel plant. However, they did not present a mathematical model for optimization of analysed processes.
J. Neuwirth [12] developed a model basing on linear programming, which eliminated the so- called machine conflicts arising during the treatment of the suc-cessive melts from steelmaking furnaces and the process of their teeming in installa-tions of continuous steel teeming. The basic factors which enable creating schedules in the analyzed technological line were also formulated in the elaborate.
In their elaborate [13], X. Tong and others presented a complex model based on a linear programming method, partially integer, for solving the prob-lem of solid ingots' production scheduling in installations of continuous steel teeming. The solution of this problem was possible through the use of heuristic techniques.

B. Karwat 56
In his elaborate [14], P. Cowling describes the issue of generating a produc-tion plans for a hot-roll plate mill. A matter was described as a problem of searching for "a route with a reward". To solve this task, the author proposed a heuristic method, which was based on searching for local solutions and looking for "Tabu Search". The local search method is used to find an input sequence, and the "tabu" search technique aims at improving this sequence. The author analyzes obtained results in various aspects and in all cases the results obtained with the use of applied heuristics are better than traditional methods used so far in solving this type of problems.
In their elaborate [15], K. Hamada and others presented an algorithm for solving complex problems of steel production planning and subsequently merged an expert system with genetic algorithm, and created effective schedules in this way.
In their elaborate [16], H. S. Lee and others described a production plan-ning procedure in a double-wire installation of continuous steel teeming. They utilized the IBM and ATM software to create schedules meeting global limita-tions based on a fast task ordering algorithm.
In their elaborate [17], L. Lopez and others used a heuristic method based on problem approach as a "tabu search" to solve the problem of production scheduling in a hot-rolling plate mill. The problem of rolling plate mill produc-tion scheduling is very difficult and comprises series of mutually contradictory objectives, which have to be achieved with taking into consideration series of restrictions. Finding an optimal solution for this problem is very difficult, there-fore authors were satisfied with finding suboptimal solutions.
In their elaborate [18], S. Li, Z. Chan describes the materials' flow through buffer stockyard of solid ingots produced in the process of continuous steel teeming and a hot-rolling plant. Basing on data from the analyzed steel plant, the authors created a mathematical model describing a decision making process of system input, system output and storage in the system. The created model appeared to be very effective and was used as a system simulating the produc-tion flow management in the existing steel plant.
In their article [19], P. Cowling, W. Rezig presented an integration model of a continuous steel teeming and hot-rolling system in order to maximize the production and lower unit production costs. Authors described the currently used methods of production planning and presented a model of production plan-ning and scheduling in the analyzed system with the use of mathematical pro-gramming and heuristic techniques. The described method, as it arises from performed simulations, is close to an optimal, and has been implemented in many steel plants.
The subject of an elaborate of L. Tang and others [20] was to study a prob-lem of production planning in processes of continuous steel teeming and pursuit of creating a computer-based planning system in order to generate optimal schedules. The objective of schedules is to determine task commencement and

Analysis of materials' flow in a steel mill in order to determine exploitation...
57
finishing times on the successive installations of a technological line. The ob-jective function in an optimization process is to deliver the product to the fol-lowing operations precisely on time, in accordance with the JIT rule. Penalties were also incorporated in the model: for losses caused by a heat stoppage, treatment latency time, too early operation accomplishment, delay in operation accomplishment. The developed non-linear mathematical model for solving the machine conflict problem was consecutively replaced by a linear programming model. Computer simulations with the use of standard computer software dem-onstrated a meaningful reduction of following operation latency times when using schedules created this way.
In their article [21], F. Pettersson and others presented the system for opti-mal planning of flat solid ingots production based on a double method of linear programming with the use of integer programming and heuristic algorithms. The created system formulates a way of task clustering and a sequence of flat blooms teeming in the installation of continuous steel teeming.
In their article [22], L. Tang and others presented a model of production scheduling in a hot-rolling plate plant. In the elaborate a strategy parallel to a production scheduling problem modelling was proposed as well as a solution of the matter through of the use of genetic algorithms. The adopted algorithms and the use of an interactive machine-human method caused a meaningful develop-ment of the proposed method in relation to the manual method used before in the analyzed steel plant.
Authors of the elaborate [23], L. Tang and others, tried to find a solution for increasing production efficiency and lowering energy consumption in a technological line containing installations of continuous flat blooms teeming, their heating up and hot-rolling. The developed algorithms of production plan-ning and scheduling enable such energy consumption limitation in the analyzed technological line.
Authors of the elaborate [24], V. Jha and others, made an attempt to create an intelligent production planning and scheduling algorithm for steel teeming processes in LD oxygen converters and flat blooms teeming in installations of continuous steel teeming. The G2 computer software was used for this purpose. The created algorithms aim at lowering production costs, increasing products' quality and delivering the product in a precisely defined time.
In their article [25], L. Tang and others introduced the proposal of solving the problem of scheduling the transport of slabs having strictly specified pa-rameters, which are produced in installations of continuous steel teeming, to hot-rolling plate plants. For this purpose an algorithm based on integer methods was formed, which consecutively was modified into a genetic algorithm. Codes used for the genetic algorithm aimed at minimizing the awaiting tasks solving time. Within a framework of performed studies, the authors implemented the constructed model in an existing plant achieving positive effects in the scope of assumed objective function.

B. Karwat 58
In their elaborate [26], Z. Gao, L. Tang present studies on forming an effec-tive optimization model, which uses methods of multiparameter pointwise sum weights approximations. The developed method was used to plan purchasing materials for production in a raw steel plant in order to determine their optimal quantity. The problem examined in the elaborate is substantial because of the mass character of raw materials necessary for production in the production plant such as steel plant.
In their article [27] SH. Park, YW. Sohn present a heuristic method of minimization of the successive technological operations latency time in steel production processes, continuous steel teeming and hot-rolling. Authors devel-oped the system aiming for a real-time production scheduling taking into con-sideration the necessity of changes in a technological process by effective use of a human-computer communication. Limitations arising from technological proc-esses in operation were taken into account in the used algorithms so as to maxi-mally reduce the latency time of the successive processing of a given cast.
In their elaborate, L. Tang, L. Huang [28] present studies on the seamless steel pipes production scheduling. The problem has been presented as a se-quence flow scheduling in order to minimize times between start and comple-tion of the hot-rolling process. The authors look for a suboptimal solution using a double-stage method of sectioning and limitation and heuristic algorithms. Study results confirmed, that with the use of such algorithms one can obtain a solution close to optimal.
The elaborate of M. Mathirajan and others [29] refers to a study problem of task scheduling with the use of parallel, non-identical initial processes for a dynamic task income, non-compatible task series and non-equal task quantities. Task scheduling in heat treatment processes has an essential meaning for the entire steel casting production times. In order to restrict the amount of per-formed calculations in classical mathematical models, several heuristic algo-rithms were developed, which enabled obtaining suboptimal solutions in the scope of utilization of furnaces in a heat treatment.
The elaborate of L. Tang, G. Liu [30] refers to scheduling of production or-ders in a steel plant in order to determine a particular technological operation start and finish times with efficiency limitations, with a purpose to minimize the sum of weighted times of all orders’ finishing. This problem was formed as a question of mixed integer programming. To solve the problem the methodology of solving the distribution composed of Lagrange relaxation, linear program-ming and heuristics was used.
In the analyzed world literature there are no elaborates concerning the pro-duction scheduling for the whole raw steel plants from the raw material supply through material preparation facilities, departments of pig iron production, de-partments of steel production and its extra-furnace treatment, installations of continuous steel teeming, up to final product rolling mills.

Analysis of materials' flow in a steel mill in order to determine exploitation...
59
3. Analysis of technological processes and material flow in main departments of the steel mill
In the Figures 2-6 five main departments of the steel mill is presented. In the Figure 2, sintering plant SP is shown, where preparation of iron-bearing sinter with set parameters, especially its granulation, is made. It also considers coke, which is used as a reducer in the furnace process. This parameter is a main factor of a proper work of furnaces. Sintering process is preceded by a compound preparation in the field of its homogenity of chemical composition, and then the composition is granulated. The last phase of the process is sinter-ing, which is conducted on three sintering lines of 312 [m2] surface and 1000– –1250 [kg/m3 x h] productivity. The sinter is cooled on the same line and in whirling cool stores after completing the process and transported to foundry - mixture store department. Parameters of all ingot components and a ready sinter, as well as devices work parameters in sintering store were given in the Figure 2.
Fig. 2. Scheme of technological processes and material flow in sintering plant (SP) Rys. 2. Schemat procesów technologicznych i przepływu materiałów w spiekalni rud (SP)
Figure 3 presents a scheme of furnaces department (BF), which consists of
three main objects, furnaces and the essential infrastructure to enable the crude iron production as a steel production intermediate product. The researched ob-ject consists of two furnaces, which are of 3200 [m3] volume and 2,4 [millions tones/year] productivity, and one thoroughly renovated in the renovation proc-ess of 3600 [m3] volume and 2,8 [millions tones/year] productivity. Sinter
B. Karwat 60
chemical composition homogenity guarantees the comparable chemical compo-sition with every heat melt. During the heat mill there is a sample taken and before reaching the steelplant, the chemical composition, mainly coal content, but also the other impurities such as sulfur, manganesse, silicon, phosphorus and other, is known. In the researched steel mill, in the furnaces departments, there are two pig sow founding devices with productivity of 2000 [t/24h], in case when steelplant cannot manage to process the produced crude iron, and there are outer receivers. The flow of input materials and production, and their main pa-rameters and parameters of basic devices used in the department are shown in the Figure 3. The furnace department is the first phase of the hot technological lines, where the processing cannot be stopped. Iron-bearing sinter is considered to be a furnace ignot, while, coke is a reducer and a hot blast, which initiates the crude iron sinter process. The hot blast is produced in Cowper stove, four per each furnace. Furnace crude iron as iron and coal alloy of 3,5 – 4,5% [C] coal content is a final product. Slug is a waste material product, which is thoroughly processed in cement production. Furnace gas is another waste material reused to heat the heaters’ air and other, because of its energetic value:
Figure 4 presents a scheme of Steel Plant Department (SPD), which is di-vided into four groups of devices presented in the Figure 1 as: – (HMDP) – stations for raw iron desulfurization with a productivity of 6 [mil-
lions tones/year]; – (BOF 1, BOF 2, BOF 3) – three oxygen converters with a maximal capacity
of 350 [tones], with BOF 1 and BOF 3 working in the upward blast system with the use of an oxygen lance and downward through gas permeable ce-ramic bricks; and BOF 2 with an upward blast only;
– (AR1, AR2, AR3, AR4) – four liquid steel argoning stations; – (LHF 1, LHF 2) – two ladle furnaces for a thorough off-furnace processing,
LHF 1 – 1station ladle furnace, LHF 2 – 2stations ladle furnace with a mov-able electrodes system for liquid steel heating;
– (RH) – a station for vacuous degassing of selected kinds of liquid steel; – (OBR) – ladle turn-around table with a liquid steel to set the ladles on turn-
around continuous steel casting towers (WO1, WO2, WO3); – (CCM 1, CCM 2, CCM 3) – three continuous steel casting aggregates, CCM
1 and CCM 2 for rounds and billets casting, and CCM 3 for slabs casting for external receivers. In the Figure 4 other feedstock material flows were presented, such as
feedstock strap, loose material, including ferroalloys and lime preparation in Maerz furnaces. Possible relations between particular devices of the techno-logical lines (SPD) and basic parameters of those devices, were presented in the figure.

Analysis of materials' flow in a steel mill in order to determine exploitation...
61
Fig
. 3
. S
chem
e o
f te
chn
olo
gic
al p
roce
sses
an
d m
ater
ial f
low
in F
urn
aces
Dep
artm
ent
(BF
) R
ys.
3.
Sch
emat
pro
cesó
w t
ech
no
log
iczn
ych
i p
rzep
ływ
u m
ater
iałó
w w
wyd
zial
e W
ielk
ich
Pie
ców
(W
P)
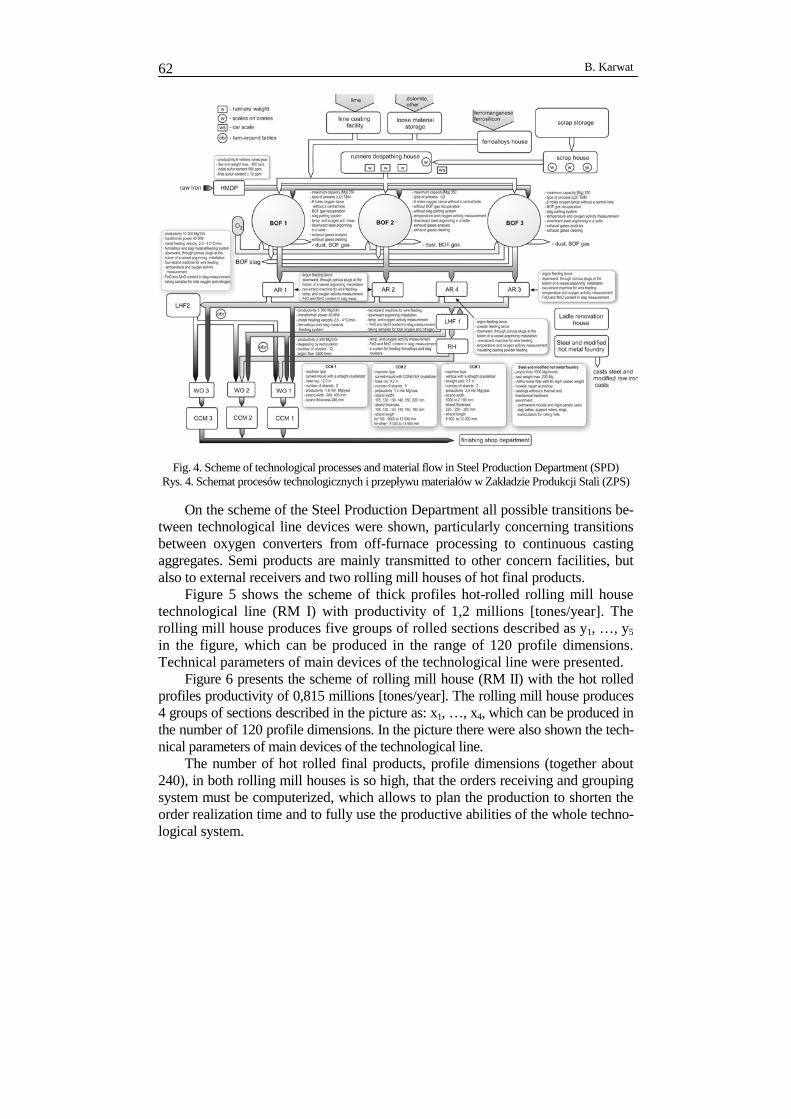
B. Karwat 62
Fig. 4. Scheme of technological processes and material flow in Steel Production Department (SPD) Rys. 4. Schemat procesów technologicznych i przepływu materiałów w Zakładzie Produkcji Stali (ZPS)
On the scheme of the Steel Production Department all possible transitions be-tween technological line devices were shown, particularly concerning transitions between oxygen converters from off-furnace processing to continuous casting aggregates. Semi products are mainly transmitted to other concern facilities, but also to external receivers and two rolling mill houses of hot final products.
Figure 5 shows the scheme of thick profiles hot-rolled rolling mill house technological line (RM I) with productivity of 1,2 millions [tones/year]. The rolling mill house produces five groups of rolled sections described as y1, …, y5 in the figure, which can be produced in the range of 120 profile dimensions. Technical parameters of main devices of the technological line were presented.
Figure 6 presents the scheme of rolling mill house (RM II) with the hot rolled profiles productivity of 0,815 millions [tones/year]. The rolling mill house produces 4 groups of sections described in the picture as: x1, …, x4, which can be produced in the number of 120 profile dimensions. In the picture there were also shown the tech-nical parameters of main devices of the technological line.
The number of hot rolled final products, profile dimensions (together about 240), in both rolling mill houses is so high, that the orders receiving and grouping system must be computerized, which allows to plan the production to shorten the order realization time and to fully use the productive abilities of the whole techno-logical system.

Analysis of materials' flow in a steel mill in order to determine exploitation...
63
Fig
. 5
. S
chem
e o
f te
chn
olo
gic
al p
roce
sses
an
d m
ater
ial f
low
in r
olli
ng
mill
ho
use
I (
RM
I)
Rys
. 5
. S
chem
at p
roce
sów
tec
hn
olo
gic
znyc
h i
prz
epły
wu
mat
eria
łów
w W
alco
wn
i I (
WL
I)

B. Karwat 64
Fig
. 6
. S
chem
e o
f te
chn
olo
gic
al p
roce
sses
an
d m
ater
ial f
low
in R
olli
ng
mill
ho
use
(R
M I
I)
Rys
. 6
. S
chem
at p
roce
sów
tec
hn
olo
gic
znyc
h i
prz
epły
wu
mat
eria
łów
w W
alco
wn
i II
(WL
II)
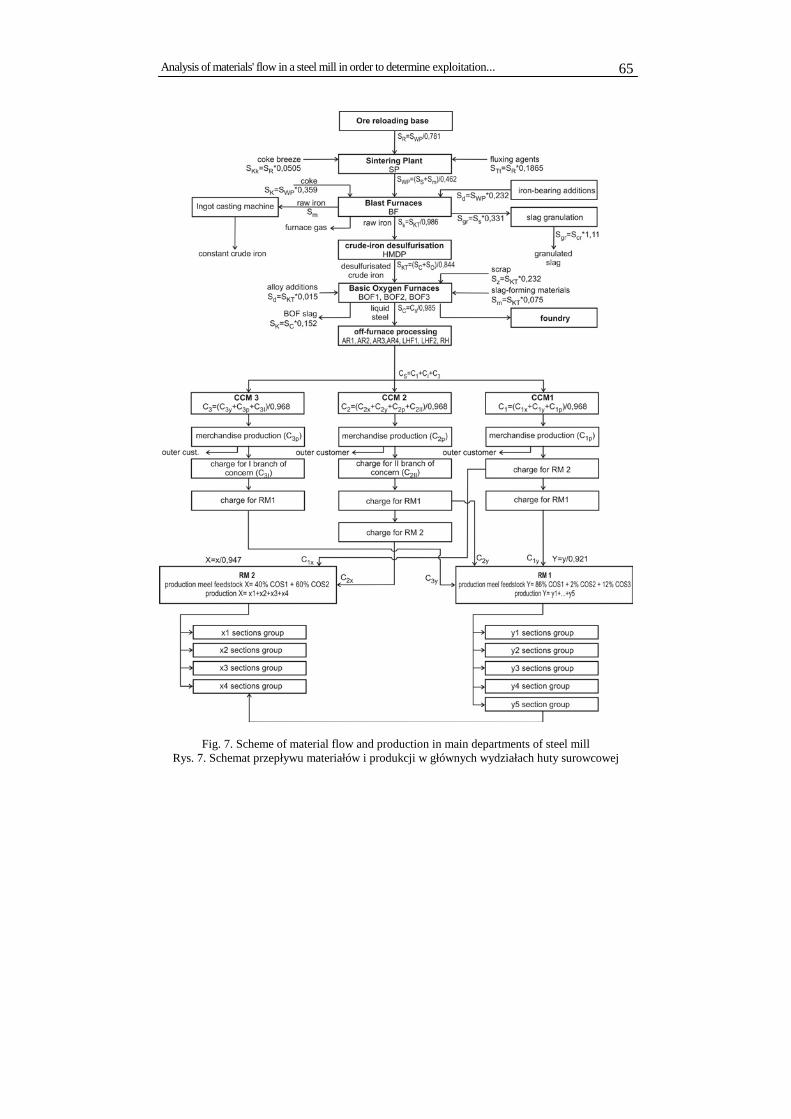
Analysis of materials' flow in a steel mill in order to determine exploitation...
65
Fig. 7. Scheme of material flow and production in main departments of steel mill Rys. 7. Schemat przepływu materiałów i produkcji w głównych wydziałach huty surowcowej
B. Karwat 66
4. Quantitive research of production flow in the steel mill
On the basis of statistic research conducted in various phases of production in the researched steel mill, there were an algorithm evolved, which enables to calculate material and raw material demand for production process of ordered final products realization. Figure 7 presents an algorithm, where final rolled products were marked as RM I sections’ groups (y1, ..., y5) and RM II sections’ groups (x1, ..., x4), and CCM aggregates continuous ingots for external receivers, and continuous ingots for other receivers of the concern's branches. Yeilds’ values for particular phases of the production process allow to calculate at any time a demand for a half-product from any device with strictly assessed final product demand. In the figure 7 all possible transfers between continuous steel casting aggregates in Steel Production Department and final products of RM I and RM II rolling mill houses were shown. According to the analysis, half-products for RM II are delivered only from CCM 1 and CCM 2, while for RM I, from all three aggregates and there is only a few percent of products from CCM 3. CCM 3 aggregate works mainly for other branches of the concern and for outer receivers. CCM 3 aggregate produces slabs, which are half-products for hot-rolled sheets, and this kind of rolling mill house was not analyzed.
5. Summary
Analysis and technological processes course identification in the steel mill, and data concerning main devices of particular departments, will enable to con-duct the further detailed research about material flow and specific processes time of realization. Firstly, Steel Production Department ought to be analysed, due to the fact that its continuous steel casting aggregates determine the work of the Rest of the devices. Moreover, Furnaces Department also ought to be ana-lysed, because it is responsible for delivering the set amount of crude iron in the set time. Furnaces’ survivability is influence with the proper exploitation. The length of exploitation influences the fixed costs, and the steel mill earning ca-pacity in the same time. The detailed analysis of hot departments’ work will allow to prepare the scheduling system for the most complicated part of steel mill work. Production planning and scheduling of this steel mill production sys-tem requires giving consideration to many factors. Scheduling process for short periods of time is complicated, but only some elements of technological proc-esses have to be taken into account. Issues connected with devices’ different exploitation times in the technological process also need to be taken into con-sideration while long term scheduling.
Analysis of materials' flow in a steel mill in order to determine exploitation...
67
References
[1] Redwine C.N., Wismer D.A.: A Mixted Integer Programming Model for Scheduling Orders in a Steel Mill. Journal of Optimization Theory and Applications.Vol.14, No.3, New York, 1974.
[2] Wright J.R., Houck M.H.: An application of systems modeling in steel production schedul-ing. Emgineering Software IV, Proceedings of the Fourth International Conference, Ken-sington Exhibition Center, London, 1985.
[3] Lally B., Biegler L., Henein H.: A Model for Sequencing a Continuous Casting Operation to Minimize Costs. Iron end Steelmaker. No. 10, 1987.
[4] Numao M., Morishita S.: SCHEPLAN – A scheduling expert for steel-making process, in: Proceedings of the International Workshop on Artificial Intelligence for Industrial Applica-tions, Hitachi, 1988.
[5] Numao M., Morishata S.: A scheduling environment for steel-making processes, in: The Fifth Conference on Artificial Intelligence Applications, Washington, DC, USA, 1989.
[6] Epp H.P., Kalin M.G., Miller D.P., Karwan K.R., Sweigart J.R.: An integrative adaptive, real-time scheduler for steel-making, in: Proceedings of the Third International Conference. Expert Systems and the Leading Edge in Production and Operations Management, USA, 1989.
[7] Morishita S., Numao M., Tozawa Y.: A scheduling expert for steel-making process by coop-erative scheduling. Journal of Japanese Society for Artificial Intelligence 5, 1990.
[8] Yimichi Y., Hori H., Odira T.: An expert system of automatic slab assignment for hot strip mill. ISIJ International 30 (1990).
[9] Numao M., Morishita S.: Cooperative scheduling and its application to steel-making proc-esses. IEEE Transactions on Industrial Electronics 38, 1991.
[10] Petersen C.M., Sorensen K.L., Vidal R.V.V.: Inter – process synchronization in steel pro-duction. International Journal of Production Research Vol.30, No. 6, 1992.
[11] Sthol K., Spopek W. VAI-Schedex: A hybrid expert system for co-operative production scheduling in steel plant, D.K. Baik (Ed.). International Conference on Computerized Pro-duction Control in Steel Plant. Korea, 1993.
[12] Neuwirth J.: A production scheduling system at the Stahl Linz GmbH, in: D.K. Baik (Ed.). International Conference on Computerized Production Control in Steel Plant. Korea, 1993.
[13] Tong X., Silverman J., Clausen S.: A caster sequencing optimization program for Geneva Steel’s Facility Modernization project. Presented at Annual AISE Convention, September 1994.
[14] Cowling P.: Optimization in steel hot rolling. Wiley, NY, 1995. [15] Hamada K., Baba T., Sato K., Yufu M.: Hybridizing a genetic algorithm with algorithm with
rule based reasoning for production planning. IEEE Expert 10, 1995. [16] Lee H.S., Murthy S.S., Haider S.W., Morse D.V.: Primary production scheduling at steel-
making industries. IBM Journal of Research and Development 40, No. 2, 1996. [17] Lopez L., Carter M.W., Gendreau M.: The hot strip mill production scheduling problem: A
tabu search approach. European Journal of Operational Research 106, 1998. [18] Li S., Chan Z.: Mathematical models of logistics decision in slab yard in an iron and steel
complex. Journal of University of Science and Technology Beijing (English Edition) (China), vol. 7, No. 4, Dec. 2000, ISSN 1005-8850.
[19] Cowling P., Rezig W.: Integration of continuous caster and hot strip mill planning for steel production. Journal of Scheduling. No 3, 2000.
[20] Tang L., Liu J., Rong A., Yang Z.: A mathematical programming model for scheduling steelmaking – continuous casting production. European Journal of Operational Research 120, 2000.
[21] Pettersson F., Slotte M., Haggblad T., Koistinen J., Saxen H.: A system for optimal melt shop production planning. 84th Steelmaking Conference, Baltimore, MD, USA, 25-28 Mar. 2001. Iron and Steel Society/AIME, 84th Steelmaking Conference. Proceedings (USA), 2001, ISBN 1-886362-53-X.
B. Karwat 68
[22] Tang L., Liu J., Rong A., Yang Z.: A multiple traveling salesman problem model for hot rolling scheduling in Shanghai Baoshan Iron & Steel Complex. European Journal of Opera-tional Research 124, 2000.
[23] Tang L., Liu J., Rong A., Yang Z.: A revive of planning and scheduling systems and meth-ods for integrated steel production. European Journal of Operational Research 133, 2001.
[24] Jha V., Mahashabde V., Mathur VK., Karunakar AN.: G2 - a shop scheduling tool for LD 2 and slab caster. Tata Iron and Steel, Tata Search (India), 2002, IS: ISSN 0971-5975.
[25] Tang L., Liu J., Rong A., Yang Z.: Modelling and a genetic algorithm solution for the slab stack shuffing problem when implementing steel rolling schedules. International Journal of Production Research. Vol. 40, No. 7, 2002, ISSN 0020-7543.
[26] Gao Z., Tang L.: A multi-objective model for purchasing of bulk raw materials of a large-scale integrated plant. International Journal of Production Economics. Vol. 83, 2003.
[27] Park SH., Sohn YW.: The Development of Synchronized Scheduling System for Steel Mak-ing & Hot Rolling Process RIST Journal of R&D (South Korea), vol. 17, no. 2, June 2003, ISSN 1225-486X.
[28] Tang L., Huang L.: Optimal and near-optimal algorithms to rolling batch scheduling for seamless steel tube production. International Journal of Production Economics. Vol. 105, 2007.
[29] Mathirajan M., Chandru V., Sivakumar A.I.: Heuristic algorithms for scheduling heat-treatment furnaces of steel casting industries. Sadahana, Vol. 32, Part 5, 2007.
[30] Tang L., Liu G.: A mathematical programming model and solution for scheduling produc-tion orders in Shanghai Baoshan Iron & Steel Complex. European Journal of Operational Research 182, 2007.
This scientific work was financed by the Ministry of Science and Higher
Education as a research project No N N504 407235.
Manuscript received by Editorial Board, January 12th, 2009.
Analiza przepływu materiałów w hucie stali w celu określenia parametrów eksploatacji urządzeń ciągu technologicznego
S t r e s z c z e n i e
Huta surowcowa stali jest bardzo skomplikowanym systemem produkcyjnym pod względem realizowanej technologii, pracującym w systemie pracy ciągłej. Dotyczy to w szczególności wy-działów gorących, takich jak wielkie piece i stalownia. Eksploatowane w tych wydziałach urzą-dzenia podlegają bardzo ścisłym reżimom technologicznym. Wszelkie odchylenia od optymalnych parametrów eksploatacji tych urządzeń i powodują nieodwracalne uszkodzenia skutkujące skróce-niem czasu ich pracy. Szczególnie dotyczy to wielkich pieców, które mogą pracować nawet kilka-naście lub kilka lat w przypadku, kiedy często w okresie eksploatacji jest ograniczana ich normal-na zdolność produkcyjna. Dlatego też planowanie i harmonogramowanie produkcji w hucie su-rowcowej jest zagadnieniem niezwykle istotnym dla optymalnej eksploatacji urządzeń, a jednocze-śnie bardzo trudnym ze względu na specyfikę produkcji. Takie prowadzenie procesu technolo-gicznego wymusza dostarczanie w ściśle określonym czasie odpowiedniej ilości półproduktów o ustalonych parametrach, do kolejnych urządzeń ciągu technologicznego. Nadrzędnymi urządze-niami w ciągu technologicznym są agregaty ciągłego odlewania stali, do których musi być dostar-czana ciekła stal o określonych parametrach, szczególnie w zakresie jej temperatury i w określo-nym przez harmonogram produkcji czasie. Do optymalizacji procesu harmonogramowania należy przyjąć jako kryterium maksymalizację ilości odlanych bez przerwy w sekwencji wytopów stali z pieców stalowniczych.
SCIENTIFIC PROBLEMS OF MACHINES OPERATION AND MAINTENANCE
4 (156) 2008
EWA MARECKA-CHŁOPEK*, EUGENIUSZ BUDNY* ZDZISŁAW CHŁOPEK** , MIROSŁAW CHŁOSTA*
Identification of combustion engine static states in real operation conditions of an earthmoving machine
K e y w o r d s
Construction machines, internal combustion engines, pollutant emission, environmental protection.
S ł o w a k l u c z o w e
Maszyny robocze, silniki spalinowe, emisja zanieczyszczeń, ochrona środowiska.
A b s t r a c t
Internal combustion engines are the basic units for the power train of mobile machines, which are most often self-ignition engines. For several decades special weight is being put to ecological proper-ties of machines, above all, to the pollutant emission from internal combustion engines. For this re-ason, it is necessary to develop a research method of the pollutant emission from internal combustion engines. Properties of internal combustion engines are strongly sensitive of work’s static states and the dynamic state occurrences. Particularly, the pollutant emission is strongly sensitive. From these reasons, for the purpose of the evaluation of operation properties for internal combustion engines in real working conditions, it is necessary to examine engine work conditions. The description of engine working conditions, in the stabilised thermal engine state, are in the form of the following processes: the engine speed and torque, which have been implemented in the paper. Demonstration tests, applied for the homological research of pollutant emission from internal combustion engines have been de-scribed with the static test – ECE R 49 and the dynamic test – ETC.
A way of appointing static states of an engine for dynamic working engine conditions has been presented. A two–dimensional histogram of static engine working states has been appointed for the ETC test. Empirical research of the static engine working states for a caterpillar bulldozer has been carried out. The engine steering and the engine speed have been recorded. The static states of the
* Institute of Mechanised Construction and Rock Mining, 6/8 Racjonalizacji Str., 02-673 Warsaw, Poland. ** Automotive Industry Institute, 55 Jagiellonska Str., 03–301 Warsaw, Poland.
TEROTECHNOLOGY •

E. Marecka-Chłopek, E. Budny, Z. Chłopek, M. Chłosta 70
engine work have been examined in the condition of real engine work. One–dimensional and two–dimensional histograms of the engine work states have been examined. A low compliance of the two dimensional histogram of engine work states with the standard static test has been stated for research of construction machine engines.
1. Introduction
Engines with spontaneous combustion are universally used as propulsion means for heavy construction machines. Among numerous properties of combu-stion engines, for many years, much importance has been attached to their eco-logical properties. The demands made on combustion engines on the part of environment protection are currently becoming a distinguishing feature of their quality, particular importance being attached to emission of pollutants harmful for people’s health and for the environment.
The knowledge of ecological properties of combustion engines with respect to pollutant emission is required for three main reasons.
The first reason is the necessity to qualify combustion engines introduced into commercial traffic and use with respect to their properties of affecting the environment, which is accomplished by homologation procedures permitting the statement that a product complies with formal requirements [1].
The second reason for checking pollution from combustion engines is the ne-cessity of knowing their ecological properties in conditions corresponding to real operation, which is necessary for estimating the effect of combustion engines on the environment, particularly for stocktaking pollution emissions from various sources in civilisation. Numerous countries are obliged to perform pollution emis-sion stocktaking, including Poland, on the strength of international agreements, inter alia within the range of the European CORINAIR programme (Coordinated Information on the Environment in the European Community) [2, 3].
The third reason is bound with the possibility of objective assessment of methods of improving the properties of combustion engines with regard to pol-lutant emission; therefore, it is necessary to work out methods of examining pollutant emission from combustion engines in conditions corresponding to real operation, which permits the assessment of these engines’ properties in their specific operating conditions [2, 4, 5–9].
2. Description of operating conditions of combustion engines
For the assessment of operational properties of combustion engines, proce-dures are used containing static or dynamic research tests [1, 2, 4–24].
Static tests are carried out in static conditions of the engine’s work; where-as, dynamic tests in dynamic conditions. Static conditions of the engine’s work are described by static processes, which are independent of time, or are constant
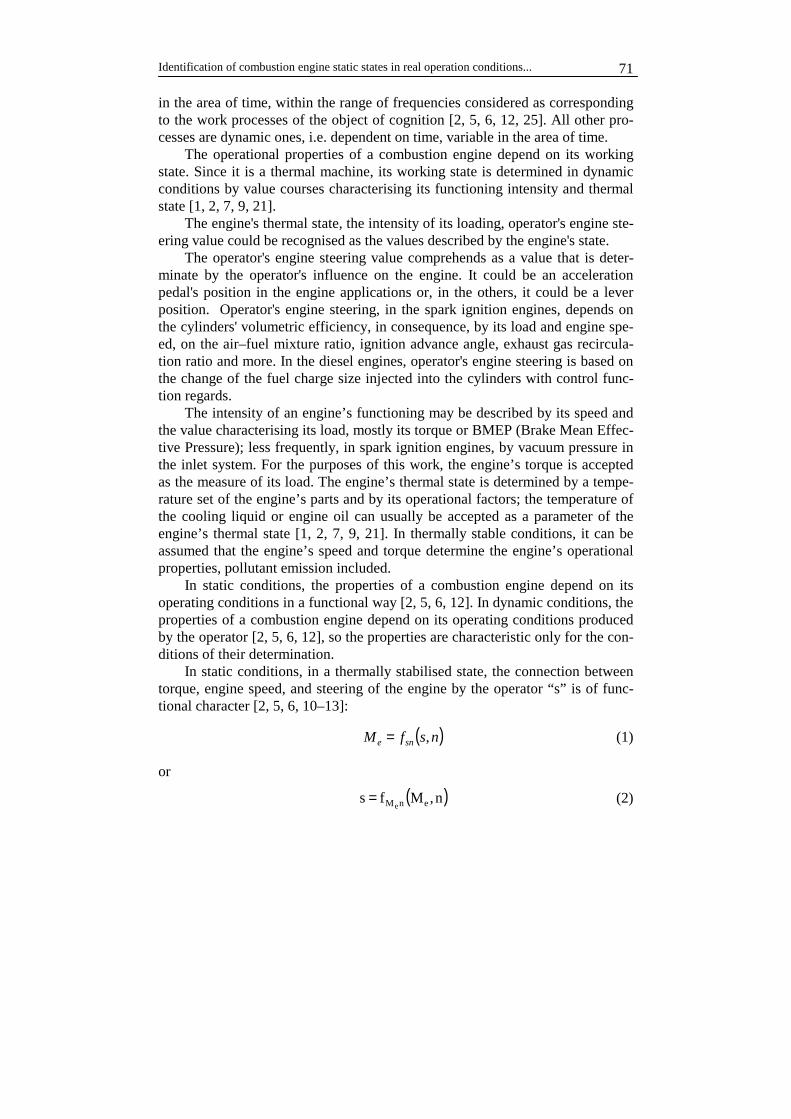
Identification of combustion engine static states in real operation conditions...
71
in the area of time, within the range of frequencies considered as corresponding to the work processes of the object of cognition [2, 5, 6, 12, 25]. All other pro-cesses are dynamic ones, i.e. dependent on time, variable in the area of time.
The operational properties of a combustion engine depend on its working state. Since it is a thermal machine, its working state is determined in dynamic conditions by value courses characterising its functioning intensity and thermal state [1, 2, 7, 9, 21].
The engine's thermal state, the intensity of its loading, operator's engine ste-ering value could be recognised as the values described by the engine's state.
The operator's engine steering value comprehends as a value that is deter-minate by the operator's influence on the engine. It could be an acceleration pedal's position in the engine applications or, in the others, it could be a lever position. Operator's engine steering, in the spark ignition engines, depends on the cylinders' volumetric efficiency, in consequence, by its load and engine spe-ed, on the air–fuel mixture ratio, ignition advance angle, exhaust gas recircula-tion ratio and more. In the diesel engines, operator's engine steering is based on the change of the fuel charge size injected into the cylinders with control func-tion regards.
The intensity of an engine’s functioning may be described by its speed and the value characterising its load, mostly its torque or BMEP (Brake Mean Effec-tive Pressure); less frequently, in spark ignition engines, by vacuum pressure in the inlet system. For the purposes of this work, the engine’s torque is accepted as the measure of its load. The engine’s thermal state is determined by a tempe-rature set of the engine’s parts and by its operational factors; the temperature of the cooling liquid or engine oil can usually be accepted as a parameter of the engine’s thermal state [1, 2, 7, 9, 21]. In thermally stable conditions, it can be assumed that the engine’s speed and torque determine the engine’s operational properties, pollutant emission included.
In static conditions, the properties of a combustion engine depend on its operating conditions in a functional way [2, 5, 6, 12]. In dynamic conditions, the properties of a combustion engine depend on its operating conditions produced by the operator [2, 5, 6, 12], so the properties are characteristic only for the con-ditions of their determination.
In static conditions, in a thermally stabilised state, the connection between torque, engine speed, and steering of the engine by the operator “s” is of func-tional character [2, 5, 6, 10–13]:
( )nsfM sne ,= (1)
or
( )n,Mfs enM e= (2)
E. Marecka-Chłopek, E. Budny, Z. Chłopek, M. Chłosta 72
or
( )esM Ms,fne
= (3)
Static tests for research on combustion engines are determined by the valu-
es of phase coordinates at points on the plane: engine speed, torque and shares (weight coefficients) of these phases in the whole tests. Dynamic tests are de-termined by the courses of speed and torque. In connection with functional de-pendencies (1 - 3), operating conditions in tests can also be determined by the knowledge of the pairs: torque speed and engine steering speed.
Traditionally static research tests are applied for examining the operational properties of these engines by mapping the engine’s operating conditions in accordance with the assumed criteria [2, 5–7, 9–16, 21]. There are two main reasons for a universal development of static research methods for spontaneous–ignition engines. The first reason is that static engine research methods are much easier to apply than dynamic ones [1, 2, 5–7, 9, 10, 17]. Equipment requ-irements for engine test benches are small for static methods; whereas, the per-formance of dynamic tests requires the application of advanced steering sys-tems, and in the case of simulating operating conditions with negative torque (braking the engine), applying brakes permitting engine propulsion. The second reason is that the operational properties of self–ignition engines are less sensi-tive to the occurrence of dynamic work states than in the case of an engine with spark ignition [2, 5, 6, 10, 17, 19].
The first static research tests of self–ignition engines were prepared to as-sess pollutant emission, and it was a 13–phase test in accordance with regulation 49 of the United Nations Economic Commission for Europe (UN ECE), marked as ECE R 49 [1, 2].
For a working state description of combustion engines, the concepts of rela-tive values are introduced in the tests, including engine speed and torque, which refer to the values on the external speed characteristic of the engine [2, 7–10, 13, 22].
The relative engine speed equals [2, 7–10, 13, 22]:
bjN
bjw nn
nnn
−−
= (4)
where: n – engine speed, nbj – minimal engine speed of idle running, nN – rated engine speed.

Identification of combustion engine static states in real operation conditions...
73
Relative torque for engine speed n is related to torque on the external speed characteristic for the same speed [2, 7–10, 13, 22]:
( ))n(M
nMM
ez
eew =
(5)
where: Me(n) – torque for engine speed n, Mez(n) – torque on external speed characteristic for engine speed n.
Figure 1 presents a 13–phase ECE R 49 test.
–
0
0.2
0.4
0.6
0.8
1
1.2
– 0 0.2 0.4 0.6 0.8 1 1.2
nw
Mew
Fig. 1. Test ECE R 49 (circle surface areas are proportional to the share in particular test phases) Rys. 1. Test ECE R 49 (pola powierzchni kół proporcjonalne do udziałów poszczególnych faz
w teście)
Numerous tests for researching engines of applications other than for cars are derived from the 13–phase test, inter alia in accordance with ISO 8178–4 standard [20], and also tests applied in the United States of America [ 1, 2, 10, 17, 19].
Apart from static tests, dynamic tests have been developed, especially in re-cent years. The first dynamic tests for researching combustion engines were introduced in the United States in 1985: HDDTT – Heavy Duty Diesel Transient Test and HDGTT – Heavy Duty Gasoline Transient Test [1, 2, 10, 17, 19]. In Europe, the first dynamic tests were introduced in 2000: ETC test (European Transient Cycle) for researching pollutant emission and ELR (European Load Response) for researching exhaust smoke [1]. Moreover, a dynamic test for re-searching engines of applications other than cars was prepared in the United States, the NRTC (Non Road Transient Cycle), later adapted in the European Union. Additionally, tests for researching combustion engines of selected cate-gories of construction machines are prepared at the US EPA (Environment Pro-tection Agency) [9].
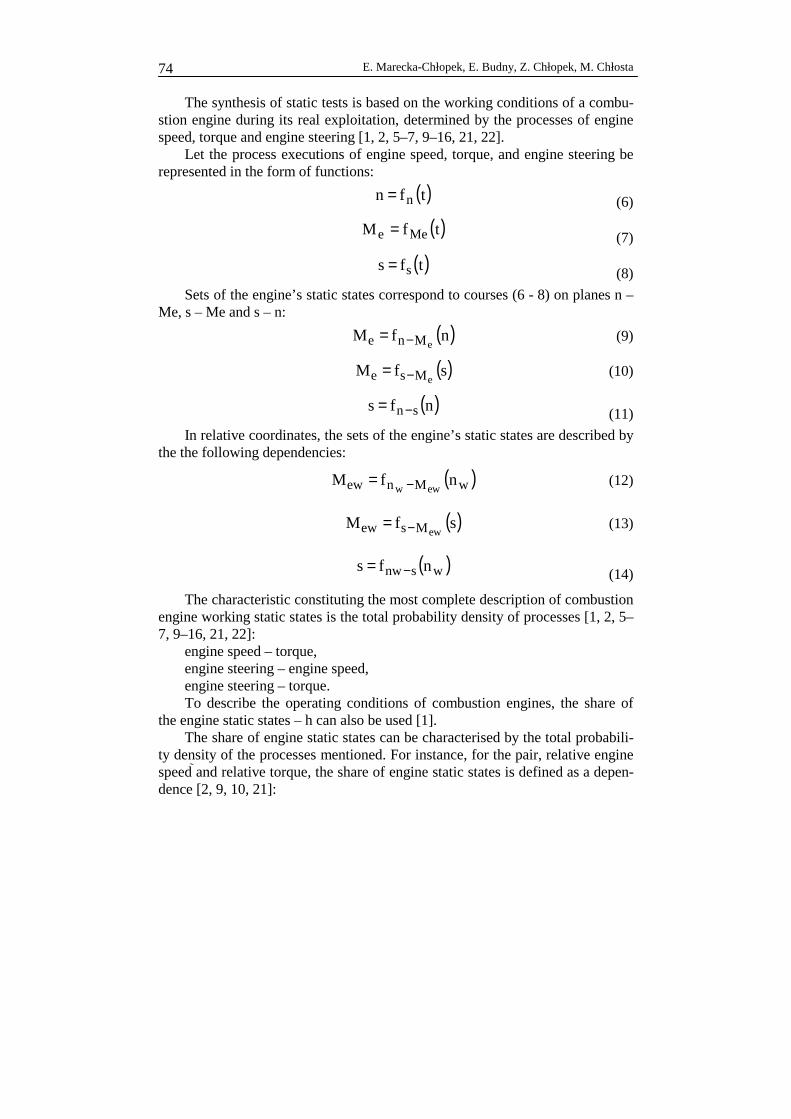
E. Marecka-Chłopek, E. Budny, Z. Chłopek, M. Chłosta 74
The synthesis of static tests is based on the working conditions of a combu-stion engine during its real exploitation, determined by the processes of engine speed, torque and engine steering [1, 2, 5–7, 9–16, 21, 22].
Let the process executions of engine speed, torque, and engine steering be represented in the form of functions:
( )tfn n= (6)
( )tfM Mee = (7)
( )tfs s= (8)
Sets of the engine’s static states correspond to courses (6 - 8) on planes n – Me, s – Me and s – n:
( )nfM
eMne −= (9)
( )sfM
eMse −= (10)
( )nfs sn−= (11)
In relative coordinates, the sets of the engine’s static states are described by the the following dependencies:
( )wMnew nfM
eww −= (12)
( )sfM
ewMsew −= (13)
( )wsnw nfs −= (14)
The characteristic constituting the most complete description of combustion engine working static states is the total probability density of processes [1, 2, 5–7, 9–16, 21, 22]:
engine speed – torque, engine steering – engine speed, engine steering – torque. To describe the operating conditions of combustion engines, the share of
the engine static states – h can also be used [1]. The share of engine static states can be characterised by the total probabili-
ty density of the processes mentioned. For instance, for the pair, relative engine speed and relative torque, the share of engine static states is defined as a depen-dence [2, 9, 10, 21]:

Identification of combustion engine static states in real operation conditions...
75
wew
ijij n∆M∆
φh
⋅=
(15)
where: ijφ – discrete total probability density of processes: Mew(t) and nw(t)
Mew – quantization interval of relative torque value Mew, nw – quantization interval of relative engine speed nw. Thus, the sum of engine work state shares equals 1.
1hK
1i
L
1jij =∑∑
= = (16)
where: K – number of states of relative engine speed, L – number of states of relative torque. The share of engine states is a relative histogram of values describing this state. Figure 2 presents the example of an ETC test and, for this test, it is in all re-
lative coordinates for engine speed–torque. Figure 3 presents a set of engine static states, and Fig. 4 presents the share of engine static states without taking account of the work points with negative torque.
0
0.2
0.4
0.6
0.8
1
0 500 1000 1500 2000
t [s]
nw

E. Marecka-Chłopek, E. Budny, Z. Chłopek, M. Chłosta 76
–
–
0
0.2
0.4
0.6
0.8
1
1.2
0 500 1000 1500 2000
t [s]
M ew
Fig. 2. ETC Test (European Transient Cycle) Rys. 2. Test ETC (European Transient Cycle)
–
–
0
0.2
0.4
0.6
0.8
1
1.2
0 0.2 0.4 0.6 0.8 1
nw
M ew
Fig. 3. Set of engine static states in relative coordinates engine speed – torque in ETC test
Rys. 3. Zbiór stanów statycznych silnika we współrzędnych względnych prędkość obrotowa – moment obrotowy w teście ETC
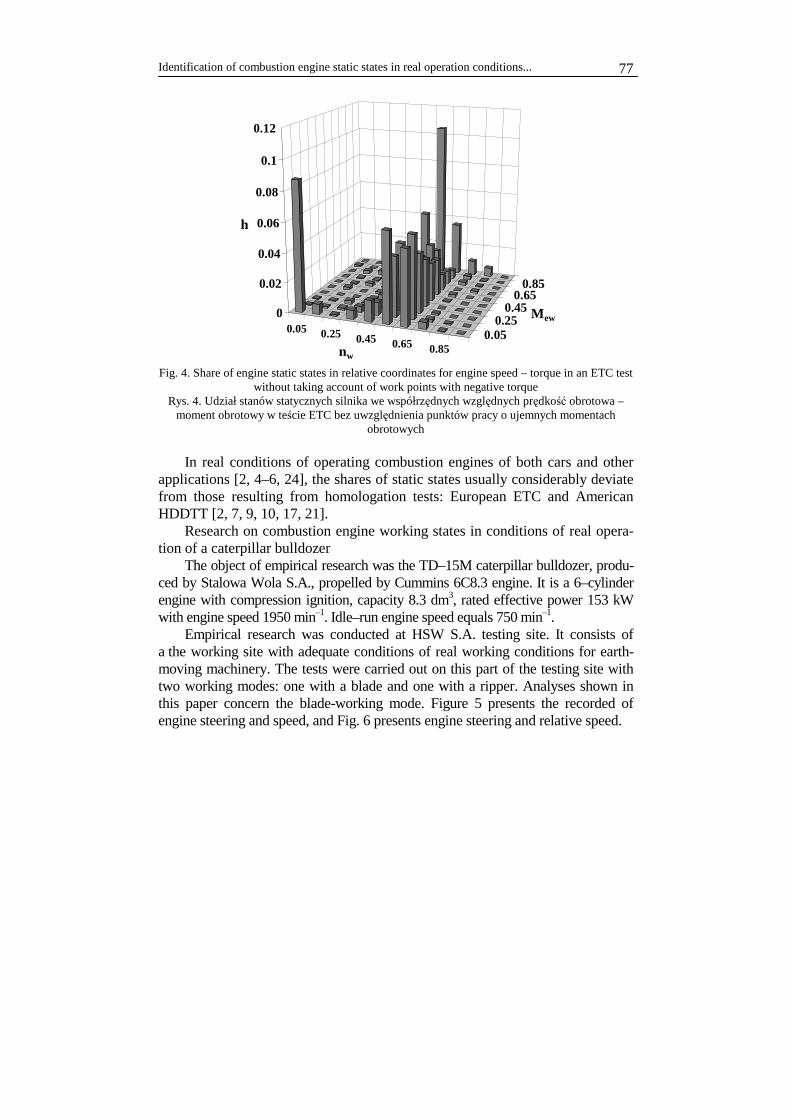
Identification of combustion engine static states in real operation conditions...
77
0.05 0.25 0.45 0.65 0.850.05
0.250.45
0.650.85
0
0.02
0.04
0.06
0.08
0.1
0.12
h
nw
M ew
Fig. 4. Share of engine static states in relative coordinates for engine speed – torque in an ETC test
without taking account of work points with negative torque Rys. 4. Udział stanów statycznych silnika we współrzędnych względnych prędkość obrotowa –
moment obrotowy w teście ETC bez uwzględnienia punktów pracy o ujemnych momentach obrotowych
In real conditions of operating combustion engines of both cars and other
applications [2, 4–6, 24], the shares of static states usually considerably deviate from those resulting from homologation tests: European ETC and American HDDTT [2, 7, 9, 10, 17, 21].
Research on combustion engine working states in conditions of real opera-tion of a caterpillar bulldozer
The object of empirical research was the TD–15M caterpillar bulldozer, produ-ced by Stalowa Wola S.A., propelled by Cummins 6C8.3 engine. It is a 6–cylinder engine with compression ignition, capacity 8.3 dm3, rated effective power 153 kW with engine speed 1950 min–1. Idle–run engine speed equals 750 min–1.
Empirical research was conducted at HSW S.A. testing site. It consists of a the working site with adequate conditions of real working conditions for earth-moving machinery. The tests were carried out on this part of the testing site with two working modes: one with a blade and one with a ripper. Analyses shown in this paper concern the blade-working mode. Figure 5 presents the recorded of engine steering and speed, and Fig. 6 presents engine steering and relative speed.

E. Marecka-Chłopek, E. Budny, Z. Chłopek, M. Chłosta 78
0
500
1000
1500
2000
2500
0 100 200 300 400 500 600 700
t [s]
n [m
in-1]
0
0,2
0,4
0,6
0,8
1
s
ns
Fig. 5. Engine speed and steering
Rys. 5. Przebieg prędkości obrotowej i sterowania silnika
0
0,2
0,4
0,6
0,8
1
1,2
0 100 200 300 400 500 600 700
t [s]
s, n
w
nw
s
nw
Fig. 6. Relative engine speed and steering
Rys. 6. Przebieg względnej prędkości obrotowej i sterowania silnika For the analysed courses of relative engine speed and steering, the static
state of the engine’s work without taking account of working points with nega-tive torque has been presented in Fig. 7. Figure 8 presents the corresponding share of the engine’s static states.
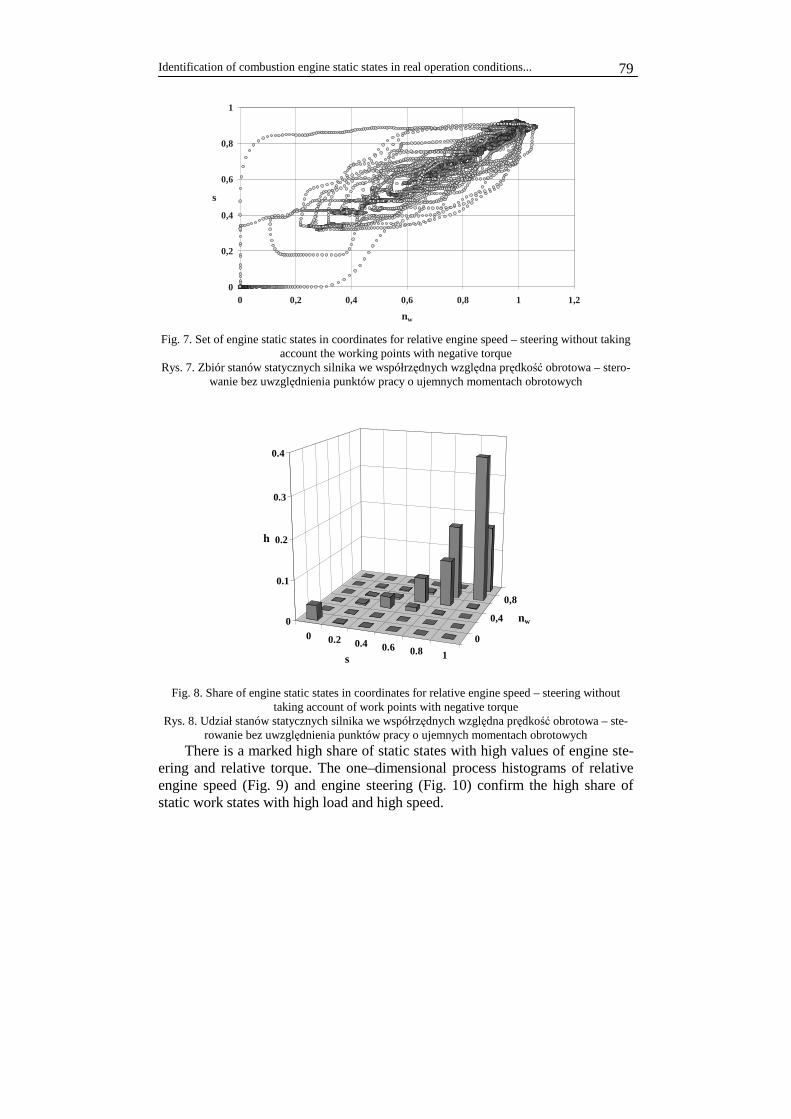
Identification of combustion engine static states in real operation conditions...
79
0
0,2
0,4
0,6
0,8
1
0 0,2 0,4 0,6 0,8 1 1,2
nw
s
Fig. 7. Set of engine static states in coordinates for relative engine speed – steering without taking
account the working points with negative torque Rys. 7. Zbiór stanów statycznych silnika we współrzędnych względna prędkość obrotowa – stero-
wanie bez uwzględnienia punktów pracy o ujemnych momentach obrotowych
0 0.2 0.4 0.6 0.8 1
0
0,4
0,8
0
0.1
0.2
0.3
0.4
h
s
nw
Fig. 8. Share of engine static states in coordinates for relative engine speed – steering without taking account of work points with negative torque
Rys. 8. Udział stanów statycznych silnika we współrzędnych względna prędkość obrotowa – ste-rowanie bez uwzględnienia punktów pracy o ujemnych momentach obrotowych
There is a marked high share of static states with high values of engine ste-ering and relative torque. The one–dimensional process histograms of relative engine speed (Fig. 9) and engine steering (Fig. 10) confirm the high share of static work states with high load and high speed.
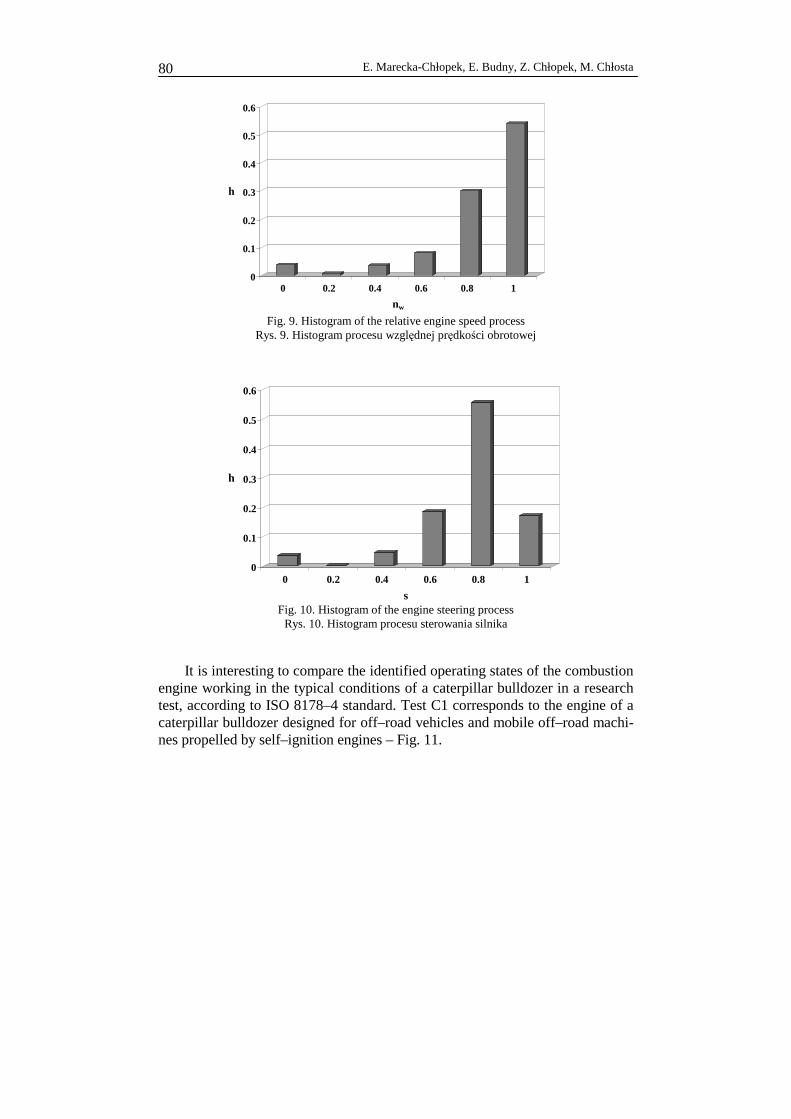
E. Marecka-Chłopek, E. Budny, Z. Chłopek, M. Chłosta 80
0
0.1
0.2
0.3
0.4
0.5
0.6
h
0 0.2 0.4 0.6 0.8 1
nw Fig. 9. Histogram of the relative engine speed process
Rys. 9. Histogram procesu względnej prędkości obrotowej
0
0.1
0.2
0.3
0.4
0.5
0.6
h
0 0.2 0.4 0.6 0.8 1
s Fig. 10. Histogram of the engine steering process Rys. 10. Histogram procesu sterowania silnika
It is interesting to compare the identified operating states of the combustion
engine working in the typical conditions of a caterpillar bulldozer in a research test, according to ISO 8178–4 standard. Test C1 corresponds to the engine of a caterpillar bulldozer designed for off–road vehicles and mobile off–road machi-nes propelled by self–ignition engines – Fig. 11.

Identification of combustion engine static states in real operation conditions...
81
–
0
0.2
0.4
0.6
0.8
1
1.2
– 0 0.2 0.4 0.6 0.8 1 1.2
nw
M ew
Fig. 11. Type C1 test (circle surface areas are proportional to the share in particular test phases)
Rys. 11. Test typu C1 (pola powierzchni kół proporcjonalne do udziałów poszczególnych faz w teście)
It is clearly visible that test C1 resembles only in a small degree the engine
operating conditions identified as a result of conducted empirical research. This conclusion is also confirmed by the results of the engine’s operating conditions with different loads on the caterpillar bulldozer engine, not published in the present work, which shows the necessity for researching working states of com-bustion engines in construction machines in conditions of real exploitation.
3. Recapitulation
The statement validation method in the various engine applications was de-scribed in this paper. The example the test results of the bulldozer engine state test were shown. These results were chosen among of many others that concer-ned the other working mode with the ripper. The tests were done in the engine static state equivalent to the real load dynamic state. These tests make a synthe-sis of the static engine state possible. The engine steering value and the speed were defined as the chart coordinates. Probability distribution of the engine state, as the engine steering value, engine speed and two-dimensional (engine speed and steering value) histograms were shown. It attaches importance to two-dimensional engine state histograms in the synthesis of the static tests. They have been used to correlate static tests with the probability of the engine state that is similar to real conditions [2, 6, 7, 9, 10, 13, 17, 19, 21].
The sensibility of the engine states histograms for the individual tests, and particularly for the various working modes of the earthmoving machines, is af-firmed by the results of conducted tests. This indicates the advisability of stati-
E. Marecka-Chłopek, E. Budny, Z. Chłopek, M. Chłosta 82
stically treating the problem of marking the states representative of the work of the engine for use in working machine engines [7, 9, 10, 14, 20, 23, 24].
The valuation of the occurrence of the influences of the dynamic states of the engine on its proprieties is the other problem.
It is reasonable to assume that the engine’s dynamic states applies to pollu-tion emission [2, 6, 10, 17, 19]
The dynamic tests synthesis to the investigation of combustion engines con-sists in the exact simulation in the time domain values describing the engine states or on the synthesis of the time domain courses of these values on the basis of the similarity of the characteristics of the test and the real engine state.
Also, in dynamic test synthesis, it is necessary to use the statistical appro-ach with the aim of assuring a representation of the test and the real conditions.
The tests and an example of results were presented in the work and show the sensibility of the combustion engine states on its working conditions and also on the essential differences of the real states of the work and standard tests that applied to the valuation of the proprieties of this kind of engine. This conc-lusion confirms the advisability of developing the subject matter of the identifi-cation of the states of the work of combustion engines under various modes of use with the aim of working out the methods of investigations of these engines in approximate conditions – in the measure of the possibility – to the conditions of the real use of the engines in various machinery and devices.
It is known from operational and research practice, and also from theoreti-cal knowledge [2], that the properties of combustion engines are strongly sensi-tive both to static and dynamic states of work, with particularly strong sensitivi-ty to operating conditions of combustion engines taking place in the case of pollutant emission; therefore, in research on the operational properties of com-bustion engines, it is necessary to take into consideration of their real operating conditions, which is why the rich experiences of methods of research on the operational properties of car combustion engines are usually insufficient to pre-pare research methods for combustion engines of other applications – a situation like this occurring in the case of combustion engines of construction machines. The large variety of operating conditions of combustion engines for construction machines requires a statistical approach to the problem, which could provide a rational basis for a synthesis of research tests, corresponding to conditions of real exploitation of these engines.
References
[1] Chłopek Z.: Pojazdy samochodowe – Ochrona środowiska naturalnego. WKŁ. Warszawa 2002.
[2] Chłopek Z.: Modelowanie procesów emisji spalin w warunkach eksploatacji trakcyjnej silników spalinowych. Prace Naukowe. Seria „Mechanika” z. 173. Oficyna Wydawnicza Po-litechniki Warszawskiej. Warszawa 1999.
Identification of combustion engine static states in real operation conditions...
83
[3] CORINAIR Coordinated Information on the Environment in the European Community Air. http://reports.eea.europa.eu/EMEPCORINAIR4/en/page002.html
[4] Chłopek Z.: Badania warunków pracy silnika spalinowego w czasie rzeczywistego użytko-wania w autobusie miejskim. Archiwum Motoryzacji 2/2007.
[5] Chłopek Z.: Metody badań ekologicznych właściwości silników spalinowych w warunkach przypadkowych. Zeszyty Naukowe Instytutu Pojazdów Politechniki Warszawskiej 3(33)/99.
[6] Chłopek Z.: Metody badań właściwości silników spalinowych w warunkach przypadkowych modelujących użytkowanie. Archiwum Motoryzacji 4/2001.
[7] Marecka-Chłopek E., Chłopek Z.: Ocena właściwości silników spalinowych maszyn robo-czych ze względu na emisję zanieczyszczeń. Przegląd Mechaniczny. Przegląd Mechaniczny 6’2007.
[8] Marecka-Chłopek E., Chłopek Z.: The estimation of research methods of the pollutant emis-sion from off–road vehicle engines. Maintenance and Realibility. (printing).
[9] Marecka-Chłopek E., Chłopek Z.: Problemy emisji zanieczyszczeń z silników spalinowych o zastosowaniach innych niż samochodowe. Eksploatacja i Niezawodność.
[10] Chłopek Z., Rostkowski J.: Testy dynamiczne do badań emisji zanieczyszczeń z silników spalinowych. The Sixth International Symposium „Combustion Engines in Military Applica-tions”. Jurata 2003.
[11] Chłopek Z.: Analiza metod wyznaczania statycznych testów badawczych silników spalino-wych. Journal of KONES 1999.
[12] Chłopek Z.: Matematyczne podstawy syntezy badawczych testów silników spalinowych. Zeszyty Naukowe Instytutu Pojazdów Politechniki Warszawskiej 1(32)/99.
[13] Chłopek Z.: O kryteriach równoważności warunków eksploatacji i warunków badań silni-ków spalinowych. Fourth International Symposium on Combustion Engines in Military Ap-plications. Jurata 1999.
[14] Chłopek Z.: Ocena ekologicznych właściwości silników spalinowych o różnych zastosowaniach – problemy procedur badawczych. Ogólnopolska Konferencja Naukowa KONSSPAL 2000.
[15] Chłopek Z.: Statyczne testy badawcze silników spalinowych do symulacji testów dynamicz-nych. Journal of KONES 2000.
[16] Chłopek Z.: Synteza statycznych testów badawczych silników spalinowych. PAN Oddział w Krakowie. Teka Komisji Naukowo-Problemowej Motoryzacji. Zeszyt 18. Kraków 1999.
[17] Cornetti G.M., Klein K., Fränkle G.J., Stein H.J.: US transient cycle versus ECE R49 mode cycle. SAE Paper 880715.
[18] Emission Test Cycles. http://www.dieselnet.com/standards/cycles/. [19] Fränkle G., Stein H.J.: Instationäre oder stationäre Abgasprüfverfahren für Nutzfahrzeug–
Dieselmotoren, 1. Teil ATZ 1/1988, 2, Teil – ATZ 2/1988 [20] ISO 08178: „Reciprocating internal combustion engines – Exhaust emission measurement –
Part 4: Test cycles for different engine applications”. [21] Marecka-Chłopek E., Chłopek Z.: Synteza testów statycznych do badania silników spalino-
wych o zastosowaniach innych niż samochodowe ze względu na emisję zanieczyszczeń i zu-życie paliwa. Przegląd Mechaniczny. Przegląd Mechaniczny 9’2007.
[22] Marecka-Chłopek E.: Analiza testów statycznych do badania emisji zanieczyszczeń z silni-ków spalinowych o zastosowaniach innych niż samochodowe. Przegląd Mechaniczny 10’2007.
[23] SAE Recommended Practise: Test Procedure for the Measurement of Gaseus Exhaust Emis-sions from Small Utility Engines. SAE J1088; February 1993.
[24] US Environmental Protection Agency: EPA Nonregulatory Nonroad Duty Cycles http:// epa.gov/nonroad–diesel/cycles/nrcycles.htm.
[25] Bendat J.S., Piersol A.G.: Metody analizy i pomiaru sygnałów losowych. PWN. Warszawa 1976.
Manuscript received by Editorial Board, March 05th, 2009.
E. Marecka-Chłopek, E. Budny, Z. Chłopek, M. Chłosta 84
Identyfikacja statycznych stanów pracy silnika spalinowego w warunkach rzeczywistego użytkowania maszyny roboczej
S t r e s z c z e n i e
Podstawowym środkiem napędu mobilnych maszyn roboczych są silniki spalinowe, najczę-ściej o zapłonie samoczynnym. Od kilkudziesięciu lat szczególną wagę przykłada się do ekolo-gicznych właściwości maszyn, przede wszystkim do emisji zanieczyszczeń z silników spalino-wych. Z tego powodu istnieje konieczność rozwijania metod badań emisji zanieczyszczeń z silni-ków spalinowych. Właściwości silników spalinowych są silnie wrażliwe na stany statyczne pracy oraz na występowanie stanów dynamicznych. Szczególnie silna wrażliwość zachodzi w wypadku emisji zanieczyszczeń. Z tych powodów – w celu oceny właściwości użytkowych silników spali-nowych w warunkach ich rzeczywistej eksploatacji konieczne jest badanie warunków pracy silni-ków. W pracy formalnie wprowadzono sposoby opisu warunków pracy silników spalinowych – w ustabilizowanym stanie cieplnym – w postaci procesów: prędkości obrotowej i momentu obro-towego. Opisano przykładowe testy, stosowane do badań kwalifikacyjnych emisji zanieczyszczeń z silników spalinowych: statyczny – ECE R 49 i dynamiczny ETC.
Przedstawiono sposób wyznaczania stanów statycznych silnika, odpowiadających dy-namicznym warunkom jego pracy na przykładzie testu ETC. Wyznaczono dwuwymiarowy histo-gram statycznych stanów pracy silnika w teście ETC. Dla spycharki gąsienicowej wykonano bada-nia empiryczne stanów pracy silnika spalinowego. Zarejestrowano przebiegi sterowania silnika oraz prędkości obrotowej. Zbadano statyczne stany pracy w warunkach odpowiadających rzeczy-wistemu użytkowaniu. Zbadano rozkłady procesów stanów pracy silnika: jednowymiarowe i dwu-wymiarowe. Stwierdzono małą zgodność dwuwymiarowego histogramu stanów pracy silnika ze standardowym testem statycznym do badania silników maszyn roboczych.

SCIENTIFIC PROBLEMS OF MACHINES OPERATION AND MAINTENANCE
4 (156) 2008
STANISŁAW DUER*
Determination of diagnostic information of a technical object on the basis of a functional and diagnostic analysis on example of a car engine
K e y w o r d s
Technical operation, control systems, technical diagnostics, neural networks, knowledge bases.
S ł o w a k l u c z o w e
Obsługiwanie techniczne, systemy sterowania, diagnostyka techniczna, sieci neuronowe, bazy wiedzy.
A b s t r a c t
This paper presents a method for the creation of diagnostic information of a technical object on the basis of a functional and diagnostic analysis, with the use of three-value logic diagnostic informa-tion. Also, a general diagram of the complex technical object was presented, and its internal structure was described. A diagnostic analysis was conducted, as a result of which sets of the functional ele-ments of the object and its diagnostic signals were determined. Also, the methodology of the diagnos-tic examination of the technical system was presented. The result was a functional and diagnostic model, which constituted the basis for initial diagnostic information, which is provided by the sets of information concerning the elements of the basic modules and their output signals.
The theoretical results obtained in the present study were verified in practice on the example of a complex and reparable technical object, which is a car engine. It belongs to the group of techni-cal equipment for which a short time of shutdowns is required (an ineffective use of the object).
1. Introduction
The technical state of the object at a given time of use determines the pos-sibilities of the realisation of its required functions. It is determined by a subset of its physical properties [1, 2, 4], which describe a given object. For practical * Koszalin University of Technology, Department of Mechanical Engineering, Racławicka 15-17, 75-620 Koszalin,
Poland, e-mail: [email protected]
DIAGNOSTICS •
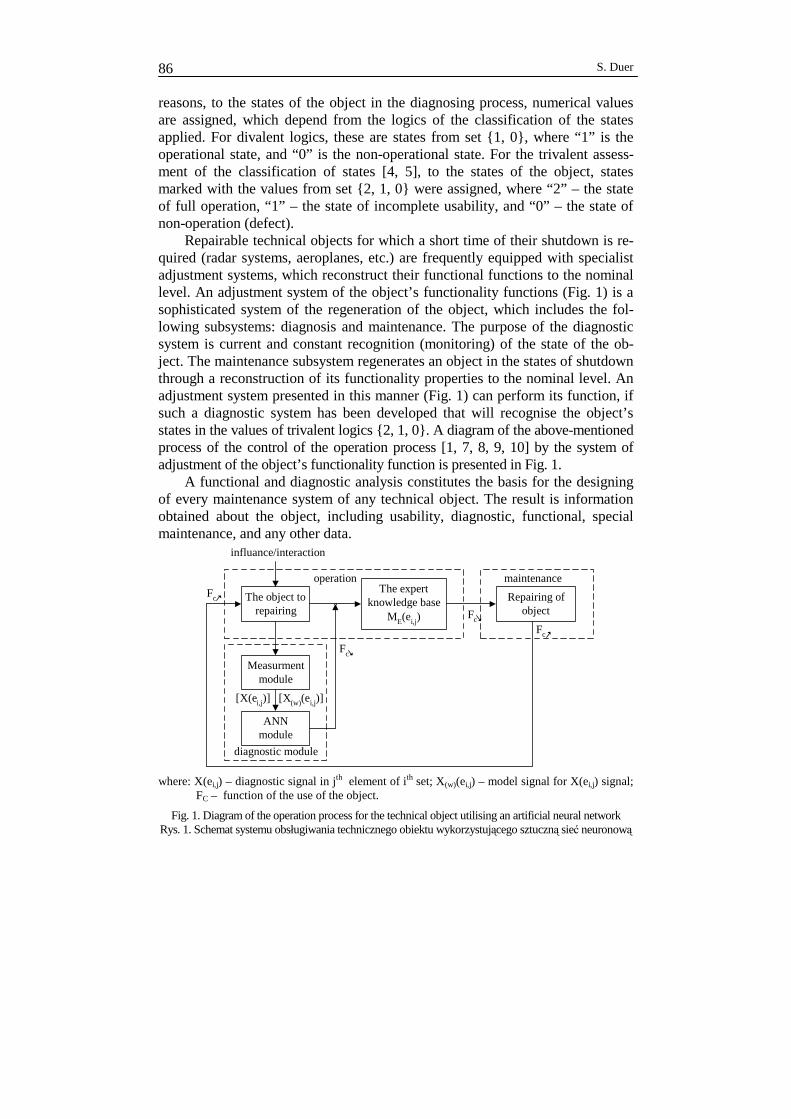
S. Duer 86
reasons, to the states of the object in the diagnosing process, numerical values are assigned, which depend from the logics of the classification of the states applied. For divalent logics, these are states from set {1, 0}, where “1” is the operational state, and “0” is the non-operational state. For the trivalent assess-ment of the classification of states [4, 5], to the states of the object, states marked with the values from set {2, 1, 0} were assigned, where “2” – the state of full operation, “1” – the state of incomplete usability, and “0” – the state of non-operation (defect).
Repairable technical objects for which a short time of their shutdown is re-quired (radar systems, aeroplanes, etc.) are frequently equipped with specialist adjustment systems, which reconstruct their functional functions to the nominal level. An adjustment system of the object’s functionality functions (Fig. 1) is a sophisticated system of the regeneration of the object, which includes the fol-lowing subsystems: diagnosis and maintenance. The purpose of the diagnostic system is current and constant recognition (monitoring) of the state of the ob-ject. The maintenance subsystem regenerates an object in the states of shutdown through a reconstruction of its functionality properties to the nominal level. An adjustment system presented in this manner (Fig. 1) can perform its function, if such a diagnostic system has been developed that will recognise the object’s states in the values of trivalent logics {2, 1, 0}. A diagram of the above-mentioned process of the control of the operation process [1, 7, 8, 9, 10] by the system of adjustment of the object’s functionality function is presented in Fig. 1.
A functional and diagnostic analysis constitutes the basis for the designing of every maintenance system of any technical object. The result is information obtained about the object, including usability, diagnostic, functional, special maintenance, and any other data.
The object torepairing
The expertknowledge base Repairing of
object
operation maintenance
Fc
[X(ei,j)]
ANNmodule
Fc
influance/interaction
[X(w)(ei,j)]
Fc
Measurmentmodule
diagnostic module
FcME(ei,j)
where: X(ei,j) – diagnostic signal in jth element of ith set; X(w)(ei,j) – model signal for X(ei,j) signal; FC – function of the use of the object.
Fig. 1. Diagram of the operation process for the technical object utilising an artificial neural network Rys. 1. Schemat systemu obsługiwania technicznego obiektu wykorzystującego sztuczną sieć neuronową

Determination of diagnostic information of a technical object on the basis...
87
2. Method of functional and diagnostic analysis of a technical object
Determination of the maintenance function of a technical object can occur on the basis of a functional and diagnostic analysis. A diagnostic study of a technical object is the domain of the reliability theory, diagnostics, and the op-eration of technical objects. The issue of the determination of maintenance in-formation is a complex process. This process begins with the recognition of the properties of the object in question, the nature of its work, and the development of its functional and diagnostic (maintenance) model.
It is only on a further stage that the object’s diagnostic structure is deter-mined, which constitutes the object’s internal structure including a diagnostic description. The final state of this process is the obtained internal structure of the object, which is adapted to the realisation of the maintenance (prophylactic) process. The issue of the diagnostic study of a complex technical object de-scribed in [1, 2, 3, 4] constitutes the basis of the process of the location of de-fects and an assessment of the object’s state.
The idea of a diagnostic study comes down to an analysis and study (trans-formation) of the internal and functional structure of the object, the effect of which is the obtaining of its diagnostic structure [1, 2, 3, 5]. The final effect of this process is the criterion of an optimal programme of the control of the state or location of defects. It is convenient to conduct a diagnostic analysis of a given object by using its previously constructed functional model, which reflects it usability, functions, and any other properties. As a result, a set of diagnostic information will be determined concerning the object’s state and its basic (con-structional) elements. Such a form of the set of diagnostic information consti-tutes the basis for the organisation of an optimal maintenance system. The pro-posed model of an organisation of the maintenance system will be feasible if the diagnosis of the object is realised in a trivalent assessment of states.
The basis of all the actions undertaken by the user in connection with a technical object, such as diagnosing and operation, is the diagnostic information determined. Most frequently, it is obtained through an examination of the state, an analysis of its model, and an observation of the real operational process of an object of a given class. The most commonly used and convenient form of the presentation of an object in the process of a diagnostic study is its functional model. During the preparation of the functional model of the object, the follow-ing should be taken into consideration: the object’s functional diagram, the working principle of the object, its purpose, as well as the depth of the penetra-tion into the object’s structure in the process of location of defects, etc.
The technical object {O} used for tests in the present study is a reparable com-plex technical object of an analogue class. While preparing a diagnostic model of this class of an object, its internal structure was divided into four levels of the main-tenance structure (Fig. 2): level one: object {O}, level two: assemblies (in object {O}), level three: subassemblies (in each assembly {Ei}), level four: modules-basic elements (in each subassembly, of each assembly of the object).
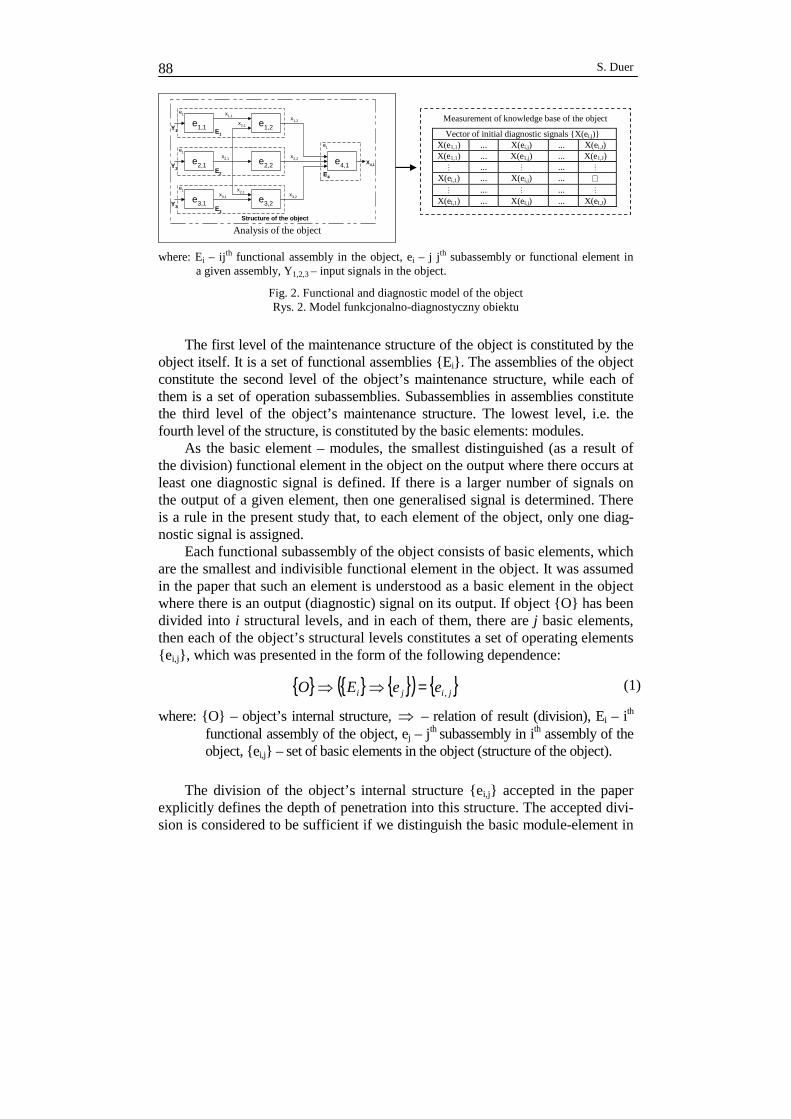
S. Duer 88
e1,1
e2,1
e3,1
e1,2
e2,2
e3,2
e4,1
Y1
Y2
Y3
X4,1
E1
x1,1
x2,1
x2,1
x2,1
E2
E3
x3,1
x2,2
x1,2
x3,2
E4
Structure of the object
e1
e1
e1
e1
Analysis of the object
Measurement of knowledge base of the object
Vector of initial diagnostic signals {X(ei,j)} X(e1,1) ... X(ei,j) ... X(ei,J) X(e1,1) ... X(e1,j) ... X(e1,J)
M ... M ... M X(ei,1) ... X(ei,j) ... ∅
M ... M ... M X(eI,1) ... X(eI,j) ... X(eI,J)
where: Ei – ijth functional assembly in the object, ei – j jth subassembly or functional element in a given assembly, Y1,2,3 – input signals in the object.
Fig. 2. Functional and diagnostic model of the object Rys. 2. Model funkcjonalno-diagnostyczny obiektu
The first level of the maintenance structure of the object is constituted by the
object itself. It is a set of functional assemblies {Ei}. The assemblies of the object constitute the second level of the object’s maintenance structure, while each of them is a set of operation subassemblies. Subassemblies in assemblies constitute the third level of the object’s maintenance structure. The lowest level, i.e. the fourth level of the structure, is constituted by the basic elements: modules.
As the basic element – modules, the smallest distinguished (as a result of the division) functional element in the object on the output where there occurs at least one diagnostic signal is defined. If there is a larger number of signals on the output of a given element, then one generalised signal is determined. There is a rule in the present study that, to each element of the object, only one diag-nostic signal is assigned.
Each functional subassembly of the object consists of basic elements, which are the smallest and indivisible functional element in the object. It was assumed in the paper that such an element is understood as a basic element in the object where there is an output (diagnostic) signal on its output. If object {O} has been divided into i structural levels, and in each of them, there are j basic elements, then each of the object’s structural levels constitutes a set of operating elements {ei,j}, which was presented in the form of the following dependence:
{ } { } { }( ) { }jiji eeEO ,=⇒⇒ (1)
where: {O} – object’s internal structure, ⇒ – relation of result (division), Ei – ith functional assembly of the object, ej – jth subassembly in ith assembly of the object, {ei,j} – set of basic elements in the object (structure of the object).
The division of the object’s internal structure {ei,j} accepted in the paper
explicitly defines the depth of penetration into this structure. The accepted divi-sion is considered to be sufficient if we distinguish the basic module-element in

Determination of diagnostic information of a technical object on the basis...
89
the structure of the object. One of the purposes of the functional-diagnostic analysis is the determination of the object’s state. The object’s state is deter-mined on the basis of an examination of the set of output (diagnostic) signals {X(ei,j)}(Table 1) [1, 5, 6]. The set of its functional elements {ei,j} determined during a diagnostic study of the object constitutes the basis for the list included in the table of a set of diagnostic signals (Table 1).
Table 1. Table of object’s input diagnostic signals
Tablica 1. Tablica wejściowych sygnałów diagnostycznych obiektu
Vector of initial diagnostic signals {X(ei,j)} Object Level of object Ei
X(e1,1) ... X(ei,j) ... X(ei,J)
E1 X(e1,1) ... X(e1,j) ... X(e1,J)
M M ... M ... M Ei X(ei,1) ... X(ei,j) ... X(ei,J) M M ... M ... M
O
EI X(eI,1) ... X(eI,j) ... X(eI,J) where: X(ei,j) – diagnostic signal of jth element in ith assembly.
For this purpose, on the basis of the object’s diagnostic model (Fig. 1), an
optimum number of check paths is determined. Each check (di) covers a certain set of elements (ej) in a given assembly (Ei), which means that a subset of ele-ments {ej ε Ei} is assigned to diagnostic check (di); therefore, the check path is determined, which is described with the following dependence:
( ) ijiji
IiDd
Eededi
∈⟨⟩∀=
∈;
,1
a
(2)
where: a - assignment relation,→ - relation of result, ij de ⟨⟩ - subset of basic
elements (ei,j) covered by check di.
The process of the determination of the technical state of the functional
elements and of the whole object consists in the measurement of the properties of each signal, and in a comparison of the measurement results obtained, with the properties of their model signals X(w)i,j. In the process of diagnosing of tech-nical object, there is a rule according to which the distinguished signal must be compared with the model in order to check it. If, during an examination of the object, nominal kth properties of input signals (Table 1) is guaranteed, then the object’s output signal characterises its state [1, 2, 4. 5, 6]. As a result of the di-

S. Duer 90
agnostic analysis, a set of checks available {D} in the object was obtained in an analytical form.
{ } ( ) ijiji
IiDd
jii EededXdDi
∈⟨⟩∀⇔→==
∈ ;
,1
, a 3)
In order to assess the signal tested, one must compare it with the model. In
the diagnostic practice of objects, simpler checking is used, which consists in establishing whether the values of output signals are within the range of their admissible or boundary changes. Result Di of check di depends of the state of
elements (ei,j) in path ij de ⟨⟩. Diagnostic decision rules [5, 7, 8, 9, 10] for a
trivalent assessment of the object’s states were presented in the form of the fol-lowing dependence:
( )( ) ( )( )( )( )000 ,, ==⇔=∃
∈ jiijiEe
eDeij
εε (4)
( )( ) ( )( )( )( )111 ,, ==⇔=∀
∈ jiijiEe
eDeij
εε (5)
( )( ) ( )( )( )( )222 ,, ==⇔=∀
∈ jiijiEe
eDeij
εε (6)
where: (ε(ei,j)) = 0 – non-operational state of element (ei,j); (ε(ei,j)) = 1 – state of incomplete usability of element (ei,j);(ε(ei,j)) = 2 – state of non-operation of element (ei,j); (Di(ε(ei,j) = 0) – result of check with non-operational element (ei,j); (Di(ε(ei,j) = 1) – result of check with an incompletely oper-ating element (ei,j); (Di(ε(ei,j) = 2) – result of check with an operational element (ei,j).
The results of the object’s diagnosis obtained from the relations (4, 5, 6) are
presented in Table 2.
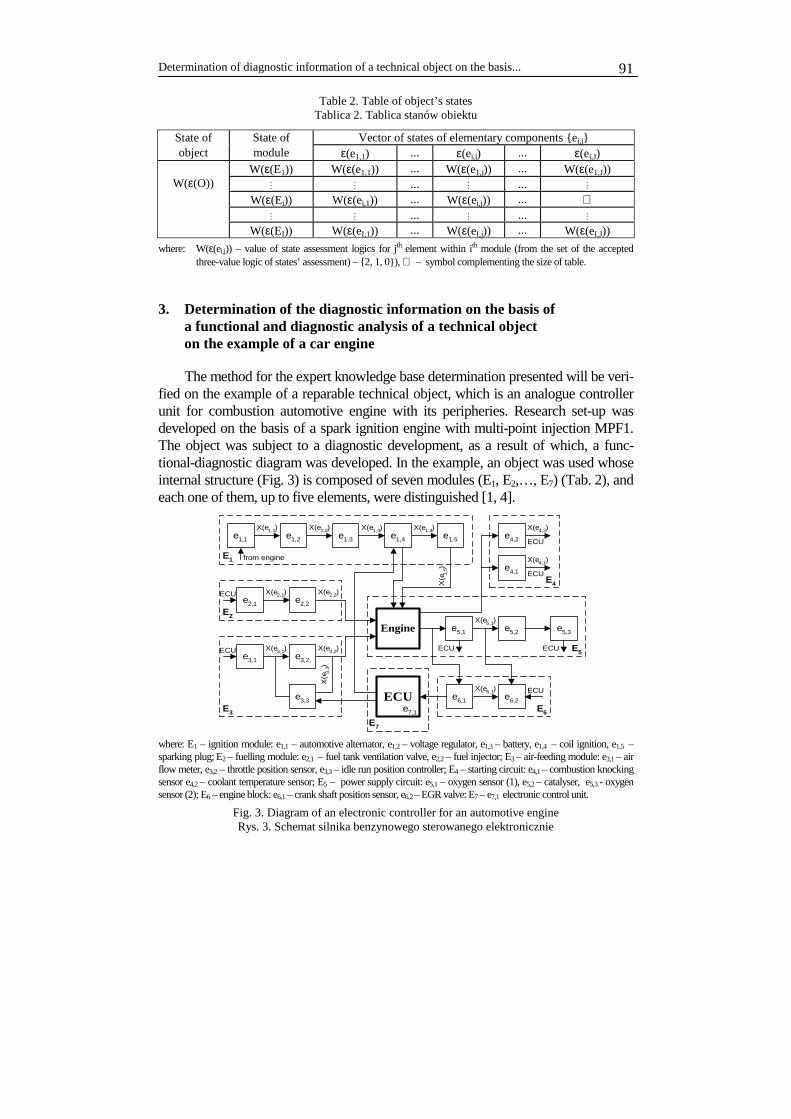
Determination of diagnostic information of a technical object on the basis...
91
Table 2. Table of object’s states Tablica 2. Tablica stanów obiektu
State of State of Vector of states of elementary components {ei,j} object module ε(e1,1) ... ε(ei,j) ... ε(ei,J)
W(ε(E1)) W(ε(e1,1)) ... W(ε(e1,j)) ... W(ε(e1,J)) M M ... M ... M
W(ε(Ei)) W(ε(ei,1)) ... W(ε(ei,j)) ... ∅ M M ... M ... M
W(ε(O))
W(ε(EI)) W(ε(eI,1)) ... W(ε(eI,j)) ... W(ε(eI,J))
where: W(ε(ei,j)) – value of state assessment logics for jth element within ith module (from the set of the accepted three-value logic of states’ assessment) – {2, 1, 0}), ∅ – symbol complementing the size of table.
3. Determination of the diagnostic information on the basis of a functional and diagnostic analysis of a technical object on the example of a car engine
The method for the expert knowledge base determination presented will be veri-fied on the example of a reparable technical object, which is an analogue controller unit for combustion automotive engine with its peripheries. Research set-up was developed on the basis of a spark ignition engine with multi-point injection MPF1. The object was subject to a diagnostic development, as a result of which, a func-tional-diagnostic diagram was developed. In the example, an object was used whose internal structure (Fig. 3) is composed of seven modules (E1, E2,…, E7) (Tab. 2), and each one of them, up to five elements, were distinguished [1, 4].
ECU
Engine
e1,2e1,1
E1
E2
E3
E4
E5
E6
E7
from engine
X(e1,1)
ECU
X(e1,2) X(e1,3) X(e1,4)
ECU X(e2,1)
X(e
1,5)
X(e4,2)
X(e4,1)
ECU X(e3,1) X(e3,2)
X(e
3,3)
X(e5,1)
X(e6,1)
X(e2,2)
e1,3 e1,4 e1,5
e2,1 e2,2
e3,1 e3,2
e3,3
e4,2
e4,1
e5,1 e5,2 e5,3
ECU
ECUECU
e6,1 e6,2
ECU
e7,1
where: E1 – ignition module: e1,1 – automotive alternator, e1,2 – voltage regulator, e1,3 – battery, e1,4 – coil ignition, e1,5 – sparking plug; E2 – fuelling module: e2,1 – fuel tank ventilation valve, e2,2 – fuel injector; E3 – air-feeding module: e3,1 – air flow meter, e3,2 – throttle position sensor, e3,3 – idle run position controller; E4 – starting circuit: e4,1 – combustion knocking sensor e4,2 – coolant temperature sensor; E5 – power supply circuit: e5,1 – oxygen sensor (1), e5,2 – catalyser, e5,3 - oxygen sensor (2); E6 – engine block: e6,1 – crank shaft position sensor, e6,2 – EGR valve: E7 – e7,1 electronic control unit.
Fig. 3. Diagram of an electronic controller for an automotive engine Rys. 3. Schemat silnika benzynowego sterowanego elektronicznie
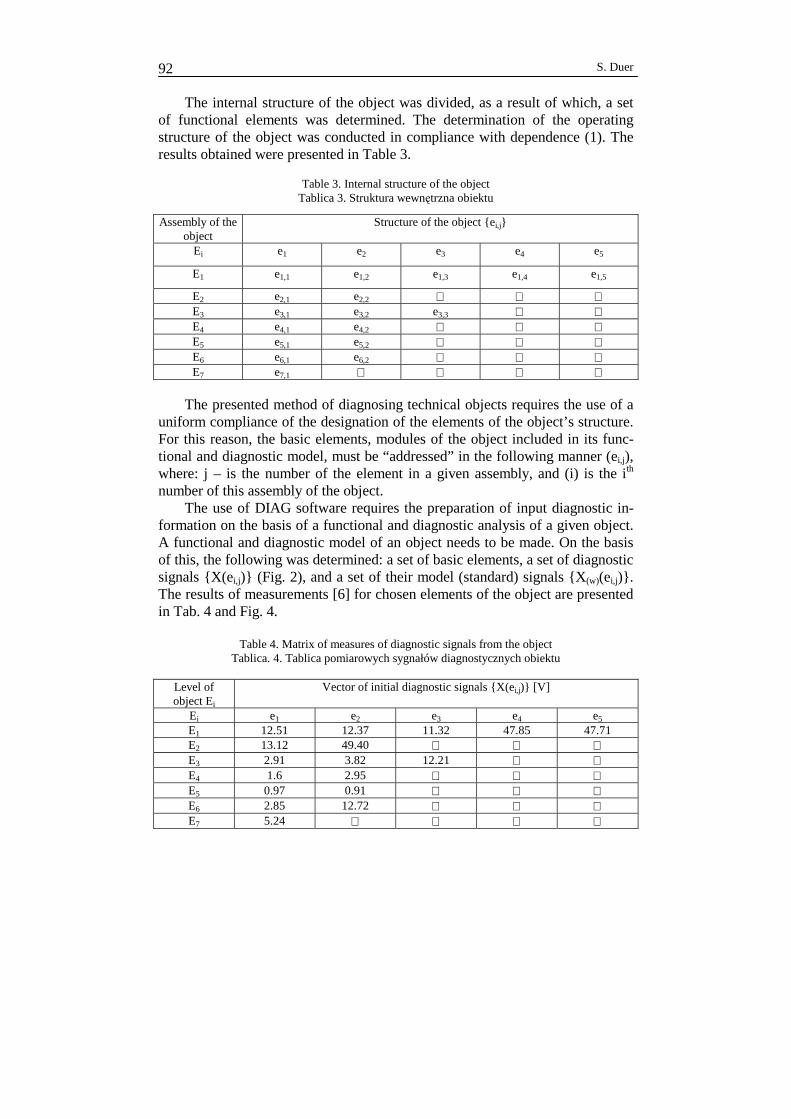
S. Duer 92
The internal structure of the object was divided, as a result of which, a set of functional elements was determined. The determination of the operating structure of the object was conducted in compliance with dependence (1). The results obtained were presented in Table 3.
Table 3. Internal structure of the object
Tablica 3. Struktura wewnętrzna obiektu
Assembly of the object
Structure of the object {ei,j}
Ei e1 e2 e3 e4 e5
E1 e1,1 e1,2 e1,3 e1,4 e1,5
E2 e2,1 e2,2 ∅ ∅ ∅ E3 e3,1 e3,2 e3,3 ∅ ∅ E4 e4,1 e4,2 ∅ ∅ ∅ E5 e5,1 e5,2 ∅ ∅ ∅ E6 e6,1 e6,2 ∅ ∅ ∅ E7 e7,1 ∅ ∅ ∅ ∅
The presented method of diagnosing technical objects requires the use of a
uniform compliance of the designation of the elements of the object’s structure. For this reason, the basic elements, modules of the object included in its func-tional and diagnostic model, must be “addressed” in the following manner (ei,j), where: j – is the number of the element in a given assembly, and (i) is the ith number of this assembly of the object.
The use of DIAG software requires the preparation of input diagnostic in-formation on the basis of a functional and diagnostic analysis of a given object. A functional and diagnostic model of an object needs to be made. On the basis of this, the following was determined: a set of basic elements, a set of diagnostic signals {X(ei,j)} (Fig. 2), and a set of their model (standard) signals {X(w)(ei,j)}. The results of measurements [6] for chosen elements of the object are presented in Tab. 4 and Fig. 4.
Table 4. Matrix of measures of diagnostic signals from the object
Tablica. 4. Tablica pomiarowych sygnałów diagnostycznych obiektu
Level of object Ei
Vector of initial diagnostic signals {X(ei,j)} [V]
Ei e1 e2 e3 e4 e5 E1 12.51 12.37 11.32 47.85 47.71 E2 13.12 49.40 ∅ ∅ ∅ E3 2.91 3.82 12.21 ∅ ∅ E4 1.6 2.95 ∅ ∅ ∅ E5 0.97 0.91 ∅ ∅ ∅ E6 2.85 12.72 ∅ ∅ ∅ E7 5.24 ∅ ∅ ∅ ∅
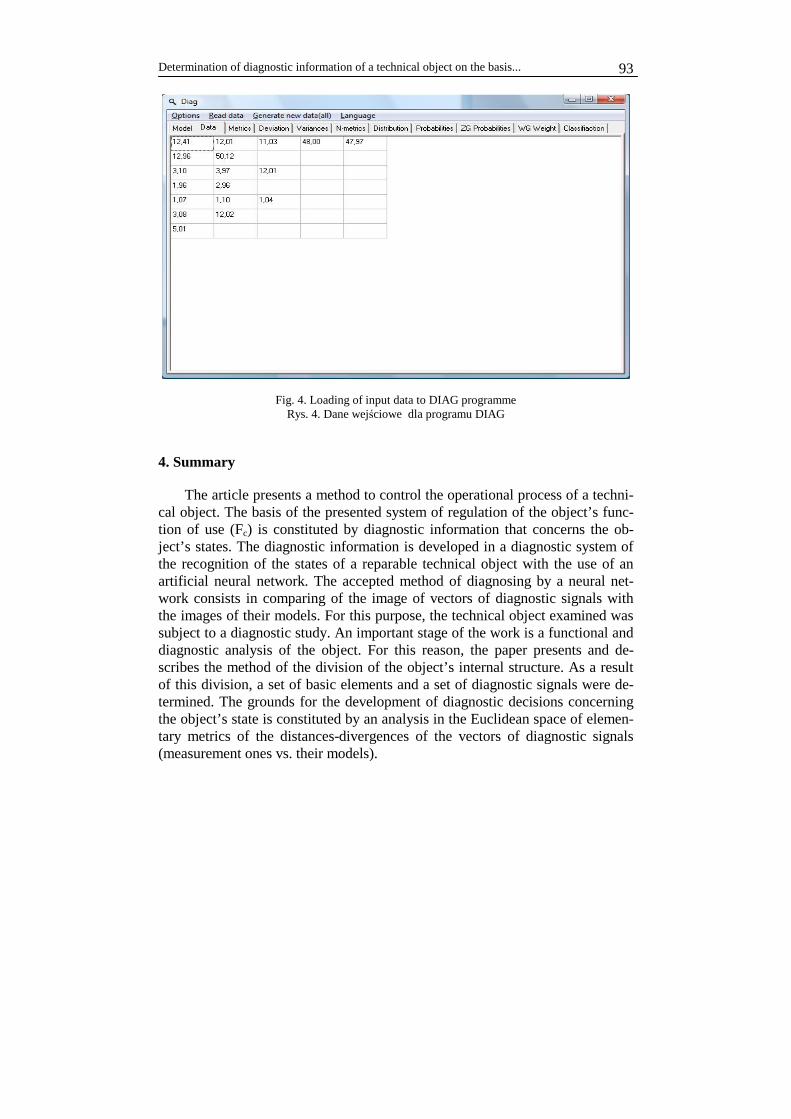
Determination of diagnostic information of a technical object on the basis...
93
Fig. 4. Loading of input data to DIAG programme Rys. 4. Dane wejściowe dla programu DIAG
4. Summary
The article presents a method to control the operational process of a techni-cal object. The basis of the presented system of regulation of the object’s func-tion of use (Fc) is constituted by diagnostic information that concerns the ob-ject’s states. The diagnostic information is developed in a diagnostic system of the recognition of the states of a reparable technical object with the use of an artificial neural network. The accepted method of diagnosing by a neural net-work consists in comparing of the image of vectors of diagnostic signals with the images of their models. For this purpose, the technical object examined was subject to a diagnostic study. An important stage of the work is a functional and diagnostic analysis of the object. For this reason, the paper presents and de-scribes the method of the division of the object’s internal structure. As a result of this division, a set of basic elements and a set of diagnostic signals were de-termined. The grounds for the development of diagnostic decisions concerning the object’s state is constituted by an analysis in the Euclidean space of elemen-tary metrics of the distances-divergences of the vectors of diagnostic signals (measurement ones vs. their models).
S. Duer 94
References
[1] Będkowski L., Dąbrowski T.: Podstawy eksploatacji cz. 2. Wyd. WAT, Warszawa 2006. [2] Duer S., Duer R.: Computer diagnostic system with expert knowledge for state’s control of
technical objects. “SYSTEM MODELLING CONTROL – SMC,2005”. Proceedings of the 11th International Conference on “System Modelling Control”, Zakopane, Poland. Wyd. EXIT, Warszawa 2005, p. 69–77.
[3] Duer S.: The concept of assistant system for analogue class technical object servicing. Sixth International Conference On Unconventional Elektromechanical And Electrical System Uees′04. Alushta, The Crimea, Ukraine, 2004, p. 687–690.
[4] Duer S.: System ekspertowy wykorzystujący trójwartościową informację diagnostyczną wspomagający obsługiwanie złożonego obiektu technicznego. Zagadnienia Eksploatacji Maszyn Z. 4(152) VOL. 42, 2007, pp. 195–208.
[5] Duer S.: An algorithm for the diagnosis of reparable technical objects utilizing artificial neural Network. Journal Scientific Problems Of Machines Operation And Maintenance, Committee Of Machine Engineering Polish Academy Of Sciences. Vol. 43, No. 1(53) 2008, pp. 101–113.
[6] Duer S., Duer R., Duer P., Płocha I.: Measurement system for the diagnosis of analogue technical objects with the use of artificial neural networks. Academic Journals, Poznan Uni-versity of Technology, s. Electrical Engineering, 2008 (in publishing).
[7] Białko M.: Podstawowe właściwości sieci neuronowych i hybrydowych systemów eksper-towych. Wydawnictwo Politechniki Koszalińskiej, Koszalin 2000.
[8] Buchannan B., Shortliffe E.: Rule – Based expert systems. Addison – Wesley Publishing Company 1985.
[9] Hayer-Roth F., Waterman D., Lenat D.: Building expert systems. Addison – Wesley Publish-ing Company 1983.
[10] Waterman D.: A guide to export systems. Addison – Wesley Publishing Company 1986.
Manuscript received by Editorial Board, March 03th, 2009.
Wyznaczanie informacji diagnostycznej obiektu technicznego na podstawie analizy funkcjonalno-diagnostycznej na przykładzie silnika samochodowego
S t r e s z c z e n i e
W pracy zaprezentowano metodę wyznaczania specjalistycznej bazy wiedzy obiektu technicznego na podstawie analizy funkcjonalno-diagnostycznej, z wykorzystaniem trójwartościowej informacji diagnostycznej. Zaprezentowano także ogólny schemat złożonego obiektu technicznego, opisano jego strukturę wewnętrzną. Wykonano analizę diagnostyczną, w efekcie której wyznaczono zbiory ele-mentów funkcjonalnych obiektu i ich sygnały diagnostyczne. Zaprezentowano także metodykę wyk-onywania opracowania diagnostycznego obiektu technicznego, w efekcie którego opracowano model funkcjonalno-diagnostyczny, będący podstawą do wyznaczenia wstępnej informacji diagnostycznej, którą wyznaczają zbiory informacji, dotyczące elementów podstawowych-modułów i ich sygnałów wyjściowych.
Uzyskane rezultaty teoretyczne w pracy zweryfikowano praktycznie na przykładzie systemu sterowania pracą silnika benzynowego. Badany obiekt jest złożonym i naprawialnym obiektem technicznym. Należy on do tej grupy urządzeń technicznych, dla których wymagany jest krótki czas ich przestojów (użytkowanie nieefektywne obiektu).

SCIENTIFIC PROBLEMS OF MACHINES OPERATION AND MAINTENANCE
4 (156) 2008
BOGDAN ŻÓŁTOWSKI*
Diagnostic investigations of critical technical systems
K e y w o r d s
Diagnostic system, technical condition, safety, comfort, dynamic state.
S ł o w a k l u c z o w e
System diagnostyczny, stan techniczny, bezpieczeństwo, komfort, stan dynamiczny.
S u m m a r y
This article shows the results obtained during the implementation of a portable diagnosis system to the maintenance routines of the passenger transport vehicles and permanent track of the Metro train, which made it possible to evaluate such aspects as safety, comfort, and the technical condi-tion of the track-vehicle interphase. The reports given in this evaluation allowed the identification and the arrangement of the track sections according to its technical condition, thus relating the track and vehicle condition parameters to the estimators connected with the passenger transport vehicle dynamics.
1. Introduction
The manufacturers of the means of railway transport invest vast amounts of money in the construction of fast, safe, comfortable, and efficient passenger transport vehicles. The methods and means of modern technical diagnostics allow maintaining the ability of the means of railway transport through constant monitoring of their technical state. They also allow examining the performance of requirements determined for the means of railway transport in the range of effective safety and comfort standards.
* University of Technology and Life Sciences, 85-796 Bydgoszcz, ul. Prof. S. Kaliskiego 7, Poland,
tel. 052 3408283, [email protected]
DIAGNOSTICS •

B. Żółtowski 96
Accepting the vibration signal as the basis of the description and examina-tion of the dynamic state changes of the railway transport system at work, the state of operation, safety and comfort, state changes of chosen assemblies of the railway system, and state changes of the foundation and railway tracks were evaluated.
During the realisation of separate tasks in this work, we used the available, and newly created, procedures for diagnostic signal acquisition and processing for state evaluation. We also created and practically verified the method of measuring point selection for vibration diagnostics, proposed modernised pro-cedures in the range of diagnostic sensitivity examination and boundary value determination for measured signals, verified chosen diagnostic models, and analysed chosen prognosis methods for the needs of the next diagnosis date determination.
In the range of statistic handling of measuring data, we used available but modernised procedures of MATLAB, EXCELL, STATGRAPHIC software, ex-amining the correlations, regressions, decompositions, models – everything at the stage of making diagnostic conclusions. For the detection and location of dam-ages, we used new procedures of the Principal Component Analysis (PCA) meth-odology and the Singular Value Decomposition (SVD) method [3, 7, 8, 11].
Fig. 1. Cars of metro train on the route Rys. 1. Pojazdy pociągu metra na trasie
The length of the power engine is about 22.8 m. All the vehicles have the
width of 3.2 m and height of 3.8 m (the height to the roof without the panto-graph). Each car of the vehicle is based on two trucks of two axles through four pneumatic cushions, which maintain the settled height of the vehicle regardless of the load. Two trucks of the power engines have a power transmission system on each axle, consisting of a transmission and an electric engine, the latter being hung on a special construction. The supply of compressed air to the unit consist-ing of three individual cars is realised by a piston compressor. Each car is con-nected with a short connector that can be removed in a workshop. One connec-tor with a bumper is placed at the end of a car, which allows connecting cars into sets. The damages to the wheels of a railway system most often undergo ability tests in the effective planning-preventing exploitation system. The super-vision of the technical state of wheel-rail system has the following parameters:
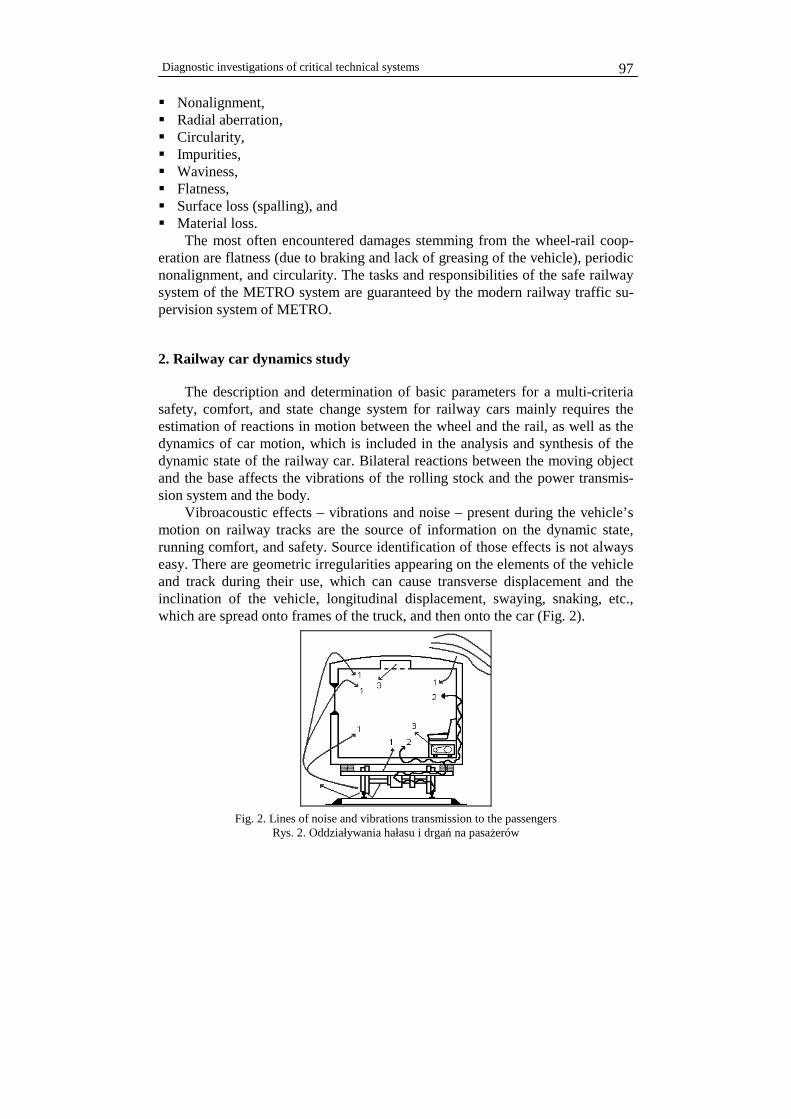
Diagnostic investigations of critical technical systems
97
! Nonalignment, ! Radial aberration, ! Circularity, ! Impurities, ! Waviness, ! Flatness, ! Surface loss (spalling), and ! Material loss.
The most often encountered damages stemming from the wheel-rail coop-eration are flatness (due to braking and lack of greasing of the vehicle), periodic nonalignment, and circularity. The tasks and responsibilities of the safe railway system of the METRO system are guaranteed by the modern railway traffic su-pervision system of METRO.
2. Railway car dynamics study
The description and determination of basic parameters for a multi-criteria safety, comfort, and state change system for railway cars mainly requires the estimation of reactions in motion between the wheel and the rail, as well as the dynamics of car motion, which is included in the analysis and synthesis of the dynamic state of the railway car. Bilateral reactions between the moving object and the base affects the vibrations of the rolling stock and the power transmis-sion system and the body.
Vibroacoustic effects – vibrations and noise – present during the vehicle’s motion on railway tracks are the source of information on the dynamic state, running comfort, and safety. Source identification of those effects is not always easy. There are geometric irregularities appearing on the elements of the vehicle and track during their use, which can cause transverse displacement and the inclination of the vehicle, longitudinal displacement, swaying, snaking, etc., which are spread onto frames of the truck, and then onto the car (Fig. 2).
Fig. 2. Lines of noise and vibrations transmission to the passengers Rys. 2. Oddziaływania hałasu i drgań na pasażerów

B. Żółtowski 98
For the dynamic analysis of railway cars in specific exploitation conditions, different complex computer programs have been used, such as Vampire, Ad-ams/Rail, Gensys, Simpack, and Miniprof Wheel And Rail (Fig. 3).
Fig. 3. Example of dynamic modelling for railway engineering Rys. 3. Przykłady modelowania dynamiki pojazdow szynowych
Fig. 4 shows complex computer models created and used for the running
dynamics analysis of a railway car.
Fig. 4. Computer models for train dynamics testing
Rys. 4. Komputerowe modelowanie dynamiki wagonu
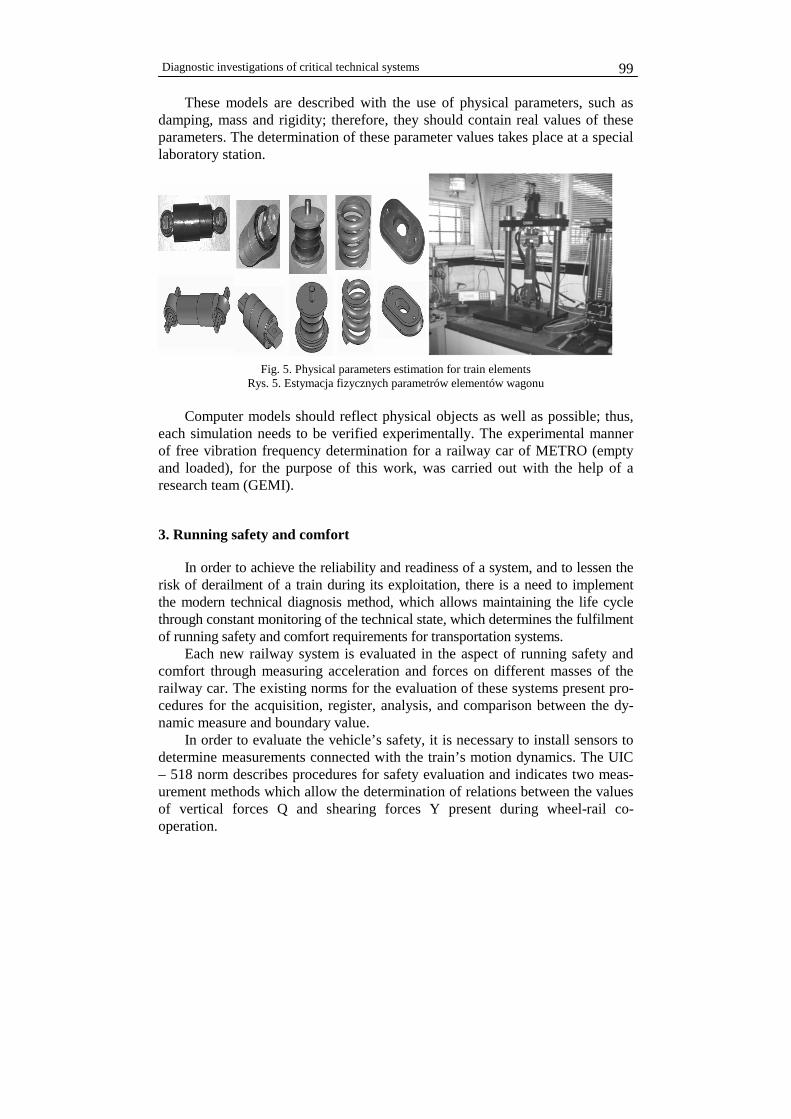
Diagnostic investigations of critical technical systems
99
These models are described with the use of physical parameters, such as damping, mass and rigidity; therefore, they should contain real values of these parameters. The determination of these parameter values takes place at a special laboratory station.
Fig. 5. Physical parameters estimation for train elements Rys. 5. Estymacja fizycznych parametrów elementów wagonu
Computer models should reflect physical objects as well as possible; thus,
each simulation needs to be verified experimentally. The experimental manner of free vibration frequency determination for a railway car of METRO (empty and loaded), for the purpose of this work, was carried out with the help of a research team (GEMI).
3. Running safety and comfort
In order to achieve the reliability and readiness of a system, and to lessen the risk of derailment of a train during its exploitation, there is a need to implement the modern technical diagnosis method, which allows maintaining the life cycle through constant monitoring of the technical state, which determines the fulfilment of running safety and comfort requirements for transportation systems.
Each new railway system is evaluated in the aspect of running safety and comfort through measuring acceleration and forces on different masses of the railway car. The existing norms for the evaluation of these systems present pro-cedures for the acquisition, register, analysis, and comparison between the dy-namic measure and boundary value.
In order to evaluate the vehicle’s safety, it is necessary to install sensors to determine measurements connected with the train’s motion dynamics. The UIC – 518 norm describes procedures for safety evaluation and indicates two meas-urement methods which allow the determination of relations between the values of vertical forces Q and shearing forces Y present during wheel-rail co-operation.
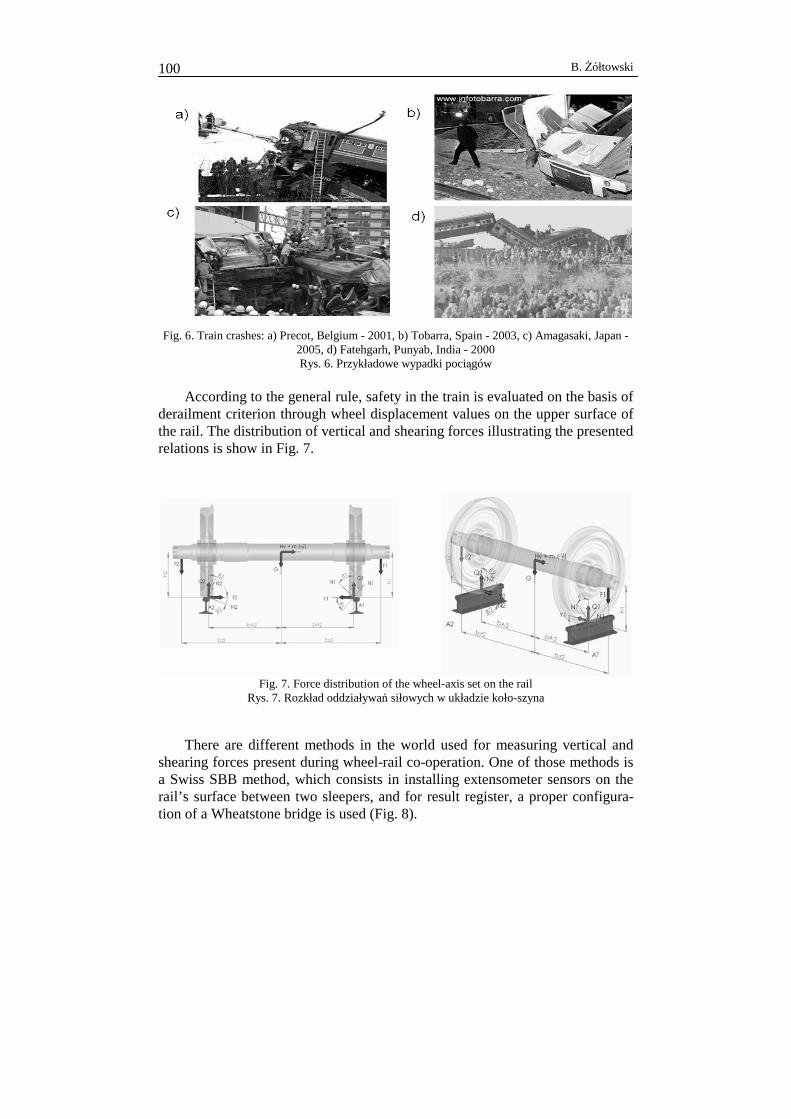
B. Żółtowski 100
Fig. 6. Train crashes: a) Precot, Belgium - 2001, b) Tobarra, Spain - 2003, c) Amagasaki, Japan - 2005, d) Fatehgarh, Punyab, India - 2000 Rys. 6. Przykładowe wypadki pociągów
According to the general rule, safety in the train is evaluated on the basis of
derailment criterion through wheel displacement values on the upper surface of the rail. The distribution of vertical and shearing forces illustrating the presented relations is show in Fig. 7.
Fig. 7. Force distribution of the wheel-axis set on the rail
Rys. 7. Rozkład oddziaływań siłowych w układzie koło-szyna
There are different methods in the world used for measuring vertical and
shearing forces present during wheel-rail co-operation. One of those methods is a Swiss SBB method, which consists in installing extensometer sensors on the rail’s surface between two sleepers, and for result register, a proper configura-tion of a Wheatstone bridge is used (Fig. 8).
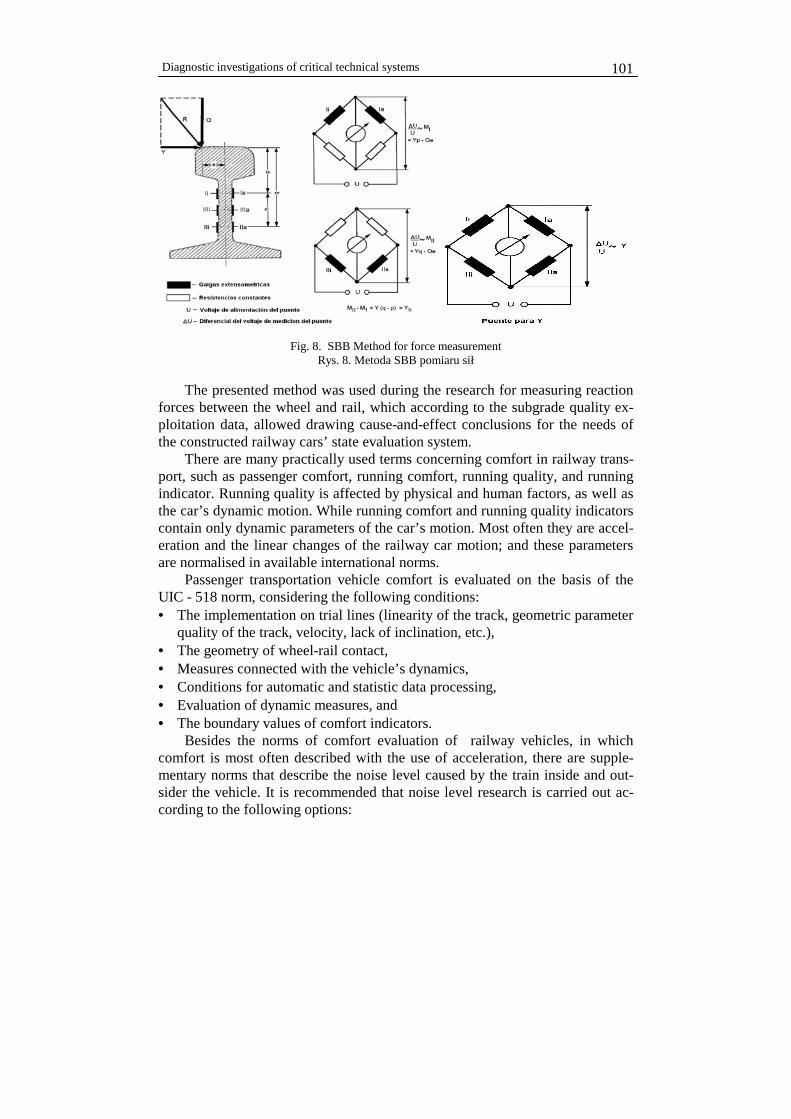
Diagnostic investigations of critical technical systems
101
Fig. 8. SBB Method for force measurement Rys. 8. Metoda SBB pomiaru sił
The presented method was used during the research for measuring reaction
forces between the wheel and rail, which according to the subgrade quality ex-ploitation data, allowed drawing cause-and-effect conclusions for the needs of the constructed railway cars’ state evaluation system.
There are many practically used terms concerning comfort in railway trans-port, such as passenger comfort, running comfort, running quality, and running indicator. Running quality is affected by physical and human factors, as well as the car’s dynamic motion. While running comfort and running quality indicators contain only dynamic parameters of the car’s motion. Most often they are accel-eration and the linear changes of the railway car motion; and these parameters are normalised in available international norms.
Passenger transportation vehicle comfort is evaluated on the basis of the UIC - 518 norm, considering the following conditions: • The implementation on trial lines (linearity of the track, geometric parameter
quality of the track, velocity, lack of inclination, etc.), • The geometry of wheel-rail contact, • Measures connected with the vehicle’s dynamics, • Conditions for automatic and statistic data processing, • Evaluation of dynamic measures, and • The boundary values of comfort indicators.
Besides the norms of comfort evaluation of railway vehicles, in which comfort is most often described with the use of acceleration, there are supple-mentary norms that describe the noise level caused by the train inside and out-sider the vehicle. It is recommended that noise level research is carried out ac-cording to the following options:
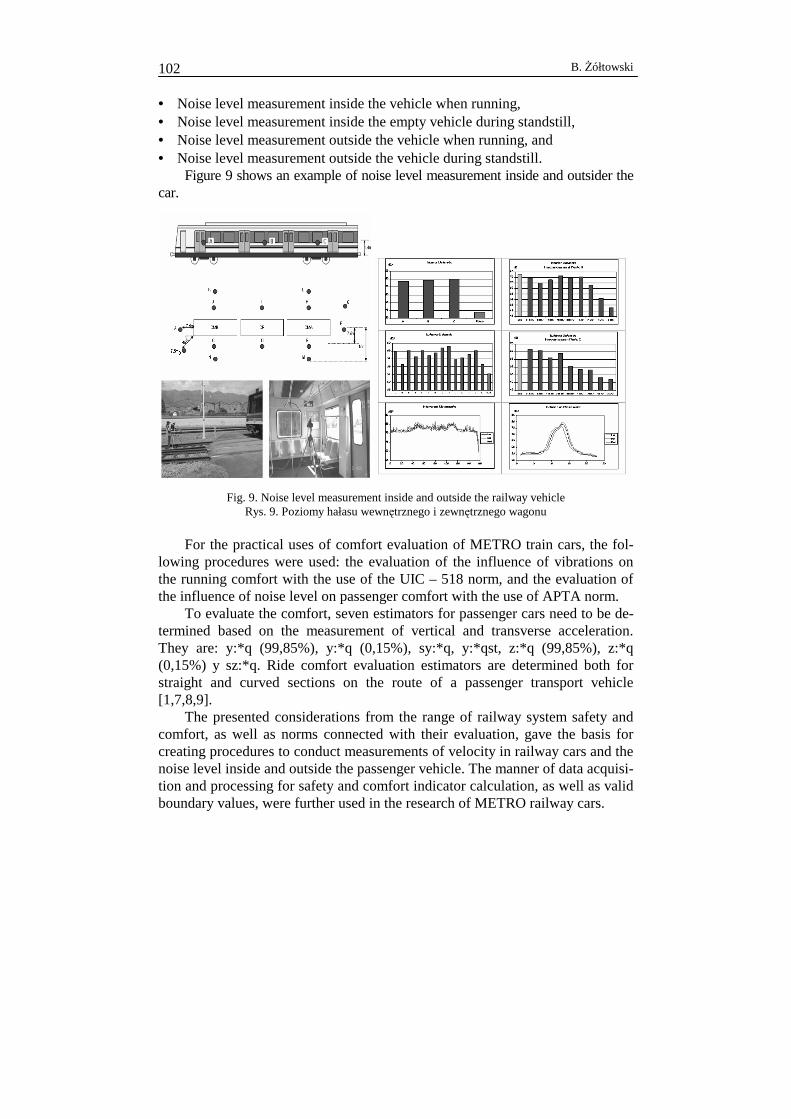
B. Żółtowski 102
• Noise level measurement inside the vehicle when running, • Noise level measurement inside the empty vehicle during standstill, • Noise level measurement outside the vehicle when running, and • Noise level measurement outside the vehicle during standstill.
Figure 9 shows an example of noise level measurement inside and outsider the car.
Fig. 9. Noise level measurement inside and outside the railway vehicle Rys. 9. Poziomy hałasu wewnętrznego i zewnętrznego wagonu
For the practical uses of comfort evaluation of METRO train cars, the fol-
lowing procedures were used: the evaluation of the influence of vibrations on the running comfort with the use of the UIC – 518 norm, and the evaluation of the influence of noise level on passenger comfort with the use of APTA norm.
To evaluate the comfort, seven estimators for passenger cars need to be de-termined based on the measurement of vertical and transverse acceleration. They are: y:*q (99,85%), y:*q (0,15%), sy:*q, y:*qst, z:*q (99,85%), z:*q (0,15%) y sz:*q. Ride comfort evaluation estimators are determined both for straight and curved sections on the route of a passenger transport vehicle [1,7,8,9].
The presented considerations from the range of railway system safety and comfort, as well as norms connected with their evaluation, gave the basis for creating procedures to conduct measurements of velocity in railway cars and the noise level inside and outside the passenger vehicle. The manner of data acquisi-tion and processing for safety and comfort indicator calculation, as well as valid boundary values, were further used in the research of METRO railway cars.

Diagnostic investigations of critical technical systems
103
4. Methodology of train cars diagnosis
The realisation of the main task of the technical diagnosis of train car sys-tem requires the determination of relations between the state features and signal parameters. Therefore, the choice of state features (necessary and available) and signals with their estimators for the examined cars has to be made. From the relations present between them, all the necessary criteria values for the safety, comfort, and system changes of the technical state are determined for the exam-ined railway system – Fig. 10.
Fig. 10. Methodology of METRO railway system testing Rys. 10. Metodologia badań systemu transportowego metra
The methodology of the conducted research is based mainly on the UIC–
518 international norm, which describes rail vehicles working conditions for safety and comfort research, such as the vehicle’s velocity, the state of the rail, the object’s dynamic and static state, etc. The research was realised in real ex-ploitation conditions of the transport system and were carried out on 16 trains. In the research, the newest methods of the measurement and description of the state of the train were used, as well as available modern means and methods for the object’s dynamic state parameter evaluation. Also, the means of the acquisi-tion, processing and diagnostic conclusion of the changeable ride quality pa-
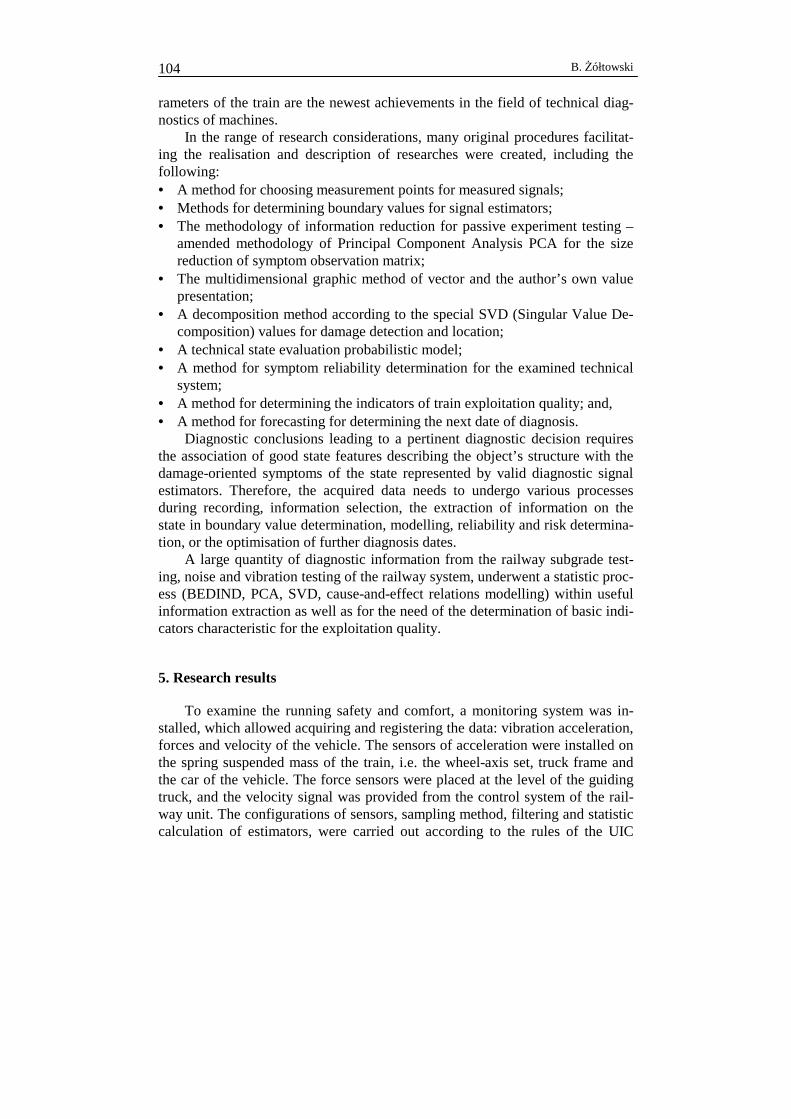
B. Żółtowski 104
rameters of the train are the newest achievements in the field of technical diag-nostics of machines.
In the range of research considerations, many original procedures facilitat-ing the realisation and description of researches were created, including the following: • A method for choosing measurement points for measured signals; • Methods for determining boundary values for signal estimators; • The methodology of information reduction for passive experiment testing –
amended methodology of Principal Component Analysis PCA for the size reduction of symptom observation matrix;
• The multidimensional graphic method of vector and the author’s own value presentation;
• A decomposition method according to the special SVD (Singular Value De-composition) values for damage detection and location;
• A technical state evaluation probabilistic model; • A method for symptom reliability determination for the examined technical
system; • A method for determining the indicators of train exploitation quality; and, • A method for forecasting for determining the next date of diagnosis.
Diagnostic conclusions leading to a pertinent diagnostic decision requires the association of good state features describing the object’s structure with the damage-oriented symptoms of the state represented by valid diagnostic signal estimators. Therefore, the acquired data needs to undergo various processes during recording, information selection, the extraction of information on the state in boundary value determination, modelling, reliability and risk determina-tion, or the optimisation of further diagnosis dates.
A large quantity of diagnostic information from the railway subgrade test-ing, noise and vibration testing of the railway system, underwent a statistic proc-ess (BEDIND, PCA, SVD, cause-and-effect relations modelling) within useful information extraction as well as for the need of the determination of basic indi-cators characteristic for the exploitation quality.
5. Research results
To examine the running safety and comfort, a monitoring system was in-stalled, which allowed acquiring and registering the data: vibration acceleration, forces and velocity of the vehicle. The sensors of acceleration were installed on the spring suspended mass of the train, i.e. the wheel-axis set, truck frame and the car of the vehicle. The force sensors were placed at the level of the guiding truck, and the velocity signal was provided from the control system of the rail-way unit. The configurations of sensors, sampling method, filtering and statistic calculation of estimators, were carried out according to the rules of the UIC

Diagnostic investigations of critical technical systems
105
international norm. The measurement on each passenger vehicle was carried out in real exploitation conditions, where the monitoring system continuously regis-tered data from different journeys of trains (Fig. 11).
Fig. 11. Measurement System for evaluating the safety and comfort of METRO vehicles Rys. 11. System pomiarowy bezpieczeństwa i komfortu jazdy pociągów metra
For the research, the following data acquisition elements were used:
• 4 force sensors HBM U2B/100; • 8 one-way acceleration sensors HBM B12/500; • MGC Plus equipment of the HBM company; • 8 interface cards between MGC Plus and CATMAN program type AP810; • 4 cards for processing data from force sensors, type ML801; • A current generator of 110-220VAC 1KVA; • A voltage regulation system UPS 120Vac/60Hz; • A computer with CATMAN (5.0 R3) software of the HBM company.
The above elements allow acquiring very complex information necessary to implement the UIC-518 norm in the examined railway system. As the result of UIC-518 norm implementation, statistical reports on the car’s safety and com-fort evaluation, as well as the track usage, have been created [2, 4, 8, 10, 12]. Example results of the research are shown in the Fig. 12.
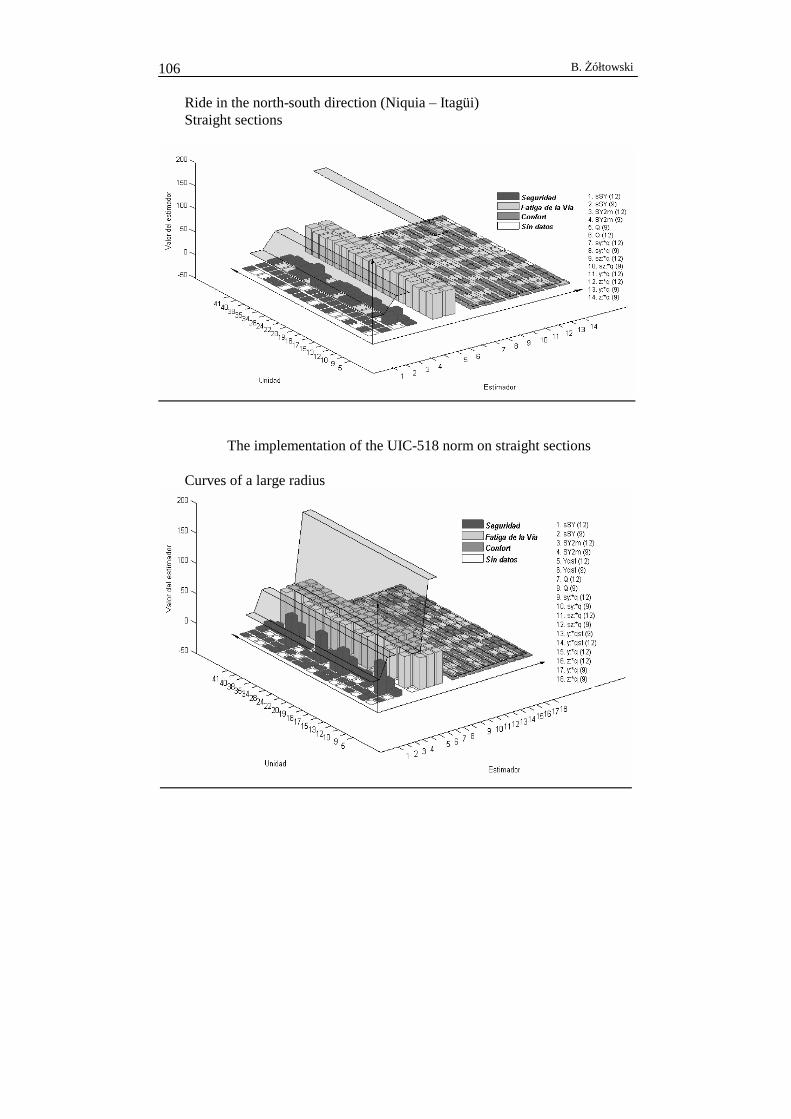
B. Żółtowski 106
Ride in the north-south direction (Niquia – Itagüi) Straight sections
The implementation of the UIC-518 norm on straight sections Curves of a large radius
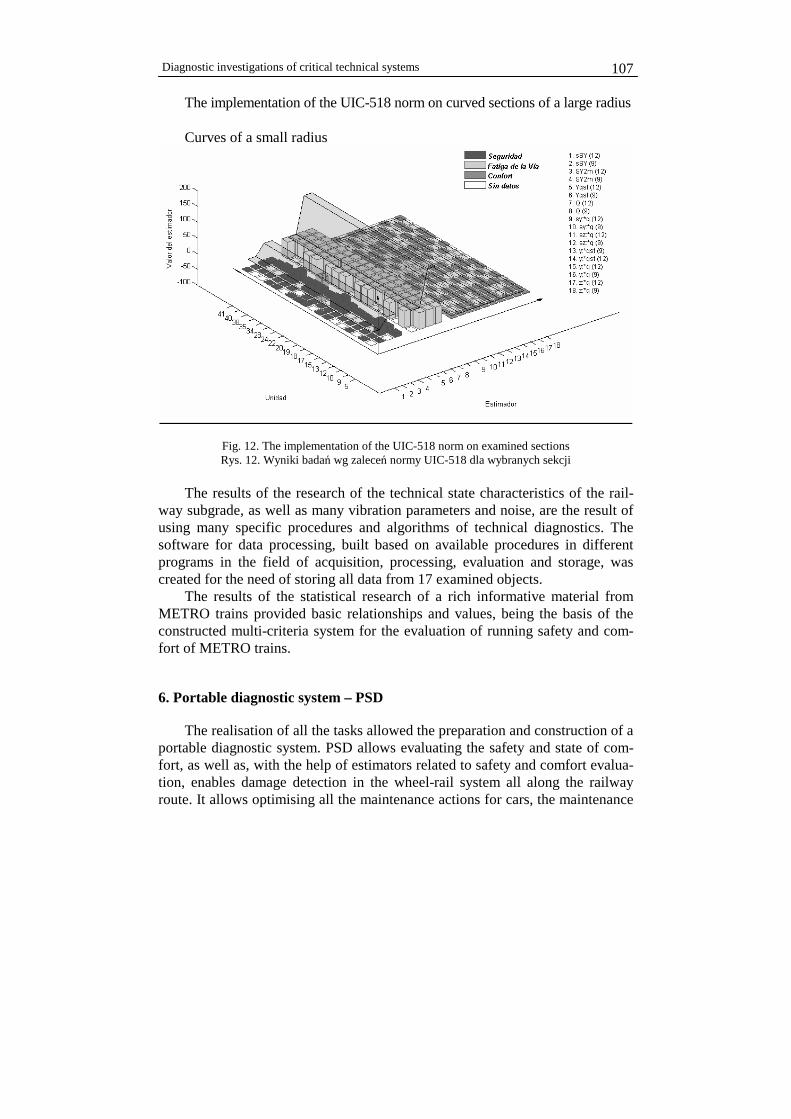
Diagnostic investigations of critical technical systems
107
The implementation of the UIC-518 norm on curved sections of a large radius Curves of a small radius
Fig. 12. The implementation of the UIC-518 norm on examined sections Rys. 12. Wyniki badań wg zaleceń normy UIC-518 dla wybranych sekcji
The results of the research of the technical state characteristics of the rail-
way subgrade, as well as many vibration parameters and noise, are the result of using many specific procedures and algorithms of technical diagnostics. The software for data processing, built based on available procedures in different programs in the field of acquisition, processing, evaluation and storage, was created for the need of storing all data from 17 examined objects.
The results of the statistical research of a rich informative material from METRO trains provided basic relationships and values, being the basis of the constructed multi-criteria system for the evaluation of running safety and com-fort of METRO trains.
6. Portable diagnostic system – PSD
The realisation of all the tasks allowed the preparation and construction of a portable diagnostic system. PSD allows evaluating the safety and state of com-fort, as well as, with the help of estimators related to safety and comfort evalua-tion, enables damage detection in the wheel-rail system all along the railway route. It allows optimising all the maintenance actions for cars, the maintenance

B. Żółtowski 108
of the track, wheel-rail system co-operation evaluation, giving premises to use the strategy in accordance to the technical state [1, 3, 9].
PSD connected with the central traffic control system is a system managing all the information connected with the maintenance of the technical state of the cars, wheel-rail system, track, and the whole railway system in general. Saved in the PSD, the history of the state of all the straight and curved sections as well as the wheels of the passenger vehicle, allows analysing the data, comparing them to the measured estimators boundary values, forecasting state changes and re-lated operations, maintenance, and investment.
The construction of PSD stems from the range of tasks to be realised and diagnosis procedures based on the UIC–518 international norm which possesses all the procedures for passenger transport vehicle testing from the point of view of its dynamic behaviour for track wear evaluation, and the safety and comfort of the ride in natural conditions. Modules of which PSD is made are as follows: • Sensors module, • Signal processing module, • Safety and comfort evaluation module, • Wheel-rail technical state evaluation module, • Damage detection module, • Auxiliary decision-making module, • Forecast module, and • Presentation module.
For example, the damage detection module in PSD contains the following tools: • Monitoring the values of safety and comfort estimators, • Monitoring the values of frequencies which describe wheel-rail co-operation, • The detection of maximal forces on the tested track, and • Monitoring the values of shearing forces generated by railway switches on
the passenger vehicle. The decision-making module is based on the analysis of the correlation be-
tween the UIC–518 norm estimators, which evaluate the comfort and safety of the vehicle, and the track’s geometric parameters for the tested railway system. The module additionally receives information provided from the safety and comfort evaluation module and wheel-rail technical state evaluation module. This module distinguishes track sections that do not meet the requirements of running safety and comfort in the face of requirements stated by the UIC–518 norm.
The presentation module is an interface between the user and the PSD sys-tem. All the information from separate modules is placed there. It is connected to the traffic control system in the company. The module is a safety system that has access to the database, data loading forms, user help, reports, and report generation in Spanish and English.

Diagnostic investigations of critical technical systems
109
Fig. 13 shows the initial PSD screen where the upper window allows access to all of the modules and functions. The program has a safety system which, through the necessity of giving one’s name and password, does not allow unau-thorised personnel to access the program.
Fig. 13. PSD main screen Rys. 13. Widok ogólny
PSD is the basic tool for strategy implementation according to the technical state in the METRO enterprise.
The suggested METRO railway technical state research system, has been adjusted to the exploitation natural conditions; and it uses estimators both ad-vised by the UIC–518 norm and new vibration state estimators. Also, the final product of the work, in the form of the portable diagnostic system, implemented in the METRO railway exploitation system, allows the implementation of the exploitation of the diagnostic system in METRO enterprise.
7. Summary
In the research of this work, we considered the problem of creating and practically verifying an evaluation system for running safety and comfort of METRO trains. The created evaluation system strays in its range from the re-quirements of the UIC-518 norm in the field of requirements concerning the conditions of research performance and range. In this work, we have performed the evaluation of motion safety and running comfort due to the requirements of the UIC-518 norm for railway vehicles in real usage conditions, and not on spe-cial rails or fields proposed by the manufacturers of these transportation sys-tems.
B. Żółtowski 110
The proposed system of state examination of METRO was adjusted to real exploitation conditions, and it uses both new estimators of the state of vibration and those recommended by the UIC-518 norm. Furthermore, the final product of this work, in the form of a portable diagnostic system implemented into the ex-ploitation system of METRO trains, allows the introduction of the exploitation diagnostic system into the METRO enterprise in Medellin.
The realisation of detailed tasks of the presented procedures allowed the creation of a multi-criteria system for the evaluation of the state evaluation of METRO trains.
References
[1] Castaneda L.: Monitoreo Multidimensional de la Interfase Vía-Vehículo de un Sistema Ferroviario. Congreso Internacional de Mantenimiento – ACIEM – 2007, Bogotá, Colom-bia.
[2] Castaneda L., F.: Multicriterial system for evaluating the safety and comfort in railway vehi-cles. Ph.D. thesis, UTP, Bydgoszcz 2007.
[3] Żółtowski B.: The Fundamentals of Machine Diagnostics (in Polish). ATR, Bydgoszcz 1997.
[4] Żółtowski B., Castaneda L.: Portable diagnostic system for the metro train. Diagnostyka, nr 1(37), Olsztyn 2006, pp. 39–44.
[5] Żółtowski B.: Energetic Measures in Machine Diagnostics (in Polish). BALTECHMASZ, Kaliningrad, 2006, pp. 290–302.
[6] Żółtowski B.: Diagnostic system for the metro train. ICME, Science Press, Chengdu, China, 2006, pp. 337–344.
[7] Żółtowski B., Castaneda L.: Sistema Portail de Diagnostico para el Sistema Metro de Medel-lin. VIII Congresso International de Mantenimiento, Bogota, Columbia 2006.
[8] Pantopian N.H., Larsen, J., Unsupervised condition detection in large diesel engines, Pro-ceedings of the IEEE Workshop on Neural Networks, 1999.
[9] Deng J-L.: Control Problems of Grey Systems, Systems and Control Letters, Vol. 1, No 5, North Holland, Amsterdam, 1982.
[10] Deng J-L.: Introduction to grey system theory, The Journal of Grey System, 1989, Vol. 1, No 1, pp. 1–24.
[11] Wen K.L., Chang T.C.: The research and development of completed GM(1,1) model toolbox using Matlab, International Journal of Computational Cognition, 2005, Vol. 3, No 3, pp. 42–48.
[12] Yao A.W.L., Chi S.C.: Analysis and design of a Taguchi-Grey based electricity demand predictor for energy management systems, Energy Conversion & Management, 2004, Vol. 45, pp. 1205–1217.
Manuscript received by Editorial Board, July 22th, 2008.

Diagnostic investigations of critical technical systems
111
Badania diagnostyczne krytycznych systemów technicznych
S t r e s z c z e n i e
Artykuł ten pokazuje opracowane procedury i wyniki uzyskane podczas wprowadzenia prze-nośnego systemu diagnostycznego do systemu utrzymania pojazdów pasażerskich i trwałości szlaku pociągów metra. System diagnostyczny umożliwia ocenę takich aspektów ruchu, jak: bez-pieczeństwo, komfort psychiczny i stan techniczny wagonów pojazdu kolejowego. Sprawozdania oddają ocenę stanu oraz identyfikację i utrzymanie zdatności sekcji szlaku, zgodnie z jego stanem technicznym, wykazując w ten sposób stan szlaku i parametry ruchu pojazdu za pomocą estyma-torów związanych z dynamiką ruchu pojazdów pasażerskich.


![SCIENTIFIC PROBLEMS OF SCIENCES OF MACHINES ...t.tribologia.org/plik/spm/spmom-10v45n1_p-all.pdf(MoDTP) and dialkyldithiocarbamates (MoDTC) are most widely used in practice [4,5]](https://img.pdfslide.us/doc/110x75/606650837cd7553e843160bc/scientific-problems-of-sciences-of-machines-t-modtp-and-dialkyldithiocarbamates.jpg)