Embed Size (px)
Citation preview
POLISH POWER SECTOR RIDING ON THE WAVE OF MEGATRENDS
— WARSAW, JANUARY 2016
Forum for Energy Analysis: Joanna Maćkowiak-Pandera PhD, Jan Rączka PhD, Maciej Bukowski PhD.
The aim of the Forum for Energy Anlysis isto conduct a dialogue focused on the power sector that is open to the diverse opinions of all stakeholders in Poland, based on analysis- orientated strategic thinking about the upcoming key challenges in the sector.
Financed by the European Climate Foundation
www.FAE.org.pl
Authors’ team
Edited by Deloitte Advisory Sp. z o.o.:Irena PicholaArtur ŚwiętanowskiRafał Rudzki Magdalena DembińskaMonika WalenckaMarcin HeydelKarolina WojtasiakCooperation:Paweł Smoleń – ERBUD SAAgata Staniewska – Konfederacja LewiatanJanusz Bil – RAMBOLL PolskaWojciech Kość – Cleantech Poland
Introduction
Dear All,
Numerous countries in Europe and worldwide have been transforming their energy systems under the increasing influence of so-called “megatrends”. Megatrends are major and permanent changes of social, economic, technological or political nature that affect societies, governments, and econo-mies of particular countries. They form slowly but when accelerated, they are irreversible. Globaliza-tion, digitalization, and automation are examples of megatrends people experience every day.
Together with experts, we have identified the most important megatrends in the European energy sector. They include, among other things: the decreasing costs of renewable energy generation, reduction of the negative impacts of power generation on human health and global climate, the changing role of coal, and emerging, new business models in the energy sector. You may disagree with the direction of these megatrends, but they have to be taken into consideration when drawing up strategic papers and taking decisions relating to the energy sector with a perspective up to the year 2050.
The first two years after elections is a good time to adopt certain reforms and decisions regarding a long-term strategy for the Polish energy sector. It is a special time – a global agreement to limit climate change has been finally reached in Paris, Europe has identified goals for the energy sector to be achieved by 2030, and the Energy Union has been specifying detailed solutions. At the same time, there are many question marks in Polish power policy. How to ensure resource adequacy in the changing energy market? Should European electricity markets be fully integrated? What will be the role of Polish coal in the future economy? Do we want renewable energy sources to be developed? What should the European compromise look like when it comes to energy issues?
It is crucial to draw up a realistic plan for the development of the energy sector based on the new „Energy Policy of Poland up to 2050” if the economy is to grow. The modernization of the energy sector may boost this growth. We hope our analysis will constructively contribute to this debate.
Yours faithfully,
Joanna Maćkowiak-PanderaChief of the Forum for Energy Analysis

CONTENTS
Introduction ............................................................................................6
1. Emission reduction .............................................................................. 8
1.1. Growing importance of emission reductions in EU laws and regulations and their consequences for Poland ..................................9
1.2. The growing importance of low-stack emissions and air pollution reductions in EU legislation ............................................................ 12
2. Development of renewable energy (RES) technologies and technical capabilities of power generation ...................................... 14
2.1. Change in RES power generation costs ............................................16
2.2. Energy storage ............................................................................. 17
2.3. Advancing prosumer energy .......................................................... 18
3. Increased role of public decision-making and awareness ....................... 20
3.1. Rising environmental awareness and social participation ................... 20
3.2. Not In My Backyard (NIMBY) .......................................................... 21
3.3. Micro-generation: prosumers ....................................................... 22
4. Declining importance of coal and other fossil fuels ................................ 23
4.1. Future of coal in the Polish energy mix............................................ 23
4.2. Coal gap ................................................................................... 28
5. Improving energy efficiency ................................................................ 29
5.1. Decreasing energy intensity of GDP ................................................ 30
5.2. Limiting energy intensity in industry and construction ...................... 32
6. New business models and the role of traditional energy companies .......... 33
6.1. Competition in the energy sector – from TPA to micro-generation and distributed systems ................................................................. 33
6.2. Traditional energy companies in the light of change ......................... 35
7. Conclusions ..................................................................................... 37
Bibliography .......................................................................................... 40
FORUM FOR ENERGY ANALYSIS
6 INTRODUCTION
INTRODUCTIONElectrification has had a profound influence over living standards. Probably not since the earliest days of electrification, however, has the power sector received the kind of public and media atten-tion it is receiving now.
Contemporary discussions on the energy sector concern the shape of the energy sector, what fuel sources it should rely upon, and how the sector should develop. These topics hit the front page of newspapers and find us on the Internet almost every day, despite the fact that energy prices and power availability have always been as crucial to the economy as interest rates and the supply of raw materials. Further to the point, in the summer of 2015, Poland experienced electricity power cuts and introduced energy rationing, a problem that the country had not experienced for three decades.
“What exactly is the power sector all about and where it is headed?” is the question to which per-plexed and sometimes ill-informed citizens have increasingly sought answers. Like many answers to complex problems, solutions are complicated because the European and Polish power sectors are interdependent. The multi-dimensional upheavals that the power sector has suffered from in recent years constitute a major shift. As early as in December 2013, The Economist, wrote1 that over a five-year period, between 2008 and 2012, the top 20 electric utilities’ value fell in half from a high of roughly €1 trillion to close to €500 billion. The trend continues and European energy utilities are writing off billions of euros worth of impairment losses on their generation assets.
In 2015, the results of the test for impairment of generation assets for Poland’s biggest company in the power sector, Polska Grupa Energetyczna, indicated a loss of value to the amount of 8.8 billion PLN (€2 billion), a write off that mainly concerned lignite power generation assets. The total valuation of PGE’s generation assets dropped from 29.3 billion PLN to 20.5 billion PLN (a decrease of €2.1 billion). In the last 12 months, the company’s shares have lost almost 32% of their value and almost 42% compared to the stock price at which PGE debuted on the Warsaw Stock Exchange in 2009 (as of 16 October 2015). Other companies in the sector are expected to be facing similar challenges.
Because the profitability of the current power generation operating model has fallen significantly, most European power utilities have invested less in the sector. We do not know whether this is a permanent shift, and when and at what level the trend is going to continue.
We used to predict the future of the power sector based on technical and economic analyses. We would look at the kind of fuel resources a particular country has, in what geological conditions re-sources can be found, and which mining & generation technologies are the cheapest to deploy. Now we know that a lot of fossil fuel reserves may stay underground indefinitely, despite their geologi-cal attractiveness, while a number of cheaper technologies are being replaced by those that are at present more expensive. What is the reason behind this?
We believe that the question can be answered by analysing social, political, technological and eco-nomic global trends, sometimes referred to as megatrends. The term which was popularized by John Naisbitt involves multidimensional transformation phenomena that have a wide-ranging influence on our lives. Megatrends include, for example, economic globalisation and the transition from an industrial society to an information society.
1 How to lose half a trillion euros, The Economist, http://www.economist.com/news/briefing/21587782-europes-electric-ity-providers-face-existential-threat-how-lose-half-trillion-euros (access: 05/09/2015).
Polish power sector riding on the wave of megatrends
7INTRODUCTION
Today, when speaking of megatrends, we mean long-term phenomena upon which activities carried out by states and economic entities have negligible effect. The trends are so strong and seemingly independent of public discourse and political action, that there is little chance they shall be reversed. Megatrends are impossible to ignore, and should be viewed as crucial contributors to reshaping the environment in which we are living.
To illustrate, we believe that decisions to open new energy resource mines will no longer be based on the criteria that we are accustomed to considering in our planning efforts, namely geological and economic attractiveness or new and attractive job prospects. These arguments may well be in favour of opening a mine, yet the project is not going to be completed, especially if the local com-munity opposes. And European societies are showing less and less support for such investments. It is a brand new phenomenon – never before have communities had so considerable and effective an impact on the environment they are living in.
Public sentiment is shifting away from conventional energy sources towards renewable power. At the same time support for subsidising renewables is generally growing. Our report will discuss this social megatrend as it is reckoned with in the world of politics, which needs to pay heed to social preferences and hence the preferences of the voters.
We will focus on those trends that we believe are of the utmost importance and yet are undervalued in the Polish discourse on energy, or even concealed because of the gravity of consequences they may have.
This report does not aspire to be an exhaustive all-inclusive analysis. We purposefully sacrifice com-prehensiveness in favour of maintaining a focus on select phenomena, which cannot be overlooked, as in our opinion these trends might have the most adverse consequences.
Among other things, the report is going to analyse the NIMBY syndrome and discuss the reasons why its impacts are more significant than technology, economics and geology. We will look into the civic aspect of new energy and why it is a powerful driving force. The report will also examine the necessity to strike a balance between the new and old energy sectors and why they should collabo-rate rather than antagonize one other.
The analysis will concern the midterm, from now until the crucial year of 2030. A fifteen year time horizon is still a relatively short time for the power sector and yet the year 2030 is chosen because it is a point at which the European Union will evaluate whether it is meeting its energy and climate targets. Numerous changes are already under way and some of them have even concluded. This choice provides a framework for observations and comparisons while allowing for the input of other countries’ experiences. We are going to use such examples and adapt them to suit the Polish reality. It is quite widely acknowledged that the 2020s will see a dramatic transformation, which has already begun. There is no consensus, however, as to the nature, extent and rate of these changes.
We hope that this report will come in handy for those responsible for preparing energy scenarios for Poland, convince them of the importance of certain trends and provide them with a more solid basis for future planning. This will, in turn, translate into developing a modern, pragmatic, and, most importantly, reliable power strategy, for investors as well as society.
Paweł Smoleń
Chairman, ERBUD SA, former President of EURACOAL
FORUM FOR ENERGY ANALYSIS
8 EMISSION REDUCTION
1. EMISSION REDUCTIONMegatrend:
Cutting down on emissions and striving to reduce the environmental impact of investments, especially in the European Union, is a megatrend pursued consistently for over two decades now. It is meant to combat climate change and reduce the environmental impact of other harm-ful emissions. The trend is connected with the development model of the European Union, the growth of which is mainly driven by innovation, investment in green technologies and increasing energy efficiency. Reductions in emissions from the power sector covered by EU legislation are not only about slashing greenhouse gases (including CO2), but also limiting low-stack emissions and air pollution.
Emissions of greenhouse gases (including CO2) and ways of decreasing them have been a widely debated social and political problem for several decades. The reason behind this debate is a trend in international politics and legislation, noticeable for a couple of years now, to promote sustainable development and environmental protection, in addition to counteracting air pollu-tion and climate change. Democratic societies, especially in densely-populated Europe, are en-deavouring to improve the environment, especially the one they live in.
U.S. emission levels have been going down since 2005. In August 2015, president Obama an-nounced the Clean Power Plan – a comprehensive plan targeting a reduction of pollution from power plants by 32 per cent (from 2005 levels) till 2030.
The Five-Year Plan for the years 2011 – 2015 adopted by China defines ambitious quantitative tar-gets aiming to reduce air pollution, lower carbon intensity and energy intensity of the economy, and increase the share of power generated from non-fossil fuels in the domestic energy mix. At the end of 2014, the country announced that it will peak its CO2 emissions in 2030 and by that time it is going to generate 20% of electricity from zero-emission sources. China is now one of the countries pursuing the most decisive and comprehensive energy efficiency and renewable energy development policies in the world2.
EU Member States, however, account directly for almost 9% of global greenhouse gas emissions (European Commission 2012 data) and over 10% of global CO2 emissions3. The policy towards cutting its CO2 emissions has been pursued consistently by the European Union since it ratified the Kyoto protocol. During that period climate protection issues have gained significance, a trend reflected in numerous Community regulations. In 2005, the EU Emissions Trading Scheme came into effect, the year 2007 saw the adoption of the Energy and Climate package for 2020, and in 2014 EU climate policy objectives for 2030 were set. The aim of the emissions trading mechanism is to provide a tool for financing investment in low-emission energy.
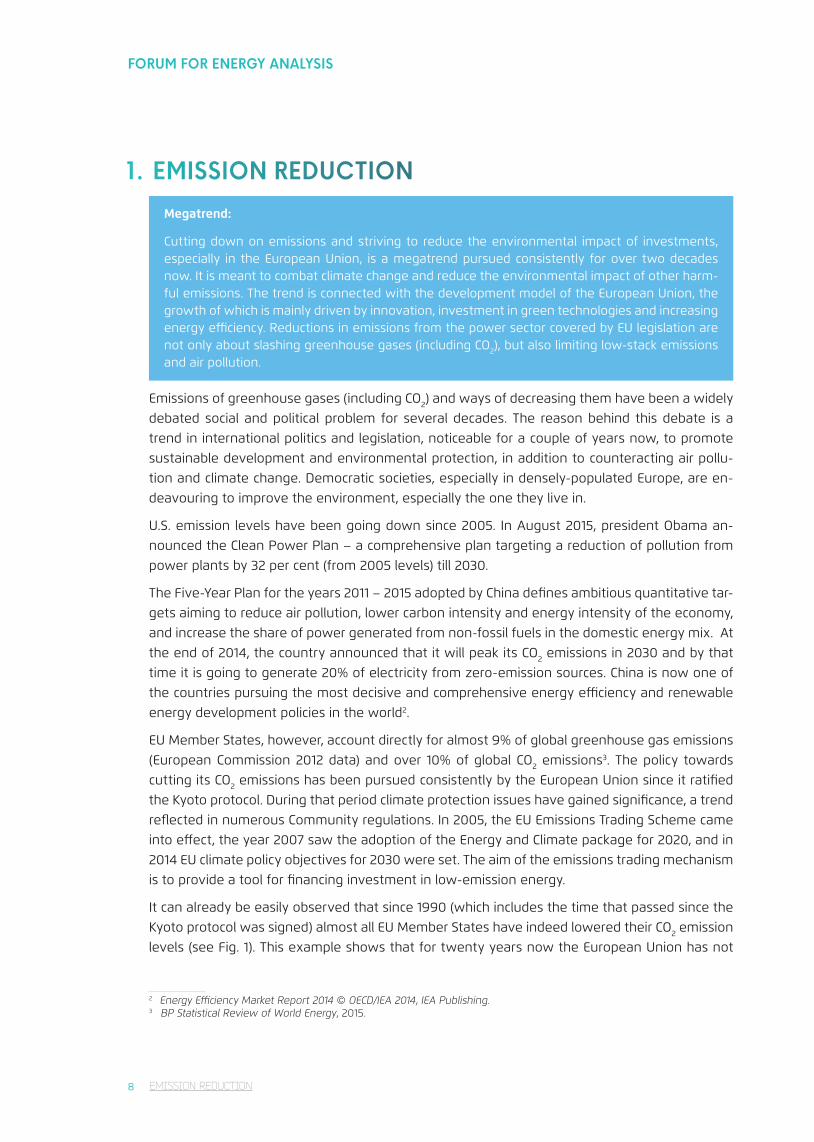
It can already be easily observed that since 1990 (which includes the time that passed since the Kyoto protocol was signed) almost all EU Member States have indeed lowered their CO2 emission levels (see Fig. 1). This example shows that for twenty years now the European Union has not
2 Energy Efficiency Market Report 2014 © OECD/IEA 2014, IEA Publishing.3 BP Statistical Review of World Energy, 2015.
Polish power sector riding on the wave of megatrends
9EMISSION REDUCTION
deviated from the path to reduce emissions. The rate of reductions has been changing, but the direction has remained the same.
Sweden84%
Denmark72%
UK76%
Ireland76%
Portugal112%
Spain124%
France84%
Belgium103%
Germany77%
Poland82%
Italy82%
Netherlands103%
Austria104%
Czech Rep.63% Slovak Rep.
54%
Hungary61% Romania
44%
Bulgaria63%
Greece93%
Finland82%
60% 154%
% of 1990 level
Figure 1. EU CO2 emission levels in 2014 as a percentage of 1990 EU emissions (source: BP Statistical Review of World Energy, June 2015)
In addition, recent years have seen a rise in the importance of requirements for air quality im-provement, improved emission controls, establishing national emission thresholds, and reducing the use of substances that deplete the ozone layer. All these regulations will limit the use of fossil fuels.
1.1. GROWING IMPORTANCE OF EMISSION REDUCTIONS IN EU LAWS AND REGULATIONS AND THEIR CONSEQUENCES FOR POLAND
Climate targets for 2030
In its conclusions adopted in October 2014, the European Council endorsed EU climate targets for 2030:
FORUM FOR ENERGY ANALYSIS
10 EMISSION REDUCTION
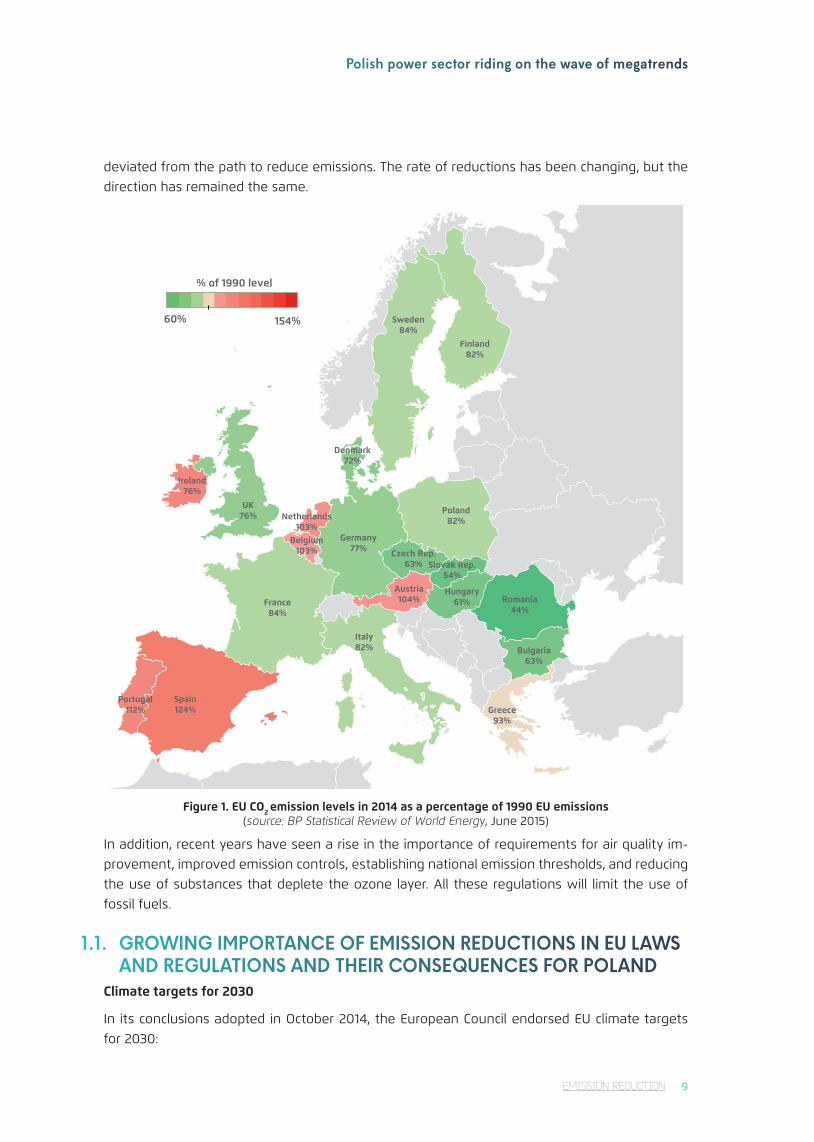
• 40% reduction in greenhouse gas emissions compared to 1990 levels, • 27% of energy consumption to come from renewable sources,• 27% improvement in energy efficiency (non-binding). Now in Brussels, work is under way on regulations which will translate the Council’s conclusions into specific tools. In July 2015, the EU Emissions Trading System (ETS) Directive was revised. In line with the draft, sectors included in the EU ETS, or the power and industrial sectors, are obliged to deliver on the EU’s target to reduce greenhouse gas emissions by 43% from 2005 levels till 2030. This will account for more or less half of the economy - wide target that Europe intends to meet by 2030. It should therefore be assumed that the EU ETS will remain the basic Community instrument in the field.
43% 30%-ETS
w
2030
2020
20%w stosunku do 1990
21% 10%EU ETS non -ETS
w stosunku do 2005
Reduction in greenhouse gas emissions
RES share
20%
? 27%z opcją zwiększenia do
20%
Energy savings
≥ 27 %≥ 27 %
20 % 20 %
≥ 40 %compared to 1990 levels
43% 30%EU ETS non-ETS
compared to 2005 levels
20 %compared to 1990 levels
21% 10%EU ETS non-ETS
compared to 2005 levels
with a possibility of increasing upto 30% afterbeing reviewed by 2020
Figure 2. EU climate targets for 2020 and 2030 (source: National Centre of Emission Balancing and Management (Krajowy Ośrodek Bilansowania i
Zarządzania Emisjami, KOBIZE)
Sectors not included in the EU ETS (non-ETS sectors), such as transport, buildings, waste and agriculture, will have to reduce CO2 emissions by 30% from 2005 levels. To achieve this objective at the EU level, each Member State will have its own target to meet. Moreover, preparing the EU negotiating position, the Environment Council reached agreement that the EU is committed to reducing emissions by half till 2050.
Emission standards
As CO2 emission reduction targets are being set, work is continuing to step up on cuts in emis-sions of other substances: sulphur dioxide (SO2), nitrogen oxides (NOX) and particulate matter. Their introduction finds its legal basis in the Industrial Emissions Directive (IED). Now work is underway to update BAT (Best Available Techniques4) reference documents and5 conclusions
4 Best available techniques. Those are meant as the most effective and advanced stage in the development of tech-nology and its methods of operation for providing the basis for emission limit values. The term also denotes rational economic availability.5 The notion is key to BAT reference documents (or BREFs) and lays down conclusions on best available techniques, BAT-related emission levels, related monitoring and fuel consumption levels. BAT conclusions are issued as EC decisions and are binding. LCP BREFs set out minimum and maximum emission limit values based on which Member States may choose their own binding emission caps, a process that then needs to be reflected in operating permits for fossil-fuelled plants.
Polish power sector riding on the wave of megatrends
11EMISSION REDUCTION
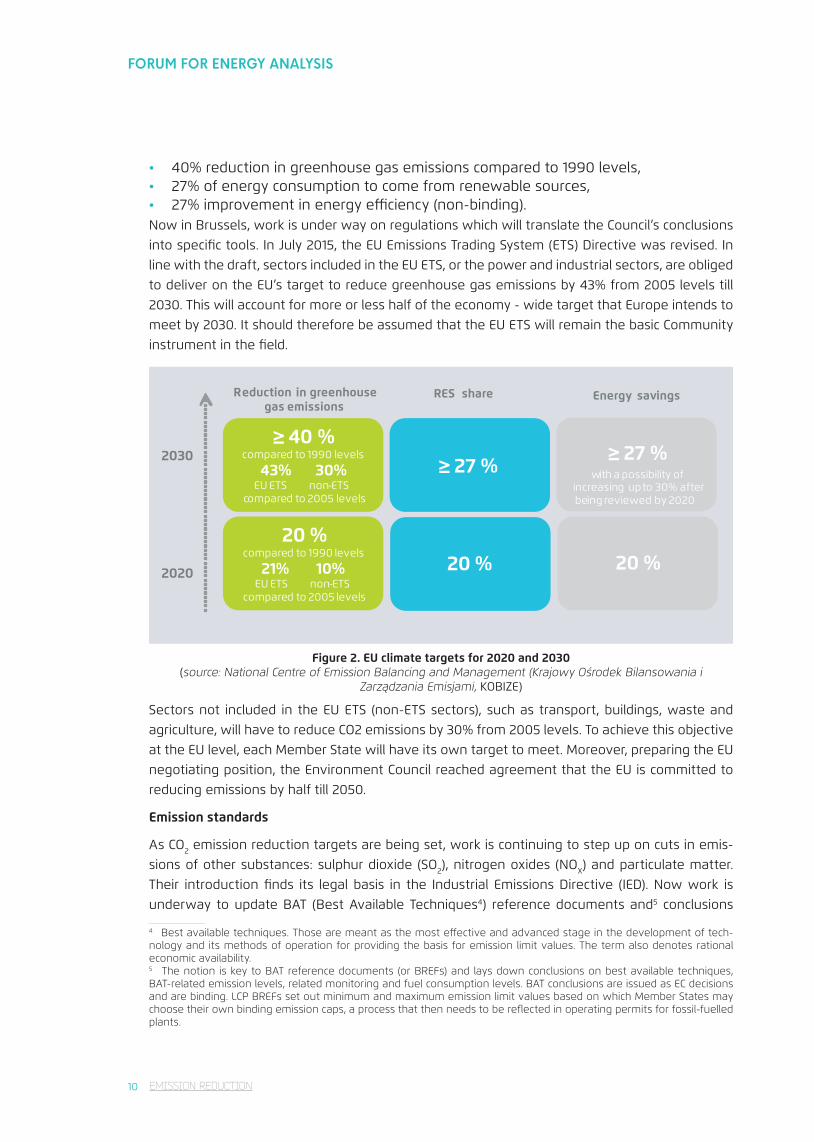
for large combustion plants (LCP). BAT conclusions are binding and will provide a basis for inte-grated permit conditions. Large combustion plants will have to be adapted to the requirements included in the permits. In April 2015, draft LCP BAT conclusions were proposed, which introduce more stringent emission standards than those set out in the IED Directive (see the table below). In 2021, the energy sector will have to meet these requirements. Otherwise, plants face a risk of closing, rather than “only” coming to terms with higher costs, as is the case for climate standards.
Power [MW]
Existing installations New installations
SO2 NOX
Particulate matter SO2 NOX
Particulate matter
<100 150–360 100–270 2–20 150–200 100–200 2–15
100–300 80–200 100–180 2–20 80–150 100–150 2–10
>300
10–13065–150
(pulverized fuel boilers)
2–15 10–7565–85
(pulverized fuel boilers)
2–5
20–180 (fluid boilers)
50–180 \ (fluid boilers and lignite)
2–10 (>1000 MW)
20–150 (fluid boilers)
50–85 (fluid boilers and lignite)
<2–5 (>1000 MW)
Table. Emission levels as updated in the LCP BREF6/BAT for existing and new hard-coal and lignite fired plants [mg/Nm3]
(source: BAT draft conclusion as of 1 April 2015)
The European Union is also seeking to apply limits for medium combustion plants (from 1 to 50 MW) by establishing the MCP Directive7, which sets out relevant emission standards. Work on a new directive on the limitation of domestic emissions of certain pollutants, the so called NEC Directive, is also nearing completion. The legislation is expected to introduce additional emission reductions obligations in the energy sector. Changes in energy prices in the wholesale market and the requirements outlined for emission standards are leading to a gradual decrease in the attractiveness of investments in new carbon-fired power plants. In addition, the oldest and the most emission-intensive carbon-fired power plants will have to be shut down on economic grounds.
European Energy Union and decarbonisation
The third element of EU policy on emissions reductions is a Communication on the Energy Union presented by the European Commission in February 2015. One of the five priorities of the strat-egy is to decarbonise the EU economy, understood as the implementation of an ambitious policy towards emission reductions (identical with climate targets described above) and to become the world’s leader in renewable energy generation. It should be stressed, that according to its defini-tion, decarbonisation is about emission cuts rather than abandoning coal entirely. A number of
6 BAT reference document prepared under the supervision of the European IPPC Bureau in Seville (acting on behalf of the European Commission). Such a document may concern various problems, e.g. emissions of air pollutants by large combustion or waste incineration plants. From Poland’s standpoint the LCP BREF (fuel combustion in large plants) is the most crucial. BREFs are guidance documents and do not have legal status. However, they serve as a basis for determin-ing BAT requirements for installations under the Industrial Emissions Directive (IED).7 Proposed directive on the limitation of emissions of certain pollutants into the air from medium combustion plants.
FORUM FOR ENERGY ANALYSIS
12
other regulations and commitments confirm the EU shifting from coal, as it has become a con-troversial fuel resource across the European Union.
According to European Commission’s vice president for energy union Maroš Šefčovič, the Euro-pean Commission will allow electricity generation from coal in the future, provided the process will be combined with the CCS technology (i.e. carbon dioxide capture and storage). CCS has been in its demonstration phase for several years now and it is still a long time before it can be used on an industrial scale.
Alongside the political debate, other signals reveal that investing in new coal-fired power plants will be more and more challenging. For example, the OECD is working towards restrictions on export credit support for coal technologies. In effect, the adoption of these provisions will lead to decreased investment in coal-fired plants in developing countries. It can concluded that reduc-tion in air pollution will be forced in various ways in different regions of the world.
1.2. THE GROWING IMPORTANCE OF LOW-STACK EMISSIONS AND AIR POLLUTION REDUCTIONS IN EU LEGISLATION
Air pollution from “low-stack sources” in Europe
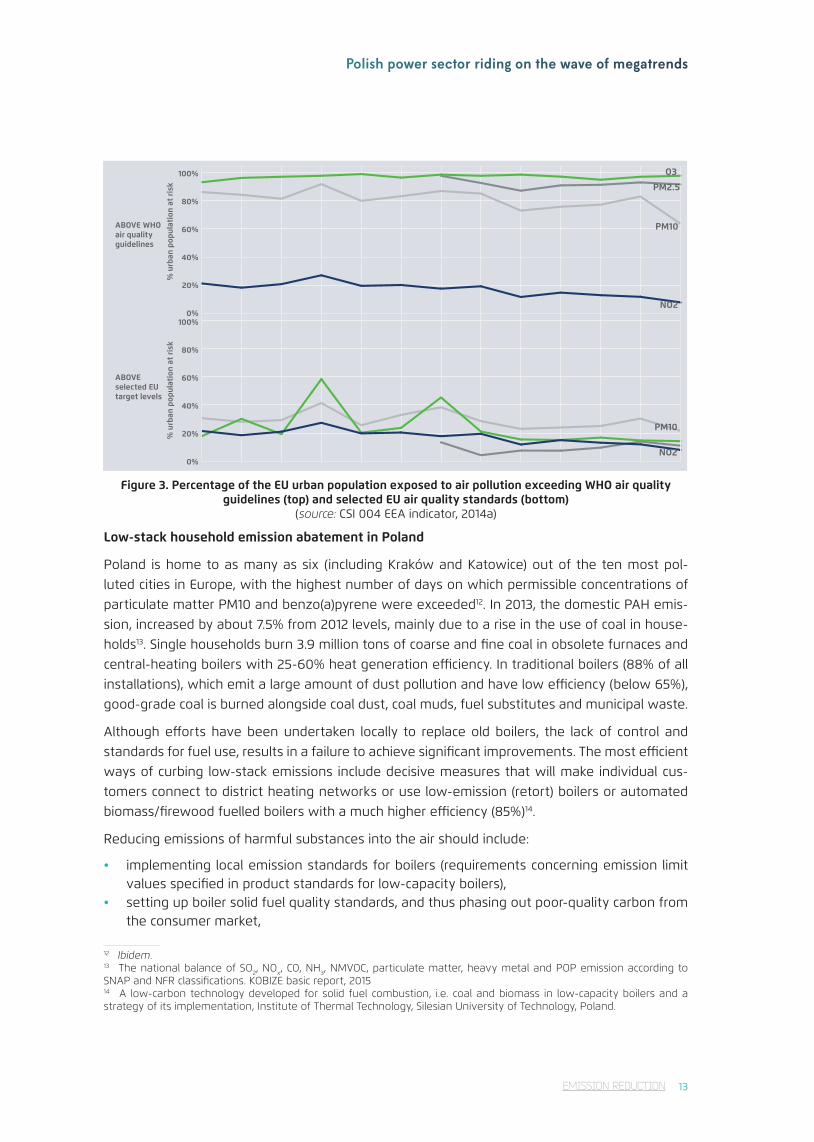
Air pollution abatement in EU legislation is primarily concerned with bringing quality standards in Member States in line with the CAFE Directive8. The greatest challenge is posed by low-stack emissions, which includes pollution coming from installations at the height of below 40m and emitted by stoves, small boilers and transport9. Low-stack emissions are dangerous due to the lack of control of air pollution, its composition and concentration. Despite the fact that since 1990 there has been a decrease in industrial pollution and greenhouse gas emissions, primarily thanks to EU policies, quite a number of Europeans – mainly Poles – still breathe air in which permissible concentrations of hazardous substances have been exceeded, for instance those of particulate matter (PM), ground-level ozone (O3), nitrogen dioxide (NO2), and polycyclic aromatic hydrocar-bons (PAHs), including benzo(a)pyrene, which is carcinogenic.
In Western European countries this problem stems primarily from transportation pollution, which is combated by establishing low-emission zones (LEZ), e.g. in London, Berlin, Cologne and Stock-holm, since the problem of stove emissions has already been eliminated. Central and Eastern Europeans, including Polish citizens, suffer from excess PM10 and PM2.5 particulate matter con-centrations and exposure to benzo(a)pyrene pollution. This is not so much due to transport, but mainly from use of household stoves and local coal-fired boilers, which burn low-grade fuel inef-ficiently and are not subject to any controls or regulations. According to a Supreme Audit Office report on Poland’s air quality,10 emissions from fuel burned for heating in households were the main contributor of particulate matter PM10 in the air (82–92.8%)11.
8 Directive 2008/50/EC of the European Parliament and of the Council of 21 May 2008 on ambient air quality and cleaner air in Europe (CAFE).9 Combustion products from low-stack sources include: carbon dioxide (CO2), carbon oxide (CO), sulphur dioxide (SO2), nitrogen oxides (NOX), polycyclic aromatic hydrocarbons, e.g. benzo(a)pyrene, apart from dioxins, heavy metals (lead, arsenic, nickel, cadmium) and particulate matter (PM10, PM2.5).10 Air pollution protection, information on the results of control carried out by Poland’s Supreme Audit Office, 1 December 201411 Ibidem.
EMISSION REDUCTION
Polish power sector riding on the wave of megatrends
13
PM10
NO2
PM2.5
O3
NO2
PM10
100%
80%
60%
40%
20%
0%
ABOVEselected EUtarget levels
ABOVE WHOair qualityguidelines
% u
rban
pop
ulat
ion
at r
isk
% u
rban
pop
ulat
ion
at r
isk
100%
80%
60%
40%
20%
0%
Figure 3. Percentage of the EU urban population exposed to air pollution exceeding WHO air quality guidelines (top) and selected EU air quality standards (bottom)
(source: CSI 004 EEA indicator, 2014a)
Low-stack household emission abatement in Poland
Poland is home to as many as six (including Kraków and Katowice) out of the ten most pol-luted cities in Europe, with the highest number of days on which permissible concentrations of particulate matter PM10 and benzo(a)pyrene were exceeded12. In 2013, the domestic PAH emis-sion, increased by about 7.5% from 2012 levels, mainly due to a rise in the use of coal in house-holds13. Single households burn 3.9 million tons of coarse and fine coal in obsolete furnaces and central-heating boilers with 25-60% heat generation efficiency. In traditional boilers (88% of all installations), which emit a large amount of dust pollution and have low efficiency (below 65%), good-grade coal is burned alongside coal dust, coal muds, fuel substitutes and municipal waste.
Although efforts have been undertaken locally to replace old boilers, the lack of control and standards for fuel use, results in a failure to achieve significant improvements. The most efficient ways of curbing low-stack emissions include decisive measures that will make individual cus-tomers connect to district heating networks or use low-emission (retort) boilers or automated biomass/firewood fuelled boilers with a much higher efficiency (85%)14.
Reducing emissions of harmful substances into the air should include:
• implementing local emission standards for boilers (requirements concerning emission limit values specified in product standards for low-capacity boilers),
• setting up boiler solid fuel quality standards, and thus phasing out poor-quality carbon from the consumer market,
12 Ibidem.13 The national balance of SO2, NOx, CO, NH3, NMVOC, particulate matter, heavy metal and POP emission according to SNAP and NFR classifications. KOBIZE basic report, 201514 A low-carbon technology developed for solid fuel combustion, i.e. coal and biomass in low-capacity boilers and a strategy of its implementation, Institute of Thermal Technology, Silesian University of Technology, Poland.
EMISSION REDUCTION
FORUM FOR ENERGY ANALYSIS
14
• establishing low-emission zones in cities,• supporting the development of heat distribution networks and enabling customers in even
very remote areas to be connected,• aiding investments in cogeneration, which is currently the most effective form of power
generation and a way of significantly driving down emissions of not only particulate matter, NOX and SO2, but also CO2.
Consequences and perspectives:
The pressure on ratcheting down greenhouse gas and other pollutant/harmful substance emissions in Europe will continue into the future. The trend will also be reinforced outside of the continent by social, environmental and political factors. As a consequence, efforts are being made to limit emissions from the energy sector, in par-ticular to slash the amount of fossil fuel burned, to generate energy from renewable sources and to reduce demand for energy. Low-stack emission controls in Polish cities will become a part of the debate on cutting emissions from the energy sector.
2. DEVELOPMENT OF RENEWABLE ENERGY (RES) TECHNOLOGIES AND TECHNICAL CAPABILITIES OF POWER GENERATION15
Megatrend:
The optimization of power technology and the falling costs of RES15 mean that they are now more widely available both to individual consumers (so prosumers) as well as institutional in-vestors, a trend that will raise the share of renewable energy in the energy mix.
The first push to develop renewable energy sources began in the 1980s and was prompted by a global energy crisis, which proved that dependence on the supply of raw materials and no diversity of supply sources can lead to global economic turmoil. Renewable sources of energy guarantee full independence from imports of raw materials for energy generation. They incur high CAPEX, but also lower operational costs compared with traditional sources.
Recent years have seen a marked growth in renewable energy, especially wind and solar power.
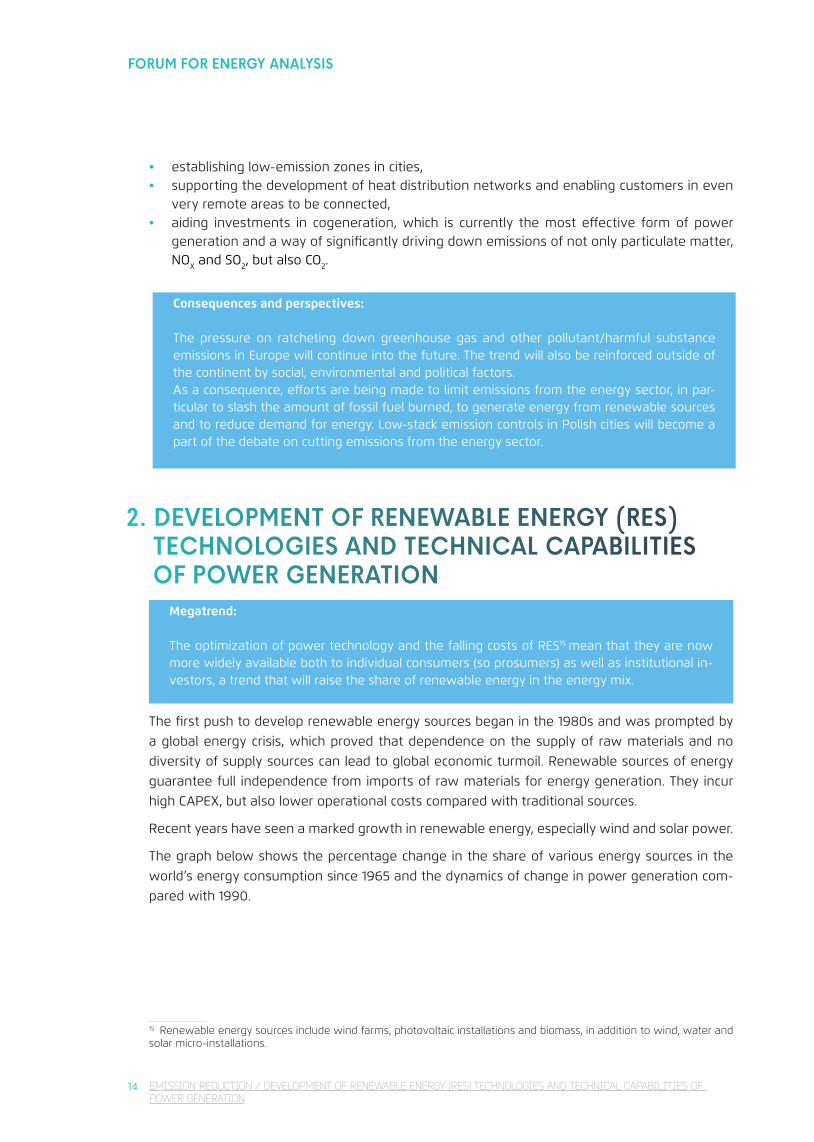
The graph below shows the percentage change in the share of various energy sources in the world’s energy consumption since 1965 and the dynamics of change in power generation com-pared with 1990.
15 Renewable energy sources include wind farms, photovoltaic installations and biomass, in addition to wind, water and solar micro-installations.
EMISSION REDUCTION / DEVELOPMENT OF RENEWABLE ENERGY (RES) TECHNOLOGIES AND TECHNICAL CAPABILITIES OF POWER GENERATION
Polish power sector riding on the wave of megatrends
15
Hydroelectricity
Nuclear
Natural Gas
Oil
Coal
1966 1968 1970 1972 1974 1976 1978 1980 1982 1984 1986 1988 1990 1992 1994 1996 1998 20002002 2004 20062008 2010 2012 2014
0%
10%
20%
30%
40%
50%
60%
70%
80%
90%
100%
-100%
-50%
0%
50%
100%
150%
200%
250%
300%
350%
400%
450%
500%
Other renewables
Energy source
HydroelectricityNuclearNatural GasOilCoal
% o
f To
tal C
on
sum
pti
on
[M
toe
]
% d
i�e
ren
ce C
on
sum
pti
on
fro
m 1
99
0 [
Mto
e]
Figure 4. World consumption of energy from various sources between 1965 and 2014 (left axis) and change for each energy source compared with 1990 (right axis and green curve)
(source: BP Statistical Review of World Energy, June 2015; Deloitte elaboration)
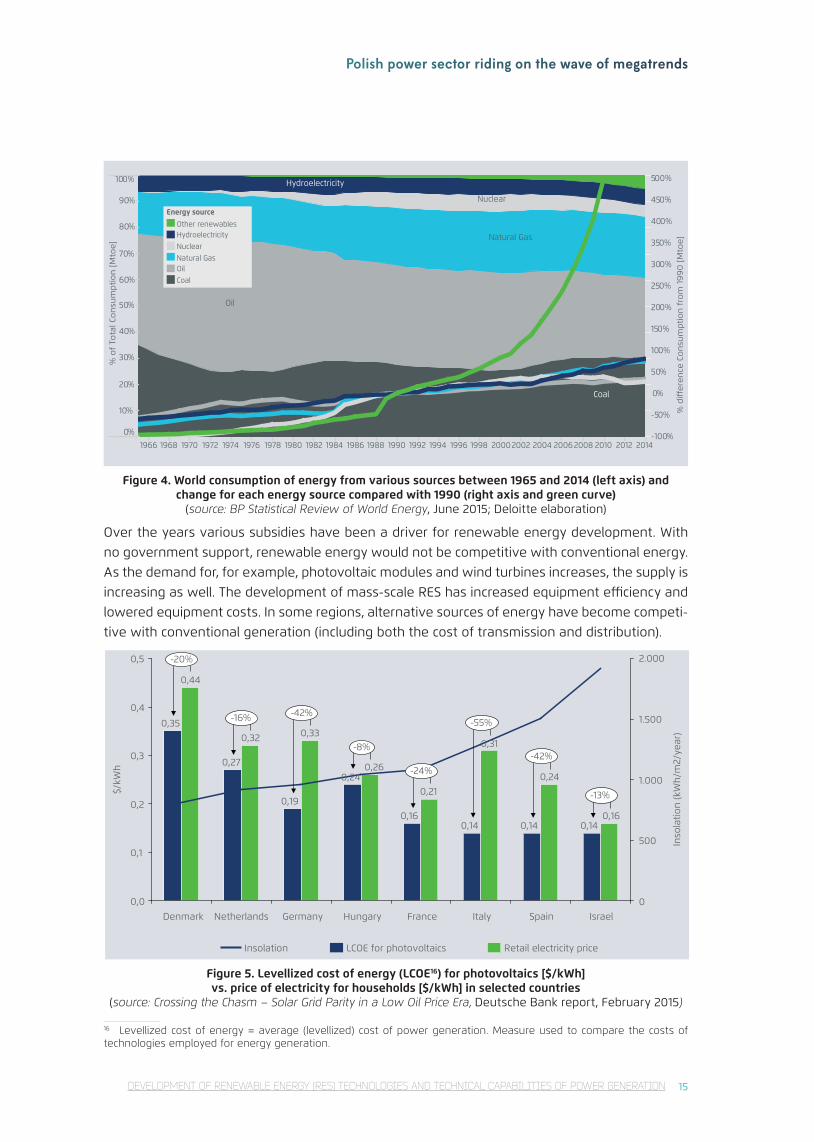
Over the years various subsidies have been a driver for renewable energy development. With no government support, renewable energy would not be competitive with conventional energy. As the demand for, for example, photovoltaic modules and wind turbines increases, the supply is increasing as well. The development of mass-scale RES has increased equipment efficiency and lowered equipment costs. In some regions, alternative sources of energy have become competi-tive with conventional generation (including both the cost of transmission and distribution).
0,140,140,140,16
0,19
0,27
0,35
0,16
0,240,21
0,26
0,330,32
0,44
0,0
0,1
0,2
0,3
0,4
0,5
500
1.500
1.000
2.000
0
-42%-8%
IsraelSpainItalyFrance
-20%
0,31
HungaryGermany
-42%
Denmark Netherlands
Inso
latio
n (k
Wh/
m2/
year
)
-16%
0,24
-55%
-24%
-13%$/kW
h
Insolation LCOE for photovoltaics Retail electricity price
Figure 5. Levellized cost of energy (LCOE16) for photovoltaics [$/kWh] vs. price of electricity for households [$/kWh] in selected countries
(source: Crossing the Chasm – Solar Grid Parity in a Low Oil Price Era, Deutsche Bank report, February 2015)
16 Levellized cost of energy = average (levellized) cost of power generation. Measure used to compare the costs of technologies employed for energy generation.
DEVELOPMENT OF RENEWABLE ENERGY (RES) TECHNOLOGIES AND TECHNICAL CAPABILITIES OF POWER GENERATION
FORUM FOR ENERGY ANALYSIS
16
The diagram above provides examples of countries where installing photovoltaic modules is profitable even without being subsidized which means that they have reached grid parity17.
As predicted by the International Energy Agency, solar energy could be the world’s largest source of electricity by 2050. The question that needs to be posed today is not whether renewables will replace conventional energy sources but when this will happen and how much time the evolu-tion will require.
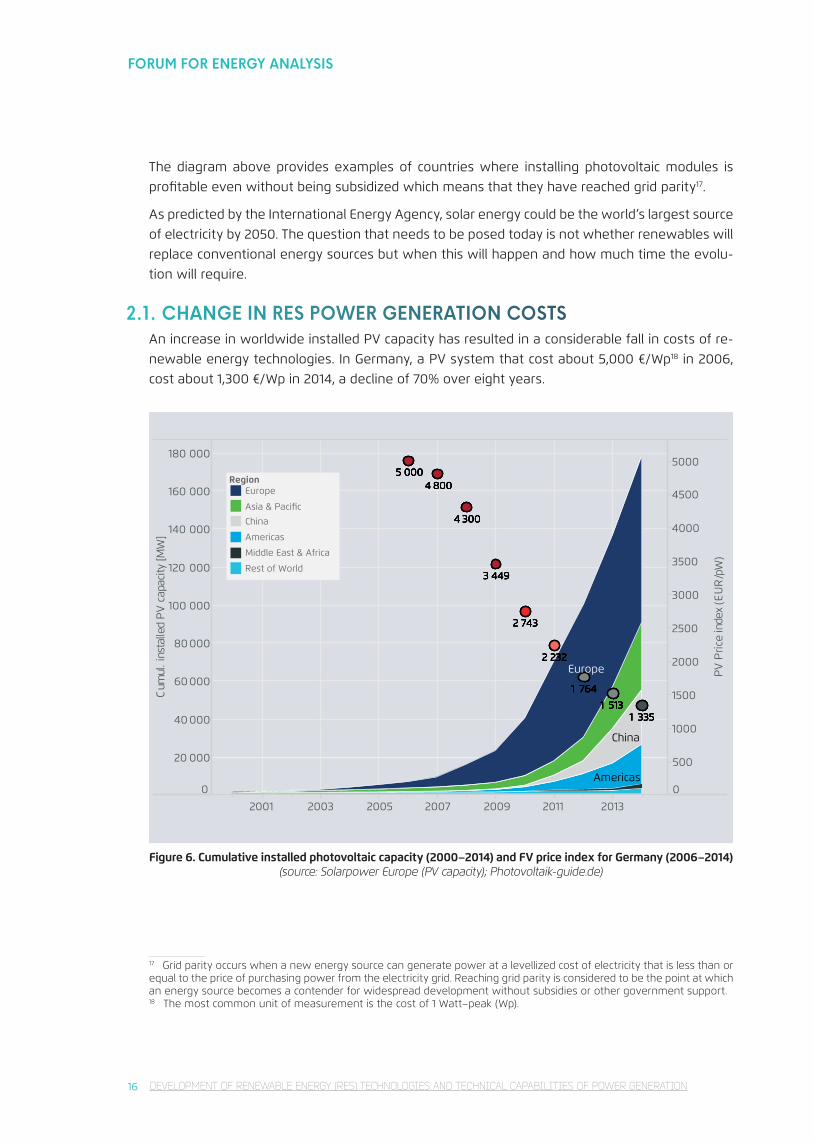
2.1. CHANGE IN RES POWER GENERATION COSTSAn increase in worldwide installed PV capacity has resulted in a considerable fall in costs of re-newable energy technologies. In Germany, a PV system that cost about 5,000 €/Wp18 in 2006, cost about 1,300 €/Wp in 2014, a decline of 70% over eight years.
2001 2003 2005 2007 2009 2011 2013
0
20 000
40 000
60000
80000
100 000
120 000
140 000
160 000
180 000
Cum
ul.i
nsta
lled
PV
capa
city
[ MW
]
0
500
1000
1500
2000
2500
3000
3500
4000
4500
5000
PV
Pric
ein
dex
(EU
R/p
W)
Europe
China
Americas
1 3351 513
1 764
2 232
2 743
3 449
4 300
4 8005 000
1 3351 513
1 764
2 232
2 743
3 449
4 300
4 8005 000
1 3351 513
1 764
2 232
2 743
3 449
4 300
4 8005 000
1 3351 513
1 764
2 232
2 743
3 449
4 300
4 8005 000
1 3351 513
1 764
2 232
2 743
3 449
4 300
4 8005 000
1 3351 513
1 764
2 232
2 743
3 449
4 300
4 8005 000
RegionEurope
Asia & Pacific
China
Americas
Middle East & Africa
Rest of World
Figure 6. Cumulative installed photovoltaic capacity (2000–2014) and FV price index for Germany (2006–2014) (source: Solarpower Europe (PV capacity); Photovoltaik-guide.de)
17 Grid parity occurs when a new energy source can generate power at a levellized cost of electricity that is less than or equal to the price of purchasing power from the electricity grid. Reaching grid parity is considered to be the point at which an energy source becomes a contender for widespread development without subsidies or other government support. 18 The most common unit of measurement is the cost of 1 Watt–peak (Wp).
DEVELOPMENT OF RENEWABLE ENERGY (RES) TECHNOLOGIES AND TECHNICAL CAPABILITIES OF POWER GENERATION
Polish power sector riding on the wave of megatrends
17
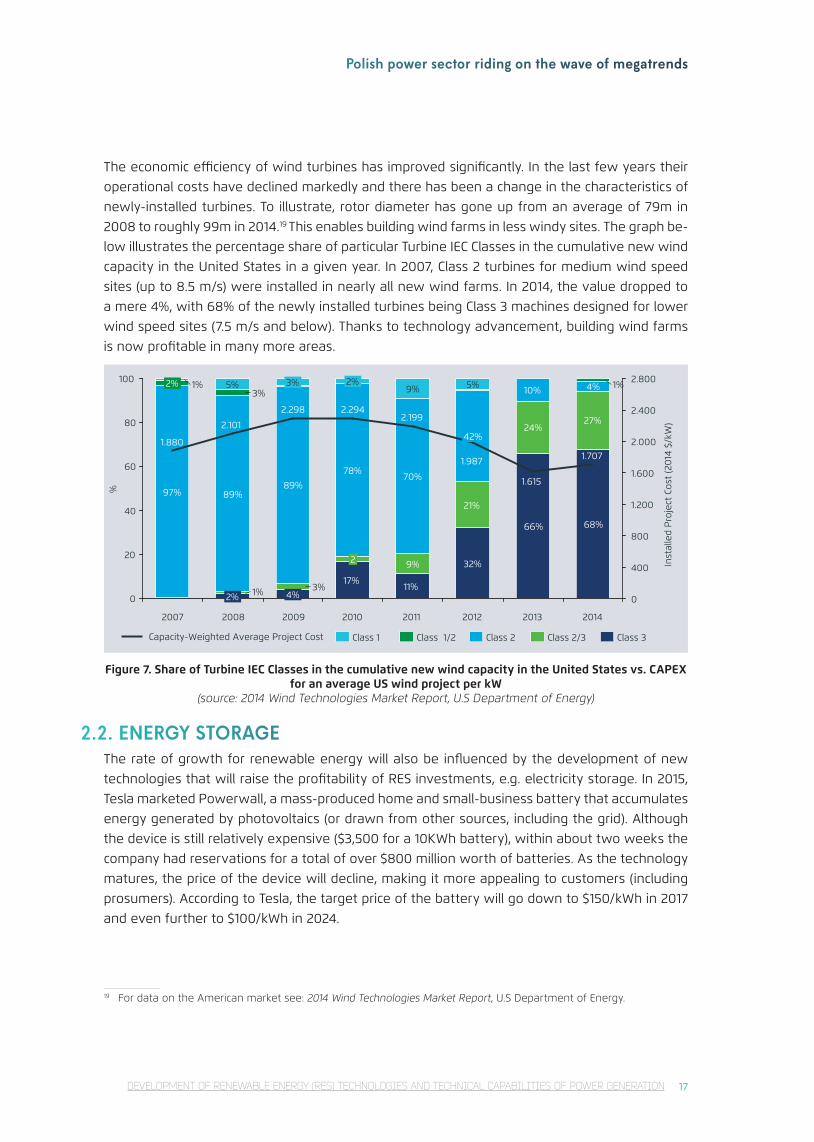
The economic efficiency of wind turbines has improved significantly. In the last few years their operational costs have declined markedly and there has been a change in the characteristics of newly-installed turbines. To illustrate, rotor diameter has gone up from an average of 79m in 2008 to roughly 99m in 2014.19 This enables building wind farms in less windy sites. The graph be-low illustrates the percentage share of particular Turbine IEC Classes in the cumulative new wind capacity in the United States in a given year. In 2007, Class 2 turbines for medium wind speed sites (up to 8.5 m/s) were installed in nearly all new wind farms. In 2014, the value dropped to a mere 4%, with 68% of the newly installed turbines being Class 3 machines designed for lower wind speed sites (7.5 m/s and below). Thanks to technology advancement, building wind farms is now profitable in many more areas.
0
20
40
60
80
100
800
400
1.200
0
2.800
2.400
2.000
1.600
42%
9%
24%
3%1%
4%
27%
Inst
alle
d P
roje
ct C
ost
(20
14 $
/kW
)
3%
4%
2%
68%
1%3%
5%
17%11%
% 97%
2%
9% 5% 1%2%
32%
66%
10%
70%89%
21%89%
2011 20132012 2014201020092007 2008
78%
2
1.615
1.987
1.880
2.1992.298 2.294
1.707
2.101
Class 2 Class 3Class 2/3Class 1/2Class 1Capacity-Weighted Average Project Cost
Figure 7. Share of Turbine IEC Classes in the cumulative new wind capacity in the United States vs. CAPEX for an average US wind project per kW
(source: 2014 Wind Technologies Market Report, U.S Department of Energy)
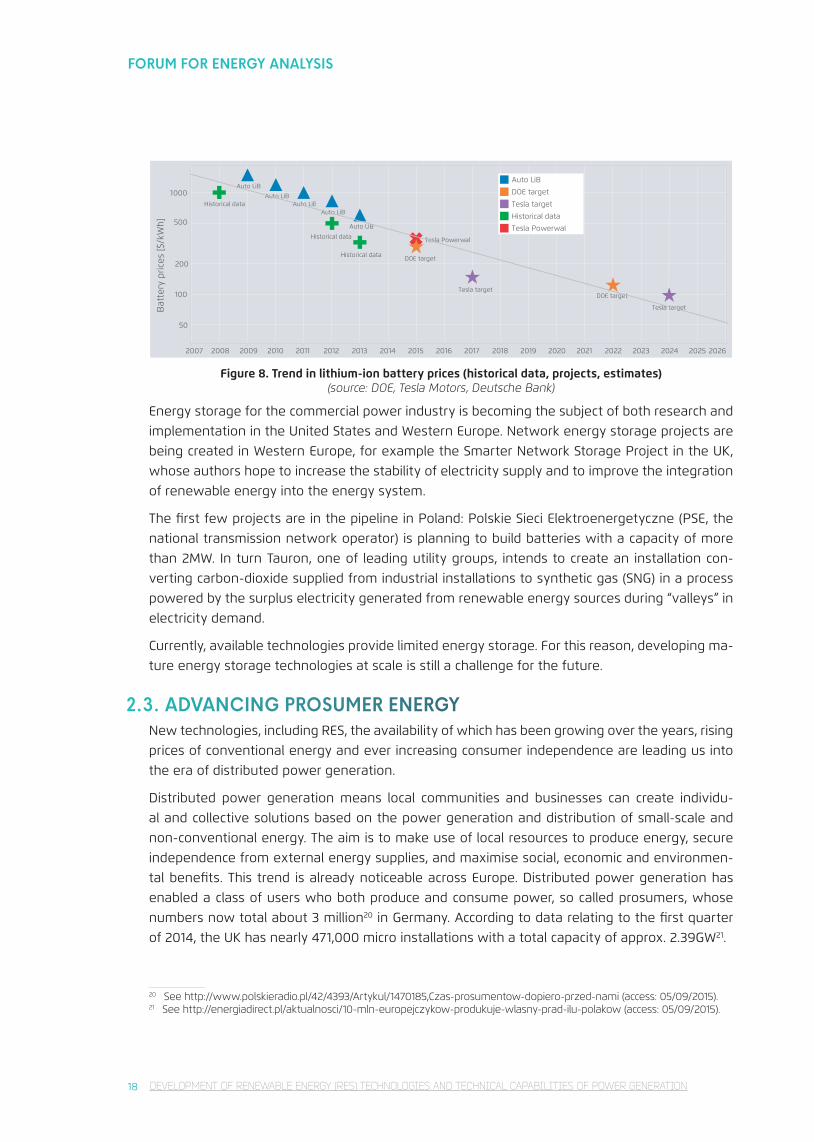
2.2. ENERGY STORAGEThe rate of growth for renewable energy will also be influenced by the development of new technologies that will raise the profitability of RES investments, e.g. electricity storage. In 2015, Tesla marketed Powerwall, a mass-produced home and small-business battery that accumulates energy generated by photovoltaics (or drawn from other sources, including the grid). Although the device is still relatively expensive ($3,500 for a 10KWh battery), within about two weeks the company had reservations for a total of over $800 million worth of batteries. As the technology matures, the price of the device will decline, making it more appealing to customers (including prosumers). According to Tesla, the target price of the battery will go down to $150/kWh in 2017 and even further to $100/kWh in 2024.
19 For data on the American market see: 2014 Wind Technologies Market Report, U.S Department of Energy.
DEVELOPMENT OF RENEWABLE ENERGY (RES) TECHNOLOGIES AND TECHNICAL CAPABILITIES OF POWER GENERATION
FORUM FOR ENERGY ANALYSIS
18
000
Bat
tery
pric
es [$
/kW
h]
2007 2008 2009 2010 2011 2012 2013 2014 2015 2016 2017 2018 2019 2020 2021 2022 2023 2024 2025 2026
50
100
1
DOE target
DOE target
Tesla target
Tesla target
Historical data
Historical data
Historical data
Tesla Powerwall
Auto LiB Auto LiB
Auto LiB Auto LiB
Auto LiB
Auto LiB DOE target
Tesla target
Historical data
Tesla Powerwall 500
200
Figure 8. Trend in lithium-ion battery prices (historical data, projects, estimates) (source: DOE, Tesla Motors, Deutsche Bank)
Energy storage for the commercial power industry is becoming the subject of both research and implementation in the United States and Western Europe. Network energy storage projects are being created in Western Europe, for example the Smarter Network Storage Project in the UK, whose authors hope to increase the stability of electricity supply and to improve the integration of renewable energy into the energy system.
The first few projects are in the pipeline in Poland: Polskie Sieci Elektroenergetyczne (PSE, the national transmission network operator) is planning to build batteries with a capacity of more than 2MW. In turn Tauron, one of leading utility groups, intends to create an installation con-verting carbon-dioxide supplied from industrial installations to synthetic gas (SNG) in a process powered by the surplus electricity generated from renewable energy sources during “valleys” in electricity demand.
Currently, available technologies provide limited energy storage. For this reason, developing ma-ture energy storage technologies at scale is still a challenge for the future.
2.3. ADVANCING PROSUMER ENERGYNew technologies, including RES, the availability of which has been growing over the years, rising prices of conventional energy and ever increasing consumer independence are leading us into the era of distributed power generation.
Distributed power generation means local communities and businesses can create individu-al and collective solutions based on the power generation and distribution of small-scale and non-conventional energy. The aim is to make use of local resources to produce energy, secure independence from external energy supplies, and maximise social, economic and environmen-tal benefits. This trend is already noticeable across Europe. Distributed power generation has enabled a class of users who both produce and consume power, so called prosumers, whose numbers now total about 3 million20 in Germany. According to data relating to the first quarter of 2014, the UK has nearly 471,000 micro installations with a total capacity of approx. 2.39GW21.
20 See http://www.polskieradio.pl/42/4393/Artykul/1470185,Czas-prosumentow-dopiero-przed-nami (access: 05/09/2015).21 See http://energiadirect.pl/aktualnosci/10-mln-europejczykow-produkuje-wlasny-prad-ilu-polakow (access: 05/09/2015).
DEVELOPMENT OF RENEWABLE ENERGY (RES) TECHNOLOGIES AND TECHNICAL CAPABILITIES OF POWER GENERATION
Polish power sector riding on the wave of megatrends
19
"big 4" power prov.5%
industry14%
investm. funds / banks13%
other power prov.7%
farmers11%
private individuals35%
others1%
projects firms14%
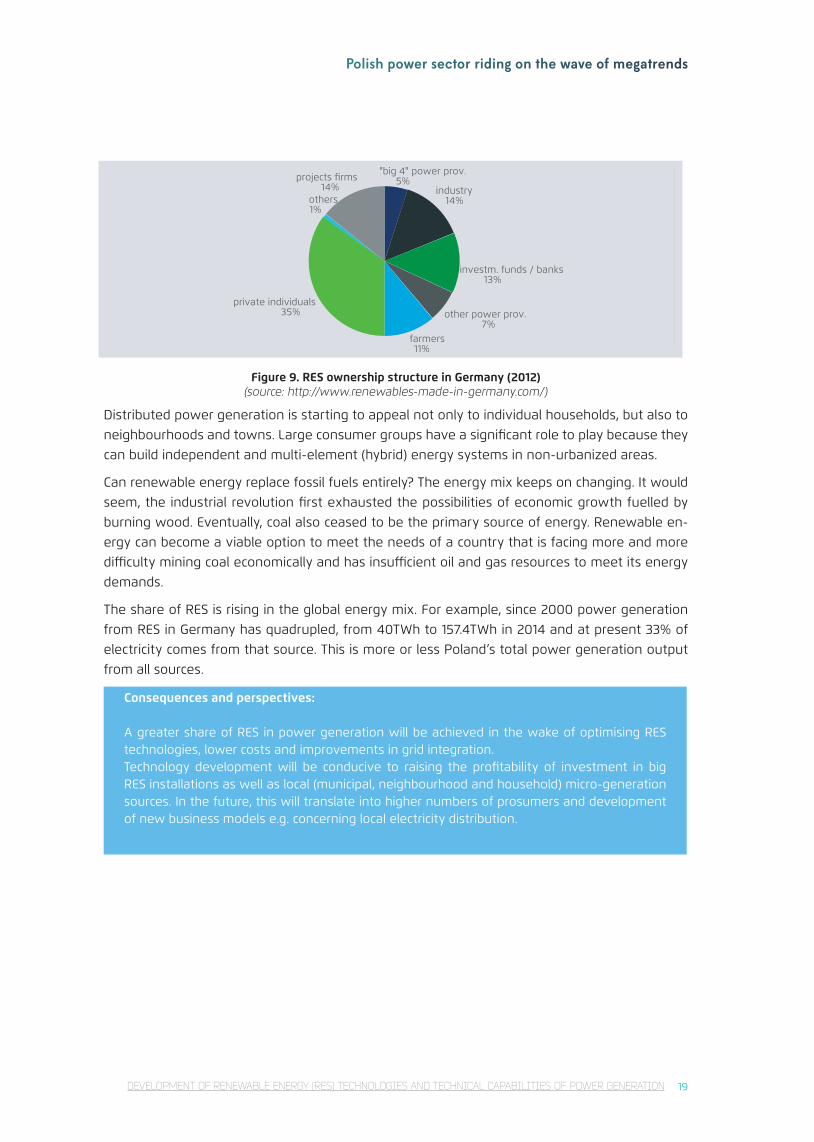
Figure 9. RES ownership structure in Germany (2012) (source: http://www.renewables-made-in-germany.com/)
Distributed power generation is starting to appeal not only to individual households, but also to neighbourhoods and towns. Large consumer groups have a significant role to play because they can build independent and multi-element (hybrid) energy systems in non-urbanized areas.
Can renewable energy replace fossil fuels entirely? The energy mix keeps on changing. It would seem, the industrial revolution first exhausted the possibilities of economic growth fuelled by burning wood. Eventually, coal also ceased to be the primary source of energy. Renewable en-ergy can become a viable option to meet the needs of a country that is facing more and more difficulty mining coal economically and has insufficient oil and gas resources to meet its energy demands.
The share of RES is rising in the global energy mix. For example, since 2000 power generation from RES in Germany has quadrupled, from 40TWh to 157.4TWh in 2014 and at present 33% of electricity comes from that source. This is more or less Poland’s total power generation output from all sources.
Consequences and perspectives:
A greater share of RES in power generation will be achieved in the wake of optimising RES technologies, lower costs and improvements in grid integration. Technology development will be conducive to raising the profitability of investment in big RES installations as well as local (municipal, neighbourhood and household) micro-generation sources. In the future, this will translate into higher numbers of prosumers and development of new business models e.g. concerning local electricity distribution.
DEVELOPMENT OF RENEWABLE ENERGY (RES) TECHNOLOGIES AND TECHNICAL CAPABILITIES OF POWER GENERATION
FORUM FOR ENERGY ANALYSIS
20
3. INCREASED ROLE OF PUBLIC DECISION-MAKING AND AWARENESS
Megatrend:
Greater public awareness of environmental issues, the environmental impact of investment and new power generation technologies.In particular, the trend relates to growing public awareness and participation, the NIMBY reac-tion (opposition by local residents to new infrastructure investment) and endeavours to gain autonomy in meeting energy needs thanks to the development of prosumer sources.
The effective development of any infrastructure, including energy infrastructure, whether it be mines, coal-fired power, nuclear power, or wind turbines and transmission grids, is now to a large extent contingent on whether a project is given the go-ahead by local communities. Local authorities and social movements are interested in shaping the surrounding reality and are be-ginning to exert considerable influence both on energy policy in a broad sense and completion of some investment projects. The effectiveness of these endeavours is increasing also thanks to the availability of modern media, especially social media, which makes it possible to quickly involve new stakeholders.
The following can be noticed in this context:
• Growing importance of public consultation as part of environmental impact assess-ment (EIA) and participation of the public in decision-making processes concerning investment projects.
• More frequent occurrence of the NIMBY22 (Not In My Backyard) effect, which inhibits virtually every investment project based on the EIA procedure.
• The development of local and prosumer energy, which provides society with a vi-able chance to regain greater control over projects carried out close to them, out of concern for living standards, money and independence from large-scale energy.
3.1. RISING ENVIRONMENTAL AWARENESS AND SOCIAL PARTICIPATION
One of the reasons for the greater public involvement in energy issues is the rise of environmen-tal awareness. According to a 2014 study by the European Commission, a high 75% of respond-ents indicated that quality of life is impacted by the state of the natural environment, and 77% of them were convinced that environmental problems have a direct bearing on their everyday lives. The voice of Europeans is also becoming important – they see environmental activities undertaken by large companies and industry as insufficient (77%) and they often have the same opinion about the efforts of their national governments (70%)23.
Poles’ opinions on environmental protection do not differ much from the European average. According to a 2014 survey on environmental awareness, as many as 86% believe that envi-
22 Not In My Back Yard A characterization of a social attitude, or opposition by residents to a new development project because it is close to them. Examples of proposals that are particularly fought over include motorways, rail lines, waste-water treatment plants and landfills.23 See http://ec.europa.eu/public_opinion/archives/ebs/ebs_416_en.pdf (access: 05/09/2015).
INCREASED ROLE OF PUBLIC DECISION-MAKING AND AWARENESS
Polish power sector riding on the wave of megatrends
21
ronmental protection is an important problem24. However, differences in income and purchasing power between Poland and Western European countries mean that Poles are less willing to undertake environmental activities if they entail higher expenses.
Communities with relatively distinct pro-environmental opinions are more and more actively involved in energy matters. Social participation has special significance locally, a trend also pre-sent in Poland. The need to become involved is confirmed by the 1555 worldwide social conflicts related to environmental protection, as identified by the Environmental Justice Organisation, Li-abilities and Trade (EJOLT). As many as 483 of them concerned energy and infrastructure projects (2014–2015)25.
The rights of access to information and public participation in decision-making with regard to the environment were ensured in the 1998 Aarhus Convention, European legislation and national laws under the EIA procedure. Mistakes on the part of an investor confronted with a well-or-ganized social group may delay or even block the proposed investment entirely. Some energy-related investments, particularly in coal-fired or nuclear power plants, open pit mines and wind farms, will require an arduous and time-consuming social dialogue and compensation activities.
3.2. NOT IN MY BACKYARD (NIMBY)NIMBY is a social attitude that can be defined as a sign of protest on the part of inhabitants against an investment, e.g. a power plant, a transmission grid, a mine or a RES source, if it will be built close to where they live. Local communities express their opposition for fear of actual or possible health risks, onerous neighbourhood, and, consequently, lower quality of life and, quite importantly, decreased real estate values.
In view of these arguments, a broader public interest, the interest of the country the communi-ties live in, and the necessity to ensure energy security, often fade into the background.
This trend includes numerous activities carried out by Polish communities in recent years and aimed at blocking energy investment projects:
• opposition against building a nuclear power plant in Pomerania for fear of decreased property values, adverse health effects and a nuclear accident;
• opposition against (some) investments in wind farms for fear of increased noise levels, changes the landscape and potential damage to birds;
• opposition against building high-voltage energy grids across Poland for fear of harmful electromagnetic radiation, changes to the landscape and lowered property values (e.g. Kozienice – Ołtarzew);
• opposition against open pit mine on Poniec-Krobia-Oczkowice, Dęby Szlacheckie, Legnica, Gubinie i Złoczewie, Gubin and Złoczewo fields for fear of decreased ground-water levels, landslides, mining damage, changes to the landscape, environmental degradation and lowered property values26.
24 A survey on environmental awareness and behaviours of Polish citizens. Tracking study carried out in October 2014. TNS Polska report for the Ministry of the Environment25 See http://ejatlas.org/ (access: 05/09/2015).26 See http://wysokienapiecie.pl/energetyka-konwencjonalna/910-w-polsce-konczy-sie-wegiel-analiza (access: 05/09/2015).
INCREASED ROLE OF PUBLIC DECISION-MAKING AND AWARENESS
FORUM FOR ENERGY ANALYSIS
22 INCREASED ROLE OF PUBLIC DECISION-MAKING AND AWARENESS
Overall local resistance to any energy investment, especially those related to mining, means the necessity to take action to overcome the NIMBY effect, yet in the future account needs to be taken of the risk ensuing from the inability to continue a particular project and also much higher costs of an investment with particularly adverse environmental impact.
3.3. MICRO-GENERATION: PROSUMERSMotivation to become a prosumer
There are at least two primary reasons why consumers could be interested in generating elec-tricity in micro-installations. The first one, and quite a prosaic one at that, is a type of economic balance. Private individuals analyse the profitability of prosumer installations in a simple manner, which does not always take into account the cost of electricity generation and distribution costs and sometimes even overlooks the cost of an installation. Potential prosumers compare invest-ment expenditure (most frequently partly state-subsidised and financed at attractive conditions) with possible monthly reductions in their electricity bills. The psychological aspect is crucial, too. An investment in a micro-source entails installation, and possibly small repair and maintenance costs of the infrastructure, but its owners are insulated from rising energy prices. At the same time the investors have a sense of independence from large energy companies.
The second reason why people should want to become energy prosumers is the trend to be green, especially in wealthy societies. In other words, energy consumers may decide to buy a RES micro-installation not only on purely commercial grounds, but also out of the desire to follow the latest trends to incorporate ecological values as a form of modernism
Significant growth potential of prosumer photovoltaics
The profitability of solar PV is determined by energy prices for the customer at the end of the chain, levels of solar irradiance and technology costs. Between 2006 and 2014, CAGR27 for the price index of PV installations in Germany amounted to -9% (for more information see subsec-tion 2.1), and prices are likely to go down further. In addition, an even further marginal reduction in technology costs will enable other regions to reach grid parity (even those with lower sunshine levels and lower grid energy prices than the countries which already have achieved grid parity).
The further pace of prosumer energy growth will also be affected by the development of new technologies which will raise the profitability of individual micro-sources. It will be crucial to store energy not only in traditional energy storage, but also using other non-conventional solutions e.g. charging an electric car or converting electric energy into heat.
An additional boost for the development of prosumer energy will be provided by widely-availa-ble investment profitability calculators in a particular location.
Google is piloting a new application called Project Sunroof. Using it, a potential investor will be able to compute how much sunlight hits their roof and estimate both the cost of PV and yearly savings it will produce. The Google application takes into account factors like roof orientation,
27 CAGR, or Compound Annual Growth Rate, is the mean annual growth rate over a specified period of time provided that annual growth is added to the starting value of the next period.
Polish power sector riding on the wave of megatrends
23INCREASED ROLE OF PUBLIC DECISION-MAKING AND AWARENESS / DECLINING IMPORTANCE OF COAL AND OTHER FOSSIL FUELS
shadows cast by trees and nearby structures, as well as historical data on local weather patterns (especially cloud cover and temperature). On top of that, this on-line tool will help the investor choose the right micro-installation size and connect with their potential solar provider.
Consequences and perspectives:
Society has a say in making decisions concerning an investment. Future energy policy needs to consider that social resistance to an energy project with high environmental impact may cause its costs to rise significantly or even block it entirely. As technology prices decline, RES micro-generation will gain significance. In the long run, the large-scale power industry may lose out, because it is not interested in this market segment. This will result in energy generation being de-centralized further and, possibly, conventional energy losing market share.
4. DECLINING IMPORTANCE OF COAL AND OTHER FOSSIL FUELS
Megatrend:
Falling importance of coal in the EU energy mix. The decline is brought about by emission reduction efforts, changes to the economics of production and rising competition from other technologies.In the Polish context, the megatrend relates to the imminent occurrence of the so called coal gap caused by a decreasing share of coal mined domestically.
Poland’s hard coal production has been falling steadily for a couple of years now. At the same time, the long lasting and well-known difficulties with the profitability of mining is blocking in-vestments and is not creating good prospects for the mines, which makes the downward trend even worse. Lignite resources are depleting fast. Poland’s electrical power generation is facing the imminent necessity to replace domestic coal with foreign coal or other production technolo-gies.
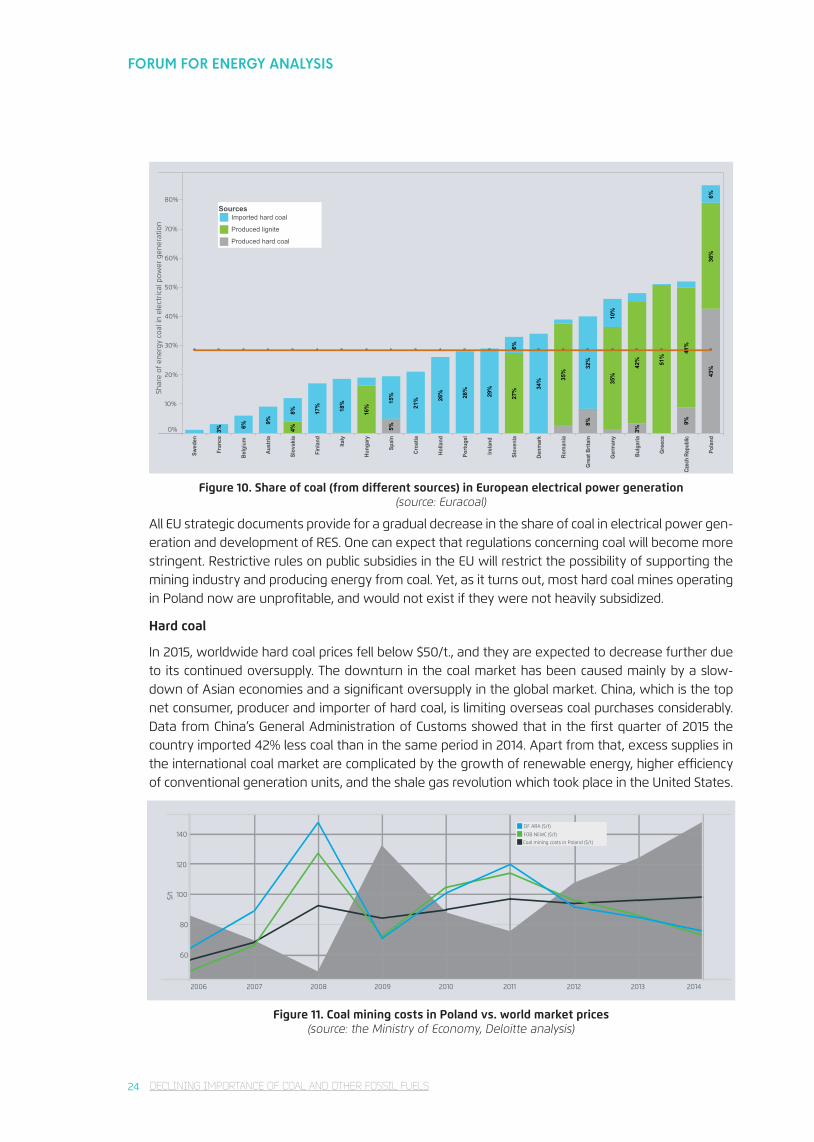
4.1. FUTURE OF COAL IN THE POLISH ENERGY MIXPoland’s energy mix differs considerably from that of other EU Member States, because as much as 87% of the country’s electricity is produced by burning coal. Hard coal, which has a higher calorific value than lignite coal, alone accounts for 50%. Hard coal is mostly mined domestically, whereas other EU Member States heavily rely on imports. Hard coal is a key resource from which Poland generates heat (about 75% share in 2012).
FORUM FOR ENERGY ANALYSIS
24 DECLINING IMPORTANCE OF COAL AND OTHER FOSSIL FUELS
Swed
en
Fran
ce
Belg
ium
Aust
ria
Slov
akia
Finl
and
Italy
Hung
ary
Spai
n
Croa
tia
Holla
nd
Portu
gal
Irela
nd
Slov
enia
Denm
ark
Rom
ania
Gre
at B
ritai
n
Ger
man
y
Bulg
aria
Gre
ece
Czec
h Re
publ
ic
Pola
nd
0%
10%
20%
30%
40%
50%
60%
70%
80%
Shar
e of
ene
rgy
coal
in e
lect
rical
pow
er g
ener
atio
n
17% 18% 15
%
21% 26
% 28%
29% 34
%
32%
10%
16%
27%
35%
35%
42% 51%
41%
36%
43%
3% 6%
9%
8%
6%
6%
4% 5%
8%
3%
9%
SourcesImported hard coal
Produced lignite
Produced hard coal
Figure 10. Share of coal (from different sources) in European electrical power generation (source: Euracoal)
All EU strategic documents provide for a gradual decrease in the share of coal in electrical power gen-eration and development of RES. One can expect that regulations concerning coal will become more stringent. Restrictive rules on public subsidies in the EU will restrict the possibility of supporting the mining industry and producing energy from coal. Yet, as it turns out, most hard coal mines operating in Poland now are unprofitable, and would not exist if they were not heavily subsidized.
Hard coal
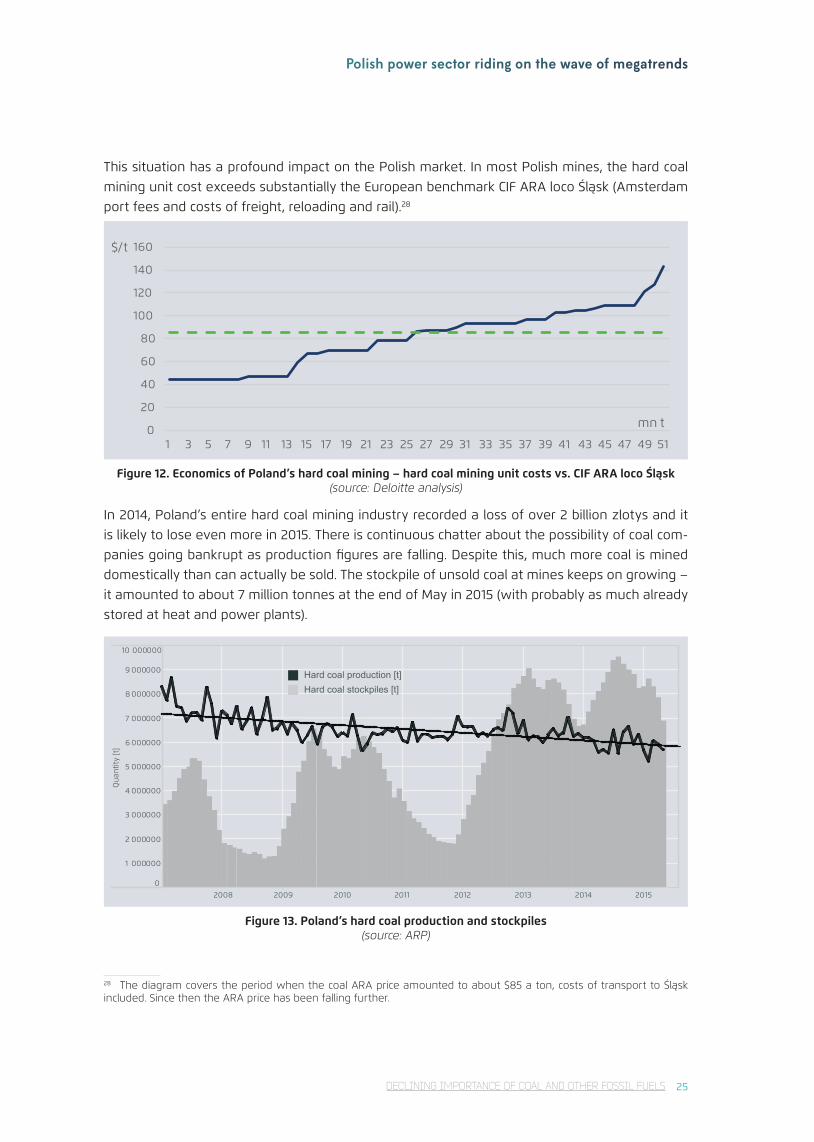
In 2015, worldwide hard coal prices fell below $50/t., and they are expected to decrease further due to its continued oversupply. The downturn in the coal market has been caused mainly by a slow-down of Asian economies and a significant oversupply in the global market. China, which is the top net consumer, producer and importer of hard coal, is limiting overseas coal purchases considerably. Data from China’s General Administration of Customs showed that in the first quarter of 2015 the country imported 42% less coal than in the same period in 2014. Apart from that, excess supplies in the international coal market are complicated by the growth of renewable energy, higher efficiency of conventional generation units, and the shale gas revolution which took place in the United States.
2006 2007 2008 2009 2010 2011 2012 2013 2014
60
80
100
120
140
$/t
CIF ARA ($/t)
FOB NEWC ($/t)
Coal mining costs in Poland ($/t)
Figure 11. Coal mining costs in Poland vs. world market prices (source: the Ministry of Economy, Deloitte analysis)
Polish power sector riding on the wave of megatrends
25DECLINING IMPORTANCE OF COAL AND OTHER FOSSIL FUELS
This situation has a profound impact on the Polish market. In most Polish mines, the hard coal mining unit cost exceeds substantially the European benchmark CIF ARA loco Śląsk (Amsterdam port fees and costs of freight, reloading and rail).28
0
20
40
60
80
100
120
140
160
1 3 5 7 9 11 13 15 17 19 21 23 25 27 29 31 33 35 37 39 41 43 45 47 49 51
$/t
mn t
Figure 12. Economics of Poland’s hard coal mining – hard coal mining unit costs vs. CIF ARA loco Śląsk (source: Deloitte analysis)
In 2014, Poland’s entire hard coal mining industry recorded a loss of over 2 billion zlotys and it is likely to lose even more in 2015. There is continuous chatter about the possibility of coal com-panies going bankrupt as production figures are falling. Despite this, much more coal is mined domestically than can actually be sold. The stockpile of unsold coal at mines keeps on growing – it amounted to about 7 million tonnes at the end of May in 2015 (with probably as much already stored at heat and power plants).
2008 2009 2010 2011 2012 2013 2014 2015
0
1 000000
2 000000
3 000000
4 000000
5 000000
6 000000
7 000000
8 000000
9 000000
10 000000
Qua
ntity
[t]
Hard coal production [t]Hard coal stockpiles [t]
Figure 13. Poland’s hard coal production and stockpiles (source: ARP)
28 The diagram covers the period when the coal ARA price amounted to about $85 a ton, costs of transport to Śląsk included. Since then the ARA price has been falling further.
FORUM FOR ENERGY ANALYSIS
26 DECLINING IMPORTANCE OF COAL AND OTHER FOSSIL FUELS
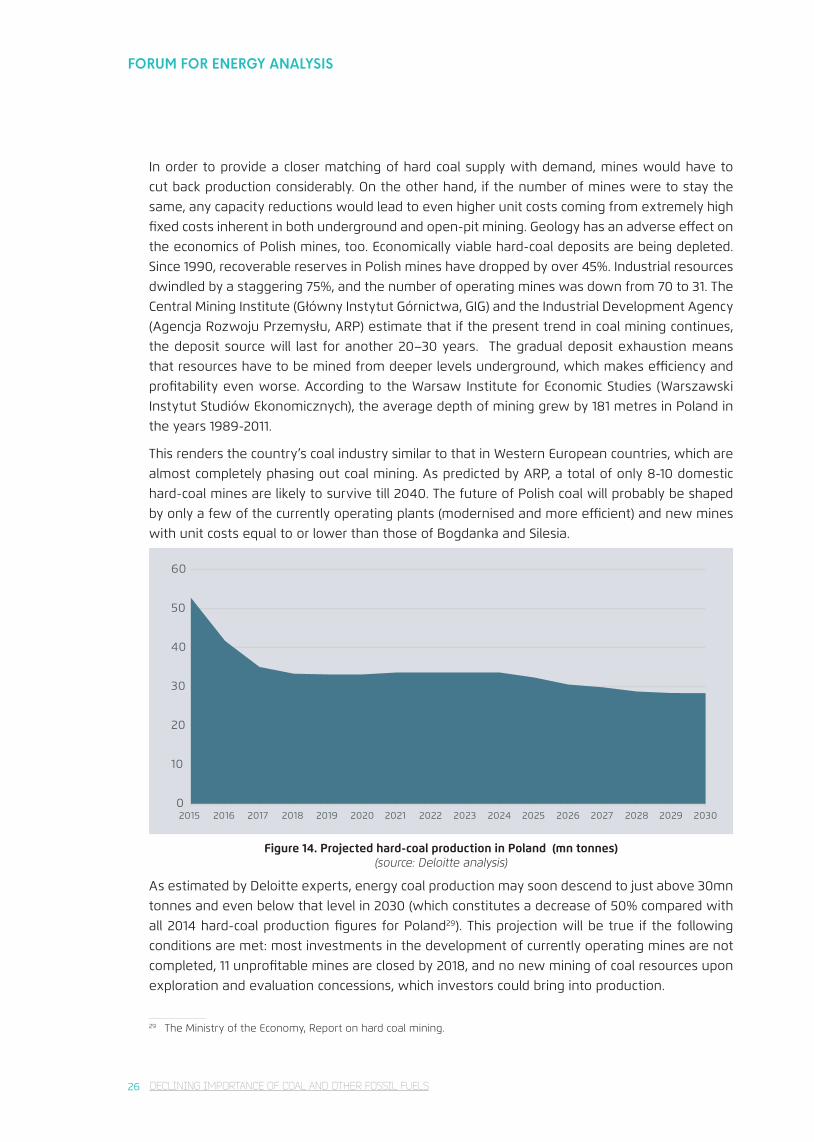
In order to provide a closer matching of hard coal supply with demand, mines would have to cut back production considerably. On the other hand, if the number of mines were to stay the same, any capacity reductions would lead to even higher unit costs coming from extremely high fixed costs inherent in both underground and open-pit mining. Geology has an adverse effect on the economics of Polish mines, too. Economically viable hard-coal deposits are being depleted. Since 1990, recoverable reserves in Polish mines have dropped by over 45%. Industrial resources dwindled by a staggering 75%, and the number of operating mines was down from 70 to 31. The Central Mining Institute (Główny Instytut Górnictwa, GIG) and the Industrial Development Agency (Agencja Rozwoju Przemysłu, ARP) estimate that if the present trend in coal mining continues, the deposit source will last for another 20–30 years. The gradual deposit exhaustion means that resources have to be mined from deeper levels underground, which makes efficiency and profitability even worse. According to the Warsaw Institute for Economic Studies (Warszawski Instytut Studiów Ekonomicznych), the average depth of mining grew by 181 metres in Poland in the years 1989-2011.
This renders the country’s coal industry similar to that in Western European countries, which are almost completely phasing out coal mining. As predicted by ARP, a total of only 8-10 domestic hard-coal mines are likely to survive till 2040. The future of Polish coal will probably be shaped by only a few of the currently operating plants (modernised and more efficient) and new mines with unit costs equal to or lower than those of Bogdanka and Silesia.
0
10
20
30
40
50
60
2015 2016 2017 2018 2019 2020 2021 2022 2023 2024 2025 2026 2027 2028 2029 2030
Figure 14. Projected hard-coal production in Poland (mn tonnes) (source: Deloitte analysis)
As estimated by Deloitte experts, energy coal production may soon descend to just above 30mn tonnes and even below that level in 2030 (which constitutes a decrease of 50% compared with all 2014 hard-coal production figures for Poland29). This projection will be true if the following conditions are met: most investments in the development of currently operating mines are not completed, 11 unprofitable mines are closed by 2018, and no new mining of coal resources upon exploration and evaluation concessions, which investors could bring into production.
29 The Ministry of the Economy, Report on hard coal mining.
Polish power sector riding on the wave of megatrends
27DECLINING IMPORTANCE OF COAL AND OTHER FOSSIL FUELS
It is possible that no new mines will be opened. According to Moody’s 2015 report, 70% of mines are unprofitable worldwide. In 2015, many mines across the world have lost or permanently decreased their profitability. They are being closed down or sold for a fraction of their value several years back or even for free30. According to some analysts’ forecasts, the permanent coal oversupply in the Polish market driven by the unwillingness to close down pits may discourage investors further. This may drive down domestic production further (even below 20mn tonnes).
Support for initiatives to open new, modern and safe mines that are cheap to operate will be critical for coal mining volumes in Poland.
Lignite
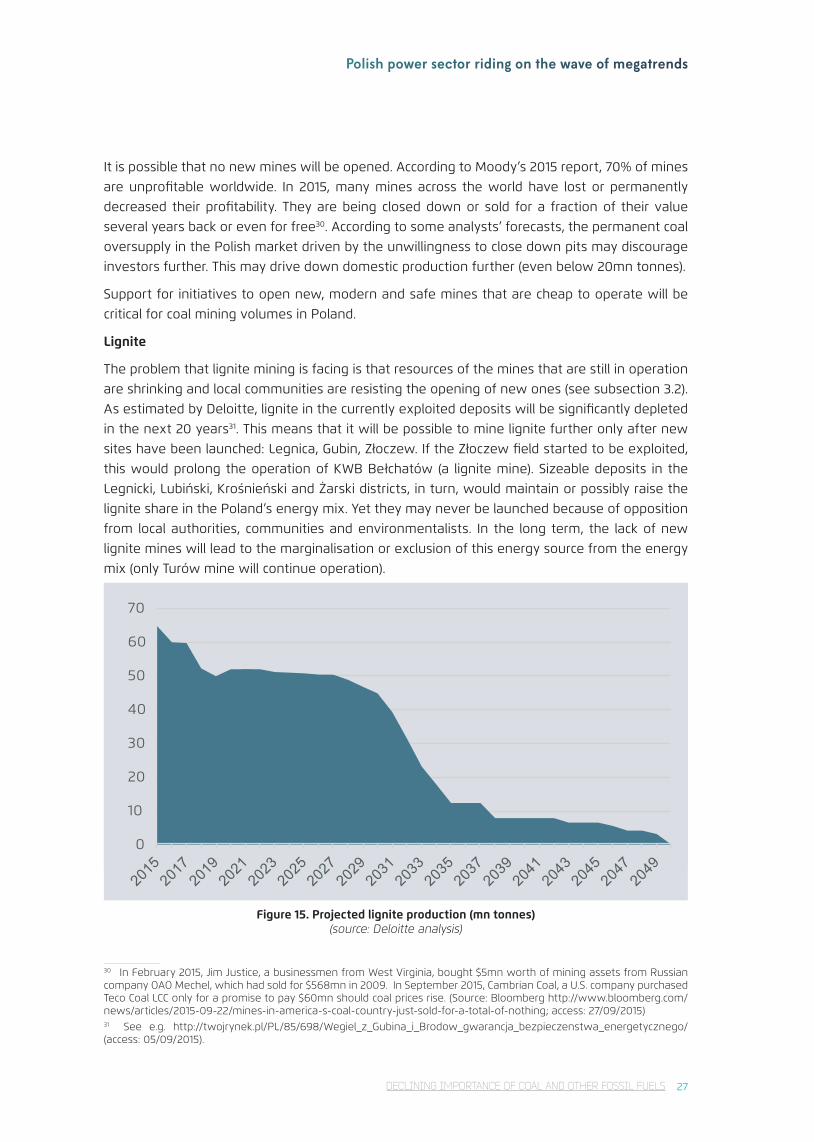
The problem that lignite mining is facing is that resources of the mines that are still in operation are shrinking and local communities are resisting the opening of new ones (see subsection 3.2). As estimated by Deloitte, lignite in the currently exploited deposits will be significantly depleted in the next 20 years31. This means that it will be possible to mine lignite further only after new sites have been launched: Legnica, Gubin, Złoczew. If the Złoczew field started to be exploited, this would prolong the operation of KWB Bełchatów (a lignite mine). Sizeable deposits in the Legnicki, Lubiński, Krośnieński and Żarski districts, in turn, would maintain or possibly raise the lignite share in the Poland’s energy mix. Yet they may never be launched because of opposition from local authorities, communities and environmentalists. In the long term, the lack of new lignite mines will lead to the marginalisation or exclusion of this energy source from the energy mix (only Turów mine will continue operation).
0
10
20
30
40
50
60
70
Figure 15. Projected lignite production (mn tonnes) (source: Deloitte analysis)
30 In February 2015, Jim Justice, a businessmen from West Virginia, bought $5mn worth of mining assets from Russian company OAO Mechel, which had sold for $568mn in 2009. In September 2015, Cambrian Coal, a U.S. company purchased Teco Coal LCC only for a promise to pay $60mn should coal prices rise. (Source: Bloomberg http://www.bloomberg.com/news/articles/2015-09-22/mines-in-america-s-coal-country-just-sold-for-a-total-of-nothing; access: 27/09/2015)31 See e.g. http://twojrynek.pl/PL/85/698/Wegiel_z_Gubina_i_Brodow_gwarancja_bezpieczenstwa_energetycznego/ (access: 05/09/2015).
FORUM FOR ENERGY ANALYSIS
28 DECLINING IMPORTANCE OF COAL AND OTHER FOSSIL FUELS
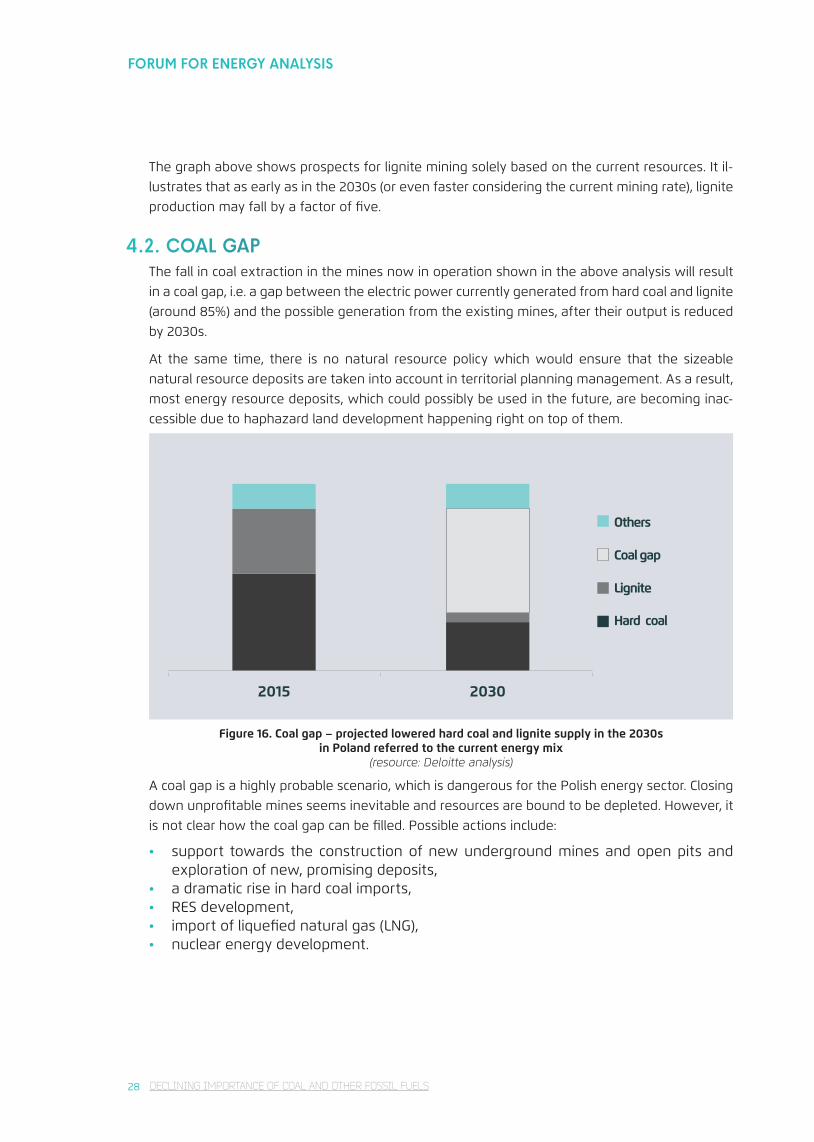
The graph above shows prospects for lignite mining solely based on the current resources. It il-lustrates that as early as in the 2030s (or even faster considering the current mining rate), lignite production may fall by a factor of five.
4.2. COAL GAPThe fall in coal extraction in the mines now in operation shown in the above analysis will result in a coal gap, i.e. a gap between the electric power currently generated from hard coal and lignite (around 85%) and the possible generation from the existing mines, after their output is reduced by 2030s.
At the same time, there is no natural resource policy which would ensure that the sizeable natural resource deposits are taken into account in territorial planning management. As a result, most energy resource deposits, which could possibly be used in the future, are becoming inac-cessible due to haphazard land development happening right on top of them.
2015 2030
Hard coal
Lignite
Coal gap
Others
Figure 16. Coal gap – projected lowered hard coal and lignite supply in the 2030s in Poland referred to the current energy mix
(resource: Deloitte analysis)
A coal gap is a highly probable scenario, which is dangerous for the Polish energy sector. Closing down unprofitable mines seems inevitable and resources are bound to be depleted. However, it is not clear how the coal gap can be filled. Possible actions include:
• support towards the construction of new underground mines and open pits and exploration of new, promising deposits,
• a dramatic rise in hard coal imports,• RES development,• import of liquefied natural gas (LNG),• nuclear energy development.
Polish power sector riding on the wave of megatrends
29DECLINING IMPORTANCE OF COAL AND OTHER FOSSIL FUELS / IMPROVING ENERGY EFFICIENCY
Each of these solutions has advantages and disadvantages. Alternative energy sources require considerable capital expenditures. Coal imports means less energy security due to the reliance on imports, mainly from Russia. There are no clear legal conditions for developing mining invest-ments or branches of energy industry which have so far been absent in Poland (for instance LNG, nuclear energy). Significant improvements in energy efficiency and energy system flexibility are also viable options.
Consequences and perspectives:
A coal gap is becoming a more and more likely scenario, which needs to be taken into account in Poland for the next 10-15 years. Regardless of what political and economic decisions will be made in this respect, it will result in changing the energy mix and the ensuing modifications of conventional energy business models (cf. chapter 6).
5. IMPROVING ENERGY EFFICIENCY
Megatrend:Energy intensity, defined as energy consumed per unit of GDP, has been falling consistently in most global economies. What is more, the traditional principle according to which economic growth is related to greater power consumption is ceasing to apply in more economically de-veloped regions. The megatrend comprises decreasing energy intensity of the economy, the development of solutions and technologies to limit energy consumption in industry and buildings, and efforts to make demand flexible (including energy demand side management) and enable lowering generation reserves in an electric power system.
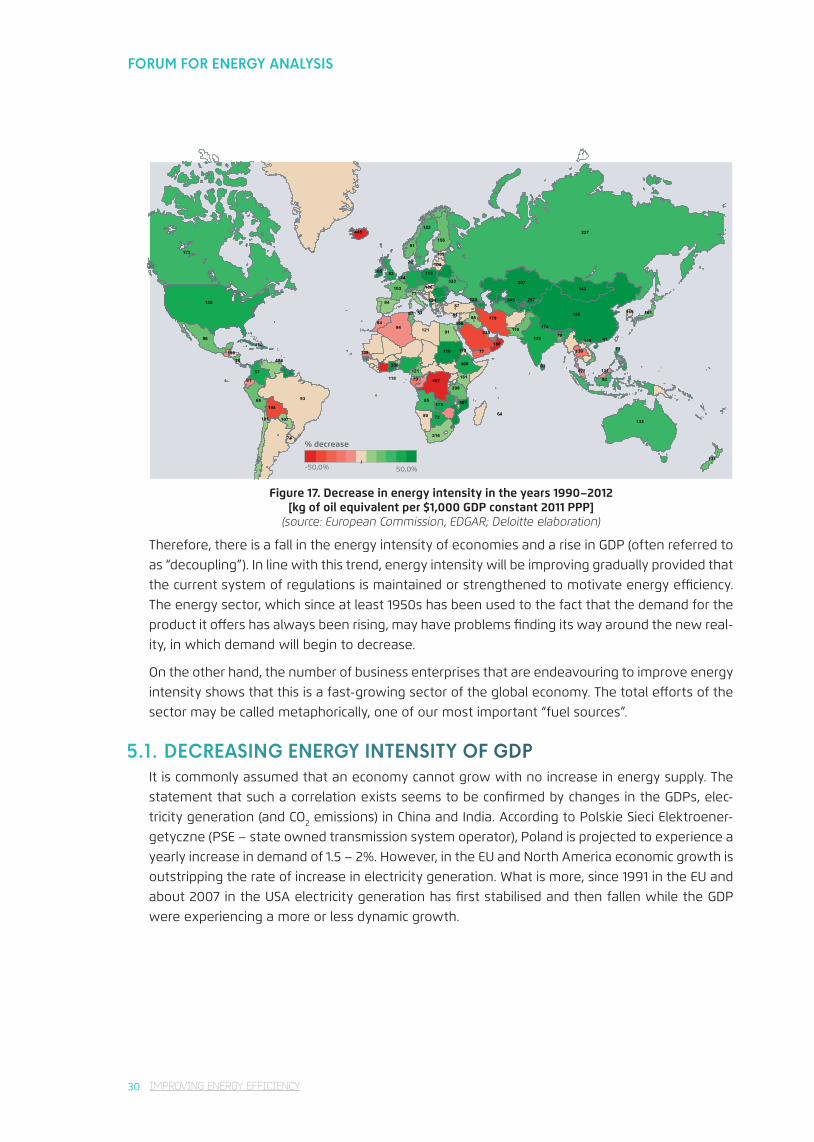
Between 1990 and 2012, most countries, including virtually the entirety of Europe, North America and most Southern and Eastern Asian countries (China included), recorded a substantial fall in the energy intensity of their economies (measured with the consumption of all forms of energy and considering changes in the purchasing power of respective currencies). The opposite trend is present mainly in developing countries and countries that are producers of primary energy sources.
FORUM FOR ENERGY ANALYSIS
30 IMPROVING ENERGY EFFICIENCY
-50,0% 50,0%
% decrease
494
124
174
124
144
104
165
445
175
235
195
155
135 345
156
106
106
216
116
173
143
133
323
113
103
123
107
118
138
207
358
128
127
457
257
227
407
139
169
179
209
149
110180250
110
400
122
101
131
101
121 131
121
181
84
84
64
94
74
75
95
65
95
66
96
63
73
93
83
93
57
77
5787
87
77
79
79
80
72
72
9141
91
81
91
Figure 17. Decrease in energy intensity in the years 1990–2012 [kg of oil equivalent per $1,000 GDP constant 2011 PPP]
(source: European Commission, EDGAR; Deloitte elaboration)
Therefore, there is a fall in the energy intensity of economies and a rise in GDP (often referred to as “decoupling”). In line with this trend, energy intensity will be improving gradually provided that the current system of regulations is maintained or strengthened to motivate energy efficiency. The energy sector, which since at least 1950s has been used to the fact that the demand for the product it offers has always been rising, may have problems finding its way around the new real-ity, in which demand will begin to decrease.
On the other hand, the number of business enterprises that are endeavouring to improve energy intensity shows that this is a fast-growing sector of the global economy. The total efforts of the sector may be called metaphorically, one of our most important “fuel sources”.
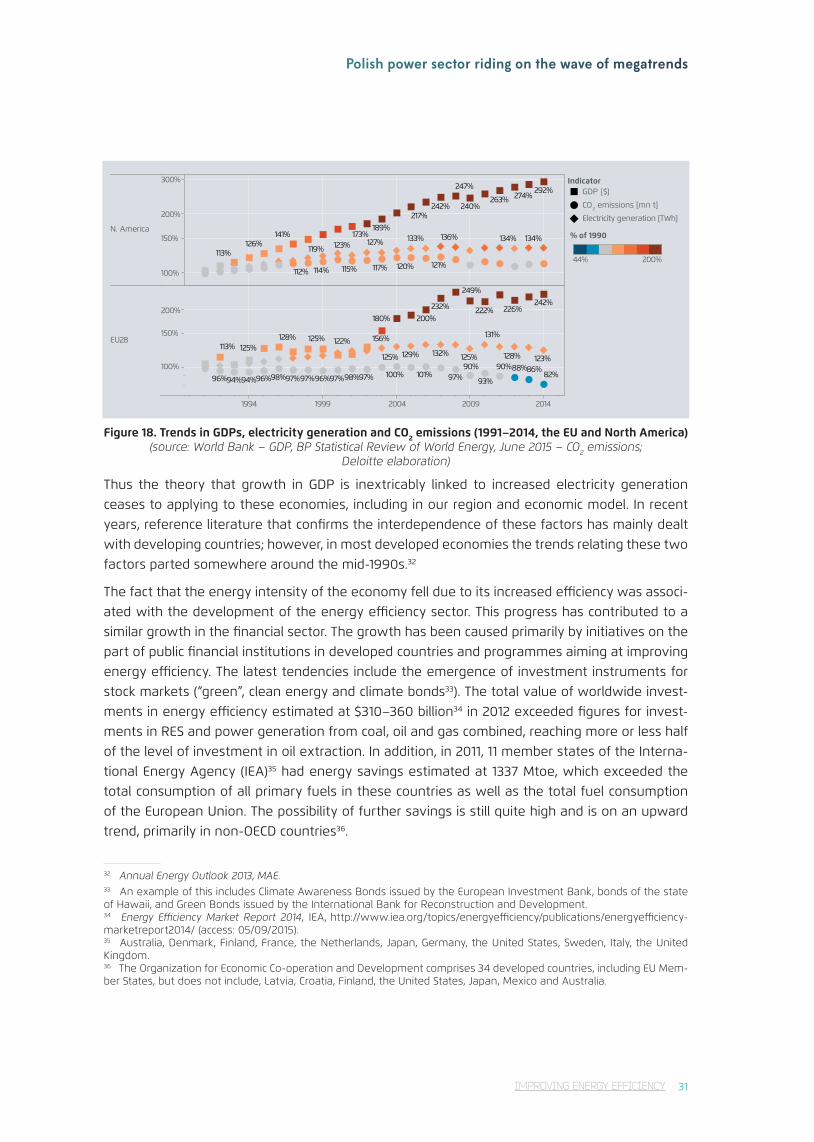
5.1. DECREASING ENERGY INTENSITY OF GDPIt is commonly assumed that an economy cannot grow with no increase in energy supply. The statement that such a correlation exists seems to be confirmed by changes in the GDPs, elec-tricity generation (and CO2 emissions) in China and India. According to Polskie Sieci Elektroener-getyczne (PSE – state owned transmission system operator), Poland is projected to experience a yearly increase in demand of 1.5 – 2%. However, in the EU and North America economic growth is outstripping the rate of increase in electricity generation. What is more, since 1991 in the EU and about 2007 in the USA electricity generation has first stabilised and then fallen while the GDP were experiencing a more or less dynamic growth.
Polish power sector riding on the wave of megatrends
31IMPROVING ENERGY EFFICIENCY
1994 1999 2004 2009 2014
N. America
EU28
100%
150%
200%
300%
100%
150%
200%
127%123%119%134%136% 134%133%
117% 120% 121%114%112% 115%
113%126%
141%
263%292%
274%240%
247%
242%217%
189%173%
132%129%125%
122%
123%128%
131%
125%90%
93%
90%88%86%82%96%94%94%96%98%97%97%96%97%98%97% 100% 101% 97%
113% 125%128% 125%
242%226%222%
249%
232%200%180%
156%
44% 200%
% of 1990
IndicatorGDP [$]
CO2 emissions [mn t]
Electricity generation [TWh]
Figure 18. Trends in GDPs, electricity generation and CO2 emissions (1991–2014, the EU and North America) (source: World Bank – GDP, BP Statistical Review of World Energy, June 2015 – CO2 emissions;
Deloitte elaboration)
Thus the theory that growth in GDP is inextricably linked to increased electricity generation ceases to applying to these economies, including in our region and economic model. In recent years, reference literature that confirms the interdependence of these factors has mainly dealt with developing countries; however, in most developed economies the trends relating these two factors parted somewhere around the mid-1990s.32
The fact that the energy intensity of the economy fell due to its increased efficiency was associ-ated with the development of the energy efficiency sector. This progress has contributed to a similar growth in the financial sector. The growth has been caused primarily by initiatives on the part of public financial institutions in developed countries and programmes aiming at improving energy efficiency. The latest tendencies include the emergence of investment instruments for stock markets (“green”, clean energy and climate bonds33). The total value of worldwide invest-ments in energy efficiency estimated at $310–360 billion34 in 2012 exceeded figures for invest-ments in RES and power generation from coal, oil and gas combined, reaching more or less half of the level of investment in oil extraction. In addition, in 2011, 11 member states of the Interna-tional Energy Agency (IEA)35 had energy savings estimated at 1337 Mtoe, which exceeded the total consumption of all primary fuels in these countries as well as the total fuel consumption of the European Union. The possibility of further savings is still quite high and is on an upward trend, primarily in non-OECD countries36.
32 Annual Energy Outlook 2013, MAE.33 An example of this includes Climate Awareness Bonds issued by the European Investment Bank, bonds of the state of Hawaii, and Green Bonds issued by the International Bank for Reconstruction and Development. 34 Energy Efficiency Market Report 2014, IEA, http://www.iea.org/topics/energyefficiency/publications/energyefficiency-marketreport2014/ (access: 05/09/2015).35 Australia, Denmark, Finland, France, the Netherlands, Japan, Germany, the United States, Sweden, Italy, the United Kingdom.36 The Organization for Economic Co-operation and Development comprises 34 developed countries, including EU Mem-ber States, but does not include, Latvia, Croatia, Finland, the United States, Japan, Mexico and Australia.
FORUM FOR ENERGY ANALYSIS
32 IMPROVING ENERGY EFFICIENCY
5.2. LIMITING ENERGY INTENSITY IN INDUSTRY AND CONSTRUCTION
According to data from the International Energy Agency (IEA), the construction, transport and industrial sectors will account for about 88% of worldwide energy consumption in 2020. Con-struction and industry are responsible for consuming most electricity in Poland37 and they have the greatest potential to improve energy efficiency. European industry has been improving ef-ficiency since at least the mid-1990s. For example in Germany, energy consumption in the steel industry fell by 10% per 1 ton of a product between 1995 and 2010 and the improvement in Spain and Italy was twice as high.
In Poland this process was more rapid due to the high energy intensity of the industry inherited from the pre-1989 era. As a consequence of the organizational and technological changes imple-mented since 1995, the energy consumption of the Polish industry was lowered by nearly 30% (especially in the metallurgy and cement industries), almost to the level seen in Western Europe.
2000
kWh/
100
0 e
uros
GD
P20
00
pri
ces
FI PT BE GR ES NL SE AT IT FR DE GB DK PL
6
5
4
3
2
1
0
2010
Figure 19. Energy intensity of the industry in Poland and the UE-15; 2000-2010 (source: WISE)
The potential for Poland to improve its energy efficiency further is substantial, yet it will be nec-essary to create regulatory incentives. The greatest potential lies in metallurgy (2 TWh can be saved yearly up till the middle of the century38) thanks to heat and blast-furnace gas recovery technologies. Recycling steel and by-products in production (e.g. replacing limestone with iron slag) and briquetting dust and metal waste separated from slag enable eliminating of the sinter-ing process from production, thus getting rid of gases and dust, lowering water consumption, and last but not least, bringing down the demand for coking coal and iron granules39. Metallurgy is an international enterprise and inter-company technology transfers ensure that what happens elsewhere will happen in Poland.
Moreover, it is estimated that energy savings in the construction sector may decrease Poland’s demand for energy by 65 TWh in 2030 and by 151 TWh in 2050.40 The trend that is present today concerns the widespread thermal upgrading of mainly multi-family residential buildings built in the 1990s or earlier. In Poland, more advanced technologies for lowering energy consumption have been applied mainly by developers of commercial real estate (principally office buildings)
37 Low-carbon Poland 2050.pl – A journey towards a low-carbon future, WISE, http://np2050.pl/files/pliki/NP_2050__CA-LOSC_internet_2.pdf (access: 05/09/2015).38 Ibidem.39 See http://www.ruukki.pl/Informacje-i-wydarzenia/Archiwum-informacji/2014/Efektywnosc-materialowa-i-energetyc-zna-w-produkcji-stali-moze-wyraznie-zmniejszyc-wplyw-wyrobow-koncowych-na-srodowisko (access: 05/09/2015).40 Low-carbon Poland 2050.pl – A journey towards a low-carbon future, WISE, http://np2050.pl/files/pliki/NP_2050__CA-LOSC_internet_2.pdf (access: 05/09/2015).
Polish power sector riding on the wave of megatrends
33IMPROVING ENERGY EFFICIENCY / NEW BUSINESS MODELS AND THE ROLE OF TRADITIONAL ENERGY COMPANIES
that see the commercial potential in the energy efficiency of their buildings as certified under BREEAM or LEED.
Despite the availability of thermal insulation solutions, there are barriers that prevent adoption: cost, lack of appropriate information about their benefits and insufficient know-how.
Consequences and perspectives:
Further reductions in energy demand in the economy will change business models of conven-tional energy industry, such as a rise in demand side management.The trend in growing investments in energy efficiency, strengthened by market uptake of energy efficiency technologies, regulatory support, and rising electricity prices, will gradually remove subsidies for efficiency investments
6. NEW BUSINESS MODELS AND THE ROLE OF TRADITIONAL ENERGY COMPANIES
Megatrend:
The new possibilities that are emerging with regard to energy generation and distribution arise from the development of decentralized energy and the change in the role and signifi-cance of traditional large-scale energy. These trends give rise to the development of com-petition not only in the area of energy generation and trading, but also in transmission and distribution. This phenomenon, comparable to the revolution in the telecommunication sector, will alter conventional energy business models.
The traditional power sector, which has gained its position and scale as a monopoly, is gradu-ally transforming into another area of a free, market-oriented economy. The changes that until now have been driven by regulation, encompassed power generation and sales; however, the technological and social transformation discussed in earlier chapters is already leading to the emergence of new energy market segments and new business models.
6.1. COMPETITION IN THE ENERGY SECTOR – FROM TPA TO MICRO-GENERATION AND DISTRIBUTED SYSTEMS
For several decades the power sector has developed as an integrated monopoly engaged in pro-ducing, transmitting, distributing and selling electricity to the end user. The identified inefficiency of the model made it necessary to seek the possibility of liberating and deregulating the energy sector. It was acknowledged that certain services so far provided by monopolies could also be subject to market competition. These include generation and trading in electricity.
To introduce competition in these fields, it was necessary to implement organizational changes to separate (in formal terms, as well as in terms of scope and ownership) activities considered to be a natural monopoly (i.e. electricity transmission and distribution), from those that can be exposed to competition, i.e. energy generation and trading. These changes included unbundling
FORUM FOR ENERGY ANALYSIS
34 NEW BUSINESS MODELS AND THE ROLE OF TRADITIONAL ENERGY COMPANIES
and TPA (Third Party Access), or, in a nutshell, the obligation on the part of electrical grid opera-tors to grant access to their infrastructure in an equal and non-discriminatory manner for all un-dertakings that are interested in producing and/or trading in electricity. The TPA principle grants each recipient the right of free choice of electricity supplier, which new undertakings in the retail sales market benefit from.
It seems that real competition can only occur as an effect of a technological breakthrough simi-lar to the one that took place in the telecommunications sector, in which the advent of mobile phones, later replaced with smartphones, revolutionised not only the way the entire industry functioned, but also many other walks of everyday life.
New possibilities for small recipients
An average end user, with the exception of big industrial customers that often have their own large-capacity energy sources, has had so far little choice to meet his or her own energy needs. The only thing the end user could do to buy electricity was to connect to an electrical grid. Grid operators, in turn, delivered power to their customers and benefited from the sales, a consider-able part of the sales being dependent on how much energy was supplied.
The technological advancement described in chapter 2 combined with lower costs of electricity generation from small sources has enabled customers, who have so far been delivered electric-ity from a grid, to generate power on their own and meet their electricity demands to a larger and larger extent. Therefore they have now at least several options to choose from:
a) traditional: being connected to a grid, a possibility available to everyone,b) becoming prosumers: connecting to a network and installing their own energy
source (a micro-windmill, a FV),c) becoming prosumers with their own storage: connecting to a grid + their own en-
ergy source + storage,d) off-grid41 systems: an end-user’s own source + storage + disconnection from the
public electrical grid.
Fighting for “the last mile”.
It is also evident that the next option may be the establishment of stand-alone enclaves not connected to the grid, in which end users themselves generate, exchange, and store power among themselves. It is only a matter of time before such enclaves and their operators (local operators of balancing zones), aggregators and virtual power plants appear. In some places these processes have already started (see subsection 3.3). Competitive struggle will begin for the so called last mile, a phenomenon experienced before in the fixed voice telephony and ca-ble television industries. “The last mile” of an energy system can include low-voltage grids and installations in multi-tenant buildings, tenants’ associations, housing associations, or even entire housing estates, villages and towns.
Virtual power plants, the role of aggregators
In practice, access to the wholesale market and system services market is limited to large utilities (system power plants, industrial customers) only. However, with decentralized generation develop-
41 Being off-grid (using stand-alone systems): relying on installations not connected to the main grid and operating in-dependently, also in areas remote from public utilities.
Polish power sector riding on the wave of megatrends
35NEW BUSINESS MODELS AND THE ROLE OF TRADITIONAL ENERGY COMPANIES
ing in micro-sources and electricity demand actively managed even by small recipients, the right economy of scale needed to gain access to the wholesale market and system services market can be achieved by a new utility, namely an aggregator42, that has appeared on the energy markets.
German company Energy2Market provides an interesting example of the implementation of the idea of a virtual power plant. The company provides services to medium-size energy producers who mainly rely on renewable generation sources. Aggregation covers over 2700 power-producing installations relying on bio-gas, biomass, wind, photovoltaics, hydropower and co-generation, with a combined capacity of more than 3200MW, with the smallest asset under Energy2Market control hav-ing the capacity of just several dozen kilowatts. The scale that the company’s operations have and the assets it manages, enable it to work in an electrical system in a way that a system power plant does and to even offer system services, such as primary and secondary control.
6.2. TRADITIONAL ENERGY COMPANIES IN THE LIGHT OF CHANGEThe transformations that are taking place, will force the current players to change their habits and business models and certainly to verify the procedures, according to which their grids are managed. Low- and medium-voltage grids were usually designed as radial and one-way systems. Meanwhile, the direction of the power flow those grids were designed for, may be reversed, which may, for ex-ample, affect the performance of their protection systems (over-current, short circuit and distance).
However the direct consequence, most often the first to be noticed by distribution system opera-tors, will be that less energy will be drawn from their grids, which will lead to lower revenues, which historically have been based on the amount of energy delivered to the end user. This will cause the volumes of energy drawn from a grid to dwindle. A Rocky Mountain Institute43 report attempts to assess the phenomenon for the northern and eastern part of the United States. It is estimated that within 15 years (2015 - 2030) the fall may amount to 58 million MWh and affect 9.6 million house-holds, and 83 million MWh for 1.9 million industrial customers, or 50% and 60% of their current vol-umes, respectively.
The simplest strategy for energy companies would seem to be to decrease variable rates and in-crease fixed ones (independent from the amount of energy consumed by end-users). In practice, however, utilities will encounter various regulatory and market restrictions. One of the most danger-ous consequences of the strategy is that more downstream users will be disconnected from grids, as was the case of the fixed voice telephony and, to some extent, in the network heating sector (when gas prices were so low that the heat produced in a local boiler was cheaper than that from the district heating system). In such a situation one interesting solution could be the one put forward by Prof. Jan Popczyk44, in which he proposes the gradual sale of lowvoltage distribution systems (and the “last mile” of “poorly” loaded mediumvoltage system) by distribution system operators to rural areas (selfgovernments, energy cooperative, or IPPs), as well as the sale of low- and mediumvoltage neighbourhood networks in cities to housing cooperatives.
42 Information on the role and potential tasks of aggregators can be found in: M. Kaleta, P. Pałka, I. Żółtowska, Rola i funkcje agregatora z perspektywy europejskich projektów sieci inteligentnych, (“Role and function of aggregators from the perspective of European intelligent grid projects”), Rynek Energii 3(112)/2014, pp.18-22.43 The economics of load defection. How grid-connected solar-plus battery systems will compete with traditional electric service, why it matters, and possible paths forward, Rocky Mountain Institute, April 2015.44 J. Popczyk, ELEKTROENERGETYKA 2014 – o potrzebie rozwoju (II restrukturyzacji polskiej energetyki) (ELEKTROENER-GETYKA 2014 – on the need of the development (second restructuring) of Poland’s energy sector), http://www.cire.pl/pokaz-pdf-%252Fpliki%252F2%252Felektroenergetyka_2014_potrzeba_rozwoju_i_ii_restrukturyzacji_ energetyki_2014.pdf (access: 05/09/2015).
FORUM FOR ENERGY ANALYSIS
36 NEW BUSINESS MODELS AND THE ROLE OF TRADITIONAL ENERGY COMPANIES
Energy companies need to find their way under these new conditions. The structural, technological, and social transformations in the energy sector will span over many years to come. It is undeniable that during that period we will witness conventional energy and innovative virtual power plants as well as smart grids and intelligent buildings coexisting with one another.
Grid operators will play a key. Many people may find it surprising, that grid operators are now the ones who own the most valuable assets. And yet those companies will be most adversely affected by the current changes. Electrical grids, most certainly controlled and managed differently than now, will have an important role to play in the future. Their operators’ role will be increasing, especially in the area of balancing and active management of their grids’ operation, in the value chain linking measurement, with data systems, optimization and control.
Unfortunately, in the long term, such a future will not be enjoyed by conventional power generation utilities. The biggest power companies are already changing their strategies in order to survive in the market. An example of this is provided by E.ON, which has split itself into two distinctly focused businesses: conventional (Old World – traditional generation) and innovative (New World – RES, grids, services). Another example is the company GDF Suez, which has decided to change the name of the company and re-brand it in order to highlight their altered strategy. Its corporate motto is “GDF Suez is now ENGIE” and the new image is supported by the research and development of new technolo-gies and innovativeness, primarily based on RES, including solar and digital technologies.
In Europe and Poland the number of highly dynamic retail businesses of various sizes is already in-creasing and they are able to compete with traditional power utilities more and more efficiently. New methods of sales portfolio and economics management combined with the latest advances in com-munications and IT, together with a customer approach comparable to that of modern e-commerce, will undoubtedly cause the current leaders to lose substantial market share.
The future of traditional energy utilities is about:
• becoming oriented towards demand and customer services;• communicating with customers on-line;• end users interacting with the energy (wholesale) market on a current basis, where energy
prices will indicate the availability of resources;• understanding that customers will change their behaviour to adapt their demand to energy
availability;• coming to terms with the fact that intelligent meters will be used for two-way communica-
tion, rather than only for measuring how much energy has been drawn;• realizing that the Internet of Things (IoT) technology will develop exponentially and will be
used to, for instance, find the balance between demand and supply.
Consequences and perspectives:
In response to the transformation of the energy sector (caused by megatrends) new possibili-ties will appear for enterprises operating in a liberalized energy market. The business model of energy companies’ in centralised power systems will be gradually re-placed with new forms of business that are better adapted to the market. New, interesting areas will emerge in RES generation and energy efficiency, transmission and distribution.
Polish power sector riding on the wave of megatrends
37CONCLUSIONS
7. CONCLUSIONSFor many decades now, the energy sector has been developing without much regard for the impact it has had on society. With more attention being paid to climate protection in the public debate, the energy sector has limited itself to meeting standards relating to emission limits. Now the power sector is increasingly being viewed from an environmental standpoint. Traditionalists consider this relationship to be just a passing fad. We believe that this is a long-term phenom-enon – the environment and the energy sector will stay inextricably linked.
Currently, the clash of these notions is determining the direction towards which the public debate is headed. For instance, the structure of offices and institutions is changing, such as the UK’s Department of Energy and Climate Change. These developments are changing both strategies of entire economic sectors and political systems, as individual voter behaviour coalesces behind broad megatrends. Energy utilities can no longer overlook their environmental impact. Business strategies need to be coupled with environmental and climate strategies, or else the strategy will be ineffective.
We are witness to a change in consumers’ attitude – end users are more and more frequently becoming conscious clients and market players. They are taking more of an interest in generat-ing energy to meet their own needs. Customer expectations as to the quality of services they receive are shaped by the latest technologies available to them, e.g. Internet services. And it is the customer experience with those services that will be a benchmark for the energy sector services. The rapid changes that we are already seeing in retail sales are likely to be reinforced further in the future.
A customer expects power companies to deliver their products and services in a reliable and modern manner, to ensure comfort, yet remain “invisible” and have minimal climate and envi-ronmental impact. The NIMBY syndrome has changed the course and designs of many energy solutions (e.g. the routing of a grid). In other cases, it has caused, or may cause, selected projects and investments (in open pits or power plants) to be abandoned completely.
Meanwhile for the first time in history the end user may appear in the role of an entrepreneur who is free to pick and choose energy solutions other than power purchased from large utilities. Technological progress and citizen-friendly regulations already today are making it possible to come up with technological solutions tailored to individual needs. The development of decentral-ized energy systems will be supported by the fact that local electricity and heat production and distribution are now possible.
For this reason, electricity distributors will be faced with the necessity of reconciling new in-vestments and costs necessary for meeting growing expectations as to the grid reliability and flexibility (suited for local production and prosumers) with decreases in customer numbers (self-generation) and volumes of energy sold, which will mean lower revenues. This will make it nec-essary to come up with a new business, financial and regulatory model to ensure stability and prevent the sector from spiralling down a risky path: the more expensive distribution, the lower
FORUM FOR ENERGY ANALYSIS
38 CONCLUSIONS
sales volume, the higher distribution unit cost, the higher motivation on the part of the end-user to become independent, and so on.
The client, in turn, is paying more and more attention to the amount of energy consumed both because of its cost and environmental impact. Households and the industry will be using less and consuming energy in a different time pattern. This is one of the reasons behind changes in traditional system load schedules.
The structure of power generation is also going to change. Current technologies enable building new, unconventional sources locally (from towns and neighbourhoods, to manufacturing plants, and to in-home installations). Many of these sources have a privileged position in the merit order and in variable costs, a fact that is driving down production volumes of large-scale generators. Under the present market structure the economic model for these generators will collapse. Who and how will maintain the resources that are still useful and even system safety critical, is a question to which there is no good answer today. The same applies to investments: according to many, large-scale conventional energy blocks that are currently under construction in Europe may be the last of their kind.
Local, cutting-edge and innovative heating and electricity solutions may become a panacea for low-stack household emissions and consequently improve health conditions. The projects may also stimulate investment and economic growth, create new jobs, make places more attractive for tourists, increase real estate prices, and, finally, deliver electric power locally (co-generation), at the same time stabilizing electric power systems. This is not only an entire set of benefits, but also an opportunity, for Poland, as an EU Member State, to develop a now missing, yet much needed unambiguously positive energy scenario – that of pushing down CO2 emissions and protecting air quality .
Poland is facing a challenge: the daunting future of hard coal. Its prices are much lower in global markets than the costs of domestic production, and they are projected to tumble further for many years to come. Only lower transport costs – compared with those of imports – may con-tribute to Polish coal becoming more competitive in terms of price in large areas of the country. And this, too, will only happen if production costs are driven down to the level attained solely by the most efficient coal mines. It is not possible to subsidize coal production, not only because of the EU restrictions with regard to public financial support, but also the state’s financial capacity.
The same difficulty is being experienced by the lignite sector: the resource is being depleted where it has been mined, whereas public approval for new open pits is at an exceptionally low level. In such conditions, only those lignite deposits that are economically viable to produce and have been given the go-ahead from the local community will be rendered accessible to mine. The latter may prevent new open pits from ever being built.
Having analysed the lifetime and economics of the mines still in operation and the current pro-jects under construction, we estimate that by 2030 the share of coal from currently working mines in the Poland’s energy mix will have fallen from the present 85% to a level even below 30%. The difference between the two figures, which we call a “coal gap”, is a space to be filled-in conceptually by the country’s energy policy makers and enterprises.

Polish power sector riding on the wave of megatrends
39CONCLUSIONS
Filling the gap fully with foreign coal is not the best solution for Poland. But opportunities do include building new mines and developing new, various energy generation technologies, also those relating to renewable energy. This will most probably, change the structure of the future energy mix (if new mines do not meet domestic energy needs).
Poland’s need to fill the gap is both a threat and an opportunity for its business, innovation, labour market and natural environment. Creating a development strategy that will take account of the megatrends that are shaping the landscape of Polish and European energy to 2030 may possibly contribute to the global efforts to combat climate change.
Paweł Smoleń
FORUM FOR ENERGY ANALYSIS
40 BIBLIOGRAPHY
BIBLIOGRAPHYEU legislation
1. Proposal for a DIRECTIVE OF THE EUROPEAN PARLIAMENT AND OF THE COUNCIL on the limita-tion of emissions of certain pollutants into the air from medium combustion plants (MCP);
2. Directive 2008/50/EC of the European Parliament and of the Council of 21 May 2008 on ambi-ent air quality and cleaner air for Europe (CAFÉ);
3. Directive 2010/75/EU of the European Parliament and the Council on industrial emissions (IED).
Publications
1. Air quality in Europe — 2014 report, EEA Report No 5/2014, European Environment Agency, Co-penhagen, Denmark;
2. Annual Energy Outlook 2013 with Projections to 2040, U.S. Energy Information Administration (EIA), April 2013;
3. World energy outlook 2013, International Energy Agency, Paris, France, 2013;
4. Badanie świadomości i zachowań ekologicznych mieszkańców Polski. Badanie trackingowe – pomiar: październik 2014. TNS Polska report for Ministry of the Environment, 2014;
5. BP Statistical Review of World Energy 2015, BP, June 2015;
6. Crossing the Chasm – Solar Grid Parity in a Low Oil Price Era, Deutsche Bank report, February 2015;
7. Energy Efficiency Market Report 2014 © OECD/IEA 2014, International Energy Agency, Paris, France, 2014;
8. Global Market Outlook for Solar Power 2015-2019, SolarPower Europe, June 2015;
9. Krajowy bilans emisji SO2, NOx, CO, NH3, NMLZO, pyłów, metali ciężkich i TZO w układzie klasyfi-kacji SNAP i NFR. Raport podstawowy, KOBIZE, 2015;
10. Informacja o funkcjonowaniu górnictwa węgla kamiennego (w latach 2011-2015), Ministry of the Economy;
11. Niskoemisyjna Polska. 2050.pl – podróż do niskoemisyjnej przyszłości, WISE, Warsaw, 2013;
12. Ochrona powietrza przed zanieczyszczeniami. Informacja o wynikach kontroli, Supreme Audit Office, 1st December 2014;
13. Rola i funkcje agregatora z perspektywy europejskich projektów sieci inteligentnych, M. Kaleta, P. Pałka, I. Żółtowska, Rynek Energii 3(112)/2014, p.18-22;
14. The economics of load defection. How grid-connected solar-plus battery systems will compete with traditional electric service, why it matters, and possible paths forward, Rocky Mountain Institute, April 2015;
15. Wind Technologies Market Report, U.S Department of Energy, 2014.
Online articles
1. ELEKTROENERGETYKA 2014 – o potrzebie rozwoju (II restrukturyzacji polskiej energetyki), J. Pop-czyk, December 2014 r. (Web. 28 Aug. 2015);
2. How to lose half a trillion euros, The Economist, http://www.economist.com/news/briefing/21587782-europes-electricity-providers-face-existential-threat-how-lose-half-tril-lion-euros (Web. 5 Sep. 2015);
Polish power sector riding on the wave of megatrends
41BIBLIOGRAPHY
3. http://www.klaster3x20.pl/sites/default/files/BZEP/22/POPCZYK%20J.%20Potrzeba%20ro-zwoju%20i%20II%20res%20trukturyzacji%20energetyki%202014.pdf (Web. 5 Sep. 2015);
4. http://www.ruukki.pl/Informacje-i-wydarzenia/Archiwum-informacji/2014/Efektywnosc-ma-terialowa-i-energetyczna-w-produkcji-stali-moze-wyraznie-zmniejszyc-wplyw-wyrobow-koncowych-na-srodowisko (Web. 5 Sep. 2015);
5. http://www.bloomberg.com/news/articles/2015-09-22/mines-in-america-s-coal-country-just-sold-for-a-total-of-nothing (Web. 27 Sep. 2015);
6. http://twojrynek.pl/PL/85/698/Wegiel_z_Gubina_i_Brodow_gwarancja_bezpieczenstwa_energetycznego/ (Web. 5 Sep. 2015);
7. http://wysokienapiecie.pl/energetyka-konwencjonalna/910-w-polsce-konczy-sie-wegiel-analiza (dostęp: (Web. 5 Sep. 2015);
8. http://www.polskieradio.pl/42/4393/Artykul/1470185,Czas-prosumentow-dopiero-przed-na-mi (dostęp: (Web. 5 Sep. 2015);
9. http://energiadirect.pl/aktualnosci/10-mln-europejczykow-produkuje-wlasny-prad-ilu-pola-kow (dostęp: (Web. 5 Sep. 2015);
10. http://ec.europa.eu/public_opinion/archives/ebs/ebs_416_en.pdf (Web. 5 Sep. 2015).
Websites
1. http://data.worldbank.org/ (Web. 5 Sep. 2015);
2. http://ejatlas.org/ (Web. 5 Sep. 2015);
3. www.photovoltaik-guide.de (Web. 5 Sep. 2015);
4. www.renewables-made-in-germany.com (Web. 5 Sep. 2015);
5. www.solarpowereurope.org/ (Web. 5 Sep. 2015);
6. www.teslamotors.com/press (Web. 5 Sep. 2015).
FORUM FOR ENERGY ANALYSIS
42
“Deloitte” is the brand under which tens of thousands of dedicated professionals in independ-ent firms throughout the world collaborate to provide audit, consulting, financial advisory, risk management, tax and legal services to selected clients. These firms are members of Deloitte Touche Tohmatsu Limited (DTTL), a UK private company limited by guarantee. Each member firm provides services in a particular geographic area and is subject to the laws and professional reg-ulations of the particular country or countries in which it operates. DTTL does not itself provide services to clients. DTTL and DTTL member firm are separate and distinct legal entities, which cannot obligate the other entities. DTTL and each DTTL member firm are only liable for their own acts or omissions, and not those of each other. Each of the member firms operates under the names “Deloitte”, “Deloitte & Touche”, “Deloitte Touche Tohmatsu”, or other related names. Each DTTL member firm is structured differently in accordance with national laws, regulations, cus-tomary practice, and other factors, and may secure the provision of professional services in their territories through subsidiaries, affiliates, and/or other entities.
Deloitte provides audit, tax, consulting, financial advisory and legal services to public and pri-vate clients spanning multiple industries. With a globally connected network of member firms in more than 150 countries and territories, Deloitte brings world-class capabilities and high-quality service to clients, delivering the insights they need to address their most complex business chal-lenges. Deloitte’s more than 225,000 professionals are committed to becoming the standard of excellence.
This publication contains general information only, and none of Deloitte Touche Tohmatsu Limit-ed, its member firms, or their related entities (collectively, the “Deloitte Network”) is, by means of this publication, rendering professional advice or services. No entity in the Deloitte Network shall be responsible for any loss whatsoever sustained by any person who relies on this publication.
© 2015 Deloitte Poland/Deloitte Advisory Sp. z o.o.

Polish power sector riding on the wave of megatrends
43NOTE
..............................................................................................................................................................................................................
..............................................................................................................................................................................................................
..............................................................................................................................................................................................................
..............................................................................................................................................................................................................
..............................................................................................................................................................................................................
..............................................................................................................................................................................................................
..............................................................................................................................................................................................................
..............................................................................................................................................................................................................
..............................................................................................................................................................................................................
..............................................................................................................................................................................................................
..............................................................................................................................................................................................................
..............................................................................................................................................................................................................
..............................................................................................................................................................................................................
..............................................................................................................................................................................................................
..............................................................................................................................................................................................................
..............................................................................................................................................................................................................
..............................................................................................................................................................................................................
..............................................................................................................................................................................................................
..............................................................................................................................................................................................................
..............................................................................................................................................................................................................
..............................................................................................................................................................................................................
..............................................................................................................................................................................................................
..............................................................................................................................................................................................................
..............................................................................................................................................................................................................

www.FAE.org.pl