Embed Size (px)
Citation preview

Please note that the information at the back forms an integral part of this report.
Polish Equity Quarterly: 1Q 2007Ripe for the picking?
January 2007
Quarterly Report

Polish Equity Quarterly: 1Q 2007 January 2007
1
Executive summary 2 Investment case 3 Poland strategy 6 Company Updates Oil & Gas/Metals & Mining PKN 27 Lotos 29 MOL 31 PGNiG 33 KGHM 35 Telecoms TPSA 37 Netia 39 Banks PKO BP 41 BZ WBK 43 BRE 45 Bank Millennium 47 Bank Handlowy 49 ING BSK 51 Kredyt Bank 53 Media Agora 55 TVN 57 IT Prokom 59 ComputerLand 51 ComArch 63 Emax 65 Industrials Pfleiderer Grajewo 67 Kety 69 Mondi (Frantschach Swiecie) 71 Pulawy 73 Inter Groclin Auto (IGA) 75 Elstar Oils 77 Construction Budimex 79 Polimex 81 PBG 83 Retail AmRest 85 CCC 87 LPP 89 Eurocash 91 Empik 93 CEDC 95 Services Impel 97 Orbis 99 Real estate GTC 101 Echo 103 Dom Development 105 Others Bioton 107 CEZ 109
Throughout this report we use share prices as of 5 January 2007. On 5 January 2007 the WIG20 index closed at 3,202.
Contents
Analysts Tomasz Bardzilowski, CFA Tel. +48 22 520 9979 [email protected] Anna Bossong, CFA Tel. +44 20 7309 7840 [email protected] Marcin Jablczynski Tel. +48 22 520 9962 [email protected] Dan Karpisek, CFA Tel. +420 22111 2570 [email protected] Tomasz Krukowski, CFA Tel. +48 22 520 9859 [email protected] Robert Réthy, CFA Tel. +36 1 374 7934 [email protected] Przemyslaw Sawala-Uryasz Tel. +48 22 520 9960 [email protected] Marcin Szortyka Tel. +48 22 520 9972 [email protected] Lukasz Wachelko Tel. +48 22 520 9965 [email protected] With research assistance from Marcin Gatarz and Iza Rokicka http://research.ca-ib.com 11 January 2007

Polish Equity Quarterly: 1Q 2007 January 2007
2
Poland’s remarkable domestic growth story should prove unaffected by any global downturn in 2007. We estimate Poland’s GDP growth accelerated to 5.7% in 2006E from 3.5% in 2005 and see no reason to expect any slowdown this year. Doubled EU inflows, booming construction, and strong private consumption may result in GDP growth close to even 6.0% in 2007.
Counting on a second consecutive GDP growth surprise, we remain constructive on Polish equities. Our Polish coverage is trading at 2007E P/E of 16.4x, against 15% earnings growth. We expect 10% weighted return from our covered stocks in 2007 and set a 12-month target for the WIG20 at 3,570.
Our main sector call remains an Overweight on the Banking sector. After a brief pause in 4Q 2006, we return to our Mining vs. Oils call, downgrading Oils to Underweight from Neutral, and upgrading Mining to Overweight from Neutral. Despite stunning performance in 2006, we Overweight the booming construction sector.
Our top picks include: PKO BP, TPSA, KGHM, and TVN. Among mid-caps, we have BUY ratings on: Budimex, Polimex, Kety, CCC and Groclin. Stocks we feel have the least upside potential include: Handlowy, Netia, Lotos, Grajewo, LPP and Dom Development.
Table 1: CA IB recommended sector stance in 1Q 2007 and BUY-rated stocks
Sector Current Previous BUY-rated stocksBanks Overweight Overweight PKO BP, BZ WBK, MillenniumOil & Gas Underweight Neutral n.a.Telecoms Neutral Neutral TPSAReal Estate/Hotels Neutral Neutral n.a.Mining Overweight Neutral KGHMConstruction Overweight Neutral Budimex, PolimexIndustrials Neutral Neutral Kety, Groclin, ElstarMedia Neutral Underweight TVNIT Neutral Underweight ComArchRetail Neutral Neutral CCCOthers Underweight Neutral n.a.
Source: CA IB estimates
Executive summary

Polish Equity Quarterly: 1Q 2007 January 2007
3
We believe Poland’s remarkable domestic growth story should prove unaffected by any global downturn. We estimate Poland’s GDP growth accelerated to 5.7% in 2006E from 3.5% in 2005 and see no reason to expect any slowdown this year. Doubled EU inflows, booming construction, and strong private consumption may result in GDP growth close to even 6.0% in 2007.
Counting on a second consecutive growth surprise, we remain constructive on Polish equities, even following last year’s 42% rally. Our Polish coverage is trading at 2007E P/E of 16.4x. While this represents a re-rating from 15.7x 2006E P/E a year ago, earnings growth prospects also improved, as we forecast 15% weighted annual earnings growth compared with 8.5% a year ago. Based on our 12-month price targets, we expect 10% weighted return from our coverage in 2007 and set a 12-month target for the WIG20 at 3,570.
The 2006 rally in Poland was supported by massive mutual fund inflows, which amounted to PLN 26.5bn in 2006, an increase of 43% YoY. Mutual fund AUM jumped 61% to PLN 98.8bn with equity investments skyrocketing 139% to PLN 39.0bn, representing 39.5% of AUM at year-end. Pension fund transfers from ZUS grew 15% YoY to PLN 16.2bn, leading to 35.4% AUM growth to PLN 116.6bn. Domestic fund equity investments of PLN 78.9bn represented 18% of the market capitalisation of the WSE and 45% of the WSE’s estimated free float as of 29 December 2006.
We conservatively estimate mutual funds should receive approximately PLN 21.7bn in 2007, which represents an 18.2% drop YoY. Pension funds should receive PLN 17.8bn from ZUS, an increase of 10% YoY. The supply side should increase materially, with an assumed value of IPOs/SPOs of PLN 9bn, a 43% rise YoY. In all, the net balance of flows – which we estimate at PLN 2.5bn, provided mutual fund foreign equity allocations remain unchanged – appear to be much less supportive for the Polish equity market than in 2006.
Nevertheless, despite the seemingly less favourable flow of funds backdrop, we believe 2007 will not mark the end of the bull market for Polish equities. Earnings momentum may surprise on the upside again, especially in domestic cyclicals, where we expect 100% earnings growth from the construction sector, 40% growth in retail and media, as well as eventual earnings recovery in the IT sector.
As a play on domestic growth and the still favourable rates backdrop, we maintain our Overweight on the Banking sector but choose a more selective approach. Within banks, our top pick remains PKO BP (BUY, TP: PLN 53) for its combination of growing retail volumes, continued cost containment and further growth options which we believe offset risks related to management changes. The remaining BUY-rated banks: BZ WBK and Millennium. We like BZ WBK due to its superior ROE, its subsidiaries and recent underperformance, and Millennium as it is growing its retail business and utilising operating leverage. We still HOLD BRE for its remarkable expansion story, but wait for better pricing territory to initiate buying. We would finance our overweight by selling Kredyt Bank, Handlowy (both downgraded) and ING; the former due to a stretched valuation, and two latter ones for their stagnating businesses.
Investment case

Polish Equity Quarterly: 1Q 2007 January 2007
4
After a brief pause in 4Q 2006, we return to our Mining vs. Oils call, downgrading Oils to Underweight from Neutral, and upgrading Mining to Overweight from Neutral. We see no positive catalyst for the Oil & Gas sector while the company-specific risks point to a downside. The price of crude oil seems to be bottoming, yet the refining outlook remains bleak. We prefer PKN’s (HOLD, TP: PLN 51) petrochemical support against Lotos’ (HOLD, TP: PLN 46) refining leverage. We maintain HOLD rating on PGNiG. Although a 10% increase in natural gas tariffs (effective from 1 January) beat our expectation, unusually warm weather may undercut profitability in 1Q 2007.
In our central global scenario, we assume that on a 3-6 month perspective, copper will recover to December 2006 levels of US$ 6,600. However, we note that KGHM (BUY, TP: PLN 103) looks undervalued even on the US$ 5,600/t copper forecast we are using for our earnings estimates (in line with the copper futures curve), trading at 2007 core business P/E of 4.7x and offering 10% dividend yield.
We BUY TPSA due to the high dividend yield prospects and attractive valuation. TPSA underperformed MSCI European Diversified Telecoms by 18.8 percentage points in 2006. TPSA’s 2007E EV/EBITDA multiple of 5.2x represents 5.0% and 13.7% discounts to MTel and Telefonica O2 multiples, unjustified in our view as we believe our forecast reflects Polish regulatory risks. The announcement of the dividend policy (due 1Q 2007) could be a catalyst. We forecast a 10% yield assuming the previous gearing guidance is maintained.
We are upgrading TVN to BUY from Hold and Media to Neutral from Underweight. We would turn our attention to expected strong 4Q 2006 results, robust 2007 outlook with an expected 15-20% increase in TVN’s ad prices and new entrants on the market posing no significant threat in 2007, in our view. We see no catalysts for Agora.
We are upgrading the IT sector to Neutral (previously Underweight) due to the improved visibility of public administration projects subsidised by EU funds with an estimated price tag of ca. PLN 2bn. However, our only BUY in the sector is ComArch (TP: PLN 225), trading at a slight discount to EU software players with no premium for its superior earnings growth track record (2004-2006E CAGR 122%) and continued success in the export arena. Prokom Group (HOLD, TP: PLN 146) appears to be the best means of gaining exposure to public sector demand while diversifying the business risk by benefiting from the dynamic CEE expansion of its subsidiary Asseco Poland. This said, Prokom’s 4Q 2006 results are likely to bring little inspiration. ComputerLand (upgraded to HOLD, TP: PLN 114), potentially emerging as a turnaround candidate, should see its earnings up ca. 50% YoY in 4Q 2006 after a year-long reorganisation.
We Overweight the Construction sector, even despite its stunning rally in 2006. Construction output increased by 18% YoY in January-November 2006 and the positive outlook is underpinned by the increasing flow of EU funds (EUR 20bn planned for 2007-2013), acceleration of fixed investments among corporates and seemingly insatiable demand for residential properties in large cities. Our top pick is Budimex, where we believe the market continues to undervalue the company’s housing business while the flow of EU funds suggests a recovery in road construction margins. We are also buyers of Polimex. We like the company for its persistently implemented M&A expansion strategy and the discount to its peers in comparative valuation.

Polish Equity Quarterly: 1Q 2007 January 2007
5
The real estate/hotel sector was the top performer in 2006. After a 32% rally we are downgrading Echo to a HOLD, mainly due to the share price performance. We are upgrading Orbis’ (HOLD) target price to PLN 67 as hotel industry operating trends look favourable with RevPar set to grow in Poland by ca. 11% p.a. in the next three years. Reported earnings to be boosted by asset disposal. We are also upgrading GTC to HOLD from Sell, raising our target price to PLN 43. GTC surprised us on the upside in terms of new sites acquisitions, having purchased plots representing ca. 105,000m2 of leaseable/sellable area in just 4Q 2006.
Our other BUY-rated mid-caps include: Kety, CCC, Groclin and Elstar Oils. We see Kety (TP: PLN 205) as a still attractively valued (2007E P/E of 15.2x) play on Poland’s strong macro environment. We have upgraded Groclin to BUY from Hold (TP: PLN 60). The stock fell 30% in the most recent 3 months but we believe the plunge to be played out. We forecast 100% EPS growth in 2007, which yields a 2007E P/E ratio of 10.1x. Despite weak 4Q 2006E results caused by warm weather, our top pick within the retail sector is CCC, which we see as still a reasonably priced growth story, trading at 2007E P/E of 18.4x, PEG of 0.6, and offering a 3% dividend yield. We are upgrading biofuel producer Elstar Oils to BUY from Hold.
What are our sell ideas? Currently, the stocks that we believe have the least upside potential include: Handlowy, Netia, Lotos, Grajewo, LPP and Dom Development.

Polish Equity Quarterly: 1Q 2007 January 2007
6
Contents
CA IB global scenarios for 2007
Performance check
Valuation
Economy
Flow of funds
CA IB recommended portfolio
CA IB stock recommendations
Sector reviews
Polish equities under CA IB 2007 global scenarios
Overweight: Mining, Oils, EUR exportersNeutral: Domestic cyclicals, real estateUnderweight: Banks, Telecoms, chemicals
Neutral/positive for Polish equities in EME context as Banks underperformance (higher yields and rates) offset by strong Mining and Oils. Strong inflows to EME equities favours large caps. Commodity-importers and defensives underperform. Volatility picking up.
Very positive scenario in total for EME equities given most of the region comprises commodity stocks. Differentiated impact between countries.Winners: Russia (positive impact of commodity price hikes on EPS estimates). Losers: Turkey and CE3 to certain degree (renewed danger of inflation and interest rates rise).
G3 growth closer to, or through, 3%. FOMC cuts priced out/market prices end-2007 ECB/BoJ at 4.50%/1.50%. Commodity price uptrend re-established. Major FX crosses rangey.
Alternative scenario 2:Wow: StrongG3 growth and inflation picks up
10% probability
Overweight: Domestic cyclicals (domestic growth outperforms), Telecoms (TPSA’s dividend yield support), IT (sector-specific factors), importers (retail) Neutral: Banks (yield steepening, volume growth slows down)Underweight: Oils, Mining, exporters
Neutral/negative for Polish equities (less affected by global factors) in EME context although absolute performance the lowest of the three scenarios. Outflows from EME markets favour mid-and small-caps’ relative performance.
Negative/neutral for EME equities.Apart from the immediate impact of lower commodity prices on valuations, lower global growth would definitely affect EME fundamentals.Winners: Turkey (growth affected to the least extent in EME region). Czech Republic (defensive).Losers: Russia (negative impact of commodity price hikes on EPS estimates). Hungary (unable to sort out fiscal problem).
G3 growth closer to 1.5%.FOMC cuts to 4.50% in 1H, ECB stops at 3.50%, BoJ at 0.25%. G3 curves flatten. Oil down to US$ 50 per bbl. US$ likely to weaken in initial phases.
Alternative scenario 1:Hard landing/EMU growth stalls
20% probability
Overweight: Banks (volume growth and higher NIMs offset slightly higher discount rate), domestic cyclicals (boominginvestments), Mining (commodities recover, US$ weakens).Neutral: EUR exporters Underweight: Oils (lack of catalyst, company-specific risks as Russia’s stance toughens)
Positive/neutral for Polish equities.Domestic growth story not affected by soft landing. Strong domestic demand and growth backdrop offsets slightly higher rates and bond yields, on balance positive for Banks. Foreign inflows should support WIG20 stocks. Mining to outperform Oils.
Positive for EME equities.Relatively higher growth and weak US$ should increase attractiveness of the EME region. Our MSCI EME Index expected return is 13.2%.Winners: Russia (firm commodity prices in the long term), Turkey and Hungary (able to stabilise macro situations).Losers: Exporters (slowdown in global growth and weakening US$).
G3 GDP growth all in a 2.0-2.5% range. ECB/BoJ gradually hiking further to 4.0%/0.75% and FOMC cutting to 4.75% by mid-year. UST rangey in 1H, with narrowing of UST/EGB spread. EUR/US$ gradually tracks higher in 1H. Commodities recover toDecember 2006 levels.
Central scenario:Soft(ish) US landing + decoupling
70% probability
Sectors and stocksPoland Top-downEME EquitiesGlobal MacroScenario
Poland domestic growth story unaffected by global
slowdown

Polish Equity Quarterly: 1Q 2007 January 2007
7
Performance check (1): Neutral stance on Poland against MSCI EME
MSCI Poland relative to MSCI EME
Source: Bloomberg, CA IB estimates Note:* P/E for CA IB coverage Source: Bloomberg, CA IB estimates
The WIG rallied 41.6% in 2006 with MSCI Poland gaining 35.3%. Since we upgraded Poland to Neutral, the MSCI Poland has risen 17.6%, in line with MSCI EME. CA IB recommends a Neutral stance on Poland in the EME portfolio, although we favour Poland over the Czech Republic (Underweight) in CE3 on valuation grounds. Improving macro should help Hungary in 2H 2007. In our central soft-landing scenario for 2007, Turkey should recover from the May 2006 crash as the global background remains relatively benign. Stay invested in Russia despite great performance in 2006 on strong domestic growth and recovering commodity prices.
CA IB recommended country stance and 2006 performance of local indices
85
90
95
100
105
110
Dec-05
Jan-0
6
Feb-06
Mar-06
Apr-06
May-06
Jun-0
6Ju
l-06
Aug-06
Sep-06
Oct-06
Nov-06
Dec-06
Neutral
Underweight
Modest OW Country
Local main index
performance
MSCI index US$
performance CA IB 2006 (YoY, %) 2006 (YoY, %) 2006E 2007E recommendation
Poland* 41.6 35.3 18.8 16.4 NeutralRussia 70.7 53.7 13.2 12.0 NeutralHungary 19.5 31.1 10.8 10.9 NeutralCzech Republic 7.9 29.6 18.2 15.2 UnderweightTurkey (1.7) (9.2) 11.3 9.7 OverweightEmerging Europe 33.6 n.a. n.a. n.a.
P/E (X)
Performance check (2): Rallying domestic sectors and asset plays
Source: Bloomberg
The 2006 rally was driven by domestic cyclicals – construction, industrials, retail - responding to surging investment growth and strengthening private consumption. Asset plays and high-beta biotech repeated their stunning performance while telecoms underperformed for a second consecutive year. Our Mining vs. Oils call delivered substantial returns for the second year in a row. In 4Q, falling bond yields supported banks (our only Overweight in Poland) and real estate plays, while key underperformers media, IT, and telecoms finally recovered. Crashing copper prices resulted in an11.6% plunge for KGHM. Oils underperformed for the fourth quarter in a row. Flight to quality affected high-beta plays.
FY 2006 sector performance (%)
Source: Bloomberg
183
140123
73 69 56 56 54 42 4023
8
(13)(50)
0
50
100
150
200
Constr
uctio
n
Biotec
h
Real E
state
/ Hote
ls
Indus
trials
MIDWIG
Mining
Banks
Retail
WIG ITMed
ia
Teleco
m
Oil & G
as
4Q 2006 sector performance (%)33
23 22 20 20 17 16 14 126
2
(3)
(12)(15)(10)
(5)05
10152025303540
Real E
state
/ Hote
lsBan
ks
Teleco
m
Constr
uctio
nMed
ia
Indus
trials
MIDWIG WIG IT
Retail
Oil & G
as
Biotec
h
Mining
Domestic cyclicals drove 2006 market performance
Despite rally, Poland performed in line with
MSCI EME. We recommend a Neutral
stance in EME portfolio

Polish Equity Quarterly: 1Q 2007 January 2007
8
Performance check (3): Banks lift the WIG20. Laggards rebound in 4Q
Source: Bloomberg
Among WIG20 stocks, our best call in 2006 was BRE, selected as a top pick in the banking sector for 2006. PKO BP, recommended as the top pick in Poland in October, was the best performing large-cap in 4Q. The pair-trade KGHM versus PKN delivered a stunning 106% return in 2006 despite a negative 29% return in 4Q after we closed the trade in October. 4Q marked a rebound of underperformers – TPSA, Agora, PGNiG, Netia - and the fall of earlier stars –Bioton and KGHM.
FY 2006: WIG20 performance (%) 4Q 2006: WIG20 performance (%)
Source: Bloomberg
39
34
29
23 23 21
18 17 17 16 15 14 13 12 10 8 6 5
(3)
(3)
(12)
(20)
(10)
0
10
20
30
40
50
BRE
GTC
PKO
TPS
A
Agor
a
CEZ
TVN
BZ W
BK
MO
L
Peka
o
BPH
PGN
iG
WIG
20
Polim
ex
Kety
Net
ia
Loto
s
Prok
om PKN
Biot
on
KGH
M
145
140
132
99
66 65 64 60 56
35 33 29 29
13 12 10 8 0
(9)
(24)
(46)
(100)
(50)
0
50
100
150
200
Polim
ex
Biot
on
GTC
BRE
PKO
BZ W
BK Kety
TVN
KGH
M
Peka
o
CEZ
BPH
WIG
20
MO
L
Loto
s
TPS
A
PGN
iGPr
okom
Net
ia
PKN
Agor
a
Performance check (4): 30% of our covered mid-caps doubled in 2006
The MIDWIG index delivered a stunning performance, rocketing 69% in 2006, outperforming the WIG20 by 40.1 percentage points, although performance of both indices converged in 4Q 2006. Almost one-third of our covered mid-cap stocks returned 100% or more. Growth stocks from construction (PBG), retail (Vistula, AmRest), real estate (Echo), software (ComArch), and retail banking (Getin) were top performers in our mid-cap universe. Only 10 mid-cap stocks from our coverage underperformed the WIG index in 2006 with InterGroclin and LPP being the main laggards.Our IPOed companies topped 4Q 2006 performers: Dom Development, Asseco Slovakia and AB surged 76%, 64% and 43% in 4Q 2006, respectively.
FY 2006: Mid-caps performance (%) 4Q 2006: Mid-caps performance (%)
Note: *Performance based on IPO price Source: BloombergNote: *Performance based on IPO price Source: Bloomberg
247
198
137
127
120
114
101
101
98 95 93 76 69 66 64 64 63 57 57 49 44 42 42 37 31 16 12 11 9 8 2(3
)(2
6)(50)0
50100150200250300
PBG
Com
Arch
Vis
tula
Ech
oM
ondi
Els
tarO
ilsA
mR
est
Get
in H
oldi
ngE
mpi
kB
udim
exO
rbis
Dom
Dev
.*M
IDW
IGM
illen
nium
Ass
eco
Slov
akia
*C
CC
Gra
jew
oE
uroc
ash
Impe
lA
B*K
redy
t ban
kIN
G B
SK
WIG
Han
dlow
yS
oftb
ank
Em
axC
ompu
terL
and
CED
CP
ulaw
yC
CI*
Mul
timed
ia*
LPP
Inte
rGro
clin
7664
43 37 35 30 30 30 29 27 26 24 23 23 22 22 16 15 14 14 14 12 9 8 6 5 3 2 1(1
)(5
)(7
)(2
2)(40)(20)
020406080
100
Dom
Dev
.*As
seco
Slo
vaki
a* ABO
rbis
PBG
Mon
diKr
edyt
Ban
kH
andl
owy
Echo
CED
CSo
ftban
kM
illenn
ium
Com
Arc
hVi
stul
aIm
pel
Gra
jew
oM
IDW
IGEm
pik
WIG
Get
in H
oldi
ngIN
G B
SKAm
Res
tC
CC
CC
I*Pu
law
yLP
PEl
star
Oils
Mul
timed
ia*
Com
pute
rLan
dBu
dim
exEu
roca
shEm
axIn
terG
rocl
in
MIDWIG outperformed the WIG20 by 40 percentage points in 2006 although
the relative performance converged in 4Q 2006
Our best stock calls in 2006: BRE, PKO BP, and
Mining vs. Oils.

Polish Equity Quarterly: 1Q 2007 January 2007
9
Valuation (1): Higher price for higher growth?
The stocks from CA IB’s coverage universe are trading at 16.4x 2007E P/E against 15% expected EPS growth. This compares to 15.7x 2006E P/E and 8.5% expected EPS growth a year ago.Based on 2007E P/E, Poland is now trading at a large 51.4% premium to Hungary and 5.6% premium to the Czech Republic. The premium to Hungary seems to be justified by higher expected EPS growth. Polish stocks are trading at a substantial 34.9% premium to the DJ Eur 50 and a small 9.2% premium to the S&P 500.The 2006E bond to earnings yield ratio jumped 25% to 0.90x compared to January 2006. A fall in 2006E WIG20 P/E to 13.9x or decrease in yields to 4.2% would make equities as attractive relative to bonds as they were at the beginning of 2006.
Poland: Relative valuation summary
Source: Bloomberg, IBES, CA IB estimates
Note: P/E for CA IB coverage (ex. Bioton and Budimex)
WIG20: Bond to 2006E earnings yield ratio
Source: Bloomberg, CA IB estimates
0.720.78
0.87 0.89 0.90
0.0
0.1
0.2
0.3
0.4
0.5
0.6
0.7
0.8
0.9
1.0
January 2006 April 2006 July 2006 October 2006 January 2007
CloseCountry Index 5 January 2006E 2007E
2007 (%) yield (%)Poland* WIG 49,560.3 18.8 16.4 15.0 5.19 0.98Hungary BUX 24,116.9 10.7 10.8 (1.2) 6.80 0.73Czech Republic PX 1,599.9 18.5 15.5 19.5 3.71 0.69Europe DJ Eur 50 3,722.6 12.9 12.1 6.3 3.98 0.51US S&P 500 1,409.7 16.2 15.0 8.4 4.65 0.75
P/E (x) 2007E EPS growth 10Y T-bond
Bond to 2006E
earnings yield ratio
Valuation (2): Growth sectors reasonably priced on PEG?
The 12-month forward P/E expansion was most visible in the construction sector where it reached 14.3%; however, this sector appears to offer superior growth with 2007E PEG of 0.7x.In addition, retail stocks and banks also saw significant P/E expansion as they moved ahead by 8.1% and 8.0%, respectively.Conversely, KGHM, TPSA and media all saw their 12-month forward P/E falling by 23.5%, 21.2% and 18.5%, respectively.
12-month forward P/E multiples
Source: CA IB estimates
NOTE: Sectors based on CA IB coverage as of January 2006
2007E PEG (x)
Source: CA IB estimates
NOTE: PEG calculated with 2006-2009E EPS CAGR and 2007E P/E
1.7
0.9 0.8 0.8 0.80.7
0.0
0.2
0.4
0.6
0.8
1.0
1.2
1.4
1.6
1.8
Banks IT Media Industrials Retail Construction
35.2
22.1
22.7
18.9
18.6
15.8
14.7
14.5
11.6
5.2
30.8
27.1
21.6
17.5
17.2
15.5
13.9 18
.4
11.3
6.8
0
5
10
15
20
25
30
35
40
Constr
uctio
nMed
ia ITBan
ksReta
il
WIG
20
Indus
trials
TPSA
Oil&Gas
KGHM
January 2007 January 2006
Domestic cyclical sectors trade at PEG below 1.0x
based on 3-year EPS CAGR
The Polish market rerated in 2006 but higher
earnings growth justifies P/E increase

Polish Equity Quarterly: 1Q 2007 January 2007
10
Valuation (3): Our ROE model suggests WIG20 fair-value at 3,182
Compared with the previous quarter, our simple ROE model implies a WIG20 fair-value increase of 2.3% compared with a 0.9% index change. A lower risk free rate and ERP offset the decrease in expected ROE. Compared with January 2006, the fair-value increased by 15.5% while the index gained 13.0%. The model suggests the WIG20 fair-value at 3182, 0.6% below the current level, and 12M target for the WIG20 of 3,493, a 9.1% upside potential.
CA IB WIG20 ROE valuation model
Source: Bloomberg, IBES, CA IB estimates
January 2007 October 2006 January 2006ROE 2007E (%) 18.9 21.8 16.4Dividend payout (%) 73.5 77.0 70Retention rate (%) 26.5 23.0 30Risk-free (%) 5.19 5.38 4.81ERP (%) 4.5 5.0 5.0Equity growth (%) 5.0 5.0 5.0Implied 2007 P/E (x) 15.7 14.4 14.5Fair-value 3,182 3,110 2,75612M target 3,493 3,437 3,045Current WIG20 (x) 3,202 3,173 2833Upside to fair-value (0.6) (2.0) (2.7)Upside to YE target 9.1 8.3 7.5 Fair-value change vs. current level 2.3 15.5 WIG change vs. current level 0.9 13.0
Valuation (4): What message does PEG send for Mid-Caps?
Following a 69% MIDWIG rally in 2006, further outperformance may appear difficult but at least our covered mid-caps do not reveal obvious overvaluation when taking into account earnings growth. Investors seem to be ready to pay 16x 2007E P/E for 10% 3-year EPS CAGR and reward growth stocks with a 3 point higher multiple for each additional 10% in CAGR.
Mid-Caps: 2007E P/E vs. 2006 – 2009E EPS CAGR
Source: Bloomberg, IBES, CA IB estimates
Note: Selection of stocks from CA IB coverage
Mid-Caps: Upsides to 12-month TP vs. 2007E PEG
Source: Bloomberg, IBES, CA IB estimates
Note: Selection of stocks from CA IB coverage
CCCLPPGRJ
PXM
EUR
PBG
DOM
EMF
CEDCKTYMPP
EAT
CMR
0
5
10
15
20
25
30
35
40
45
10% 15% 20% 25% 30% 35% 40% 45%3YR EPS CAGR (%)
2007
P/E
(x)
CCC
LPP
GRJ
PXMEUR
PBG
DOMEMF
CEDC
KTY
MPPEAT
CMR
(10)
(5)
0
5
10
15
20
0.4 0.6 0.8 1.0 1.2 1.4 1.6PEG (x)
Ups
ide
(%)
Is 16x 2007E P/E a correct multiple for 10% 3-year
EPS CAGR?
WIG20 looks fairly-valued on our ROE model, after reducing ERP for Poland
to 4.5%

Polish Equity Quarterly: 1Q 2007 January 2007
11
Economy (1): 2006: The (first) year of the boom?
GDP growth (YoY, %)
Source: GUS, CA IB estimates Source: GUS, CA IB estimates
GDP growth exceeded the most optimistic forecasts, accelerating to 5.8% YoY in 3Q 2006, driven by 5.5% growth in private consumption and a 19.8% YoY jump in investments. Growth indicators remained very firm in 4Q 2006 with industrial output up 11.7% and retail sales up 14.1% in November 2006. Exceptionally warm weather suggests massive YoY growth in construction output in December. We forecast GDP growth will remain at the record level of 5.8% in 4Q 2006. We estimate 5.7% YoY GDP growth in 2006, against just 3.5% in 2005.
GDP components growth (YoY, %)
2.22.9
3.94.3
5.25.5
5.8 5.8
3.5
5.7 5.5
0
1
2
3
4
5
6
7
1Q 20
05
2Q 20
05
3Q 20
05
4Q 20
05
1Q 20
06
2Q 20
06
3Q 20
06
4Q 20
06E
2005
2006
E20
07E
(5)
0
5
10
15
20
25
1Q 2005 2Q 2005 3Q 2005 4Q 2005 1Q 2006 2Q 2006 3Q 2006 4Q 2006EInvestments (YoY, %) Private consumption (YoY, %)Net exports (YoY, %)
Economy (2): Is 6.0% GDP growth possible in 2007?
Key economic indicators (YoY, %)
Source: GUS Source: GUS
We see no reason to anticipate a growth slowdown in 2007. Conversely, our 2007 GDP growth forecast of 5.5% might appear conservative, as consumption is set to be buoyed by a tightening labour market, while investments are set for double-digit growth. We expect unemployment to fall to 13.2% in 2007 from 14.2% in 2006 and 17.6% in 2005. Real wage growth remains in check at 4.0% in 2006 while stable inflation and the interest rate backdrop – we expect average CPI to increase from 1.1% in 2006 to 2.0% in 2007, and a main rate hike of only 50bps – should exert little drag on real purchasing power. Is 6.0% GDP growth possible in 2007? Given the robust private consumption outlook, booming private construction, and prospects of further acceleration in investment growth, fuelled by doubled inflows of EU structural funds, we believe the risks are on the upside.
CPI, PPI and wage growth (YoY, %)
0
1
2
3
4
5
6
Jan-0
6
Jan-0
6
Jan-0
6
Feb-06
Feb-06
Mar-06
Mar-06
Apr-06
Apr-06
May-06
May-06
Jun-0
6
Jun-0
6Ju
l-06Ju
l-06
Jul-0
6
Aug-06
Aug-06
Sep-06
Sep-06
Oct-06
Oct-06
CPI (YoY, %) PPI (YoY, %) Wage growth (YoY, %)
(15)(10)
(5)05
101520
2530
Jan-0
6
Feb-06
Mar-06
Apr-06
May-06
Jun-0
6Ju
l-06
Aug-06
Sep-06
Oct-06
Nov-06
Industrial output (YoY, %) Retail sales (YoY, %) Construction (YoY, %)
Given robust private consumption, booming
construction, and further double-digit investment growth, risks are on the upside to our 5.5% GDP
growth forecasts for 2007
Major positive growth surprise in 2006

Polish Equity Quarterly: 1Q 2007 January 2007
12
Economy (3): The EU funds inflows set to double in 2007
EU structural funds and investment growth
Source: Ministry of Regional Development Source: Ministry of Regional Development, CA IB estimates
In 2006, Poland received EUR 2.1bn from the EU Structural and Cohesion Fund. According to the Ministry of Regional Development, in 2007 inflows are set to more than double to EUR 4.3bn. In 2008-2013 Poland should receive on average EUR 9bn annually (excluding an estimated EUR 3bn annually from CAP). The EU funds are dedicated mainly to infrastructure and environmental improvements with as much as 31% of total funds directed to transport infrastructure, followed by 19% earmarked for the environment. The key GDP growth driver - investments - appears to grow in line with EU funds inflows. Detailed data indicates that construction is the most important component of investments in Poland, with its share amounting to 53% in 3Q 2006. The increased spending on infrastructure is likely to further fuel growth of the construction sector.
EU funds by category (the 2004-2006 allocation)
Transport32%
Environment19%
HR Development15%
Other programmes9%
Community infrastructure
3%Support for Enterprises
10%
Rural Development12%
0
5
10
15
20
25
1Q 2005 2Q 2005 3Q 2005 4Q 2005 1Q 2006 2Q 2006 3Q 2006 4Q2006E
2006Equarterlyaverage
2007Equarterlyaverage
01002003004005006007008009001000
SF payments received (EURm) - rhs Fixed investments growth YoY (%) - lhs
Flow of funds (1): Massive mutual fund equity buying in 2006Pension funds: Estimated pension fund inflow
and equity purchases
Source: KNUiFE, CA IB estimates Source: IZFiA, CA IB estimates
Mutual funds’ inflows reached a record high of PLN 26.5bn in 2006, an increase of 43% YoY. As much as PLN 26.9bn was directed to equity-related funds, which led to the highest ever annual equity buying amounting to PLN 12.4bn (46.7% of total inflows).Pension fund transfers from ZUS grew 15% YoY to PLN 16.2bn. Nevertheless, net equity buying was subdued for most of the year with a rebound in 4Q, when they bought equities worth PLN 1.5bn.In all, domestic equity buying reached a record-high PLN 13.2bn, up 409% YoY, and can be seen as one of the major drivers of the superior equity market performance.
Mutual funds: Estimated mutual fund inflow and equity purchases
(4)
(2)
0
2
4
6
8
10
1Q 20
03
2Q 20
03
3Q 20
03
4Q 20
03
1Q 20
04
2Q 20
04
3Q 20
04
4Q 20
04
1Q 20
05
2Q 20
05
3Q 20
05
4Q 20
05
1Q 20
06
2Q 20
06
3Q 20
06
4Q 20
06
Inflows from Social Security Estimated net equity purchases
PLNbn
(4)
(2)
0
2
4
6
8
10
1Q 20
03
2Q 20
03
3Q 20
03
4Q 20
03
1Q 20
04
2Q 20
04
3Q 20
04
4Q 20
04
1Q 20
05
2Q 20
05
3Q 20
05
4Q 20
05
1Q 20
06
2Q 20
06
3Q 20
06
4Q 20
06
Estimated inflows Estimated net equity purchases
PLNbn
Domestic fund equity buying surged over 400%
in 2006 and can be seen as a major driver of last
year’s rally
EU inflows to double in 2007 to EUR 4bn and
further increase to EUR 9bn annually in the
2008-2013 period

Polish Equity Quarterly: 1Q 2007 January 2007
13
Flow of funds (2): Local funds account for 45% of free float in 2006
Pension funds’ AUM (PLNbn)
Source: ZUS, KNUiFE, CA IB estimatesSource: IZFiA, CA IB estimates
Pension funds’ AUM increased in 2006 by 35.4% YoY to PLN 116.6bn. At the same time equity allocation rose to 34.2% from 31.6% at the end of 2005.Mutual funds’ AUM surged to PLN 98.8bn in December 2006 from PLN 61.3bn a year ago, up 62% YoY.Domestic funds’ equity investments amount to PLN 78.9bn, i.e. 45% of the WSE estimated free float.
Mutual funds’ AUM (PLNbn)
Local funds: Structure of assets
Source: IZFiA, KNUiFE, CA IB estimates
30405060708090
100110120130
Jan-0
4
Mar-04
May-04
Jul-0
4
Sep-04
Nov-04
Jan-0
5
Mar-05
May-05
Jul-0
5
Sep-05
Nov-05
Jan-0
6
Mar-06
May-06
Jul-0
6
Sep-06
Nov-06
25%26%27%28%29%30%31%32%33%34%35%
Pension funds' AUM (PLNbn, lhs) Equity investments (%, rhs)
30405060708090
100110120130
Jan-0
4
Mar-04
May-04
Jul-0
4
Sep-04
Nov-04
Jan-0
5
Mar-05
May-05
Jul-0
5
Sep-05
Nov-05
Jan-0
6
Mar-06
May-06
Jul-0
6
Sep-06
Nov-06
10%
15%
20%
25%
30%
35%
40%
45%
Mututal funds AUM (PLNbn, lhs) Equity investments (%, rhs)
Equities40%
Others17%
Treasuries43%
Mutual funds
Equities34%
Cash2%
Treasuries63%
Others1%
Pension funds
Flow of funds (3): Pension funds underweight Large-Caps vs. WIG
In 2H 2006 pension funds were sellers of TPSA (16.0m shares, estimated selling size of PLN 346m), KGHM (2.2m shares, PLN 233m) and PKO BP (5.2m shares, PLN 208m).
On the buy side, pension funds accumulated PKN Orlen (1.7m shares, PLN 87m) and Pekao (182,000 shares, PLN 38m).
Looking at relative portfolio positions, pension funds increased their underweight position vs. the WIG index in PKO BP, TP SA and PKN Orlen (despite net purchases of PKN). Underweight positions werereduced in KGHM and Pekao.
We estimate that in 2H 2006 pension funds have sold PLN 662m in the Top-5 largest equity holdings.
Company
Weight in pension funds' equity portfolio
(end-2006)
Weight in WIG (end-2006)
Overweight vs. benchmark (end-2006,
pp)
Overweight in 1H 2006 (pp)
No. of shares bought (sold) in 2H 2006 (m)
Estimated transaction value (PLNm)
PKO BP 8.5 10.1 (1.6) (0.8) (5.195) (208)PKN Orlen 7.8 8.8 (1.1) 0.2 1.696 87Pekao 7.1 7.7 (0.5) (1.9) 0.182 38TPSA 6.4 10.0 (3.6) (2.7) (16.013) (346)KGHM 4.2 5.9 (1.7) (2.9) (2.177) (233)
Pension funds’ top-5 largest equity holdings
Source: KNUiFE, CA IB estimates
Pension funds’ biggest underweight among top
five stocks is TPSA
At the end of 2006, domestic fund
investments accounted for 18% of the WSE
market capitalisation and 45% of the estimated free
float

Polish Equity Quarterly: 1Q 2007 January 2007
14
Flow of funds (4): Foreign funds reverting from EME region
Poland: AUM and monthly flows of EME regional and GEM funds
Source: EPFR, CA IB estimates
Source: Bloomberg, EPFR, CA IB estimates
In 2006 foreign investors redeemed almost PLN 1.3bn from Poland’s equity market vis-à-vis a ca. PLN 3.4bn inflow in 2005.4Q saw a PLN 381m outflow; however, the monthly net balance of flows improved steadily with a PLN 20m inflow in December.The outflows reflect the general situation in Emerging Europe, which in 4Q 2006 suffered a US$ 588m outflow.Conversely, the net inflows to the emerging markets in 4Q amounted to US$ 7.3bn, of which US$ 6.4bn was directed to Asia ex-Japan funds.
4Q 2006: Equity funds flows and performance of MSCI indices
Poland (129) (73) 22.9 (412) 1,056 35.3 6,595EME (588) (17) 18.3 (1,810) 5,185 33.6 39,067Asia 6,366 252 15.0 16,790 8,380 29.8 113,235LatAm 1,130 651 21.1 3,319 4,022 39.3 21,979BRIC 120 (21) 23.5 4,294 n.a. 52.9 12,069GEM 256 (2,681) 17.3 (85) 974 29.2 141,269Total EM 7,276 (1,813) 17.3 22,442 20,285 29.2 330,556International 7,036 6,982 8.0 22,416 19,590 18.0 580,617
MSCI Index Chg.
(2006 %)
MSCI Index Chg.
(QoQ %)
Quarterly Flows - 3Q 2006 (US$m)
Assets EoM
(US$m)
Quarterly Flows - 4Q 2006 (US$m)
Flows 2006
(US$m)
Flows 2005
(US$m)
(400)(300)(200)(100)
0100200300400500
Jan-0
5
Feb-05
Mar-05
Apr-05
May-05
Jun-0
5Ju
l-05
Aug-05
Sep-05
Oct-05
Nov-05
Dec-05
Jan-0
6
Feb-06
Mar-06
Apr-06
May-06
Jun-0
6Ju
l-06
Aug-06
Sep-06
Oct-06
Nov-06
Dec-06
0
1,000
2,000
3,000
4,000
5,000
6,000
7,000
Assets (US$m) - rhs Net monthly flows (US$m) - lhs
Flow of funds (5): 2007E balance of flows less supportive than in 2006
Estimated equity supply/demand balance
We conservatively estimate mutual funds should receive approximately PLN 21.7bn in 2007, which represents an 18.2% drop YoY.Pension funds should receive PLN 17.8bn from ZUS, an increase of 10% YoY.The supply side should increase materially, with an assumed value of IPOs/SPOs of PLN 9bn, a 43% rise YoY.In all, the net balance of flows – which we estimate at PLN 2.5bn, provided mutual fund foreign equity allocations remain unchanged – appears to be much less supportive for the Polish equity market than in 2006.
Source: KNUiFE, IZFiA, EPFR, CA IB estimates
2007E 2006 YoY (%) 2005 YoY (%)DemandMutual funds inflows (PLNm) 21,691 26,527 (18) 18,501 43
% of equity allocation 45.0 46.6 20.1Mutual funds equity investments (PLNm) 9,761 12,366 (21) 3,712 233Pension funds inflows (PLNm) 17,796 16,156 10 14,025 15
% of equity allocation 10.0 5.5 (7.9)Pension funds domestic equity investments (PLNm) 1,780 882 102 (1,110) n.m.Domestic equity purchases potential (PLNm) 11,541 13,247 (13) 2,603 409Foreign equity funds inflows (PLNm) (1,264) n.a. 3,378 n.m.SupplyIPO/SPO (institutional tranche, PLNm)) 9,000 6,277 43 4,250 48Secondary market balance (PLNm) 2,541 5,707 (55) 1,730 230WIG change (%) 41.6 33.7WIG20 change (%) 23.8 35.4
Domestic fund equity buying to decrease, while
IPOs/SPOs pipeline to rise in 2007
In 2006, EME funds redeemed US$ 1.8bn
from the region vs. a US$ 5.2bn inflow in 2005

Polish Equity Quarterly: 1Q 2007 January 2007
15
CA IB recommended sector stance in 1Q 2007
Our main sector call remains an Overweight on the Banking sector.
Following a brief intermission in 4Q 2006, we return to our Mining vs. Oils call, downgrading Oils to Underweight from Neutral, and upgrading Mining to (small) Overweight from Neutral. Despite stunning performance in 2006, we Overweight the booming construction sector. We are upgrading media and IT to Neutral.
Source: Bloomberg, CA IB estimates
Sector Current Previous Adj. weight in WIG Relative weight CA IB weight CA IB vs. WIG BUY-rated stocksBanks Overweight Overweight 37.4 1.10 41.0 3.6 PKO BP, BZWBK, MillenniumOil&Gas Underweight Neutral 17.4 0.80 13.9 (3.5) n.a.Telecoms Neutral Neutral 13.4 1.00 13.4 0.0 TPSAReal Estate/Hotels Neutral Neutral 7.6 1.00 7.6 0.0 n.a.Mining Overweight Neutral 7.0 1.05 7.3 0.3 KGHMConstruction Overweight Neutral 3.8 1.10 4.1 0.4 Budimex, PolimexIndustrials Neutral Neutral 3.6 1.00 3.6 0.0 Kety, Groclin, ElstarMedia Neutral Underweight 3.6 1.00 3.6 0.0 TVNIT Neutral Underweight 2.5 1.00 2.5 0.0 ComArchRetail Neutral Neutral 1.6 1.00 1.6 0.0 CCCOthers Underweight Neutral 2.0 0.75 1.5 (0.5) n.a.Total 100.0 100.0
Earnings preview: Domestic cyclicals to show highest earnings growth4Q 2006E: Net profit growth (%)
Source: Companies data, CA IB estimates Source: Companies data, CA IB estimates
In 4Q 2006, we expect our universe to post a 4% YoY decline in aggregate net profit, in line with mere 4% YoY growth in 3Q 2006. Domestic cyclicals to show the highest EPS growth of 44-59%. Oil & gas to post an earnings drop, as PKN’s YoY recovery is offset by a plunge in Lotos and PGNiG. KGHM’s net profit growth is seen at 5% compared to 19% in 3Q 2006 and 127% in 2Q 2006. Real estate aggregate earnings are set to plunge by 54% due to lower revaluation gains. In 2007, earnings momentum may surprise on the upside again, especially in domestic cyclicals, where we expect 100% earnings growth from the construction sector, 40% growth in retail and media, as well as eventual earnings recovery in the IT sector.
2007E: Net profit growth (%)
59 59
44 41
10 5
(4)
(11)
(22)
(27)
(54)(60)
(40)
(20)
0
20
40
60
80
Constr
uctio
n
Indus
trials
Retail
Media
Banks
Mining
CA IB un
iverse IT
Oil&Gas
Teleco
ms
Real E
state&
Hotels
100
5239 39
24 186 4 1
(12) (12)(20)
0
20
40
60
80
100
120
Constr
uctio
n ITReta
il
Media
Indus
trials
Real E
state&
Hotels
Teleco
msBan
ks
CA IB un
iverse
Mining
Oil&Gas
Are 2007 earnings growth patterns already
discounted?

Polish Equity Quarterly: 1Q 2007 January 2007
16
Upsides to 12-month target prices WIG20: Upsides to 12M target prices (%)
Source: Bloomberg, CA IB estimates Source: Bloomberg, CA IB estimates
Our top picks include: PKO BP, TPSA, KGHM and TVN.
Among mid-caps, we have BUY ratings on: Budimex, Polimex, Kety, CCC and Groclin.
We see downsides in banks: Handlowy, Kredyt Bank and ING BSK. Other stocks that we believe have the least upside potential include: Netia, Agora, Lotos, Grajewo, LPP, Emax, Orbis and Dom Development.
Mid-caps: Upsides to 12M target prices (%)
25.6
21.9
17.6
15.8
14.1
12.4
11.8
10.8
10.2
8.1
7.8
7.1
7.0
5.1
2.4
0.7
(0.2
)
(0.3
)
(5)
0
5
10
15
20
25
30
KGH
TPS
TVN
PKO
BZW
PXM
CEZ
MO
L
BIO
BRE
PKN
PGN
PKM
KTY
GTC LT
S
NET
AGO
33.6
33.1
17.7
17.1
15.3
12.9
12.2
10.6
8.8
8.3
8.0
7.5
5.5
4.3
3.0
2.3
0.0
(2.0
)
(2.2
)
(3.9
)
(5.0
)
(5.9
)
(7.3
)
(16.
7)(20)
(10)
0
10
20
30
40
GCN EL
SBD
XCC
CCM
RCE
DC MIL IPL
EUR
CPL
EAT
ZAP
EMF
ECH
MPP
PBG
LPP
DOM
ORB
EMX
BSK
GRJ
KRB
BHW
CA IB recommendations and target price revisions
Source: CA IB estimates
New Old New OldBZ WBK BUY (↑) Hold 251 210 TP upgrade based on lower RFR and ERPBank Millennium BUY (↑) Hold 9.3 6.2 TP upgrade based on lower RFR and ERP and increased earningsComArch BUY (↑) Hold 225 196 TP upgrade based on increased earnings and lower RFR and ERP. Roll-up of target priceTVN BUY (↑) Hold 28.4 28.4 Recommendation upgrade on price performanceKety BUY (↑) Hold 205 200 TP upgrade based on lower RFR and ERPPolimex BUY (↑) Hold 168 160 TP upgrade based on lower RFR and ERPElstar Oils BUY (↑) Hold 17.5 17.8 Recommendation upgrade on price performanceComputerLand HOLD (↑) Sell 114 92 TP upgrade based on lower RFR and ERP and consolidation of EmaxEmax HOLD (↑) Sell 120 110 TP upgrade based on lower RFR and ERP. Roll-up of target priceInterGroclin BUY (↑) Hold 60 60 Recommendation upgrade on price performanceLPP HOLD (↑) Sell 770 700 TP upgrade based on lower RFR and ERP and increased earningsGTC HOLD (↑) Sell 43.0 35.5 TP upgrade on inclusion of new projects, lower RFR and ERPKGHM BUY Buy 103 122 TP downgrade based on decreased earningsCCC BUY Buy 54 53 TP upgrade based on lower RFR and ERPBRE HOLD Hold 350 260 TP upgrade based on lower RFR and ERP and increased earningsProkom HOLD Hold 146 132 TP upgrade based on lower RFR and ERP and increased stake in Comp. Roll-up of target priceAgora HOLD Hold 37.9 36.8 TP upgrade based on lower RFR and ERP. Roll-up of target pricePGNiG HOLD Hold 3.75 3.45 TP upgrade based on lower RFR and ERP and increased earningsMondi HOLD Hold 103 95 TP upgrade based on lower RFR and ERPPBG HOLD Hold 267 230 TP upgrade based on lower RFR and ERPEurocash HOLD Hold 8.00 7.95 TP upgrade based on lower RFR and ERPAmRest HOLD Hold 76.0 71.9 TP upgrade based on inclusion of Burger King project in the forecastsOrbis HOLD Hold 67.0 51.6 TP upgrade based on lower RFR and ERP and increased earningsING BSK SELL Sell 740 690 TP upgrade based on lower RFR and ERPGrajewo SELL Sell 53 50 TP upgrade based on lower RFR and ERPPulawy HOLD (↓) Buy 61 64 TP downgrade based on decreased earningsCEDC HOLD (↓) Buy 33.0 31.8 TP upgrade based on lower RFR and ERPEcho HOLD (↓) Buy 96 87 TP upgrade on inclusion of new projects, lower RFR and ERPImpel HOLD (↓) Buy 25.0 24.5 Recommendation downgrade on price performanceBank Handlowy SELL (↓) Hold 75 77 TP downgrade based on decreased earningsKredyt Bank SELL (↓) Hold 19.8 17.0 TP upgrade based on lower RFR and ERP
Reccommendation Target PriceReason for changeCompany
Top-picks for 2007: PKO BP, TPSA, KGHM and
TVN

Polish Equity Quarterly: 1Q 2007 January 2007
17
Note: * for banks and Dom Dev. P/BV, for GTC and Echo P/NAV, **IBES consensus estimates, *** multiples for fiscal years 2005/2006 – 2007/2008, **** prices in US$
CA IB Polish coverage
Source: Bloomberg, CA IB estimates
P/E (x) EV/EBITDA // P/BV // P/NAV (x)* DY (%)2006E 2007E 2008E 2006E 2007E 2008E 2006E
PKO PKO Buy 46.01 53 15.2 46,010 48.5 21.2 19.3 16.8 4.6 4.1 3.6 2.4Pekao** PEO Not covered 230.00 n.a. n.a. 38,349 47.1 22.2 19.7 17.6 4.3 4.0 3.7 3.4Bank BPH** BPH Not covered 923.00 n.a. n.a. 26,505 28.8 21.1 18.6 15.9 3.9 3.6 3.3 3.7Handlowy BHW Sell 88.00 75 (14.8) 11,498 25.0 20.8 19.0 16.0 2.8 2.7 2.5 4.3BZWBK BZW Buy 225.00 251 11.6 16,416 29.5 20.4 18.5 16.2 4.4 4.1 3.7 3.7INGBSK BSK Sell 776.00 740 (4.6) 10,096 18.5 16.2 18.3 15.6 2.8 2.8 2.6 5.6BRE BRE Hold 336.00 350 4.2 9,863 29.8 22.6 19.3 15.5 4.5 3.6 3.0 0.0Bank Millennium MIL Buy 8.20 9.3 13.4 6,963 34.5 26.2 18.1 13.2 3.2 2.8 2.5 1.9Kredyt Bank KRB Sell 21.35 19.8 (7.3) 5,800 15.0 12.3 19.2 15.6 2.8 2.7 2.5 4.1TPSA TPS Buy 23.26 29 24.7 32,564 48.6 15.5 14.5 12.5 5.6 5.7 5.3 8.2Netia NET Sell 4.70 4.75 1.1 1,829 49.3 n.m. n.m. n.m. 5.8 7.2 5.5 2.8Prokom PKM Hold 137.00 146 2.9 1,900 66.0 23.7 17.8 16.2 13.7 10.1 9.3 0.7ComputerLand CPL Hold 104.00 114 9.6 777 58.7 51.8 26.5 15.8 15.4 12.4 8.8 1.0ComArch CMR Buy 191.00 225 17.8 1,530 33.4 28.4 25.5 21.6 24.6 18.0 15.0 0.0Emax EMX Hold 119.50 120 0.4 412 63.2 51.7 21.0 19.0 14.8 10.5 9.7 0.0Agora AGO Hold 38.98 37.9 (2.8) 2,143 66.3 35.8 23.7 22.1 13.8 10.7 10.3 1.3TVN TVN Buy 24.02 28.4 18.2 8,699 38.6 29.2 22.5 19.1 21.7 15.9 13.6 0.0PKN PKN Hold 48.00 51 6.3 20,530 72.5 7.5 9.4 10.1 4.2 5.8 5.9 2.1Lotos LTS Hold 45.00 46 2.2 5,117 41.2 7.6 11.8 12.7 4.3 5.1 4.8 0.0PGNiG PGN Hold 3.51 3.75 6.8 20,709 15.3 20.4 16.4 16.8 7.3 6.1 5.9 3.9KGHM KGH Buy 80.05 103 28.7 16,010 55.7 4.6 5.2 5.6 2.2 2.6 2.9 11.0Mondi MPP Hold 99.00 103 4.0 4,950 28.7 19.4 15.8 14.4 11.8 10.2 9.6 5.2Grajewo GRJ Sell 55.90 53 (5.2) 2,774 39.7 28.5 17.5 15.1 13.5 9.6 8.1 3.0Pulawy*** ZAP Hold 58.00 61 5.2 1,109 28.8 8.8 11.8 13.0 2.9 3.6 3.8 3.4Kety KTY Buy 182.00 205 12.6 1,679 100.0 18.9 15.2 14.0 11.4 9.1 8.3 2.6InterGroclin GCN Buy 46.38 60 29.4 255 46.6 20.2 10.1 7.5 9.4 6.3 5.2 0.0Budimex BDX Buy 74.50 93 24.8 1,902 40.9 420.0 38.1 21.0 43.0 18.2 11.5 0.0Polimex PXM Buy 151.00 168 11.3 2,805 100.0 37.0 28.9 19.7 21.8 15.3 11.4 0.4PBG PBG Hold 256.00 267 4.3 3,438 63.6 57.5 38.8 26.7 40.6 25.3 17.8 0.0LPP LPP Hold 745.00 770 3.4 1,269 67.1 28.1 18.4 14.0 13.9 10.1 8.1 0.0CCC CCC Buy 46.35 54 16.5 1,780 25.3 31.1 19.7 14.4 23.9 15.1 11.0 2.8Eurocash EUR Hold 7.35 8.0 8.8 939 45.0 20.8 16.0 13.5 9.5 7.8 7.0 2.4CEDC**** CEDC Hold 30.28 33 9.0 3,218 74.8 21.7 18.8 16.1 14.1 12.6 11.6 0.0AmRest EAT Hold 71.90 76 5.7 971 60.1 26.1 20.5 17.0 12.3 10.3 8.6 0.0NFI Empik EMF Hold 14.00 14.5 3.6 1,430 31.5 32.2 23.4 18.4 13.1 10.6 8.8 0.0GTC GTC Hold 42.20 43 1.9 9,295 53.6 13.7 16.4 6.1 3.3 2.7 1.7 0.0Echo ECH Hold 91.00 96 5.5 3,822 59.0 14.1 10.6 12.6 2.1 1.5 1.1 0.0Dom Dev. DOM Hold 146.90 150 2.1 3,608 21.3 25.7 18.9 15.3 7.5 5.4 4.1 0.0Impel IPL Hold 23.00 24.9 8.3 346 41.2 17.1 15.7 15.5 6.7 6.2 6.1 2.9Orbis ORB Hold 65.05 67 3.0 2,997 59.4 43.9 28.1 19.7 14.3 11.9 10.3 0.5Bioton BIO Hold 2.20 2.48 12.7 5,809 46.1 105.4 53.6 36.5 73.3 31.8 21.6 0.0Elstar Oils ELS Buy 13.30 17.5 31.6 688 49.1 73.8 23.4 15.0 33.0 16.2 10.4 0.0WIG20 WIG20 3,202 3,570 11.5 17.3 15.8 14.1WIG WIG 49,560MOL MOL Hold 308.2 335.0 8.7 27,477 64.6 6.4 9.0 9.5 4.3 5.2 5.2 2.1CEZ CEZ Buy 130.6 141.0 7.9 77,315 33.0 19.8 17.0 14.4 10.0 8.4 7.5 2.5
Free float (%)
BANKS
TELECOM
IT
MEDIA
INDUSTRY
MCAP (PLNm)Sector Company Ticker Rating Current price
(PLN)12M TP
(PLN) Upside (%)
REAL ESTATE
RETAIL
CONST.
FOREIGN STOCKS
INDEX
OTHER
SERVICE
Banks: Volume growth accelerates...
Source: GUS
Mortgage loans (PLNm)
0
10,000
20,000
30,000
40,000
50,000
60,000
70,000
Mar-02 Sep-02 Mar-03 Sep-03 Mar-04 Sep-04 Mar-05 Sep-05 Mar-06 Sep-06
PLN FX
5.1
5.4
8.1
9.2
9.9
10.2
15.3
19.5
21.9
23.7
24.7
29.0
30.8
31.8
33.4
36.1
36.5
37.3
42.8
49.6
53.9
59.1
Slovenia
Poland
Slovakia
Lithuania
Czech Rep.
Hungary
Italy
Latvia
Austria
Greece
Estonia
France
Finland
Belgium
Malta
Luxemburg
Euro area
Sweden
Germany
Spain
Portugal
Ireland
Housing loans as % of GDP (2005)
Source: ECB, Eurostat

Polish Equity Quarterly: 1Q 2007 January 2007
18
Source: ECB, Eurostat
Corporate loans as % of GDP (2005)
... but underpenetration persists
13.1
18.4
18.9
22.3
25.7
26.2
30.4
30.4
33.6
34.4
35.7
38.0
38.2
42.6
45.7
46.1
48.2
49.6
59.7
60.0
64.1
66.8
Poland
Czech Rep.
Slovakia
Lithuania
Hungary
Finland
Estonia
Belgium
Latvia
Germany
France
Slovenia
Greece
Euro area
Italy
Sweden
Netherlands
Austria
Portugal
Malta
Spain
Ireland
0.5
5.012.4
21.0
21.1
24.724.9
26.5
36.9
43.455.2
59.962.6
Czech Rep.
Poland
Greece
FinlandNetherlands
ItalyPortugal
Spain
BelgiumGermany
France
Euro area
Austria
Assets of Polish and euro area mutual funds as % of GDP (2005)
Source: ECB, Eurostat
Banks: Overweight on strong macro and low CPI
WIG-Banks was up 50% last year, but we think it’s premature to take profits as 2007 shapes up to be the best year for the sector in at least a decade.Risks? We see little risk domestically (i.e. banks are likely to continue to outperform the equity market), but regionally valuations are as usual stretched versus CEE peers (for good reason, we argue!).Unlike in 2006, we now think that selection may be important as we now have unjustified P/E convergence, i.e. the market is neglecting growth profiles and the scale of exposure to volume growth
Banks: Comparable valuation
Source: Bloomberg, *IBES consensus, CA IB estimates
Price 12-M TP Upside P/BV (x) P/E (x) ROE (%)(local) (local) (%) 2006E 2007E 2008E 2006E 2007E 2008E 2006E 2007E 2008E
PKO BP PLN 46.0 53 15.2 BUY 4.6 4.1 3.6 21.2 19.3 16.8 23.3 22.4 22.7Pekao* PLN 230 n.a. n.a. NOT COVERED 4.3 4.0 3.7 22.2 19.7 17.6 19.9 21.7 21.8BPH* PLN 923 n.a. n.a. NOT COVERED 3.9 3.6 3.3 21.1 18.6 15.9 19.4 20.2 20.7BZ WBK PLN 225 251 11.6 BUY 4.4 4.1 3.7 20.4 18.5 16.2 22.6 22.8 24.1BRE PLN 336 350 4.2 HOLD 4.5 3.6 3.0 22.6 19.3 15.5 22.1 20.9 21.0Millennium PLN 8.2 9.3 13.4 BUY 3.2 2.8 2.5 26.2 18.1 13.2 11.6 16.5 20.1Handlowy PLN 88 75 (14.8) SELL 2.8 2.7 2.5 20.8 19.0 16.0 13.6 14.4 16.4ING BSK PLN 776 740 (4.6) SELL 2.8 2.8 2.6 16.2 18.3 15.6 18.0 15.4 17.5Kredyt Bank PLN 21.4 19.8 (7.3) SELL 2.8 2.7 2.5 12.3 19.2 15.6 25.5 14.4 16.6Poland 3.7 3.4 3.0 20.3 18.9 15.8 19.6 18.8 20.1Erste EUR 59.1 56 (5.2) HOLD 2.4 2.1 1.8 20.8 16.1 11.8 14.5 13.8 16.5OTP HUF 8,560 8,310 (2.9) BUY 3.4 2.8 2.3 12.3 11.0 10.0 30.2 26.5 23.8Komercni Banka* CZK 3,157 n.a. n.a. NOT COVERED 2.4 2.1 1.9 13.2 12.0 11.1 18.0 19.2 18.5Raiffeisen Int. EUR 114.0 96.0 (15.8) BUY 4.6 4.0 3.0 14.1 20.7 16.5 36.4 20.5 20.9FHB* HUF 1,861 1,500 (19.4) SELL 4.0 3.3 2.7 15.2 15.0 13.3 29.6 24.5 22.2Sberbank* US$ 3,450 n.a. n.a. NOT COVERED 5.9 4.4 3.4 23.9 19.1 15.2 28.0 25.9 25.2CEE peers 3.8 3.1 2.5 16.6 15.6 13.0 26.1 21.7 21.2PL/CEE (%) (2.0) 9.0 20.0 23.0 21.0 22.0 (25.0) (14.0) (5.0)
Currency RatingCompany

Polish Equity Quarterly: 1Q 2007 January 2007
19
Banks: PKO BP (BUY, TP: PLN 53)
Best exposure to volume growth (especially vs. merger story Pekao).
Still valid cost-cutting story on further restructuring and IT rollout.
More transparency will help sentiment.
Valuation: P/E of 19x this year, falling to 15x in 2009; upside may come from corporate segment, mutual funds and even more cut costs.
Risks? Political influence (we think offset by potentially positive effect from co-op with Post and PZU).
90
110
130
150
170
Jan-06 Mar-06 May-06 Jul-06 Sep-06 Nov-06 Jan-07
(Rebased to 100)
PKO
WIG
Source: Companies’ data, CA IB estimates
PKO BP: Performance check
Source: Bloomberg
2005 2006E 2007E 2008E 2009ENet profit (PLNm) 1,735.0 2,168.0 2,382.0 2,743.0 3,097.0Stated EPS 1.7 2.2 2.4 2.7 3.1NAVPS 8.8 10.1 11.4 13.0 14.7NIM (%) 4.4 4.4 4.8 5.1 5.1C/I ratio (%) 64.9 60.3 57.7 54.4 52.4Provisioning (%) 0.36 0.14 0.51 0.72 0.74Adj. ROE (%) 20.9 23.3 22.4 22.7 22.6Adj. P/E (x) 26.5 21.2 19.3 16.8 14.9Adj. P/BV (x) 5.3 4.6 4.1 3.6 3.2Dividend yield (%) 1.7 2.4 2.6 3.0 3.4
BUY-rated: BZ WBK (TP: PLN 251) and Millennium (TP: PLN 9.3)
Banks: Performance check
Source: Bloomberg
Source: Companies’ data, CA IB estimates
2005 2006E 2007E 2008E 2009EBZ WBKAdj. ROE (%) 16.1 22.6 22.8 24.1 25.1Adj. P/E (x) 31.8 20.4 18.5 16.2 14.3Adj. P/BV (x) 4.9 4.4 4.1 3.7 3.4Dividend yield (%) 2.7 3.7 4.1 4.6 5.2MillenniumAdj. ROE (%) 9.5 11.6 16.5 20.1 20.7Adj. P/E (x) 33.4 26.2 18.1 13.2 11.4Adj. P/BV (x) 2.9 3.2 2.8 2.5 2.2Dividend yield (%) 6.6 1.9 2.8 3.8 4.4
90
110
130
150
170
Jan-06 Mar-06 May-06 Jul-06 Sep-06 Nov-06 Jan-07
(Rebased to 100)
BZW
MIL
BZ WBK: High-quality exposure to Western part of Poland (both retail and SME corporates) and subsidiaries (Arka TFI and brokerage business likely to have another record year in 2007).Valuation: Attractive again after weak stock performance; P/E of 18x falling to 14x in 2009.Bank Millennium: Quickly escaping from lack of scope by adding new retail customers; mortgage boom to filter into transactional banking, TFI, credit cards. Valuation: Fastest growth in EPS; P/E falling from 18x to just 11x in 2009.

Polish Equity Quarterly: 1Q 2007 January 2007
20
BRE (HOLD, TP: PLN 350); Handlowy, ING and Kredyt Bank (SELL)
Source: Bloomberg
Source: Companies’ data, CA IB estimates
Banks: Performance check
80
100
120
140
160
180
200
220
Jan-06 M ar-06 M ay-06 Jul-06 Sep-06 Nov-06 Jan-07
BRE
BHW
KRB
BSK
(Rebased to 100)
BRE: Athough the stock doubled without correction, we would use any to accumulate it. New projects are generating operating leverage in the retail segment, warranting a decline in P/E from 19x to 12x in 2009
We are sellers of Kredyt Bank on valuation grounds. A growth story as well, but too high C/I ratio makes it too dangerous
ING and Handlowy: No investment story other than dividend yield; stagnant retail and falling corporate profits (both active in blue-chip segments of corporate = low margins). ROEsunder pressure. Catalysts to change our view? More success in winning retail volumes and/or SME business (ING has better odds in both)
2005 2006E 2007E 2008E 2009EBREAdj. ROE (%) 16.7 22.1 20.9 21.0 21.9Adj. P/E (x) 36.7 22.6 19.3 15.5 12.0Adj. P/BV (x) 5.6 4.5 3.6 3.0 2.4Dividend yield (%) 0.0 0.0 0.0 0.0 0.0HandlowyAdj. ROE (%) 13.7 13.6 14.4 16.4 17.3Adj. P/E (x) 18.7 20.8 19.0 16.0 14.3Adj. P/BV (x) 2.9 2.8 2.7 2.5 2.4Dividend yield (%) 4.1 4.3 3.9 4.7 5.2HandlowyAdj. ROE (%) 17.5 18.0 15.4 17.5 18.7Adj. P/E (x) 18.4 16.2 18.3 15.6 13.7Adj. P/BV (x) 3.0 2.8 2.8 2.6 2.5Dividend yield (%) 3.5 5.6 4.1 4.8 5.5Kredyt BankAdj. ROE (%) 14.6 25.5 14.4 16.6 18.0Adj. P/E (x) 25.9 12.3 19.2 15.6 13.0Adj. P/BV (x) 3.5 2.8 2.7 2.5 2.2Dividend yield (%) 1.0 4.1 2.6 3.2 3.8
Oil & Gas (1): Back to Underweight. Oil price lull, refining tougher?
We have kept an Underweight rating for Oil & Gas for most of 2006, upgrading the sector to Neutral for 4Q 2006. We are now downgrading Oil & Gas back to Underweight as we see no positive sector catalyst while company-specific risks point to a downside. While the price of crude oil seems to be bottoming with futures pointing to a 13% recovery in Brent over the next 12 months, we believe an oil price lull in the US$ 50-60 range is likely in the meantime. Refining outlook remains bleak. In 4Q, European refinery margins plunged 58% YoY with a flat Ural-Brent differential. Refining margins rebounded recently but the medium-term outlook remains poor with a growing pipeline of new capacity additions. We assume flat margins for 2007, at US$ 5.0/bbl with a 17% decrease in Ural-Brent differential to US$ 3.50/bbl. CEE oils are trading at median 2007E EV/EBITDA of 5.6x, slightly above historical multiples, at almost 40% and 27% respective premiums to European integrated and US downstream oils.
Oil fundamentals
Source: Bloomberg, CA IB estimates
Brent-ROT refinery margins (US$/bbl)
Source: Reuters
2007E 2006 4Q 2006 3Q 2006 QoQ (%) 4Q 2005 YoY (%)Dated Brent (US$/bbl) 61.5 65.1 59.5 69.7 (14.6) 56.7 4.9 Brent-Ural differential (US$/bbl) 3.50 4.20 3.40 4.39 (22.6) 3.28 3.7 Brent-ROT (US$/bbl) 5.00 4.89 2.97 5.20 (42.9) 7.12 (58.3)ROT+ differential (US$/bbl) 8.50 9.09 6.37 9.59 (33.6) 10.40 (38.8)
(2.0)0.02.04.06.08.0
10.012.014.0
Jan
Feb
Mar
Apr
May Jun
Jul
Aug
Sep Oct
Nov
Nov
Dec
5-year range 20052006 2007 5-year average
Oil price range-trading, refining margins outlook
bleak, valuation premium to Western peers?

Polish Equity Quarterly: 1Q 2007 January 2007
21
Oil & Gas (2): PKN preferred over Lotos but mind the risks
Despite significant underperformance, a major recovery in 2007 seems unlikely. We prefer PKN’spetrochemical support against Lotos’ refining leverage.Company-specific risks weight on PKN’s performance while Lotos suffers from pure refining exposure. PKN’s MN acquisition resulted in ca. PLN 5.0/share value destruction, eliminated dividend prospects as net gearing rose to 39%, and remains a source of downside risks, in our view. Earnings outlook rather weak, especially for Lotos. PKN’s 4Q 2006E net profit down 48% QoQ (up 84% YoY due to low base). Lotos’ earnings down 52% QoQ (down 76% YoY). In 2007, PKN and Lotos net profit down a respective 19.8% and 35.7% YoY.Valuation: Trading at an EV/EBITDA of nearly 6.0x (2007-2008), PKN does not look attractive vs. its key peers. Lotos’ EV-based multiples (nearly 5.0x EV/EBITDA, adjusted for the PKRT capex) appear to be fair, but not yet overly attractive.
Oil & Gas: Comparable valuation
Source: Bloomberg, CA IB estimates
PKN and Lotos: relative performance
Source: Bloomberg, CA IB estimates
MCAP PriceUS$m 2006E 2007E 2006E 2007E
PKN 6,843 48.0 7.5 9.4 4.3 5.8Lotos 1,706 45.0 7.9 11.8 4.5 5.1OMV 15,914 40.8 9.2 8.6 5.3 4.5MOL 11,083 20,275.0 6.8 9.4 4.5 5.3SNP Petrom 12,692 0.6 15.1 12.5 8.4 7.4Tupras 4,166 24.0 7.3 9.6 4.8 5.9Unipetrol 1,996 232.5 13.2 12.2 5.7 5.4Rompetrol 761 0.1 38.8 19.0 13.2 11.1Median 8.5 10.7 5.0 5.6
P/E (x) EV/EBITDA (x)
60
70
80
90
100
110
120
130
140
Jan-
06
Feb-
06
Mar
-06
Apr
-06
May
-06
Jun-
06
Jul-0
6
Aug
-06
Sep
-06
Oct
-06
Nov
-06
Dec
-06
Jan-
07
PKN LotosWIG 20 Brent Crude
(rebased to 100)
Oil & Gas (3): The impact of different crude supplies sources?
What if the Druzhba pipeline were to never reopen? The brief answer is an easy one: You just do not want to be the shareholder of PKN (Unipetrol), Lotos and MOL. Although our core scenario remains one that assumes the swift resumption of Russian crude oil supply to Central Europe, we did the quick-and-dirty math on what the valuation impact would be on CEE oils should the title-scenario (worst case) materialise.
We estimate we would have to cut our target prices for PKN and Lotos by around 29% and that of MOL by around 16% in a worst-case scenario. Our calculation assumed an incremental cost of crude supply of US$ 2.0/bbl (only US$ 1.5/bbl at Lotos due to its coastal location), which we believe may even be a conservative estimate.
No supply problems, as alternative supply routes exist and may easily be utilised.
The impact of the potential demise of Druzhba on CEE oils - drasticPKN* Lotos MOL
Refinery throughput (m bbl), 2007E 129.6 42.7 94.9Russian pipeline supply (m bbl), 2007E 115.9 39.8 89.9Annual profit decline pre-tax, US$m** 231.8 59.7 179.6Annual profit decline post-tax, US$m** 187.7 48.3 146.4PV of annual profit decline post-tax, US$m (perpetuity) 2,086 509 1,541Current TP PLN 51.0 PLN 46.0 HUF 22,000Current target MCAP, US$m 7,295.0 1,749.0 9,769***Downside risk to our TP (%) 28.6 29.1 15.8
Note:*including Unipetrol, excluding MN, **@ US$ 2.0/bbl incremental cost Source: CA IB estimates(only US$ 1.5/bbl for Lotos, *** MOL MCAP after deducting treasury shares
29% downside to our TP if alternative crude oil
supply used
Company-specific risks weight on PKN’s
performance while Lotos suffers from pure refining
exposure

Polish Equity Quarterly: 1Q 2007 January 2007
22
Telecoms: Neutral with positive bias despite regulatory risks
Positive bias despite regulatory risks due to improving mobile outlook. BUY TPSA, SELL Netia. We BUY TPSA due to its high dividend yield prospects and attractive valuation. Risk factors include a stronger than anticipated revenue impact of regulatory measures in the fixed line business which however appears offset by recovery in mobile growth. TPSA underperformed MSCI European Diversified Telecoms by 18.8 percentage points in 2006. TPSA’s 2007E EV/EBITDA multiple of 5.2x represents 5.0% and 13.7% discounts to MTel and Telefonica O2 multiples, unjustified in our view as we believe our forecast reflects Polish regulatory risks. The announcement of the dividend policy (due 1Q 2007) could be a catalyst. We forecast a 10% yield assuming the previous gearing guidance is maintained.We reiterate our SELL rating on Netia in light of a bearish earnings outlook and unattractive valuation. We forecast 10% YoY EBITDA drop in 2007 and yet the stock is trading at adjusted EV/EBITDA of 5.2x.
TPSA: Figures and ratios (2005-2008)
Source: Bloomberg, CA IB estimates
TPSA and Netia: Relative performancePLNm 2005 2006E 2007E 2008ENet revenues (PLNm) 18,342 18,860 18,580 18,230Net profit (PLNm) 2,316 2,100 2,250 2,600EBITDA (PLNm) 8,083 7,959 7,740 7,580EPS (PLN) 1.65 1.50 1.61 1.86P/E (x) 14.8 16.4 15.3 13.2CEPS (PLN) 4.7 4.7 4.6 4.5PCE (x) 5.2 5.2 5.3 5.4DPS (PLN) 1.0 1.9 2.1 2.4Dividend yield (%) 4.1 7.7 8.6 9.8EV/revenue (x) 2.4 2.3 2.2 2.2EV/EBITDA US$ min. adj. (x) 6.0 5.4 5.2 5.2
Source: Bloomberg, CA IB estimates
70
80
90
100
110
120
130
Jan-
06
Feb-
06
Mar
-06
Apr
-06
May
-06
Jun-
06
Jul-0
6
Aug
-06
Sep
-06
Oct
-06
Nov
-06
Dec
-06
TPSAMSCI Europe Diversified TelecomNetia
(rebased to 100)
Mining: Upgrade to Overweight (KGHM, BUY, TP PLN 103)
Copper: The outlook will prove positive on a 3-6 month perspective, we believe. Chinese GDP growth near 10% is continuing while the US housing sector appears to have seen its worst. KGHM: We switched to using the copper futures curve for forecasting the company’s earnings. Assuming copper at US$ 5,600/t and US$ 5,331/t in 2007 and 2008, respectively, we forecast KGHM’s net profit at PLN 3.1bnand 2.9bn. Valuation: 2007E copper business P/E ratio of 4.7x and EV/EBITDA of 2.9x, respective 37% and 17% discounts to sector peers. We expect the next dividend to yield 10.5%.
KGHM: Figures and ratios
Source: CA IB estimates
LME copper spot price vs. inventory
Copper futures curve
Source: Bloomberg
Source: Bloomberg
*copper business
3,000
4,000
5,000
6,000
7,000
8,000
9,000
10,000
Jan-0
5
Mar-05
May-05
Jul-0
5
Sep-05
Nov-05
Jan-0
6
Mar-06
May-06
Jul-0
6
Sep-06
Nov-06
Jan-0
7
020,00040,00060,00080,000100,000120,000140,000160,000180,000200,000
Copper price (US$/tonne, lhs)Copper inventory (tonnes, rhs)
4,000
4,400
4,800
5,200
5,600
Jan-0
7Ju
l-07
Jan-0
8Ju
l-08
Jan-0
9Ju
l-09
Jan-1
0Ju
l-10
Jan-1
1Ju
l-11
Jan-1
2
Copper futures curve Annual average
US$/t
2003 2004 2005 2006E 2007E 2008ERevenue (PLNm) 4,741 6,342 8,000 11,698 10,763 10,584EBIT (PLNm) 358 1,554 2,509 4,208 3,414 3,090Net profit (PLNm) 530 1,397 2,289 3,515 3,103 2,890Net profit core business (PLN m) 362 1,150 2,217 3,250 2,819 2,586P/E (x) 31.7 12.0 7.3 4.8 5.4 5.9P/E core business (x) 36.7 11.6 6.0 4.1 4.7 5.1EV/EBITDA (x)* 16.3 5.8 3.8 2.4 2.9 3.1Dividend yield (%) 0.0 2.4 11.9 10.5 9.2 8.6
We upgrade Mining to Overweight; longer run,
we still believe the Super Cycle will be supportive of
commodities prices
TPSA is one of our top-picks on valuation
grounds and dividend support. SELL Netia

Polish Equity Quarterly: 1Q 2007 January 2007
23
Media: Upgrade to Neutral. Switch to TVN.
We are upgrading Media to Neutral ahead of the publication of results for 4Q 2006, which is seasonally the strongest quarter for media companies.We are upgrading TVN to BUY. We would turn our attention to expected strong 4Q 2006 results, robust 2007 outlook with an expected 15-20% increase in TVN’s ad prices and new entrants on the market posing no significant threat in 2007, in our view.As to Agora (HOLD), we see the stock as fully valued. While the next year is likely to bring improvement in the company’s results (we are expecting 2007E adjusted EBITDA up 29% YoY), competitive risks (such as the new daily project by Polskapresse, Springer expanding on the Polish market) still remain in place.
Source: Bloomberg, CA IB estimates
Source: Bloomberg
Media: Comparable valuation
Source: Agora, TVN, CA IB estimates
Media: Quarterly adj. EBITDA growth
Price Target Upside Rating Adj. P/E (x) Adj. EV/EBITDA (x)(PLN) (PLN) (%) 2006E 2007E 2008E 2006E 2007E 2008E
Agora 39.0 37.9 (2.8) HOLD 35.8 23.7 22.1 13.8 10.7 10.3TVN 24.0 28.4 18.2 BUY 29.2 22.5 19.1 21.7 15.9 13.6
36%
62%
29%
54%
-56% -51% -48%
-7%
-80%
-60%
-40%
-20%
0%
20%
40%
60%
80%
1Q 2006 2Q 2006 3Q 2006 4Q 2006ETVN Agora
FY 2006 performance of media companies
35557595
115135155175195
Dec-05
Jan-0
6
Feb-06
Mar-06
Apr-06
May-06
Jun-0
6Ju
l-06
Aug-06
Sep-06
Oct-06
Nov-06
Dec-06
Agora TVN WIG
(rebased to 100)
IT: Waiting for facts? Upgrade to Neutral
We are upgrading the IT sector to Neutral on the improved visibility of public projects (an option worth consideration given their estimated price tag of more than PLN 2bn) and cost-cutting stories.In line with our prior underweight stand, most rated companies from our IT universe underperformed the WIG index (Prokom, ComputerLand and Emax, down a respective 10%, 14% and 22% in 4Q 2006). Two exceptions included ComArch (BUY, TP: PLN 225) up 9% and Asseco Poland (Restricted) up 11%, driven primarily by excellent results as well as merger & acquisition-related newsflow.Ahead of the release of 4Q 2006 results, we prefer ComArch and a potential turnaround candidate, ComputerLand. Negative surprises include Prokom and Emax. Looking ahead, we continue to see value in ComArch, trading at a slight discount to EU software players with no premium for its superior earnings growth track record (2004-2006E CAGR of 122%) and continued success in the export arena. Prokom remains our top pick for exposure to the public sector.
Source: Bloomberg, CA IB estimates
IT: Comparable valuationPrice Target Upside MCAP P/E (x) EV/EBITDA (x) PEG (x)
Company Ticker Rating PLN PLN (%) PLNm 2006E 2007E 2008E 2006E 2007E 2008E 2006EAsseco Poland (consensus) ACP PW R 56.0 R n.a. 2,583 31.9 23.9 22.0 n.a. n.a. n.a. 1.6Prokom PKM PW HOLD 137.0 146.0 6.6 1,903 23.7 17.8 16.2 14.2 10.5 9.6 1.1
ComArch CMR PW BUY 191.0 225.0 17.8 1,528 28.4 25.5 21.6 23.7 16.7 14.4 1.3
ComputerLand CPL PW HOLD 104.0 114.0 9.6 733 51.8 26.5 15.8 10.6 6.9 5.0 0.6
Emax EMX PW HOLD 119.5 120.0 0.4 412 51.7 21.0 19.0 14.8 10.5 9.7 0.8Median 51.7 25.5 19.0 14.8 10.5 9.7 0.80
Average 44.0 24.3 18.8 16.4 11.4 9.7 0.92EU IT service 18.1 15.4 13.8 9.2 8.1 7.2 1.19
EU IT software 34.9 26.3 23.1 19.8 15.8 13.6 1.67
Wagering on contracts from public administration
(price tag of PLN 2bn)
Yet, only one BUY: on ComArch
4Q is seasonally the best quarter for media;
earnings momentum improving in Agora,
strong results expected in TVN

Polish Equity Quarterly: 1Q 2007 January 2007
24
Real Estate: Neutral stance on top-performing sector in 2006
The real-estate/hotel sector was the top performer in 2006.
After a 32% rally in 4Q 2006 we are downgrading Echo to a HOLD, mainly due to the share price performance.
We are upgrading GTC to HOLD, raising our target price to PLN 43. GTC surprised us on the upside in terms of new sites acquisitions, having purchased plots representing ca. 105,000m2 of leaseable/sellable area in just 4Q 2006.
We are upgrading Orbis’ (HOLD) target price to PLN 67 as hotel industry operating trends look favourable with RevPar set to grow in Poland by ca. 11% p.a. in the next three years. Reportedearnings to be boosted by asset disposal.
Source: Bloomberg, CA IB estimates
Source: Bloomberg
Real estate companies: Comparable valuation
-10.1
-0.9
2.8
6.79.4
1.5
-0.3
-7.6
-0.3
4.42.3
9.6 9.2
4.0
12.6
-15.0
-10.0
-5.0
0.0
5.0
10.0
15.0
1Q 20
03
2Q 20
03
3Q 20
03
4Q 20
03
1Q 20
04
2Q 20
04
3Q 20
04
4Q 20
04
1Q 20
05
2Q 20
05
3Q 20
05
4Q 20
05
1Q 20
06
2Q 20
06
3Q 20
06
(%)
Orbis: RevPar growth on the rise
Source: Orbis
Price TP Upside P/E (x) P/BV (x) / EV/EBITDA (x)Real estate (PLN) (PLN) (%) Rating 2006E 2007E 2008E 2006E 2007E 2008EGTC 42.2 43 1.9 HOLD 13.7 16.4 6.1 3.3 2.8 1.7Echo 91.0 97 6.6 HOLD 14.1 10.6 12.6 2.2 1.6 1.1Dom Developmen 146.9 150 2.1 HOLD 25.7 18.9 15.3 21 14.8 11.9Hotels Adj. P/E (x) Adj. EV/EBITDA (x)Orbis 65.05 67 3.0 HOLD 43.9 28.1 19.7 14.3 11.9 10.3 80
120
160
200
240
280
Jan-
06Fe
b-06
Mar
-06
Apr-0
6M
ay-0
6Ju
n-06
Jul-0
6Au
g-06
Sep-
06O
ct-0
6No
v-06
Dec-
06
GTC Echo Orbis WIG
(rebased to 100)
FY 2006 performance of real estate companies
Construction: Upgrade to Overweight. Boom to continue
Construction output increased by 18% YoY in Jan-Nov 2006 and we expect the robust trends to be continued throughout 2007.The positive outlook is underpinned by the increasing flow of EU funds (EUR 20bn planned for 2007-2013), acceleration of fixed investments among corporates and seemingly insatiable demand for residential properties in large cities.Sector valuations appear to be justified by earnings growth: 2007E P/E of 35.2x but PEG of 0.7x.Our top pick is Budimex, where we believe the market continues to undervalue the company’s housing business while the flow of EU funds suggests a recovery in road construction margins. We are also buyers of Polimex. We like the company for its persistently implemented M&A expansion strategy and the discount to its peers in comparative valuation.
Source: CA IB estimates
Construction output growth (YoY, %)Source: CA IB estimates
Source: GUS
Construction: Comparable valuation Budimex, Polimex, PBG: EPS growth forecasts for 2007 and 2008
(7.8)(3.5)
15.5
4.1
13.4 15.7
4.9
15.321.0
28.723.4
(10)(5)05
101520253035
Jan-0
6
Feb-06
Mar-06
Apr-06
May-06
Jun-0
6Ju
l-06
Aug-06
Sep-06
Oct-06
Nov-06
%
28
48
81
47 45
1,004
0102030405060708090
100
Budimex Polimex PBG2007E 2008E
%
Company Price 12-M TP Upside Rating P/E (x) PEG (x)(PLN) (PLN) (%) 2006E 2007E 2008E 2007E 2006E 2007E 2008E
Budimex 74.5 93 25 BUY 420.0 38.1 21.0 0.2 43.0 18.2 11.5Polimex 151 168 11 BUY 37.0 28.9 19.7 1.0 21.8 15.3 11.3PBG 256 267 4 HOLD 57.5 38.8 26.7 0.9 40.6 25.3 17.8Average 171.5 35.2 22.5 0.7 35.1 19.6 13.5
EV/EBITDA (x)
Upgrade to Overweight: Positive outlook
underpinned by inflow of the EU funds, acceleration
in fixed investments and huge demand for
residential properties
We see the real estate sector as fairly valued;
GTC surprised us on the upside with new sites
acquisitions

Polish Equity Quarterly: 1Q 2007 January 2007
25
Industrials: Neutral: We BUY Groclin, Kety and Elstar
Industrials are trading at the average 2007E P/E of 15.8x and EV/EBITDA of 9.6x, rich multiples in our view even despite our forecast of a 5.5% GDP growth in 2007.Our top pick is Groclin (upgrade to BUY, TP: PLN 60). The stock fell 30% in the most recent 3 months but we believe the plunge to be played out. We forecast 100% EPS growth in 2007, which yields a 2007E P/E ratio of 10.1x. Hit by the negative newsflow on biofuel regulations ElstarOils plunged 23% without material deterioration of long-term fundamentals. We are upgrading Elstar to BUY.We are upgrading Kety to BUY from Hold (TP upped to PLN 205) as a still attractively valued (2007E P/E of 15.2x) play onPoland’s strong macro environment.
Source: CA IB estimates
Industrial stocks: 4Q 2006E earnings preview
Industrial output growth (YoY, %)
Source: CA IB estimates
Source: GUS
Industrials: Comparable valuation
(5)
0
5
10
15
20
25
Jan-0
5
Mar-05
May-05
Jul-0
5
Sep-05
Nov-05
Jan-0
6
Mar-06
May-06
Jul-0
6
Sep-06
Nov-06
%
Company Price 12-M TP Upside Rating P/E (x)(PLN) (PLN) (%) 2006E 2007E 2008E 2006E 2007E 2008E
Grajewo 55.9 53 (5) SELL 28.5 17.5 15.1 13.5 9.6 8.1Groclin 46.38 60 29 BUY 20.2 10.1 7.5 9.4 6.3 5.2Kety 182 205 13 BUY 18.9 15.2 14.0 11.4 9.1 8.3Mondi 99 103 4 HOLD 19.4 15.8 14.4 10.2 9.6 9.2Elstar 13.3 17.5 32 BUY 73.8 23.4 15.0 33.0 16.2 10.4Average 20.2 15.8 14.4 11.4 9.6 8.3
EV/EBITDA (x)
84.6
27.519.5
6.5 1.1
39.2
21.215.0
(11.4)
2.3
-20
0
20
40
60
80
100
Mondi Grajewo Kety Groclin Elstar4Q 2006E 4Q 2005
PLNm
Retail: Neutral: Seasonality disturbed by weather; BUY CCC on weakness
We believe the normal seasonality of the retail industry has been disturbed by the one-off factor of an unusually warm winter. Among the beneficiaries, we would place LPP, AmRest and EM&F. On the other hand, we believe that CCC and CEDC were hit by the absence of a freeze. Retail stocks are currently trading at an average 2007E P/E of 19.5x, 9% higher than in our previous quarterly, implying a PEG ratio of 0.8x. We maintain our NEUTRAL weighting of the retail sector towards the benchmark.
Within the sector, we prefer the reasonably priced growth story of CCC over the fully valued EM&F, Eurocash, CEDC, recovered LPP and depending on the Burger King deal, AmRest. Our pecking order in the retail industry would be: 1) CCC (BUY, TP PLN 54), 2) AmRest (HOLD, TP PLN 76), 3) EM&F (HOLD, TP PLN 14.5), 4) Eurocash (HOLD, TP PLN 8.0), 5) LPP (HOLD, TP PLN 770), and 6) CEDC (HOLD, TP US$ 33).
Retail: Comparable valuation
Source: Companies’ data, CA IB estimates Source: CA IB estimates
Retail: 4Q 2006 earnings growth
P/E (x) EV/EBITDA (x)2006E 2007E 2008E 2006E 2007E 2008E
LPP PLN 745.0 770.0 3.4 HOLD 28.1 18.4 14.0 0.6 13.9 10.1 8.1CCC PLN 46.4 54.0 16.5 BUY 31.1 19.7 14.4 0.5 23.9 15.1 11.0Eurocash PLN 7.35 8.0 8.8 HOLD 20.8 16.0 13.5 0.8 9.5 7.8 7.0CEDC US$ 30.3 33.0 9.0 HOLD 21.7 18.8 16.1 0.6 14.1 12.6 11.6AmRest PLN 71.9 76.0 5.7 HOLD 26.1 20.5 17.0 1.4 12.3 10.3 8.6NFI Empik PLN 14.0 14.5 3.6 HOLD 32.2 23.4 18.4 0.9 13.1 10.6 8.8Average 26.7 19.5 15.6 0.8 14.5 11.1 9.2
Upside (%)
Rating PEG (x)Company Price
(local)12M TP (local)
182.7
139.1110.1
73.248.7
35.518.2
0
40
80
120
160
200
LPP
EMPiK
AmRest
Euroca
sh
Retail u
nivers
eCEDC
CCC
Neutral stance maintained; CCC is only BUY
Neutral on valuation grounds, despite strong
GDP growth prospects in 2007; our main BUY ideas
are from within small caps territory: Groclin
and Elstar Oils

Polish Equity Quarterly: 1Q 2007 January 2007
26
Recommendations and Stock Ratings CA IB utilises a three-tier recommendation system for stocks under formal coverage: Buy, Hold, or Sell.
A BUY is applied when the expected total return over the next 12M is higher than the stock's cost of equity (“required return”).
A HOLD is applied when the expected total return over the next 12M is lower than its cost of equity but higher than zero.
A SELL is applied when the stock's expected total return over the next 12M is negative.
CA IB employs two further categorisations for stocks under coverage:
Restricted: A rating and financial forecasts and target price are not disclosed owing to compliance or other regulatory considerations such as a blackout period or conflict of interest.
Coverage in Transition: Due to changes in the research team, the disclosure of a stock's rating and target price and financial information are temporarily suspended. The stock remains in the CA IB research universe and disclosure of relevant information will be resumed in due course.
Temporary movements by stocks across the boundaries of these categories due to share price volatility will not necessarily trigger a recommendation change. CA IB will advise as and when coverage of securities commences and ceases. CA IB has no policy or standard as to the frequency of any updates or changes to its coverage policies.
The cost of equity for each stock is calculated using the standard Capital Asset Pricing Model utilising predicted risk-free rates for countries, market equity risk premiums for each country and individual stock betas.
Valuation Metrics • Cash earnings and, hence, CEPS are calculated with best efforts to adjust earnings
for non-cash items.
• EPS and CEPS are diluted for capital increases, rights issues, bonus shares, etc.
• Market and company valuations are made with the price at the market close on the last trading day before publication date.
• P/E (and P/CE) ratios are derived by dividing total market value by total earnings; negative earnings are treated as zero.
• NAV and, hence, book value per share refer to the most recent annual balance sheet, unless otherwise specified.
• Free float is that part of the listed MCAP that can be identified as, in principle, potentially available to a buyer in the market.
• EV/EBITDA incorporates MCAP, net debt and additional adjustments to enterprise value over EBITDA, and is also adjusted for capital changes.
Public offerings in this context are offerings of shares in issue or of new shares with current or immediate post-offering listings.
Definitions

Please note that the information at the back forms an integral part of this report.
2002 2003 2004 2005 2006E 2007E 2008EEBITDA (PLNm) 1,861 2,474 3,886 4,804 5,413 5,451 5,519Net profit (PLNm) 421 987 2,482 4,585 2,726 2,185 2,026EPS (PLN) 1.00 2.35 5.80 6.29 6.37 5.11 4.74EPS growth (%) 12.0 134.1 147.4 8.4 1.3 (19.8) (7.3)CEPS (PLN) 3.65 4.60 8.74 11.15 10.81 9.51 10.07P/E (x) 23.9 10.7 8.3 7.6 7.5 9.4 10.1 P/CE (x) 6.6 5.5 5.5 4.3 4.8 5.6 5.3 EV/EBITDA (x) 11.0 8.3 4.8 5.0 4.2 5.8 5.9 EV/DACF (x) 18.3 11.0 5.7 5.2 5.3 7.7 7.4 Dividend yield (%) 0.3 1.4 4.4 0.0 2.1 2.5 3.1 Net gearing (%) 28.1 25.0 3.0 16.4 8.6 39.1 38.6 ROE (%) 5.2 11.1 23.4 19.0 15.1 10.8 9.2 ROACE (%) 4.7 9.1 16.9 13.5 11.1 8.6 7.0
Shareholder structure: Treasury 10.20%, Nafta Polska 17.32%, free float 72.48% (including 7.69% in GDRs)EV-based multiples adjusted by treating the stake in Polkomtel as a cash equivalent at PLN 2.70bn after-tax value
Investment case: We maintain our HOLD rating and our 12M target price of PLN 51/share. PKN was one of the worst performing blue chips in Poland and also among the CEE/SEE oils in 2006. This makes many wonder if PKN is to outperform in 2007. Not likely, in our view. We continue to see a negative case for refiners in 2007-2010; we do not see PKN’s problems with MN (and with Russia) resolved; and further problems (such as uncertainty over management; potential crude supply issues in the mid-term) may also weigh on the stock. Only petchems’ strength may differentiate PKN from the rest of the sector, but this is not our core scenario for 2007 (despite expecting improving petchems YoY).
Recent developments: MN; Druzhba supply, Upstream plans. The MN deal was completed in December 2006. Our forecasts include the MN contribution from 2007. As said earlier, the consolidation will dilute EPS only in 2007 and only slightly (due to volume problems at MN), as financing costs are low, but the deal will massively dilute EV-based multiples, indicating value destruction. This is still estimated at PLN 5.0/share. The supply disruption in the Druzhba pipeline, we believe, will only be temporary. It, however, does highlight Poland’s exposure and it is entirely likely that at some point Poland will have to pay more for energy supply security. This would certainly hurt PKN. In this context, hostility with Russia clearly does not help either. PKN’s CEO confirmed PKN may come up with Upstream projects as early as in 2007 and may exceed the originally planned capex for this segment (US$ 130m/year in 2007-2009).
4Q Results preview: We see weak 4Q earnings, plunging ca. 50% QoQ to PLN 596m EBIT and PLN 507m net profit. On the other hand, these earnings will still show impressive YoY growth, but the base period was extremely weak and was also burdened by provisions, therefore this comparison may be misleading. In 4Q we expect continued strength in retail and petchems to be offset by very weak refining and more inventory holding losses (on the declining crude price). Forex gains will likely support the bottom line (on the strong PLN).
Valuation: Trading at an EV/EBITDA of nearly 6.0x (2007-2008) – EV-based multiples are boosted by the inclusion of MN – PKN does not look attractive vs. its key peers. Admittedly, near-term multiples fail to take into account PKN’s full investment cycle.
PKN Oil & Gas Poland
PLN 48.0 GDR US$ 32.0 Hold
Target price: PLN 51.0
WIG index 49,560 # of shares 427.7m MCAP PLN 20.53bn US$ 6.89bn Free float PLN 14.88bn US$ 4.99bn PKNA.WA / PKN PW
40
45
50
55
60
65
70
75
Jan-06 May-06 Sep-06 Jan-07
PKN Orlen
60
70
80
90
100
110
120
130
140
Jan-06 May-06 Sep-06 Jan-07
PKN Orlen WIG
(Rebased to 100)
Analysts Robert Réthy, CFA Tel. +36 1 374 7936 [email protected] Tomasz Bardzilowski, CFA Tel. +48 22 520 9979 [email protected] http://research.ca-ib.com
Will the laggard become a star? Unlikely, we think.
11 January 2007
Company Update

PKN January 2007
28
Table 2: 4Q 2006 Results preview
4Q 06 3Q 06 QoQ % 4Q 05 YoY %
Oil fundamentals Dated Brent (US$/bbl) 59.5 69.7 (14.6) 56.7 4.9Brent-Ural differential (US$/bbl) 3.40 4.39 (22.6) 3.28 3.7Brent-ROT (US$/bbl) 2.97 5.20 (42.9) 7.12 (58.3)ROT+ differential (US$/bbl) 6.37 9.59 (33.6) 10.40 (38.8)
4Q 06E 3Q 06 QoQ % 4Q 05 YoY %Financial forecasts Sales (PLNm) 11,065 14,879 (25.6) 11,353 (2.5)EBITDA (PLNm) 1,105 1,681 (34.3) 1,063 4.0EBIT (PLNm) 596 1,167 (49.0) 342 74.0o/w: Refining & Marketing 163 783 (79.3) 291 (44.1) Chemicals 253 183 38.2 195 29.8 Retail 126 183 (30.8) (32) n.a. Unipetrol 134 189 (29.2) 66 103.3 Others (80) (171) (53.3) (177) (54.7)Net profit (PLNm) 507 973 (47.9) 275 84.1
Source: Reuters, PKN, CA IB estimates
Figure 1: Rotterdam (Brent) refinery margin (US$/bbl)
3.42
5.69
4.87 5.00
3.22
7.09 7.48
7.14
5.02
6.19
5.20
2.97
0.0
1.0
2.0
3.0
4.0
5.0
6.0
7.0
8.0
1Q04
2Q04
3Q04
4Q04
1Q05
2Q05
3Q05
4Q05
1Q06
2Q06
3Q06
4Q06
Source: Reuters
Figure 2: Monomer spread* (ethylene margin, EUR/t)
(300)
(200)
(100)
0
100
200
300
1Q00
3Q00
1Q01
3Q01
1Q02
3Q02
1Q03
3Q03
1Q04
3Q04
1Q05
3Q05
1Q06
3Q06
* assuming 1 unit of ethylene and 0.55 unit of propylene Source: Datastream, CA IBproduced from 3 units of naphtha
Table 3: PKN – Earnings statement PLNm 2005 2006E 2007E 2008ENet revenue 41,188 50,819 56,060 58,847EBIT by segments Refining & Wholesale 2,698 1,966 1,203 910Retail 89 400 420 440Petrochemicals 788 778 930 939Other (79) 100 70 70HQ (732) (446) (411) (427)Unipetrol 261 617 607 608MN 0 0 398 591EBIT 3,025 3,414 3,217 3,131Net financials 218 15 (468) (574)Associates 203 223 228 247Extraordinary items 1,894 0 0 0Pre-tax profit 5,339 3,652 2,977 2,804Tax (701) (730) (566) (533)Minorities (53) (196) (227) (245)Net profit 4,585 2,726 2,185 2,026Depreciation (1,780) 1,999 2,234 2,388EBITDA 4,804 5,413 5,451 5,519 Source: PKN, CA IB estimates
Table 4: PKN – Cash flow PLNm 2005 2006E 2007E 2008ENet profit 4,585 2,726 2,185 2,026Depreciation 1,780 1,999 2,234 2,388Other non-cash (1,596) (104) (354) (106)Cash earnings 4,770 4,622 4,066 4,308Change in WC (1,827) (1,559) (134) (85)Capex (3,646) (1,800) (12,201) (4,250)Free cash flow (704) 1,262 (8,269) (27)Dividends (911) 0 (428) (513) Source: PKN, CA IB estimates
Table 5: PKN – Balance sheet PLNm 2005 2006E 2007E 2008EFixed assets 20,912 20,898 30,947 32,873Working capital 4,343 5,902 6,036 6,121Capital employed 25,317 26,862 37,046 39,056Shareholders equity 16,697 19,422 21,180 22,693Minority interest 2,616 2,813 3,849 4,094Net debt/(cash) 3,170 1,908 9,794 10,334Total assets 33,404 36,069 44,273 46,413 Source: PKN, CA IB estimates
Table 6: PKN – Key ratios % 2005 2006E 2007E 2008EEBITDA margin 11.7 10.7 9.7 9.4EBIT margin 7.3 6.7 5.7 5.3Net debt (cash)/equity 16.4 8.6 39.1 38.6 ROE 19.0 15.1 10.8 9.2 ROACE 13.5 11.1 8.6 7.0 Source: PKN, CA IB estimates

Please note that the information at the back forms an integral part of this report.
2002 2003 2004 2005 2006E 2007E 2008EEBITDA (PLNm) 335 540 805 1,075 1,140 890 895Net profit (PLNm) 94 289 543 930 675 434 404EPS (PLN) 1.20 3.68 6.90 6.67 5.94 3.82 3.56EPS growth (%) n.a. 207.3 87.5 (3.3) (11.0) (35.7) (6.9)CEPS (PLN) n.a. 5.05 8.74 9.75 8.67 6.66 6.63P/E (x) 37.6 12.2 6.5 6.7 7.6 11.8 12.7P/CE (x) n.a. 8.9 5.2 4.6 5.2 6.8 6.8EV/EBITDA (x) 11.8 6.9 4.6 4.5 4.3 5.1 4.8EV/DACF (x) 22.0 11.5 7.6 6.4 6.8 7.9 7.4Dividend yield (%) 0.4 0.2 0.4 0.9 0.0 0.0 0.0Net gearing (%) 32.8 13.2 4.9 (10.9) (6.6) 0.6 8.7ROE (%) 7.5 20.8 26.0 25.9 13.8 8.0 6.9ROACE (%) 7.2 17.4 22.7 21.6 15.0 9.1 8.3 Shareholder structure: Nafta Polska 51.91%; State Treasury 6.93%; free float 41.16%
Investment case: we still recommend an opportunistic stance. We keep our HOLD rating, but also reiterate our opportunistic trading suggestions (see our note, dated 24 November 2006) of selling Lotos at or around PLN 50/share (this has worked well lately) and of showing interest in Buying only below PLN 40/share. Our target price remains unchanged at PLN 46/share. The negative impact of the EPS downgrade was fully offset by our lower WACC assumptions for Poland (ERP cut by 50bps to 4.5% and the risk free rate was cut by 25bps to 5.25%).
Weakness in sector macro vs. attractive long-term growth prospects. The recent oil price decline and poor refinery margins will keep Lotos’ earnings and sentiment under pressure in the near term. We expect further deterioration of the refining macro in 2007-2009, resulting in negative earnings growth at Lotos (being one of the most leveraged on refining in the region). On the other hand, the attractive features of Lotos and the potential positive drivers, i.e. value-creating growth projects (refinery upgrade and expansion and upstream growth) are still several years away.
2007-2009 EPS cut by 4% on weaker US$ assumptions. We have lowered our PLN/US$ assumptions for our forecast horizon to a flat 2.99 from 2007 onwards. Lotos is exposed to the US$ in both its Upstream and refining segments and suffers from a weak US$/strong PLN. We have also trimmed our 2006 EPS estimate by 3%, having adjusted our 4Q forecasts for the poorer than expected refining macro in 4Q 2006.
4Q Results preview: Similarly to PKN, we expect very poor 4Q earnings. We see EBIT and net profit halving QoQ and also to be down slightly YoY. Refinery margins deteriorated further in 4Q QoQ (from US$ 5.2/bbl to US$ 3.0/bbl in 4Q) and the Ural-Brent differential also narrowed slightly. Further inventory holding losses may also hit reported earnings, and volumes seasonality does not help either.
Valuation: Lotos is traded at a rather high P/E of ca. 12.0x on 2007-2008 assumptions, a premium to the sector median. EV-based multiples (nearly 5.0x EV/EBITDA, adjusted for the PKRT capex) appear to be fair, but not yet overly attractive. The massive leverage on refining may deteriorate near-term multiples (and earnings) quickly, if the macro disappoints.
Lotos Oil & Gas Poland
PLN 45.0 Hold
Target price: PLN 46.0
WIG index 49,560 # of shares 113.7m MCAP PLN 5.12bn US$ 1.72bn Free float PLN 2.11bn US$ 0.72bn LTOS.WA / LTS PW
38
43
48
53
58
63
Jan-06 May-06 Sep-06 Jan-07
Lotos
80
90
100
110
120
130
140
Jan-06 May-06 Sep-06 Jan-07
Lotos WIG
(Rebased to 100)
Analysts Robert Réthy, CFA Tel. +36 1 374 7936 [email protected] Tomasz Bardzilowski, CFA Tel. +48 22 520 9979 [email protected] http://research.ca-ib.com
Not exciting at current price
11 January 2007
Company Update

Lotos January 2007
30
Table 7: 4Q 2006 Results preview 4Q 06 3Q 06 QoQ % 4Q 05 YoY %Oil fundamentals Dated Brent (US$/bbl) 59.5 69.7 (14.6) 56.7 4.9Brent-Ural differential (US$/bbl) 3.40 4.39 (22.6) 3.28 3.7Brent-ROT (US$/bbl) 2.97 5.20 (42.9) 7.12 (58.3)ROT+ differential (US$/bbl) 6.37 9.59 (33.6) 10.40 (38.8)
4Q 06E 3Q 06 QoQ % 4Q 05 YoY %Financial forecasts Sales (PLNm) 3,417 3,702 (7.7) 2,955 15.7EBITDA (PLNm) 197 331 (40.4) 219 (9.8)EBIT (PLNm) 120 254 (52.7) 145 (16.8)o/w: Upstream 61 47 30.0 n.a. n.a. Refining 60 198 (69.6) n.a. n.a. Retail (5) 5 n.a. n.a. Others 4 4 7.5 n.a. n.a.Net profit (PLNm) 96 200 (51.7) 408 (76.4)
Source: Bloomberg, Company data, CA IB estimates
Figure 3: Brent-ROT refinery margin (US$/bbl)
(2.0)0.02.04.06.08.0
10.012.014.0
Jan
Feb Mar AprMay Ju
n Jul
Aug Sep OctNov Nov Dec
5-year range 20052006 2007 5-year average
Source: Reuters
Figure 4: Ural-Brent differential (US$/bbl)
2.51 2.72
3.66
5.56
4.59
3.92 4.
32
3.28
4.09
4.94
4.39
3.42
0.0
1.0
2.0
3.0
4.0
5.0
6.0
1Q04
2Q04
3Q04
4Q04
1Q05
2Q05
3Q05
4Q05
1Q06
2Q06
3Q06
4Q06
Source: Reuters
Table 8: Lotos – Income statement
PLNm 2005 2006E 2007E 2008ENet revenue 9,646 13,074 12,080 11,766EBIT by segments Upstream n.a. 197 204 270Refining n.a. 642 355 268Retail n.a. (20) 0 15Others n.a. 20 20 20EBIT 812 839 578 573Net financials 46 90 43 32Extraordinary items 288 0 0 0Pre-tax profit 1,147 929 622 605Tax (173) (181) (118) (115)Minorities (46) (73) (71) (88)Associates 2 1 2 2Net profit 930 675 434 404Depreciation (263) (301) (311) (322)EBITDA 1,075 1,140 890 895
Source: Lotos, CA IB estimates
Table 9: Lotos – Cash flow
PLNm 2005 2006E 2007E 2008ENet profit 930 675 434 404Depreciation 263 301 311 322Other non-cash (256) 10 11 28Cash earnings 938 986 757 754Change in WC (397) (349) 119 38Capex (912) (790) (1,254) (1,284)Free cash flow (371) (153) (378) (492)Dividends (18) 0 0 0Ch. in net debt 626 (154) (378) (492)
Source: Lotos, CA IB estimates
Table 10: Lotos – Balance sheet
PLNm 2005 2006E 2007E 2008EFixed assets 3,581 4,080 5,033 6,005Working capital 1,231 1,580 1,461 1,423Capital employed 4,813 5,660 6,494 7,429Shareholders equity 4,554 5,226 5,661 6,065Total debt 407 457 635 927Net debt/(cash) (497) (343) 35 527Total assets 6,990 7,768 8,302 9,005
Source: Lotos, CA IB estimates
Table 11: Lotos – Key ratios
% 2005 2006E 2007E 2008EEBITDA margin 11.1 8.7 7.4 7.6EBIT margin 8.4 6.4 4.8 4.9Net debt (cash)/equity (10.9) (6.6) 0.6 8.7ROE 25.9 13.8 8.0 6.9ROACE 21.6 15.0 9.1 8.3
Source: Lotos, CA IB estimates

Please note that the information at the back forms an integral part of this report.
2002 2003 2004 2005 2006E 2007E 2008EEBITDA (HUFbn) 128.8 178.3 358.2 427.9 461.3 383.9 374.0 Net profit (HUFbn) 65.3 99.7 209.3 244.9 366.5 202.3 190.8 EPS (HUF) 683 623 2,030 2,406 3,154 2,261 2,133EPS growth (%) n.a. (8.8) 226.0 18.5 31.1 (28.3) (5.6)CEPS (HUF) 1,719 1,559 3,556 3,350 4,698 3,563 3,463P/E (x) 29.7 32.6 10.0 8.4 6.4 9.0 9.5 P/CE (x) 11.8 13.0 5.7 6.1 4.3 5.7 5.9 EV/EBITDA (x) 17.1 13.7 6.6 5.8 4.3 5.2 5.2 EV/DACF (x) 13.9 12.1 7.1 6.9 4.4 6.5 6.8 Dividend yield (%) 0.3 0.3 0.8 1.6 2.1 2.3 2.6 Net gearing (%) 44.1 47.7 30.1 29.0 (6.8) (5.4) (6.0)ROE (%) 16.9 13.5 33.3 28.5 28.9 18.4 16.4 ROACE (%) 7.5 8.1 18.9 19.8 20.7 15.3 13.5
Shareholder structure: OMV 10.0%, State Holding Co. (APV Rt.) 1.7%, Treasury 18.2% (including 8.2% held by BNP),Magnolia Finance 5.5%, free float 64.6%
Investment case: MOL is our top pick among CEE oils. We keep our HOLD rating on MOL (12M target price of HUF 22,000/share also unchanged), but see MOL increasingly interesting. Our trading call remains to buy the stock below HUF 20,000. We favour MOL over its peers in CEE for several reasons. A) The same-old quality advantage (assets, management, strategy), which is also reflected by the fact that MOL is the only oil now in the region that has not yet made a major M&A mistake (unlike OMV and PKN). B) A potential takeover target. Fully privatised and with the voting cap expiring at the end of 2009, MOL may soon become a takeover target, in fact the only sizeable one in the sector in CEE. And Hungary may not oppose a friendly takeover. These factors may justify a valuation premium for MOL.
Recent events: Russian M&A; gas storage tender; Druzhba supply; INA. 1) The acquisition of the Russian E&P asset (Baituganskoye field) may boost MOL’s reserves and production (once the field reaches peak flow rate) by ca. 15%. 2) The gas storage project will shift operations (and profits) from Upstream to the lower-return natgas infrastructure, also resulting in the loss of 15% of the domestic gas production. 3) The Druzhba supply disruption, if permanent (not our core scenario), would hurt MOL massively, but it may also result in MOL seeking stronger ties with Russian oil companies. 4) Unfortunately, INA – despite the recent IPO – is unlikely to be a driver for MOL in 2007, as the Croatian side will not make a decision before the elections.
2007-2008 EPS downgrade (8% and 5%) on forex rates, gas storage project. The earnings downgrade reflects our weaker US$/stronger HUF assumptions – which hurt oil earnings – as well as the fallout of Upstream production due to the gas storage project. We slightly revised up our 2006 estimates due to the stronger year-end HUF/EUR rate (forex gains).
4Q Results preview: We expect MOL also to report weak 4Q profits with EBIT plunging 35% and net profit to be down 50% QoQ (3Q net profit was boosted by one-off tax items). Sector macro weakness and seasonality are the major culprits. On the other hand, 4Q earnings may be similar to the year-ago numbers. Financials are to continue to support net earnings on forex gains triggered by the very strong HUF at the end of the year.
Valuation: MOL trades at a P/E of 9.0-9.5x and EV/EBITDA of 5.2x on 2007-2008 assumptions, slightly cheaper than the sector median, whereas one may argue it should trade at a premium.
MOL Oil & Gas Hungary
HUF 20,275 Hold
Target price: HUF 22,000
BUX index 24,117 # of shares 109.33m MCAP HUF 2,217bn US$ 11.34bn Free float HUF 1,432bn US$ 7.32bn MOLB.BU / MOL HB
17,000
19,000
21,000
23,000
25,000
27,000
Jan-06 May-06 Sep-06 Dec-06
MOL
80
90
100
110
120
130
Jan-06 May-06 Sep-06 Dec-06
MOL BUX
(Rebased to 100)
Analyst Robert Réthy, CFA Tel. +36 1 374 7936 [email protected] http://research.ca-ib.com
Our preferred CEE oil may soon be a trading Buy
11 January 2007
Company Update

MOL January 2007
32
Table 12: 4Q 2006 Results preview
4Q 06 3Q 06 QoQ % 4Q 05 YoY %Oil fundamentals Dated Brent (US$/bbl) 59.5 69.7 (14.6) 56.7 4.9Brent-Ural differential (US$/bbl) 3.40 4.39 (22.6) 3.28 3.7Brent-ROT (US$/bbl) 2.97 5.20 (42.9) 7.12 (58.3)ROT+ differential (US$/bbl) 6.37 9.59 (33.6) 10.40 (38.8)
4Q 06E 3Q 06 QoQ % 4Q05 YoY %Financial forecasts Sales (HUFbn) 686.0 765.6 (10.4) 758.4 (9.5)EBITDA (HUFbn) 93.2 127.1 (26.7) 105.4 (11.6)EBIT (HUFbn) 61.7 94.8 (34.9) 64.4 (4.2)Net profit (HUFbn) 59.6 119.5 (50.1) 52.1 14.4
* includes HUF 60bn one-off gain Source: Bloomberg, MOL, CA IB estimates
Figure 5: Brent and Urals crude prices (US$/bbl)
31.9 35
.4 41.4
44.2 47.6 51
.6 61.6
56.7 61
.8 69.5
69.7
59.6
29.4 32.7 37
.7
38.6 43
.0 47.7 57
.2
53.4 57
.7 64.6
65.3
56.2
0.010.020.030.040.050.060.070.080.0
1Q04
2Q04
3Q04
4Q04
1Q05
2Q05
3Q05
4Q05
1Q06
2Q06
3Q06
4Q06
BRENT URAL
Source: Reuters
Figure 6: Key product crack spreads (ROT-Ural, US$/t)
124.
7 177.
3
160.
9
139.
3
120.
4 157.
4
232.
0
147.
0
148.
0
242.
2
205.
7
117.
7
87.7 10
5.4 13
9.2
212.
0
163.
4
184.
8
184.
3
174.
8
151.
6
178.
0
170.
7
154.
9
0.0
50.0
100.0
150.0
200.0
250.0
300.0
1Q04
2Q04
3Q04
4Q04
1Q05
2Q05
3Q05
4Q05
1Q06
2Q06
3Q06
4Q06
GASOLINE DIESEL
Source: Reuters
Table 13: Earnings statement
HUFbn 2005 2006E 2007E 2008ENet revenue 2,473.6 2,961.4 2,308.9 2,104.1 EBITDA 427.9 461.3 383.9 374.0 Gas 50.4 35.5 27.9 28.7 Upstream 105.4 136.1 115.5 112.3 Downstream 185.6 180.9 141.4 128.0 Petrochemicals 19.1 20.5 21.2 21.9 HQ expenses (41.8) (46.0) (46.0) (46.0)Intersegment (5.7) 6.0 0.0 0.0 Provisions (8.6) 0.0 0.0 0.0 EBIT after provisions 304.4 333.0 259.9 245.0 Net financials (32.2) (15.8) (9.2) (4.5)Exceptional items 0.0 81.0 0.0 0.0 Pre-tax profit 272.3 398.2 250.8 240.5 Net profit 244.9 366.5 202.3 190.8
Source: MOL, CA IB estimates
Table 14: Cash flow
HUFbn 2005 2006E 2007E 2008ENet profit 244.9 285.5 202.3 190.8 Depreciation 123.5 128.3 123.9 129.0 Other non-cash (27.4) 23.6 (7.4) (10.0)Cash earnings 341.0 437.4 318.8 309.9 Change in WC (48.8) 59.6 (9.6) (7.5)Capex, acquisitions, divestitures (262.9) 40.4 (185.0) (200.0)Free cash flow 29.3 537.4 124.2 102.4Dividends (17.0) (35.0) (47.6) (50.6)Ch. in net debt (63.3) 409.0 (17.0) 11.3
Source: MOL, CA IB estimates
Table 15: Balance sheet
HUFbn 2005 2006E 2007E 2008EFixed assets 1,310.7 1,231.0 1,270.1 1,319.1 Working capital 175.3 115.7 125.3 132.8 Capital employed 1,519.5 1,366.9 1,411.5 1,466.4 Shareholders equity 983.3 1,079.0 1,125.3 1,208.3 Minority interest 70.4 186.4 167.8 151.0 Total debt 387.1 263.4 230.4 219.1 Net debt/(cash) 322.4 (86.6) (69.6) (80.9)Total assets 2,028.8 2,216.9 2,100.6 2,120.7
Source: MOL, CA IB estimates
Table 16: Key ratios
2005 2006E 2007E 2008EEBITDA margin (%) 17.3 15.6 16.6 17.8 EBIT margin (%) 12.3 11.2 11.3 11.6 Net debt (cash)/equity (%) 29.0 (6.8) (5.4) (6.0)ROE (%) 28.5 28.9 18.4 16.4 ROACE (%) 19.8 20.7 15.3 13.5
Source: MOL, CA IB estimates

Please note that the information at the back forms an integral part of this report.
2003 2004 2005 2006E 2007E 2008ERevenue (PLNm) 10,189 10,909 12,560 15,549 17,447 18,004EBITDA (PLNm) 2,747 2,856 2,654 2,568 2,923 2,962Net profit (PLNm) 677 793 880 1,014 1,265 1,234EPS (PLN) 0.14 0.16 0.17 0.17 0.21 0.21CEPS (PLN) 0.33 0.46 0.44 0.39 0.45 0.46BVPS (PLN) 1.47 3.55 3.52 3.54 3.62 3.66P/E (x) 25.9 22.1 20.8 20.4 16.4 16.8P/CE (x) 10.5 7.6 8.0 8.9 7.8 7.6P/BV (x) 2.4 1.0 1.0 1.0 1.0 1.0EV/Sales* (x) 1.6 1.5 1.3 1.1 0.9 0.9EV/EBITDA* (x) 6.0 5.8 6.2 7.3 6.1 5.9Dividend yield (%) 1.1 2.4 4.3 3.9 4.9 4.8
Shareholder structure: State Treasury 84.7% *EV adjusted for NPV of lease contract and stake in EUROPOLGAZ; EBITDA adjusted for interest from lease contract
Investment case: We reiterate our HOLD rating on PGNiG with our 12-month target price upped to PLN 3.75 from PLN 3.45. Although the regulator’s recent decisions regarding new natural gas tariffs appear to be favourable for PGNiG, the company’s earnings potential is still locked in by the regulatory price regime. The change in that pricing system seems to be a key issue for the company in light of the plans for LNG seaport construction and importation of LNG (the price of which is likely to exceed Gazprom’s prices). In the short run, unusually warm weather may put pressure on earnings in 1Q 2007.
Recent developments: PGNiG has been allowed to increase the regulated tariff for natural gas by 10% as of January 2007 resulting from a change in pricing formula that the company pays when importing natural gas from Gazprom (the change in formula implied an approximately 10% increase in import price). We estimate the increase in the regulated tariff will more that offset the increase in PGNiG’s costs, and therefore have increased our 2007 EBITDA forecast for the company by 7% to PLN 2.923m, and by 1% to PLN 2,962m for 2008. We have increased our net profit estimates by 21% and 7%, respectively, for 2007 and 2008.
4Q 2006 Results and outlook: We forecast PGNiG to report 4Q 2006 results with a 5% YoY decline in EBITDA to PLN 498m and 46% fall in net profit to 152m. The exceptionally warm weather in January 2007 creates a risk to the company’s 1Q 2007 results, which is seasonally the strongest in each year.
Valuation: Having updated our DCF model for revised earnings forecasts as well as assumptions for RFR (down to 5.25% from 5.5%) and ERP (down to 4.5% from 5.0%), we have increased our 12-month target price for PGNiG to PLN 3.75 from PLN 3.45. We reiterate our HOLD recommendation on the stock, which is trading at an adjusted 2007E EV/EBITDA of 6.1% while the nearest dividend payment yields 3.9%.
PGNiG Oil & Gas Poland
PLN 3.51 Hold
Target price: PLN 3.75 (Previously: PLN 3.45)
WIG index 49,560 # of shares 5.9bn MCAP PLN 20.7bn US$ 6.9bn Free float PLN 3.2bn US$ 1.1bn PGNI.WA / PGN PW
3.0
3.2
3.4
3.6
3.8
4.0
4.2
Jan-06 May-06 Sep-06 Jan-07
PGNiG
80
90
100
110
120
130
140
150
Jan-06 May-06 Sep-06 Jan-07
PGNiG WIG
(Rebased to 100)
Analyst Tomasz Krukowski, CFA Tel. +48 22 520 9859 [email protected] http://research.ca-ib.com
Waiting for the real winter weather
11 January 2007
Company Update

PGNiG January 2007
34
Table 17: PGNiG: 4Q 2006 Results preview
PLNm 4Q 2006E 4Q 2005 YoY (%) 2006E 2005 YoY (%)Sales 4,591 4,015 14 15,549 12,560 24 EBITDA 498 524 (5) 2,568 2,654 (3)EBIT 165 229 (28) 1,261 1,253 1 Net profit 152 282 (46) 1,014 880 15
Source: PGNiG, CA IB estimates
Table 18: PGNiG: Earnings revision
PLNm 2006E 2007E 2008E New Ch. % New Ch. % New Ch. % Sales 15,549 (1) 17,447 3 18,004 (4)EBITDA 2,568 (1) 2,923 7 2,962 1 Net profit 1,014 2 1,265 21 1,234 7
Source: PGNiG, CA IB estimates
Table 19: Earnings statement
PLNm 2004 2005 2006E 2007E 2008ENet revenues 10,909 12,560 15,549 17,447 18,004 Operating costs 8,052 9,905 13,288 14,762 15,215 EBITDA 2,856 2,654 2,568 2,923 2,962 Depreciation 1,531 1,402 1,307 1,381 1,479 EBIT 1,326 1,253 1,261 1,542 1,483 Net financials (168) 2 (8) 22 42 Pre-tax profit 1,158 1,254 1,252 1,563 1,525 Tax 365 374 238 297 290 Net profit 793 880 1,014 1,265 1,234
Source: PGNiG, CA IB estimates
Table 20: Cash flow
PLNm 2004 2005 2006E 2007E 2008ENet profit 793 880 1,014 1,265 1,234 Depreciation 1,531 1,402 1,307 1,381 1,479 Other non-cash 589 197 735 467 137 Cash earnings 2,912 2,478 3,055 3,113 2,850 Change in WC 43 (79) (323) (205) (60)Capex (1,274) (1,321) (1,400) (2,300) (2,300)Free cash flow 1,681 1,078 1,333 608 490 Change in LT investments (6) 588 784 969 1,108 Dividends (197) (500) (885) (811) (1,012)New capital (debt) (1,276) 1,127 (0) 0 0 Change in liquid funds 202 2,294 1,232 766 586
Source: PGNiG, CA IB estimates
Table 21: Balance sheet
PLNm 2004 2005 2006E 2007E 2008EFixed assets 23,989 23,146 22,524 22,518 22,243 Working capital 1,276 1,356 1,678 1,883 1,943 Capital employed 25,265 24,502 24,202 24,401 24,187 Shareholders equity 17,740 20,760 20,889 21,343 21,565 Net debt/(cash) 3,473 (742) (1,974) (2,740) (3,326)Other liabilities 5,028 5,036 5,936 6,507 6,674 Total assets 28,420 30,364 31,894 33,238 33,721
Source: PGNiG, CA IB estimates
Table 22: Key ratios
2004 2005 2006E 2007E 2008EEBITDA margin (%) 26.2 21.1 16.5 16.8 16.5 EBIT margin (%) 12.2 10.0 8.1 8.8 8.2 Net debt (cash)/equity (%) 19.6 (3.6) (9.4) (12.8) (15.4)Current ratio (x) 0.7 2.4 2.5 2.6 2.7 Debtors turnover (x) 5.5 5.5 5.2 5.0 4.8 ROE (%) 6.3 4.6 4.9 6.0 5.8 ROCE (%) 5.2 3.7 4.5 5.6 5.4
Source: PGNiG, CA IB estimates

Please note that the information at the back forms an integral part of this report.
2003 2004 2005 2006E 2007E 2008ERevenue (PLNm) 4,741 6,342 8,000 11,698 10,763 10,584EBIT (PLNm) 358 1,554 2,509 4,208 3,414 3,090Net profit (PLNm) 530 1,397 2,289 3,515 3,103 2,890Net profit core business (PLNm) 362 1,150 2,217 3,250 2,819 2,586EPS (PLN) 2.65 6.99 11.45 17.57 15.44 14.31EPS core business (PLN) 1.81 5.75 11.09 16.25 14.09 12.93CEPS (PLN) 4.13 8.35 12.90 19.16 17.08 16.17P/E (x) 31.7 12.0 7.3 4.8 5.4 5.9P/E core business (x) 36.7 11.6 6.0 4.1 4.7 5.1P/CE (x) 20.3 10.1 6.5 4.4 4.9 5.2EV/Sales (x)* 2.3 1.7 1.3 0.9 1.0 1.0EV/EBITDA (x)* 16.3 5.8 3.8 2.4 2.9 3.1Dividend yield (%) 0.0 2.4 11.9 10.5 9.2 8.6
Shareholder structure: State Treasury 44.3% *Note: EV adjusted for stakes in Polkomtel and Dialog
KGHM’s share price lost 19% in the past month with the sell-off being triggered by an 18% plunge in the price of copper. Although we still remain positive on the fundamentals of copper, we have decided to base our earnings forecast and valuation of the company on the copper futures curve. The latter yields US$ 5,600/tonne in 2007 and US$ 5,331/tonne in 2008, 12% and 3% respectively below our previous assumptions. This as well as a more conservative approach to the forex market (we assume a PLN/US$ exchange rate of 2.99 from 2007 forward versus 3.10 previously) has led to respective 29% and 20% cuts in our earnings forecasts for 2007 and 2008. A significant earnings downgrade notwithstanding, we reiterate our BUY recommendation on KGHM with the target price reduced by 16% to PLN 103. KGHM’s inexpensive valuation (2007E P/E of 4.7x) and hefty dividend yield (10.5%) are among the arguments to buy the stock.
We believe the outlook for the copper market will prove positive on a 3-6 month perspective. Chinese GDP growth near 10% is continuing while the US housing sector appears to have seen its worst. The odds of a decline in visible inventories on the LME look high, and when this occurs – probably by April – copper prices should see a resumption in support.
For forecasting KGHM’s earnings, we currently apply the copper futures curve, which points to US$ 5,600/tonne in 2007 (vs. our previous estimate of US$ 6,400/tonne) and US$ 5,331/tonne in 2008 (vs. US$ 5,500/tonne). We have trimmed our 2006 earnings forecasts by 4% to PLN 3,515m, and slashed them by 29% for 2007 to PLN 3,103m and by 20% for 2008 to PLN 2,890m. We forecast 4Q 2006 net profit at PLN 694m.
We have reduced our 12-month target price for KGHM by 16% to PLN 103. Nevertheless, with a 12-month 23% upside on a 12-month horizon, we reiterate our BUY rating on the stock. An inexpensive valuation (2007E copper business P/E ratio of 4.7x and EV/EBITDA of 2.9x) as well as the expectation of a hefty dividend payment (we forecast a yield of 10.5% based on a 50% payout ratio assumption) are the other arguments that we find as positives.
KGHM Metal and Mining Poland
PLN 84.0* Buy
Target price: PLN 103 (Previously: PLN 122) *Pricing as of 8 Jan 2007
WIG index 49,560 # of shares 200m MCAP PLN 16.8bn US$ 5.6bn Free float PLN 9.4bn US$ 3.1bn KGHM.WA / KGH PW
60
80
100
120
140
Jan-06 May-06 Sep-06 Jan-07
KGHM
90
110
130
150
170
190
Jan-06 May-06 Sep-06 Jan-07
KGHM WIG
(Rebased to 100)
Analysts Tomasz Krukowski, CFA Tel. +48 22 520 9859 [email protected] Tomasz Bardzilowski, CFA Tel. +48 22 520 9979 [email protected] http://research.ca-ib.com
When it settles
11 January 2007
Company Update

KGHM January 2007
36
4Q 2006 Results preview 4Q 2006 was the first quarter of a declining environment for KGHM. The copper price averaged US$ 7,088/tonne, and although it increased by 65% YoY, it subsided by 8% QoQ. Additionally, the zloty has continued its appreciation trend vis-à-vis the dollar, averaging 2.98 in 4Q 2006 versus 3.29 in 4Q 2005 and 3.10 in 3Q 2006. Against that backdrop, and forecasting KGHM’s volumes to decline by 9% YoY to 140,000 tonnes, we estimate the company will report revenues of PLN 2,757m, up 14% YoY and down 17% QoQ.
Looking at unit production costs, we forecast a 42% YoY gain to PLN 11,750/tonne. Our cost forecasts includes a bonus payment for employees of approximately PLN 100m that we expect to be booked in 4Q 2006.
Based on the above trends, we forecast KGHM to report EBIT of PLN 795m, down 8% YoY and net profit of PLN 694m, up 5% YoY (we note that in 4Q 2005 KGHM recognised a write-down of PLN 159m for its stake in Dialog, which depressed the bottom line).
Table 23: KGHM: 4Q 2006 Results preview
PLNm 4Q 2006E
4Q2005
YoY, %
3Q2006
QoQ, %
Sales 2,757 2,421 14 3,339 (17)EBIT 795 862 (8) 1,257 (37)Net profit 694 660 5 825 (16)Net profit core business 654 819 (20) 748 (13)
Copper volume sold ('000 t) 140 153 (9) 136 3 Silver volume sold (t) 300 283 6 343 (12)
Copper production costs (PLN/t) 11,750 8,275 42 11,537 2 Copper production costs (US$/t) 3,943 2,515 57 3,719 6
Copper price (US$/t) 7,088 4,297 65 7,670 (8)PLN/US$ rate 2.98 3.29 (9) 3.10 (4)
Source: KGHM, CA IB estimates
Table 24: Earnings statement
PLNm 2004 2005 2006E 2007E 2008ENet revenue 6,342 8,000 11,698 10,763 10,584 COGS 4,196 4,724 6,843 6,712 6,843 SG&A 517 570 574 584 598 Other operating items (75) (198) (73) (54) (53)EBITDA 1,827 2,800 4,525 3,744 3,467 Depreciation 273 291 318 330 376 EBIT 1,554 2,509 4,208 3,414 3,090 Net financials (108) 126 35 66 102 Pre-tax profit 1,446 2,635 4,242 3,480 3,193 Tax 296 417 992 661 607 Income from cons. subsidiaries 247 72 265 285 304 Net profit 1,397 2,289 3,515 3,103 2,890 Net profit core business 1,150 2,217 3,250 2,819 2,586
Source: KGHM, CA IB estimates
Table 25: Cash flow
PLNm 2004 2005 2006E 2007E 2008EEBIT 1,359 2,509 4,208 3,414 3,090 Tax 296 477 799 649 587 NOPAT 1,063 2,032 3,408 2,765 2,503 Depreciation 273 291 318 330 376 Gross cash flow 1,336 2,323 3,726 3,096 2,879 Change in operating WC 270 0 0 0 0 Capex 520 521 932 986 888 Increase in other assets, net 172 0 0 0 0 Free cash flow 373 1,802 2,794 2,110 1,991
Source: KGHM, CA IB estimates
Table 26: Balance sheet
PLNm 2004 2005 2006E 2007E 2008EFixed assets 6,552 7,079 8,320 9,169 9,967 Working capital 1,275 1,461 2,324 2,138 2,103 Capital employed 6,720 6,286 7,161 8,135 8,957 Shareholders equity 5,337 6,214 7,729 9,075 10,413 Net debt/(cash) (77) (1,595) (2,247) (2,648) (3,208)Total assets 8,948 10,977 13,915 14,933 16,246
Source: KGHM, CA IB estimates
Table 27: Key ratios
PLNm 2004 2005 2006E 2007E 2008EEBITDA margin (%) 28.8 35.0 38.7 34.8 32.8 EBIT margin (%) 24.5 31.4 36.0 31.7 29.2 Net debt (cash)/equity (%) (1.4) (25.7) (29.1) (29.2) (30.8)Current ratio (x) 1.2 1.4 1.4 1.5 1.7 ROE (%) 26.1 38.4 46.6 33.5 26.5 ROCE (%) 23.1 39.9 58.8 42.0 34.5
Source: KGHM, CA IB estimates

Please note that the information at the back forms an integral part of this report.
PLNm 2005 2006E 2007E 2008E 2009ENet revenues (PLNm) 18,342 18,860 18,580 18,230 18,360 Net profit (PLNm) 2,316 2,100 2,250 2,600 2,850 EBITDA (PLNm) 8,083 7,959 7,740 7,580 7,430 EPS (PLN) 1.65 1.50 1.61 1.86 2.04P/E (x) 14.1 15.5 14.5 12.5 11.4CEPS (PLN) 4.7 4.7 4.6 4.5 4.5PCE (x) 5.0 4.9 5.0 5.1 5.2DPS (PLN) 1.00 1.90 2.10 2.40 2.50Dividend yield (%) 4.3 8.2 9.0 10.3 10.7EV/revenue (x) 2.3 2.2 2.1 2.1 2.1EV/EBITDA US$ min. adj. (x) 5.8 5.1 5.0 5.0 5.1 Shareholder structure: France Telecom 47.50%, Polish state 3,87%, free float 48,63%
Due to positive developments in the cellular and broadband business lines, TPSA has been enjoying stronger than expected 2Q and 3Q results. A number of factors, including high dividend yield prospects and attractive valuation, led us to maintain our BUY rating and to increase the target price to PLN 29 on 15 December 2006. Nevertheless, we note substantial risk factors including heavy fixed line disconnections due to the implementation of wholesale line rental and the forced unbundling of TPSA’s DSL and fixed line subscriptions.
Results & developments: Although TPSA looks set to report volatile earning figures due to sustaining heavy fixed line losses, there are a number of factors that lead us to believe that the stock should not be underweighted during this period. TPSA’s EV/EBITDA multiple of 5.0x represents a 17% discount compared to the average Magyar Telecom and Telefonica O2 multiple. This discount seems to be unjustified given that our forecasts fully reflect the Polish regulatory risk and we do believe that the market will reduce this discount. Moreover, TPSA offers attractive dividend yield prospects. A detailed dividend policy announcement is expected in 1Q 2007. We also believe that TPSA will rake back at least half of the revenue decline that resulted from the previously mentioned customer base losses. The aggressive new head of the UKE might also be replaced soon due to EU complaints about the lack of independence of the UKE. The stock also gains an effective edge due to the market having already set its sights at a quite low level for next year.
Short-term outlook and 4Q 2006 results preview: We are expecting 4Q 2006 net profit of PLN 387m, down 30% YoY, on sales of PLN 4,921m, up 5% YoY driven primarily by strong growth in the cellular business (up 19.5% YoY), which partially offsets the expected sales declines in the fixed line segment (down 5.1% YoY). We are looking for EBITDA margin expansion to 36.4% from 34.6% in the corresponding period of 2005.
Valuation: TPSA is currently trading with 25% upside to our target of PLN 29.0. Based on our estimated 2006 and 2007 EV/EBITDA of 5.1x and 5.0x, TPSA trades at a 21% and 22% discount to the CEE diversified peer group and a 27% and 18% discount to the CEE median, respectively.
TPSA Telecoms – Diversified Poland
PLN 23.26 Buy
Target price: PLN 29.0
WIG index 49,560 # of shares 1,400m MCAP PLN 33,880m US$ 11,369m Free float PLN 16,465m US$ 5,525 TPSAs.WA / TPS PW
17.5
18.5
19.5
20.5
21.5
22.5
23.5
24.5
25.5
Jan-06 May-06 Sep-06 Jan-07
TPSA
70
80
90
100
110
120
130
140
Jan-06 May-06 Sep-06 Jan-07
TPSA WIG
(Rebased to 100)
Analysts Anna Bossong, CFA Tel. +44 207 309 7840 [email protected] Przemyslaw Sawala-Uryasz Tel. +48 22 520 9960 [email protected] http://research.ca-ib.com
Good story – not for the faint hearted
11 January 2007
Company Update

TPSA January 2007
38
Table 28: 4Q Results preview (IFRS, consolidated) PLNm 4Q 2006E 4Q 2005 Ch.% 2006E 2005 Ch.%Fixed line telephony 2,230 2,350 (5) 8,863 9,794 (10)Mobile telephony 1,865 1,561 19 6,942 5,773 20Data services 577 544 6 2,247 2,099 7Group revenue 4,921 4,686 518,86018,342 3EBITDA 1,791 1,621 10 7,959 8,083 (2)EBITDA margin (%) 36 35 5 18 44 (59)EBIT 695 612 14 3,380 3,827 (12)FX gains/(losses) - 24 (100) (6) (24) (75)Pre-tax profit 497 516 (4) 2,613 3,005 (13)Net profit 387 553 (30) 2,100 2,316 (9)
Source: CA IB
Preliminary 4Q 2006 preview
TPSA will release its 4Q 2006 earnings on 1 March. We expect 4Q net profit to decline 30% YoY in spite of 5% sales growth YoY. The main reasons for this are:
• Heavy fixed line disconnections resulting from wholesale line rental.
• Forced unbundling and fines associated with TPSA’s DSL and fixed line subscriptions.
Despite the group’s 5% YoY fall in fixed line telephony, we expect EBITDA and EBITDA margin growth due to:
• Fixed line margins being bolstered by recent agreements with unions.
• Strong cellular business performance and increased per minute revenues.
We are looking for the group to report a 19.5% YoY growth in mobile telephony. The EBITDA margin should grow 5% to 36.4%, which will result in 10.5% EBITDA growth to PLN 1,791.
Table 29: Earnings statement (IFRS, consolidated) PLNm 2005 2006E 2007E 2008E 2009E 2010ERevenue: fixed line 9,794 8,863 7,882 7,270 6,969 6,835Revenue: cellular 5,773 6,942 7,456 7,579 8,065 8,422Net revenue 18,342 18,860 18,580 18,230 18,360 18,680 Net revenue, change % (1.0) 2.8 (1.5) (1.9) 0.7 1.7 EBITDA 8,083 7,959 7,740 7,580 7,430 7,580 EBITDA, change % (1.7) (1.5) (2.8) (2.1) (2.0) 2.0 EBIT 3,827 3,380 3,470 3,850 3,970 4,280 EBIT, change % 1.0 (11.7) 2.7 11.0 3.1 7.8 Net financials (822) (767) (610) (470) (400) (340)Pre-tax profit 3,005 2,613 2,860 3,380 3,570 3,940 Tax (514) (610) (780) (720) (750) (800)Net profit 2,316 2,100 2,250 2,600 2,850 3,190
Source: UniCredit CA IB
Table 30: Cash flows (IFRS, consolidated) PLNm 2005 2006E 2007E 2008E 2009E 2010ECash earnings 6,576 6,630 6,470 6,330 6,310 6,490 Ch. in working cap 554 (35) 14 (24) 78 25 Capex (3,046) (3,009) (2,596) (2,481) (2,593) (2,630)Free cash flow 4,084 3,586 3,888 3,826 3,795 3,885Other op. CF 29 114 (68) (78) 22 72Dividends (462) (1,400) (2,660) (2,940) (3,360) (3,500)Acquisitions/disposals (4,880) 0 0 0 0 0 Change in liquid funds (1,229) 2,300 1,160 808 457 457Closing net debt 7,784 5,484 4,323 3,516 3,058 2,601
Source: CA IB
Table 31: Balance Sheet (IFRS, consolidated) PLNm 2005 2006E 2007E 2008E 2009E 2010ELong-term assets 31,262 29,743 28,121 26,873 26,008 25,340 Cash 1,702 1,655 3,177 3,484 3,442 2,899 Current assets 4,362 4,385 5,873 6,124 6,114 5,606 Total assets 35,624 34,125 33,993 32,994 32,124 30,946 Current liabilities 8,694 7,772 9,089 7,480 7,601 7,688 Capital employed 26,930 26,353 24,904 25,514 24,523 23,258 Equity 17,977 18,677 18,267 17,927 17,417 17,107 Minorities 13 10 10 10 10 10 LT debt 6,347 5,000 4,000 5,000 4,500 3,500 Other LT liabilities 2,593 2,666 2,627 2,577 2,596 2,641 Total equity and liabilities 35,624 34,125 33,993 32,994 32,124 30,946
Source: CA IB
Table 32: Key ratios (IFRS, consolidated) 2005 2006E 2007E 2008E 2009E 2010EROE (%) 12.9 11.2 12.3 14.5 16.4 18.6 ROA (%) 10.7 9.9 10.2 11.7 12.4 13.8 ROCE (%) 14.2 12.8 13.9 15.1 16.2 18.4 Net debt/equity (%) 43.3 29.4 23.7 19.6 17.6 15.2Interest cover 4.0 4.4 5.1 6.7 7.8 9.5 Fixed channels (‘000s) 10,607 10,155 9,370 8,858 8,283 7,786 ARPL (US$/mth) 34.1 35.3 36.5 36.7 38.0 40.2 Cellular subs (‘000s) 9,919 12,491 13,294 13,874 14,218 14,233 ARPU (US$/mth) 19.1 17.5 16.9 16.3 16.6 16.9 MOU (min/mth) 97 101 105 105 104 105
Source: CA IB

Please note that the information at the back forms an integral part of this report.
PLNm 2004 2005 2006E 2007E 2008E 2009ENet revenues (PLNm) 865 909 877 926 1,021 1,113Net profit (PLNm) 158.1 59.0 (26.1) (48.4) (67.1) (38.6)EBITDA (PLNm) 343 339 269 241 288 309EPS (PLN) 0.44 0.15 (0.07) (0.12) (0.17) (0.10)EPS diluted (PLN) 0.40 0.16 (0.06) (0.12) (0.16) (0.09)P/E diluted (x) 12.7 32.4 n.a. n.a. n.a. n.a.CEPS (PLN) 1.0 0.8 0.7 0.5 0.5 0.5 PCE (x) 4.9 6.3 7.7 9.8 11.0 9.6 DPS (PLN) 0.10 0.13 0.13 0.13 0.13 0.00 Dividend yield (%) 2.0 2.6 2.6 2.6 2.6 0.0 EV/Revenue diluted (x) 2.3 2.0 2.2 2.1 2.0 1.9 EV/EBITDA diluted (x) 5.8 5.3 7.3 8.2 7.2 6.8 Net debt (cash) /equity (%) (13.2) (11.1) 1.1 5.0 3.5 (0.8)
Shareholder structure: Novator Telecom Poland 25.24% SISU Capital Ltd. 6.10%, Third Avenue Management LLC: 14.27%, Pioneer Pekao 5.08%, Free float 49.31%
In our recent note, we have reviewed our Netia earnings forecasts in the light of the disappointing 3Q 2006 results and management’s more bearish statements about the outlook for earnings in 2007. We have reduced our underlying EBITDA forecasts for 2007 and 2008 by 15% with revenue expectations in 2007 and 2008 cut by 2.6% and 3.8%, respectively. This had a negative impact on the 12-month valuation in our model (cutting it by ca. PLN 0.4 per share), but we have decided to wait until management issues its revised earnings guidance for 2007 before altering our 12-month target price from the current PLN 4.75, in case our revisions have been too bearish. We are maintaining our SELL rating given the 6% downside to our current target price.
4Q 2006 Preliminary preview: We are expecting Netia to report a net loss of PLN 20m (compared to a PLN 11.6m net loss in 4Q 2005) on sales of PLN 225m, down 5% YoY. The fourth quarter results were boosted by the inclusion of PLN 13.5m in licence fee write-backs, being the last remaining liabilities related to EI-Net’s licences. Primary factors behind the weak results include: continued pressure on call revenues (weak demand for fixed line voice services), declining fixed to mobile tariffs (due to a 22% cut in mobile interconnection tariffs in December 2006) and continued high leased line costs (see over).
Outlook: Reduced mobile interconnection rates in December are likely to put further downward pressure on call revenues in 2007 by pushing down fixed to mobile call tariffs. Management has advised that 2007 margin and revenue targets will almost certainly require downward revision. P4 is set to launch operations in 1Q 2007 but the market is unlikely to get a feel for its performance until the third quarter 2007. Management has recently warned that the company is likely to find it costly to attract subscribers.
Netia Telecoms – Diversified Poland
PLN 4.83* Sell
Target price: PLN 4.75 *Pricing as of 4 Jan 2007
WIG index 49,560 # of shares 389.2m MCAP PLN 1,880m US$ 631m Free float PLN 927m US$ 311m NTIA.WA/NET PW
4.0
4.5
5.0
5.5
6.0
Jan-06 May-06 Sep-06 Jan-07
Netia
65
75
85
95
105
115
125
135
Jan-06 May-06 Sep-06 Jan-07
Netia WIG
(Rebased to 100)
Analysts Anna Bossong, CFA Tel. +44 207 309 7840 [email protected] Przemyslaw Sawala-Uryasz Tel. +48 22 520 9960 [email protected] http://research.ca-ib.com
Cutting earnings down to size
11 January 2007
Company Update

Netia January 2007
40
Table 33: 3Q 2006 Results preview (IFRS, consolidated) PLNm 4Q 06E 4Q 05 Ch. % 3Q 06 2Q 06 1Q 06Net revenue 225.1 237.1 (5.0) 230.5 203.3 218.4Net interconnection (65.6) (56.7) 15.7 (66.9) (49.1) (56.1)Gross profit 159.5 180.4 (11.6) 163.6 154.2 162.3 EBITDA 55.4 72.8 (24.0) 94.7 58.4 58.8 EBITDA margin (%) 24.6 30.7 0.0 41.1 28.7 26.9 EBIT (13.1) 10.1 (229.2) 25.1 (9.5) (5.8)Associates (10.0) (2.5) 292.4 (7.3) (4.7) (3.1)Net financials (0.0) 0.4 (111.6) (0.2) 0.5 1.4 Pre-tax profit (23.1) 8.0 (389.5) 17.7 (13.7) (7.6)Net profit (loss) (20.1) (11.6) 72.6 17.7 (12.8) (10.8)
Source: Netia, CA IB
Preliminary 4Q 2006 preview
Netia will release its 4Q 2006 earnings on 1 March. We expect the fourth quarter results to be boosted by the inclusion of PLN 13.5m in licence fee write-backs, being the last remaining liabilities related to El-Net’s licences. The results are nevertheless likely to fall well short of the third quarter result, which was boosted by PLN 40.7m in licence fee write-downs. The main reasons for this are:
• Continued pressure on call revenues from weak demand for fixed line voice services
• Declining fixed to mobile tariffs resulting from a 22% cut in mobile interconnection tariffs in December 2006.
• Continued high leased line costs in the fourth quarter following a sharp rise in the third quarter as a result of the acquisition of Pro Futuro. Netia management expects these costs to come down in 2007 as Pro Futuro’s leased line contracts expire and it switches to using Netia’s network but, in the meantime, this will remain a negative factor on the cost side.
Given these factors, we are looking for the group to report a 5.0% YoY fall in revenues in the fourth quarter and an EBITDA margin of 24.6%. This is expected to result in a 24.0% YoY decline in EBITDA to PLN 55.4m.
Table 34: Earnings statement (IFRS, consolidated) PLNm 2004 2005 2006E 2007E 2008ENet revenue 865 909 877 926 1,021Net revenue, change % 22.8 5.0 (3.4) 5.5 10.3 EBITDA 343 339 269 241 288EBITDA , change % 66.9 (1.3) (20.5) (10.4) 19.1 EBIT 125.9 90.3 (3.3) (6.8) 42.3 EBIT, change % (300.4) (28.3) (103.6) 107.9 (722.6)Net financials (4.9) 8.2 1.6 (2.3) (2.9)Associates 0.0 (3.1) (25.0) (90.1) (116.9)Pre-tax profit 121.0 95.5 (26.7) (99.2) (77.5)Tax 46.3 (35.3) 1.2 51.4 11.0 Extraordinaries (8.3) 0.0 0.0 0.0 0.0 Net profit 158.1 59.0 (26.1) (48.4) (67.1)
Source: Netia, CA IB
Table 35: Cash flow (IFRS, consolidated) PLNm 2004 2005 2006E 2007E 2008ECash earnings 338 343 245 151 168Ch. in working cap 5 32 (21) 5 (12)Capex (191) (146) (269) (185) (184)Free cash flow 152 229 (45) (29) (28)Other cash flows (32) (58) 14 84 114Dividends - (39) (50) (51) (51)Shares issued 55 (41) 21 - -Acquisitions/disposals (101) (134) (225) (89) -Change in liquid funds 74 (41) (285) (84) 36Net cash (debt) 302 260 (25) (109) (74)
Source: Netia, CA IB
Table 36: Balance sheet (IFRS, consolidated) PLNm 2004 2005 2006E 2007E 2008EFixed assets 2,095 2,196 2,393 2,382 2,217Working capital (49) (81) (60) (65) (53)Capital employed 2,348 2,376 2,338 2,278 2,140Equity 2,285 2,354 2,299 2,200 2,082Net debt (302) (260) 25 109 74Minorities 5 6 7 8 8Total assets 2,533 2,627 2,563 2,493 2,336
Source: Netia, CA IB
Table 37: Key data (IFRS, consolidated) 2004 2005 2006E 2007E 2008ENet debt (US$m) (100) (80) 8 36 24Interest cover n.a. n.a. (31.4) (21.6) (14.6)Net debt/equity (%) (13.2) (11.1) 1.1 5.0 3.5ROE (%) 6.9 2.5 (1.1) (2.2) (3.2)ROCE (%) 5.4 3.8 (0.1) (0.3) 2.0Fixed lines (‘000s) 425 413 396 397 397Business subs (%) 34.3 28.4 0.3 28.4 12.8ARPL (US$/mth) 31.9 33.6 4.8 38.8 2.0
Source: Netia, CA IB

Please note that the information at the back forms an integral part of this report.
2005 2006E 2007E 2008E 2009E
Net profit (PLNm) 1,735 2,168 2,382 2,743 3,097
Stated EPS 1.7 2.2 2.4 2.7 3.1
NAVPS 8.8 10.1 11.4 13.0 14.7
NIM (%) 4.4 4.4 4.8 5.1 5.1
C/I ratio (%) 64.9 60.3 57.7 54.4 52.4
Provisioning (%) 0.36 0.14 0.51 0.72 0.74
Adj. ROE (%) 20.9 23.3 22.4 22.7 22.6
Adj. P/E (x) 26.5 21.2 19.3 16.8 14.9
Adj. P/BV (x) 5.3 4.6 4.1 3.6 3.2
Dividend yield (%) 1.7 2.4 2.6 3.0 3.4
Shareholder structure: State Treasury 51.5%
PKO BP is our top pick for the year, even despite strong performance since we upgraded it to a BUY on 1 December 2006. The stock offers all the features that we seek for this year (exposure to retail, rising volumes, cost containment/restructuring option), plus a play on more transparency. It also has certain risks, most important of which for us are potential politically-driven disruptions and delays in IT rollout or selling of mutual funds. Nevertheless, we think that positives outpace the risks and we buy the stock on any weakness. We look for strong YoY earnings in 4Q. The stock trades at P/E of 19.3x, falling to 16.8x next year.
Recent developments. The market absorbed very well an overhang from employees, amounting to 105m shares. On the negative side, we do not like the direction in which the management change saga is leading, as Mr. Slawomir Skrzypek, the acting CEO, seems on his way to the NBP, and PKO BP is left with no CEO, a leaving Head of Retail, and generally a lot of uncertainty. Lack of strong appointments to the Management Board remains a risk factor.
4Q Results preview. For 4Q 2006, we are looking for PLN 602m net profit, huge improvement YoY against a weak base, but flattish QoQ. We look for a 19% rise in interest income, continued strong growth in fees (42%), and overall 32% YoY and 9% QoQ increase in total banking revenues. We factor in a seasonally increased cost base and normal provisioning for this part of the cycle.
Valuation summary. The stock trades at P/E of 19.3x for 2007, and P/BV of 4.1x. We believe that some upside to our earnings forecasts is likely in the course of the year, but we prefer to stand on conservative footing in terms of mutual funds. There is little support, we believe, from the yield. Risks are difficult to quantify into numbers, but continued management uncertainty may lead to a slower pace of cost restructuring, plus the band may start to lose market share in the growing market, which so far has not been the case. BUY maintained.
PKO BP Banks Poland
PLN 46.01 Buy
Target price: PLN 53
WIG index 49,560 # of shares 1bn MCAP PLN 46.0bn US$ 15.4bn Free float PLN 22.3bn US$ 7.5bn PKOW.WA / PKO PW
25
30
35
40
45
50
Jan-06 Apr-06 Jul-06 Oct-06 Jan-07PKO BP
90
110
130
150
170
Jan-06 Apr-06 Jul-06 Oct-06 Jan-07
PKO BP WIG
(Rebased to 100)
Analyst Marcin Jablczynski Tel. +48 22 520 9962 [email protected] http://research.ca-ib.com
Our top pick in the sector
11 January 2007
Company Update

PKO BP January 2007
42
Table 38: PKO BP: Profit & loss account
PLNm (unless otherwise stated) 2005 2006E 2007E 2008E 2009ENet interest income 3,544 3,823 4,411 5,034 5,566 Net interest margin (%) 4.4 4.4 4.8 5.1 5.1 Spread (%) 4.2 4.4 4.6 4.9 4.9 NII growth (%) (2.3) 7.9 15.4 14.1 10.6 Net commission income 1,218 1,731 1,952 2,255 2,472 Income from securities 16 5 5 6 6 Financial income & capital gains 309 0 0 0 0 Forex gains 612 550 605 666 732 Other non-interest income 0 0 0 0 0 Revenue from banking operations 5,699 6,109 6,973 7,961 8,776 Change (%) 1.9 7.2 14.1 14.2 10.2 Other operating income/cost 767 660 605 552 500 Personnel cost (2,053) (2,074) (2,159) (2,197) (2,269)Depreciation (467) (350) (448) (538) (548)Other administrative cost (1,642) (1,571) (1,664) (1,789) (1,922)Operating costs (4,161) (3,995) (4,271) (4,524) (4,739) Change (%) 11.1 (4.0) 6.9 5.9 4.8 Cost/income (%) 64.9 60.3 57.7 54.4 52.4 Pre-provision profit 2,305 2,773 3,307 3,988 4,536 Net provisions (161) (78) (339) (565) (663)Consolidation gain + extraordinary items
24 25 26 27 29
Pre-tax profit 2,167 2,720 2,994 3,451 3,902 Income tax (411) (512) (564) (650) (736)Profit/loss from subsidiaries (21) (40) (48) (58) (69)Net income 1,735 2,168 2,382 2,743 3,097 Change (%) 14.6 25.0 9.9 15.1 12.9 Accounting standard IFRS IFRS IFRS IFRS IFRS
Source: PKO BP, CA IB estimates
Table 39: PKO BP: 4Q 2006 Results preview
4Q 2006E 3Q 2006QoQ (%) 4Q 2005 YoY (%)Interest income 1,031 964 7 864 19 Fees and commissions 457 445 3 322 42 Revenue from banking 1,673 1,540 9 1,270 32 Other operating result 172 152 14 332 (48)Operating costs (1,094) (932) 17 (1,153) (5)Net provisions (53) 16 n.m. (20) 163 Pre-tax profit 722 778 (7) 434 66 Net profit 602 614 (2) 361 67
Source: PKO BP, CA IB estimates
Table 40: PKO BP: Balance sheet
PLNm (unless otherwise stated) 2005 2006E 2007E 2008E 2009ECash + CB accounts 3,895 2,862 3,022 3,269 3,595 Receivables from FI 12,663 8,232 2,274 71 126 Loans to customers 46,875 57,304 70,152 81,877 92,726 Debt securities 22,792 24,000 23,000 22,000 22,000 Shares 184 184 184 184 184 Fixed assets 2,644 2,511 2,386 2,267 2,153 Intangible assets 532 1,189 1,130 1,073 1,019 Accrued interest & other assets 2,028 2,058 2,058 2,058 2,058 goodwill 156 156 156 156 156 Total assets 91,613 98,341 104,207 112,799 123,863 Liabilities to FI 2,084 1,000 1,000 1,000 1,000 Liabilities to customers 76,748 81,778 86,346 93,386 102,725 Debt securities 68 120 120 120 120 Accrued interest & other liabilities 3,938 5,300 5,300 5,300 5,300 of which subordinated debt 0 0 0 0 0 Total liabilities 82,838 88,198 92,766 99,806 109,145 Share capital 1,000 1,000 1,000 1,000 1,000 Reserve capital 7,775 9,143 10,441 11,993 13,718 Shareholders equity 8,775 10,143 11,441 12,993 14,718 Total liabilities & equity 91,613 98,341 104,207 112,799 123,863 Accounting standard IFRS IFRS IFRS IFRS IFRS
Source: PKO BP, CA IB estimates
Table 41: PKO BP: Key ratios
2005 2006E 2007E 2008E 2009ENet loans (PLNm) 46,875 57,304 70,152 81,877 92,726 Gross YE (PLNm) 49,819 59,976 72,813 84,703 95,715 NPLs (PLNm) 3,360 3,026 3,213 3,783 4,409 Provisions (PLNm) 2,945 2,673 2,661 2,826 2,989 NPL ratio (%) 6.7 5.0 4.4 4.5 4.6 Coverage ratio (%) 87.6 88.3 82.8 74.7 67.8 Dividend per share (PLN) 0.80 1.08 1.19 1.37 1.55 Payout ratio (%) 46.1 50.0 50.0 50.0 50.0 BIS ratio (%, YE) 13.90 13.19 13.15 13.20 13.41 Tier1 ratio (%, YE) 13.90 13.19 13.15 13.20 13.41
Source: PKO BP, CA IB estimates

Please note that the information at the back forms an integral part of this report.
2005 2006E 2007E 2008E 2009E
Net profit (PLNm) 516 806 889 1,015 1,147
Stated EPS 7.1 11.0 12.2 13.9 15.7
NAVPS 46.3 51.4 55.3 60.1 65.4
NIM (%) 3.6 3.6 3.8 3.8 3.8
C/I ratio (%) 61.4 51.9 49.9 48.3 47.1
Provisioning (%) 0.44 0.40 0.60 0.60 0.60
Adj. ROE (%) 16.1 22.6 22.8 24.1 25.1
Adj. P/E (x) 31.8 20.4 18.5 16.2 14.3
Adj. P/BV (x) 4.9 4.4 4.1 3.7 3.4
Dividend yield (%) 2.7 3.7 4.1 4.6 5.2
Shareholder structure: AIB 70.5%
BZ WBK has underperformed recently, which we think was caused by a slight disappointment in 3Q numbers. Recently, we saw continued strong performance of the mutual fund business and other subsidiaries. We also like the improved risk/reward profile of the stock. Awaiting news on the new CEO, we expect strong earnings in 4Q. The stock trades at P/E of 18.5x, falling to 16.2x next year. Upgrade to BUY.
Recent developments. BZ WBK is a relatively quiet stock in terms of newsflow, which is obviously good for a bank. 3Q figures were weak, but we believe that mutual fund fees will gradually stabilise, with a higher share of management fees at the expense of upfront. If the word on the street about the new CEO proves true (reportedly Mr. Justyn Konieczny, Head of Investment Banking), we would be pleased.
4Q Results preview. For 4Q 2006, we are looking for PLN 212m net profit, a huge improvement YoY against a weak base, and up 25% QoQ. We look for an 11% rise in interest income, continued strong growth in fees (48%), and overall 29% YoY and 14% QoQ increase in total banking revenues. We factor in a seasonally increased cost base and normal provisioning for this part of the cycle, but we may be too cautious on risk charges.
Valuation summary. The stock trades at P/E of 18.5x for 2007, P/BV of 4.1x. With the rise of its mutual fund business, BZ WBK substantially lifted its ROE to 23%, which is (given the bank’s cost and capital discipline) good news for investors seeking both a nice yield and still growth in the underlying business. Following the recent stock underperformance, we now upgrade BZ WBK back from Hold to BUY with an upside of 12%.
BZ WBK Banks Poland
PLN 225.0 Buy (Upgrade from Hold)
Target price: PLN 251 (Previously: PLN 210)
WIG index 49,560 # of shares 73m MCAP PLN 16.4bn US$ 5.5bn Free float PLN 4.8bn US$ 1.6bn BZWB.WA / BZW PW
130
150
170
190
210
230
250
Jan-06 Apr-06 Jul-06 Oct-06 Jan-07BZ WBK
90
110
130
150
170
Jan-06 Apr-06 Jul-06 Oct-06 Jan-07
BZ WBK WIG
(Rebased to 100)
Analyst Marcin Jablczynski Tel. +48 22 520 9962 [email protected] http://research.ca-ib.com
Good value for the money
11 January 2007
Company Update

BZ WBK January 2007
44
Table 42: BZ WBK: Profit & loss account
PLNm (unless otherwise stated) 2005 2006E 2007E 2008E 2009ENet interest income 909 1,022 1,186 1,360 1,537 Net interest margin (%) 3.6 3.6 3.8 3.8 3.8 Spread (%) 3.4 3.4 3.5 3.6 3.6 NII growth (%) 4.5 12.4 16.0 14.7 13.0 Net commission income 697 1,026 1,142 1,221 1,326 Income from securities 48 55 59 63 67 Financial income & capital gains 24 75 35 35 35 Forex gains 218 210 221 232 243 other non-interest income 0 0 0 0 0 Revenue from banking operations
1,896 2,388 2,642 2,910 3,208
Change (%) 3.6 25.9 10.6 10.2 10.2 Other operating income/cost 20 15 15 15 15 Personnel cost (574) (665) (704) (738) (783)Depreciation (186) (168) (176) (185) (194)Other administrative cost (404) (406) (438) (483) (534)Operating costs (1,165) (1,239) (1,318) (1,406) (1,512) Change (%) 1.7 6.4 6.4 6.7 7.5 Cost/income (%) 61.4 51.9 49.9 48.3 47.1 Pre-provision profit 751 1,164 1,339 1,519 1,712 Net provisions (62) (66) (118) (137) (155)Consolidation gain + extraordinary items
0 0 0 0 0
Pre-tax profit 689 1,098 1,220 1,382 1,557 Income tax (144) (209) (232) (263) (296)Profit/loss from subsidiaries (30) (84) (100) (104) (114)Net income 516 806 889 1,015 1,147 Change (%) 16.2 56.1 10.3 14.3 13.0 Accounting standard IFRS IFRS IFRS IFRS IFRS
Source: BZ WBK, CA IB estimates
Table 43: BZ WBK: 4Q 2006 Results preview
4Q 2006E3Q 2006 QoQ (%)4Q 2005 YoY (%)Interest income 270 259 4 243 11 Fees and commissions 296 240 23 201 48 Revenue from banking 639 562 14 497 29 Other operating result 3 4 (13) 6 (47)Operating costs (328) (304) 8 (312) 5 Net provisions (43) (6) 633 (33) 30 Pre-tax profit 271 256 6 158 72 Net profit 212 170 25 104 105
Source: BZ WBK, CA IB estimates
Table 44: BZ WBK: Balance sheet
PLNm (unless otherwise stated) 2005 2006E 2007E 2008E 2009ECash + CB accounts 572 833 925 1,027 1,129 Receivables from FI 3,608 4,737 4,336 6,533 8,415 Loans to customers 14,212 17,170 20,705 23,378 26,445 Debt securities 8,916 8,000 8,000 8,000 8,000 Shares 73 450 450 450 450 Fixed assets 519 503 488 473 459 Intangible assets 174 139 111 89 71 Accrued interest & other assets 1,529 990 960 930 930 goodwill 0 0 0 0 0 Total assets 29,604 32,822 35,975 40,881 45,899 Liabilities to FI 1,693 1,693 1,693 1,693 1,693 Liabilities to customers 21,839 23,804 26,422 29,329 32,262 Debt securities 840 1,740 2,040 3,740 5,440 Accrued interest & other liabilities
1,851 1,836 1,786 1,736 1,736
of which subordinated debt 0 0 0 0 0 Total liabilities 26,223 29,073 31,941 36,498 41,131 Share capital 730 730 730 730 730 Reserve capital 2,652 3,020 3,304 3,653 4,039 Shareholders equity 3,382 3,750 4,034 4,383 4,769 Total liabilities & equity 29,604 32,822 35,975 40,881 45,899 Accounting standard IFRS IFRS IFRS IFRS IFRS
Source: BZ WBK, CA IB estimates
Table 45: BZ WBK: Key ratios
2005 2006E 2007E 2008E 2009ENet loans (PLNm) 14,212 17,170 20,705 23,378 26,445 Gross YE (PLNm) 14,939 17,888 21,465 24,201 27,347 NPLs (PLNm) 1,030 1,023 1,096 1,196 1,323 Provisions (PLNm) 727 718 761 823 902 NPL ratio (%) 6.9 5.7 5.1 4.9 4.8 Coverage ratio (%) 70.6 70.1 69.4 68.8 68.2 Dividend per share (PLN) 6.00 8.28 9.14 10.44 11.79 Payout ratio (%) 84.8 75.0 75.0 75.0 75.0 BIS ratio (%, YE) 16.05 14.65 13.88 13.42 13.01 Tier1 ratio (%, YE) 16.05 14.65 13.88 13.42 13.01
Source: BZ WBK, CA IB estimates

Please note that the information at the back forms an integral part of this report.
2005 2006E 2007E 2008E 2009E
Net profit (PLNm) 248 405 476 591 763
Stated EPS 8.6 13.9 16.2 20.1 26.0
NAVPS 70.0 83.2 99.4 119.5 145.5
NIM (%) 2.3 2.3 2.5 2.8 2.9
C/I ratio (%) 72.3 63.5 61.0 55.9 52.0
Provisioning (%) 0.54 0.35 0.45 0.65 0.65
Adj. ROE (%) 16.7 22.1 20.9 21.0 21.9
Adj. P/E (x) 36.7 22.6 19.3 15.5 12.0
Adj. P/BV (x) 5.6 4.5 3.6 3.0 2.4
Dividend yield (%) 0.0 0.0 0.0 0.0 0.0
Shareholder structure: Commerzbank 70.2%
As much as we like the current transformation of BRE, we unfortunately downgraded the stock to HOLD too early and missed the recent leg of the rally. At this juncture, we believe the stock is fairly valued, but we would accumulate on any weakness. Both underlying business growth and new projects warrant decent visibility of earnings. We look for strong YoY earnings growth in 4Q. The stock trades at P/E of 19.3x, falling to 15.5x next year. HOLD maintained, with a materially upgraded target price to PLN 350.
Recent developments. All the current and potential newsflow is positive, including a fast pace of growth in underlying businesses (mainly retail and SME), divestment of non-core assets (such as Skarbiec and potentially PTE as well). Moreover, on its ever-rising retail customer base, BRE is launching new projects such as an insurance concept or MVNO, all nicely accretive to EPS in the mid-term. Therefore, we like the mid-term earnings growth.
4Q Results preview. For 4Q 2006, we are looking for PLN 99m net profit, a huge improvement YoY against a weak base, but down QoQ. We look for a 46% rise in interest income, continued strong growth in fees (73%), and overall 18% YoY and 3% QoQ increase in total banking revenues. We factor in a seasonally increased cost base and normal provisioning for this part of the cycle. The drop in earnings QoQ could be attributed to our more conservative forecast of risk charges in 4Q.
Valuation summary. The stock trades at P/E of 19.3x for 2007, and P/BV of 3.6x. We remind our readers that our approach to multiples excludes the impact of one-offs, i.e. we do not account for the Skarbiec disposal, which will be booked in 1Q 2007. This transaction lowers BRE’s headline P/E to 15.3x, making it more attractive to the headline-oriented community. HOLD for now, but definitely overweight in the portfolio context and wait for any dip to Buy.
BRE Banks Poland
PLN 336.0 Hold
Target price: PLN 350 (Previously: PLN 260)
WIG index 49,560 # of shares 29m MCAP PLN 9.9bn US$ 3.3bn Free float PLN 2.9bn US$ 986m BREP.WA / BRE PW
150
180
210
240
270
300
330
360
Jan-06 Apr-06 Jul-06 Oct-06 Jan-07BRE
90
110
130
150
170
190
210
Jan-06 Apr-06 Jul-06 Oct-06 Jan-07
BRE WIG
(Rebased to 100)
Analyst Marcin Jablczynski Tel. +48 22 520 9962 [email protected] http://research.ca-ib.com
We missed the last leg of the rally; still HOLD
11 January 2007
Company Update

BRE January 2007
46
Table 46: BRE: Profit & loss account
PLNm (unless otherwise stated) 2005 2006E 2007E 2008E 2009ENet interest income 622 738 921 1,119 1,333 Net interest margin (%) 2.3 2.3 2.5 2.8 2.9 Spread (%) 2.7 2.5 2.7 2.9 2.9 NII growth (%) 13.8 18.6 24.9 21.5 19.1 Net commission income 394 502 550 614 683 Income from securities 47 19 21 23 25 Financial income & capital gains 50 55 58 61 64 Forex gains 258 330 363 399 439 Other non-interest income 0 0 0 0 0Revenue from banking operations
1,371 1,644 1,914 2,217 2,545
Change (%) 28.2 19.9 16.4 15.9 14.8 Other operating income/cost (13) 0 0 29 66 Personnel cost (424) (471) (544) (588) (622)Depreciation (140) (175) (201) (231) (265)Other administrative cost (377) (399) (422) (437) (469)Operating costs (940) (1,044) (1,167) (1,255) (1,356) Change (%) 5.7 11.1 11.7 7.6 8.1 Cost/income (%) 72.3 63.5 61.0 55.9 52.0 Pre-provision profit 417 599 747 991 1,254 Net provisions (79) (72) (123) (215) (252)Consolidation gain + extraordinary items
(0) 0 0 0 0
Pre-tax profit 338 528 623 776 1,003 Income tax (70) (100) (118) (147) (191)Profit/(loss) from subsidiaries (20) (22) (29) (38) (49)Net income 248 405 476 591 763 Change (%) (188.9) 63.7 17.4 24.2 29.2 Accounting standard IFRS IFRS IFRS IFRS IFRS
Source: BRE, CA IB estimates
Table 47: BRE: 4Q 2006 Results preview
4Q 2006E 3Q 2006QoQ (%) 4Q 2005 YoY (%)Interest income 210 195 8 144 46 Fees and commissions 142 130 9 82 73 Revenue from banking 442 428 3 374 18 Other operating result 9 5 68 (8) n.m.Operating costs (296) (272) 9 (274) 8 Net provisions (31) (7) 323 (28) 13 Pre-tax profit 124 154 (19) 64 93 Net profit 99 126 (21) 47 110
Source: BRE, CA IB estimates
Table 48: BRE: Balance sheet
PLNm (unless otherwise stated) 2005 2006E 2007E 2008E 2009ECash + CB accounts 1,816 838 961 1,101 1,211 Receivables from FI 4,668 5,924 3,113 5,208 5,293 Loans to customers 15,464 23,692 29,395 34,769 40,343 Debt securities 7,653 5,400 5,500 3,400 3,400 Shares 6 6 5 5 4 Fixed assets 559 570 581 593 605 Intangible assets 103 109 115 121 127 Accrued interest & other assets 2,549 3,388 3,450 3,517 3,640 goodwill 304 304 304 304 304 Total assets 32,817 39,926 43,120 48,714 54,622 Liabilities to FI 4,337 4,300 3,500 4,500 6,500 Liabilities to customers 20,443 23,935 27,453 31,456 34,602 Debt securities 3,906 7,000 7,000 7,000 7,000 Accrued interest & other liabilities 2,095 2,249 2,249 2,249 2,249 of which subordinated debt 1,363 1,363 1,363 1,363 1,363 Total liabilities 30,782 37,484 40,202 45,205 50,351 Share capital 116 117 117 117 117 Reserve capital 1,919 2,324 2,800 3,391 4,154 Shareholders equity 2,035 2,442 2,918 3,508 4,272 Total liabilities & equity 32,817 39,926 43,120 48,714 54,622 Accounting standard IFRS IFRS IFRS IFRS IFRS
Source: BRE, CA IB estimates
Table 49: BRE: Key ratios
2005 2006E 2007E 2008E 2009ENet loans (PLNm) 15,464 23,692 29,395 34,769 40,343 Gross YE (PLNm) 16,327 24,552 30,304 35,817 41,568 NPLs (PLNm) 1,388 1,390 1,470 1,688 1,960 Provisions (PLNm) 864 860 909 1,048 1,225 NPL ratio (%) 8.5 5.7 4.9 4.7 4.7 Coverage ratio (%) 62.2 61.9 61.8 62.1 62.5 Dividend per share (PLN) 0.00 0.00 0.00 0.00 0.00 Payout ratio (%) 0.0 0.0 0.0 0.0 0.0 BIS ratio (%, YE) 11.1 9.6 9.4 9.4 9.6 Tier1 ratio (%, YE) 6.8 5.7 6.1 6.6 7.1
Source: BRE, CA IB estimates

Please note that the information at the back forms an integral part of this report.
2005 2006E 2007E 2008E 2009E
Net profit (PLNm) 567 266 384 527 612
Stated EPS 0.67 0.31 0.45 0.62 0.72
NAVPS 2.82 2.59 2.88 3.28 3.69
NIM (%) 3.3 3.1 3.2 3.2 3.2
C/I ratio (%) 52.9 70.7 63.1 56.2 54.9
Provisioning (%) 0.40 0.40 0.55 0.60 0.60
Adj. ROE (%) 9.5 11.6 16.5 20.1 20.7
Adj. P/E (x) 33.4 26.2 18.1 13.2 11.4
Adj. P/BV (x) 2.9 3.2 2.8 2.5 2.2
Dividend yield (%) 6.6 1.9 2.8 3.8 4.4
Shareholder structure: BCP 65.5%
We return to Millennium, upgrading the stock back to BUY, as we believe that the growth prospects of the bank still have not been fully reflected. Amid an aggressive strategy of capturing new retail business, Millennium is fast outrunning its economies-of-scale problem. We look for strong YoY earnings in 4Q, if adjusted for branch expansion costs. The stock trades at P/E of 18.1x, falling to only 13.2x next year, according to our upgraded forecasts.
Recent developments. Having implemented a category-killer approach to the mortgage business, MIL is doing the same for credit cards, capturing new client relationships. Its bundle-offer of mutual funds is selling well, with new branch openings targeting prime locations. Moreover, overhang concerns are out, as BCP increased its stake to 65.5% in a tender, and we should not expect supply concerns. To sum up, we regret we took an overdose of conservatism earlier, prematurely downgrading the stock, as it seems that everything looks rosier than ever.
4Q Results preview. For 4Q 2006, we are looking for PLN 54m net profit, down both YoY and QoQ, but due to factoring in most of the expansion costs. We look for a 65% rise in interest income, continued strong growth in fees (45%), and overall 40% YoY and 9% QoQ increase in total banking revenues (adjusted for the PZU transaction impact last year). We factor in a seasonally increased cost base and normal provisioning for this part of the cycle. On any weakness caused by the poor appearance of headline profits, we are buyers.
Valuation summary. The stock trades at P/E of 18.1x for 2007, and P/BV of 2.8x. While this bank is definitely a higher beta exposure to the sector in Poland due to its smaller size, we believe that P/E falling to 13.2x and 11.4x for 2008 and 2009 cannot be neglected. Risks to our scenario? Having forecasts above the management guidance (some lag is however normal in updating it, we feel), plus more competition for CHF-based mortgage loans from Handlowy, which will come to market as a new entrant.
Bank Millennium Banks Poland
PLN 8.20 Buy (Upgrade from Hold)
Target price: PLN 9.3 (Previously: PLN 6.2)
WIG index 49,560 # of shares 849m MCAP PLN 7.0bn US$ 2.3bn Free float PLN 2.4bn US$ 806m BIGW.WA / MIL PW
5
6
7
8
9
Jan-06 Apr-06 Jul-06 Oct-06 Jan-07Millennium
90
100
110
120
130
140
150
160
Jan-06 Apr-06 Jul-06 Oct-06 Jan-07
Millennium WIG
(Rebased to 100)
Analyst Marcin Jablczynski Tel. +48 22 520 9962 [email protected] http://research.ca-ib.com
Don’t call me small anymore!
11 January 2007
Company Update

Bank Millennium January 2007
48
Table 50: Millennium: Profit & loss account
PLNm (unless otherwise stated) 2005 2006E 2007E 2008E 2009ENet interest income 620 694 841 984 1,109 Net interest margin (%) 3.3 3.1 3.2 3.2 3.2 Spread (%) 3.0 2.9 3.0 3.0 3.0 NII growth (%) 5.4 12.0 21.1 17.1 12.7 Net commission income 265 351 421 499 585 Income from securities 2 2 2 2 2 Financial income & capital gains 485 25 26 28 29 Forex gains 93 150 180 198 218other non-interest income 0 0 0 0 0 Revenue from banking operations
1,465 1,223 1,470 1,711 1,943
Change (%) 0.1 (16.6) 20.3 16.4 13.5 Other operating income/cost 16 16 16 16 16 Personnel cost (326) (356) (389) (425) (464)Depreciation (86) (103) (124) (148) (178)Other administrative cost (344) (399) (403) (372) (406)Operating costs (756) (859) (916) (946) (1,048) Change (%) (28.8) 13.6 6.7 3.2 10.8 Cost/income (%) 52.9 70.7 63.1 56.2 54.9 Pre-provision profit 725 380 570 781 910 Net provisions (15) (51) (96) (130) (155)Consolidation gain + extraordinary items
0 0 0 0 0
Pre-tax profit 710 328 474 651 756 Income tax (143) (62) (90) (124) (144)Profit/loss from subsidiaries 0 0 0 0 0 Net income 567 266 384 527 612 Change (%) 135.8 (53.1) 44.4 37.2 16.1 Accounting standard IFRS IFRS IFRS IFRS IFRS
Source: Millennium, CA IB estimates
Table 51: Millennium: 4Q 2006 Results preview
4Q 2006E 3Q 2006QoQ (%) 4Q 2005 YoY (%)Interest income 209 164 28 126 65 Fees and commissions 100 87 14 68 45 Revenue from banking 340 311 9 653 (48)Other operating result 3 (1) n.m. 14 (81)Operating costs (258) (206) 25 (201) 28 Net provisions (20) (13) 51 5 n.m.Pre-tax profit 65 91 (29) 470 (86)Net profit 54 72 (25) 377 (86)
Source: Millennium, CA IB estimates
Table 52: Millennium: Balance sheet
PLNm (unless otherwise stated) 2005 2006E 2007E 2008E 2009ECash + CB accounts 511 698 806 929 1,060 Receivables from FI 2,603 3,371 5,303 6,703 6,434 Loans to customers 9,903 14,415 19,069 22,924 26,996 Debt securities 8,215 6,000 4,000 3,000 3,000 Shares 2 2 2 2 2 Fixed assets 232 290 363 453 567 Intangible assets 27 26 25 25 24 Accrued interest & other assets
659 706 760 821 887
goodwill 3 0 0 0 0 Total assets 22,151 25,508 30,328 34,856 38,969 Liabilities to FI 1,067 1,300 2,000 2,700 2,700 Liabilities to customers 17,055 19,946 23,025 26,541 30,277 Debt securities 573 700 1,500 1,500 1,500 Accrued interest & other liabilities 1,064 1,364 1,353 1,331 1,360 of which subordinated debt 310 310 325 325 325 Total liabilities 19,760 23,310 27,879 32,072 35,836 Share capital 849 849 849 849 849 Reserve capital 1,542 1,349 1,600 1,935 2,284 Shareholders equity 2,391 2,198 2,449 2,784 3,133 Total liabilities & equity 22,151 25,508 30,328 34,856 38,969 Accounting standard IFRS IFRS IFRS IFRS IFRS
Source: Millennium, CA IB estimates
Table 53: Millennium: Key ratios
2005 2006E 2007E 2008E 2009ENet loans (PLNm) 9,903 14,415 19,069 22,924 26,996 Gross YE (PLNm) 10,568 15,082 19,782 23,717 27,894 NPLs (PLNm) 1,076 1,083 1,157 1,283 1,445 Provisions (PLNm) 665 667 713 793 898 NPL ratio (%) 10.2 7.2 5.8 5.4 5.2 Coverage ratio (%) 61.8 61.6 61.6 61.8 62.2 Dividend per share (PLN) 0.54 0.16 0.23 0.31 0.36 Payout ratio (%) 80.9 50.0 50.0 50.0 50.0 BIS ratio (%, YE) 19.07 14.74 12.33 11.28 10.76 Tier1 ratio (%, YE) 15.90 12.41 10.49 9.73 9.41
Source: Millennium, CA IB estimates

Please note that the information at the back forms an integral part of this report.
2005 2006E 2007E 2008E 2009E
Net profit (PLNm) 616 654 605 720 804
Stated EPS 4.7 5.0 4.6 5.5 6.1
NAVPS 40.3 41.2 42.1 44.2 46.2
NIM (%) 4.0 3.8 3.9 4.6 4.9
C/I ratio (%) 67.8 66.6 67.1 63.3 60.4
Provisioning (%) (0.36) (0.35) 0.35 0.60 0.90
Adj. ROE (%) 13.7 13.6 14.4 16.4 17.3
Adj. P/E (x) 18.7 20.8 19.0 16.0 14.3
Adj. P/BV (x) 2.9 2.8 2.7 2.5 2.4
Dividend yield (%) 4.1 4.3 3.9 4.7 5.2
Shareholder structure: Citigroup 75%
Bank Handlowy has enjoyed a remarkable rally as both the investment community and sell-side analysts turned positive on the stock. We agree that the overhang from bondholders is out, but we see no discount at all, although we would welcome one for a stagnant corporate bank. It delivered two quarters of earnings disappointments. While we expect good 4Q figures, we recommend selling strongly into them, as earnings disappointment is likely to continue next year. We would also want to see something before we believe in traditional retail business turnaround, helped by the introduction of a mortgage offer. With P/E of 19x; P/BV (adjusted for goodwill) of 2.7x, hardly falling onwards; and poor ROE, we downgrade from Hold to SELL.
Recent developments. Good news mixed with bad. On a positive note, the overhang is gone, the bank is about to rebuild its underperforming retail business, plus the market gave it the benefit of the doubt for that. The negatives are more serious: constant disappointments in earnings, pressure in corporate margins, along with volatile trading revenues.
4Q Results preview. For 4Q 2006, we are looking at PLN 169m net profit, a nice improvement YoY against a weak base, but flattish QoQ (pre-tax). We look for a mere 7% rise in interest income, solid fees (22% up), but overall only a 6% YoY and 14% QoQ increase in total banking revenues. We factor in a seasonally increased cost base and almost no provisioning.
Valuation summary. The stock trades at P/E of 19.0x for 2007, and P/BV of 2.7x. Both P/E and P/BV multiples are falling much more slowly than in the sector, so in fact it turns out to be a premium valuation to the sector from 2008 onwards. The only help we see is from a yield of ca. 4%, as the bank continues to be terribly overcapitalised for its stagnant RWA. SELL into the current price or wait for the 4Q release and do it then.
Bank Handlowy Banks Poland
PLN 88.0 Sell (Downgrade from Hold)
Target price: PLN 75 (Previously: PLN 77)
WIG index 49,560 # of shares 131m MCAP PLN 11.5bn US$ 3.9bn Free float PLN 2.9bn US$ 964m BHWA.WA / BHW PW
60
65
70
75
80
85
90
Jan-06 Apr-06 Jul-06 Oct-06 Jan-07Handlowy
90
100
110
120
130
140
Jan-06 Apr-06 Jul-06 Oct-06 Jan-07
Handlowy WIG
(Rebased to 100)
Analyst Marcin Jablczynski Tel. +48 22 520 9962 [email protected] http://research.ca-ib.com
P/E of 19x for a corporate, stagnant bank?
11 January 2007
Company Update

Bank Handlowy January 2007
50
Table 54: Handlowy: Profit & loss account
PLNm (unless otherwise stated) 2005 2006E 2007E 2008E 2009ENet interest income 1,026 1,025 1,150 1,331 1,485 Net interest margin (%) 4.0 3.8 3.9 4.6 4.9 Spread (%) 3.6 3.5 3.5 4.2 4.5 NII growth (%) 13.4 (0.1) 12.2 15.8 11.6 Net commission income 599 617 690 774 874 Income from securities 2 2 2 2 3 Financial income & capital gains 259 110 90 70 50 Forex gains 346 310 326 342 359 Other non-interest income 0 0 0 0 0 Revenue from banking operations
2,232 2,064 2,257 2,520 2,770
Change (%) 13.5 (7.5) 9.4 11.6 10.0 Other operating income/cost 73 196 92 97 102 Personnel cost (686) (576) (605) (636) (667)Depreciation (140) (147) (155) (162) (171)Other administrative cost (717) (760) (795) (831) (869)Operating costs (1,543) (1,484) (1,555) (1,629) (1,706) Change (%) 8.0 (3.9) 4.8 4.8 4.7 Cost/income (%) 67.8 66.6 67.1 63.3 60.4 Pre-provision profit 762 776 795 988 1,166 Net provisions 37 41 (48) (99) (174)Consolidation gain + extraordinary items
(6) 0 0 0 0
Pre-tax profit 793 817 747 888 992 Income tax (177) (163) (142) (169) (188)Profit/loss from subsidiaries 0 0 0 0 0 Net income 616 654 605 720 804 Change (%) 48.1 6.1 (7.5) 19.0 11.7 Accounting standard IFRS IFRS IFRS IFRS IFRS
Source: Handlowy, CA IB estimates
Table 55: Handlowy: 4Q 2006 Results preview
4Q 2006E 3Q 2006QoQ (%) 4Q 2005 YoY (%)Interest income 253 264 (4) 237 7 Fees and commissions 170 145 17 139 22 Revenue from banking 555 485 14 525 6 Other operating result 17 22 (22) 36 (52)Operating costs (369) (366) 1 (402) (8)Net provisions (6) 38 n.m. 3 n.m.Pre-tax profit 192 181 6 165 17 Net profit 169 142 19 123 37
Source: Handlowy, CA IB estimates
Table 56: Handlowy: Balance sheet
PLNm (unless otherwise stated) 2005 2006E 2007E 2008E 2009ECash + CB accounts 923 628 697 774 852 Receivables from FI 6,467 3,868 3,490 3,654 5,283 Loans to customers 9,607 10,639 13,542 16,274 19,050 Debt securities 9,055 15,000 12,000 9,000 7,000 Shares 82 91 100 110 121 Fixed assets 700 760 740 720 700 Intangible assets 65 61 67 63 69 Accrued interest & other assets 6,016 6,493 7,017 7,594 8,229 goodwill 1,249 1,249 1,249 1,249 1,249 Total assets 32,916 37,540 37,653 38,190 41,304 Liabilities to FI 5,224 7,500 5,000 2,500 2,500 Liabilities to customers 17,262 17,951 19,926 22,118 24,330 Debt securities 0 0 0 0 0 Accrued interest & other liabilities 5,166 6,701 7,225 7,803 8,441 of which subordinated debt 0 0 0 0 0 Total liabilities 27,651 32,152 32,151 32,421 35,271 Share capital 523 523 523 523 523 Reserve capital 4,742 4,866 4,980 5,246 5,510 Shareholders equity 5,265 5,388 5,503 5,769 6,033 Total liabilities & equity 32,916 37,540 37,653 38,190 41,304 Accounting standard IFRS IFRS IFRS IFRS IFRS
Source: Handlowy, CA IB estimates
Table 57: Handlowy: Key ratios
2005 2006E 2007E 2008E 2009ENet loans (PLNm) 9,607 10,639 13,542 16,274 19,050 Gross YE (PLNm) 11,361 12,276 15,152 17,909 20,784 NPLs (PLNm) 2,165 1,878 1,725 1,649 1,685 Provisions (PLNm) 1,754 1,637 1,610 1,634 1,733 NPL ratio (%) 19.1 15.3 11.4 9.2 8.1 Coverage ratio (%) 81.0 87.2 93.4 99.1 102.9 Dividend per share (PLN) 3.60 3.75 3.47 4.13 4.61 Payout ratio (%) 76.3 75.0 75.0 75.0 75.0 BIS ratio (%, YE) 14.63 14.72 13.73 12.91 12.06 Tier1 ratio (%, YE) 14.63 14.72 13.73 12.91 12.06
Source: Handlowy, CA IB estimates

Please note that the information at the back forms an integral part of this report.
2005 2006E 2007E 2008E 2009E
Net profit (PLNm) 550 623 552 646 738
Stated EPS 42.3 47.9 42.4 49.7 56.7
NAVPS 272.8 293.2 292.5 310.3 329.8
NIM (%) 2.0 2.3 2.2 2.2 2.2
C/I ratio (%) 67.2 67.8 63.6 60.5 58.2
Provisioning (%) (1.2) (1.4) 0.5 0.6 0.7
Adj. ROE (%) 17.5 18.0 15.4 17.5 18.7
Adj. P/E (x) 18.4 16.2 18.3 15.6 13.7
Adj. P/BV (x) 3.0 2.8 2.8 2.6 2.5
Dividend yield (%) 3.5 5.6 4.1 4.8 5.5
Shareholder structure: ING 75%, Commercial Union OFE BPH CU WBK 6.53%
We fear that the market may lose patience, waiting for a turnaround in the bank’s retail lending business (as we did). Moreover, we see real risk to reported earnings once the NPL write-backs are out, a moment that we think is approaching. In light of sluggish growth in revenues, little cost discipline and this threat from normalising risk charges, we find the stock unattractive. Risks to our negative stance: nice dividend yields and generally defensive aspects of the stock, which the market may reward in the potentially falling equity market, and successful cross selling within the growing base of depositors. We look for weak (flat) YoY earnings in 4Q. The stock trades at P/E of 18.3x, falling to 15.6x next year, on our ambitious forecast given the poor track record in operating surplus. SELL maintained.
Recent developments. A very quiet period in terms of newsflow, but perhaps worth mentioning is the success of the bank in selling mutual funds, utilising the first mover advantage in umbrella funds, which allow for tax postponement. But, similarly to 3Q, the impact for the bank (which does not own the ING mutual fund business and thus benefits only from fee sharing) may be too small to ascertain.
4Q Results preview. For 4Q 2006, we are looking for PLN 134m in net profit, almost no improvement YoY against a weak base, but down QoQ. Upside risk to reported earnings may come as usual from NPL write-backs. We foresee 26% YoY and 13% QoQ increases in total banking revenues, but from a very low base. We believe that operating costs will grow more slowly than revenues, which has not happened recently and is generally a unique phenomenon among Polish banks.
Valuation summary. The stock trades at P/E of 18.3x for 2007, and P/BV of 2.8x. It is not sky-high, but other than for the yield, we think the fact that earnings rise slowly is negative. We are sellers of the stock, especially on any further upturns, unless the story changes.
ING Bank Slaski Banks Poland
PLN 776.0 Sell
Target price: PLN 740 (Previously: PLN 690)
WIG index 49,560 # of shares 13m MCAP PLN 10.1bn US$ 3.4bn Free float PLN 1.9bn US$ 626m SLAS.WA / BSK PW
500
550
600
650
700
750
800
Jan-06 Apr-06 Jul-06 Oct-06 Jan-07ING Bank Slaski
90
100
110
120
130
140
Jan-06 Apr-06 Jul-06 Oct-06 Jan-07
ING Bank Slaski WIG
(Rebased to 100)
Analyst Marcin Jablczynski Tel. +48 22 520 9962 [email protected] http://research.ca-ib.com
Not for the faint-hearted
11 January 2007
Company Update

ING Bank Slaski January 2007
52
Table 58: ING: Profit & loss account
PLNm (unless otherwise stated) 2005 2006E 2007E 2008E 2009ENet interest income 721 929 1,004 1,102 1,167 Net interest margin (%) 2.0 2.3 2.2 2.2 2.2 Spread (%) 1.9 2.1 2.1 2.1 2.0 NII growth (%) (13.5) 28.8 8.2 9.8 5.9 Net commission income 528 623 719 829 956 Income from securities 2 3 0 0 0 Financial income & capital gains 214 80 83 85 80 Forex gains 176 150 158 165 174 Other non-interest income 0 0 0 0 0 Revenue from banking operations
1,641 1,785 1,964 2,181 2,377
Change (%) (2.5) 8.7 10.0 11.1 9.0 Other operating income/cost 26 40 42 44 46 Personnel cost (537) (586) (601) (642) (675)Depreciation (128) (145) (160) (167) (176)Other administrative cost (445) (507) (515) (538) (561)Operating costs (1,109) (1,237) (1,276) (1,347) (1,411) Change (%) 7.4 11.5 3.1 5.6 4.7 Cost/income (%) 67.2 67.8 63.6 60.5 58.2 Pre-provision profit 557 587 730 878 1,012 Net provisions 122 163 (62) (94) (114)Consolidation gain + extraordinary items
27 34 31 33 35
Pre-tax profit 706 785 699 818 933 Income tax (139) (143) (127) (149) (171)Profit/loss from subsidiaries (17) (19) (21) (23) (25)Net income 550 623 552 646 738 Change (%) 50.1 13.4 (11.5) 17.1 14.2 Accounting standard IFRS IFRS IFRS IFRS IFRS
Source: ING, CA IB estimates
Table 59: ING: 4Q 2006 Results preview
4Q 2006E 3Q 2006QoQ (%) 4Q 2005 YoY (%)Interest income 238 243 (2) 109 119 Fees and commissions 162 157 3 141 14 Revenue from banking 489 433 13 389 26 Other operating result 10 3 201 24 (60)Operating costs (335) (304) 10 (293) 14 Net provisions 15 55 (73) 53 (72)Pre-tax profit 185 196 (6) 182 1 Net profit 134 157 (14) 131 2
Source: ING, CA IB estimates
Table 60: ING: Balance sheet
PLNm (unless otherwise stated) 2005 2006E 2007E 2008E 2009ECash + CB accounts 1,176 1,252 1,390 1,543 1,697 Receivables from FI 12,574 17,147 20,651 26,454 31,924 Loans to customers 9,903 11,834 13,734 15,223 17,105 Debt securities 17,078 14,000 13,000 10,000 7,000 Shares 75 56 36 13 (12)Fixed assets 601 571 542 515 489 Intangible assets 95 100 105 110 116 Accrued interest & other assets 625 766 776 786 796 goodwill 224 224 224 224 224 Total assets 42,127 45,727 50,234 54,645 59,116 Liabilities to FI 1,329 1,329 1,900 1,700 1,500 Liabilities to customers 32,824 35,778 39,713 44,082 48,490 Debt securities 3,686 3,686 3,686 3,686 3,686 Accrued interest & other liabilities 740 1,120 1,130 1,140 1,150 of which subordinated debt 0 0 0 0 0 Total liabilities 38,578 41,913 46,429 50,608 54,826 Share capital 130 130 130 130 130 Reserve capital 3,419 3,684 3,675 3,907 4,160 Shareholders equity 3,549 3,814 3,805 4,037 4,290 Total liabilities & equity 42,127 45,727 50,234 54,645 59,116 Accounting standard IFRS IFRS IFRS IFRS IFRS
Source: ING, CA IB estimates
Table 61: ING: Key ratios
2005 2006E 2007E 2008E 2009ENet loans (PLNm) 9,903 11,834 13,734 15,223 17,105 Gross YE (PLNm) 10,716 12,627 14,731 16,457 18,596 NPLs (PLNm) 1,048 921 1,244 1,632 2,060 Provisions (PLNm) 813 793 997 1,234 1,491 NPL ratio (%) 9.8 7.3 8.4 9.9 11.1 Coverage ratio (%) 77.6 86.1 80.1 75.6 72.4 Dividend per share (PLN) 27.50 43.12 31.80 37.25 42.53 Payout ratio (%) 65.1 90.0 75.0 75.0 75.0 BIS ratio (%, YE) 18.60 17.27 15.70 14.79 14.01 Tier1 ratio (%, YE) 18.60 17.27 15.70 14.79 14.01
Source: ING, CA IB estimates

Please note that the information at the back forms an integral part of this report.
2005 2006E 2007E 2008E 2009E
Net profit (PLNm) 416 472 302 372 445
Stated EPS 1.53 1.74 1.11 1.37 1.64
NAVPS 6.2 7.7 7.9 8.8 9.7
NIM (%) 3.9 3.8 3.8 4.0 4.0
C/I ratio (%) 74.2 74.0 70.2 65.0 61.8
Provisioning (%) 0.1 (1.2) 0.5 0.8 0.9
Adj. ROE (%) 14.6 25.5 14.4 16.6 18.0
Adj. P/E (x) 25.9 12.3 19.2 15.6 13.0
Adj. P/BV (x) 3.5 2.8 2.7 2.5 2.2
Dividend yield (%) 1.0 4.1 2.6 3.2 3.8
Shareholder structure: KBC 80%, Sofina 5.5%
Kredyt Bank is paying a high price for being late in the chase for retail customers, which translates into weaker margins. While we generally like the turnaround that is being delivered by the current management, we think the share price has gone up too much. We also reckon that limited liquidity should warrant an additional discount, not a premium. KRB remains one of the most risky bets as its operating leverage is the highest. Our remaining worry is that a reported earnings drop is not fully reflected in the price. We look for stagnant YoY earnings in 4Q. The stock trades at P/E of 19.2x, falling to 15.6x next year.
Recent developments. We pretty much appreciate the fact that KRB not only gradually delivers turnaround in its business by using a nice bancassurance approach to retail. We also like the quality of the bank’s presentations, which is constantly improving. However, it looks to us as though the underlying profitability, cleared of NPL write-backs and sales and other one-offs, is weak, and operating leverage very high.
4Q Results preview. For 4Q 2006, we are looking for PLN 85m net profit, flattish YoY, and flattish QoQ. We look for an 11% drop in interest income, a continued drop in fees (1%), and overall 0% YoY and 17% QoQ increase in total banking revenues. Such an announcement is likely to be negatively received by the market, we think.
Valuation summary. The stock trades at P/E of 19.2x for 2007, P/BV of 2.7x. For a risky story, with by far the highest C/I ratio, we believe that some discount may be needed. While we generally remain constructive on the bank, we are less so at the current stock price. If any correction occurs, we would treat the stock as a welcomed addition to the Polish banking “growth stories” portfolio.
Kredyt Bank Banks Poland
PLN 21.35 Sell (Downgrade from Hold)
Target price: PLN 19.8 (Previously: PLN 17.0)
WIG index 49,560 # of shares 272m MCAP PLN 5.8bn US$ 1.9bn Free float PLN 870m US$ 292m BKRE.WA / KRB PW
13
15
17
19
21
23
25
Jan-06 Apr-06 Jul-06 Oct-06 Jan-07Kredyt Bank
90
110
130
150
170
Jan-06 Apr-06 Jul-06 Oct-06 Jan-07
Kredyt Bank WIG
(Rebased to 100)
Analyst Marcin Jablczynski Tel. +48 22 520 9962 [email protected] http://research.ca-ib.com
Too few highlights for such a rally
11 January 2007
Company Update

Kredyt Bank January 2007
54
Table 62: Kredyt Bank: Profit & loss account
PLNm (unless otherwise stated) 2005 2006E 2007E 2008E 2009ENet interest income 753 770 833 938 1,025 Net interest margin (%) 3.9 3.8 3.8 4.0 4.0 Spread (%) 3.9 3.6 3.6 3.7 3.8 NII growth (%) 18.7 2.2 8.2 12.5 9.3 Net commission income 315 287 357 440 543 Income from securities 1 0 0 0 0 Financial income & capital gains 92 30 32 33 35 Forex gains 48 130 143 157 173 Other non-interest income 0 0 0 0 0 Revenue from banking operations
1,209 1,218 1,365 1,568 1,776
Change (%) (9.0) 0.7 12.1 14.9 13.3 Other operating income/cost 11 12 12 13 14 Personnel cost (411) (426) (455) (485) (526)Depreciation (135) (122) (128) (134) (141)Other administrative cost (345) (347) (366) (385) (414)Operating costs (891) (895) (949) (1,005) (1,081) Change (%) (15.6) 0.5 6.0 5.9 7.6 Cost/income (%) 74.2 74.0 70.2 65.0 61.8 Pre-provision profit 329 335 429 576 709 Net provisions (9) 152 (64) (129) (176)Consolidation gain + extraordinary items
1 5 8 12 16
Pre-tax profit 321 491 372 459 550 Income tax 94 (19) (71) (87) (104)Profit/loss from subsidiaries 1 0 0 0 0 Net income 416 472 302 372 445 Change (%) 124.6 13.5 (36.1) 23.3 19.7 Accounting standard IFRS IFRS IFRS IFRS IFRS
Source: Kredyt Bank, CA IB estimates
Table 63: Kredyt Bank: 4Q 2006 Results preview
4Q 2006E 3Q 2006QoQ (%) 4Q 2005 YoY (%)Interest income 190 187 2 214 (11)Fees and commissions 97 69 39 98 (1)Revenue from banking 344 293 17 344 (0)Other operating result 7 (4) n.m. 2 361 Operating costs (235) (222) 6 (234) 0 Net provisions (20) 35 n.m. (42) (52)Pre-tax profit 100 103 (3) 69 43 Net profit 85 90 (5) 91 (6)
Source: Kredyt Bank, CA IB estimates
Table 64: Kredyt Bank: Balance sheet
PLNm (unless otherwise stated) 2005 2006E 2007E 2008E 2009ECash + CB accounts 607 558 620 688 757 Receivables from FI 2,227 6,198 4,628 3,317 1,862 Loans to customers 9,702 11,657 14,539 18,063 21,786 Debt securities 7,414 3,500 3,300 3,000 2,700 Shares 9 9 9 9 9 Fixed assets 416 396 376 357 339 Intangible assets 111 117 123 129 135 Accrued interest & other assets 355 499 509 519 529 goodwill 36 36 36 36 36 Total assets 20,841 22,934 24,103 26,082 28,117 Liabilities to FI 2,562 2,562 1,900 1,700 1,500 Liabilities to customers 14,534 15,957 17,712 19,660 21,626 Debt securities 771 771 771 771 771 Accrued interest & other liabilities 1,293 1,550 1,560 1,570 1,580 of which subordinated debt 590 430 430 430 430 Total liabilities 19,160 20,840 21,943 23,701 25,477 Share capital 1,358 1,358 1,358 1,358 1,358 Reserve capital 323 736 801 1,022 1,282 Shareholders equity 1,682 2,094 2,160 2,381 2,640 Total liabilities & equity 20,841 22,934 24,103 26,082 28,117 Accounting standard IFRS IFRS IFRS IFRS IFRS
Source: Kredyt Bank, CA IB estimates
Table 65: Kredyt Bank: Key ratios
2005 2006E 2007E 2008E 2009ENet loans (PLNm) 9,702 11,657 14,539 18,063 21,786 Gross YE (PLNm) 12,306 12,977 15,573 18,877 22,425 NPLs (PLNm) 3,558 2,200 1,838 1,607 1,468 Provisions (PLNm) 2,604 1,320 1,034 813 639 NPL ratio (%) 28.9 17.0 11.8 8.5 6.5 Coverage ratio (%) 73.2 60.0 56.3 50.6 43.5 Dividend per share (PLN) 0.22 0.87 0.56 0.68 0.82 Payout ratio (%) 14.4 50.0 50.0 50.0 50.0 BIS ratio (%, YE) 16.42 17.54 17.02 15.47 14.44 Tier1 ratio (%, YE) 10.99 13.57 13.58 12.55 11.91
Source: Kredyt Bank, CA IB estimates

Please note that the information at the back forms an integral part of this report.
2004 2005 2006E 2007E 2008ERevenue (PLNm) 1,001.1 1,202.1 1,138.5 1,157.1 1,201.8Adj. EBITDA (ex-SOP, PLNm) 204.9 252.9 143.5 184.5 192.3EBITDA (PLNm) 204.9 245.8 110.5 151.5 159.3Net profit (PLNm) 67.3 126.7 26.8 57.6 63.8Adj. net profit (PLNm) 67.3 133.8 59.8 90.6 96.8Adj. EPS (PLN) 1.19 2.37 1.09 1.65 1.76CEPS (PLN) 3.38 4.08 2.47 3.07 3.23BVPS (PLN) 19.8 19.9 20.4 21.0 21.6Adj. P/E (x) 32.9 16.4 35.8 23.7 22.1P/CE (x) 11.5 9.6 15.8 12.7 12.1P/BV (x) 2.0 2.0 1.9 1.9 1.8EV/Sales (x) 2.0 1.7 1.7 1.7 1.7EV/Adj. EBITDA (x) 9.7 7.8 13.8 10.7 10.3EV/FCF 15.0 11.4 23.1 17.9 18.1Dividend yield (%) 1.3 1.3 1.3 1.3 1.3
Shareholder structure: Agora Holding 18.6% of equity and 37.9% of votes, Julius Baer IM 7.2% of equity and 5.3% of votes, employees 7.9% of equity and 5.3% of votes
Investment case: Agora’s share price outperformed the WIG index by 8% in 4Q 2006 as, we believe, investors turned their attention to efficiency improvements in 2007 and developments in segments other than press, i.e. outdoor and Internet. While we currently see the stock as fully valued, we are waiting to ascertain the affect of Dziennik’s market entry on Agora’s advertising revenues and to assess the degree of completion (and effectiveness) of the company’s restructuring programme.
Recent developments: The competitive positions of Gazeta Wyborcza and Dziennik appear to be stabilising, with Agora achieving average daily circulation of 430,000 copies vs. 200,000 copies of Dziennik. Importantly, Rzeczpospolita, the third largest quality daily in Poland, began to lose circulation in October (down 8%) and November (down 16% to 151,400 copies), indicating a slightly stronger position for GW and Dziennik in the overall advertising pie. In January, Metro International, Agora’s largest competitor in the free press area, halted the publication of its newspaper, leaving Agora’s complimentary Metro as the unquestionable leader of the free press ad market.
4Q 2006 Preview and outlook: We are expecting Agora to post an 8% decrease in revenues to PLN 303.8m in 4Q 2006 on the back of a 14% decline in press segment revenues (the effect of a cover price cut in April and a high base related to the launch of Nowy Dzien in November 2005). We are forecasting the decline in SOP-adjusted EBITDA to slow down to 7.3% YoY (PLN 41.3m) from a 50% drop recorded in 1-3Q 2006, mainly as a result of the high base effect (last year’s 4Q included marketing spending related to the launch of Nowy Dzien). In reported figures, we are expecting PLN 34.7m in EBITDA and PLN 12.4m in net profit. The key performance factors in 2007 are the potential advertising market share loss to Dziennik (we expect 3 percentage points) and the launch of the Polskapresse nationwide project in 2H 2007.
Valuation: We are increasing our target price by 3% to PLN 37.9, while maintaining our HOLD recommendation. With Agora’s 2007E adjusted EV/EBITDA of 10.7x and 2007E adjusted P/E of 23.7x, we see the stock as fairly valued.
Agora Media Poland
PLN 38.98 Hold
Target price: PLN 37.9 (Previously: PLN 36.8)
WIG index 49,560 # of shares 55.0 MCAP PLN 2.1bn US$ 0.7bn Free float PLN 1.7bn US$ 0.5bn AGO PW / AGOD.WA
25
35
45
55
65
75
Jan-06 May-06 Sep-06 Jan-07
Agora
25
45
65
85
105
125
145
Jan-06 May-06 Sep-06 Jan-07
Agora WIG
(Rebased to 100)
Analysts Marcin Szortyka Tel. +48 22 520 9972 [email protected] Tomasz Bardziłowski, CFA Tel. +48 22 520 9979 [email protected] http://research.ca-ib.com
Catalyst needed
11 January 2007
Company Update

Agora January 2007
56
Table 66: Agora: 4Q 2006 Results preview
PLNm 4Q 2006E 4Q 2005 Ch. YoYRevenues 303.8 329.2 (7.7)EBITDA 34.7 37.4 (7.3)EBITDA (ex-SOP) 41.3 44.5 (7.3) EBIT 15.9 12.3 29.0 Net profit 12.4 8.5 45.9 Net profit (ex-SOP) 19.0 15.6 21.8
Source: Agora, CA IB estimates
We are expecting a 7.7% decrease in revenues to PLN 303.8m on the back of a 14% decrease in press segment revenues (the effect of the cover price cut in April and a high base related to the launch of Nowy Dzien in November 2005) and a 5-10% YoY increase in outdoor, magazines and radio segments.
In 4Q 2006 we are expecting the decline in SOP-adjusted EBITDA to slow down to 7.3% YoY (PLN 41.3m) from the 50% drop recorded in 1-3Q 2006, mainly as a result of the high base effect (last year’s 4Q included marketing spending related to the launch of the publication Nowy Dzien). In reported figures, we are expecting PLN 34.7m in EBITDA and PLN 12.4m in net profit.
Table 67: Agora: Profit & loss account
PLNm 2005 2006E 2007E 2008ENet sales 1,202.1 1,138.5 1,157.1 1,201.8 Operating costs 1,051.3 1,103.9 1,083.9 1,123.5 o/w SOP 7.1 33.0 33.0 33.0 Operating profit 150.8 34.6 73.2 78.3 D&A 96.4 75.9 78.4 81.0 EBITDA 245.8 110.5 151.5 159.3 EBITDA ex-SOP 252.9 143.5 184.5 192.3 Interest and financial items 3.1 4.8 3.6 6.0 Finance income 17.9 11.2 10.3 13.2 Finance costs (14.8) 6.3 6.7 7.1 Result of associates 0.2 0.2 0.2 0.2 Profit before tax 154.1 39.7 77.0 84.6 Income tax 28.5 12.8 19.4 20.8 Minority interest (1.1) 0.0 0.0 Net profit 126.7 26.8 57.6 63.8 Net profit ex-SOP 133.8 59.8 90.6 96.8
Source: Agora, CA IB estimates
Table 68: Agora: Balance sheet
PLNm 2005 2006E 2007E 2008ECurrent assets 502.8 519.5 577.8 641.8 cash and equivalents 189.7 218.5 273.2 328.7 short-term securities 75.5 75.5 75.5 75.5 accounts receivable 209.2 198.1 201.4 209.1 inventories 18.8 17.8 18.1 18.8other 9.6 9.6 9.6 9.6Fixed assets 1,001.2 975.0 948.9 926.1 PPE 680.1 654.0 627.8 605.1 long-term investments 12.0 12.0 12.0 12.0 intangibles, inc. goodwill 273.4 273.4 273.4 273.4 other 35.6 35.6 35.6 35.6Total assets 1,504.0 1,494.6 1,526.7 1,567.9Current liabilities 131.3 124.4 126.4 131.3 short-term borrowings 0.0 0.0 0.0 0.0 accounts payable 131.3 124.4 126.4 131.3Long-term provisions 47.1 47.1 47.1 47.1Long-term liabilities 218.6 218.6 218.6 218.6 long-term borrowings 158.7 158.7 158.7 158.7 deferred income taxes 59.9 59.9 59.9 59.9Minority interest (18.5) (18.5) (18.5) (18.5)Equity 1,125.4 1,123.0 1,153.0 1,189.4Total liabilities and equity 1,504.0 1,494.6 1,526.7 1,567.9
Source: Agora, CA IB estimates
Table 69: Agora: Cash flow statement
PLNm 2005 2006E 2007E 2008ECash flow from operations 207.7 107.8 134.5 141.2Cash flow from investment (111.1) (49.7) (52.2) (58.2)Cash flow from financing (134.3) (29.3) (27.5) (27.5)Net change in cash (37.7) 28.8 54.8 55.5
Source: Agora, CA IB estimates

Please note that the information at the back forms an integral part of this report.
2004 2005 2006E 2007E 2008ERevenue (PLNm) 717.1 860.3 1,121.9 1,470.1 1,673.4Adj. EBITDA (PLNm) 209.7 295.7 443.0 606.0 705.5EBITDA (PLNm) 209.7 295.1 386.0 562.0 685.5EBIT (PLNm) 178.1 255.4 338.6 500.1 607.7Net profit (PLNm) 196.3 209.3 217.2 328.8 425.1Adj. EPS (PLN) 0.12 0.13 0.82 1.07 1.26BVPS (PLN) 0.9 1.2 3.1 4.2 4.8Adj. P/E (x) 40.3 37.3 29.2 22.5 19.1P/BV (x) 26.0 19.4 7.6 5.8 5.0EV/Sales (x) 13.4 11.2 8.6 6.5 5.8Adj. EV/EBITDA (x) 45.9 32.6 21.7 15.9 13.6
Shareholder structure: ITI Holdings 61%
Investment case: We are upgrading TVN to BUY from Hold, maintaining our recently increased target price of PLN 28.4 We now believe the risks to TVN’s business are discounted and we would turn our attention to the three main positive factors: 1) expected strong 4Q 2006 results; 2) robust 2007 outlook with an expected 15-20% increase in TVN’s ad prices; and 3) new entrants on the market posing no significant threat in 2007, in our view.
Recent developments: On 3 January the company revealed audience share figures for December 2006 and FY 2006. TVN Group audience share increased 2.1 percentage points YoY in December to 21.0%, while the TVN channel recorded a 0.8 percentage point YoY increase to 16.7%. In FY 2006, TVN ranked third with an all day audience share of 16.7% (up 1.7 percentage points YoY) for the first time beating Polsat (16.1%). We believe that the audience share gains confirm TVN’s growth story.
4Q 2006 Preview and outlook: The increase in audience share indicates a strong 4Q 2006. Following a 2-3 percentage-point increase in audience share in 4Q 2006, we are expecting TVN to post strong 4Q 2006 figures, forecasting respective revenue, adjusted EBITDA and earnings growth of 31%, 54% and 22%. Next year’s outlook sees TVN having started negotiations with advertisers with a more than 20% increase in ad prices. The station is confident in its pricing power, showing little willingness to reduce the increase, according to Press magazine. In our model, we are expecting a 21% increase in advertising prices and 30.4% growth in total revenues.
Valuation: TVN is trading at 2007E adjusted P/E of 22.5x, a 5% discount to Agora’s respective adjusted P/E. While the EV/EBITDA multiple of 15.9x implies a premium to peers, we believe it is justified given the 24% 2006E-2008E adjusted EBITDA CAGR offered by TVN vs. 12% for peers. We also note that historically TVN has traded within a range of 17.0x-20.0x current year EV/EBITDA.
TVN Media Poland
PLN 24.02 Buy (Upgrade from Hold)
Target price: PLN 28.4
WIG index 49,560 # of shares 362.2 MCAP PLN 8.7bn US$ 3.0bn Free float PLN 3.4bn US$ 1.2bn TVN PW / TVNA.WA
15
20
25
30
Jan-06 May-06 Sep-06 Jan-07
TVN
85
95
105
115
125
135
145
155
165
Jan-06 May-06 Sep-06 Jan-07
TVN WIG
(Rebased to 100)
Analysts Marcin Szortyka Tel. +48 22 520 9972 [email protected] Tomasz Bardziłowski, CFA Tel. +48 22 520 9979 [email protected] http://research.ca-ib.com
Turning to positives. Upgrading to BUY.
11 January 2007
Company Update

TVN January 2007
58
Table 70: TVN: 4Q 2006 Results preview
PLNm 4Q 2006E 4Q 2005 YoY (%)Sales 361.8 275 31.5EBITDA 135.4 98.7 37.1EBITDA (ex-SOP) 151.6 98.7 53.5EBIT 121.2 90.8 33.5Net profit 82.4 67.6 21.9Net profit (ex-SOP) 98.7 67.6 45.9
Source: TVN, CA IB estimates
We are expecting a 31.5% YoY increase in TVN’s revenues in 4Q 2006 to PLN 316.8m. The major revenue drivers are advertising revenues, which we estimate to grow 35.5% YoY in 4Q 2006 to PLN 308m, based on a 24% increase in TV advertising to PLN 282.5m, and the consolidation of Onet from 2H 2006 (PLN 25.8m contribution in 4Q 2006). Meanwhile, we are expecting 12.7% growth in non-advertising revenues to PLN 53.5m.
In 4Q 2006, we are expecting TVN to post EBITDA of PLN 135.4m, up 37% YoY. Excluding the costs of the stock option plan, we are expecting EBITDA to surge 53.5% to PLN 151.6m. On the bottom line we are expecting PLN 82.4m in net profit.
Table 71: TVN: Profit & loss account
PLNm 2005 2006E 2007E 2008ENet sales 860.3 1121.9 1470.1 1673.4 Cost of sales 498.6 613.5 780.7 885.1 Gross profit 361.7 508.4 689.4 788.3 SG&A 103.9 169.7 189.3 180.7 Other operating income, net (2.4) 0.0 0.0 0.0 EBITDA 295.1 386.0 562.0 685.5 Adjusted EBITDA (ex SOP) 295.7 443.0 606.0 705.5 depreciation 39.6 47.3 61.9 77.9 Operating profit 255.4 338.6 500.1 607.7 Net financial income/(costs) 8.2 (57.1) (83.9) (78.1)Profit before tax 263.6 281.5 416.2 529.5 Income tax 54.3 64.3 87.4 104.4 Net profit 209.3 217.2 328.8 425.1 Adjusted net profit 209.9 274.2 372.8 445.1
Source: TVN, CA IB estimates
Table 72: TVN: Balance sheet
2005 2006E 2007E 2008ECurrent assets, of which: 496.7 568.5 766.7 975.1 cash and equivalents 80.8 96.8 221.1 382.4 trade receivables 137.3 179.0 234.6 267.0 programming inventory 151.1 157.0 164.5 172.8 Fixed assets, of which: 944.7 1777.9 1926.6 2014.4 PPE 139.7 199.0 335.6 412.2 intangibles 23.6 27.2 32.9 38.8 goodwill 144.1 1471.1 1471.1 1471.1 programming inventory 55.0 57.2 59.9 62.9 bond receivable 561.6 0.0 0.0 0.0 Total assets 1,441.4 2,346.4 2,693.3 2,989.5 Current liabilities, of which 155.9 275.1 249.1 283.5 bank debt 0.0 85.0 0.0 0.0 trade payables 56.0 73.0 95.7 108.9 other current liabilities 89.7 117.0 153.3 174.5 Long-term liabilities, of which: 888.8 979.5 979.5 979.5 bank debt 843.5 843.5 843.5 843.5 deferred tax liability 45.3 136.0 136.0 136.0 Equity 396.7 1091.9 1464.8 1726.6 Total liabilities and equity 1,441.4 2,346.4 2,693.3 2,989.5
Source: TVN, CA IB estimates
Table 73: TVN: Cash flow statement
Cash flow statement 2005 2006E 2007E 2008ECash flow from operations 93.6 213.4 336.8 466.1 Cash flow from investment (44.5) (760.5) (171.6) (141.4)Cash flow from financing (34.1) 563.0 (40.9) (163.4)
Net change in cash 15.0 16.0 124.3 161.3
Source: TVN, CA IB estimates

Please note that the information at the back forms an integral part of this report.
PLNm 2004 2005 2006E 2007E 2008ERevenues 1,573.3 1,854.8 1,682.3 2,130.4 2,235.9EBITDA 171.5 226.2 209.3 277.2 298.0EBITDA adj. 139.5 167.5 147.6 200.0 217.3EBIT 72.6 151.1 148.1 206.8 220.8Net profit 41.6 80.3 80.0 106.6 117.4EPS (PLN) 3.00 5.79 5.77 7.69 8.46CEPS (PLN) 10.1 11.2 10.2 12.8 14.0P/E (x) 45.6 23.7 23.7 17.8 16.2P/CE (x) 13.5 12.2 13.5 10.7 9.8EV/EBITDA adj. (x) 14.5 12.1 13.7 10.1 9.3Dividend yield (%) 0.0 0.2 1.1 0.7 0.9DPS 0.0 0.25 1.50 1.01 1.26
Shareholder structure: R. Krauze 11.26%, Prokom Investments 10.23%Note: 2004 earnings goodwill adjusted PAS. 2005 and beyond IFRS. EV/EBITDA adjusted for minority interest.
Prokom has the broadest exposure to the dynamically consolidating IT market in Poland, is possibly best positioned to benefit from expected EU-subsidised public projects and is passively participating in CEE expansion through its subsidiary Asseco Poland. A win-win situation? Perhaps long term. In the immediate perspective, the 4Q 2006 results are likely to bring little inspiration as Prokom itself continues to experience weakening sales although its FY 2006 earnings guidance is helped by favourable financial contributions from subsidiaries. We are rolling our target price upwards by 11% to PLN 146 and maintaining our HOLD recommendation.
Recent developments: 4Q 2006E brought no breakthrough contracts or tenders in the public administration projects arena. Prokom announced contracts worth PLN 93m, slightly higher than PLN 57m in 4Q 2005 but still negligible from the quarterly results perspective being mostly of a long-term or of continued maintenance nature. The Prokom Group continued its reorganisation process, concluding the merger of Softbank and Asseco Poland, advancing the merger of Spin and ABG and finalising the acquisition of the controlling stake in Comp. As a result, Prokom Group has become a well diversified and specialised IT group prepared to claim its share of the public administration projects’ pie, estimated at PLN 2bn to PLN 4bn (based on the government’s IT systems priority projects list prepared for 2007-2010).
Forecasts revisions: We have reduced our 2006E top line forecast by 13% to PLN 1,682m to reflect the low contribution of the parent company. We subsequently cut our operating profit by 10% to PLN 148m while leaving our bottom line unchanged (boosted by financial contributions from subsidiaries). We have applied only cosmetic changes to our figures for subsequent years (see over).
4Q 2006 Preview: We are expecting Prokom Group to post a 4Q 2006 net profit of PLN 23.6m, down 35% primarily due to the high base in 4Q 2005 (non-operating financial items and a gain on the sale of a subsidiary group) and the weak contribution of Prokom itself (our estimated net profit of PLN 2m, significantly below PLN 30m in the corresponding period of 2005).
Valuation: Prokom is trading at our estimated 2007E P/E of 18x, one of the lowest multiples in our universe. Opportunity? The finalisation of the reorganisation process and the conclusion of the ambitious acquisition plans of subsidiaries are likely to contribute significantly (pro rata, adjusted for minority stakes). Major risk: further declines in the parent company’s business. We continue our coverage with a HOLD recommendation.
Prokom IT Poland
PLN 137 Hold
Target price: PLN 146 (Previously: PLN 132)
WIG index 49,560 # of shares 13.9m MCAP PLN 1903m US$ 639m Free float PLN 1,257m US$ 422m PKMD.WA / PKM PW
115
125
135
145
155
165
Jan-06 May-06 Sep-06 Jan-07
Prokom
70
80
90
100
110
120
130
140
Jan-06 May-06 Sep-06 Jan-07
Prokom WIG
(Rebased to 100)
Analyst Przemyslaw Sawala-Uryasz Tel. +48 22 520 9960 [email protected] http://research.ca-ib.com
Silent consolidator
11 January 2007
Company Update

Prokom January 2007
60
Table 74: Prokom: Consolidated 4Q preview
PLNm 4Q 2006E
4Q 2005
YoY (%)
2006E 2005 YoY (%)
Revenues 514.3 701.0 (26.6) 1,682.31,854.8 (9.3)EBIT 45.2 58.3 (22.4) 148.1 151.1 (2.0)EBIT adj.* 45.2 58.3 (22.4) 148.1 139.9 5.8Net profit 23.6 36.3 (35.0) 80.0 80.3 (0.3)Net adj.* 23.6 36.3 (35.0) 80.0 77.5 3.3
EBIT margin, adj. (%) 8.8 8.3 8.8 7.5 Net margin, adj. (%) 4.6 5.2 4.8 4.2 Note: 9M 2005 EBIT and net profit adjusted for Source Prokom, CA IB estimates income tax recovered
Table 75: Prokom: Unconsolidated 4Q preview
PLNm 4Q 2006E
4Q 2005
YoY (%)
2006E 2005 YoY (%)
Revenues 150.0 224.3 (33.1) 557.1 773.5 (28.0)EBIT 6.9 26.3 (73.7) 56.8 68.9 (17.5)Net profit 1.8 30.0 (94.1) 47.0 68.3 (31.3)
EBIT margin (%) 4.6 11.7 3.4 3.7 Net margin (%) 1.2 13.4 2.8 3.7
Source: Prokom, CA IB estimates
Table 76: Prokom Group: Forecasts revisions
PLNm 2006E Ch. 2007E Ch. 2008E Ch. New Prior (%) New Prior (%) New Prior (%)Revenues 1,682 1,944 (13.4) 2,130 2,215 (3.8) 2,236 2,300 (2.8)EBIT 148.1 165.3 (10.4) 206.8 208.6 (0.9) 220.8 220.1 0.3Net profit 80.0 80.5 (0.6) 106.6 107.4 (0.7) 117.4 116.4 0.8
EBIT margin (%)
8.8 8.5 9.7 9.4 9.9 9.6
Net margin (%)
4.8 4.1 5.0 4.8 5.2 5.1
Source: Prokom, CA IB estimates
Table 77: Profit & loss
PLNm 2004 2005 2006E 2007E 2008ENet revenue 1,573.3 1,854.8 1,682.3 2,130.4 2,235.9COGS (1,062.9) (1,280.2) (1,145.4) (1,478.1) (1,555.4)SG&A (415.7) (417.8) (389.3) (445.5) (459.6)Other operating (22.1) (5.6) 0.5 0.0 0.0EBITDA 171.5 226.2 209.3 277.2 298.0Depreciation (98.9) (75.0) (61.2) (70.4) (77.2)EBIT 72.6 151.1 148.1 206.8 220.8Net financials (36.9) 4.4 (5.1) (18.1) (16.9)Profit from affiliates (2.5) 3.7 9.4 10.7 11.9Profit on sale of subsidiaries
28.2 (1.5) 5.0 0.0 0.0
Pre-tax profit 61.4 157.7 157.4 199.5 215.8Tax (14.3) (33.3) (15.1) (37.9) (41.0)Minority interest (5.5) (44.1) (62.3) (55.0) (57.4)Net profit 41.6 80.3 80.0 106.6 117.4
Source: Prokom, CA IB estimates
Table 78: Cash flow
PLNm 2004 2005 2006E 2007E 2008ENet profit 41.6 80.3 80.0 106.6 117.4Depreciation 98.9 75.0 61.2 70.4 77.2Cash earnings 140.6 155.3 141.2 177.0 194.6Change in WC 151.0 (4.9) (11.2) (56.1) (13.2)Operations 291.5 150.5 130.0 120.9 181.4Investments (469.2) (70.7) (114.7) (81.3) (158.4)Financing 213.5 (49.1) (28.7) (4.8) (14.8)Dividends 0.0 (3.5) (20.8) (14.1) (17.5)Change in cash 35.8 30.8 (13.4) 34.8 8.2
Source: Prokom, CA IB estimates
Table 79: Balance sheet
PLNm 2004 2005 2006E 2007E 2008EFixed assets 1,379.4 1,400.1 1,443.7 1,480.4 1,567.7Net working capital 209.7 220.2 228.0 293.0 308.3Capital employed 1,589.1 1,620.3 1,671.7 1,773.5 1,876.0Shareholders equity 730.1 813.5 890.3 949.5 1,042.0Minorities 155.0 313.2 313.2 313.2 313.2Debt & lease obligations 704.0 493.6 468.1 510.7 520.7Marketable securities and cash
287.6 305.9 315.8 326.3 377.0
Total assets 2,137.3 2,242.9 2,216.8 2,447.9 2,580.9
Source: Prokom, CA IB estimates
Table 80: Ratios
2004 2005 2006E 2007E 2008EEBITDA margin (%) 10.9 12.2 12.4 13.0 13.3EBIT margin (%) 4.6 8.1 8.8 9.7 9.9Interest cover (x) 1.6 3.1 4.2 6.1 6.5Net debt/equity (%) 57.0 23.1 17.1 19.4 13.8Current ratio (x) 1.8 1.8 2.0 1.9 1.9Sales/receivables (x) 2.4 2.6 2.6 2.6 2.6ROE (%) 5.9 10.4 9.4 11.6 11.8ROCE (%) 5.0 9.4 9.0 12.0 12.1
Source: CA IB estimates

Please note that the information at the back forms an integral part of this report.
PLNm 2004 2005 2006E 2007E* 2008E*Revenues 755.9 858.1 956.5 1,226.6 1,252.0EBITDA 69.5 56.5 61.6 94.2 130.5EBITDA (adj.) 69.5 66.9 61.6 94.2 130.5EBIT 44.1 34.1 33.3 56.0 88.3Net profit 12.7 11.5 9.8 37.1 69.6Net profit (adj.) 22.2 30.5 15.0 37.1 69.6EPS 1.86 1.66 1.31 3.93 6.57EPS (adj. PLN) 3.24 4.42 2.01 3.93 6.57P/E (x) 56.1 62.6 79.5 26.5 15.8P/E (adj. x) 32.1 23.5 51.8 26.5 15.8EV/EBITDA (x) 13.3 16.4 15.0 9.8 7.1EV/EBITDA (adj. x) 10.4 9.6 15.4 12.4 8.8Dividend yield 0.0 0.0 1.0 1.0 1.0DPS 0.00 0.00 1.00 1.00 1.00
Shareholder structure: BBI Capital 12.55%, T. Sielicki 7.51%, Pioneer IM 9.12%, CU OFE 6.27%, ING NN OFE 5.90%* Note: Emax 100% consolidated as of 2H 2007, includes synergies at 50% probability.
We are upgrading ComputerLand to a HOLD and increasing our 12-month target price to PLN 114 following incorporation of the synergies presented by the management of Emax and ComputerLand, albeit at a 50% probability, and lower equity risk premium. With no profit warning in sight, it appears as though ComputerLand is set to deliver on its 2H 2006E net profit forecast of PLN 20m (+/- 10%), which implies an annual net profit of ca. PLN 5m – prior to the contribution from Emax. While we take this as a good omen, it is still too early for us to begin to trumpet about ComputerLand having turned the corner. Management’s expected synergies, which now add PLN 12 per share to our valuation, are key to the upside.
Recent developments: No announcement of major contracts in 4Q 2006 has been made, which may be indicative of a weak opening of and significantly lower backlog for 2007. Management’s phrasing of the company’s long-term goal (maintaining stable sales level through 2008) implies at most flat or lower sales in 2007. In exchange, management is targeting 8% operating profit margins by 2008. This then defines the primary long-term risk: will improved backlog quality, i.e. volume of service contracts and proprietary software sales, indeed compensate for lower (or no) growth?
Forecast revisions: We are reducing our net profit forecasts (2007) by 33% to PLN 27m and (2008) by 35% to PLN 30m following respective 9% and 12% cuts to our sales estimates. Starting in 4Q 2006, we have consolidated the results of Emax with ComputerLand adjusting for minority interest (consolidation of Emax as of 4Q 2006 at 37.65%). We have merged the two companies entirely as of 3Q 2007 and forward, subject to General Shareholders’ approval. To such calculated pro forma results we have applied management’s estimated synergies with a 50% probability. (Our front page table presents our estimated results of ComputerLand and Emax combined, while the following page of this update presents ComputerLand’s standalone figures.)
4Q 2006E Results outlook: We expect ComputerLand to report a net profit of PLN 22m, up more than 100% YoY (on our one-off adjusted figures) including the contribution from Emax. Excluding Emax, we expect ComputerLand to deliver net profit of PLN 16m, in line with its original guidance.
Valuation: Demanding in light of our estimated 2007 P/E of 26.5x, but drops to 16x in 2008E, subject to at least partial delivery of the estimated synergies. Thus, HOLD… and see?
ComputerLand IT Poland
PLN 104.0 Hold (Upgrade from Sell)
Target price: PLN 114 (Previously: PLN 92)
WIG index 49,560 # of shares 8.0m MCAP PLN 838m US$ 281m Free float PLN 491m US$ 165 COMW.WA / CPL PW
85.0
90.0
95.0
100.0
105.0
110.0
115.0
120.0
Jan-06 May-06 Sep-06 Jan-07
ComputerLand
85
95
105
115
125
135
145
Jan-06 May-06 Sep-06 Jan-07
ComputerLand WIG
(Rebased to 100)
Analyst Przemyslaw Sawala-Uryasz Tel. +48 22 520 9960 [email protected] http://research.ca-ib.com
Synergies key for upside. Up to Hold.
11 January 2007
Company Update

ComputerLand January 2007
62
Table 81: ComputerLand and Emax 4Q 2006 Preview
PLNm 4Q 2006E
4Q 2005
YoY % 2006E 2005 YoY %
Revenue 449.9 362.9 24.0 956.5 858.1 11.5EBIT 39.3 9.0 334.5 33.3 34.1 (2.2)EBIT adjusted* 39.3 19.4 102.5 33.3 44.4 (25.0)Net profit 22.2 0.4 n.m. 9.8 11.5 (14.6)Net profit adjusted* 22.2 10.8 106.1 9.8 21.8 (55.2)
EBIT margin adj. (%) 8.7 5.4 3.5 5.2Net margin, adj. (%) 4.9 3.0 1.0 2.5Note: 4Q and FY 2005 adjusted for PLN 10.4m Source: ComputerLand, CA IB estimates provision for ARiMR-imposed fine
Table 82: ComputerLand 4Q 2006 Results preview
PLNm 4Q 2006E
4Q 2005
YoY % 2006E 2005 YoY %
Revenue 286.0 362.9 (21.2) 792.8 858.1 (7.6)EBIT 21.0 9.0 131.6 15.1 34.1 (55.7)EBIT adjusted* 21.0 19.4 7.9 15.1 44.4 (66.0)Net profit 16.3 0.4 n.m. 4.3 11.5 (62.6)Net profit adjusted* 16.3 10.8 50.9 4.3 21.8 (80.4)
EBIT margin adj. (%) 7.3 5.4 1.9 5.2 Net margin, adj. (%) 5.7 3.0 0.5 2.5 Note: 4Q and FY 2005 adjusted for PLN 10.4m Source: ComputerLand, CA IB estimates provision for ARiMR-imposed fine; ComputerLand’s 4Q 2006E standalone results (prior to consolidation of Emax)
Table 83: ComputerLand: Forecasts revisions
PLNm 2006E Ch. 2007E Ch. 2008E Ch. New Prior (%) New Prior (%) New Prior (%)Revenue 792.8 792.6 0.0 713.1 785.9 (9.3) 713.1 814.3 (12.4)EBIT 15.1 9.4 60.6 39.5 45.1 (12.5) 43.6 52.2 (16.5)Net profit 4.3 0.1 n.m. 26.6 40.0 (33.4) 30.1 46.4 (35.2)
EBIT margin (%)
1.9 1.2 5.5 5.7 6.1 6.4
Net margin (%)
0.5 0.0 3.7 5.1 4.2 5.7
Source: CA IB estimates
Table 84: Profit & loss
PLNm 2004 2005 2006E 2007E 2008ENet revenue 755.9 858.1 792.8 713.1 713.1COGS (527.9) (638.9) (607.5) (529.9) (529.3)SG&A (181.6) (175.4) (173.5) (143.0) (140.0)Other operating, net (2.3) (9.8) 3.3 (0.8) (0.2)EBITDA 69.5 56.5 40.7 66.4 73.5Depreciation (25.3) (22.4) (25.6) (26.9) (29.9)EBIT 44.1 34.1 15.1 39.5 43.6Net financials (23.4) (12.5) (7.0) (6.4) (6.3)Pre-tax profit 20.8 21.5 8.1 33.0 37.3Tax (7.9) (9.6) (3.7) (6.3) (7.1)Minorities (0.2) (0.4) (0.1) (0.1) (0.1)Net profit 12.7 11.5 4.3 26.6 30.1
Source: ComputerLand, CA IB estimates
Table 85: Cash flow
PLNm 2004 2005 2006E 2007E 2008ENet profit 12.7 11.5 4.3 26.6 30.1Depreciation 25.3 22.4 25.6 26.9 29.9Cash earnings 38.0 33.9 29.9 53.5 59.9Change in WC (1.0) 77.0 (115.3) 14.2 (0.1)Operations 37.1 110.9 (85.4) 67.7 59.8Investments (41.7) (31.8) (201.4) (33.6) (37.3)Financing 9.9 12.0 119.1 (8.2) (8.2)Dividends 7.5 8.1 8.2Change in cash 5.3 91.1 (167.7) 25.9 14.3
Source: ComputerLand, CA IB estimates
Table 86: Balance sheet
PLNm 2004 2005 2006E 2007E 2008EFixed assets 204.4 302.9 312.3 346.5 368.2Net working capital 99.6 24.6 138.5 122.7 122.8Capital employed 304.0 327.4 450.8 469.2 491.0Shareholders equity 197.3 216.0 335.9 354.3 376.1Minorities 8.0 4.5 4.0 4.0 4.0Debt 98.6 106.9 110.9 110.9 110.9Marketable securities & cash 83.8 172.9 6.5 34.0 48.3Total assets 478.1 634.6 665.0 662.5 684.3
Source: ComputerLand, CA IB estimates
Table 87: Ratios
2004 2005 2006E 2007E 2008EEBITDA margin (%) 9.2 6.6 5.1 9.3 10.3EBIT margin (%) 5.8 4.0 1.9 5.5 6.1Net debt/equity (%) 7.5 (30.6) 31.1 21.7 16.7Current ratio (x) 2.1 1.6 1.7 1.8 1.9Sales/receivables (x) 4.9 3.8 3.2 3.2 3.2ROE (%) 6.7 5.5 1.6 7.7 8.2ROCE (%) 15.1 10.8 3.9 8.6 9.1
Source: CA IB estimates

Please note that the information at the back forms an integral part of this report.
PLNm 2004 2005 2006E 2007E 2008E
Revenues 328.4 444.0 473.4 616.0 708.4
EBITDA 25.9 38.0 58.5 83.2 96.1
EBIT 16.1 26.7 46.0 67.2 79.3
Net profit 10.2 27.3 50.6 55.5 66.8
Net profit (adj.)* 8.8 28.1 45.2 53.9 63.4
EPS (PLN) 1.51 3.95 6.74 6.92 8.33
EPS (adj. PLN) 1.29 4.06 6.02 6.72 7.91
P/E (x) 126.7 48.4 28.3 27.6 22.9
P/E (adj. x) 132.8 42.1 28.4 25.5 21.6
EV/EBITDA (x) 51.8 35.4 24.6 18.0 15.0
Shareholder structure: J. and E. Filipiak 43.08%, TFI BZ WBK AM 23.53 Note: *Net profit and P/E adjusted for Interia.pl's valuation impact (MCAP & net profit), 2005 negative goodwill on MKS Cracovia, 2006E after-tax gain on sale of stake in Interia.pl and NetBrokers, and management's stock option costs
ComArch has traded flat since our downgrade to Hold (27 October 2006). Reported 3Q results and management’s upgrade of FY 2006 forecast appeared to have been priced in before their release. Outstanding 4Q 2006 figures (expected earnings up ca. 60% YoY), preceded by the CEO’s guidance, should strongly support current price levels. Beyond the near term, we see more upside stemming from a bulging backlog, which implies 2007E sales growth from 35% to 40% and improving sales mix coupled with growing references in software implementations abroad. We are upgrading ComArch to a BUY and rolling our price target up 15% to PLN 225.
4Q 2006E Preview: In line with the CEO’s guidance, ComArch should have no problem delivering on its FY 2006 net profit forecast of PLN 50m, translating into ca. PLN 20m in 4Q 2006, up more than 70% YoY on sales of PLN 165m, down 16% YoY. Lower YoY sales are primarily due to a high base, as 4Q 2005 was the period in which the company realised more than PLN 70m in PC delivery contracts for the Ministry of Education (high volumes but low margins). A superior sales mix more than compensated for lower volumes (the company expected services and proprietary software to comprise 67% of sales in 2006 vs. 53% in 2005).
Outlook: ComArch’s beginning of the year backlog is up 35% to 40% YoY, according to the CEO, which implies 2007E sales of PLN 640m to PLN 660m based on the historical backlog level at this point in the year. We view the CEO’s absolute minimum sales growth guidance at 20% YoY as a conservative minimum indeed. The company is negotiating with global corporations (names have not yet been made public) and contract signings are expected already in 1Q 2007.
Forecasts revisions: We are increasing our 2007 and 2008 net profit forecasts by 18% and 11%, respectively, primarily on an improved sales mix and management’s supportive commitment to target the maintenance of the ca. 9% profit margins going forward.
Valuation: Based on our adjusted earnings, ComArch is trading at our adjusted 2007E P/E of 26x, in line with the EU software houses but reflecting no premium for its outstanding growth track record. Following our forecast upgrade, the incorporation of lower equity risks premium as well as 6% shares dilution from the management stock option plan, we are upgrading our target price to PLN 225. With an 18% upside, we are upgrading ComArch to a BUY.
ComArch IT Poland
PLN 191 Buy (Upgrade from Hold)
Target price: PLN 225 (Previously: PLN 196)
WIG index 49,560 # of shares 7.5m MCAP PLN 1,530m US$ 515m Free float PLN 511m US$ 172m COMH.WA / CMR PW
60
80
100
120
140
160
180
200
220
Jan-06 May-06 Sep-06 Jan-07
ComArch
90
130
170
210
250
290
330
Jan-06 May-06 Sep-06 Jan-07
ComArch WIG
(Rebased to 100)
Analyst Przemyslaw Sawala-Uryasz Tel. +48 22 520 9960 [email protected] http://research.ca-ib.com
Keeps going and going… Upgrade to Buy
11 January 2007
Company Update

ComArch January 2007
64
Table 88: 4Q Results preview
PLNm 4Q 2006E
4Q 2005
YoY % 2006E 2005 YoY %
Revenue 164.6 195.0 (15.6) 473.4 444.0 6.6EBIT 17.9 14.3 25.1 46.0 26.7 72.1Net profit 20.7 12.0 72.3 50.6 27.3 85.6 (-) Gain on sale of Interia.pl and NetBrokers 0.0 0.0 n.a. (6.6) 0.0 n.a.Net profit adj. 20.7 12.0 72.3 44.0 27.3 61.3
EBIT margin (%) 10.9 7.3 9.7 6.0 Net margin (%) 12.6 6.2 10.7 6.1Net margin adj. (%) 12.6 6.2 9.3 6.1
Source: ComArch, CA IB estimates
Forecasts upgrade
Based on the company’s year-to-date performance, we have upgraded our sales mix and profitability assumptions. The 2007E backlog now 35-40% higher than this time last year bodes well for our sales estimates. The major risks to our forecasts include:
1) pressure on otherwise growing profit margins due to higher salary costs resulting from a competitive pricing environment and a maturing workforce (recruited students becoming full-time employees on the payroll).
2) foreign exchange risks (an increasing portion – more than 20% in 2006 and up to 40% in 2008E – of ComArch’s business is derived from the EUR and US$ zones).
Table 89: ComArch: Forecast revision
2006E YoY 2007E YoY 2008E YoYPLNm New Prior (%) New Prior (%) New Prior (%)Revenues 473.4 544.6 (13.1) 616.0 642.6 (4.1) 708.4 755.9(6.3)EBIT 46.0 44.6 3.1 67.2 54.8 22.7 79.3 69.4 14.3Net profit 50.6 44.1 14.8 55.5 47.0 18.0 66.8 60.0 11.3
EBIT margin (%) 9.7 8.2 10.9 8.5 11.2 9.2Net margin 10.7 8.1 9.0 7.3 9.4 7.9
Source: ComArch, CA IB estimates
Table 90: Profit & loss
PLNm 2004 2005 2006E 2007E 2008ENet revenue 328.4 444.0 473.4 616.0 708.4COGS (254.2) (354.3) (358.4) (459.4) (526.8)SG&A (56.7) (60.0) (67.7) (88.1) (101.3)Other operating, net (1.3) (2.9) (1.4) (1.2) (1.0)EBITDA 25.9 38.0 58.5 83.2 96.1Depreciation (9.7) (11.3) (12.5) (15.9) (16.7)EBIT 16.1 26.7 46.0 67.2 79.3Financials, net (6.1) (4.2) 7.3 (1.0) 0.3Share of profit in subsidiaries (0.8) 1.3 2.7 2.8 3.4Pre-tax profit 9.2 23.8 56.0 69.0 83.0Tax (0.6) 3.3 (4.9) (13.1) (15.8)Minorities profit 1.6 0.2 (0.4) (0.4) (0.4)Net profit 10.2 27.3 50.6 55.5 66.8
Source: ComArch, CA IB estimates
Table 91: Cash Flow
PLNm 2004 2005 2006E 2007E 2008ENet profit 10.2 27.3 50.6 55.5 66.8Depreciation 9.7 11.3 12.5 15.9 16.7Cash earnings 20.0 38.6 63.1 71.4 83.5Change in WC (8.6) 8.6 (11.1) (10.6) (6.9)Operations 11.4 47.1 52.0 60.8 76.6Investments (29.6) (40.7) (59.3) (57.6) (74.6)Financing 1.8 13.7 (18.0) 3.9 2.5Dividends 0.0 0.0 0.0 0.0 1.0Change in cash (16.4) 20.2 (25.3) 7.1 4.6
Source: ComArch, CA IB estimates
Table 92: Balance sheet
PLNm 2004 2005 2006E 2007E 2008EFixed assets 150.6 199.0 220.3 267.7 329.3Net working capital 35.9 28.5 39.8 51.8 59.6Capital employed 186.5 227.5 260.2 319.6 388.9Shareholders equity 118.4 146.2 197.5 252.9 319.7Minorities 14.0 14.5 14.5 14.5 14.5Debt 54.1 66.8 48.2 52.2 54.7Marketable securities & cash 27.5 44.7 40.1 80.0 137.7Total assets 272.9 346.0 376.8 471.4 563.4
Source: ComArch, CA IB estimates
Table 93: Ratios
2004 2005 2006E 2007E 2008ESales growth 27.9 35.2 6.6 30.1 15.0EBITDA margin (%) 7.9 8.6 12.3 13.5 13.6EBIT margin (%) 4.9 6.0 9.7 10.9 11.2Interest cover (x) 3.2 5.2 11.4 22.3 24.7Net debt/equity (%) 22.5 15.1 4.1 (11.0) (26.0)Current ratio (x) 1.7 1.6 1.7 1.9 2.1Sales/receivables (x) 3.2 3.8 3.8 3.8 3.8ROE (%) 8.6 20.6 29.5 24.6 23.3ROCE (%) 10.7 20.2 24.7 25.3 26.8Net profit margin (%) 3.1 6.1 10.7 9.0 9.4
Source: ComArch, CA IB estimates

Please note that the information at the back forms an integral part of this report.
PLNm 2004 2005 2006E 2007E 2008E
Revenues 327.2 379.2 443.4 495.9 515.7
EBITDA 36.0 37.5 29.2 41.4 44.5
EBIT 23.0 28.7 18.8 30.1 32.3
Net profit 9.2 20.4 8.0 19.6 21.6
EPS (PLN) 2.71 5.96 2.31 5.69 6.27
CEPS (PLN) 6.5 8.5 5.3 9.0 9.8
P/E (x) 44.1 20.0 51.7 21.0 19.0
P/CE (x) 18.3 14.0 22.5 13.3 12.2
EV/EBITDA (x) 12.0 11.6 14.8 10.5 9.7Shareholder structure: ComputerLand 36.8%, AIG OFE 9.26% Note: Emax’s standalone estimates, include no synergies from merger with ComputerLand
We are upgrading Emax to a HOLD to reflect favourable share price parity (1:1.2) in its merger with ComputerLand, which implies Emax’s share price at PLN 136, 13.5% above the company’s current price. Since the merger and the parity still require shareholders’ approval (planned in March 2007), we find it a bit risky to extend a parity-implied valuation to Emax’s shares at this time, especially in light of the upcoming, quite weak in our view quarterly results. We are rolling our target price upwards 9% to PLN 120 per share following the incorporation of lower equity risk premium assumptions.
Developments: While the company’s backlog should continue to expand at a double-digit pace (the value of our estimated aggregate announced contracts increased more than 63% YoY to ca. PLN 100m in 4Q 2006), Emax’s immediate reporting season may be disappointing due to the delays in projects executed for Polish Post. As 4Q has been a significant contributor to profit margins in the past, 4Q 2006 may significantly underperform investors’ expectations. We expect the Polish Post project to return to the backlog list and we would forecast the company’s net profit to recover in 2007. More importantly though, 4Q 2006 will test Emax’s ability to maintain its profit margins at the levels at which they have been in the past once this project concludes.
Forecasts revisions: We are cutting our 2006E net profit estimates in half to PLN 8m and reducing our 2007 and 2008 net profit by 12.5% and 11.4% YoY, respectively, reflecting the growing risks associated with the contribution from Polish Post, the company’s largest project to date.
4Q 2006 Results preview: We expect Emax to post a net profit of PLN 12m, down 47% YoY, on revenues of PLN 164m, down 8% YoY. Downside risks exist to our quarterly forecast despite our significantly reduced figures; the company’s CEO, as quoted by the daily Parkiet, has indicated that the company has had a weak quarter, but it should end the year in the black (for the three quarters of 2006, Emax accumulated a net loss of PLN 4.2m).
Valuation: At our estimated 2007E P/E of 21x, investors appear to give Emax credit resulting from the merger parity (1.2 shares of ComputerLand for 1 share of Emax). Once the merger is operationally digested, both companies should benefit from the synergies, estimated by the management at ca. PLN 25m p.a. starting 2008. Credit for parity? We upgrade to HOLD.
Emax IT Poland
PLN 119.50 Hold (Upgrade from Sell)
Target price: PLN 120.0 (Previously: PLN 110.0)
WIG index 49,560 # of shares 3.5m MCAP PLN 412m US$ 138m Free float PLN 225m US$ 75m EMXX.WA / EMX PW
100
110
120
130
140
Jan-06 May-06 Sep-06 Jan-07
Emax
90
100
110
120
130
140
Jan-06 May-06 Sep-06 Jan-07
Emax WIG
(Rebased to 100)
Analyst Przemyslaw Sawala-Uryasz Tel. +48 22 520 9960 [email protected] http://research.ca-ib.com
Credit for favourable parity. Up to Hold.
11 January 2007
Company Update

Emax January 2007
66
Table 94: 4Q 2006 Results preview
PLNm 4Q 2006E4Q 2005 YoY (%) 2006E 2005 YoY (%)Revenues 164.0 178.6 (8.2) 443.4 379.2 16.9EBIT 18.4 29.6 (38.0) 18.8 28.7 (34.4)Net profit 12.2 22.9 (46.9) 8.0 20.4 (60.9)
EBIT margin (%) 11.2 16.6 4.3 7.6Net margin (%) 7.4 12.8 1.8 5.4
Source: Emax, CA IB estimates
Table 95: Emax: Forecasts revisions
PLNm 2006E Ch. 2007E Ch. 2008E Ch. New Prior (%) New Prior (%) New Prior (%)Revenues 443.4 450.4 (1.6) 495.9 503.2 (1.4) 515.7 529.8 (2.7)EBIT 18.8 31.0 (39.2) 30.1 32.7 (7.9) 32.3 35.0 (7.8)Net profit 8.0 19.2 (58.5) 19.6 22.4 (12.5) 21.6 24.4 (11.4)
EBIT margin (%)
4.3 6.9 6.1 6.5 6.3 6.6
Net margin (%)
1.8 4.3 4.0 4.5 4.2 4.6
Source: CA IB estimates
Table 96: Profit & loss
PLNm 2004 2005 2006E 2007E 2008ENet revenue 327.2 379.2 443.4 495.9 515.7COGS (265.9) (315.8) (389.5) (426.5) (443.2)SG&A (32.7) (35.1) (37.7) (39.3) (40.2)Other operating income/cost (5.5) 0.4 2.7 0.0 0.0EBITDA 36.0 37.5 29.2 41.4 44.5Depreciation (12.9) (8.8) (10.3) (11.3) (12.3)EBIT 23.0 28.7 18.8 30.1 32.3Net financials (7.0) (2.1) (6.4) (2.9) (2.8)Pre-tax profit 16.0 26.7 12.5 27.2 29.5Tax (5.4) (5.0) (2.8) (5.9) (5.6)Minority interest (1.4) (1.3) (1.7) (1.7) (2.3)Net profit 9.2 20.4 8.0 19.6 21.6 Source: Emax, CA IB estimates
Table 97: Cash flow
PLNm 2004 2005 2006E 2007E 2008ENet profit 9.2 20.4 8.0 19.6 21.6Depreciation 12.9 8.8 10.3 11.3 12.3Cash earnings 22.1 29.1 18.3 30.9 33.9Change in WC (16.5) (26.8) (19.7) (8.1) (3.0)Operations 5.6 2.3 (1.4) 22.8 30.8Investments (11.9) (8.7) (14.3) (14.3) (15.2)Financing 11.0 13.3 7.6 7.3 2.7Dividends 0.0 0.0 0.0 0.0 1.0Change in cash 4.8 6.9 (8.1) 15.7 18.3 Source: Emax, CA IB estimates
Table 98: Balance sheet
PLNm 2004 2005 2006E 2007E 2008EFixed assets 68.8 74.6 69.3 87.0 108.0Net working capital 63.4 91.3 112.2 121.4 124.8Capital employed 132.2 165.9 181.5 208.4 232.8Shareholders equity 81.5 105.2 113.1 132.7 154.4Minority capital 4.4 5.6 5.9 5.9 5.9Debt 46.3 55.1 62.4 69.7 72.5Marketable securities & cash 24.4 26.5 17.1 31.8 49.7Total assets 253.8 313.3 353.2 398.0 429.1 Source: Emax, CA IB estimates
Table 99: Ratios
2004 2005 2006E 2007E 2008EEBITDA margin (%) 11.0 9.9 6.6 8.3 8.6EBIT margin (%) 7.0 7.6 4.3 6.1 6.3Interest cover (x) 7.5 10.0 5.6 8.0 8.0Net debt/equity (%) 26.9 27.2 40.1 28.6 14.7Current ratio (x) 1.7 1.7 1.7 1.8 1.8Sales/receivables (x) 2.7 2.4 2.4 2.4 2.4ROE (%) 11.3 19.4 7.0 14.8 14.0ROCE (%) 17.4 17.3 10.4 14.4 13.9
Source: Emax, CA IB estimates

Please note that the information at the back forms an integral part of this report.
2003 2004 2005 2006E 2007E 2008ERevenue (PLNm) 552.8 634.3 998.2 1,138.6 1,527.4 1,764.4EBIT (PLNm) 86.1 157.6 130.3 157.0 217.9 258.9Net profit (PLNm) 61.8 144.1 92.4 97.3 158.8 184.0EPS (PLN) 1.50 3.17 1.86 1.96 3.20 3.71CEPS (PLN) 2.05 3.73 2.92 3.06 5.00 5.80BVPS (PLN) 6.77 11.39 11.64 12.32 13.85 15.94P/E (x) 37.3 17.6 30.0 28.5 17.5 15.1P/CE (x) 27.3 15.0 19.2 18.2 11.2 9.6P/BV (x) 8.3 4.9 4.8 4.5 4.0 3.5EV/Sales (x) 5.2 4.5 2.9 2.5 1.9 1.6EV/EBITDA (x) 26.3 15.7 15.7 13.5 9.6 8.1Dividend yield (%) 2.7 3.1 2.3 3.0 2.9 3.0
Shareholder structure: Pfleiderer AG 64.1%, CU Pension Fund 10.2% *Note: EV/EBITDA adjusted for minorities
Investment case: We reiterate our SELL recommendation on Grajewo, increasing our 12-month target price to PLN 53 from PLN 50. The company just recently downgraded its 2006 net profit forecast from PLN 115m to PLN 97m, primarily placing the blame on its failure to acquire Prospan. Consequently we have downgraded our 2006 net profit estimate by 8% to PLN 97.3m. Grajewo is trading at 2007E P/E of 17.5x, a 15% premium to Kety and an 11% premium to Mondi.
Recent developments: Grajewo is currently taking part in exclusive talks with the State Treasury for the acquisition of a 43% stake in Prospan. Our base case scenario calls for the talks to soon be completed and for Grajewo to buy out Prospan by the end of 1Q 2007, paying a total consideration of PLN 215m. As to the company’s investments plans beyond 2008, Grajewo is likely to reveal those in early March, together with earnings forecasts for 2007.
4Q 2006 Results and outlook: We expect strong earnings figures in 4Q 2006 with a 17% YoY increase in revenues to PLN 330m, a 36% rise in EBIT to PLN 44.6m and a 29% rise in net profit of PLN 27.5m. In FY 2007, we forecast a 62% increase in net profit to PLN 158.8m, driven by 1) the buyout of a 43% stake in Prospan from the State Treasury, 2) increased contribution from the Russian manufacturing plant (launched in mid-2006) and 3) the launch of the MDF production facility in Poland.
Valuation: Based on our updated DCF model (RFR cut to 5.25% from 5.5% and ERP cut to 4.5% from 5.0%), we have increased our target price from PLN 50 to PLN 53. The latter implies a 5% downside on a 12-month horizon and warrants reiteration of our SELL rating.
Pfleiderer Grajewo Engineered Wood Poland
PLN 55.9 Sell
Target price: PLN 53 (Previously: PLN 50)
WIG index 49,560 # of shares 49.6m MCAP PLN 2.8bn US$ 931m Free float PLN 1.0bn US$ 327m GRAJ.WA / GRJ PW
30
35
40
45
50
55
60
Jan-06 May-06 Sep-06 Jan-07
Grajewo
80
100
120
140
160
Jan-06 May-06 Sep-06 Jan-07
Grajewo WIG
(Rebased to 100)
Analyst Tomasz Krukowski, CFA Tel. +48 22 520 9859 [email protected] http://research.ca-ib.com
New investments to be announced in March
11 January 2007
Company Update

Pfleiderer Grajewo January 2007
68
Table 100: Grajewo: 4Q 2006 Results preview
PLNm 4Q 2006E 4Q 2005YoY, % 2006E 2005 YoY, %Sales 330.0 281.6 17 1,138.6 998.2 14 EBIT 44.6 32.8 36 157.0 130.3 21 Net profit 27.5 21.2 29 97.3 92.4 5
Source: Grajewo, CA IB estimates
Table 101: Grajewo: Earnings revision
PLNm 2006E 2007E 2008E New Ch. % New Ch. % New Ch. % Sales 1,138.6 1 1,527.4 0 1,764.4 (1)EBIT 157.0 (6) 217.9 0 258.9 (1)Net profit 97.3 (8) 158.8 (0) 184.0 (1)
Source: Grajewo, CA IB estimates
Table 102: Earnings statement
PLNm 2004 2005 2006E 2007E 2008ENet revenues 634.3 998.2 1,138.6 1,527.4 1,764.4 COGS 477.5 758.1 862.5 1,137.5 1,309.2 Gross profit 156.9 240.1 276.1 389.9 455.2 SG&A 57.4 115.3 121.2 171.9 196.2 Other operating incomes, net 58.1 5.5 2.2 0.0 0.0 EBITDA 183.1 182.5 211.8 307.5 362.6 Depreciation 25.5 52.2 54.7 89.5 103.6 EBIT 157.6 130.3 157.0 217.9 258.9 Net financials (5.8) (13.8) (0.6) 13.2 12.8 Pre-tax profit 163.4 144.1 157.6 204.7 246.2 Tax 19.3 29.1 31.6 38.9 46.8 Minorities/associates 0.0 (22.5) (28.7) (7.1) (15.4)Net profit 144.1 92.4 97.3 158.8 184.0 Source: Grajewo, CA IB estimates
Table 103: Cash flow
PLNm 2004 2005 2006E 2007E 2008ENet profit 144.1 92.4 97.3 158.8 184.0 Depreciation 25.5 52.2 54.7 89.5 103.6 Other non-cash 14.5 (128.4) 23.8 (1.2) (0.3)Cash earnings 184.1 16.2 175.8 247.1 287.3 Change in WC (106.4) (6.3) (56.2) (86.5) (52.7)Capex (116.2) (133.9) (242.2) (197.0) (61.8)Free cash flow (38.5) (124.0) (122.6) (36.5) 172.8 Change in LT investments 16.4 8.4 2.8 7.8 4.8 Dividends (61.8) (84.7) (63.5) (82.9) (80.1)New capital (debt) 182.5 55.0 185.0 171.8 38.1 Change in liquid funds 98.6 (145.3) 1.7 60.2 135.6 Source: Grajewo, CA IB estimates
Table 104: Balance sheet
PLNm 2004 2005 2006E 2007E 2008EFixed assets 452.0 682.9 870.4 977.9 936.0 Working capital 190.9 197.1 253.4 339.9 392.6 Capital employed 642.8 880.1 1,123.8 1,317.8 1,328.7 Shareholders equity 565.0 577.7 611.5 687.3 791.2 Net debt/(cash) (109.8) 93.6 215.1 294.9 159.3 Other liabilities 209.8 234.1 323.2 363.5 407.2 Total assets 852.2 1,015.9 1,275.7 1,569.7 1,740.4 Source: Grajewo, CA IB estimates
Table 105: Key ratios
2004 2005 2006E 2007E 2008EEBITDA margin (%) 28.9 18.3 18.6 20.1 20.6 EBIT margin (%) 24.8 13.0 13.8 14.3 14.7 Net debt (cash)/equity (%) (19.4) 16.2 35.2 42.9 20.1 Current ratio (x) 4.1 1.7 1.9 2.3 2.8 Debtors turnover (x) 5.2 5.6 5.2 5.2 4.9 ROE (%) 34.1 16.2 16.4 24.4 24.9 ROCE (%) 31.2 12.1 9.7 13.0 13.9 Source: Grajewo, CA IB estimates

Please note that the information at the back forms an integral part of this report.
2003 2004 2005 2006E 2007E 2008ERevenue (PLNm) 664.9 781.6 752.4 1,028.5 1,139.6 1,228.6EBIT (PLNm) 77.6 117.7 94.2 114.5 141.1 152.7Net profit (PLNm) 69.9 95.1 88.0 89.0 110.4 119.7EPS (PLN) 7.84 10.31 9.54 9.65 11.97 12.97CEPS (PLN) 11.90 14.06 13.55 14.19 17.82 19.60BVPS (PLN) 40.92 60.88 66.41 71.29 78.43 85.42P/E (x) 23.2 17.7 19.1 18.9 15.2 14.0P/CE (x) 15.3 12.9 13.4 12.8 10.2 9.3P/BV (x) 4.4 3.0 2.7 2.6 2.3 2.1EV/Sales (x) 2.7 2.3 2.4 1.7 1.6 1.4EV/EBITDA (x) 15.6 11.7 13.5 11.4 9.1 8.3Dividend yield (%) 1.6 2.2 2.2 2.6 2.7 3.3
Shareholder structure: NN Pension Fund 10.9%, PZU Pension Fund 9.6%, CU Pension Fund 6.6%, Pioneer 5.9%, Julius Bear IM 5.9%, Raiffeisen 5.7%
Investment case: We are upgrading Kety to BUY from Hold inching our target price upwards to PLN 205 from PLN 200. With expected 5.5% GDP growth in Poland in 2007, we forecast Kety to deliver 24% EPS growth in 2007. The return of strong earnings momentum will already be visible in 4Q 2006 results, where the company preliminarily expects 30% YoY earnings growth.
Recent developments: Kety has just presented its earnings guidance for 2007 with revenues of PLN 1.2bn and net profit of PLN 98m. Although the latter is 11% below our own forecasts, we keep them almost intact at PLN 110.4m. We believe Kety’s management underestimates the potential for growth in the Polish economy in 2007 (Kety forecast only 4% GDP growth) and we expect the company’s guidance to be upgraded over the course of 2007. Additional upside may appear from the likely reduction in custom duty for imports of primary aluminium to the EU from Russia from 6% to 3%, which has been suggested by the European Commission.
4Q 2006 Results and outlook: Kety has reported its preliminary results for 4Q 2006, with a 40% YoY increase in revenues to PLN 285m, a 58% YoY rise in EBIT to PLN 28-30m and a 30% increase in net profit to PLN 19-20m.
Valuation: Based on the updated DCF model (minor revisions in earnings, RFR cut to 5.25% from 5.5% and ERP cut to 4.5% from 5.0%), we have increased our target price on Kety to PLN 205 from PLN 200. With a 13% upside in a 12-month horizon, we upgrade our recommendation to BUY from Hold. The stock is trading at a 2007E P/E ratio of 15.2x, an 8% discount to our Polish mid-cap industrials universe.
Kety Aluminium processing/packaging Poland
PLN 182 Buy (Upgrade from Hold)
Target price: PLN 205 (Previously: PLN 200)
WIG index 49,560 # of shares 9.2m MCAP PLN 1.7bn US$ 563m Free float PLN 1.7bn US$ 563m KETY.WA / KTY PW
110
130
150
170
190
210
Jan-06 May-06 Sep-06 Jan-07
Kety
85
95
105
115
125
135
145
155
Jan-06 May-06 Sep-06 Jan-07
Kety WIG
(Rebased to 100)
Analyst Tomasz Krukowski, CFA Tel. +48 22 520 9859 [email protected] http://research.ca-ib.com
Momentum is on its way back
11 January 2007
Company Update

Kety January 2007
70
Table 106: Kety: Preliminary 4Q 2006 results
PLNm 4Q 2006E 4Q 2005YoY, % 2006E 2005 YoY, %Sales 285.0 202.9 40 1,028.5 752.4 37 EBIT 28-30 18.4 58 114.5 94.2 (69)Net profit 19-20 15.0 30 89.0 88.0 (78)
Source: Kety, CA IB estimates
Earnings revisions We have tuned-up our 2006-2008 earnings estimates for Kety. We have left our 2006 net profit forecast intact at PLN 89m, but we have increased this figure by 1% to PLN 110.4m for 2007 and we have decreased it by 2% to PLN 119.7m for 2008.
Table 107: Kety: Earnings update
PLNm 2006E 2007E 2008E New Old Ch. % New Old Ch. % New Old Ch. %Sales 1,029 1,029 0 1,140 1,112 2 1,229 1,192 3 EBIT 114.5 112.5 2 141.1 138.0 2 152.7 151.3 1 Net profit 89.0 89.0 0 110.4 109.4 1 119.7 121.7 (2)
Source: Kety, CA IB estimates
Table 108: Earnings statement
PLNm 2004 2005 2006E 2007E 2008ENet revenues 781.6 752.4 1,028.5 1,139.6 1,228.6 COGS 663.9 658.3 914.0 998.5 1,075.9 Gross profit 117.7 94.2 114.5 141.1 152.7 SG&A 0.0 0.0 0.0 0.0 0.0 Other operating incomes, net 0.0 0.0 0.0 0.0 0.0 EBITDA 152.4 131.1 156.4 195.1 213.9 Depreciation 34.6 36.9 41.9 54.0 61.2 EBIT 117.7 94.2 114.5 141.1 152.7 Net financials 6.4 (8.9) 9.0 10.4 11.1 Pre-tax profit 111.4 103.0 105.5 130.7 141.6 Tax 15.1 14.3 15.8 19.6 21.2 Minorities/associates (1.2) (0.7) (0.7) (0.7) (0.7)Net profit 95.1 88.0 89.0 110.4 119.7
Source: Kety, CA IB estimates
Table 109: Cash flow
PLNm 2004 2005 2006E 2007E 2008ENet profit 95.1 88.0 89.0 110.4 119.7 Depreciation 34.6 36.9 41.9 54.0 61.2 Other non-cash (1.4) (22.6) 2.4 1.0 0.8 Cash earnings 128.4 102.4 133.3 165.3 181.6 Change in WC (56.5) (30.8) (80.4) (32.3) (25.9)Capex (77.3) (80.1) (139.6) (163.9) (64.6)Free cash flow (5.5) (8.5) (86.7) (30.9) 91.1 Change in LT investments 2.1 7.1 3.6 1.5 1.2 Dividends (36.9) (36.9) (44.0) (44.5) (55.2)New capital (debt) 24.3 33.7 140.7 (29.3) (29.3)Change in liquid funds (16.0) (4.7) 13.6 (103.3) 7.7
Source: Kety, CA IB estimates
Table 110: Balance sheet
PLNm 2004 2005 2006E 2007E 2008EFixed assets 458.9 514.4 612.1 722.0 725.4 Working capital 188.3 219.1 299.5 331.9 357.8 Capital employed 647.2 733.6 911.6 1,053.9 1,083.2 Shareholders equity 561.7 612.7 657.7 723.6 788.0 Net debt/(cash) 53.7 96.9 223.3 296.6 258.8 Other liabilities 32.5 29.8 36.5 39.5 42.2 Total assets 752.8 859.1 1,085.7 1,138.8 1,187.1 Source: Kety, CA IB estimates
Table 111: Key ratios
2004 2005 2006E 2007E 2008EEBITDA margin (%) 19.5 17.4 15.2 17.1 17.4 EBIT margin (%) 15.1 12.5 11.1 12.4 12.4 Net debt (cash)/equity (%) 9.6 15.8 33.9 41.0 32.8 Current ratio (x) 1.9 1.5 1.6 1.3 1.4 Debtors turnover (x) 5.6 4.5 4.7 4.3 4.2 ROE (%) 20.5 15.0 14.0 16.0 15.8 ROCE (%) 17.6 12.7 10.8 11.2 11.2
Source: Kety, CA IB estimates

Please note that the information at the back forms an integral part of this report.
2003 2004 2005 2006E 2007E 2008ERevenue (PLNm) 1,280.4 1,306.8 1,282.5 1,432.5 1,660.1 1,774.2 EBIT (PLNm) 260.3 265.8 197.2 319.5 387.1 423.3 Net profit (PLNm) 147.6 289.8 135.4 255.4 312.5 344.9 EPS (PLN) 2.95 5.80 2.71 5.11 6.25 6.90 CEPS (PLN) 5.67 7.98 4.85 7.07 8.15 8.70 BVPS (PLN) 13.62 20.71 19.59 19.62 20.76 21.41 P/E (x) 33.5 17.1 36.6 19.4 15.8 14.4 P/CE (x) 17.5 12.4 20.4 14.0 12.1 11.4 P/BV (x) 7.3 4.8 5.1 5.0 4.8 4.6 EV/Sales (x) 3.8 3.8 3.8 3.4 3.0 2.8 EV/EBITDA (x) 12.4 13.1 16.1 11.8 10.2 9.6 Dividend yield (%) 5.1 4.0 4.9 5.2 6.3 7.0
Shareholder structure: Framondi 71.3%, NN Pension Fund 5.2%, The Treasury 5.0%
Investment case: Following a 27% increase in price of Kraftliner since a low in October 2005 (in euro-terms), we believe its upside potential to be exhausted. Additionally, appreciation of the zloty against the euro has partially muted the positive effect of the containerboard rally on Mondi’s earnings. Shall we then take profits in Mondi? Not yet, we believe. On a positive note, we expect a 115% increase in earnings to be reported for 4Q 2006, and a 22% rise in net profit in FY 2007. We also find the decent dividend yield (5.2%) supportive of the stock price. We reiterate our HOLD rating, raising our 12-month target price to PLN 103 from PLN 95.
Recent developments: According to FOEX, Kraftliner prices increased by 6% QoQ in 4Q 2006 in euro-terms and by 3% QoQ in zloty-terms. As the capacity closure cycle appears to be completed (approximately 6% of European containerboard capacity was closed in the last 18 months, but no further significant closures have been announced), we believe further increases in containerboard prices to be limited. Nevertheless, assuming flat containerboard prices from now forward, we forecast an 8% increase on average in 2007. On the forex front, with the recent appreciation of the zloty, we have decreased our PLN/EUR rate forecast to 3.85 from 3.99 for 2007 forward. Having applied the above assumptions, we only marginally reduced our earnings forecasts for Mondi for 2007 and 2008.
4Q 2006 Results and outlook: We forecast Mondi to report a 115% YoY increase in net profit to PLN 84.6m in 4Q 2006. We expect strong operating performance to be additionally supported by a capital gain of PLN 23m on the disposal of carbon dioxide emission certificates.
Valuation: Based on our revised DCF model (earnings revisions, RFR cut to 5.25% from 5.5% and ERP cut to 4.5% from 5.0%), we have increased our 12-month target price for Mondi to PLN 103 from PLN 95. We reiterate our HOLD rating on the stock, which trades at 2007E P/E of 15.8x while the next dividend payment offers a 5.2% yield.
Mondi (Frantschach Swiecie) Pulp & Paper Poland
PLN 99.0 Hold
Target price: PLN 103 (Previously: PLN 95)
WIG index 49,560 # of shares 50m MCAP PLN 4.9bn US$ 1.7bn Free float PLN 1.4bn US$ 478m CELA.WA / MPP PW
48
58
68
78
88
98
108
Jan-06 May-06 Sep-06 Jan-07
Mondi
90
110
130
150
170
190
210
Jan-06 May-06 Sep-06 Jan-07
Mondi WIG
(Rebased to 100)
Analyst Tomasz Krukowski, CFA Tel. +48 22 520 9859 [email protected] http://research.ca-ib.com
Upside in containerboards exhausted?
11 January 2007
Company Update
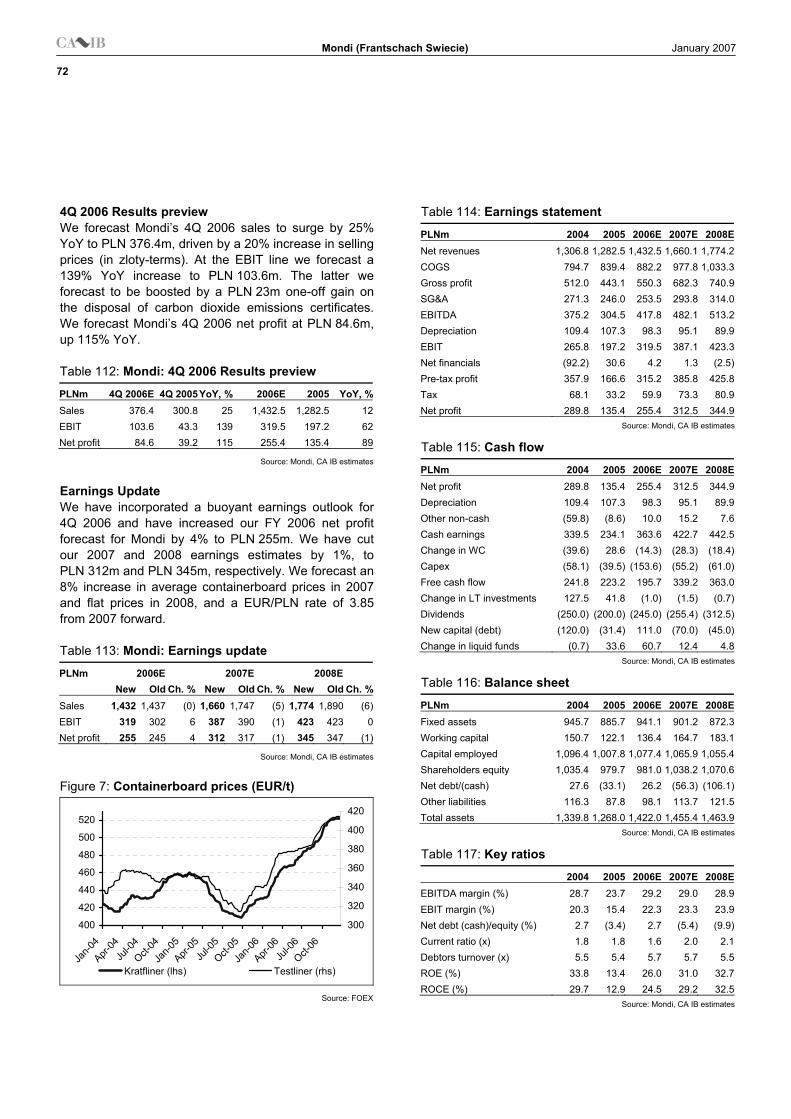
Mondi (Frantschach Swiecie) January 2007
72
4Q 2006 Results preview We forecast Mondi’s 4Q 2006 sales to surge by 25% YoY to PLN 376.4m, driven by a 20% increase in selling prices (in zloty-terms). At the EBIT line we forecast a 139% YoY increase to PLN 103.6m. The latter we forecast to be boosted by a PLN 23m one-off gain on the disposal of carbon dioxide emissions certificates. We forecast Mondi’s 4Q 2006 net profit at PLN 84.6m, up 115% YoY.
Table 112: Mondi: 4Q 2006 Results preview
PLNm 4Q 2006E 4Q 2005YoY, % 2006E 2005 YoY, %Sales 376.4 300.8 25 1,432.5 1,282.5 12EBIT 103.6 43.3 139 319.5 197.2 62Net profit 84.6 39.2 115 255.4 135.4 89
Source: Mondi, CA IB estimates
Earnings Update We have incorporated a buoyant earnings outlook for 4Q 2006 and have increased our FY 2006 net profit forecast for Mondi by 4% to PLN 255m. We have cut our 2007 and 2008 earnings estimates by 1%, to PLN 312m and PLN 345m, respectively. We forecast an 8% increase in average containerboard prices in 2007 and flat prices in 2008, and a EUR/PLN rate of 3.85 from 2007 forward.
Table 113: Mondi: Earnings update
PLNm 2006E 2007E 2008E New Old Ch. % New Old Ch. % New Old Ch. %Sales 1,432 1,437 (0) 1,660 1,747 (5) 1,774 1,890 (6)EBIT 319 302 6 387 390 (1) 423 423 0 Net profit 255 245 4 312 317 (1) 345 347 (1)
Source: Mondi, CA IB estimates
Figure 7: Containerboard prices (EUR/t)
400
420
440
460
480
500
520
Jan-0
4
Apr-04
Jul-0
4
Oct-04
Jan-0
5
Apr-05
Jul-0
5
Oct-05
Jan-0
6
Apr-06
Jul-0
6
Oct-06
300
320
340
360
380
400
420
Kratfliner (lhs) Testliner (rhs)
Source: FOEX
Table 114: Earnings statement
PLNm 2004 2005 2006E 2007E 2008ENet revenues 1,306.8 1,282.5 1,432.5 1,660.1 1,774.2 COGS 794.7 839.4 882.2 977.8 1,033.3 Gross profit 512.0 443.1 550.3 682.3 740.9 SG&A 271.3 246.0 253.5 293.8 314.0 EBITDA 375.2 304.5 417.8 482.1 513.2 Depreciation 109.4 107.3 98.3 95.1 89.9 EBIT 265.8 197.2 319.5 387.1 423.3 Net financials (92.2) 30.6 4.2 1.3 (2.5)Pre-tax profit 357.9 166.6 315.2 385.8 425.8 Tax 68.1 33.2 59.9 73.3 80.9 Net profit 289.8 135.4 255.4 312.5 344.9 Source: Mondi, CA IB estimates
Table 115: Cash flow
PLNm 2004 2005 2006E 2007E 2008ENet profit 289.8 135.4 255.4 312.5 344.9 Depreciation 109.4 107.3 98.3 95.1 89.9 Other non-cash (59.8) (8.6) 10.0 15.2 7.6 Cash earnings 339.5 234.1 363.6 422.7 442.5 Change in WC (39.6) 28.6 (14.3) (28.3) (18.4)Capex (58.1) (39.5) (153.6) (55.2) (61.0)Free cash flow 241.8 223.2 195.7 339.2 363.0 Change in LT investments 127.5 41.8 (1.0) (1.5) (0.7)Dividends (250.0) (200.0) (245.0) (255.4) (312.5)New capital (debt) (120.0) (31.4) 111.0 (70.0) (45.0)Change in liquid funds (0.7) 33.6 60.7 12.4 4.8 Source: Mondi, CA IB estimates
Table 116: Balance sheet
PLNm 2004 2005 2006E 2007E 2008EFixed assets 945.7 885.7 941.1 901.2 872.3 Working capital 150.7 122.1 136.4 164.7 183.1 Capital employed 1,096.4 1,007.8 1,077.4 1,065.9 1,055.4 Shareholders equity 1,035.4 979.7 981.0 1,038.2 1,070.6 Net debt/(cash) 27.6 (33.1) 26.2 (56.3) (106.1)Other liabilities 116.3 87.8 98.1 113.7 121.5 Total assets 1,339.8 1,268.0 1,422.0 1,455.4 1,463.9 Source: Mondi, CA IB estimates
Table 117: Key ratios
2004 2005 2006E 2007E 2008EEBITDA margin (%) 28.7 23.7 29.2 29.0 28.9EBIT margin (%) 20.3 15.4 22.3 23.3 23.9Net debt (cash)/equity (%) 2.7 (3.4) 2.7 (5.4) (9.9)Current ratio (x) 1.8 1.8 1.6 2.0 2.1Debtors turnover (x) 5.5 5.4 5.7 5.7 5.5ROE (%) 33.8 13.4 26.0 31.0 32.7ROCE (%) 29.7 12.9 24.5 29.2 32.5 Source: Mondi, CA IB estimates
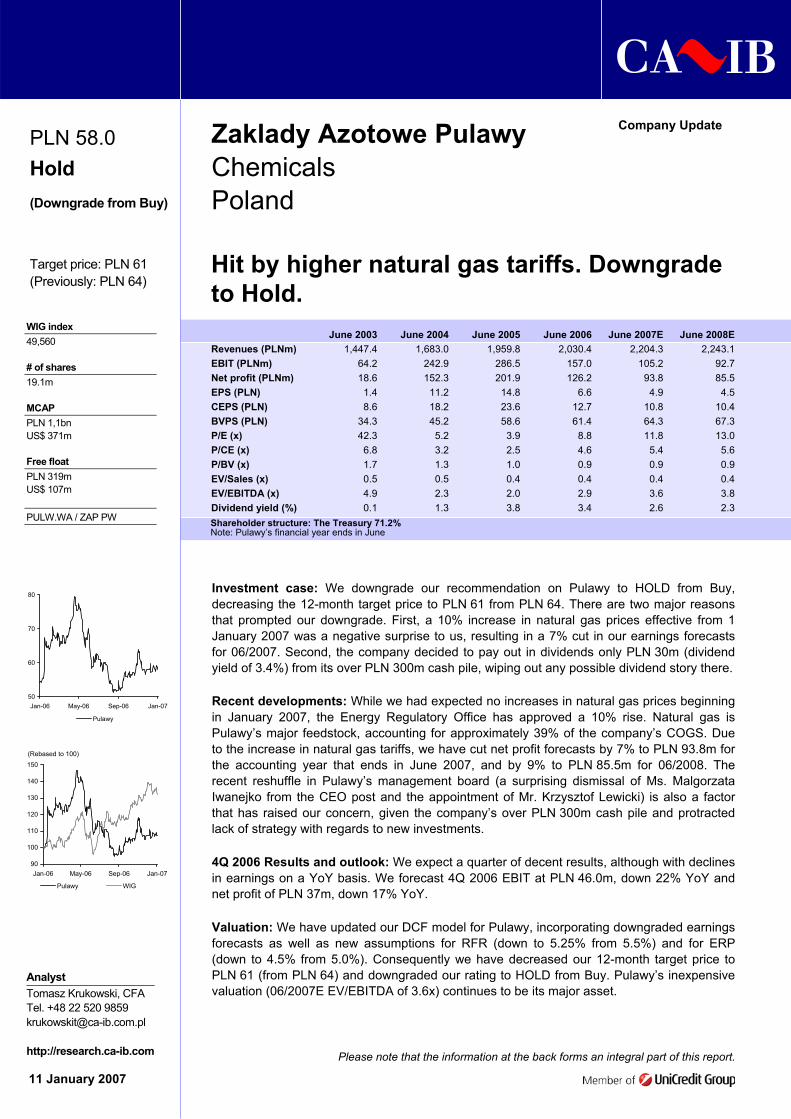
Please note that the information at the back forms an integral part of this report.
June 2003 June 2004 June 2005 June 2006 June 2007E June 2008E
Revenues (PLNm) 1,447.4 1,683.0 1,959.8 2,030.4 2,204.3 2,243.1EBIT (PLNm) 64.2 242.9 286.5 157.0 105.2 92.7Net profit (PLNm) 18.6 152.3 201.9 126.2 93.8 85.5EPS (PLN) 1.4 11.2 14.8 6.6 4.9 4.5CEPS (PLN) 8.6 18.2 23.6 12.7 10.8 10.4BVPS (PLN) 34.3 45.2 58.6 61.4 64.3 67.3P/E (x) 42.3 5.2 3.9 8.8 11.8 13.0P/CE (x) 6.8 3.2 2.5 4.6 5.4 5.6P/BV (x) 1.7 1.3 1.0 0.9 0.9 0.9EV/Sales (x) 0.5 0.5 0.4 0.4 0.4 0.4EV/EBITDA (x) 4.9 2.3 2.0 2.9 3.6 3.8Dividend yield (%) 0.1 1.3 3.8 3.4 2.6 2.3
Shareholder structure: The Treasury 71.2% Note: Pulawy’s financial year ends in June
Investment case: We downgrade our recommendation on Pulawy to HOLD from Buy, decreasing the 12-month target price to PLN 61 from PLN 64. There are two major reasons that prompted our downgrade. First, a 10% increase in natural gas prices effective from 1 January 2007 was a negative surprise to us, resulting in a 7% cut in our earnings forecasts for 06/2007. Second, the company decided to pay out in dividends only PLN 30m (dividend yield of 3.4%) from its over PLN 300m cash pile, wiping out any possible dividend story there.
Recent developments: While we had expected no increases in natural gas prices beginning in January 2007, the Energy Regulatory Office has approved a 10% rise. Natural gas is Pulawy’s major feedstock, accounting for approximately 39% of the company’s COGS. Due to the increase in natural gas tariffs, we have cut net profit forecasts by 7% to PLN 93.8m for the accounting year that ends in June 2007, and by 9% to PLN 85.5m for 06/2008. The recent reshuffle in Pulawy’s management board (a surprising dismissal of Ms. Malgorzata Iwanejko from the CEO post and the appointment of Mr. Krzysztof Lewicki) is also a factor that has raised our concern, given the company’s over PLN 300m cash pile and protracted lack of strategy with regards to new investments.
4Q 2006 Results and outlook: We expect a quarter of decent results, although with declines in earnings on a YoY basis. We forecast 4Q 2006 EBIT at PLN 46.0m, down 22% YoY and net profit of PLN 37m, down 17% YoY.
Valuation: We have updated our DCF model for Pulawy, incorporating downgraded earnings forecasts as well as new assumptions for RFR (down to 5.25% from 5.5%) and for ERP (down to 4.5% from 5.0%). Consequently we have decreased our 12-month target price to PLN 61 (from PLN 64) and downgraded our rating to HOLD from Buy. Pulawy’s inexpensive valuation (06/2007E EV/EBITDA of 3.6x) continues to be its major asset.
Zaklady Azotowe Pulawy Chemicals Poland
PLN 58.0 Hold (Downgrade from Buy)
Target price: PLN 61 (Previously: PLN 64)
WIG index 49,560 # of shares 19.1m MCAP PLN 1,1bn US$ 371m Free float PLN 319m US$ 107m PULW.WA / ZAP PW
50
60
70
80
Jan-06 May-06 Sep-06 Jan-07
Pulawy
90
100
110
120
130
140
150
Jan-06 May-06 Sep-06 Jan-07
Pulawy WIG
(Rebased to 100)
Analyst Tomasz Krukowski, CFA Tel. +48 22 520 9859 [email protected] http://research.ca-ib.com
Hit by higher natural gas tariffs. Downgrade to Hold.
11 January 2007
Company Update

Zaklady Azotowe Pulawy January 2007
74
Table 118: Pulawy: 4Q 2006 Results preview PLNm 4Q 2006E 4Q 2005 YoY, % 3Q-4Q
2006E3Q-4Q
2005YoY, %
Sales 580.0 559.2 4 1040 981 6 EBIT 46.0 59.1 (22) 63 80 (22)Net profit 37.0 44.4 (17) 52 61 (15)
Note: Pulawy’s financial year ends in June Source: Pulawy, CA IB estimates
Table 119: Pulawy: Earnings upgrade PLNm June 2007E June 2008E New Old Ch. % New Old Ch. %Sales 2,204.3 2,177.8 1 2,243.1 2,216.5 1 EBITDA 218.5 227.4 (4) 206.4 216.3 (5)EBIT 105.2 114.1 (8) 92.7 102.6 (10)Net profit 93.8 101.2 (7) 85.5 94.0 (9)Natural gas price growth (%) 18 13 - 3 3 -
Note: Pulawy’s financial year ends in June Source: Pulawy, CA IB estimates
Table 120: Earnings statement
PLNm 06/2004 06/2005 06/2006 06/2007E 06/2008ENet revenues 1,683.0 1,959.8 2,030.4 2,204.3 2,243.1 COGS 1,237.1 1,448.3 1,634.1 1,871.1 1,918.4 Gross profit 446.0 511.5 396.4 333.2 324.7 SG&A 198.7 196.9 227.6 221.4 225.3 Other operating items (4.3) (28.1) (11.8) (6.6) (6.7)EBITDA 338.3 404.9 274.4 218.5 206.4 Depreciation 95.4 118.4 117.4 113.3 113.7 EBIT 242.9 286.5 157.0 105.2 92.7 Net financials 23.3 (10.4) (5.2) (10.7) (12.9)Pre-tax profit 219.6 296.9 162.1 115.9 105.6 Tax 67.3 95.0 36.0 22.0 20.1 Net profit 152.3 201.9 126.2 93.8 85.5 Note: Pulawy’s financial year ends in June Source: Pulawy, CA IB estimates
Table 121: Cash flow
PLNm 06/2004 06/2005 06/2006 06/2007E 06/2008ENet profit 152.3 201.9 126.2 93.8 85.5 Depreciation 95.4 118.4 117.4 113.3 113.7 Other non-cash (3.4) (12.2) 9.8 5.3 1.2 Cash earnings 244.3 308.2 253.4 212.5 200.4 Change in WC (10.1) (135.7) 14.0 (25.3) (7.9)Capex (121.1) (34.2) (86.9) (126.4) (120.0)Free cash flow 113.1 138.2 180.5 60.7 72.5 Ch. in LT investments (29.4) 72.6 (46.3) 4.1 0.9 Dividends (0.5) (10.0) (30.0) (38.2) (28.4)New capital (debt) (83.5) (60.9) 227.0 (75.0) 0.0 Change in liquid funds (0.3) 140.0 331.2 (48.4) 45.0 Note: Pulawy’s financial year ends in June Source: Pulawy, CA IB estimates
Table 122: Balance sheet
PLNm 06/2004 06/2005 06/2006 06/2007E 06/2008EFixed assets 786.7 700.3 671.6 684.7 691.1 Working capital 173.6 309.3 295.3 320.6 328.5 Capital employed 960.3 1,009.6 967.0 1,005.4 1,019.6 Shareholders equity 614.8 796.7 1,173.7 1,229.3 1,286.4 Net debt/(cash) 259.2 68.4 (316.7) (343.2) (388.2)Other liabilities 133.7 193.8 160.3 174.0 177.0 Total assets 1,225.4 1,321.2 1,635.1 1,641.3 1,704.1 Note: Pulawy’s financial year ends in June Source: Pulawy, CA IB estimates
Table 123: Key ratios
06/2004 06/2005 06/2006 06/2007E 06/2008EEBITDA margin (%) 20.1 20.7 13.5 9.9 9.2 EBIT margin (%) 14.4 14.6 7.7 4.8 4.1 Net debt (cash)/equity (%) 42.2 8.6 (27.0) (27.9) (30.2)Current ratio (x) 1.3 2.3 3.9 3.9 4.1 Debtors turnover (x) 5.9 6.8 6.9 7.4 7.1 ROE (%) 28.2 28.6 12.8 7.8 6.8 ROCE (%) 16.2 20.5 12.8 9.5 8.4 Note: Pulawy’s financial year ends in June Source: Pulawy, CA IB estimates

Please note that the information at the back forms an integral part of this report.
2004 2005 2006E 2007E 2008ERevenues (PLNm) 508.8 466.0 488.3 660.3 787.6EBITDA (PLNm) 64.5 32.3 33.5 49.8 60.5EBIT (PLNm) 50.9 18.4 17.9 31.7 41.5Net profit (PLNm) 42.7 12.3 12.7 25.2 33.8EPS (PLN) 7.77 2.24 2.30 4.59 6.14CEPS (PLN) 10.23 4.77 5.14 7.87 9.61BVPS (PLN) 38.5 41.6 43.9 47.3 51.1P/E (x) 6.0 20.7 20.2 10.1 7.5P/CE (x) 4.5 9.7 9.0 5.9 4.8P/BV (x) 1.2 1.1 1.1 1.0 0.9EV/Sales (x) 0.6 0.7 0.6 0.5 0.4EV/EBITDA (x) 4.9 9.8 9.4 6.3 5.2
Shareholder structure (shares): Z. Drzymala 53.61%
Investment case: The continued appreciation of the Polish currency (up 3.5% QoQ vs. the EUR in 4Q 2006) and the lack of positive newsflow drove Groclin’s share price again below PLN 50/share. Following the recent correction, Groclin is now trading at P/E of 10x for 2007 and 7x for 2008. In our worst case scenario, these multiples jump to a still reasonable 17x and 14x, respectively. We leave our DCF-derived, 12-month target price of PLN 60/share unchanged as the positive impact of the cuts in assumptions in the risk free rate (from 5.5% to 5.25%) and equity risk premium (from 5.0% to 4.5%) have been neutralised by a lowered earnings forecast due to the trimmed PLN/EUR exchange rate assumptions. However, following the recent weakness, the stock offers 29% upside potential yielding a BUY recommendation.
4Q Results preview and outlook: We expect Groclin to report flat YoY revenues of PLN 117m. However, due to the lack of one-off costs that drove 4Q 2005 profits into the red, we forecast a recovery in EBIT to PLN 5.2m (up from negative PLN 12.4m) and in earnings to PLN 6.5m (up from negative PLN 11.4m).
Valuation: Following the recent correction, Groclin is trading at P/E of 10.1x and 7.5x for 2007 and 2008, 36.5% and 44.1% below its multinational peers’ median, respectively. We have left our 12-month target price for the company at PLN 60/share, as the cuts in assumptions in the risk free rate (from 5.5% to 5.25%) and equity risk premium (from 5.0% to 4.5%) have been neutralised by a lowered earnings forecast (down 16.9% in 2006, 0.1% in 2007 and 3.5% in 2008) due to the trimmed PLN/EUR exchange rate assumptions. Following the recent weakness, our target price offers 29% upside potential and yields a BUY recommendation. However, we note that further delays in the implementation of the long-term strategy may create a downside risk to our forecasts and valuation.
Inter Groclin Auto (IGA) Automotive Poland
PLN 46.38 Buy (Upgrade from Hold)
Target price: PLN 60.0
WIG index 49,560 # of shares 5.5m MCAP PLN 255m US$ 86m Free float PLN 118m US$ 40m IGAU.WA / GCN PW
35
45
55
65
75
Jan-06 May-06 Sep-06 Jan-07
Groclin
50
70
90
110
130
Jan-06 May-06 Sep-06 Jan-07
Groclin WIG
(Rebased to 100)
Analyst Łukasz Wachełko Tel. +48 22 520 9965 [email protected] http://research.ca-ib.com
Up to BUY on price performance
11 January 2007
Company Update

Inter Groclin Auto (IGA) January 2007
76
Table 124: IGA: 4Q 2006 Results preview
4Q 2006E 4Q 2005 Ch. % FY 2006E FY 2005 Ch. %Revenues 117.4 116.8 0 488.3 466.0 4.8EBIT 5.2 (12.4) n.m. 17.9 18.4 (3.1)Net profit 6.5 (11.4) n.m. 12.7 12.3 2.5
Source: IGA, CA IB estimates
Table 125: IGA: Earnings statement
PLNm 2004 2005 2006E 2007E 2008ERevenues 508.8 466.0 488.3 660.3 787.6COGS 441.6 429.3 444.4 587.6 694.0Gross profit 67.2 36.7 43.9 72.7 93.6SG&A 33.5 37.2 39.0 52.8 62.9EBITDA 64.5 32.3 33.5 49.8 60.5Depreciation 13.6 13.9 15.6 18.1 19.0One-off gains* 4.5 4.9 0.0 0.0 1.0EBIT 50.9 18.4 17.9 31.7 41.5Net financials (1.2) 2.5 2.2 0.6 (0.3)Pre-tax profit 51.3 15.9 15.6 31.2 41.7Tax 8.5 3.6 3.0 5.9 7.9Net profit 42.7 12.3 12.7 25.2 33.8
* sale of Football players’ contracts Source: IGA, CA IB estimates
Table 126: IGA: Cash flow statement
PLNm 2004 2005 2006E 2007E 2008ECash flow from operations (0.1) 38.5 24.9 17.3 33.6Cash flow from investment (44.6) (21.6) (19.9) (23.9) (6.9)Cash flow from financing 11.7 (1.1) 0.0 (26.3) (12.6)Net change in cash (33.0) 15.8 5.0 (32.9) 14.1Beginning cash 45.6 12.6 27.1 32.1 (0.8)Ending cash 12.6 27.1 32.1 (0.8) 13.3
Source: IGA, CA IB estimates
Table 127: IGA: Balance sheet
PLNm 2004 2005 2006E 2007E 2008ECurrent assets 213.7 184.9 196.9 218.3 272.6Fixed assets 190.8 217.9 220.1 228.5 218.2Long-term deferred charges 1.2 1.2 1.2 1.6 2.0Total assets 405.7 403.9 418.2 448.4 492.8Current liabilities 167.0 152.4 155.6 160.2 178.4Deferred income 11.4 13.3 14.0 18.9 22.5Long-term liabilities 11.6 4.5 2.1 2.1 2.1Provisions 3.8 4.8 5.0 6.8 8.1Equity 211.5 228.6 241.2 260.1 281.3Minority Interest 0.4 0.4 0.4 0.4 0.4Total liabilities and equity 405.7 403.9 418.2 448.4 492.8Net debt (cash) 77.3 60.7 55.7 68.6 54.4
Source: IGA, CA IB estimates
Table 128: IGA: Key ratios
PLNm 2004 2005 2006E 2007E 2008EEBITDA margin (%) 12.7 6.9 6.9 7.5 7.7EBIT margin (%) 10.0 4.0 3.7 4.8 5.3Net margin (%) 8.4 2.6 2.6 3.8 4.3Net debt (cash)/equity (%) 36.5 26.6 23.1 26.4 19.3ROE (%) 21.9 5.6 5.4 10.1 12.5
Source: IGA, CA IB estimates

Please note that the information at the back forms an integral part of this report.
2005 2006E 2007E 2008E 2009ERevenues (PLNm) 139.9 206.7 402.7 531.6 778.7EBITDA (PLNm) 13.9 21.8 44.5 69.6 103.9EBIT (PLNm) 11.0 17.0 39.2 61.2 92.7Net profit (PLNm) 7.1 9.3 29.4 46.0 73.8EPS (PLN) 0.16 0.18 0.57 0.89 1.43CEPS (PLN) 0.23 0.27 0.67 1.05 1.64BVPS (PLN) 2.01 3.70 4.66 5.87 7.83P/E (x) 82.3 73.8 23.4 15.0 9.3P/CE (x) 58.1 48.4 19.8 12.6 8.1P/BV (x) 6.6 3.6 2.9 2.3 1.7EV/Sales (x) 4.4 3.5 1.8 1.4 0.9EV/EBITDA (x) 44.2 33.0 16.2 10.4 6.9
Shareholder structure: S. Rosnowski 50.9%, PZU AM SA 7.95%, BPH TFI SA 5.07%
Investment case: On 22 December 2006, Polish authorities modified legislation in respect of the biofuel market: relatively high excise tax relief (up to PLN 2.2/l) was replaced by low tax advantage (PLN 1.0/l) and the threat of financial charges, which would come into force after 15 June 2007, once the National Indicatory Target of the percentage share of biocomponent in total fuel turnover has been set. Consequently, already without a carrot, and still without a stick, the market has been frozen for another six months. To avoid further delaying the implementation of its strategy, the management of Elstar Oils has decided to sell its biocomponent production of 1H 2007 abroad, even at the expense of potentially lower margins due to high transportation costs. Therefore, we have cut our 2007 earnings forecast by PLN 6.3m and left further estimates unchanged. Following recent underperformance, Elstar is trading at P/E of 23x for 2007 and 15x for 2008, a respective 13% below and 15% above its European peer average. We are trimming our 12-month target price for Elstar from PLN 17.8/share to PLN 17.5/share and upgrading the stock from Hold to BUY.
Recent developments: Following the material reduction of tax incentives, newsflow from representatives of the biofuel industry has been uninspiring. In fact, many players have left the battlefield: Skotan decided to remodel its strategy and PKN’s Trzebinia reported the cessation of biofuel production. However, according to the management of Elstar Oils, barring another delay in the market launch, the fundamentals of the company have not changed materially. In other words, the demand for their products should be in place, either lured by tax incentives or the threat of a financial penalty (50% of the value of the difference between the National Indicatory Target and actual biocomponent sales).
4Q Results preview and outlook: We expect Elstar to report 4Q 2006 sales of PLN 56m, implying decent YoY growth of 31%. Below the top line, we are looking for PLN 5m in EBIT (up 42% YoY) and PLN 1m in earnings (down 53% YoY).
Valuation: Elstar Oils is trading at a P/E of 23.4x and 15.0x for 2007 and 2008, implying discount of 13% and a premium of 15% to European peers’ average, respectively. We are trimming our 12-month target price for Elstar Oils from PLN 17.8/share to PLN 17.5//share. With 31.9% upside potential, we are upgrading the stock to BUY from Hold. However, we note that any further delay of a Polish market launch would result in ca. 50% downside to our earnings forecasts for the affected period.
Elstar Oils Food Products Poland
PLN 13.3 Buy (Upgrade from Hold)
Target price: PLN 17.5 (Previously: PLN 17.8)
WIG index 49,560 # of shares 51.7m MCAP PLN 687m US$ 230m Free float PLN 337m US$ 113m ELSA.WA / ELS PW
7.0
9.0
11.0
13.0
15.0
17.0
19.0
Jan-06 May-06 Sep-06 Jan-07
Elstar
90
120
150
180
210
240
270
Jan-06 May-06 Sep-06 Jan-07
Elstar WIG
(Rebased to 100)
Analyst Łukasz Wachełko Tel. +48 22 520 9965 [email protected] http://research.ca-ib.com
Bad newsflow, but fundamentals untouched
11 January 2007
Company Update

Elstar Oils January 2007
78
Table 129: Elstar: 4Q 2006 Results preview
4Q 2006E 4Q 2005 Ch. % FY 2006E FY 2005 Ch. %Revenues 56.3 42.8 31.5 206.7 139.9 47.8EBIT 5.1 3.6 42.4 17.0 11.0 54.1Net profit 1.1 2.3 (53.4) 9.3 7.1 31.5
Source: Elstar, CA IB estimates
Table 130: Elstar: Earnings statement
PLNm 2005 2006E 2007E 2008E 2009ERevenues 139.9 206.7 402.7 531.6 778.7COGS 121.1 179.5 341.0 440.8 642.5Gross profit 18.7 27.2 61.7 90.9 136.2SG&A 8.5 11.5 22.5 29.7 43.5EBITDA 13.9 21.8 44.5 69.6 103.9Depreciation 3.0 4.9 5.3 8.4 11.1EBIT 11.0 17.0 39.2 61.2 92.7Net financials (2.3) (5.4) (4.9) (7.9) (8.5)Pre-tax profit 8.7 11.5 34.3 53.3 84.3Tax 1.6 2.2 4.9 7.3 10.5Net profit 7.1 9.3 29.4 46.0 73.8
Source: Elstar, CA IB estimates
Table 131: Elstar: Cash flow statement
PLNm 2005 2006E 2007E 2008E 2009ECash flow from operations (10.2) 27.5 (30.9) 11.3 2.2Cash flow from investment (27.7) (9.3) (52.9) (47.4) (56.1)Cash flow from financing 39.8 94.0 90.1 74.3 (42.2)Net change in cash 1.8 112.2 6.3 38.2 (96.2)Beginning cash 19.8 21.6 133.8 140.0 178.2Ending cash 21.6 133.8 140.0 178.2 82.1
Source: Elstar, CA IB estimates
Table 132: Elstar: Balance sheet
PLNm 2005 2006E 2007E 2008E 2009ECurrent assets 117.7 222.8 312.8 406.0 415.4Fixed assets 102.9 108.1 157.7 198.1 245.7Long-term deferred charges 0.1 0.1 0.2 0.2 0.3Total assets 220.7 330.9 470.7 604.3 661.4Current liabilities 89.3 94.8 180.8 191.3 141.5Deferred income 0.8 1.2 2.4 3.2 4.6Long-term liabilities 40.1 40.1 40.1 97.9 97.9Provisions 2.2 3.3 6.3 8.4 12.3Equity 88.2 191.5 241.0 303.6 405.1Total liabilities and equity 220.7 330.9 470.7 604.3 661.4Net debt (cash) 90.0 (22.2) 41.5 61.1 87.2
Source: Elstar, CA IB estimates
Table 133: Elstar: Key ratios
PLNm 2005 2006E 2007E 2008E 2009EEBITDA margin (%) 10.0 10.6 11.1 13.1 13.3EBIT margin (%) 7.9 8.2 9.7 11.5 11.9Net margin (%) 5.1 4.5 7.3 8.7 9.5Net debt (cash)/equity (%) 102.0 (11.6) 17.2 20.1 21.5ROE (%) 8.4 6.7 13.6 16.9 20.8
Source: Elstar, CA IB estimates

Please note that the information at the back forms an integral part of this report.
2003 2004 2005E 2006E 2007E 2008ERevenues (PLNm) 2,147.0 2,150.7 2,702.9 3,033.6 3,297.3 3,730.4 EBIT (PLNm) 70.9 4.5 2.0 13.7 62.3 110.4 Net profit (PLNm) 45.4 8.4 2.0 4.5 50.0 90.5 EPS (PLN) 1.78 0.33 0.08 0.18 1.96 3.54 CEPS (PLN) 3.05 1.34 0.89 1.04 2.81 4.46 BVPS (PLN) 19.97 20.38 20.36 20.53 22.58 27.59 P/E (x) 41.9 227.5 936.9 420.0 38.1 21.0 P/CE (x) 24.4 55.4 83.7 71.8 26.5 16.7 P/BV (x) 3.7 3.7 3.7 3.6 3.3 2.7 EV/Sales (x) 0.7 0.7 0.6 0.5 0.5 0.4 EV/EBITDA (x) 14.8 50.2 67.7 43.0 18.2 11.5 Dividend yield (%) 0.0 0.0 0.0 0.0 0.0 0.0
Shareholder structure: Ferrovial 59.1%
We upgraded Budimex to BUY from Hold in our in our 5 January 2007 research report, raising our 12-month target price to PLN 93 from PLN 82. We believe Budimex’s housing business to be undervalued, given the company’s pipeline of 4,000 residential units. Earnings in that business line (booked only after the transfer of the property), as well as an expected pick-up in margins in road construction (spending on roads in Poland is set to double from 2007 forward vs. 2005) are the major drivers of the 252% CAGR in EPS we forecast Budimex to post in 2006-2008E.
• The current pipeline of 4,000 residential units will be fully visible in Budimex’s P&L only from 2008 forward, as the company books earnings only after the transfer of legal ownership of the property. We estimate the Inflancka project alone (10% of total pipeline by units) will generate EBIT of PLN 82m to be booked between 2008 and 2010.
• Finally a pick-up in road construction margins? Spending on road construction in Poland is set to double to almost PLN 13bn annually between 2007 and 2013 (vs. 2005) fuelled by the inflow of EU funds. We expect road construction margins to pick up as road builders demand higher prices while the government is determined to launch new projects (otherwise some EU funds may be forfeited).
• Earnings forecasts: We expect 4Q results to still show some weakness (net profit of just PLN 1.6m) but to begin recovering already from 1Q 2007. For this reason we have recently cut our 2006 net profit forecast by 81% to PLN 4.5m. We forecast 2006-2008E EPS CAGR of 252%.
• Valuation: Budimex is trading at 2007E P/E of 38.1x but 2007E PEG of just 0.2x. Based on our updated DCF model (earnings revisions, and cuts in ERP to 4.5% and RFR to 5.25%), on 5 January we increased our target price to PLN 93 from PLN 82. With the expected 25% upside on a 12-month horizon, we rate Budimex as a BUY.
Budimex Construction Poland
PLN 74.5 Buy
Target price: PLN 93
WIG index 49,560 # of shares 25.5m MCAP PLN 1.9bn US$ 639m Free float PLN 0.8bn US$ 261m BMEX.WA / BDX PW
30
40
50
60
70
80
Jan-06 May-06 Sep-06 Jan-07
Budimex
80
100
120
140
160
180
200
Jan-06 May-06 Sep-06 Jan-07
Budimex WIG
(Rebased to 100)
Analyst Tomasz Krukowski, CFA Tel. +48 22 520 9859 [email protected] http://research.ca-ib.com
Housing business undervalued
11 January 2007
Company Update

Budimex January 2007
80
4Q 2006 Results preview We forecast Budimex to post yet another quarter of relatively weak results. We forecast revenues of PLN 901m, up 15% YoY, EBIT of just PLN 2.6m (vs. a loss of PLN 5.2m in the corresponding period a year ago) and net profit of PLN 1.6m, up 230% YoY.
Table 134: Budimex 4Q Results preview
PLNm 4Q 2006E 4Q 2005 %, YoY 2006E 2005 %, YoYSales 901.2 783.2 15.1 3,033.6 2,702.9 12.2 EBIT 2.6 (5.2) n.m. 13.7 2.0 598.6 Net profit 1.6 0.5 230.4 4.5 2.0 123.1
Source: Budimex, CA IB estimates
Table 135: Earnings statement
PLNm 2004 2005 2006E 2007E 2008ENet revenues 2,150.7 2,702.9 3,033.6 3,297.3 3,730.4 COGS 2,144.3 2,597.0 2,880.2 3,074.5 3,437.2 Gross profit 6.4 105.9 153.5 222.8 293.2 SG&A 136.5 135.2 142.6 155.0 175.3 Other operating items 134.6 31.3 2.8 (5.6) (7.5)EBITDA 30.5 22.7 35.7 84.1 133.8 Depreciation 26.0 20.7 21.9 21.9 23.4 EBIT 4.5 2.0 13.7 62.3 110.4 Net financials (3.4) (4.2) 3.5 3.6 2.1 Pre-tax profit 8.0 6.2 10.2 58.7 108.3 Tax 0.7 6.1 7.9 11.2 20.6 Minorities/associates 1.1 2.0 2.2 2.4 2.7 Net profit 8.4 2.0 4.5 50.0 90.5
Source: Budimex, CA IB estimates
Table 136: Cash flow
PLNm 2004 2005 2006E 2007E 2008ENet profit 8.4 2.0 4.5 50.0 90.5 Depreciation 26.0 20.7 21.9 21.9 23.4 Other non-cash (266.1) (1.0) 7.7 6.1 10.0 Cash earnings (231.8) 21.7 34.1 77.9 123.9 Change in WC 174.6 (60.2) (46.3) (11.9) (19.5)Capex (27.2) (14.1) (48.8) (31.2) (35.1)Free cash flow (84.4) (52.6) (60.9) 34.8 69.3 Ch. in investment 228.2 137.7 32.9 26.3 43.1 Dividends 0.0 0.0 0.0 2.3 37.5 New capital/(debt) (0.1) 65.1 (0.0) 0.0 0.0 Change in liquid funds 143.7 150.2 (28.0) 63.4 149.9
Source: Budimex, CA IB estimates
Table 137: Balance sheet
PLNm 2004 2005 2006E 2007E 2008EFixed assets 371.0 292.5 319.3 328.6 340.4 Working capital 30.2 90.3 136.6 148.5 168.0Capital employed 401.1 382.8 455.9 477.1 508.4 Shareholders equity 520.2 519.7 524.3 576.5 704.4 Net debt/(cash) (288.8) (369.3) (341.3) (404.7) (554.6)Other liabilities 396.0 478.5 526.4 564.6 627.3 Total assets 1,754.4 1,942.5 2,095.2 2,265.7 2,587.8
Source: Budimex, CA IB estimates
Table 138: Key ratios
2004 2005 2006E 2007E 2008EEBITDA margin (%) 1.4 0.8 1.2 2.6 3.6 EBIT margin (%) 0.2 0.1 0.5 1.9 3.0 Net debt/equity (%) (55.5) (71.1) (65.1) (70.2) (78.7)Current ratio (x) 1.3 1.3 1.2 1.3 1.3 Debtors turnover (x) 3.6 4.1 4.3 4.2 4.2 ROE (%) 1.6 0.4 0.9 9.1 14.1 ROCE (%) 1.8 0.5 1.1 10.7 18.4
Source: Budimex, CA IB estimates

Please note that the information at the back forms an integral part of this report.
2003 2004 2005 2006E 2007E 2008ERevenue (PLNm) 564.9 1,701.0 1,841.9 2,312.7 3,033.9 3,629.2EBIT (PLNm) 35.8 79.8 75.4 99.4 141.8 201.0Net profit (PLNm) 12.2 37.3 43.2 60.0 97.1 144.4EPS (PLN) 1.27 3.43 2.94 4.08 5.23 7.67CEPS (PLN) 2.98 6.03 4.82 6.27 7.69 10.42BVPS (PLN) 11.53 16.18 19.08 22.30 36.50 42.87P/E (x) 118.6 44.1 51.4 37.0 28.9 19.7P/CE (x) 50.6 25.0 31.3 24.1 19.6 14.5P/BV (x) 13.1 9.3 7.9 6.8 4.1 3.5EV/Sales (x) 5.1 1.7 1.6 1.2 0.9 0.8EV/EBITDA (x) 54.9 26.5 27.8 21.8 15.3 11.3Dividend yield (%) 0.0 0.0 0.3 0.4 0.5 0.8
Shareholder structure: CU pension fund 9.7%, PZU pension fund 8.5%, ING NN Pension Find 6.3%, Amplico Life 6.1%, Pioneer Pekao IM 5.2%, BGK 5.1%, treasury shares 3.5%
Investment case: We are upgrading our recommendation on Polimex to BUY from Hold, raising our 12-month target price to PLN 168 from PLN 160. The comparative valuation (2007E P/E of 28.9x implying a 25% discount to Budimex and PBG) and persistently implemented M&A strategy are the major arguments for buying the stock, in our view.
Recent developments: Polimex’s EGM accepted the company’s merger with ZREW and its acquisition of EPN. In both transactions, which are planned to be completed in 1Q 2007, Polimex is set to issue 3.3m new shares (22% dilution). In addition, the company continues to work on another M&A deal, as it plans to acquire a PLN 100m-revenue general construction company. We have updated our earnings forecast for Polimex, incorporating the recent M&As, and consequently, we have increased our net profit forecasts by 12% to PLN 97.1m for 2007 and by 10% to PLN 144.4m for 2008. Nevertheless, the acquisition of EPN appears to be dilutive for 2007 and 2008, and, accordingly, we have trimmed our EPS estimates for Polimex by 2% and 3%, respectively.
4Q 2006 Results and outlook: We expect another quarter of solid results, with revenues of PLN 713m, up 38% YoY, EBIT of PLN 16.1m, up 516% YoY and net profit of PLN 7.7m, up 1% YoY.
Valuation: Based on our updated earnings forecasts and revised assumptions for RFR (down to 5.25% from 5.5%) and ERP (down to 4.5% from 5.0%), we have increased our target price for Polimex to PLN 168 from PLN 160. With an 11% upside on a 12-month horizon, we upgrade Polimex to BUY from Hold. The company is trading 2007E P/E ratio of 28.9% versus 2006E-2008E EPS CAGR of 38%.
Polimex Mostostal
Upgrade to Buy
Polimex Mostostal Construction Poland
PLN 151 Buy (Upgrade from Hold)
Target price: PLN 168 (Previously: PLN 160)
WIG index 49,560 # of shares 15.2m MCAP PLN 2,295m US$ 770m Free float PLN 2,295m US$ 770m MOSD.WA / PXM PW
50
70
90
110
130
150
170
Jan-06 May-06 Sep-06 Jan-07
Polimex
90
140
190
240
290
Jan-06 May-06 Sep-06 Jan-07
Polimex WIG
(Rebased to 100)
Analyst Tomasz Krukowski, CFA Tel. +48 22 520 9859 [email protected] http://research.ca-ib.com
11 January 2007
Company Update

Polimex Mostostal January 2007
82
Table 139: Polimex: 4Q 2006 Results preview
PLNm 4Q 2006E 4Q 2005 YoY (%) 2006E 2005 YoY (%)Sales 713.1 516.8 38.0 2,313.0 1,841.9 25.6EBIT 16.1 2.6 515.8 99.4 75.4 31.8Net profit 7.7 7.6 0.6 60.0 43.2 38.9
Source: Polimex, CA IB estimates
Table 140: Polimex: Earnings revision
2006E 2007E 2008E PLNm New Ch.% New Ch.% New Ch.%Sales 2,312.7 0 3,033.9 11 3,629.2 12 EBIT 99.4 0 141.8 15 201.0 14 Net profit 60.0 0 97.1 12 144.4 10 EPS (PLN) 4.08 0 5.23 (2) 7.67 (3)
Source: Polimex, CA IB estimates
Table 141: Income statement forecasts
PLNm 2004 2005 2006E 2007E 2008ENet revenues 1,701.0 1,841.9 2,312.7 3,033.9 3,629.2 COGS 1,498.6 1,640.6 2,051.4 2,679.7 3,174.1 Gross profit 202.3 201.3 261.3 354.2 455.1 SG&A 133.3 122.6 157.3 206.3 246.8 Other operating items 10.8 (3.3) (4.6) (6.1) (7.3)EBITDA 108.2 103.1 131.7 187.4 252.7 Depreciation 28.4 27.7 32.3 45.6 51.6 EBIT 79.8 75.4 99.4 141.8 201.0 Net financials 20.3 7.5 7.6 4.5 0.8 Pre-tax profit 59.5 67.9 91.8 137.3 200.2 Tax 11.9 15.7 18.3 27.2 39.4 Minorities and associates (10.3) (9.0) (13.4) (13.0) (16.5)Net profit 37.3 43.2 60.0 97.1 144.4 Source: Polimex, CA IB estimates
Table 142: Cash flow statement forecasts
PLNm 2004 2005 2006E 2007E 2008ENet profit 37.3 43.2 60.0 97.1 144.4 Depreciation 28.4 27.7 32.3 45.6 51.6 Other non-cash 34.0 14.7 45.8 36.8 30.4 Cash earnings 99.6 85.7 138.2 179.4 226.4 Change in WC (199.7) (64.1) (41.6) (127.0) (97.9)Capex (166.1) (18.7) (92.0) (124.0) (63.8)Free cash flow (266.2) 2.9 4.6 (71.5) 64.7 Change in LT investments 78.1 35.8 37.7 (111.3) 56.7 Dividends 0.0 0.0 (6.9) (9.5) (15.4)New capital (debt) 226.9 (4.0) (13.4) 289.0 (16.5)Change in liquid funds 38.8 34.7 22.0 96.7 89.5 Source: Polimex, CA IB estimates
Table 143: Balance sheet
PLNm 2004 2005 2006E 2007E 2008EFixed assets 283.4 256.3 315.9 574.4 586.5 Working capital 340.4 404.4 446.1 573.0 671.0 Capital employed 623.8 660.7 762.0 1,147.4 1,257.5 Shareholders equity 238.3 280.8 334.0 677.4 806.3 Net debt/(cash) 94.2 64.3 42.4 (54.3) (143.8)Other liabilities 341.1 334.8 411.8 558.7 636.1 Total assets 1,042.8 1,105.9 1,332.6 1,971.8 2,309.6 Source: Polimex, CA IB estimates
Table 144: Key ratios
2004 2005 2006E 2007E 2008EEBITDA margin (%) 6.4 5.6 5.7 6.2 7.0 EBIT margin (%) 4.7 4.1 4.3 4.7 5.5 Net debt (cash)/equity (%) 39.5 22.9 12.7 (8.0) (17.8)Current ratio (x) 1.3 1.3 1.3 1.4 1.5 Debtors turnover (x) 5.5 3.3 3.6 3.9 3.7 ROE (%) 21.4 16.7 19.5 19.2 19.5 ROCE (%) 8.6 6.7 8.4 10.2 12.0 Source: Polimex, CA IB estimates

Please note that the information at the back forms an integral part of this report.
2003 2004 2005 2006E 2007E 2008ERevenue (PLNm) 180.7 216.1 409.0 840.8 1,419.4 2,019.0EBIT (PLNm) 14.3 21.8 40.1 71.7 116.6 166.9Net profit (PLNm) 11.1 13.9 36.0 53.6 88.7 128.5EPS (PLN) 1.55 1.57 3.42 4.45 6.60 9.57CEPS (PLN) 2.48 2.33 4.43 5.80 8.44 12.06BVPS (PLN) 4.52 13.54 16.79 30.62 54.88 64.45P/E (x) 165.6 162.7 74.8 57.5 38.8 26.7P/CE (x) 103.3 110.0 57.8 44.1 30.3 21.2P/BV (x) 56.7 18.9 15.3 8.4 4.7 4.0EV/Sales (x) 19.8 16.5 8.7 4.3 2.5 1.8EV/EBITDA (x) 170.2 125.3 70.4 40.6 25.3 17.8Dividend yield (%) 0.0 0.0 0.0 0.0 0.0 0.0
Shareholder structure: Mr. Jerzy Wisniewski 36.4%, BZ WBK AIB Asset Management 7.4%, ING Mutual Fund 7.0%
Investment case: We reiterate our HOLD recommendation on PBG, raising our 12-month target price to PLN 267 from PLN 230. PBG shares offer a seemingly unique in Poland exposure to the combination of the booming markets of hydro-construction and oil & gas construction. The company’s expansion plans, both geographical (Norway, Bulgaria, Romania) and segmental (entrance into road construction), may further enhance its growth profile.
Recent developments: PBG announced its earnings guidance for 2007, with revenues of PLN 1.2bn and net profit at PLN 82m, 15% and 8% below our own forecasts, respectively. We note, however, that PBG’s sales projections are already 80% covered by its order book, while the outcome of a few, sizable tenders are expected in 2007. This will include a PLN 0.6bn contract for the construction of an oil & gas plant for PGNiG as well as a more than PLN 1bn contract for the construction a sewage treatment plant in Warsaw. To finance the working capital requirements associated with these projects, as well as the acquisitions in the road construction segment, PBG is currently in the process of conducting a rights issue (11.7% dilution) worth approximately PLN 350m.
4Q 2006 Results and outlook: In the past, 4Q has been PBG’s strongest quarter due to seasonal considerations, and this year we expect it to be no exception from that rule. We forecast a 147% rise in revenues to PLN 418m, a 31% rise in EBIT to PLN 24.3m and an 88% rise in net profit to PLN 23.5m.
Valuation: We have updated our DCF model with new assumptions for RFR (down to 5.25% from 5.5%) and ERP (down to 4.5% from 5.0%), and consequently increase our 12-month target price for PBG to PLN 267 from PLN 230. The stock is trading at 2007E P/E ratio of 38.8x, but offers a 3-year EPS CAGR of 41%. We reiterate our HOLD rating.
PBG Construction Poland
PLN 256 Hold
Target price: PLN 267 (Previously: PLN 230)
WIG index 49,560 # of shares 12m MCAP PLN 3,1bn US$ 1bn Free float PLN 2,0bn US$ 656m PBGG.WA / PBG PW
50
100
150
200
250
Jan-06 May-06 Sep-06 Jan-07
PBG
80
130
180
230
280
330
Jan-06 May-06 Sep-06 Jan-07
PBG WIG
(Rebased to 100)
Analyst Tomasz Krukowski, CFA Tel. +48 22 520 9859 [email protected] http://research.ca-ib.com
Growth continues
11 January 2007
Company Update

PBG January 2007
84
4Q 2006 Results preview
Table 145: PBG: 4Q 2006 Results preview
PLNm 4Q 2006E 4Q 2005 YoY (%) 2006E 2005 YoY (%)Sales 418.0 169.5 146.7 840.0 409.0 105.4EBIT 24.3 18.5 30.8 71.7 40.1 78.8Net profit 23.5 12.5 87.7 53.6 36.0 48.9
Source: PBG, CA IB estimates
Table 146: Earnings statement
PLNm 2004 2005 2006E 2007E 2008ENet revenues 216.1 409.0 840.8 1,419.4 2,019.0 COGS 172.1 338.5 701.9 1,189.1 1,689.7 Gross profit 44.0 70.5 138.9 230.3 329.2 SG&A 24.1 33.9 65.7 110.9 157.7 Other operating incomes, net 1.9 3.5 (1.5) (2.8) (4.6)EBITDA 28.5 50.7 87.9 141.2 200.3 Depreciation 6.7 10.6 16.2 24.7 33.4 EBIT 21.8 40.1 71.7 116.6 166.9 Net financials 2.7 (4.7) 6.3 7.4 6.4 Pre-tax profit 19.1 44.8 65.4 109.2 160.5 Tax 5.1 7.9 10.8 15.6 19.3 Minorities/associates (0.0) (0.9) (1.0) (5.0) (12.7)Net profit 13.9 36.0 53.6 88.7 128.5 Source: PBG, CA IB estimates
Table 147: Cash flow
PLNm 2004 2005 2006E 2007E 2008ENet profit 13.9 36.0 53.6 88.7 128.5 Depreciation 6.7 10.6 16.2 24.7 33.4 Other non-cash (10.2) (117.7) (85.7) (143.9) (149.1)Cash earnings 10.4 (71.1) (15.9) (30.6) 12.9 Change in WC (65.9) (23.7) 42.7 (45.5) (47.2)Capex (14.1) (143.3) (60.0) (100.0) (40.4)Free cash flow (69.6) (238.1) (33.2) (176.1) (74.7)Change in LT investments (5.6) 128.2 (68.4) (32.5) 18.1 Dividends 0.0 0.0 0.0 0.0 0.0 New capital (debt) 108.3 147.6 141.4 285.5 13.3 Change in liquid funds 33.1 37.8 39.9 76.9 (43.3) Source: PBG, CA IB estimates
Table 148: Balance sheet
PLNm 2004 2005 2006E 2007E 2008EFixed Assets 68.0 192.9 318.2 443.5 450.4 Working Capital 111.9 232.8 276.3 466.5 663.5 Capital employed 179.9 425.7 594.5 910.0 1,114.0 Shareholders equity 142.6 176.7 368.3 737.0 865.5 Net debt/(cash) 29.7 135.3 95.4 18.5 61.8 Other liabilities 14.7 142.0 159.1 182.9 215.0 Total assets 305.8 662.2 954.5 1,491.6 1,802.2 Source: PBG, CA IB estimates
Table 149: Key ratios
2004 2005 2006E 2007E 2008EEBITDA margin (%) 13.2 12.4 10.5 10.0 9.9 EBIT margin (%) 10.1 9.8 8.5 8.2 8.3 Net debt (cash)/equity (%) 20.9 76.6 25.9 2.5 7.1 Current ratio (x) 1.9 1.7 1.7 2.0 1.9 Debtors turnover (x) 2.0 2.2 3.5 4.2 3.9 ROE (%) 15.9 22.6 19.7 16.0 16.0 ROCE (%) 9.8 11.9 10.5 11.8 12.7 Source: PBG, CA IB estimates

Please note that the information at the back forms an integral part of this report.
2004 2005 2006E 2007E 2008ERevenues (PLNm) 463.2 499.8 629.4 733.6 851.5EBITDA (PLNm) 49.9 54.4 86.5 100.4 120.4Adj. EBITDA 49.9 54.4 84.3 100.4 120.4EBIT (PLNm) 19.7 22.8 49.4 58.8 70.1Adj. EBIT 19.7 22.8 47.2 58.8 70.1Net profit (PLNm) 11.7 22.2 43.2 47.3 57.0Adj. Net profit 11.7 22.2 37.2 47.3 57.0EPS (PLN) 1.17 1.64 3.20 3.50 4.22Adj. EPS 1.17 1.64 2.76 3.50 4.22P/E (x) 61.3 43.8 22.5 20.5 17.0Adj. P/E 61.3 43.8 26.1 20.5 17.0EV/Sales (x) 1.7 2.1 1.6 1.4 1.2Adj. EV/EBITDA 20.7 19.0 12.3 10.3 8.6EV/EBITDA (x) 15.7 19.0 12.0 10.3 8.6
Shareholder structure: IRI 37.5%, BZ WBK AIB AM 10.34%, ING NN OFE 6.21%, AIG OFE 5.17%, BZ WBK AIB TFI 5.10%
Investment case: Facing obstacles in its Ukrainian expansion, AmRest management has decided to focus its growth activities on its “old” territories. In our view, the major growth driver may be the potential relaunch of the Burger King (BK) chain in Poland. According to the company’s management, AmRest intends to challenge the leading position of McDonald’s, which operates ca. 360 outlets in our region, 83% more than AmRest. Conservatively assuming AmRest will add 10 BK outlets per annum in the coming years and based on strong 4Q 2006 sales data, we have increased our earnings forecasts for the company by 3% in 2006, 1% in 2007 and 3% in 2008. On our updated forecasts, AmRest is trading at P/E of 20x for 2007 and 17x for 2008, 14.4% and 13.8% above its multinational peers, respectively. Incorporating the BK project into our DCF model and cutting ERP and risk free rate assumptions, we have upped our target price for the stock from PLN 63/share to PLN 76/share. We reiterate our HOLD recommendation for the stock.
Recent developments: On 7 December 2006, AmRest reported it had signed a letter of intent with Burger King Europe regarding the relaunch of the BK restaurant chain in the region. In our talks with the company, we have learned that a final agreement should be reached in late January 2007, after which, we expect the company to publish its development strategy for the coming years.
4Q Results preview and outlook: AmRest reported 4Q 2006 sales of PLN 182.1m, implying decent YoY growth of 28.9%. Below the top line, we are looking for PLN 18m in EBIT (up 250% YoY) and PLN 15m in earnings (up 110% YoY).
Valuation: AmRest is trading at 2006E and 2007E P/E of 20.5x and 17.0x, respectively, 14.4% and 13.8% above its multinational peers’ median. We have upped our target price for the stock from PLN 63/share to PLN 76/share due to 1) inclusion of the BK project into our forecasts and 2) reductions in ERP and risk free rate assumptions. Interestingly, the 2006 P/E of the company’s closest peer Sfinks implies AmRest’s fair value at PLN 83/share. We reiterate our HOLD recommendation on AmRest.
AmRest Food & Beverages Poland
PLN 71.9 Hold
Target price: PLN 76 (Previously: PLN 63)
WIG index 49,560 # of shares 13.5m MCAP PLN 971m US$ 326m Free float PLN 607m US$ 204m AMMR.WA / EAT PW
35
45
55
65
75
85
Jan-06 May-06 Sep-06 Jan-07
AmRest
80
100
120
140
160
180
200
220
Jan-06 May-06 Sep-06 Jan-07
AmRest WIG
(Rebased to 100)
Analyst Łukasz Wachełko Tel. +48 22 520 9965 [email protected] http://research.ca-ib.com
King of Burgers?
11 January 2007
Company Update

AmRest January 2007
86
Table 150: AmRest: 4Q Results preview
4Q 2006E 4Q 2005 Ch. % FY 2006E FY 2005 Ch. %Revenues 182.1 141.3 28.9 629.4 499.8 25.9EBIT 18.4 5.2 252.9 49.4 22.8 116.8Net profit 14.7 7.0 110.1 43.2 22.2 94.9
Source: AmRest, CA IB estimates
Table 151: AmRest: Earnings statement
PLNm 2004 2005 2006E 2007E 2008ENet revenue 463.2 499.8 629.4 733.6 851.5COGS 404.7 434.4 544.7 635.8 736.1Gross profit 58.5 65.4 84.7 97.8 115.3G&A 42.4 40.6 41.1 47.9 55.6EBITDA 49.9 54.4 86.5 100.4 120.4Depreciation 30.2 31.6 37.1 41.6 50.3EBIT 19.7 22.8 49.4 58.8 70.1Net financials (6.2) (5.7) 4.1 (0.2) 0.5Pre-tax profit 13.5 17.1 53.5 58.6 70.6Tax 1.8 (5.1) 10.2 11.1 13.4Net profit 11.7 22.2 43.2 47.3 57.0
Source: AmRest, CA IB estimates
Table 152: AmRest: Cash flow statement
PLNm 2004 2005 2006E 2007E 2008ECash flow from operations 29.1 39.5 83.8 88.4 105.3Cash flow from investment (26.0) (56.1) (49.6) (91.8) (92.1)Cash flow from financing 0.1 36.7 1.0 (5.9) (0.3)Net change in cash 3.2 20.0 35.2 (9.4) 12.8Beginning cash 7.7 11.5 31.5 66.7 57.4Ending cash 11.5 31.5 66.7 57.4 70.2
Source: AmRest, CA IB estimates
Table 153: AmRest: Balance sheet
PLNm 2004 2005 2006E 2007E 2008ECurrent assets 33.6 61.9 102.7 97.9 115.9Fixed assets 176.8 212.7 222.2 270.1 309.2Long-term deferred charges 3.9 11.5 14.5 16.9 19.6Total assets 214.4 286.1 339.5 384.9 444.7Current liabilities 171.4 73.2 81.2 84.2 86.3Long-term liabilities 22.5 84.7 64.7 54.7 44.7Provisions 1.5 4.7 5.9 6.9 8.0Equity 18.6 123.6 187.7 239.1 305.8Total liabilities and equity 214.0 286.1 339.5 384.9 444.7Net debt (cash) 128.3 67.2 12.0 11.3 (11.5)
Source: AmRest, CA IB estimates
Table 154: AmRest: Key ratios
PLNm 2004 2005 2006E 2007E 2008EEBITDA margin (%) 10.8 10.9 13.7 13.7 14.1EBIT margin (%) 4.3 4.6 7.9 8.0 8.2Net margin (%) n.m. 4.4 6.9 6.4 6.7Net debt (cash)/equity (%) 687.9 54.4 6.4 4.7 (3.8)ROE (%) n.m. 31.2 27.7 22.2 20.9
Source: AmRest, CA IB estimates

Please note that the information at the back forms an integral part of this report.
2004 2005 2006E 2007E 2008ERevenues (PLNm) 278.0 330.9 400.5 613.7 871.2EBIT (PLNm) 29.7 54.9 69.4 111.2 152.5Net profit (PLNm) 20.7 43.8 57.2 90.3 123.8EPS (PLN) 0.54 1.14 1.49 2.35 3.22CEPS (PLN) 0.69 1.23 1.63 2.53 3.49BVPS (PLN) 3.3 4.4 5.9 8.2 11.4P/E (x) 85.8 40.6 31.1 19.7 14.4P/CE (x) 67.4 37.5 28.5 18.3 13.3P/BV (x) 14.2 10.6 7.9 5.6 4.1ROE (%) 26.0 29.8 29.1 33.4 32.8EV/EBITDA (x) 55.6 30.3 23.9 15.1 11.0Dividend yield (%) 0.0 2.2 2.8 4.4 6.1
Shareholder structure: D. Milek 60.89%, L. Gaczorek 14.06%
Investment case: We believe the warm winter has negatively affected CCC’s FY 2006 results. As already reported by the company, in December 2006 the revenues dynamics slowed to 12%. Consequently, we have cut our FY 2006 earnings forecasts by 10% to PLN 57m, 6% below management forecasts. However, we believe that such a one-off, weather-related factor will have no lasting impact in the ensuing years. CCC is currently trading at P/E of 20x for 2007, 7% below LPP and 21% lower than Geox. As the reduction of ERP and risk free rate assumptions have outweighed the negative impact of the 2006 forecast cut, we are inching up our 12-month target price for CCC from PLN 53/share to PLN 54/share. We would advise using the likely correction to accumulate the stock.
Recent developments: In recent weeks CCC has opened its first franchise outlets under the new super-economy brand Boti. Interestingly, in line with previous statements, CCC has decided to change its company name to NG2.
4Q Results preview and outlook: We expect CCC to deliver disappointing 4Q 2006 results. As already reported by the company, the unfavourable weather resulted in uninspiring revenues dynamics of 22% in 4Q 2006. Below the top line, we are looking for PLN 25m in EBIT (up 36% YoY) and PLN 20m in earnings (up 18% YoY). For the FY 2006, we have cut our overall forecasts by 3% in revenues (to PLN 400.5m), 10% in EBIT (to PLN 69.4m) and 10% in earnings (to PLN 57.2m).
Valuation: CCC is currently trading at P/E of 19.7x for 2007 and 14.4x for 2008, a respective 6.8% and 2.4% below its closest peer LPP, and already 20.6% and 31.8% below the respective multiples of Geox. Due to the cuts in ERP and risk free rate assumptions, which outweighed the negative impact of FY 2006, we have upped our 12-month target price for CCC from PLN 53/share to PLN 54/share. With 16.5% upside potential we reiterate our BUY recommendation for the stock. However, we note that weak 4Q numbers may affect market sentiment towards the stock.
CCC Retail Poland
PLN 46.35 Buy
Target price: PLN 54 (Previously: PLN 53)
WIG index 49,560 # of shares 38.4m MCAP PLN 1,780m US$ 597m Free float PLN 446m US$ 150m CCCC.WA / CCC PW
30
35
40
45
50
Jan-06 May-06 Sep-06 Jan-07
CCC
90
100
110
120
130
140
150
160
Jan-06 May-06 Sep-06 Jan-07
CCC WIG
(Rebased to 100)
Analyst Łukasz Wachełko Tel. +48 22 520 9965 [email protected] http://research.ca-ib.com
Buy on weakness opportunity?
11 January 2007
Company Update

CCC January 2007
88
Table 155: CCC: 4Q 2006 Results preview
4Q 2006E 4Q 2005 Ch. % FY 2006E FY 2005 Ch. %Revenues 121.1 99.2 22.1 400.5 330.9 21.0EBIT 25.5 18.8 35.7 69.4 54.9 26.5Net profit 20.0 16.9 18.2 57.2 43.8 30.6
Source: CCC, CA IB estimates
Table 156: CCC: Earnings statement
PLNm - pro forma 2004 2005 2006E 2007E 2008ENet revenue 278.0 330.9 400.5 613.7 871.2COGS (193.6) (185.3) (221.9) (331.0) (473.1)SG&A (52.8) (91.2) (109.1) (171.5) (245.5)Other operating income/cost (6.0) (3.4) (0.1) (0.1) (0.1)EBITDA 32.1 58.8 74.6 118.2 162.5Depreciation (2.4) (3.9) (5.2) (7.0) (10.0)EBIT 29.7 54.9 69.4 111.2 152.5Net financials (4.4) (0.2) 1.3 0.3 0.4Pre-tax profit 25.3 54.7 70.7 111.5 152.9Tax (4.6) (10.8) (13.4) (21.2) (29.0)Net profit 20.7 43.8 57.2 90.3 123.8
Source: CCC, CA IB estimates
Table 157: CCC: Cash flow statement
PLNm 2004 2005 2006E 2007E 2008ENet profit 20.7 43.5 57.2 90.3 123.8Depreciation 2.4 3.9 5.2 7.0 10.0Cash earnings 26.4 47.4 62.4 97.3 133.9Change in WC (26.5) (23.5) 0.6 (48.3) (60.2)Operations 0.5 24.4 63.1 49.0 73.7Investments (6.3) (33.8) (62.2) (48.5) (73.5)Financing 33.4 (13.5) (0.5) 3.6 4.7Dividends 0.0 38.4 50.1 79.1 108.5Change in cash 27.6 (22.9) 0.3 4.1 4.9
Source: CCC, CA IB estimates
Table 158: CCC: Balance sheet
PLNm 2004 2005 2006E 2007E 2008EFixed assets 70.6 76.3 132.9 174.4 237.8Net working capital 75.5 99.7 99.9 152.2 217.3Capital employed 146.1 176.0 232.8 326.6 455.1Shareholders equity 125.8 168.7 225.1 315.4 439.3Debt 21.2 8.2 7.6 11.2 15.9Marketable securities & cash 24.6 13.2 49.3 55.3 92.3Total assets 180.6 203.6 258.6 364.5 508.5
Source: CCC, CA IB estimates
Table 159: CCC: Key ratios
PLNm 2004 2005 2006E 2007E 2008EEBITDA margin (%) 11.5 17.8 18.6 19.3 18.7EBIT margin (%) 10.7 16.6 17.3 18.1 17.5Interest cover (x) 5.9 35.6 69.8 175.6 170.6Net debt/equity (%) (2.7) (3.0) (18.5) (14.0) (17.4)Current ratio (x) 3.9 5.1 6.8 6.5 6.8Sales/receivables (x) 7.0 6.5 7.3 7.3 7.3ROE (%) 26.0 29.8 29.1 33.4 32.8ROCE (%) 25.3 34.1 33.9 39.8 39.0
Source: CCC, CA IB estimates

Please note that the information at the back forms an integral part of this report.
2004 2005 2006E 2007E 2008ERevenues (PLNm) 546.3 685.8 813.7 1,030.6 1,236.1EBITDA (PLNm) 71.8 86.1 99.5 136.0 170.5EBIT (PLNm) 52.7 59.2 64.0 92.5 117.3Net profit (PLNm) 42.2 40.6 45.1 69.1 90.4EPS (PLN) 24.75 23.84 26.48 40.56 53.09CEPS (PLN) 35.99 39.61 47.33 66.07 84.30BVPS (PLN) 112.02 136.45 165.91 200.27 239.35P/E (x) 30.1 31.3 28.1 18.4 14.0P/CE (x) 20.7 18.8 15.7 11.3 8.8P/BV (x) 6.7 5.5 4.5 3.7 3.1EV/Sales (x) 2.5 2.0 1.7 1.3 1.1EV/EBITDA (x) 19.2 16.0 13.9 10.1 8.1
Shareholder structure (shares): M. Piechocki (CEO) 16.55%, J. Lubianec (Chairman of the Supervisory Board) 14.46%, Grangefont Limited 20.55%, Commercial Union OFE BPH CU WBK 9.17%
Investment case: Despite unfavourable weather conditions, LPP managed to deliver strong December sales of PLN 116m, up 35% YoY. Importantly, a solid top line was accompanied by a record-high gross margin of 61%. Consequently, we see upside potential to management’s earnings forecast for FY 2006 and believe the probability of growth dynamics and margin recovery in the coming quarters has improved. LPP is currently trading at P/E of 18x and 14x for 2006 and 2007, respectively, in line with CCC and its European peers. On the back of the minor forecast upgrade and cuts in the risk free rate from 5.5% to 5.25% and ERP from 5.0% to 4.5%, we are increasing our target price for LPP by 10% to PLN 770/share and upgrading the stock from Sell to HOLD.
Recent developments: LPP recorded strong December sales data of PLN 116m, implying 35% YoY growth dynamics. Importantly, unlike the previous year, strong sales were not made at the expense of profitability. Therefore, we believe that the probability of growth dynamics and margins recovery in the coming quarters has improved. Consequently, we have upped our revenues forecasts by 6.9% to PLN 1,030.6m in 2007 and 7.5% to PLN 1.236.1m in 2008. At the bottom line, our upgrade was smaller – we raised our forecasts by 0.9% to PLN 69.1m in 2007 and 2.3% to PLN 90.4m in 2008.
4Q Results preview and outlook: After a disappointing year, we believe, LPP results picked up in 4Q. The company has already reported sales of PLN 286m (up 35% YoY) and gross profit of PLN 175m (up 52% YoY). On operating profit and bottom line levels, we expect LPP to report PLN 68m (up 181% YoY) and PLN 49m (up 183% YoY), respectively. Consequently, we expect LPP to beat management’s FY 2006 earnings forecast of PLN 42m.
Valuation: Since we downgraded LPP to Sell on 27 October the stock has dropped by 9%, underperforming the WIG index by 9%. LPP is currently trading at P/E of 18.4x for 2007 and 14.0x for 2008, in line with CCC and the European peers’ median. Following a minor forecast upgrade and cuts in the risk free rate from 5.5% to 5.25% and ERP from 5.0% to 4.5%, we are increasing our target price for LPP by 10% to PLN 770/share and upgrading the stock from Sell to HOLD.
LPP Retail Poland
PLN 745 Hold (Upgrade from Sell)
Target price: PLN 770 (Previously: PLN 700)
WIG index 49,560 # of shares 1.7m MCAP PLN 1,269m US$ 426m Free float PLN 876m US$ 294m LPPP.WA / LPP PW
450
550
650
750
850
Jan-06 May-06 Sep-06 Jan-07
LPP
50
70
90
110
130
150
Jan-06 May-06 Sep-06 Jan-07
LPP WIG
(Rebased to 100)
Analyst Łukasz Wachełko Tel. +48 22 520 9965 [email protected] http://research.ca-ib.com
There’s light in the tunnel. Up to HOLD.
11 January 2007
Company Update

LPP January 2007
90
Table 160: LPP: 4Q 2006 Results preview
4Q 2006E 4Q 2005 Ch. % FY 2006E FY 2005 Ch. %Revenues 285.7 212.5 34.4 813.7 685.8 18.6EBIT 67.5 24.0 181.1 64.0 59.2 8.1Net profit 48.9 17.3 182.7 45.1 40.6 11.1
Source: LPP, CA IB estimates
Table 161: LPP: Earnings statement
PLNm 2005 2006E 2007E 2008ERevenues 685.8 813.7 1,030.6 1,236.1COGS 311.7 368.7 473.1 561.0Gross profit 374.2 445.0 557.5 675.0SG&A 313.2 381.0 465.0 557.7EBITDA 86.1 99.5 136.0 170.5Depreciation 26.9 35.5 43.5 53.2EBIT 59.2 64.0 92.5 117.3Net financials (6.7) (8.3) (7.2) (5.6)Pre-tax profit 52.6 55.7 85.3 111.7Tax 11.9 10.6 16.2 21.2Net profit 40.6 45.1 69.1 90.4
Source: LPP, CA IB estimates
Table 162: LPP: Cash flow statement
PLNm 2005 2006E 2007E 2008ECash flow from operations 47.5 65.2 49.3 147.9Cash flow from investment (93.8) (58.0) (80.9) (49.7)Cash flow from financing 58.2 5.1 (10.6) (93.9)Net change in cash 11.9 12.2 (42.1) 4.3Beginning cash 15.5 27.4 39.6 (2.5)Ending cash 27.4 39.6 (2.5) 1.8
Source: LPP, CA IB estimates
Table 163: LPP: Balance sheet
PLNm 2005 2006E 2007E 2008ECurrent assets 239.3 257.1 317.4 305.4Fixed assets 190.6 224.0 263.7 262.4Long-term deferred charges 4.8 7.8 9.9 11.8Total assets 434.7 488.9 590.9 579.6Current liabilities 185.2 190.5 232.7 153.7Deferred income 0.1 0.6 0.8 1.0Long-term liabilities 11.0 11.0 11.0 11.0Provisions 6.0 4.1 5.2 6.2Equity 232.5 282.6 341.2 407.7Total liabilities and equity 434.7 488.9 590.9 579.6Net debt (cash) 110.2 98.0 140.1 65.8
Source: LPP, CA IB estimates
Table 164: LPP: Key ratios
PLNm 2005 2006E 2007E 2008EEBITDA margin (%) 12.6 12.2 13.2 13.8EBIT margin (%) 8.6 7.9 9.0 9.5Net margin (%) 5.9 5.5 6.7 7.3Net debt (cash)/equity (%) 47.4 34.7 41.1 16.1ROE (%) 19.2 17.5 22.2 24.2
Source: LPP, CA IB estimates

Please note that the information at the back forms an integral part of this report.
2004 2005 2006E* 2007E 2008ERevenues (PLNm) 1,527 1,687 3,637 4,179 4,399EBIT (PLNm) 31.2 44.7 57.8 73.2 84.3EBITDA (PLNm) 48.8 70.2 92.7 112.5 125.6Net profit (PLNm) 22.1 32.6 45.1 58.8 69.8EPS (PLN) 0.18 0.26 0.35 0.46 0.54CEPS (PLN) 0.33 0.49 0.63 0.77 0.87BVPS (PLN) 1.1 1.4 1.3 1.6 1.9P/E (x) 41.4 28.8 20.8 16.0 13.5P/CE (x) 22.0 14.9 11.7 9.6 8.5P/BV (x) 6.6 5.3 5.7 4.7 3.9EV/Sales (x) 0.58 0.52 0.24 0.21 0.20EV/EBITDA (x) 18.1 12.5 9.5 7.8 7.1Dividend yield (%) 0.0 5.9 2.4 3.1 3.7
Shareholder structure: Politra 55.0%, Charlemagne Capital 5.08%, ING NN OFE 5.17% * Note: KDWT pro forma consolidation for FY 2006; Carment consolidation in 2H 2006
Investment case: Despite a strong M&A pipeline, the recent months saw no acquisitions for Eurocash. Moreover, 3Q 2006 results came in below our expectations. Consequently, we have cut our earnings forecasts for the company by 8% in 2006, 8% in 2007 and 7% in 2008. On our updated estimates, Eurocash is trading at P/E of 16x for 2007 and 14x for 2008, 4% and 12% below its multinational peers’ average, respectively. We are rolling our 12-month target price for Eurocash upward, from PLN 7.95/share to PLN 8.0/share. Following the recent correction, our updated target price offers moderate 9% upside potential. We maintain our HOLD recommendation on the stock.
4Q 2006 Results and outlook: On the back of the consolidation of KDWT and Carment, we expect Eurocash to have more than doubled revenues to ca. PLN 1.1bn in 4Q 2006. Below the top line, we are looking for 45% growth in EBIT to PLN 20m and a 73% increase in earnings dynamics to PLN 16m.
Valuation: Eurocash is trading at P/E of 16.0x and 13.5x for 2007 and 2008, implying discounts of 3.8% and 11.8% to its multinational peers’ average, respectively. We are rolling our 12-month target price for the stock up, from PLN 7.95/share to PLN 8.0/share. Our updated target price offers moderate 8.8% upside potential and yields a HOLD recommendation. Our optimism towards the stock would be revived were the company to announce a sizable and value accretive acquisition.
Eurocash Wholesale Poland
PLN 7.35 Hold
Target price: PLN 8.00 (Previously: PLN 7.95)
WIG index 49,560 # of shares 127.7m MCAP PLN 939m US$ 315m Free float PLN 423m US$ 142m ERCS.WA / EUR PW
5.0
6.0
7.0
8.0
9.0
10.0
Jan-06 May-06 Sep-06 Jan-07
Eurocash
80
100
120
140
160
Jan-06 May-06 Sep-06 Jan-07
Eurocash WIG
(Rebased to 100)
Analyst Łukasz Wachełko Tel. +48 22 520 9965 [email protected] http://research.ca-ib.com
All’s quiet on the M&A front
11 January 2007
Company Update

Eurocash January 2007
92
Table 165: Eurocash: 4Q 2006 Results preview
4Q 2006E 4Q 2005 Ch. %FY 2006E FY 2005 Ch. %Revenues 1,068.3 420.4 154.1 3,636.5 1,687.1 115.5EBIT 19.6 13.5 44.6 57.8 44.7 29.4Net profit 15.6 9.0 73.2 45.1 32.6 38.2
Source: Eurocash, CA IB estimates
Table 166: Eurocash: Earnings statement
PLNm 2004 2005 2006E 2007E 2008ENet revenue 1,526.5 1,687.1 3,636.5 4,179.2 4,398.7COGS 1,328.5 1,456.7 3,307.6 3,796.7 3,995.2Gross profit 198.0 230.5 328.9 382.4 403.5SG&A 154.6 179.3 259.7 297.1 306.7EBITDA 48.8 70.2 92.7 112.5 125.6Depreciation 17.6 25.6 35.0 39.4 41.4EBIT 31.2 44.7 57.8 73.2 84.3Net financials (3.7) (3.0) (2.1) (0.5) 1.9Pre-tax profit 27.5 41.7 55.7 72.6 86.1Tax 5.4 9.1 10.6 13.8 16.4Net profit 22.1 32.6 45.1 58.8 69.8
Source: Eurocash, CA IB estimates
Table 167: Eurocash: Cash flow statement
PLNm 2004 2005 2006E 2007E 2008ECash flow from operations 29.1 90.6 106.5 114.1 117.6Cash flow from investment (78.8) (29.5) (91.7) (19.0) (17.0)Cash flow from financing (18.2) 1.7 (55.4) (22.5) (29.4)Net change in cash (69.8) 65.1 (40.7) 72.5 71.2Beginning cash 103.7 33.9 99.0 58.4 130.9Ending cash 33.9 99.0 58.4 130.9 202.0
Source: Eurocash, CA IB estimates
Table 168: Eurocash: Balance sheet
PLNm 2004 2005 2006E 2007E 2008ECurrent assets 187.0 259.9 451.3 581.9 676.5 Fixed assets 178.6 180.6 236.8 216.4 192.0 Long-term deferred charges 1.6 1.5 1.5 1.5 1.5 Total assets 367.1 442.0 689.6 799.8 870.0 Current liabilities 211.0 246.8 505.3 579.2 609.1 Long-term liabilities 13.5 19.1 18.5 18.5 18.5 Provisions 0.0 0.4 0.4 0.4 0.4 Equity 142.7 175.8 165.5 201.8 242.1 Total liabilities and equity 367.1 442.0 689.6 799.8 870.0 Net debt (cash) (29.5) (93.0) (52.3) (124.8) (196.0)
Source: Eurocash, CA IB estimates
Table 169: Eurocash: Key ratios
PLNm 2004 2005 2006E 2007E 2008EEBITDA margin (%) 3.2 4.2 2.6 2.7 2.9EBIT margin (%) 2.0 2.6 1.6 1.8 1.9Net margin (%) n.m. 1.9 1.2 1.4 1.6Net debt (cash)/equity (%) (20.7) (52.9) (31.6) (61.9) (80.9)ROE (%) 17.1 20.5 26.4 32.0 31.4
Source: Eurocash, CA IB estimates

Please note that the information at the back forms an integral part of this report.
2004 2005 2006E 2007E 2008ERevenues 1,112.6 1,169.3 1,313.1 1,434.0 1,786.1Adj. Revenues 813.6 915.5 1,104.0 1,434.0 1,786.1EBITDA 72.4 132.8 121.8 123.6 150.7Adj. EBITDA 60.6 69.6 96.8 119.9 145.2EBIT 44.8 75.5 81.4 76.3 95.6Adj. EBIT 33.1 37.2 57.1 73.8 91.9Net profit 26.3 60.8 63.0 59.8 76.2Adj. Net profit 13.4 25.4 40.1 55.1 70.2EPS (PLN) 0.24 0.56 0.62 0.59 0.75Adj. EPS (PLN) 0.12 0.23 0.39 0.54 0.69P/E (x) 54.4 23.5 22.7 23.9 18.8Adj. P/E (x) 103.2 54.5 32.2 23.4 18.4EV/EBITDA (x) 19.5 10.6 11.6 11.4 9.4Adj. EV/EBITDA (x) 21.0 18.3 13.1 10.6 8.8
Shareholder structure: Eastbridge 68.5%
Investment case: Empik Media and Fashion (EM&F) is the unquestioned leader on the Polish lifestyle retail market with exposure to Germany and Ukraine. As such, we find EM&F to be one of the best plays on the strength of the Polish economy and booming consumption. Based on the company’s strategy to double its shop floor space by 2008, we expect EM&F to achieve 2006E-2008E CAGR of 25% in adjusted sales and 44% in adjusted EPS. EM&F is currently trading at adjusted 2007E P/E of 23x, 24% above its Polish peers’ average and 31% above its foreign peers’ median. However, we find these premiums partially justified by the company’s superior growth potential. With our 12-month target price for EM&F of PLN 14.5/share, the stock offers 3.6% upside potential, thus yielding a HOLD recommendation.
Recent developments: In December 2006, in line with earlier announcements, the company finalised two acquisitions. EM&F already operates a Smyk store in Berlin; it has now purchased a 65% stake in Bukva, one of the largest chains of bookstores in Ukraine (for US$ 6.38m) and a 65% stake in Ukrainian Paritet Servis Retail, which operates two children’s stores under the Kinderland brand (for US$ 5.0m).
4Q Results preview and outlook: We expect EM&F to report strong 4Q 2006 results. We forecast the company will deliver 15.2% YoY revenues growth to PLN 608.9m. On the operating and bottom lines, we expect EM&F to report PLN 60.5m, up 63.3% YoY, and PLN 53.1m, up 1.6% YoY, respectively.
Valuation: EM&F is currently trading at adjusted P/E of 32.2x for 2006 and 23.4x for 2007, 18.8% and 23.7% above the average of its Polish retail peers, respectively. The stock looks cheaper on an adjusted EV/EBITDA basis, trading at 13.1x for 2006 and 10.6x for 2007 with modest discounts of 2-3%. We reiterate our HOLD rating and our target price of PLN 14.50 for the stock.
NFI EMPiK Media & Fashion Retail Poland
PLN 14.00 Hold
Target price: PLN 14.50
WIG index 49,560 # of shares 102.1m MCAP PLN 1,430m US$ 480m Free float PLN 450m US$ 151m NFIWo.WA / EMF PW
6.0
8.0
10.0
12.0
14.0
16.0
18.0
Jan-06 May-06 Sep-06 Jan-07
NFI Empik
80
120
160
200
240
Jan-06 May-06 Sep-06 Jan-07
NFI Empik WIG
(Rebased to 100)
Analyst Łukasz Wachełko Tel. +48 22 520 9965 [email protected] http://research.ca-ib.com
Keep up the style
11 January 2007
Company Update

NFI EMPiK Media & Fashion January 2007
94
Table 170: EM&F: 4Q 2006 Results preview
PLNm 4Q 2006E 4Q 2005 Ch. % FY 2006E FY 2005 Ch. %Revenues 608.9 528.7 15.2 1,313.1 1,169.3 12.3EBIT 60.5 37.1 63.3 81.4 75.5 7.8Net profit 53.1 52.2 1.6 63.0 60.8 3.5
Source: EM&F, CA IB estimates
Table 171: EM&F: Earnings statement
PLNm 2004 2005 2006E 2007E 2008ERevenues 1,112.6 1,169.3 1,313.1 1,434.0 1,786.1COGS 676.2 695.2 779.0 839.4 1,033.1Gross profit 436.4 474.1 534.1 594.6 753.0SG&A 379.8 360.4 430.3 518.3 657.3EBITDA 72.4 132.8 121.8 123.6 150.7Depreciation 27.6 57.4 40.4 47.4 55.1EBIT 44.8 75.5 81.4 76.3 95.6Net financials (1.6) (0.8) (4.7) (5.3) (5.1)Pre-tax profit 43.1 76.8 80.7 76.7 98.0Tax 12.2 15.8 17.1 15.9 20.0Net profit 26.3 60.8 63.0 59.8 76.2
Source: EM&F, CA IB estimates
Table 172: EM&F: Cash flow statement
PLNm 2004 2005 2006E 2007E 2008ECash flow from operations 55.1 79.0 86.4 89.0 109.9Cash flow from investment 12.4 (35.0) (94.1) (90.2) (68.2)Cash flow from financing (32.2) (0.6) 0.7 1.0 1.7Net change in cash 33.2 42.9 (6.9) (0.3) 43.4Beginning cash 53.2 86.4 129.3 122.4 122.1Ending cash 86.4 129.3 122.4 122.1 165.5
Source: EM&F, CA IB estimates
Table 173: EM&F: Balance sheet
PLNm 2004 2005 2006E 2007E 2008ECurrent assets 355.3 438.1 468.3 496.3 627.3Fixed assets 259.0 325.1 394.3 450.3 501.7Long-term deferred charges 3.0 5.7 6.4 7.0 8.7Total assets 617.3 768.9 869.0 953.6 1,137.7Current liabilities 290.6 425.1 460.3 482.9 585.7Deferred income 4.6 11.2 12.6 13.8 17.2Long-term liabilities 79.4 75.9 75.9 75.9 75.9Equity 242.7 256.6 320.3 381.1 459.0Total liabilities and equity 617.3 768.9 869.0 953.6 1,137.7Net debt (cash) (3.2) (18.3) (11.4) (11.1) (54.6)
Source: EM&F, CA IB estimates
Table 174: EM&F: Key ratios
PLNm 2004 2005 2006E 2007E 2008EEBITDA margin (%) 6.5 11.4 9.3 8.6 8.4EBIT margin (%) 4.0 6.5 6.2 5.3 5.4Net margin (%) n.m. 5.2 4.8 4.2 4.3Net debt (cash)/equity (%) (1.3) (7.1) (3.6) (2.9) (11.9)ROE (%) n.m. 24.4 21.8 17.0 18.1
Source: EM&F, CA IB estimates

Please note that the information at the back forms an integral part of this report.
2004 2005 2006E 2007E 2008ERevenues (US$m) 580.7 749.4 957.5 1,015.1 1,070.0EBITDA (US$m) 31.8 55.9 109.1 121.5 132.6EBIT (US$m) 28.4 51.6 99.5 108.8 119.0Net profit (US$m) 21.8 20.3 49.8 61.7 71.8EPS (US$) 1.31 0.77 1.40 1.61 1.88CEPS (US$) 1.51 0.94 1.66 1.95 2.23BVPS (US$) 7.20 14.32 12.24 15.77 18.23P/E (x) 23.2 39.1 21.7 18.8 16.1P/CE (x) 20.1 32.3 18.2 15.6 13.5P/BV (x) 4.2 2.1 2.5 1.9 1.7EV/Sales (x) 2.6 2.0 1.6 1.5 1.4EV/EBITDA (x) 48.2 27.4 14.1 12.6 11.6
Shareholder structure: W. V. Carey 11.0%, CEDC 7.1%, Remy Cointreau 7.1%, MSIM 6.2%, Charlemagne Capital 7.0%, Perry Corp. 6.2%
Investment case: CEDC debuted on the Warsaw Stock Exchange offering 2.55m shares at US$ 30 each (total value of US$ 76.5m). However, as CEDC managed to buy a mere 2.8% stake in Polmos Bialystok (of the 34.0% tendered), the management decided to use the raised capital mainly to redeem US$ 55.9m of its high-yield bonds. In line with our expectations, together with a WSE listing, CEDC re-rated to multiples of Polish peers. CEDC is currently trading at 2007 P/E of 18.8x, in line with the domestic industry average. We roll our 12-month target price for CEDC up from US$ 31.8/share to US$ 33.0/share. However, following a recent rally, the company has exhausted its upside potential, in our view. Consequently, we downgrade the stock from Buy to HOLD.
Recent developments: Under pressure from minority shareholders, CEDC increased its tender price for Polmos Bialystok from PLN 85.25/share to PLN 91/share. However, even at the boosted price, CEDC managed to purchase only a 2.8% stake of the 34.0% tendered. Interestingly, despite holding only a 68.8% stake in the vodka maker, CEDC intends to call an EGM to decide on Polmos Bialystok’s delisting from the stock market. Given the 80% threshold requirement, we believe that the probability of success of this attempt is relatively slim.
4Q 2006 Results and outlook: We believe 4Q 2006 should bring another decent set of quarterly results. On the back of the consolidation of Polmos Lublin and Bols, we expect the company’s top line to expand 26% YoY to ca. US$ 310m. Below the top line, we expect CEDC to deliver EBIT of US$ 39m (up 38% YoY) and earnings of US$ 26m (up 120% YoY).
Valuation: CEDC is trading at P/E of 18.8x for 2007, in line with Polish peers’ average. We have rolled our DCF SOTP 12-month target price for CEDC up from US$ 31.8/share to US$ 33.0/share, implying moderate upside potential of 9.0%. As we believe the re-rating has already taken place, we downgrade CEDC from Buy to HOLD.
CEDC Food & Beverages Poland
US$ 30.28 Hold (Downgrade from Buy)
Target price: US$ 33.0 (Previously: US$ 31.8)
NASDAQ index 2,434 # of shares 35.7m MCAP US$ 1,080m PLN 3,218m Free float US$ 808m PLN 2,407m CEDC.O / CEDC US
20
22
24
26
28
30
32
Jan-06 May-06 Sep-06 Jan-07
CEDC
80
90
100
110
120
Jan-06 May-06 Sep-06 Jan-07
CEDC Nasdaq
(Rebased to 100)
Analyst Łukasz Wachełko Tel. +48 22 520 9965 [email protected] http://research.ca-ib.com
Re-rating delivered
11 January 2007
Company Update

CEDC January 2007
96
Table 175: CEDC: 4Q 2006 Results preview
US$m 4Q 2006E 4Q 2005 Ch. % FY 2006E FY 2005 Ch. %Revenues 311.4 247.6 25.8 957.5 749.4 27.8EBIT 38.9 28.2 37.9 99.5 51.6 92.7Net profit 26.4 12.1 119.0 49.8 20.3 145.7
Source: CEDC, CA IB estimates
Table 176: CEDC: Earnings statement
US$m 2004 2005 2006E 2007E 2008ENet revenue 580.7 749.4 957.5 1,015.1 1,070.0COGS 506.4 627.4 723.5 763.8 805.2Gross profit 74.3 122.0 234.0 251.3 264.9SG&A 41.8 70.4 122.6 127.4 129.7EBITDA 31.8 55.9 109.1 121.5 132.6Depreciation 3.4 4.3 9.6 12.7 13.6EBIT 28.4 51.6 99.5 108.8 119.0Net financials (1.9) (23.8) (29.1) (22.9) (20.1)Pre-tax profit 26.4 27.9 70.4 85.9 98.9Tax 4.6 5.3 13.4 16.3 18.8Minority interest 0.0 2.3 7.2 7.9 8.4Net profit 21.8 20.3 49.8 61.7 71.8
Source: CEDC, CA IB estimates
Table 177: CEDC: Cash flow statement
US$m 2004 2005 2006E 2007E 2008ECash flow from operations 8.9 34.1 106.7 99.7 111.2Cash flow from investment (9.3) (460.1) (27.8) (12.5) (18.1)Cash flow from financing 0.6 476.4 (3.7) 43.3 8.9Net change in cash 0.2 50.4 75.2 130.5 102.0Beginning cash 6.2 10.5 60.9 136.1 266.6Ending cash 10.5 60.9 136.1 266.6 368.6
Source: CEDC, CA IB estimates
Table 178: CEDC: Balance sheet
US$m 2004 2005 2006E 2007E 2008ECurrent assets 218.3 351.5 472.0 620.5 731.6Fixed assets 71.7 673.1 703.1 706.2 713.1Long-term deferred charges 1.7 2.3 2.7 1.1 1.1Total assets 291.7 1,024.7 1,175.1 1,326.7 1,444.7Current liabilities 166.0 252.6 330.4 346.3 359.2Deferred income 0.0 3.0 3.3 3.3 3.4Long-term liabilities 4.0 369.0 369.1 326.5 326.5Provisions 1.4 12.9 22.7 33.6 44.1Equity 120.3 374.9 436.4 602.5 696.5Total liabilities and equity 291.7 1,024.7 1,175.1 1,326.7 1,444.7Net debt (cash) 32.0 330.8 260.7 91.7 (2.0)
Source: CEDC, CA IB estimates
Table 179: CEDC: Key ratios
US$m 2004 2005 2006E 2007E 2008EEBITDA margin (%) 5.5 7.5 11.4 12.0 12.4EBIT margin (%) 4.9 6.9 10.4 10.7 11.1Net margin (%) 3.8 2.7 5.2 6.1 6.7Net debt (cash)/equity (%) 26.6 88.2 59.7 15.2 (0.3)ROE (%) 8.8 5.3 9.6 9.5 9.6
Source: CEDC, CA IB estimates

Please note that the information at the back forms an integral part of this report.
2004 2005 2006E 2007E 2008ERevenues (PLNm) 568.5 625.0 721.3 749.6 779.2EBITDA (PLNm) 18.4 38.0 41.4 45.0 46.1EBIT (PLNm) 2.7 21.8 24.3 27.1 27.5Net profit (PLNm) (1.5) 20.4 20.3 22.0 22.4EPS (PLN) (0.10) 1.36 1.35 1.46 1.49CEPS (PLN) 0.94 2.43 2.49 2.65 2.72BVPS (PLN) 13.38 14.79 15.45 16.06 16.58DPS (PLN) 0.34 0.68 0.67 0.98 0.99P/E (x) n.m. 17.0 17.1 15.7 15.5P/CE (x) 24.4 9.4 9.3 8.7 8.4P/BV (x) 1.7 1.6 1.5 1.4 1.4EV/Sales (x) 0.5 0.4 0.4 0.4 0.4EV/EBITDA (x) 15.2 7.3 6.7 6.2 6.1Dividend yield (%) 1.5 2.9 2.9 4.2 4.3
Shareholder structure: Grzegorz Dzik (CEO Impel Cleaning) 33.50%, Jozef Biegaj (CEO of Impel Security) 25.27%, ML IM 7.79%, Pioneer IM 7.14%
Investment case: Our investment story of Impel as a real estate play appears to be materialising. On 12 December 2006 Impel entered into a joint venture with developer BNM 3 to construct 350 flats on a 0.5ha plot in the centre of Wroclaw. Importantly, the remaining Impel landbank of 6.2ha allows for the construction of an additional 4,300 flats. Were their developing activity a going concern, and aggressively assuming Dom Development’s valuation per flat as a benchmark, we would arrive at a valuation of PLN 1bn for Impel, triple the current level. However, given that Impel has no experience in the real estate business, we conservatively continue to base the valuation of the company on the plot value estimate. Following the recent rally, our updated 12-month target price of PLN 24.9/share offers only 8% upside potential. We downgrade the stock from Buy to HOLD.
Recent developments: On a positive note, in late December 2006, the Polish government drafted new legislation on protected labour enterprises, which maintains the existing subsidies for disabled employees at current levels. Moreover, in the past three months, Impel has intensified its M&A activity, acquiring two companies and setting up three enterprises. On the corporate front, management board member Mr. Slawomir Borkowski left the company on 15 December citing personal reasons.
4Q Results preview and outlook: We expect Impel to show strong reported results after 4Q 2006. We expect the company to deliver 14% YoY growth in revenues to PLN 145m. Below the top line we anticipate profitability expansion driven by the one-off real estate disposal contributing ca. PLN 5m to the bottom line. Consequently, at the reported level we are looking for 290% EBIT growth to PLN 12.6m and a net profit jump of 140% to PLN 9.9m. On a one-off adjusted level, the dynamics decline to ca. 100% and 20%, respectively.
Valuation: Impel trades at reasonable earnings multiple of 15.7x and EV/EBITDA of 6.2x for 2007. In light of continued pressure on the profitability of Impel’s core business, we have cut our earnings forecast for the company by 8.4% in 2006 and 6.4% in 2007. However, the reduction in ERP and risk free rate assumptions outweighed this negative impact on our target price, which inched upwards from PLN 24.5/share to PLN 24.9/share. With only 8.5% upside potential left, we downgrade the stock from Buy to HOLD. However, any continued real estate rally in Poland and the successful completion of the company’s development projects may create ample upside to our valuation.
Impel Support Services Poland
PLN 23.0 Hold (Downgrade from Buy)
Target price: PLN 24.9 (Previously: PLN 24.5)
WIG index 49,560 # of shares 15m MCAP PLN 346m US$ 116m Free float PLN 143m US$ 48m IMPL.WA / IPL PW
11
13
15
17
19
21
23
25
Jan-06 May-06 Sep-06 Jan-07
Impel
80
100
120
140
160
Jan-06 May-06 Sep-06 Jan-07
Impel WIG
(Rebased to 100)
Analyst Łukasz Wachełko Tel. +48 22 520 9965 [email protected] http://research.ca-ib.com
Down to HOLD on price performance
11 January 2007
Company Update

Impel January 2007
98
Table 180: Impel: 4Q 4006 Results preview
4Q 2006E 4Q 2005 Ch. %FY 2006E FY 2005 Ch. %Revenues 145.4 127.3 14.2 721.3 625.0 15.4EBIT 12.6 3.2 289.2 24.3 21.8 11.5Net profit 9.9 4.1 141.0 20.3 20.4 (0.5)
Source: Impel, CA IB estimates
Table 181: Impel: Earnings statement
PLNm 2004 2005 2006E 2007E 2008ENet revenue 568.5 625.0 721.3 749.6 779.2Subsidiaries 67.0 54.1 50.0 40.0 33.0COGS 544.2 576.1 655.1 676.8 702.0Gross profit 24.3 48.9 66.2 72.8 77.3SG&A 77.4 85.4 98.2 102.1 106.1EBITDA 18.4 38.0 41.4 45.0 46.1Depreciation 15.7 16.2 17.1 17.9 18.6EBIT 2.7 21.8 24.3 27.1 27.5Net financials 2.7 2.0 0.7 1.1 1.1Pre-tax profit 5.4 23.8 25.0 28.2 28.6Minorities (1.0) (0.7) (0.7) (0.8) (0.8)Tax 5.9 2.7 4.0 5.4 5.4Net profit (1.5) 20.4 20.3 22.0 22.4
Source: Impel, CA IB estimates
Table 182: Impel: Cash flow statement
PLNm 2004 2005 2006E 2007E 2008ECash flow from operations 8.4 18.7 23.0 36.3 37.1Cash flow from investment (38.5) (17.8) 4.7 (21.0) (19.5)Cash flow from financing (53.7) (2.0) (13.3) (12.9) (14.6)Net change in cash (83.8) (1.1) 14.4 2.3 3.1Beginning cash 156.6 72.8 71.7 86.1 88.4Ending cash 72.8 71.7 86.1 88.4 91.5
Source: Impel, CA IB estimates
Table 183: Impel: Balance sheet
PLNm 2004 2005 2006E 2007E 2008ECurrent assets 226.8 232.4 268.6 277.3 287.1Fixed assets 98.9 105.9 94.3 100.4 104.4Long-term deferred charges 11.1 12.7 14.7 15.3 15.9Total assets 336.8 351.0 377.6 393.0 407.4Current liabilities 113.0 111.3 124.9 129.8 134.9Deferred income 14.5 12.0 13.8 14.4 15.0Long-term liabilities 3.6 2.7 2.7 2.7 2.7Provisions 3.5 2.3 2.6 2.7 2.8Equity 201.2 222.4 232.4 241.5 249.3Minority Interest 0.9 0.4 1.1 1.9 2.7Total liabilities and equity 336.8 351.0 377.6 393.0 407.4Net debt (cash) (62.2) (66.8) (84.2) (86.5) (89.6)
Source: Impel, CA IB estimates
Table 184: Impel: Key ratios
PLNm 2004 2005 2006E 2007E 2008EEBIT margin (%) 0.5 3.5 3.4 3.6 3.5Net margin (%) n.m. 3.3 2.8 2.9 2.9Subsidies/net sales (%) 11.8 8.7 6.9 5.3 4.2Net debt (cash)/equity (%) (30.9) (30.1) (36.2) (35.8) (36.0)ROE (%) n.m. 9.6 8.9 9.3 9.1
Source: Impel, CA IB estimates

Please note that the information at the back forms an integral part of this report.
2004 2005 2006E 2007E 2008ERevenues (PLNm) 943.0 996.4 1,076.3 1,262.3 1,394.9EBITDA (PLNm) 205.3 265.9 257.5 318.9 368.4EBIT (PLNm) 76.4 135.7 119.7 180.8 239.2Net profit (PLNm) 60.2 97.8 94.3 145.4 197.0EPS (PLN) 1.31 2.12 2.05 3.16 4.28BVPS (PLN) 34.32 36.09 37.73 41.49 46.20Adj. P/E (x) 120.6 188.2 43.9 28.1 19.7P/CE (x) 15.8 13.1 12.9 10.6 9.2P/BV (x) 1.9 1.8 1.7 1.6 1.4EV/Sales (x) 3.4 3.2 3.0 2.6 2.3Adj. EV/EBITDA (x) 20.0 19.6 14.3 11.9 10.3Dividend yield (%) 0.5 0.5 0.5 0.8 1.1
Shareholder Structure: Accor 40.6^%, BZ WBK AIB 14.2%, ING OFE 5.9%, CU OFE 5.1%
Investment case: Orbis shares have risen 36.5% in 4Q 2006 driven by a solid improvement in operating performance revealed in 3Q 2006 figures (RevPar up 12.4% YoY) as well as by property disposal (Hotel Monopol) which partially exposed the hidden value in Orbis’ premises. With the fundamentals of the hotel industry improving (i.e. increased domestic and business traffic in Orbis’ hotels) and the Polish market now experiencing the beginning of an upswing in the RevPar cycle, we’re upgrading our recommendation for Orbis to PLN 67, and reiterating our HOLD recommendation.
Recent developments: In December 2006, the company sold Hotel Monopol, a 62-room hotel in Wroclaw. While the value of the transaction has not been made public, following the sale, the company increased its FY 2006 hotel segment EBITDA forecast to PLN 223m from PLN 191m, implying PLN 32m in profit on the disposal.
4Q 2006 Preview and outlook: We expect these favourable trends to continue in 4Q 2006, leading to a 15% increase in revenues to PLN 251.2m. Furthermore, the reported EBITDA is likely to be boosted by the PLN 32m in profits on the disposal of the aforementioned Monopol Hotel. While we are expecting reported EBITDA of PLN 73m, excluding the effect of the property disposal, this figure would be PLN 41.6m (up 36% YoY). On the bottom line, we are expecting PLN 34.3m in net profit. The outlook for 2007 looks encouraging. With Poland enjoying the upswing of the RevPar cycle according to Jones Lang LaSalle and with the support of the introduction of yield management policies in Orbis’ hotels, we are now expecting an on average 11% increase in Orbis’ RevPar in the next three years.
Valuation: We are increasing our target price to PLN 67 per share, based on three factors: 1) forecast upgrade following the upside presented by the recent property disposal and an improvement in operating performance, 2) the change in risk free rate and ERP, 3) as well as the rolling upwards of our target price. Orbis is trading at 2007E adjusted for disposals EV/EBITDA of 11.9x, broadly in line with Western European hotel operators.
Orbis Hotel and Leisure Poland
PLN 65.05 Hold
Target price: PLN 67 (Previously: PLN 51.6)
WIG index 49,560 # of shares 46.1m MCAP PLN 3.0bn US$ 1.8bn Free float PLN 1.0bn US$ 0.6bn ORB PW / ORBS.WA
33
38
43
48
53
58
63
68
Jan-06 May-06 Sep-06 Jan-07
Orbis
90
110
130
150
170
190
Jan-06 May-06 Sep-06 Jan-07
Orbis WIG
(Rebased to 100)
Analysts Marcin Szortyka Tel. +48 22 520 9972 [email protected] Łukasz Wachełko Tel. +48 22 520 9965 [email protected] http://research.ca-ib.com
Riding the RevPar cycle
11 January 2007
Company Update

Orbis January 2007
100
Table 185: Orbis: 4Q 2006 Results preview
PLNm 4Q 2006E 4Q 2005 Ch. YoYRevenues 251.2 218.5 15 EBIT 38.6 3.0 n.m.EBITDA 73.6 30.6 141 Adj. EBITDA 41.6 30.6 36 Net profit 34.3 (0.6) n.a.
Source: Orbis, CA IB estimates
We are expecting a 15% increase in revenues to PLN 251.2m in 4Q 2006. Furthermore, the reported EBITDA is likely to be boosted by the PLN 32m in profits on the disposal of the aforementioned Monopol Hotel. We are expecting reported EBITDA of PLN 73m, while excluding the effect of the property disposal, we would be looking at PLN 41.6m in EBITDA (up 36% YoY). On the bottom line, we are expecting PLN 34.3m in net profit.
Figure 8: Orbis: RevPar growth on the rise
-10.1
-0.9
2.86.7
9.4
1.5
-0.3
-7.6
-0.3
4.42.3
9.6 9.2
4.0
12.6
-15.0
-10.0
-5.0
0.0
5.0
10.0
15.0
1Q 20
03
2Q 20
03
3Q 20
03
4Q 20
03
1Q 20
04
2Q 20
04
3Q 20
04
4Q 20
04
1Q 20
05
2Q 20
05
3Q 20
05
4Q 20
05
1Q 20
06
2Q 20
06
3Q 20
06
Source: Orbis
Table 186: Orbis: Forecast upgrade
2007E 2008E New Old Ch. (%) New Old Ch. (%)Sales 1,262.3 1,156.7 9.1 1,394.9 1,260.5 10.7EBITDA 318.9 260.5 22.4 368.4 295.4 24.7EBIT 180.8 122.5 47.6 239.2 166.1 44.0Net profit 145.4 95.4 52.4 197.0 133.5 47.6
Source: CA IB estimates
We are upgrading our 2007-2008 revenue forecast for Orbis by 10% based on favourable trends in the Polish hospitality industry (increasing RevPar, growing number of business and domestic traffic). Following the PLN 32m increase in Orbis’ forecast after the Hotel Monopol disposal, we are increasing our EBITDA estimates to reflect potential upcoming property divestures. In 2007, Orbis intends to sell, among others, Hotel Beskid in Nowy Sacz, Hotel Silesia in Katowice and a 10,000m2 plot in Warsaw.
Table 187: Orbis: Profit & loss account PLNm 2005E 2006E 2007E 2008ERevenues 996.4 1,076.3 1,262.3 1,394.9COGS 755.8 739.8 792.6 835.1Gross profit 240.6 336.6 469.7 559.8SG&A 205.9 216.9 241.2 265.6EBITDA 265.9 257.5 318.9 368.4Personnel 287.4 285.7 276.8 302.9Depreciation 130.2 137.8 138.1 129.3EBIT 135.7 119.7 180.8 239.2Net financials (9.7) (3.1) (1.0) 4.5Pre-tax profit 126.0 116.6 179.8 243.7Minorities (0.2) (0.2) (0.3) (0.4)Tax 28.0 22.1 34.2 46.3Net profit 97.8 94.3 145.4 197.0
Source: Orbis, CA IB estimates
Table 188: Orbis: Balance sheet summary
PLNm 2005E 2006E 2007E 2008ECurrent assets 216.9 275.7 449.3 778.3Fixed assets 1,939.1 2,007.7 2,115.3 2,093.2Long-term deferred charges 21.4 23.1 27.1 29.9Total assets 2,177.9 2,307.0 2,592.2 2,901.9Current liabilities 171.6 181.9 205.9 223.0Deferred income 0.2 0.2 0.2 0.2Long-term liabilities 273.2 310.7 385.7 451.7Provisions 68.2 73.7 86.4 95.5Equity 1,662.7 1,738.4 1,911.6 2,128.7Minority interest 2.0 2.2 2.4 2.8Total liabilities and equity 2,177.9 2,307.0 2,592.2 2,902.0Net debt (cash) 228.6 212.2 124.9 (130.0)
Source: Orbis, CA IB estimates
Table 189: Orbis: Cash flow summary
PLNm 2005E 2006E 2007E 2008ECash flow from operations 100.3 238.9 299.3 337.7Cash flow from investment (34.8) (203.9) (239.8) (102.9)Cash flow from financing (24.1) 18.9 102.8 86.1Net change in cash 41.4 53.9 162.3 320.9
Source: Orbis, CA IB estimates

Please note that the information at the back forms an integral part of this report.
2004 2005 2006E 2007E 2008ERevenues (US$m) 56.4 95.6 102.8 183.8 355.9 Operating profit (US$m) 49.5 195.8 295.0 281.9 734.3 Net profit (US$m) 36.0 140.1 233.2 194.2 524.5 BV per share (US$) 2.15 2.73 4.25 5.13 7.51NAV per share (US$) n.a. n.a. 4.34 5.31 8.57EPS (US$) 0.18 0.70 1.06 0.88 2.38DPS (US$) 0.00 0.00 0.00 0.00 0.00ROE (%) 10.5 29.2 31.5 18.8 37.7P/BV (x) 6.7 5.3 3.4 2.8 1.9P/NAV (x) n.a. n.a. 3.3 2.7 1.7P/E (x) 79.9 20.7 13.7 16.4 6.1EV/Sales (x) 55.9 32.9 30.6 17.1 8.9EV/EBIT (x) 63.6 16.1 10.7 11.2 4.3 Dividend yield (%) 0.0 0.0 0.0 0.0 0.0
Shareholder structure: GTC RE 46.4%, ING OFE 5.0%, CU OFE 6.0%
Investment case: GTC has been acquiring land for new developments at a rate that has exceeded our expectations. In 4Q 2006 alone, the company has acquired sufficient sites to allow for the development of 105,000m2 (economic ownership of GTC) in Poland, the Czech Republic and Romania, representing ca. 15% of GTC’s total end-2009E leaseable area. We have moved our cut-off date for projects one year forward from 2008 to include 2009 in our valuation, which was the main reason for the increase of our target price to PLN 43. We are upgrading our recommendation for GTC to a HOLD.
Recent developments: In 4Q 2006 GTC acquired two sites in Katowice, the seventh Polish city in which the company has operations, which will allow it to develop 50,000m2 of combined office and residential space. In addition, GTC’s Czech subsidiary (in which GTC holds a 30% stake) purchased a plot of land in Prague for the development of a 120,000m2 shopping and office complex. Furthermore, in Romania, GTC has purchased land for the development of a 25,000m2 shopping mall (a project in which GTC will hold a 75% stake).
4Q 2006 Preview and outlook: We are expecting a softer quarter for GTC in terms of reported earnings, given the disposal of MBP and the lack of new project openings that could boost the bottom line via revaluation gains. We are expecting US$ 26.7m in revenues and US$ 2m in net profit. In 2007 the project that is likely to have the greatest impact on the company’s financials will be Avenue Mall, a 26,000m2 large shopping mall in Zagreb. However, since the revenue from the sale of MBP has been recognised in 2006, we are expecting a decline in GTC’s earnings in 2007 ahead of their explosion in 2008.
Valuation: We have moved our cut-off date for new projects forward by one year to 2009, which – combined with the recently announced projects – was the primary justification for our increase in GTC’s target price to PLN 43. We have also increased our residual capex assumption to US$ 200m (up from US$ 130m), representing the potential for annual development of ca. 100,000m2.
GTC Real estate Poland
PLN 42.2 Hold (Upgrade from Sell)
Target price: PLN 43 (Previously: PLN 35.5)
WIG index 49,560 # of shares 42.0m MCAP PLN 9.3bn US$ 3.2bn Free float PLN 5.0bn US$ 1.7bn GTC PW / GTCA.WA
15
20
25
30
35
40
45
50
Jan-06 May-06 Sep-06 Jan-07
GTC
80
130
180
230
Jan-06 May-06 Sep-06 Jan-07
GTC WIG
(Rebased to 100)
Analyst Marcin Szortyka Tel. +48 22 520 9972 [email protected] http://research.ca-ib.com
Developing above expectations. Upgrade to HOLD.
11 January 2007
Company Update

GTC January 2007
102
Table 190: GTC: 4Q 2006 Results preview
US$m 4Q 2006E 4Q 2005 Ch. YoYRevenues 26.7 27.9 (4.5)Operating profit excluding revaluation
8.5 11.5 (25.7)
Operating profit including revaluation
8.5 76.1 (88.8)
Net profit 2.3 60.2 (96.2)
Source: GTC, CA IB estimates
We are expecting a softer quarter for GTC in terms of reported earnings, given the disposal of MBP and the lack of new project openings that could boost the bottom line via revaluation gains. We are expecting US$ 26.7m in revenues and US$ 2m in net profit.
Table 191: GTC: Forecast change
US$m 2007 2008 New Old Ch. New Old Ch.Revenues 183.8 258.9 (29.0) 355.9 347.6 2.4 Rental 64.4 98.3 (34.5) 131.3 175.8 (25.3) Development 119.4 160.6 (25.7) 224.5 171.8 30.7 Profit excluding. revaluation
83.8 41.1 103.7 122.9 76.7 60.1
Profit including revaluation
281.9 258.7 9.0 734.3 411.8 78.3
Net profit (equity holders)
223.9 191.7 16.8 574.0 299.3 91.8
Source: GTC, CA IB estimates
We are amending our 2007-2008 financial forecasts for GTC. The main changes for the year 2007 are the removal of one quarter of the consolidation of MBP, as well as the incorporation of delays into GTC’s original schedule of completed projects. These revisions result in a 29% decrease in our expected revenues. Our operating profit increase stems mainly from the increased profitability of the residential segment. Having moved part of the projects from 2007 to 2008, as well as having applied lower yields for GTC’s premises, we are upgrading our net profit for GTC 92% to US$ 574m.
Table 192: GTC: Profit & loss account
US$m 2005 2006E 2007E 2008ERevenues from operations 95.6 102.8 183.8 355.9 Rental 70.4 81.1 64.4 131.3 Development 25.2 21.7 119.4 224.5Cost of operations (38.6) (39.2) (119.2) (219.5) Rental (19.4) (23.2) (19.3) (39.4) Development (19.2) (16.0) (99.9) (180.1)Gross margin 57.1 63.6 109.0 166.0Selling expenses (3.5) (3.3) (5.5) (10.7)Administration expenses (7.1) (17.3) (14.7) (28.5)Share based payment (1.9) (3.1) (5.0) (4.0)Revaluation gains 150.9 252.5 198.2 611.4Other income, net 0.3 2.5 0.0 0.0Profit before revaluation 44.9 42.5 83.8 122.9Profit from cont. operations 195.8 295.0 281.9 734.3Foreign currency gain, net (2.5) 7.4 0.0 0.0Financial income, net (15.5) (19.0) (6.4) (21.9)Share of associates 0.5 2.0 4.3 5.2Profit before taxation 178.3 290.5 279.8 717.5Taxation (34.2) (53.7) (56.0) (143.5)Profit for the period 144.1 236.8 223.9 574.0 Equity holders 140.1 233.2 194.2 524.5 Minority interest 3.9 3.7 29.7 49.5
Source: GTC, CA IB estimates
Table 193: GTC: Balance sheet
US$m 2005 2006E 2007E 2008EInvestment property 683 702 1,075 2,420PPE 150 201 409 48Investment in associates 20 21 26 31Other non-current assets 28 19 20 20Non-current assets 881 944 1,529 2,519Inventory 37 93 53 81Other current assets 67 51 51 51Cash and cash equivalents 73 444 285 246Current assets 178 588 389 377Total assets 1,058 1,532 1,919 2,896Total equity 546 936 1,130 1,655Long-term loans 402 422 543 776Deposits from tenants 4 4 3 7Long term payable 1 1 1 1Deferred tax liability 41 86 132 297Long-term liabilities 447 513 679 1,080Trade and other payables 24 43 54 82Short-term loans 20 25 36 52Accruals 5 5 9 18Other 16 10 10 10Current Liabilities 65 83 109 161Total equity and liabilities 1,058 1,532 1,919 2,896
Source: GTC, CA IB estimates

Please note that the information at the back forms an integral part of this report.
2004 2005 2006E 2007E 2008ERevenues (PLNm) 332.1 257.9 339.7 450.0 773.5 Operating profit (PLNm) (24.1) 292.0 400.4 506.5 464.2 Net profit (PLNm) 26.4 194.4 271.5 361.5 303.8 BV per share (PLN) 17.2 22.3 28.8 37.4 44.6NAV per share (PLN) n.a. n.a. 41.2 56.6 80.4EPS (PLN) 0.63 4.63 6.46 8.61 7.23DPS (PLN) 0.00 0.00 0.00 0.00 0.00ROE (%) 3.6 23.4 25.3 26.0 17.6P/BV (x) 5.3 4.1 3.2 2.4 2.0P/NAV (x) n.a. n.a. 2.2 1.6 1.1P/E (x) 144.8 19.7 14.1 10.6 12.6EV/Sales (x) 13.5 17.4 13.2 10.0 5.8EV/EBIT (x) (186.1) 15.4 11.2 8.9 9.7Dividend yield (%) 0.0 0.0 0.0 0.0 0.0
Shareholder structure: Michał Sołowow 41.0%, ING NN OFE 9.9%, PZU OFE 8.8%, CU OFE 7.7%, BZ WBK AIB 5.0%
Investment case: Echo has outperformed the WIG index by 13% in 4Q 2006, supported by strong 3Q 2006 revaluation gains which revealed faster than anticipated property price appreciation. While we’re positive about the long-term fundamentals of the real estate developer, we’re downgrading Echo to a HOLD, mainly due to the recent price performance.
Recent developments: Echo has recently announced it plans to redevelop a currently held shopping centre in Piotrkow Trybunalski. The project with gross leaseable area of 37,000m2 will – in addition to 120 retail shops – contain a multiplex as well as recreational space. Construction works are expected to commence in 2007 while the completion of the project is scheduled for 2009.
4Q 2006 Preview and outlook: We are expecting Echo to post revenues of PLN 79.2m in 4Q 2006. In addition, Echo’s bottom line is likely to be boosted by the revaluation gains related to the opening of the 13,200m2 Pasaz Swietokrzyski shopping centre in Kielce. We estimate Echo’s revaluation gains at PLN 25.8m. We are expecting operating profit before revaluation gains of PLN 31.6m, and PLN 55.3m including the profit from revaluation. On the bottom line, we are expecting PLN 32.1m. Next year’s results should be boosted mainly by the opening of Echo’s flagship shopping mall project Pasaz Grunwaldzki in Wroclaw (47,900m2).
Valuation: We have moved our cut-off date one year forward, i.e. from 2008 to 2009, which was the primary justification for increasing our target price by 10% to PLN 96. We are upgrading our 2007 and 2008 profit forecasts based on faster than expected yield compression, as well as inclusion of the profits from the disposal of the Polkomtel building in 2007 (previously we assumed the disposal of the property in 2006). Echo is trading at a 2007E P/NAV of 1.6x, which diminishes to 1.1x in 2008E.
Echo Investment Real estate Poland
PLN 91 Hold (Downgrade from Buy)
Target price: PLN 96 (Previously: PLN 87)
WIG index 49,560 # of shares 42.0m MCAP PLN 3.8bn US$ 1.3bn Free float PLN 2.3bn US$ 0.8bn ECH PW / EPRS.WA
40
50
60
70
80
90
100
Jan-06 May-06 Sep-06 Jan-07
Echo
90
140
190
240
Jan-06 May-06 Sep-06 Jan-07
Echo WIG
(Rebased to 100)
Analyst Marcin Szortyka Tel. +48 22 520 9972 [email protected] http://research.ca-ib.com
Waiting for the trigger. Downgrade to HOLD.
11 January 2007
Company Update

Echo Investment January 2007
104
Table 194: Echo: 4Q 2006 Results preview
PLNm 4Q 2006E 4Q 2005 Ch. YoYRevenues 79.2 59.8 32.5 Operating profit excluding revaluation
31.6 29.7 6.4
Operating profit including revaluation
55.3 29.8 85.9
Net profit 32.1 15.8 103.8
Source: Echo, CA IB estimates
We are expecting Echo to post revenues of PLN 79.2m in 4Q 2006. In addition, Echo’s bottom line is likely to be boosted by the revaluation gains related to the opening of the 13,200m2 Pasaz Swietokrzyski shopping centre in Kielce. We estimate revaluation gains in Echo at PLN 25.8m. We are expecting operating profit before revaluation gains of PLN 31.6m, and PLN 55.3m including the profit from revaluation. On the bottom line, we are expecting PLN 32.1m.
Table 195: Echo: Forecast revision
2007 2008 New Old Ch.
YoYNew Old Ch.
YoYRevenues 450.0 447.7 0.5 773.5 770.9 0.3Revaluation gains 336.2 288.6 16.5 211.5 175.2 20.7Operating profit 506.5 457.5 10.7 464.2 411.9 12.7Net income 361.5 355.3 1.7 303.8 290.2 4.7
Source: Echo, CA IB estimates
We are upgrading our 2007 and 2008 forecasts based on faster than expected yield compression revealed in 3Q 2006 results, as well as inclusion of the profits from the disposal of the Polkomtel building in 2007 (previously we assumed the disposal of the property in 2006).
Table 196: Echo: Profit & loss account
2005 2006E 2007E 2008EOperating income 257.9 339.7 450.0 773.5Operating expenses (108.1) (151.7) (211.2) (438.5)Gross profit (loss) on sales 149.8 188.0 238.8 334.9Profit on real estate sales 63.7 11.6 0.0 0.0Real estate revaluation 101.3 258.6 336.2 211.5Selling expenses (8.5) (8.8) (12.3) (21.1)G&A expenses (28.8) (42.8) (48.3) (53.1)Other operating income 14.4 (6.2) (8.0) (8.0)Operating profit 292.0 400.4 506.5 464.2Financial income 8.2 6.6 3.5 1.7Financial expenses (43.0) (61.9) (63.7) (90.8)Exchange gains 16.1 (6.6) 0.0 0.0Revaluation of goodwill (6.4) (0.0) 0.0 0.0Pre-tax profit 266.8 338.6 446.3 375.0Income tax (55.8) (64.5) (84.8) (71.3)Net profit (loss) 211.0 274.2 361.5 303.8 Minority shareholders 16.6 2.7 0.0 0.0 Parent company 194.4 271.5 361.5 303.8
Source: Echo, CA IB estimates
Table 197: Echo: Balance sheet summary
2005 2006E 2007E 2008EFixed asses, of which: 1,678.9 1,968.6 2,900.1 3,834.7 Tangible fixed assets 245.1 285.4 488.7 129.0 Investment real estate 1,400.4 1,649.8 2,377.9 3,672.2Current assets, of which 470.8 462.2 399.7 334.2 Inventories 170.6 237.8 292.5 193.4 Tax receivables 35.2 35.2 35.2 35.2 Trade receivables 13.8 18.2 24.1 41.4 Cash 242.5 162.3 39.2 55.5Total assets 2,149.7 2,430.8 3,299.8 4,168.8Total equity 935.2 1,209.4 1,570.9 1,874.7Provisions 156.8 179.2 221.0 287.9Long-term liabilities, of which: 714.3 714.3 1,161.6 1,618.2 Financial liabilities 685.0 685.0 1,132.4 1,588.9Short-term liabilities, of which: 343.4 328.0 346.2 388.1 Financial liabilities 153.0 153.0 153.0 153.0 Tax liabilities 57.5 63.2 69.6 76.5 Trade liabilities 27.9 36.7 48.6 83.6 Other liabilities 105.0 75.0 75.0 75.0Total liabilities and equity 2,149.7 2,430.8 3,299.8 4,168.8
Source: Echo, CA IB estimates

Please note that the information at the back forms an integral part of this report.
2003 2004 2005E 2006E 2007E 2008ERevenues (PLNm) 306.9 371.2 537.2 722.3 853.7 1,229.3EBIT (PLNm) 17.8 23.6 71.5 166.9 236.9 294.0Net profit (PLNm) 7.0 10.6 52.2 127.7 190.7 236.4EPS (PLN) 0.32 0.48 2.39 5.73 7.76 9.63CEPS (PLN) 0.38 0.55 2.47 5.80 7.85 9.75BVPS (PLN) 3.23 3.50 6.10 19.49 27.25 35.71P/E (x) 460.8 304.0 61.6 25.7 18.9 15.3P/CE (x) 389.4 266.6 59.6 25.3 18.7 15.1P/BV (x) 45.5 42.0 24.1 7.5 5.4 4.1EV/Sales (x) 11.5 9.5 6.6 4.9 4.1 2.9EV/EBITDA (x) 186.0 140.9 48.3 21.0 14.8 11.9Dividend yield (%) 0.0 0.0 0.0 0.0 0.8 1.0
Shareholder structure: Dom Development B.V. 63.1%
We initiated coverage of Dom Development with our research report on 15 December 2006. Dom Development is a leading residential property developer in Warsaw, with an approximate 10% market share. Benefiting from the rebound in the residential market in Poland, the company nearly doubled revenues and increased its net profit seven-fold between 2003 and 2005. Dom Development is trading at 2007E and 2008E P/E ratios of 18.9x and 15.3x, respectively. Although these multiples represent premiums to its international peers, we note that the company boasts a 3-year EPS CAGR of 59% versus the average in our peer group of negative 2%. We rate Dom Development as a HOLD with a DCF-based 12-month target price of PLN 150.
• The rebound in the residential development market in Poland is continuing, fuelled by the solid fundamentals of the Polish economy (we expect GDP growth of 5.3% in 2006) and seemingly boundless mortgage lending (the cumulative value of mortgages has increased by 36% YTD). Warsaw, accounting for 30% of the Polish residential development market, is especially attractive as its above-average wages and below-average unemployment constantly attract new inhabitants.
• Dom Development’s land bank secures the majority of anticipated earnings for 2006-2008. On the plots of land the company already owns, Dom Development plans to build almost 8,500 residential units within the next five years, of which 3,000 units are currently under construction. The historical cost of land (i.e. far below current levels) on these projects cannot help but bolster margins. We forecast Dom Development to report growth of 145% in net profit to PLN 127.7m in 2006, and 49% to PLN 190.7m in 2007.
• Valuation: Dom Development is trading at our 2007E P/E ratio of 18.9x versus a 3-year EPS CAGR of 59%. Using our DCF-model, we have set a 12-month target price for Dom Development of PLN 150, which offers a 2% upside to the current price. We rate the company as a HOLD.
Dom Development Real Estate Poland
PLN 146.9 Hold
Target price: PLN 150
WIG index 49,560 # of shares 24.6m MCAP PLN 3.6bn US$ 1.2bn Free float PLN 756m US$ 254m DOMD.WA / DOM PW
80.0
90.0
100.0
110.0
120.0
130.0
140.0
150.0
160.0
Oct-06 Nov-06 Dec-06
Dom Development
80
100
120
140
160
180
Oct-06 Nov-06 Dec-06
Dom Development WIG
(Rebased to 100)
Analysts Tomasz Krukowski, CFA Tel. +48 22 520 9859 [email protected] Marcin Szortyka Tel. +48 22 520 9972 [email protected] http://research.ca-ib.com
House-hunting
11 January 2007
Company Update
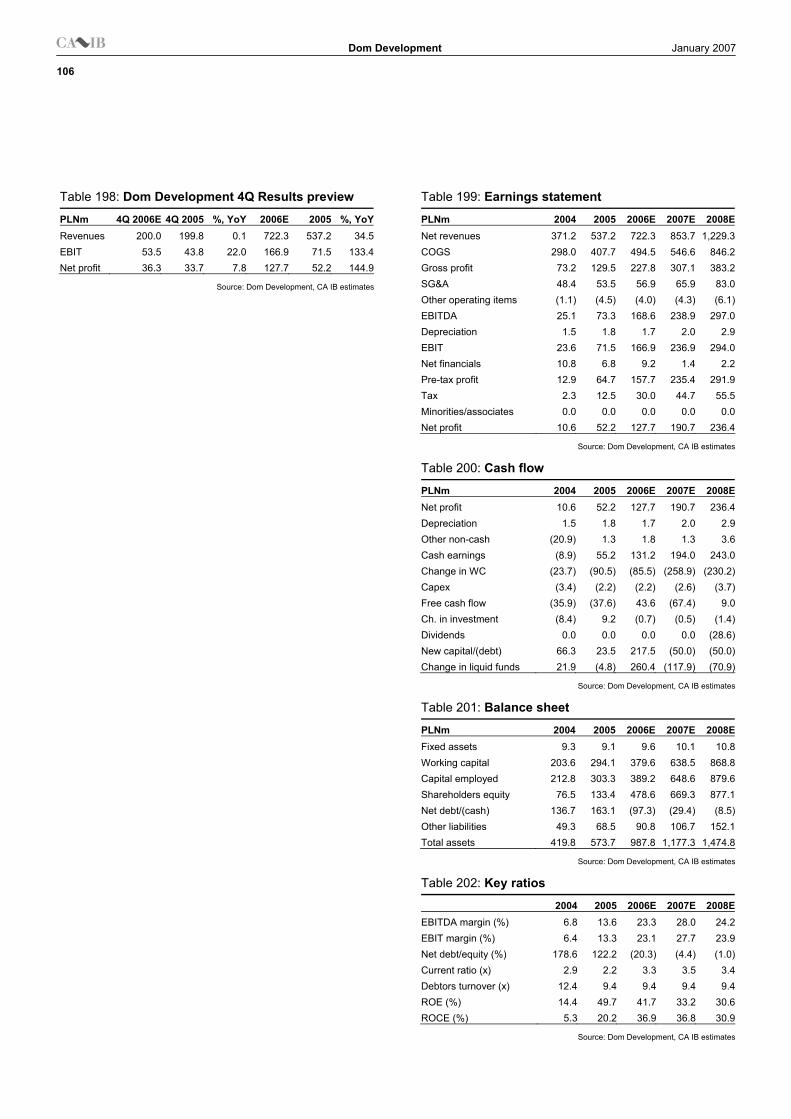
Dom Development January 2007
106
Table 198: Dom Development 4Q Results preview
PLNm 4Q 2006E 4Q 2005 %, YoY 2006E 2005 %, YoYRevenues 200.0 199.8 0.1 722.3 537.2 34.5 EBIT 53.5 43.8 22.0 166.9 71.5 133.4 Net profit 36.3 33.7 7.8 127.7 52.2 144.9
Source: Dom Development, CA IB estimates
Table 199: Earnings statement
PLNm 2004 2005 2006E 2007E 2008ENet revenues 371.2 537.2 722.3 853.7 1,229.3COGS 298.0 407.7 494.5 546.6 846.2Gross profit 73.2 129.5 227.8 307.1 383.2SG&A 48.4 53.5 56.9 65.9 83.0Other operating items (1.1) (4.5) (4.0) (4.3) (6.1)EBITDA 25.1 73.3 168.6 238.9 297.0Depreciation 1.5 1.8 1.7 2.0 2.9EBIT 23.6 71.5 166.9 236.9 294.0Net financials 10.8 6.8 9.2 1.4 2.2Pre-tax profit 12.9 64.7 157.7 235.4 291.9Tax 2.3 12.5 30.0 44.7 55.5Minorities/associates 0.0 0.0 0.0 0.0 0.0Net profit 10.6 52.2 127.7 190.7 236.4
Source: Dom Development, CA IB estimates
Table 200: Cash flow
PLNm 2004 2005 2006E 2007E 2008ENet profit 10.6 52.2 127.7 190.7 236.4 Depreciation 1.5 1.8 1.7 2.0 2.9 Other non-cash (20.9) 1.3 1.8 1.3 3.6 Cash earnings (8.9) 55.2 131.2 194.0 243.0 Change in WC (23.7) (90.5) (85.5) (258.9) (230.2)Capex (3.4) (2.2) (2.2) (2.6) (3.7)Free cash flow (35.9) (37.6) 43.6 (67.4) 9.0 Ch. in investment (8.4) 9.2 (0.7) (0.5) (1.4)Dividends 0.0 0.0 0.0 0.0 (28.6)New capital/(debt) 66.3 23.5 217.5 (50.0) (50.0)Change in liquid funds 21.9 (4.8) 260.4 (117.9) (70.9)
Source: Dom Development, CA IB estimates
Table 201: Balance sheet
PLNm 2004 2005 2006E 2007E 2008EFixed assets 9.3 9.1 9.6 10.1 10.8 Working capital 203.6 294.1 379.6 638.5 868.8 Capital employed 212.8 303.3 389.2 648.6 879.6 Shareholders equity 76.5 133.4 478.6 669.3 877.1 Net debt/(cash) 136.7 163.1 (97.3) (29.4) (8.5)Other liabilities 49.3 68.5 90.8 106.7 152.1 Total assets 419.8 573.7 987.8 1,177.3 1,474.8
Source: Dom Development, CA IB estimates
Table 202: Key ratios
2004 2005 2006E 2007E 2008EEBITDA margin (%) 6.8 13.6 23.3 28.0 24.2 EBIT margin (%) 6.4 13.3 23.1 27.7 23.9 Net debt/equity (%) 178.6 122.2 (20.3) (4.4) (1.0)Current ratio (x) 2.9 2.2 3.3 3.5 3.4 Debtors turnover (x) 12.4 9.4 9.4 9.4 9.4 ROE (%) 14.4 49.7 41.7 33.2 30.6 ROCE (%) 5.3 20.2 36.9 36.8 30.9
Source: Dom Development, CA IB estimates

Please note that the information at the back forms an integral part of this report.
PLNm 2004 2005 2006E 2007E 2008E 2009ERevenues 128.8 151.6 237.5 489.7 694.0 839.7EBITDA (adjusted) 33.1 35.1 73.2 168.8 248.8 308.1EBITDA (reported)* 33.1 35.1 108.2 168.8 248.8 308.1EBIT 19.7 25.8 94.8 141.8 219.0 278.1Net profit (adjusted) 8.4 19.4 55.1 108.3 159.3 203.0Net profit (reported)* 8.4 19.4 90.1 108.3 159.3 203.0EPS (PLN) 0.08 0.11 0.04 0.04 0.06 0.08CEPS (PLN) 0.20 0.16 0.07 0.05 0.07 0.09BVPS (PLN) 1.65 1.36 0.31 0.35 0.41 0.48P/E adjusted (x) 695.4 299.8 105.4 53.6 36.5 28.6P/CE (x) 11.2 13.4 30.0 42.9 30.7 24.9P/BV (x) 1.3 1.6 7.2 6.3 5.4 4.5EV/Sales (x) 41.7 35.4 22.6 11.0 7.7 6.4EV/EBITDA adjusted (x) 162.1 153.0 73.3 31.8 21.6 17.4
Shareholder structure: Mr. Jerzy Wisniewski 36.4%, BZ WBK AIB Asset Management 7.4%, ING Mutual Fund 7.0%
As 2007 progresses, delivery on management’s high-growth expectations should be key to Bioton’s share price appreciation. Upside opportunities abound with the entrance of Bioton’s insulin and hepatitis B vaccine into new markets underway, the R&D pipeline packed with the human growth hormone, interferon and EPO, and the promising venture into blood serum fractionation (LFO) services. Nevertheless, stiffening domestic competition, still only partial entry into the Russian and Ukrainian insulin markets and less favourable foreign exchange rates pose risks of a bit slower than anticipated earnings growth (our estimated 2006-2009E CAGR recently reduced to 54% vs. 62% – prior to LFO impact). We maintain our HOLD recommendation and 12-month target of PLN 2.48/share. Our valuation incorporates our estimated PLN 0.12 per share impact from the blood serum fractionation services project.
Recent developments: While advantageous in the long run, the regulatory cuts to the maximum prices permitted on imported insulin in Poland narrowed Bioton’s price advantage and, we estimate, slowed the pace of its domestic insulin market share expansion. We have recently lowered our year-end 2006 market share target to 26% (from 28% but with FY 2006 sales volumes close to our original expectations) and 2009 to 39% (from 40%). Intensified price competition from international players has put pressure on domestic insulin profit margins, as indicated by the company’s CEO. We have recently reduced our model gross profit margin on domestic insulin to 70% (from 75%). In Ukraine, delayed acquisition of the majority stake in Indar (ca. 70% Ukrainian insulin market share) rendered our full-year consolidation of this subsidiary premature. We have recently cut our Ukrainian insulin sales estimates 50% to PLN 30m in 2007.
4Q 2006 Outlook: We are expecting net profit of PLN 24m, up four-fold YoY on sales of PLN 86m, and up 76% YoY, driven primarily by market share gains in Poland and the first substantial insulin shipments to Russia (management’s target US$ 15m). The PLN/US$ exchange rate presents the most significant risk to our forecasts.
Valuation: Bioton is trading at our estimated 2006-2009 PEG of 1.98x, a 17% premium to the biotech peer group median (the premium is justified, in our view, by Bioton’s outstanding growth prospects). Comparable peer group analysis implies Bioton’s valuation at PLN 2.05, fairly close to our DCF-based valuation of PLN 2.11, which translates into a 12-month target price of PLN 2.48 per share (including the LFO project). We maintain our HOLD recommendation.
Bioton Biopharmaceuticals Poland
PLN 2.25* Hold
Target price: PLN 2.48
*Pricing as of 9 Jan 2007
WIG index 49,769 # of shares 2,640m MCAP PLN 5,941m US$ 1,994m Free float PLN 2,736m US$ 918m BOTN.WA / BIO PW
0.6
1.0
1.4
1.8
2.2
2.6
3.0
Jan-06 May-06 Sep-06 Jan-07
Bioton
70
120
170
220
270
320
370
Jan-06 May-06 Sep-06 Jan-07
Bioton WIG
(Rebased to 100)
Analyst Przemyslaw Sawala-Uryasz Tel. +48 22 520 9960 [email protected] http://research.ca-ib.com
2007. Time to deliver.
11 January 2007
Company Update

Bioton January 2007
108
Table 203: 4Q Results preview
PLNm 4Q 2006E
4Q 2005
YoY (%)
2006E 2005 YoY (%)
Revenues 85.6 48.7 75.7 237.5 151.6 56.7EBITDA 30.1 13.5 122.6 108.2 35.1 208.7EBIT 26.0 11.0 135.7 94.8 25.8 267.6Net profit 24.1 6.3 283.8 55.1 19.4 184.4- SciGen intangibles revaluation n.a. n.a. n.a. 35.0 n.a. n.a.Net profit (including SciGen's revaluation) 24.1 6.3 283.8 90.1 19.4 365.1EBITDA margin (%) 35.2 27.8 45.6 23.1 EBIT margin (%) 30.3 22.6 39.9 17.0Net margin (%) adj. 28.2 12.9 37.9 12.8
Source: Bioton, CA IB estimates
Table 204: Profit & loss
PLNm 2004 2005 2006E 2007E 2008E 2009ENet revenue 128.8 151.6 237.5 489.7 694.0 839.7COGS (68.7) (70.4) (95.9) (229.0) (324.5) (392.6)Gross profit 60.1 81.2 141.6 260.7 369.5 447.0SG&A (37.6) (54.2) (81.5) (120.4) (151.7) (169.6)Other operating, net (2.8) (1.2) 34.7 1.5 1.1 0.7EBITDA 33.1 35.1 108.2 168.8 248.8 308.1Depreciation (13.4) (9.3) (13.5) (27.0) (29.8) (29.9)EBIT 19.7 25.8 94.8 141.8 219.0 278.1Net financials (8.6) 1.6 7.6 (3.1) (7.2) (6.4)Share in profits of affiliates 0.0 (2.9) 1.1 4.1 5.2 6.3Pre-tax profit 11.1 24.5 103.5 142.8 217.0 278.0Tax (2.7) (5.1) (13.9) (32.3) (52.6) (69.1)Minority interest 0.0 0.0 0.5 (2.2) (5.1) (5.9)Net profit 8.4 19.4 90.1 108.3 159.3 203.0
Source: Bioton, CA IB estimates
Table 205: Cash flow
PLNm 2004 2005 2006E 2007E 2008E 2009ENet profit 8.4 19.4 90.1 108.3 159.3 203.0Depreciation 13.4 9.3 13.5 27.0 29.8 29.9Cash earnings 21.7 28.7 103.6 135.4 189.1 233.0Change in NWC (31.2) (26.2) (31.5) (140.2) (115.6) (82.5)Operations (9.4) 2.4 72.1 (4.8) 73.4 150.5Investments (29.5) (68.9) (433.6) (116.0) (84.6) (32.8)Financing 68.9 48.6 469.0 101.9 37.2 (23.4)Dividends 0.0 0.0 0.0 0.0 0.0 0.0Change in cash 30.0 (17.9) 107.6 (18.9) 26.0 94.3
Source: Bioton, CA IB estimates
Table 206: Balance sheet
PLNm 2004 2005 2006E 2007E 2008E 2009EFixed assets 140.4 181.0 704.4 761.8 832.4 922.3Net working capital 76.4 103.8 139.6 292.4 418.2 508.0Capital employed 216.8 284.8 843.91,054.21,250.61,430.2Shareholders equity 183.3 241.6 806.6 914.91,074.21,277.2Debt 33.5 43.2 37.4 139.3 176.5 153.0Marketable securities & cash 25.4 6.3 109.6 78.1 93.9 180.9Total assets 258.0 333.8 939.01,250.51,519.61,751.1
Source: Bioton, CA IB estimates
Table 207: Ratios
2004 2005 2006E 2007E 2008E 2009EGross margin (%) 46.7 53.6 59.6 53.2 53.2 53.2EBITDA margin (%) 25.7 23.1 45.6 34.5 35.8 36.7EBIT margin (%) 15.3 17.0 39.9 28.9 31.6 33.1Interest cover (x) 5.7 4.9 29.3 26.7 23.1 28.1Net debt/equity (%) 4.4 15.2 (9.0) 6.7 7.7 (2.2)Current ratio (x) 3.5 3.2 3.6 2.9 2.9 3.1Sales/receivables (x) 1.7 1.6 1.6 1.6 1.6 1.6ROE (%) 6.1 9.1 17.2 12.6 16.0 17.3ROCE (%) 11.1 10.3 16.8 14.9 19.0 20.7
Source: Bioton, CA IB estimates

Please note that the information at the back forms an integral part of this report.
2004 2005 2006E 2007E 2008ERevenue (CZKm) 102,670 125,083 140,647 164,399 176,939EBITDA (CZKm) 39,627 50,157 63,110 73,078 79,850Net profit (CZKm) 13,213 21,452 27,319 31,956 37,742EPS (CZK) 22.3 36.2 46.1 54.0 63.7CEPS (CZK) 61.5 76.4 91.5 102.3 112.9DPS (CZK) 9.0 15.0 23.1 27.0 31.9P/E (x) 41.0 25.3 19.8 17.0 14.4P/CE (x) 14.9 12.0 10.0 8.9 8.1EV/revenue (x) 5.9 4.8 4.5 3.7 3.4EV/EBITDA (x) 15.2 12.0 10.0 8.4 7.5Dividend yield (%) 1.0 1.6 2.5 2.9 3.5FCF yield (%) -0.9 2.3 3.0 6.9 6.8
Shareholder structure: Finance Ministry (67%), free float (33%)
We maintain our BUY recommendation for CEZ with a target price of CZK 1,006/share as CEZ still offers investors exposure to the price convergence story and continuing M&A activity in the sector.
Recent developments: CEZ signed a contract with the government of Republika Srpska to build new and modernise existing power plants in the Gacko area in a JV with local Elektroprivreda Republika Srpska. The total costs of the project are estimated at EUR 1.4bn and CEZ should control 51% of the JV. The contract should be completed by 2015. On a related note, CEZ has progressed to the next round in a tender to build a new 2,100MW power plant in Kosovo. Unfortunately, CEZ failed to agree on a price in the potential acquisition of package of eight electricity distributors in Ukraine. The government formation talks are also important for CEZ primarily due to the presence of the Greens Party. The government-proposed agenda calls for maintenance of the current mining limits and no decision on the construction of new nuclear power plants. However, as we consider it to be highly unlikely that this government will win the vote of confidence, the market should view these pre-agreements neutrally.
Valuation. CEZ currently trades at 2007E EV/EBITDA of 8.4x, which is an approximately 17% premium over West European utilities, but we continue to advocate that the CEZ premium is deserved given its faster growth, higher margins, free cash flow yield and ROE.
CEZ Utilities Czech Republic
CZK 936.6 Buy
Target price: CZK 1,006
PX index 1,600 # of shares 592m MCAP CZK 541.9bn US$ 25.5bn Free float CZK 175.6bn US$ 8.3bn CEZPsp.PR / CEZP CD
560
660
760
860
960
1,060
Jan-06 May-06 Aug-06 Dec-06
CEZ
75
85
95
105
115
125
135
Jan-06 May-06 Aug-06 Dec-06
CEZ PX-D
(Rebased to 100)
Analyst Dan Karpisek, CFA Tel. +420 22111 2570 [email protected] http://research.ca-ib.com
Investment story remains untouched
11 January 2007
Company Update

Cez January 2007
110
Figure 9: Germany 2008 baseload forward (EUR/MWh)
47
49
51
53
55
57
59
61
Jan-0
6
Feb-06
Mar-06
Apr-06
May-06
Jun-0
6Ju
l-06
Aug-06
Sep-06
Oct-06
Nov-06
Dec-06
Jan-0
7
Source: Bloomberg
Figure 10: CO2 vouchers 2008 forward (EUR)
14161820222426283032
Jan-0
6
Feb-06
Mar-06
Apr-06
May-06
Jun-0
6Ju
l-06
Aug-06
Sep-06
Oct-06
Nov-06
Dec-06
Jan-0
7
Source: Bloomberg
Table 208: Income statement
CZKm 2004 2005 2006E 2007E 2008ERevenue 102,670 125,083 140,647 164,399 176,939EBITDA 39,627 50,157 63,110 73,078 79,850Depreciation (19,842) (20,737) (23,904) (25,667) (25,806)EBIT 19,785 29,420 39,206 47,411 54,044Pre-tax profit 18,501 27,323 37,423 43,916 51,406Net profit (loss) 13,213 21,452 27,319 31,956 37,742
Source: CEZ, CA IB estimates
Table 209: Balance sheet
Assets (CZKm) 2004 2005 2006E 2007E 2008EFixed assets 239,196 259,091 293,696 294,976 301,986Intangible assets 3,379 6,057 6,057 6,057 6,057Financial investment 28,437 14,740 15,050 15,050 15,050Inventory 4,057 4,427 5,820 6,570 7,293Receivables 9,189 14,792 15,413 18,016 19,391Other assets 6,050 8,189 8,324 8,324 8,324Cash & equivalent 8,942 16,791 13,389 31,876 46,870CO2 emission rights 0 134 0 0 0Total assets 299,250 324,221 357,750 380,870 404,971Share capital 59,218 58,237 58,237 58,237 58,237Retained earnings 99,666 96,998 109,567 123,226 139,204Net profit 13,213 21,452 27,319 31,956 37,742Total equity 172,097 176,687 195,122 213,419 235,183Provisions 29,441 35,864 43,246 43,529 43,755Payables 12,587 16,243 17,340 20,268 21,814Debt 41,819 38,739 61,515 62,497 62,546Other liabilities 36,956 42,070 31,161 31,161 31,161Minority interests 6,350 14,618 9,367 9,997 10,512Total liabilities & equity 299,250 324,221 357,750 380,870 404,971
Source: CEZ, CA IB estimates
Table 210: Cash flow statement
CZKm 2004 2005 2006E 2007E 2008EOperating cash flow 28,445 57,404 41,525 58,111 63,739Investing cash flow (32,620) (29,613) (58,820) (26,947) (32,816)Financing cash flow 9,103 (19,942) 13,893 (12,677) (15,929)Net change in cash 4,928 7,849 (3,402) 18,487 14,994
Source: CEZ, CA IB estimates
Table 211: Ratio summary
2004 2005 2006E 2007E 2008EROIC (%) 2.4 3.6 4.8 5.8 6.7ROE (%) 8.1 12.3 14.7 15.6 16.8EBITDA margin (%) 38.6 40.1 44.9 44.5 45.1EBIT margin (%) 19.3 23.5 27.9 28.8 30.5Revenue (Ch. % YoY) 40.5 71.2 92.5 16.9 7.6EBITDA (Ch. % YoY) 38.2 75.0 120.2 15.8 9.3EBIT (Ch. % YoY) 30.8 94.4 159.1 20.9 14.0Net profit (Ch. % YoY) 29.5 110.2 167.7 17.0 18.1Payout ratio (%) 40.3 41.4 50.0 50.0 50.0
Source: CEZ, CA IB estimates

Polish Equity Quarterly: 1Q 2007 January 2007
111
Notes

Polish Equity Quarterly: 1Q 2007 January 2007
112
Notes

Polish Equity Quarterly: 1Q 2007 January 2007
113
Notes

Polish Equity Quarterly: 1Q 2007 January 2007
114
Distribution of CA IB’s current stock ratings
Coverage Universe
Buy Hold Sell Coverage In Transition Restricted
Count 39 53 17 9 3
% of total 32.2 43.8 14.0 7.4 2.5 Investment Banking Clients*
Buy Hold Sell Coverage In Transition Restricted
Count 1 6 2 1 1
% of total 9.1 54.5 18.2 9.1 9.1 * Investment Banking Clients are companies from whom CA IB International Markets Ltd. or CA IB Corporate Finance Ltd. or an
affiliate has received investment banking compensation within the last 12 months. Please note that CA IB’s stock ratings have to be interpreted individually by each investor in the context of their investment policy, the existing portfolio and risk considerations.
History of CA IB's rating of Agora History of CA IB's rating of AmRest
25
35
45
55
65
75
Jan-0
4
Apr-04
Jul-0
4
Oct-04
Jan-0
5
Apr-05
Jul-0
5
Oct-05
Jan-0
6
Apr-06
Jul-0
6
Oct-06
Jan-0
7
Agora STRONG BUYBUY HOLDREDUCE SELLRESTRICTED UNDER REVIEWCOVERAGE IN TRANSITION Target Price
1525354555657585
Jan-0
4
Apr-04
Jul-0
4
Oct-04
Jan-0
5
Apr-05
Jul-0
5
Oct-05
Jan-0
6
Apr-06
Jul-0
6
Oct-06
Jan-0
7
Amrest STRONG BUYBUY HOLDREDUCE SELLRESTRICTED UNDER REVIEWCOVERAGE IN TRANSITION Target Price
Source: Datastream, CA IB
Source: Datastream, CA IB
History of CA IB's rating of Bank Handlowy History of CA IB's rating of Bank Millennium
50
60
70
80
90
Jan-0
4
Apr-04
Jul-0
4
Oct-04
Jan-0
5
Apr-05
Jul-0
5
Oct-05
Jan-0
6
Apr-06
Jul-0
6
Oct-06
Jan-0
7
Bank Handlowy STRONG BUYBUY HOLDREDUCE SELLRESTRICTED UNDER REVIEWCOVERAGE IN TRANSITION Target Price
2
3
4
5
6
7
8
Jan-0
4
Apr-04
Jul-0
4
Oct-04
Jan-0
5
Apr-05
Jul-0
5
Oct-05
Jan-0
6
Apr-06
Jul-0
6
Oct-06
Jan-0
7
Bank Millennium STRONG BUYBUY HOLDREDUCE SELLRESTRICTED UNDER REVIEWCOVERAGE IN TRANSITION Target Price
Source: Datastream, CA IB
Source: Datastream, CA IB

Polish Equity Quarterly: 1Q 2007 January 2007
115
History of CA IB's rating of Bioton History of CA IB's rating of BRE
0.1
0.61.11.6
2.12.6
3.1
Jan-
04
Apr-04
Jul-0
4
Oct-04
Jan-
05
Apr-05
Jul-0
5
Oct-05
Jan-
06
Apr-06
Jul-0
6
Oct-06
Jan-
07
Bioton STRONG BUYBUY HOLDREDUCE SELLRESTRICTED UNDER REVIEWCOVERAGE IN TRANSITION Target Price
50100150200250300350400
Jan-
04
Apr-04
Jul-0
4
Oct-04
Jan-
05
Apr-05
Jul-0
5
Oct-05
Jan-
06
Apr-06
Jul-0
6
Oct-06
Jan-
07
BRE STRONG BUYBUY HOLDREDUCE SELLRESTRICTED UNDER REVIEWCOVERAGE IN TRANSITION Target Price
Source: Datastream, CA IB
Source: Datastream, CA IB
History of CA IB's rating of Budimex History of CA IB's rating of BZWBK
2535455565758595
Jan-0
4
Apr-04
Jul-0
4
Oct-04
Jan-0
5
Apr-05
Jul-0
5
Oct-05
Jan-0
6
Apr-06
Jul-0
6
Oct-06
Jan-0
7
Budimex STRONG BUYBUY HOLDREDUCE SELLRESTRICTED UNDER REVIEWCOVERAGE IN TRANSITION Target Price
50
100
150
200
250
Jan-
04
Apr-0
4Ju
l-04
Oct-04
Jan-
05
Apr-0
5Ju
l-05
Oct-05
Jan-
06
Apr-0
6Ju
l-06
Oct-06
Jan-
07
BZWBK STRONG BUYBUY HOLDREDUCE SELLRESTRICTED UNDER REVIEWCOVERAGE IN TRANSITION Target Price
Source: Datastream, CA IB
Source: Datastream, CA IB
History of CA IB's rating of CCC History of CA IB's rating of CEDC
51525354555
Jan-0
4
Apr-04
Jul-0
4
Oct-04
Jan-0
5
Apr-05
Jul-0
5
Oct-05
Jan-0
6
Apr-06
Jul-0
6
Oct-06
Jan-0
7
CCC STRONG BUYBUY HOLDREDUCE SELLRESTRICTED UNDER REVIEWCOVERAGE IN TRANSITION Target Price
101520253035
Jan-0
4
Apr-04
Jul-0
4
Oct-04
Jan-0
5
Apr-05
Jul-0
5
Oct-05
Jan-0
6
Apr-06
Jul-0
6
Oct-06
Jan-0
7
CEDC STRONG BUYBUY HOLDREDUCE SELLRESTRICTED UNDER REVIEWCOVERAGE IN TRANSITION Target Price
Source: Datastream, CA IB
Source: Datastream, CA IB
History of CA IB's rating of CEZ History of CA IB's rating of ComArch
100300500700900
1,100
Jan-0
4
Apr-04
Jul-0
4
Oct-04
Jan-0
5
Apr-05
Jul-0
5
Oct-05
Jan-0
6
Apr-06
Jul-0
6
Oct-06
Jan-0
7
CEZ STRONG BUYBUY HOLDREDUCE SELLRESTRICTED UNDER REVIEWCOVERAGE IN TRANSITION Target Price
25
75
125
175
225
Jan-0
4
Apr-04
Jul-0
4
Oct-04
Jan-0
5
Apr-05
Jul-0
5
Oct-05
Jan-0
6
Apr-06
Jul-0
6
Oct-06
Jan-0
7
ComArch STRONG BUYBUY HOLDREDUCE SELLRESTRICTED UNDER REVIEWCOVERAGE IN TRANSITION Target Price
Source: Datastream, CA IB
Source: Datastream, CA IB

Polish Equity Quarterly: 1Q 2007 January 2007
116
History of CA IB's rating of ComputerLand History of CA IB's rating of Dom Development
8090
100110120130
Jan-0
4
Apr-04
Jul-0
4
Oct-04
Jan-0
5
Apr-05
Jul-0
5
Oct-05
Jan-0
6
Apr-06
Jul-0
6
Oct-06
Jan-0
7
ComputerLand STRONG BUYBUY HOLDREDUCE SELLRESTRICTED UNDER REVIEWCOVERAGE IN TRANSITION Target Price
100
120
140
160
Jan-0
4
Apr-04
Jul-0
4
Oct-04
Jan-0
5
Apr-05
Jul-0
5
Oct-05
Jan-0
6
Apr-06
Jul-0
6
Oct-06
Jan-0
7
Dom Development STRONG BUYBUY HOLDREDUCE SELLRESTRICTED UNDER REVIEWCOVERAGE IN TRANSITION Target Price
Source: Datastream, CA IB
Source: Datastream, CA IB
History of CA IB's rating of Echo Investment History of CA IB's rating of Elstar Oils
1030507090
110
Jan-0
4
Apr-04
Jul-0
4
Oct-04
Jan-0
5
Apr-05
Jul-0
5
Oct-05
Jan-0
6
Apr-06
Jul-0
6
Oct-06
Jan-0
7
Echo Investment STRONG BUYBUY HOLDREDUCE SELLRESTRICTED UNDER REVIEWCOVERAGE IN TRANSITION Target Price
0
5
10
15
Jan-0
4
Apr-04
Jul-0
4
Oct-04
Jan-0
5
Apr-05
Jul-0
5
Oct-05
Jan-0
6
Apr-06
Jul-0
6
Oct-06
Jan-0
7
Elstar Oils STRONG BUYBUY HOLDREDUCE SELLRESTRICTED UNDER REVIEWCOVERAGE IN TRANSITION Target Price
Source: Datastream, CA IB
Source: Datastream, CA IB
History of CA IB's rating of EMAX History of CA IB's rating of Eurocash
70
90
110
130
150
Jan-0
4
Apr-04
Jul-0
4
Oct-04
Jan-0
5
Apr-05
Jul-0
5
Oct-05
Jan-0
6
Apr-06
Jul-0
6
Oct-06
Jan-0
7
EMAX STRONG BUYBUY HOLDREDUCE SELLRESTRICTED UNDER REVIEWCOVERAGE IN TRANSITION Target Price
2
4
6
8
10
Jan-0
4
Apr-04
Jul-0
4
Oct-04
Jan-0
5
Apr-05
Jul-0
5
Oct-05
Jan-0
6
Apr-06
Jul-0
6
Oct-06
Jan-0
7
Eurocash STRONG BUYBUY HOLDREDUCE SELLRESTRICTED UNDER REVIEWCOVERAGE IN TRANSITION Target Price
Source: Datastream, CA IB
Source: Datastream, CA IB
History of CA IB's rating of Grajewo History of CA IB's rating of GTC
102030405060
Jan-0
4
Apr-04
Jul-0
4
Oct-04
Jan-0
5
Apr-05
Jul-0
5
Oct-05
Jan-0
6
Apr-06
Jul-0
6
Oct-06
Jan-0
7
Grajewo STRONG BUYBUY HOLDREDUCE SELLRESTRICTED UNDER REVIEWCOVERAGE IN TRANSITION Target Price
5
15
25
35
45
Jan-0
4
Apr-04
Jul-0
4
Oct-04
Jan-0
5
Apr-05
Jul-0
5
Oct-05
Jan-0
6
Apr-06
Jul-0
6
Oct-06
Jan-0
7
GTC STRONG BUYBUY HOLDREDUCE SELLRESTRICTED UNDER REVIEWCOVERAGE IN TRANSITION Target Price
Source: Datastream, CA IB
Source: Datastream, CA IB

Polish Equity Quarterly: 1Q 2007 January 2007
117
History of CA IB's rating of IGA History of CA IB's rating of IMPEL
255075
100125150
Jan-0
4
Apr-04
Jul-0
4
Oct-04
Jan-0
5
Apr-05
Jul-0
5
Oct-05
Jan-0
6
Apr-06
Jul-0
6
Oct-06
Jan-0
7
IGA STRONG BUYBUY HOLDREDUCE SELLRESTRICTED UNDER REVIEWCOVERAGE IN TRANSITION Target Price
5
15
25
35
Jan-0
4
Apr-04
Jul-0
4
Oct-04
Jan-0
5
Apr-05
Jul-0
5
Oct-05
Jan-0
6
Apr-06
Jul-0
6
Oct-06
Jan-0
7
Impel STRONG BUYBUY HOLDREDUCE SELLRESTRICTED UNDER REVIEWCOVERAGE IN TRANSITION Target Price
Source: Datastream, CA IB
Source: Datastream, CA IB
History of CA IB's rating of ING BSK History of CA IB's rating of Kety
300
400
500
600
700
800
Jan-
04
Apr-0
4Ju
l-04
Oct-04
Jan-
05
Apr-0
5Ju
l-05
Oct-05
Jan-
06
Apr-0
6Ju
l-06
Oct-06
Jan-
07
ING Bank Slaski STRONG BUYBUY HOLDREDUCE SELLRESTRICTED UNDER REVIEWCOVERAGE IN TRANSITION Target Price
100
125
150
175
200
Jan-0
4
Apr-04
Jul-0
4
Oct-04
Jan-0
5
Apr-05
Jul-0
5
Oct-05
Jan-0
6
Apr-06
Jul-0
6
Oct-06
Jan-0
7
Kety STRONG BUYBUY HOLDREDUCE SELLRESTRICTED UNDER REVIEWCOVERAGE IN TRANSITION Target Price
Source: Datastream, CA IB
Source: Datastream, CA IB
History of CA IB's rating of KGHM History of CA IB's rating of Kredyt Bank
1030507090
110130150
Jan-0
4
Apr-04
Jul-0
4
Oct-04
Jan-0
5
Apr-05
Jul-0
5
Oct-05
Jan-0
6
Apr-06
Jul-0
6
Oct-06
Jan-0
7
KGHM STRONG BUYBUY HOLDREDUCE SELLRESTRICTED UNDER REVIEWCOVERAGE IN TRANSITION Target Price
5
10
15
20
25
Jan-
04
Apr-0
4Ju
l-04
Oct-04
Jan-
05
Apr-0
5Ju
l-05
Oct-05
Jan-
06
Apr-0
6Ju
l-06
Oct-06
Jan-
07
Kredyt Bank STRONG BUYBUY HOLDREDUCE SELLRESTRICTED UNDER REVIEWCOVERAGE IN TRANSITION Target Price
Source: Datastream, CA IB
Source: Datastream, CA IB
History of CA IB's rating of Lotos Group History of CA IB's rating of LPP
20
30
40
50
60
Jan-0
4
Apr-04
Jul-0
4
Oct-04
Jan-0
5
Apr-05
Jul-0
5
Oct-05
Jan-0
6
Apr-06
Jul-0
6
Oct-06
Jan-0
7
Lotos Group STRONG BUYBUY HOLDREDUCE SELLRESTRICTED UNDER REVIEWCOVERAGE IN TRANSITION Target Price
400
600
800
1,000
Jan-0
4
Apr-04
Jul-0
4
Oct-04
Jan-0
5
Apr-05
Jul-0
5
Oct-05
Jan-0
6
Apr-06
Jul-0
6
Oct-06
Jan-0
7
LPP STRONG BUYBUY HOLDREDUCE SELLRESTRICTED UNDER REVIEWCOVERAGE IN TRANSITION Target Price
Source: Datastream, CA IB
Source: Datastream, CA IB

Polish Equity Quarterly: 1Q 2007 January 2007
118
History of CA IB's rating of MOL History of CA IB's rating of Mondi Packaging
5,00010,00015,00020,00025,00030,000
Jan-0
4
Apr-04
Jul-0
4
Oct-04
Jan-0
5
Apr-05
Jul-0
5
Oct-05
Jan-0
6
Apr-06
Jul-0
6
Oct-06
Jan-0
7
MOL STRONG BUYBUY HOLDREDUCE SELLRESTRICTED UNDER REVIEWCOVERAGE IN TRANSITION Target Price
30
50
70
90
110
Jan-0
4
Apr-04
Jul-0
4
Oct-04
Jan-0
5
Apr-05
Jul-0
5
Oct-05
Jan-0
6
Apr-06
Jul-0
6
Oct-06
Jan-0
7
Mondi Packaging STRONG BUYBUY HOLDREDUCE SELLRESTRICTED UNDER REVIEWCOVERAGE IN TRANSITION Target Price
Source: Datastream, CA IB
Source: Datastream, CA IB
History of CA IB's rating of Netia History of CA IB's rating of NFI EMPiK Media & Fashion
3
4
5
6
7
Jan-0
4
Apr-04
Jul-0
4
Oct-04
Jan-0
5
Apr-05
Jul-0
5
Oct-05
Jan-0
6
Apr-06
Jul-0
6
Oct-06
Jan-0
7
Netia STRONG BUYBUY HOLDREDUCE SELLRESTRICTED UNDER REVIEWCOVERAGE IN TRANSITION Target Price
468
10121416
Jan-0
4
Apr-04
Jul-0
4
Oct-04
Jan-0
5
Apr-05
Jul-0
5
Oct-05
Jan-0
6
Apr-06
Jul-0
6
Oct-06
Jan-0
7
NFI EMPiK Media & Fashion STRONG BUYBUY HOLDREDUCE SELLRESTRICTED UNDER REVIEWCOVERAGE IN TRANSITION Target Price
Source: Datastream, CA IB
Source: Datastream, CA IB
History of CA IB's rating of Orbis History of CA IB's rating of PBG
203040506070
Jan-0
4
Apr-04
Jul-0
4
Oct-04
Jan-0
5
Apr-05
Jul-0
5
Oct-05
Jan-0
6
Apr-06
Jul-0
6
Oct-06
Jan-0
7
Orbis STRONG BUYBUY HOLDREDUCE SELLRESTRICTED UNDER REVIEWCOVERAGE IN TRANSITION Target Price
1060
110160210260
Jan-0
4
Apr-04
Jul-0
4
Oct-04
Jan-0
5
Apr-05
Jul-0
5
Oct-05
Jan-0
6
Apr-06
Jul-0
6
Oct-06
Jan-0
7
PBG STRONG BUYBUY HOLDREDUCE SELLRESTRICTED UNDER REVIEWCOVERAGE IN TRANSITION Target Price
Source: Datastream, CA IB
Source: Datastream, CA IB
History of CA IB's rating of PGNiG History of CA IB's rating of PKN
2
3
4
5
Jan-0
4
Apr-04
Jul-0
4
Oct-04
Jan-0
5
Apr-05
Jul-0
5
Oct-05
Jan-0
6
Apr-06
Jul-0
6
Oct-06
Jan-0
7
PGNiG STRONG BUYBUY HOLDREDUCE SELLRESTRICTED UNDER REVIEWCOVERAGE IN TRANSITION Target Price
203040506070
Jan-0
4
Apr-04
Jul-0
4
Oct-04
Jan-0
5
Apr-05
Jul-0
5
Oct-05
Jan-0
6
Apr-06
Jul-0
6
Oct-06
Jan-0
7
PKN STRONG BUYBUY HOLDREDUCE SELLRESTRICTED UNDER REVIEWCOVERAGE IN TRANSITION Target Price
Source: Datastream, CA IB
Source: Datastream, CA IB

Polish Equity Quarterly: 1Q 2007 January 2007
119
History of CA IB's rating of PKO BP History of CA IB's rating of Polimex
15
25
35
45
55
Jan-
04
Apr-0
4Ju
l-04
Oct-04
Jan-
05
Apr-0
5Ju
l-05
Oct-05
Jan-
06
Apr-0
6Ju
l-06
Oct-06
Jan-
07
PKO BP STRONG BUYBUY HOLDREDUCE SELLRESTRICTED UNDER REVIEWCOVERAGE IN TRANSITION Target Price
10
60
110
160
210
Jan-0
4
Apr-04
Jul-0
4
Oct-04
Jan-0
5
Apr-05
Jul-0
5
Oct-05
Jan-0
6
Apr-06
Jul-0
6
Oct-06
Jan-0
7
Polimex STRONG BUYBUY HOLDREDUCE SELLRESTRICTED UNDER REVIEWCOVERAGE IN TRANSITION Target Price
Source: Datastream, CA IB
Source: Datastream, CA IB
History of CA IB's rating of Prokom History of CA IB's rating of TPSA
50
100
150
200
250
Jan-0
4
Apr-04
Jul-0
4
Oct-04
Jan-0
5
Apr-05
Jul-0
5
Oct-05
Jan-0
6
Apr-06
Jul-0
6
Oct-06
Jan-0
7
Prokom STRONG BUYBUY HOLDREDUCE SELLRESTRICTED UNDER REVIEWCOVERAGE IN TRANSITION Target Price
10
15
20
25
30
Jan-0
4
Apr-04
Jul-0
4
Oct-04
Jan-0
5
Apr-05
Jul-0
5
Oct-05
Jan-0
6
Apr-06
Jul-0
6
Oct-06
Jan-0
7
TPSA STRONG BUYBUY HOLDREDUCE SELLRESTRICTED UNDER REVIEWCOVERAGE IN TRANSITION Target Price
Source: Datastream, CA IB
Source: Datastream, CA IB
History of CA IB's rating of TVN History of CA IB's rating of Zaklady Azotowe Pulawy
51015202530
Jan-0
4
Apr-04
Jul-0
4
Oct-04
Jan-0
5
Apr-05
Jul-0
5
Oct-05
Jan-0
6
Apr-06
Jul-0
6
Oct-06
Jan-0
7
TVN STRONG BUYBUY HOLDREDUCE SELLRESTRICTED UNDER REVIEWCOVERAGE IN TRANSITION Target Price
40
50
60
70
80
Jan-0
4
Apr-04
Jul-0
4
Oct-04
Jan-0
5
Apr-05
Jul-0
5
Oct-05
Jan-0
6
Apr-06
Jul-0
6
Oct-06
Jan-0
7
Zaklady Azotowe Pulawy STRONG BUYBUY HOLDREDUCE SELLRESTRICTED UNDER REVIEWCOVERAGE IN TRANSITION Target Price
Source: Datastream, CA IB
Source: Datastream, CA IB

Polish Equity Quarterly: 1Q 2007 January 2007
120
Other regulatory disclosures
1 2 3 4 5 6
Agora No No No No No No
AmRest No Yes Yes No No No
Bank Handlowy No No Yes No No No
Bank Millennium No No No No No No
Bioton Yes Yes Yes No No No
BRE No No No No No No
Budimex No No No No No No
BZWBK No No No No No No
CCC No No No No No No
CEDC No No No No No No
CEZ No Yes Yes No No No
ComArch No No No No No No
ComputerLand No No No No No No
Dom Development Yes No No No No No
Echo Investment No No No No No No
Elstar Oils Yes No No No No No
EMAX No No No No No No
Eurocash No No Yes No Yes No
Grajewo No Yes No No No No
GTC Yes No No No No No
IGA No No No No No No
IMPEL No No No No No No
ING BSK No No No No No No
Kety No No No No No No
KGHM No No Yes No No No
Kredyt Bank No No No No No No
Lotos Group No No Yes No No No
LPP No No No No No No
MOL Yes Yes No No No No
Mondi Packaging No No No No No No
Netia No No No No No No
NFI EMPiK Media &
Fashion
Yes Yes Yes No No No
Orbis No No No No No No
PBG No No No No No No
PGNiG No No Yes No No No
PKN No No Yes No No No
PKO BP No No Yes No No No
Polimex No No No No No No
Prokom No Yes Yes No No No
TPSA No No Yes No No No
TVN No No No No No No
Zaklady Azotowe Pulawy No No Yes No No No
Legend: 1) CA IB International Markets Ltd. or an affiliate was a manager or co-manager of a public offering of securities of this company
within the past 12 months. 2) CA IB International Markets Ltd. or an affiliate has received compensation for investment-banking services within the past 12
months. 3) CA IB International Markets Ltd. or an affiliate acts as a stabilising manager, market maker or designated sponsor of the
analysed securities on the stock exchange. 4) CA IB International Markets Ltd. and/or an affiliate together own at least 5% of the equity securities of the company. 5) The analyst owns securities in the company they cover in this report. The analyst is on the supervisory/management board of the company they cover.

Analysts' Certification
The analysts certify that their views regarding the companies and the securities in this report are truly expressed and that they have not received nor will receive direct or indirect compensation in exchange for publishing specific views or recommendations in this report.
This document is intended for the sole use of the person to whom it is addressed. It must not be transmitted further without the written permission of CA IB International Markets Limited or one of its associated companies (together and individually referred to as “CA IB”).
This document is provided as a service to market professionals, institutional, ordinary business and accredited investors, clients or customers only; it must not be passed to private or retail clients in any territory. It has been prepared and issued by CA IB on the basis of publicly available information, internally developed data and other sources believed to be reliable. All reasonable care has been taken to ensure the facts stated are accurate and opinions given are fair and reasonable, but no guarantee, warranty or representation expressed or implied is given; all opinions and estimates included constitute our good-faith judgement at this date, but are subject to change without notice; neither CA IB nor its directors, officers or employees shall in any way be responsible for its contents. CA IB, or its clients or customers, may trade as market maker or specialist in the investments or securities that are the subject of this document, or in related investments, and may have acted upon, bought for their own account or used the information contained in this document or the research or analysis on which it is based, before its publication. CA IB, its shareholders, directors, officers or employees may have a long or short position or be otherwise interested in the investments or securities referred to in this document, or in options on such investments or securities, or in related investments (including other securities of the same issuer). This document is published for private reference purposes only and is not an offer or solicitation to buy or sell the investments or securities referred to. CA IB have, or may seek to have, an investment banking relationship with any of the companies mentioned in this document. Within the past three years CA IB may have acted as manager or co-manager in the most recent registered public offerings, or in private placements of some of the companies or securities mentioned in this document. Unless otherwise noted, sources for all information in charts and tables are CA IB estimates.
The prices or values of the securities and any income generated therefrom may go down as well as up and can fluctuate and fall against the investor. There may be no income at all or it may be paid from capital. The securities or investments may cause the investor to lose the amount invested, as in addition past performance is not necessarily a guide to future performance. Changes in exchange rates may have an adverse effect on the value, price or income of the securities or investments. If taxation is referenced, the levels, basis for and relief from taxation may change. Any investment or security referred to in this document may not be suitable for every investor who receives it, and if in doubt the investor must seek advice from their investment adviser. Investors should be aware of the additional and special risks associated with securities and investments in emerging or developing markets. The securities or investments referred to in this document may be difficult to sell or realise, and information about them or the risks to which they are exposed may be unreliable or difficult to obtain. Investors should make themselves aware of any local laws governing such securities or investments.
CA IB uses a variety of valuation methods including but not limited to peer group comparisons of earnings, cash flow and book value multiples and methods based on discounted cash flows. Although the definition and application of these methods are based on generally accepted industry practices and models developed in the financial economics literature, please note that there is a range of reasonable variations within these models. The application of models typically depends on forecasts of a range of economic variables, which may include, but not limited to, interest rates, exchange rates, earnings, cash flows and risk factors that are subject to uncertainty and also may change over time. Any valuation is dependent upon inputs that are based on the subjective opinion of the analysts carrying out this valuation. Investors and other readers to whom the research is addressed may request further information and details with respect to the valuation models or assumptions applied to the models.
Recommendations and Stock Ratings
CA IB utilises a three-tier recommendation system for stocks under formal coverage: BUY, HOLD, or SELL (see definitions below). A BUY is applied when the expected total return over the next 12M is higher than the stock's cost of equity, or required return. A HOLD is applied when the expected total return over the next 12M is lower than its cost of equity but higher than zero. A SELL is applied when the stock's expected total return over the next 12M is negative.
CA IB employs two further categorisations for stocks under coverage: RESTRICTED: A rating and financial forecasts and target price are not disclosed owing to compliance or other regulatory considerations such as a blackout period or conflict of interest. COVERAGE IN TRANSITION: Due to changes in the research team, the disclosure of a stock's rating and target price and financial information are temporarily suspended. The stock remains in the CA IB research universe and disclosures of relevant information will be resumed in due course.
Temporary movements by stocks across the boundaries of these categories due to share price volatility will not necessarily trigger a recommendation change CA IB will advise as and when coverage of securities commences and ceases. CA IB has no policy or standard as to the frequency of any updates or changes to its coverage policies.
The MSCI sourced information is the exclusive property of Morgan Stanley Capital International Inc. (MSCI). Without prior written permission of MSCI, this information and any other MSCI intellectual property may not be reproduced, redisseminated or used to create any financial products, including any indices. This information is provided on an “as is” basis. The user assumes the entire risk of any use made of this information. MSCI, its affiliates and any third party involved in, or related to, computing or compiling the information hereby expressly disclaim all warranties of originality, accuracy, completeness, merchantability or fitness for a particular purpose with respect to any of this information. Without limiting any of the foregoing, in no event shall MSCI, any of its affiliates or any third party involved in, or related to, computing or compiling the information have any liability for any damages of any kind. MSCI, Morgan Stanley Capital International and the MSCI indexes are services marks of MSCI and its affiliates.
The Global Industry Classification Standard (GICS) was developed by and is the exclusive property of Morgan Stanley Capital International Inc. and Standard & Poor’s. GICS is a service mark of MSCI and S&P and has been licensed for use by CA IB.
This document may not be passed on to any person in the United Kingdom (i) who is a private customer (ii) unless that person or entity qualifies as an authorised or exempted person within the meaning of the UK Financial Services and Markets Act 2000 (the “Act”), as supplemented or amended, or to other persons of a kind described in the Financial Services and Markets Act 2000 (Financial Promotion) Order 2001, or to persons who can be treated as “intermediate customers” for the purposes of the Conduct of Business Rules of the Financial Services Authority. Certain securities or investments mentioned in this document may not have been and may not be registered in the US under The Securities Act 1933 ("1933 Act") or The Investment Company Act 1940 ("1940 Act") and, as such, will not and may not be offered for sale or sold generally to the public in the US, its territories, possessions or protectorates under its jurisdiction, or to any citizen, resident, corporation, partnership or other entity formed or present therein other than under certain exemptions available to accredited or sophisticated institutional investors under the 1933 or 1940 Acts. Failure to comply with these restrictions may constitute a violation of UK & US Securities laws, and in any other jurisdictions where restrictions apply.
This document is communicated in the UK by CA IB International Markets Limited of 80 Cheapside, London EC2V 6EE. Tel: +44 20 7309 7888; Fax: +44 20 7309 7887. CA IB International Markets Limited is authorised and regulated by the Financial Services Authority. Any qualifying person or institution receiving this document in the UK requiring information or seeking to effect a transaction in the securities or investments should contact CA IB International Markets Limited, attention Head of Sales.
This document is released under restriction in the US by HVB Capital Markets Inc, Member of NASD, 150 East 42nd Street, New York NY 10017. Tel: + 1 212 672 6140; Fax: + 1 212 672 6154. Any qualifying person or institution receiving this document in the US requiring information or seeking to effect a transaction in the securities or investments should contact HVB Capital Markets Inc., attention Head of Sales.
ADDITIONAL INFORMATION IS AVAILABLE UPON REQUEST

Equity Research Sector Analysts Strategists
Head of Equity Research Mark Robinson +44 20 7309 7873
Deputy Head of Research Tomasz Bardziłowski +48 22 520 9979
Banks Marcin Jabłczyński +48 22 520 9962Katalin Dani +36 1 374 7930Adriana Marin +40 21 206 4698Paul Wessely +43 50505 82331Selim Yazici +44 20 7309 6512
Insurance Paul Wessely +43 50505 82331
IT Przemysław Sawała-Uryasz +48 22 520 9960
Metals & Mining Alfred Reisenberger +43 50505 82367Roger Monson +44 20 7309 7844
Oil & Gas Róbert Réthy +36 1 374 7934
Pharmaceuticals Katalin Dani +36 1 374 7930
Real Estate Patrick Berger +44 20 7309 7843 Alexander Hodosi +43 50505 82359 Hanzade Kılıçkıran +44 20 7309 7854 Marcin Szortyka +48 22 520 9972
Telecoms Anna Bossong +44 20 7309 7840
Equity Mark Robinson +44 20 7309 7873Roger Monson +44 20 7309 7844Ruben Zakharian +44 20 7309 7857Patrick Berger +44 20 7309 7843Piotr Dzieciolowski +44 20 7309 7855
Fixed Income & FX Martin Blum +43 50505 82363 +43 664 313 46 02
Head of Sales Regional Research
Europe Fritz Schweiger +44 20 7972 0208
US Gyula Schuch +1 212 672 6140
Bulgaria Peter Stoyanov +359 2 9269 112Simon Quijano-Evans+43 50505 82364
Croatia Goran Šaravanja +385 1 4897 809
Czech Republic Dan Karpisek +420 22 111 2570Pavel Sobíšek +420 22 111 2504
Hungary Katalin Dani +36 1 374 7930Róbert Réthy +36 1 374 7934Gyula Toth +43 50505 82362
Poland Tomasz Bardziłowski+48 22 520 9979 Marcin Jabłczyński +48 22 520 9962 Tomasz Krukowski + 48 22 520 9859 Przemysław Sawała-Uryasz 520 9960 Marcin Szortyka +48 22 520 9972 Łukasz Wachełko + 48 22 520 9965 Piotr Chwiejczak +43 50505 82361
Romania Adriana Marin +40 21 206 4698 Carmen Arsene +40 21 206 4697 Simon Quijano-Evans+43 50505 82364
Russia Roger Monson +44 20 7309 7844
Slovenia Katalin Dani +36 1 374 7930Piotr Dzieciolowski +44 20 7309 7855Goran Šaravanja +385 1 489 7809
Turkey Hanzade Kılıçkıran +44 20 7309 7854Selim Yazici +44 20 7309 6512Simon Quijano-Evans +43 50505 82364
Quantitative Analysis Ruben Zakharian +44 20 7309 7857
Head of Sales – Trading Sales – Europe Sales – US
Michel Danechi + 44 20 7309 7810
+44 20 7972 0208
+1 212 672 6140